Article

Particle Formation Mechanism of TiCl4 Hydrolysis to Prepare Nano TiO2

College of Materials Science and Engineering, Central South University of Forestry and Technology, Changsha 410004, China
*
Author to whom correspondence should be addressed.
Appl. Sci. 2023, 13(22), 12213; https://doi.org/10.3390/app132212213
Submission received: 23 October 2023 / Revised: 3 November 2023 / Accepted: 6 November 2023 / Published: 10 November 2023

Abstract

:
This study utilizes Aspen Plus chemical process simulation software (V11), applies uniform nucleation theory and growth kinetics equations, and explores the particle formation mechanism of TiCl4 hydrolysis to prepare nano TiO2. In the water/ethanol system, the effects of the reaction time, reaction temperature, water addition, pH value, and ethanol amount on the crystal nucleation rate and TiO2 particle distribution (PSD) were studied in detail by adding triethanolamine dropwise and using the Aspen Plus chemical process software simulation calculation method. The calculation results indicate that at room temperature, the formation of TiO2 crystal nuclei mainly occurs in the first 300 s and then enters the growth stage. The reaction was carried out under neutral conditions at room temperature for 4 h in 1 mL TiCl4, 6 mL C6H15NO3, 15 mL H2O, and 30 mL C2H5OH. The maximum number of particles reached 195 mesh per cubic micrometer, and the particle size after crystal nucleus growth was smaller, with a D50 of 6.15 nm. The distribution curve shows a normal distribution, which is basically consistent with the experimental results. When studying various factors, it was found that controlling the reaction time within 60 min and maintaining the reaction temperature at room temperature can reduce the particle size D50 to 2.44 nm. Continuing to adjust the amount of water added, it was found that at 1 mL, D50 decreased again to 0.19 nm. Adjusting the pH value found that maintaining the neutrality did not change the particle size. Continuing to adjust ethanol, it was found that adding an appropriate amount of ethanol promoted nucleation and growth. At 4 mL, the maximum number of particles reached 199 mesh per cubic micrometer, but D50 slightly increased to 0.24 nm.

1. Introduction

As a new type of inorganic functional material, nano-TiO2 has been widely used in many fields because of its unique physical, chemical, and photoelectric properties. For example, when used as a white pigment, its visible light scattering force and hiding force will vary with the particle size change [1,2]. Specifically, the particle size of TiO2 affects its ability to resist UV rays. Smaller particles of TiO2 protect against the sun by absorbing UV rays in the mid-wave region (280–320 nm), the larger particle size is mainly through reflection, scattering medium-wave and long-wave UV (280–400 nm) to achieve physical protection against the Sun or fade [3]. The solar light, visible light reflectance, and brightness of rutile TiO2 coating decrease with the increase in the particle size of TiO2 [4]. At the same time, the particle size of TiO2 also affects the specific surface area and the ratio of surface atoms of TiO2 as a photocatalyst, thus affecting the light absorption and the generation of photogenerated electron-hole pairs; furthermore, it has different effects on photocatalytic performance [5,6,7]. Therefore, the in-depth study of the particle formation mechanism is of great significance for the proper design of particle size and structure, as well as the regulation and optimization of properties of TiO2 nanoparticles.
Despite the prevalent use of TiCl4 hydrolysis in nano-TiO2 synthesis, the mechanisms underpinning particle formation remain largely unexplored. Prior research has primarily investigated experimental methodologies to optimize nano-TiO2 synthesis, rarely integrating computational simulations. Much of the existing work is grounded in theoretical formula analyses. For instance, Zhang et al. [8] elucidated the phase transition principles from ilmenite to niobite during titanium dioxide crystal production using quantum dynamics simulations. However, this research is not exhaustive, relying solely on theoretical foundations and experimentation, without adequate consideration of experimental errors and limitations. In contrast, Yang et al. [9] examined the elastic properties of anatase nanotubes via Molecular Dynamics (MD) simulations. Such investigations, however, lean more towards kinetic models pertinent to adsorption and photocatalysis coupling simulation software with fundamental computations. Furthermore, the majority of studies focus excessively on the attributes of final products [10,11], such as photocatalysis [12] and ultraviolet light absorption capacities [13]. Although these studies enhance our understanding of material properties, they fall short of offering comprehensive insights into and control over the physicochemical characteristics of nano-TiO2, particularly concerning the particle formation mechanism.
The interconnected processes of mass transfer, energy transfer, and separation occur on various scales, potentially ranging from the molecular to the macroscopic. To comprehensively understand and optimize these processes, multi-scale simulations are required. Aspen Plus [14] is a powerful tool capable of performing such analyses, with exceptional capabilities for solving chemical reactions, and material and energy balances. Through such optimization, the synthesis process of nanomaterials and equipment design can be improved, enhancing the synthesis efficiency and quality of nanomaterials, and reducing production costs. In recent years, Aspen Plus has been successfully used in nanomaterials synthesis. Mouad Hachhach et al. [15] leveraged Aspen Plus in simulating the synthesis of molybdenum disulfide nanoparticles, effectively producing the product, and examining the influence of factors such as ammonium heptamolybdate on the nanoparticles. Similarly, Pyarimohan Dehury et al. [16] used Aspen Plus to assess the performance of a two-stage steam generator (u-and shell-and-tube heat exchangers) when evaluating the potential of low eutectic solvents (DES) and DES-based nanofluids as vapor-generating heat transfer fluids. To contribute to the understanding of the formation mechanism of TiO2 nanoparticles, Aspen Plus was employed to investigate the hydrolysis process of TiCl4. The impact of the reaction time, temperature, water volume, pH value, and ethanol volume on the nucleation rate of TiO2 crystals was examined. This method provides a more precise and scientific approach, avoiding the constraints and unpredictability of experimental conditions. Consequently, our findings are not only significant for understanding and controlling the physical-chemical properties of nano-TiO2 but also offer broader applicability. They provide guidance for the synthesis of nano-TiO2 on both laboratory and industrial scales, laying a foundation for the large-scale production and application of nano-TiO2.

2. TiCl4 Hydrolysis Process and Mathematical Model

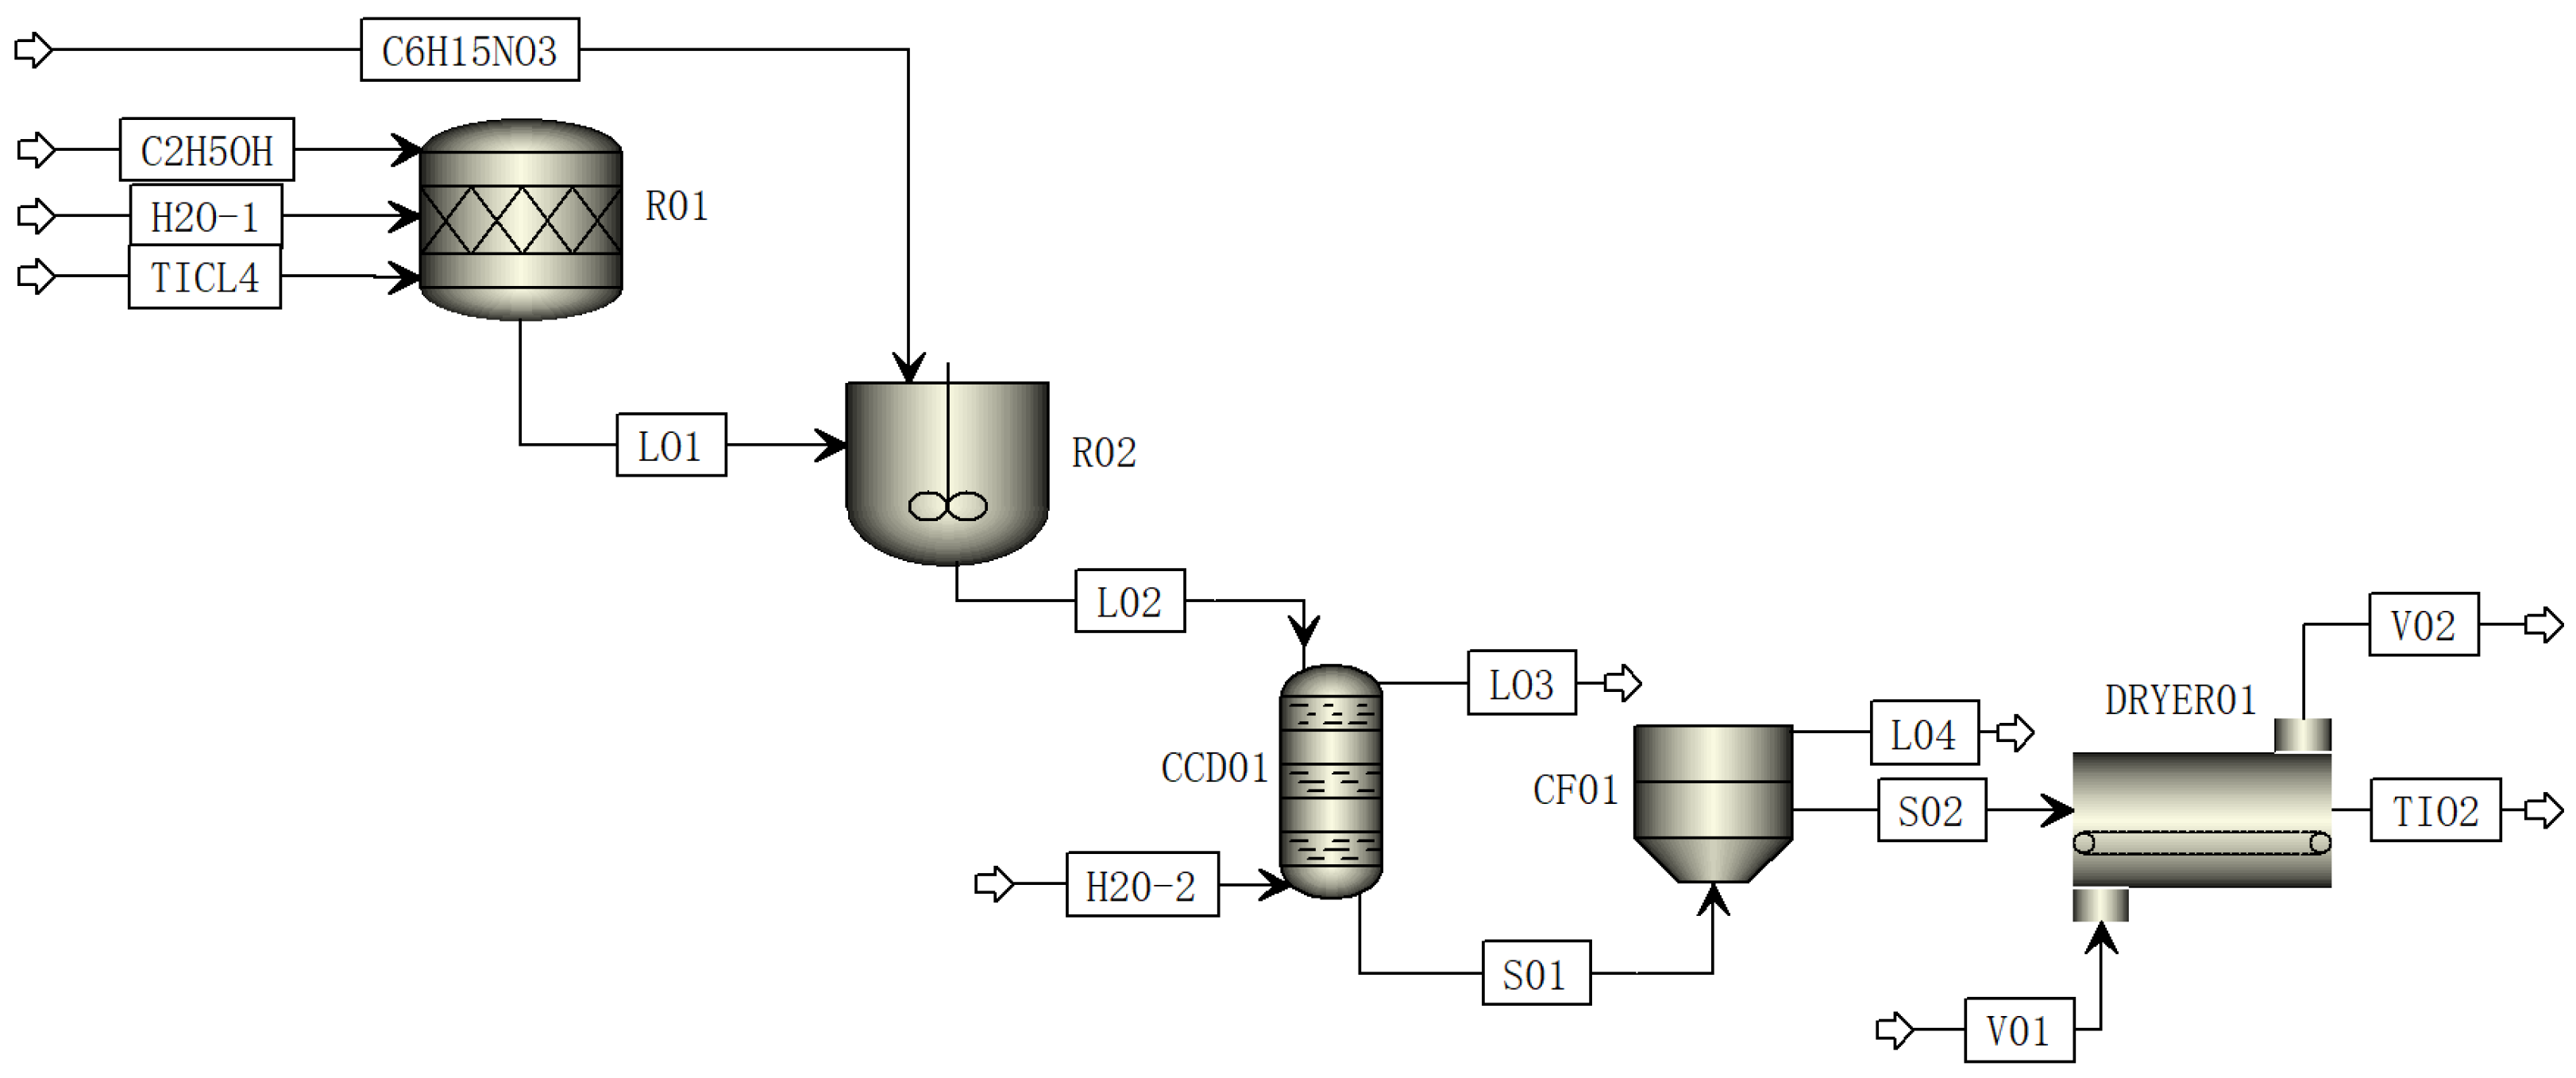
2.1. Process Flow of TiCl4 Hydrolysis to Prepare TiO2

In the user interface of the software, an appropriate engineering environment such as solid processing, electrolyte, or gasoline splitting can be selected, and a file with a .bkp suffix is created. Subsequently, it is necessary to identify whether the reactants and products are conventional substances. If so, they can be selected directly from the material library; otherwise, the product needs to be customized. Following this, the SOLIDS physical property method is employed to iteratively estimate and correct the physical parameters of the substance, such as enthalpy and entropy, until the initial operation is performed correctly [17]. Next, the preparation process is established along with the creation of the reaction equation. During this stage, the required parameters for each module are determined and obtained through experimentation, including reaction order, activation energy, nucleation rate constant, growth rate constant, and fitting coefficient, among others. A computational model that aligns with particle nucleation and growth behavior is determined through screening, comparison, and customization [18]. Finally, the particle size distribution (PSD) data are exported and compared with experimental results for verification. If the validation results are satisfactory, reaction parameters can be adjusted for the sensitivity analysis to predict the particle size distribution and mass fraction under varying operational conditions, with the aim of obtaining smaller and more concentrated nanoparticles. Concurrently, the nucleation and growth behavior of particles are recorded for future reference and analysis.
The TiCl4 hydrolysis process in Aspen Plus is composed of three main unit operations: hydrolysis, solid–liquid separation, and powder drying, as depicted in Figure 1. Initially, a specific volume ratio of VTiCl4, V H2O, and VC2H5OH is added to the reactor R01 and stirred at room temperature for 30 min. Subsequently, the mixed solution is introduced into the hydrolysis reactor R02, where the hydrolysis temperature is adjusted as per the requirement. In different constant temperature reactors R02, C6H15NO3 is added dropwise at a rate of 0.2 mL/min under continuous stirring. Following a designated reaction period, the suspension is left to settle for 12 h. It is then passed through L02 into the multi-stage washing device CCD01 and the centrifugal filter CF01 for centrifugal separation. Post-separation, the filter residue S02 is transferred to a continuous simple dryer DRYER01 for drying, resulting in the final product, TiO2.

2.2. Mathematical Model

2.2.1. POWERLAW Dynamics

In the hydrolysis reactor R02, the reaction equation was established:
T i 4 + + 2 C 6 H 15 N O 3 T i O 2 + 2 N H 4 +
and the POWERLAW Kinetic Model [19] was used as follows:
k = k o ( T T O ) n e E a R ( 1 T 1 T O )
In Equation (2), k denotes the rate constant, ko is the pre-exponential factor (0.007247), Ea symbolizes the activation energy (4.962412 J/mol), n is the correction coefficient (typically 0), and To is the reference temperature.

2.2.2. Nucleation Dynamics

The hydrolysis process involves a change in the concentration of Ti4+ over time. Referencing prior studies [20], the reaction rate for the formation of TiO2 via hydrolysis of TiCl4 takes the form of a power function:
r T i 4 + = C t d t = k c t α
In this equation, r T i 4 + signifies the reaction rate of Ti4+ hydrolysis, while t denotes the reaction time, Ct is the concentration of Ti4+ at time t, k1 is the reaction rate constant, and α represents the reaction order. With the reaction sequence set at α = 1, an experimental relationship can be drawn between Ti4+ concentration and time:
C T i 4 + = e x p ( 0.098 t + 2.708 )
Based on the principles of homogeneous nucleation along with the previous literature [21,22], the initiation of primary homogeneous nucleation demands an energy barrier that surpasses the nucleation energy, Ω. Assuming a spherical shape for both the embryo and nucleus, we derive
Ω = 16 π σ 3 V m 2 3 ( k B R T l n S ) 2
Combining the homogeneous nucleation theory with the Arrhenius equation, the nucleation rate is given as
B 1 = Z c e x p ( Ω R T )
By substituting Equation (4) into Equation (5), we arrive at
B 1 = Z c e x p ( 16 π σ 3 V m 2 3 k B 2 ( R T ) 3 ( l n S ) 2 )
In these equations,
S = c c s a t
Z c = k ( c c s a t ) n c s a t n
Furthermore, the secondary nucleation of TiO2 may occur due to the influence of crystalline slurry. Its rate can be represented by Formula (10).
B 2 = k 2 τ o G q M T p
The total nucleation rate can be obtained by substituting Formulas (7) and (10) into Formula (11).
B = B 1 × B 2
Formula (12) is obtained by further collation.
B = k 1 ( c c s a t ) n c s a t n τ o M T p Q q e x p ( k 3 T 3 ( l n S ) 2 )
where k3 is a constant.
k 3 = 16 π σ 3 V m 2 3 k B 2 R 3
In Equation (12), B denotes the assay nuclear rate (number/μm3∙s), R stands for the gas constant (8.314 J/mol∙K), and k1 is the nucleation rate constant. The difference between c and csat refers to the supersaturation concentration, while csat signifies the saturation concentration (kg/m3). The supersaturation index, represented by n, is considered to be 1, given that TiO2 is fundamentally insoluble in water. The saturation index, denoted n′, is consistent with the supersaturation index. The impeller tip velocity (m/s) during the growth of the crystal core is represented by τ, with o being the agitation index, typically set to 1 based on empirical data. MT denotes the suspension density (kg crystal/m3 suspension), and p signifies the suspension density index. The formation of TiO2 can lead to an agglomeration process, which impacts the suspension density. However, this influence is not incorporated into the calculation, suggesting that p is zero. Q symbolizes the growth rate (μm/s), and q represents the growth rate index in the nucleation equation, typically set to 1. The molar volume of the crystal nucleus is represented by Vm (0.14364 nm3), while σ stands for the interfacial tension (0.05737 N/m). Lastly, kB denotes the Boltzmann constant (1.380649 × 10⁻²³ J/K).
Drawing on [23] and the diffusion theory [24], the reaction order α defines the correction coefficient η with the formula η = ( c s c s a t c c s a t ) α , where c signifies C T i 4 + and cs represents the concentration on the solid surface. For this scenario, the reaction rate is set to match the diffusion rate under the critical condition, i.e., r T i 4 + = η Q (here Q represents the rate when the diffusion is ignored). The diffusion rate is expressed as k D ( c b c s ) , where k D = D i l A , and A signifies the characteristic length (m), a variable contingent upon the agitator properties, liquid volume, solution density, viscosity, and particle diameter. The equation η Q = k D ( c c s a t ) ( 1 η 1 α ) can be extracted in the reactor under consideration of agitation. Given the stirrer parameters (speed 10 rpm, impeller diameter 40 mm, power 60 W, DJ1-60 electric stirrer, Jintan Environmental Protection Instrument Factory), η and B can be obtained at distinct points in time through the Newton–Raphson iteration. On substituting these parameters into Formula (3) and organizing the experimental parameters, we arrive at the nucleation rate equation, which is computed as follows.
B ( t ) = 45.8 η e x p ( 5.69 × 10 10 T 3 0.098 t + 2.33 2 ) exp 0.098 t + 2.708 0.6856
η = 1 0.07247 e x p ( 596.87 T 0.098 t + 2.708 ) K D ( exp 0.098 t + 2.708 0.6856 )
The nucleation rate equation, as depicted in Formulas (14) and (15), is influenced by factors such as reaction temperature, reaction time, and crystal structure. When the temperature and crystal structure are fixed, the nucleation rate varies with time. The particle count can be expressed as a differential within a specific time period, as shown in Formula (16).
Y t = 0 t B ( x ) x d x
At t = 0, B(0) equals zero. For t > 0, the particle count Y(t) (within a PSD mesh range of 10−6~1 μm, where 1 μm equals 12,000 mesh) is converted based on the correlation between the mesh number and particle size. During the hydrolysis process, the volume of water and the pH value can alter the concentration of titanium ions, which in turn affects the nucleation rate. Additionally, changes in KD caused by ethanol can modify the final nucleation rate by altering the crystal structure.

2.2.3. Growth Kinetics

According to the research [25,26], supersaturation propels the growth of the existing nucleation or seed after its formation. The crystal nucleus growth rate is calculated using the following formula:
G = η k g ( a + β L ) m c c s a t n c s a t n τ o exp E a R 1 T 1 T r e f
In Formula (17), G signifies the nucleation growth rate (μm/s), kg is the growth rate constant, while a, β, and m represent the growth factors related to crystal size. Ea is the activation energy, T is the reaction temperature, and Tref is the reference temperature. Using the experimental parameters and Formula (3), we can derive the crystal growth rate equation as follows:
G ( t ) = 4.488 d η × 10 3 e x p ( 1.995 596.87 T ) exp 0.098 t + 2.708 0.6856
Formula (18) shows that the crystal growth rate is influenced by the reaction temperature, reaction time, and crystal structure. Once the temperature and crystal structure are determined, the growth rate fluctuates over time. The crystal size can then be represented as a differential over a specific time period:
D t = 0 t G ( x ) x   d x
when t = 0, G(0) = 59.76 × 10⁻³ μm/s. From the above analysis, we can establish the connection between the crystal growth rate and various factors, and further investigate the effects of the reaction time, reaction temperature, water content, pH value, and ethanol content on crystal growth.

2.2.4. PSD Calculation

According to [27] and the associated reference materials utilizing Aspen Plus, the particle size distribution formula adheres to the normal distribution model.
f D t = 1 2 π σ e x p ( ( D t D 50 ) 2 2 σ 2 )
In Equation (20), D50 symbolizes the median or average particle size (μm), f stands for the particle size distribution function (mass fraction), and Dt is a random variable that holds when the particle size is greater than zero (0 < t < t). The standard deviation of particle size (μm) is represented by σ. This formula can directly depict the nucleation and growth behavior of TiO2 particles. Moreover, based on the normal distribution model, it can accurately compute the particle size distribution of TiO2 particles.

3. Experimental Methods

Mix a certain amount of deionized water with C2H5OH (Tianjin Fuyu Fine Chemical Co., Ltd., AR, Tianjin, China) into a 250 mL three-necked flask, then add 1 mL of TiCl4 (Tianjin Fengchuan Chemical Reagent Technology Co., Ltd., AR, Tianjin, China), and stir at room temperature for 30 min. In a constant temperature water bath, add C6H15NO3 (Xilong Technology Co., Ltd., AR, Shanghai, China) dropwise at a rate of 0.2 mL/min while maintaining the liquid in the bottle in a stirred state (using DF-101S collector type magnetic stirrer manufactured by Gongyi Yuhua Instrument Co., Ltd., Gongyi, China). After 4 h of reaction, transfer the suspension into a beaker and let it stand for 12 h, then filter and wash it. The solid product obtained after filtration and washing is placed in a 60 °C drying oven (101-OAB type, manufactured by Tianjin Taist Instrument Co., Ltd., Tianjin, China) and dried for 24 h to obtain TiO2 powder.

4. Results and Discussion

4.1. Particle Formation Process

In a specific experimental condition, a mixture containing 1 mL of TiCl4, 6 mL of C6H15NO3, 15 mL of H2O, and 30 mL of C2H5OH is prepared and maintained at a pH of 7 and a temperature of 25 °C for a duration of 4 h. The formation and growth behavior of TiO2 particles is observed to change over time. As depicted in Figure 2, the nucleation of TiO2 particles primarily occurs between 65 and 80 s, reaching a peak count of 195 particles per cubic micron. As the reaction progresses, the initially formed TiO2 nuclei undergoes a process of agglomeration and secondary nucleation. Over a span of 240 min, particles of varying sizes are formed, as indicated in Figure 3c. Figure 3a,b suggest that the first 5 min are crucial for the formation of TiO2 monocytes, as these quickly enter the second stage of nucleation and growth, leading to the formation of TiO2 particles of different sizes. The mass fraction curve centers around D50 at this point, displaying a normal distribution with the highest mass fraction at 14.01%. However, at the 60 min mark, despite continued nucleation and growth, the number of small particles declines due to agglomeration. The mass fraction curve is primarily centered around D50 = 0.769 nm, following a normal distribution, with the mass fraction reduced to 8.21%. Beyond 60 min, with the complete hydrolyzation of TiCl4, the formation of small TiO2 particles almost comes to a halt and the mass fraction of D50 gradually decreases to zero. Therefore, it is determined that the optimal reaction stage falls within the first 60 min.

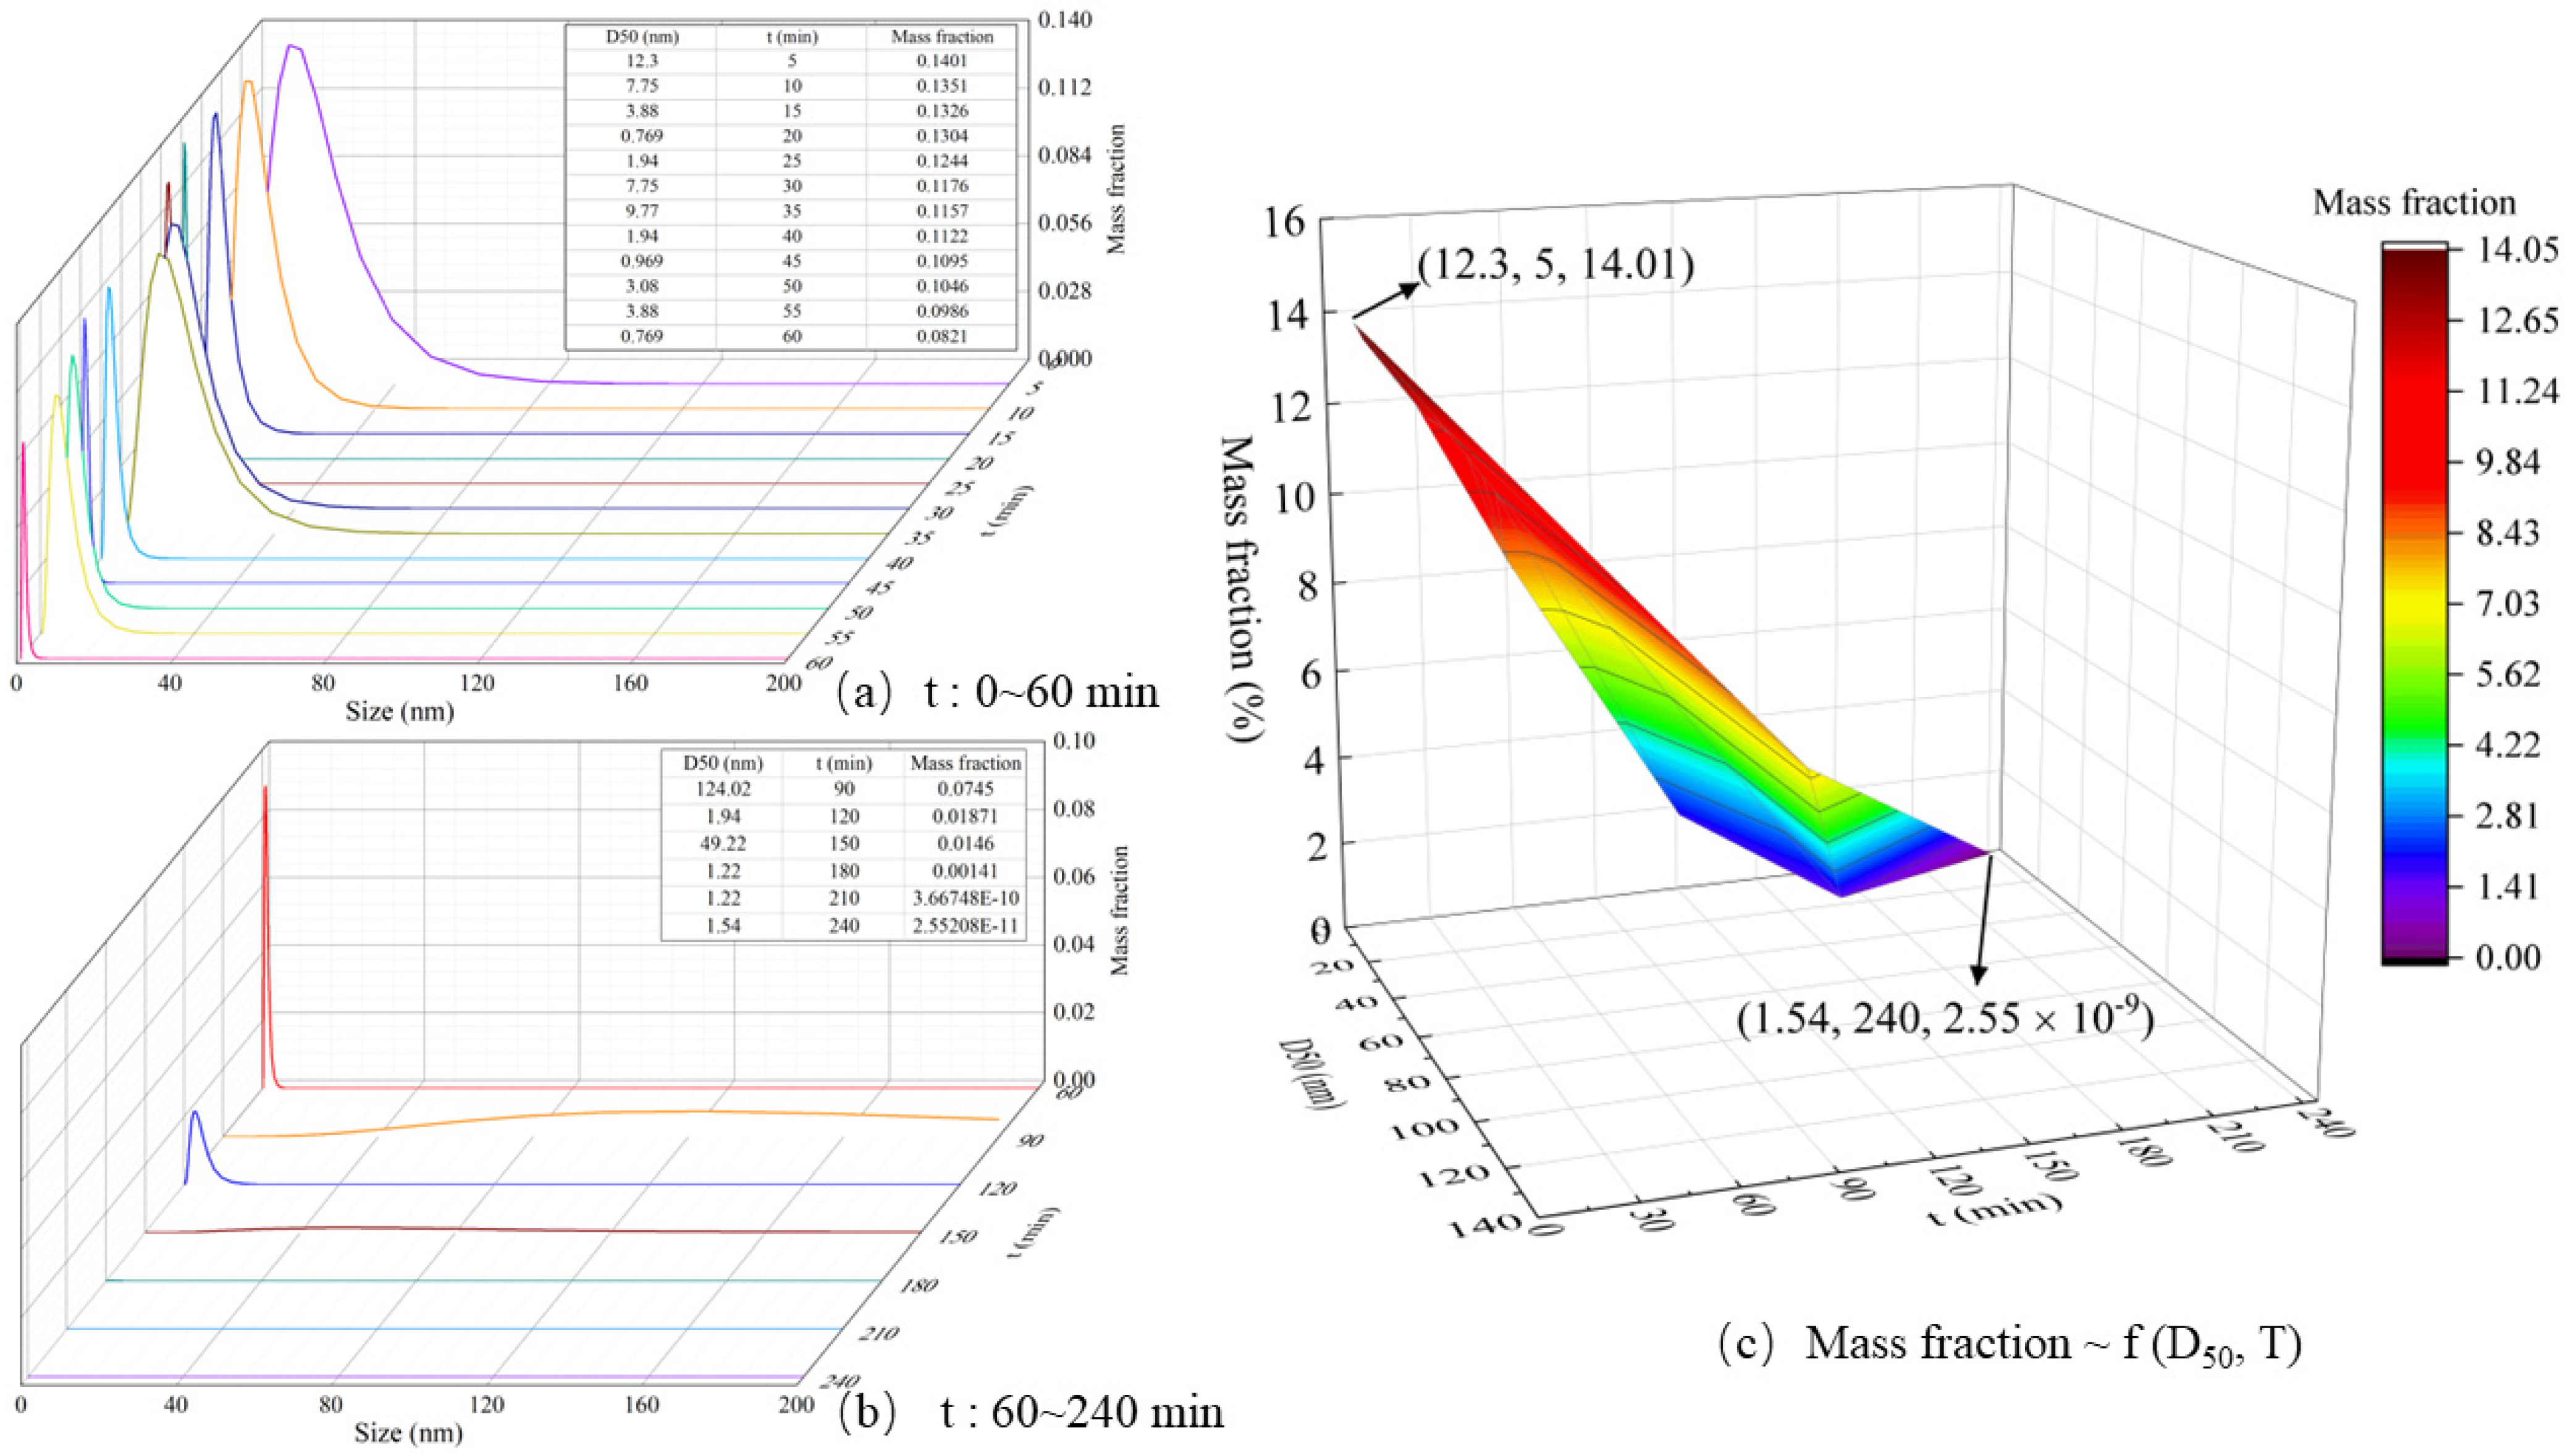
4.2. Effect of Reaction Temperature on Particle Formation Behavior

The impact of varying reaction temperatures, from 15 °C to 55 °C, on particle formation was explored under specified conditions: 15 mL of H2O, 30 mL of C2H5OH, a pH of 7, and a 60 min duration. Interpretations drawn from Figure 4 and Figure 5 yield the following insights. As per the data from Figure 4, the highest concentration of nuclei is observed at 25 °C, with a maximum particle count of 195 per cubic micron. Below this temperature, there is an apparent lack of nucleation. Conversely, above 25 °C, the nucleation period shortens, and the quantity of nuclei diminishes. This trend becomes increasingly pronounced with rising temperatures. A further analysis of the findings from Figure 5a,b reveals that at a reaction temperature of 25 °C, the D50 value is 2.44 nm. The Particle Size Distribution (PSD) curve within the 0–15 nm range centers vertically at 2.44 nm, indicating a normal distribution and a notably concentrated particle size. The mass fraction at D50 hits a peak at 6.2%. At 15 °C, despite the low temperature favoring heat dissipation from the reaction, thereby boosting hydrolysis, quick crystal growth occurs. This rapid growth leads to increased viscosity in the solution, consequently inhibiting nucleation and growth. Consequently, at this temperature, the D50 value increases, the mass fraction shrinks, and the particle distribution spreads out, with a D50 value of 31 nm and a mere 0.8% mass fraction. When the reaction temperature exceeds 25 °C, a pattern emerges: the higher the temperature, the faster the hydrolysis reaction. The resulting shortened nucleation and growth periods cause particle sizes to enlarge and the distribution to broaden, with the mass fraction reducing accordingly.

4.3. Effect of Water Addition on Particle Formation Behavior

Investigations were carried out on the impact of water addition on particle formation at 30 mL of C2H5OH, a pH of 7, a reaction temperature of 25 °C, and a reaction duration of 60 min. The data analysis from Figure 6 and Figure 7 lead us to the following conclusions: Figure 6 depicts that at a water volume of 1 mL, the maximum grain count is 102.2 per cubic micron mesh, and the nucleation duration is at its minimum. When the water volume falls below 1 mL, the nucleation duration extends, with significant nucleation formation occurring at 180 s. However, when the water volume rises above 1 mL, the nucleation duration extends, and the nucleation quantity decreases with the increase in water volume. Figure 7, on the other hand, reveals that at a water volume of 1 mL, the D50 value is 0.19 nm, and the particle size distribution (PSD) curve exhibits a standard distribution with a vertical center of 0.19 nm in the 0.1–2 nm range, indicating a fairly concentrated particle distribution. Concurrently, the D50 content hits its peak at 14.48%. However, when the water volume falls to 0.5 mL, the small water volume causes TiCl4 to form TiCl4∙2H2O. Because the TiO2 precursor has a higher concentration and a lower degree of hydrolysis, the resulting TiO2 particles are larger, and the D50 value rises to 1.54 nm. The distribution range also widens, reaching up to 10 nm. Conversely, when the water volume rises above 1 mL, the reaction between TiCl4 and water intensifies, forming TiCl4∙5H2O. This hydrolysis process forms titanic acid precipitation and increases the size of TiO2 particles. Starting from a water volume of 2 mL, the D50 value surges from 0.69 nm to 12.3 nm, while the range of the PSD curve also incrementally expands. The corresponding D50 mass fraction marginally decreases from 14.48% to 11.89%.

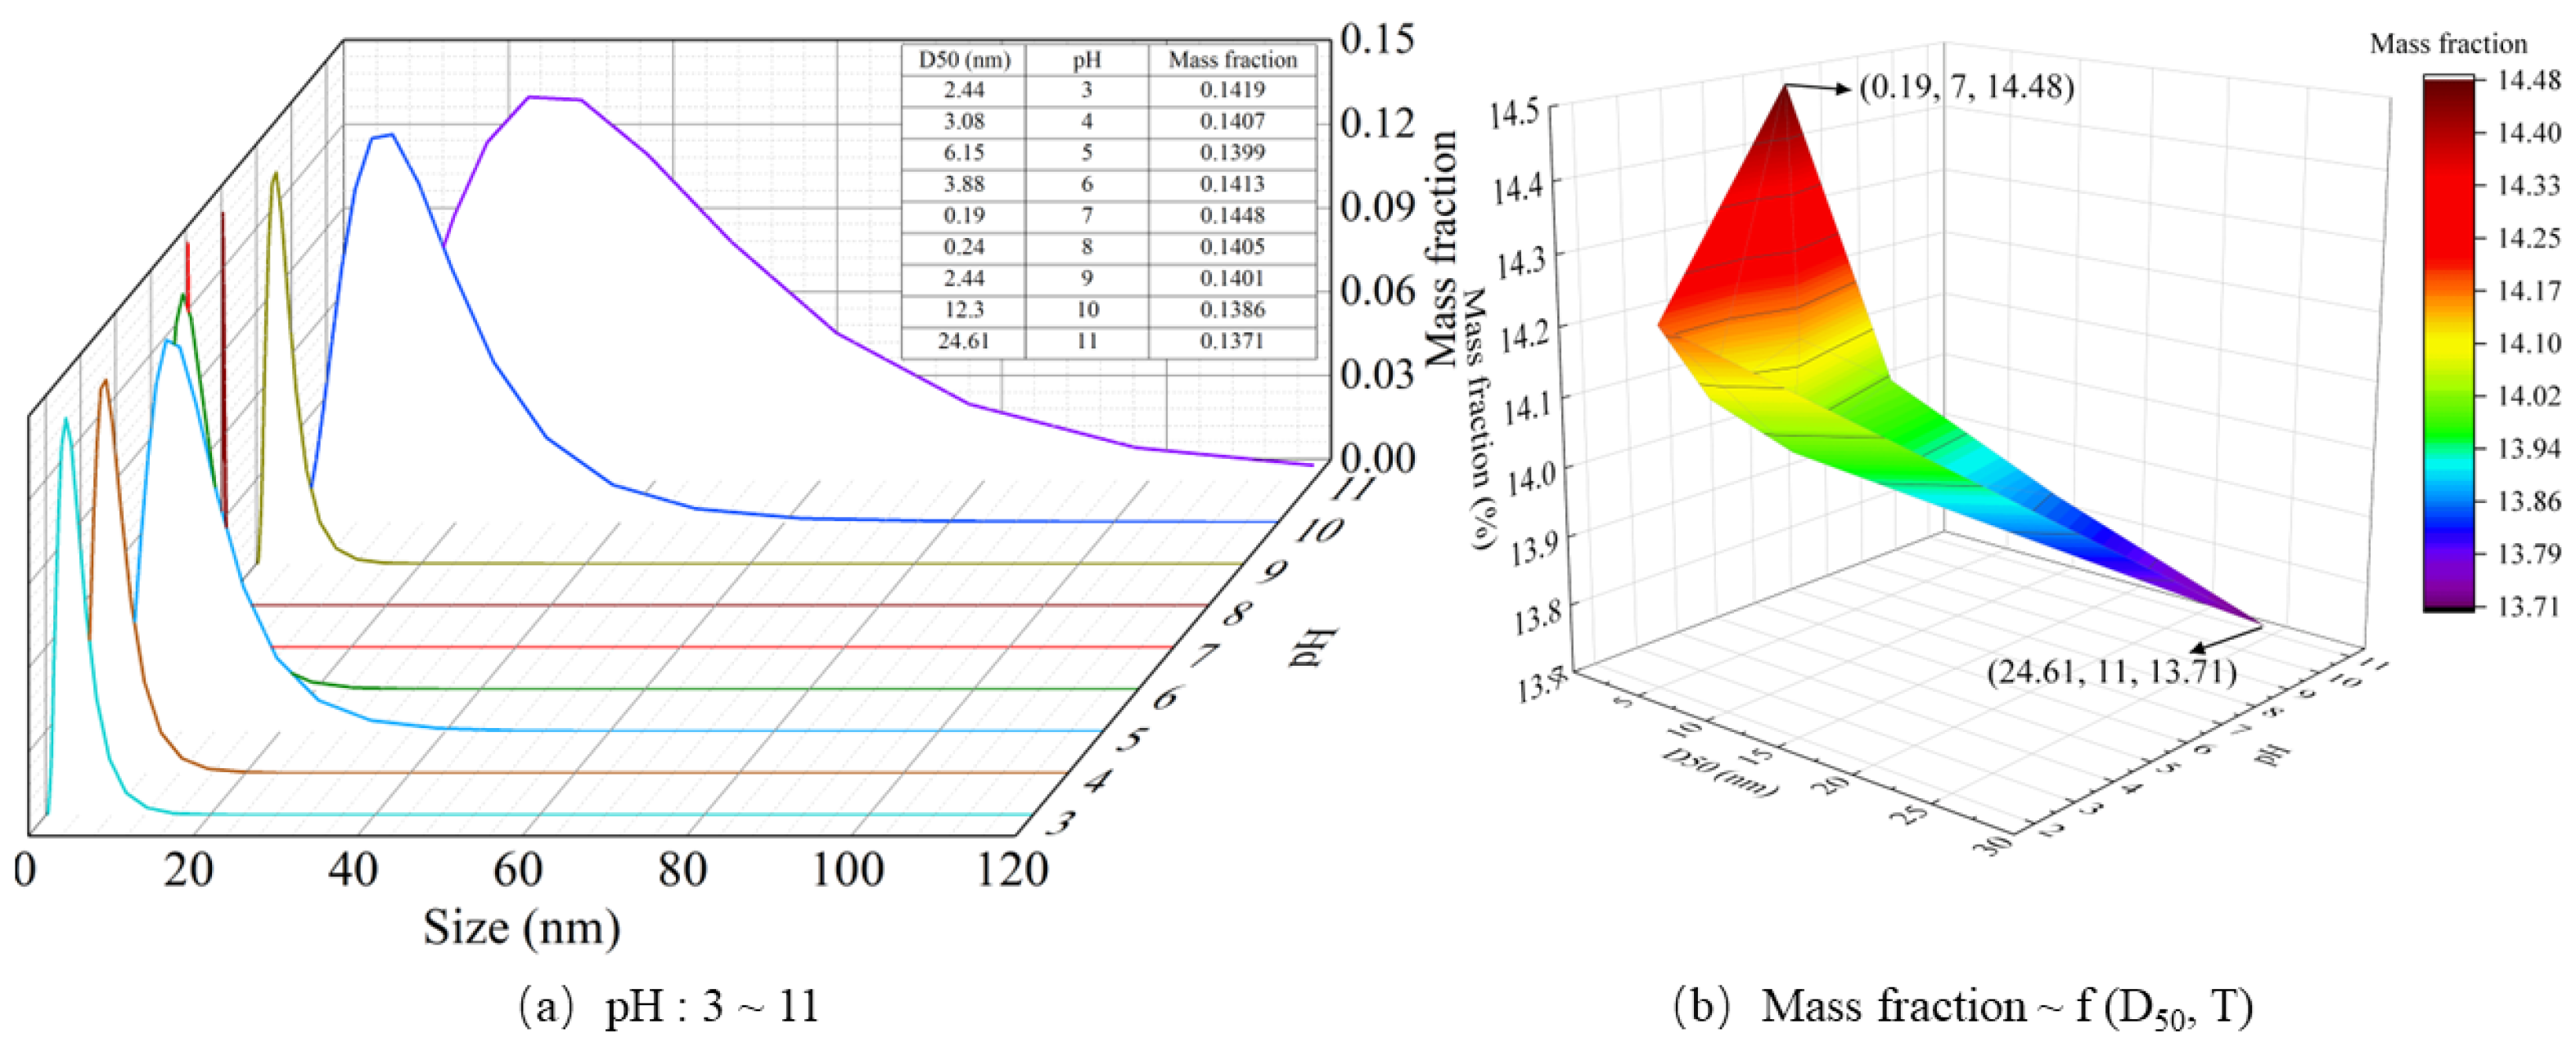
4.4. Effect of pH on Particle Formation Behavior

The following paragraphs have been adapted to provide clarity and improve the overall flow of the information presented. We conducted an experiment where we adjusted the C6H15NO3 levels to examine the influence of the pH value on particle formation behavior. The results, as depicted in Figure 8 and Figure 9, yielded some noteworthy findings. Figure 8 reveals that at a neutral pH level of 7, there is a maximum grain count of 102.2 meshes per cubic micron, and the nucleation time is the shortest. However, as the pH level increases or decreases, the time required for nucleation formation extends, and the number of nucleations decreases. Figure 9 offers more insights. At a pH level of 7, the D50 is 0.19 nm, and the particle size distribution (PSD) curve is normal with 0.19 nm acting as the vertical center in the 0~1.2 nm range. At this point, the particle size is small with a concentrated distribution, and the D50 mass fraction is also high, at 14.48%. In an acidic environment, the lower the pH level, the higher the H+ concentration. This inhibits the hydrolysis of TiCl4, leading to fewer TiO2 grains precipitating from the solution. An increased H+ concentration also accelerates the polycondensation reaction of H+ and the dehydration condensation product of the titanium hydroxyl complex, causing the grain size of the TiO2 to increase rapidly. Hence, the particle size in acidic conditions is larger than in neutral conditions. As the amount of C6H15NO3 dropped increases, the system’s pH level also increases. This leads to an increased hydrolysis degree of the TiO2 precursor. When the pH level is neutral, the rate of polycondensation is moderate, resulting in a smaller TiO2 particle size and a narrower distribution. However, at high pH levels, the severe hydrolysis of the TiO2 precursor due to the high OH concentration in the water leads to more TiO2 grains precipitating. The OH also inhibits the polycondensation reaction, slowing down the growth rate of TiO2 grains. These rapidly formed TiO2 grains tend to agglomerate on the original particles, causing an increase in the TiO2 particle size and a widening of the PSD curve distribution. As the pH value increases, the mass fraction also decreases.

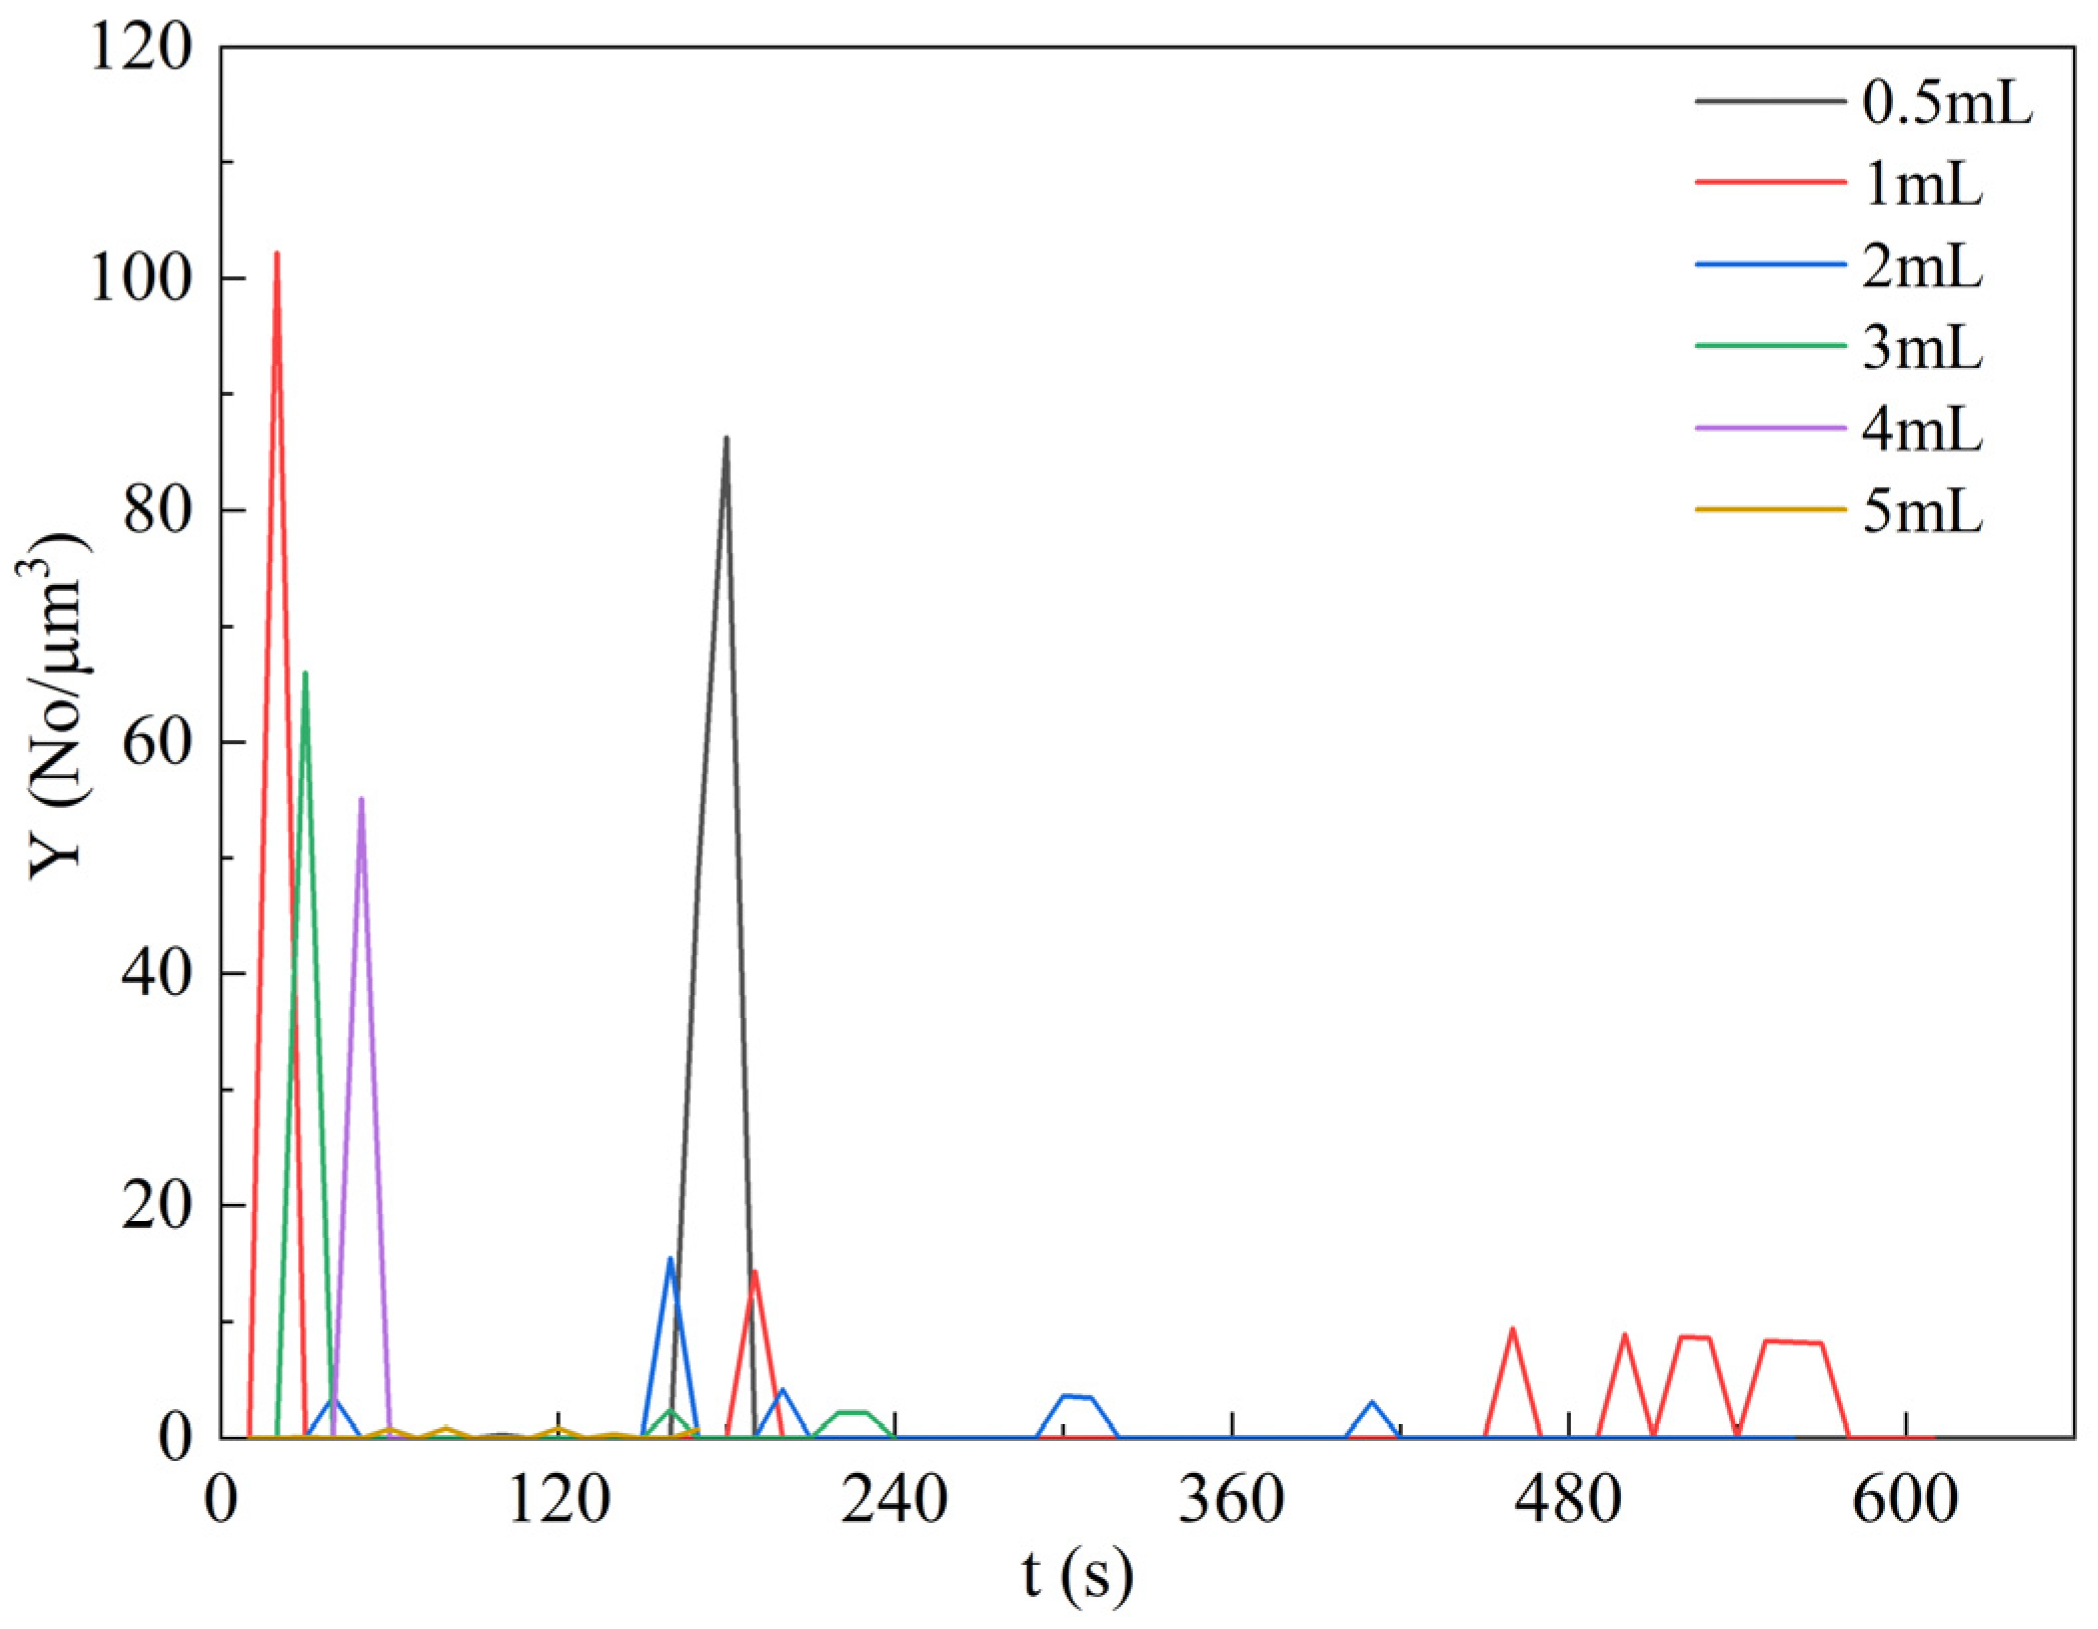
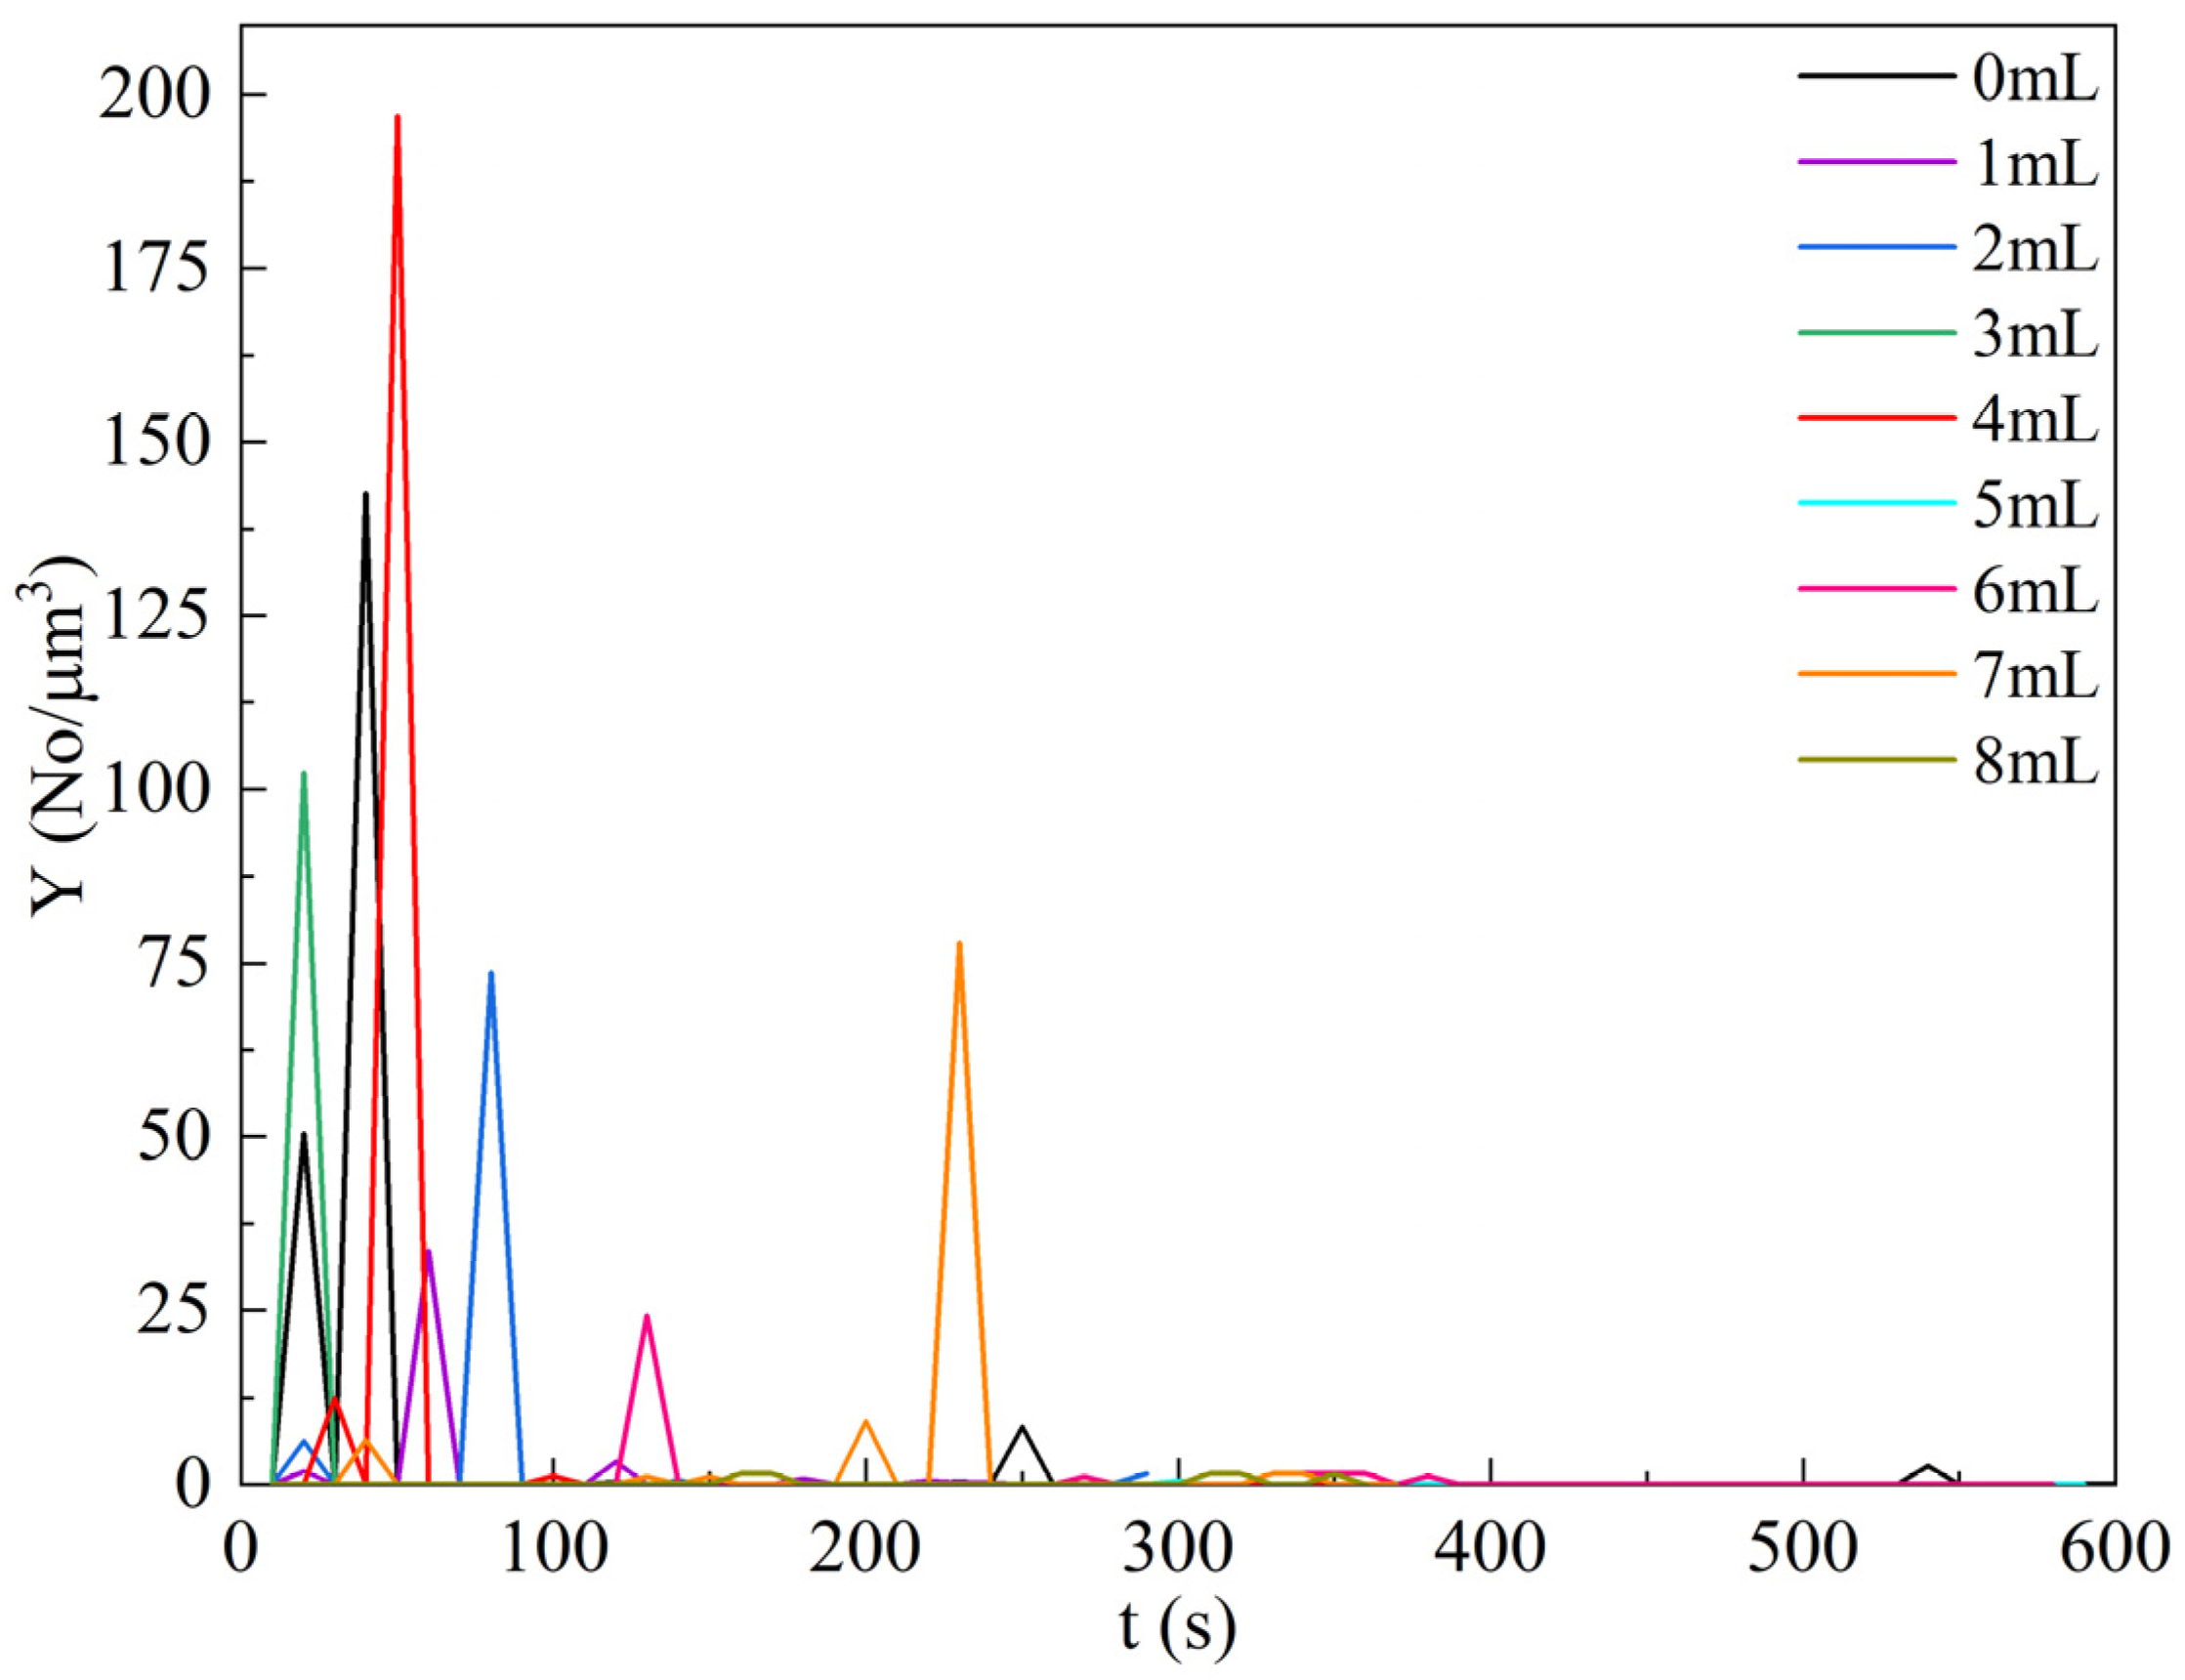
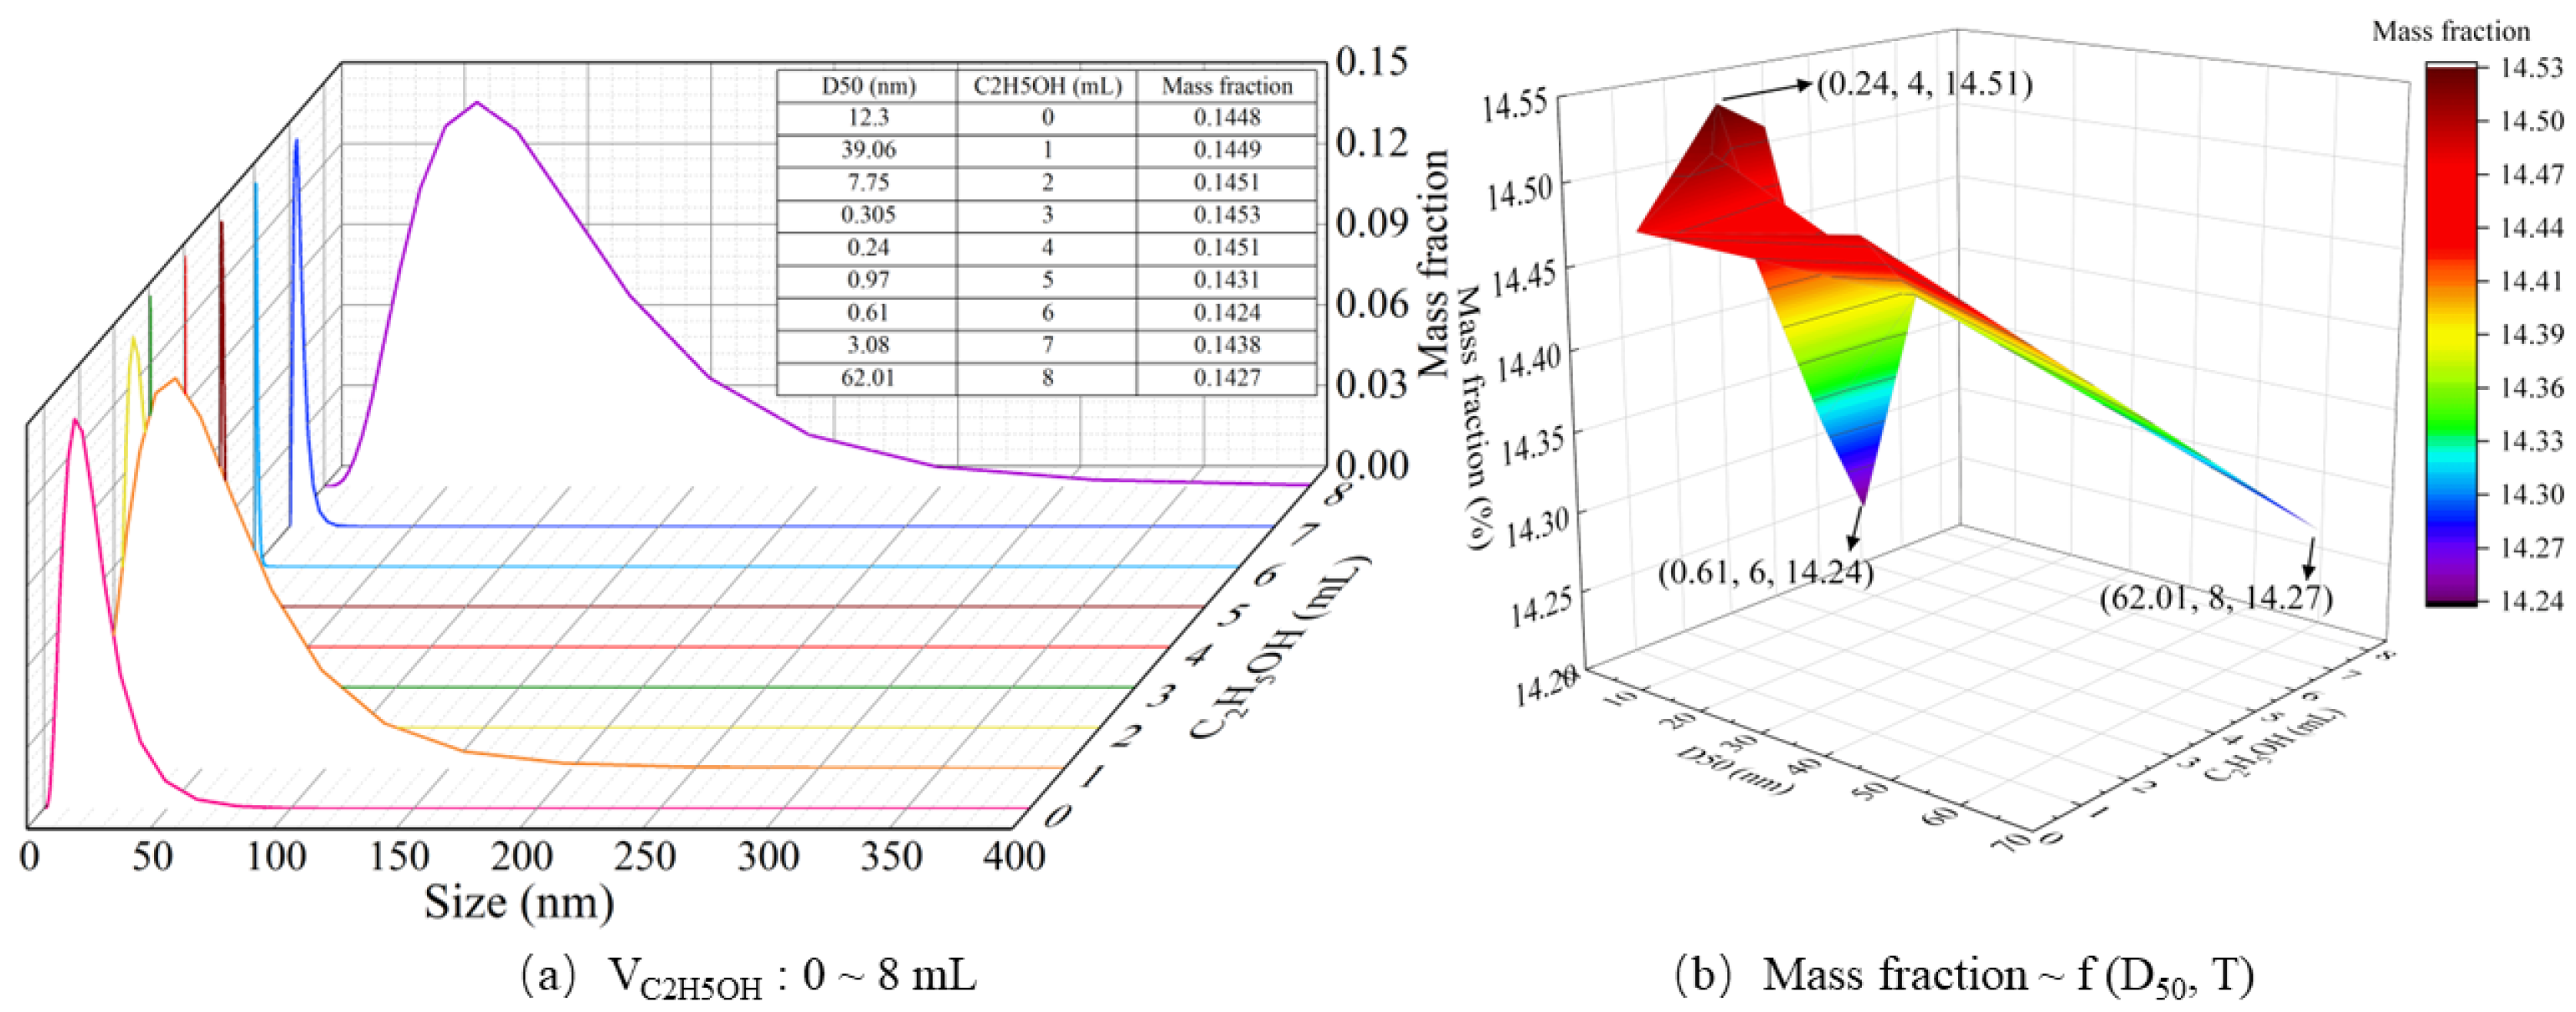
4.5. Effect of Ethanol Amount on Particle Formation Behavior

Under the conditions of 3 mL H2O, a pH of 7, a reaction temperature of 25 °C, and a reaction time of 120 min, conclusions can be drawn based on the results depicted in Figure 10 and Figure 11. Figure 10 reveals that without the addition of ethanol, the nucleation time is relatively scattered and quick, reaching formation within just 50 s. However, the introduction of ethanol results in a more consolidated nucleation time, peaking when the ethanol volume is at 4 mL. At this point, the nucleation reaches its maximum, with the highest particle count of 199 mesh per cubic micron. If the ethanol volume is less than or more than 4 mL, the nucleation time prolongs and the quantity of nucleation decreases. Figure 11, presenting a D50 of 0.24 nm and a PSD curve within the range of 0.2 nm with a central vertical of 0.24 nm at a volume of 4 mL of ethanol, shows a normal distribution of the PSD curve, characterized by a small particle size and concentrated distribution. At this stage, the D50 content is also at its highest, at 14.51%. The low ethanol content accelerates the exothermic reaction, which in turn speeds up the evaporation rate of ethanol. This creates favorable conditions for crystal growth and grain reduction. However, if the ethanol volume is too small, it weakens the inhibition effect on the TiO2 precursor, instead quickening the hydrolysis reaction. This leads to faster crystal growth and more intense agglomeration, resulting in an increase in the particle size. Hence, when the ethanol volume is less than 4 mL, the D50 is larger, and the particle size distribution is broader than when the ethanol volume is 4 mL. Excessive ethanol can also form complexes with titanium ions in the TiO2 Sol, thereby affecting the growth of TiO2 crystals [28]. Consequently, when the ethanol content exceeds 4 mL, the particle size increases and the particle distribution broadens. As the ethanol content escalates, the mass fraction also diminishes.

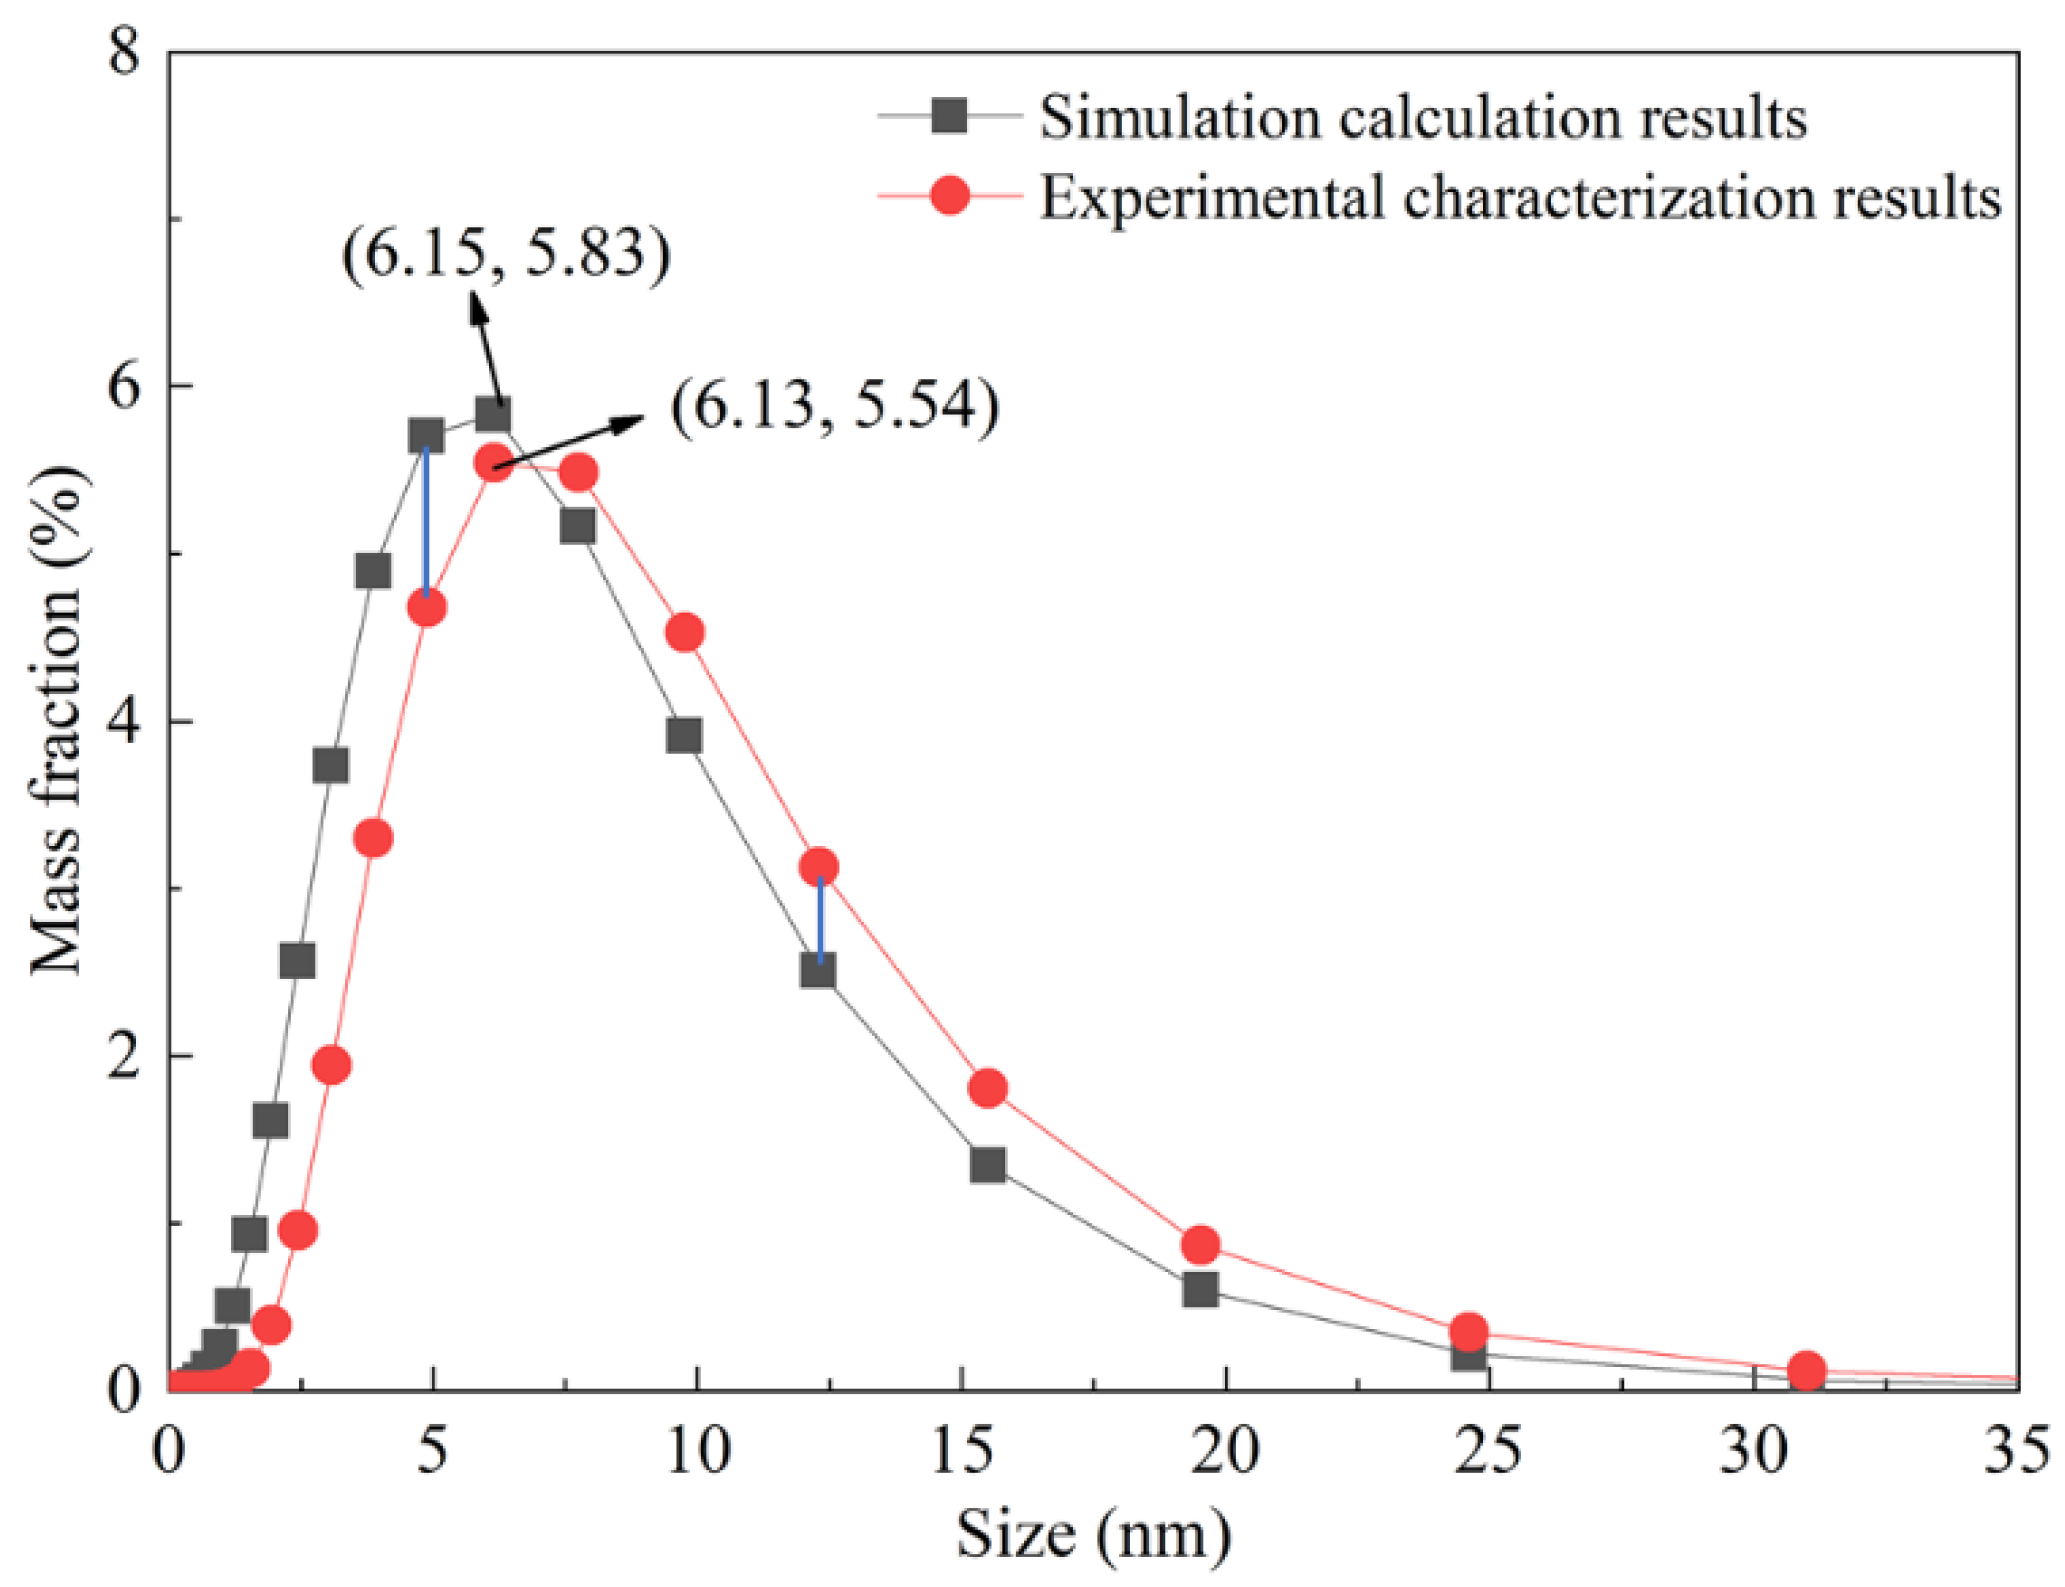
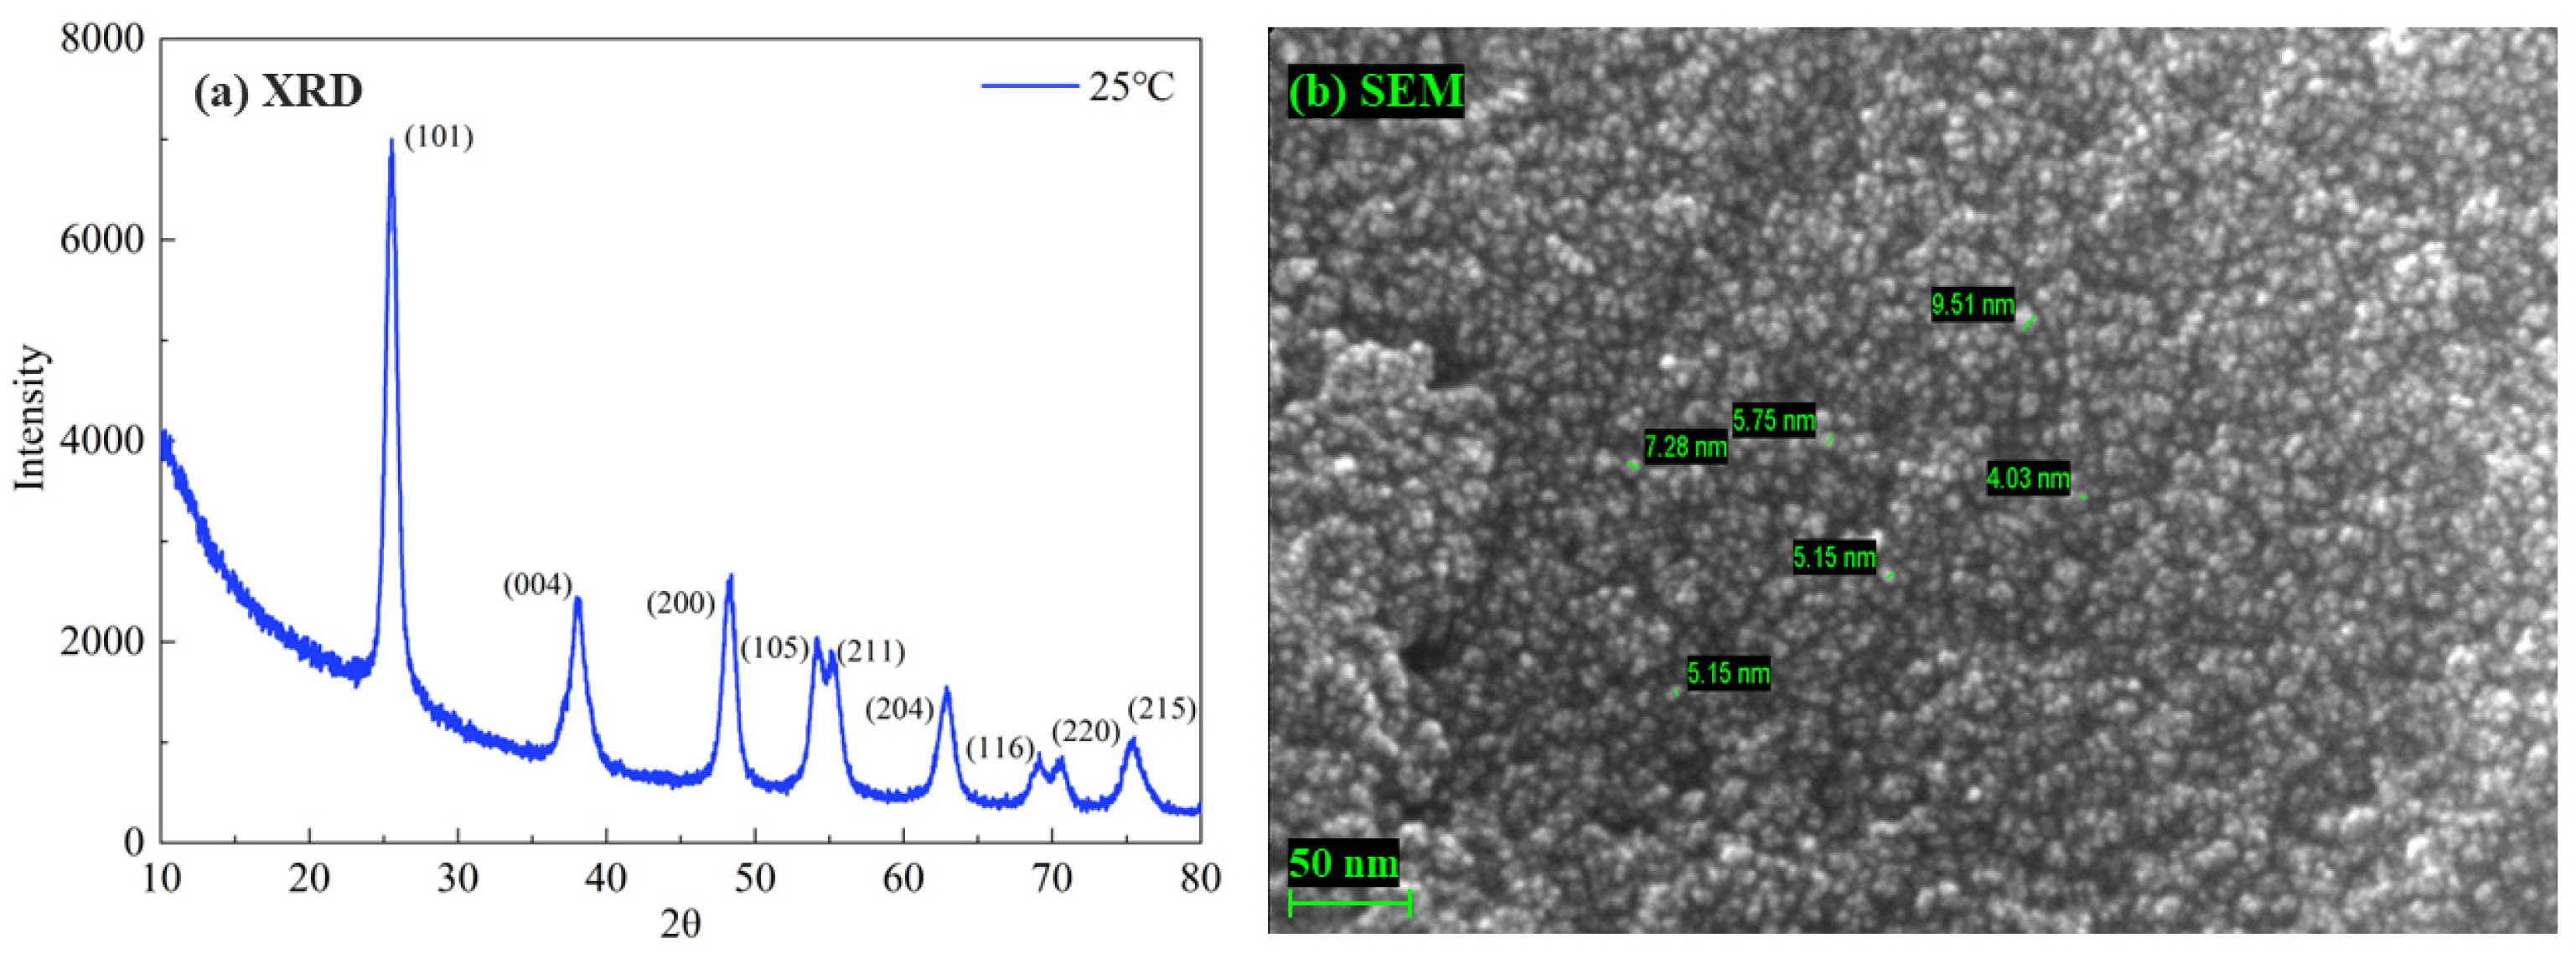
4.6. Experimental Verification

Under the conditions of 1 mLTiCl4, 6 mLC6H15NO3, 15 mLH2O, and 30 mLC2H5OH, the pH was 7, the reaction temperature was 25 °C, and the reaction time was 4 h. After the reaction was completed, the solution and product were characterized using a nanoparticle size and Zeta potential analyzer (Malvern Panalytical Ltd. (Malvern, UK) MAIVERN TU-1901), XRD (Japan Rigaku Smart Lab SE), and SEM (Germany ZEISS Sigma 300, Jena, Germany). The calculation and experimental results are shown in Figure 12 and Figure 13. From Figure 12, the experimental characterization results exhibit a normal distribution with D50 at 6.13 nm as the center of symmetry, while the simulation calculation results exhibit a normal distribution with D50 at 6.15 nm as the center of symmetry. In the range of particle sizes less than 6 nm, the simulation results are slightly larger than the experimental characterization results, and the maximum error of the mass fraction is around 1%. However, when the particle size exceeds 6 nm, the experimental characterization results are larger than the simulation calculation results, and the maximum error of the mass fraction currently is about 0.5%. From Figure 13a, the 2θ characteristic peak of the anatase type TiO2 appeared at an angle of 25.4 degrees (101), which was very sharp. The average particle size was estimated to be 5.75 nm using the Scheler formula. However, compared to the SEM characterization results in Figure 13b, the particle size varied, including 4.03 nm, 5.15 nm, 7.28 nm, and 9.51 nm, but the distribution was very uniform and concentrated. Overall, the particles characterized via XRD and SEM in Figure 13 were within the particle size range of the particle size distribution curve in Figure 12. The error range of the simulation calculation results is within 1% ± 0.5%, which clearly conforms to the prediction of the model, indicating that the model has good accuracy and applicability under this condition.

5. Conclusions

The results show that the formation mechanism of nano-TiO2 particles is affected by many factors, such as the reaction time, reaction temperature, amount of water, pH value, and amount of ethanol. Especially in the process of particle formation, the nucleation and growth stage play a decisive role, and the kinetics equations of nucleation and growth stage are obtained. The experimental results show that the maximum number of particles can reach 195 mesh per cubic micron under the neutral conditions of 1 mL TiCl4,6 mL C6H15NO3,15 mL H2O, and 30 mL C2H 5OH for 4 h, and the particle size after crystal nucleus growth is small, and D50 is 6.15 nm. At this time, the particle size distribution curve accords with the normal distribution, which is consistent with the results obtained via XRD and SEM. We found that D50 can be reduced to 2.44 nm within 60 min at room temperature. In addition, D50 can be further reduced to 0.19 nm by adjusting the amount of water added to 1 mL, although this leads to a decrease in the number of nuclei. After further adjusting the pH value and the amount of ethanol, we found that the number of nuclei and D50 reached the optimum under neutral conditions. When the amount of ethanol was 4 mL, the maximum particle number reached 199 mesh per cubic micron, and the D50 increased slightly to 0.24 nm. However, the formation of TIO2 particles will be adversely affected by too little or too much ethanol. Although this study is limited by the experimental equipment and only discusses the influence of a single factor, these findings have important reference value for further optimizing the preparation process of nano-TiO2, and it provides an important theoretical basis for seeking the optimum preparation conditions.

Author Contributions

Methodology, Q.L.; Validation, Q.L.; Resources, W.L.; Writing–original draft, Q.L.; Writing–review & editing, S.Y. All authors have read and agreed to the published version of the manuscript.

Funding

This research was funded by Key Project of Education Department of Hunan Province, grant number 19A521, Natural Science Foundation of Hunan Province, grant number 2022JJ31008, and Special Project of Department of Science and Technology of Guangdong Province, grant number GDKTP2020019900.

Data Availability Statement

Data are contained within the article.

Conflicts of Interest

The authors declare no conflict of interest.

References

  1. Li, L. TiO2 Research on the Regulation Mechanism and Performance of 2 Morphology and Crystal Structure; Chongqing University: Chongqing, China, 2021. [Google Scholar]
  2. Zhao, X.; Xu, W.; Huang, B.; Ma, J.; Chen, H.; Hao, X.; Ge, B.; Wang, C. Effect of TiH2 intermediate on the structure and properties of TiO2 coating induced on titanium by induction heating and its multifunctional mechanism. Appl. Surf. Sci. 2021, 536, 147968. [Google Scholar] [CrossRef]
  3. Yu, S.; Zhang, J.; Luo, W.; Zhang, K.; Li, X.; Liu, Y. Titanium Dioxide Nanocomposites and Their Preparation Methods and Applications, Hunan Province. CN 109847662B, 29 October 2021. [Google Scholar]
  4. Song, J.; Qin, J.; Qu, J.; Song, Z.; Zhang, W.; Xue, X.; Shi, Y.; Zhang, T.; Ji, W.; Zhang, R.; et al. The effects of particle size distribution on the optical properties of titanium dioxide rutile pigments and their applications in cool non-white coatings. Sol. Energy Mater. Sol. Cells 2014, 130, 42–50. [Google Scholar] [CrossRef]
  5. Zhang, Q.; Li, C. Effects of Water-to-Methanol Ratio on the Structural, Optical and Photocatalytic Properties of Titanium Dioxide Thin Films Prepared by Mist Chemical Vapor Deposition. Catal. Today 2019, 358, 172–176. [Google Scholar] [CrossRef]
  6. Horvat, P.; Škapin, A.S.; Štangar, U.L.; Korošec, R.C. Thermal techniques as a tool for the direction of the preparation of photocatalytically efficient titania thin films and powders. J. Therm. Anal. Calorim. 2020, 146, 1121–1131. [Google Scholar] [CrossRef]
  7. Kompa, A.; Mahesha, M.G.; Kekuda, D.; Rao, K.M. Spectroscopic investigation of defects in spin coated titania based thin films for photocatalytic applications. J. Solid-State Chem. 2021, 303, 122488. [Google Scholar] [CrossRef]
  8. Zhang, B.; Chen, S.; Yang, Y.; Luo, R.; Xia, Y.; Wang, X.; Liu, Q.; Hu, B. Phase transition of titanium dioxide based on quantum dynamics. Phys. Chem. Chem. Phys. 2023, 25, 23024–23032. [Google Scholar] [CrossRef] [PubMed]
  9. Yang, K.; Yang, L.; Ai, C.-Z.; Wang, Z.; Lin, S.-W. Elastic properties of anatase titanium dioxide nanotubes: A molecular dynamics study. Chin. Phys. B 2019, 28, 103102. [Google Scholar] [CrossRef]
  10. Aljaerani, H.A.; Samykano, M.; Pandey, A.K.; Said, Z.; Sudhakar, K.; Saidur, R. Effect of TiO2 nanoparticles on the thermal energy storage of HITEC salt for concentrated solar power applications. J. Energy Storage 2023, 72, 108449. [Google Scholar] [CrossRef]
  11. Wang, M.-C.; Wu, B.-H.; Liu, S.-E.; Li, Y.-C.; Lin, S.-K.; Tsai, T.-M.; Chang, T.-C. A solid-state semiconductor battery with silica-coated TiO2 core–shell energy storage nanoparticles for rechargeable device application. AIP Adv. 2023, 13, 095011. [Google Scholar] [CrossRef]
  12. Yang, M.; Ma, R.; Chen, L.; Zhang, C.; Cao, R.; Wen, Q. Preparation and photo-catalytic performance of β2-SiW11/PANI/TiO2 photo-catalyst. J. Coord. Chem. 2020, 73, 3420–3430. [Google Scholar] [CrossRef]
  13. El-Ola, S.M.A.; Kotb, R.M. Functional versatility of hybrid composite finishing of chitosan-titania NPs-organic UV-absorber for polyacrylonitrile fabric. J. Eng. Fibers Fabr. 2021, 16, 15589250211064845. [Google Scholar] [CrossRef]
  14. ASPEN PLUS V11 User’s Manual; Aspen Technology Inc.: Bedford, MA, USA, 2023.
  15. Hachhach, M.; Akram, H.; Hanafi, M.; Achak, O.; Chafik, T. Simulation and Sensitivity Analysis of Molybdenum Disulfide Nanoparticle Production Using Aspen Plus. Int. J. Chem. Eng. 2019, 2019, 3953862. [Google Scholar] [CrossRef]
  16. Dehury, P.; Mahanta, U.; Singh, R.; Banerjee, T. Potential of deep eutectic solvent based nanofluids as a new generation heat transfer media. J. Mol. Liq. 2023, 379, 121700. [Google Scholar] [CrossRef]
  17. ASPEN PLUS V11 Modeling Solid Operations in Aspen Plus; Aspen Technology Inc.: Bedford, MA, USA, 2023.
  18. Schefflan, R. Introduction to Aspen Plus. In Teach Yourself the Basics of Aspen Plus™; Schefflan, R., Ed.; John Wiley & Sons, Inc.: Hoboken, NJ, USA, 2011. [Google Scholar] [CrossRef]
  19. Mangum, J.S.; Garten, L.M.; Ginley, D.S.; Gorman, B.P. Utilizing TiO2 amorphous precursors for polymorph selection: An in-situ TEM study of phase formation and kinetics. J. Am. Ceram. Soc. 2019, 103, 2899–2907. [Google Scholar] [CrossRef]
  20. Fang, X. TiCl Preparation of Nano TiO2 by Liquid Phase Hydrolysis Research on 2 Powders; South China University of Technology: Guangzhou, China, 2002. [Google Scholar]
  21. Wei, H.-y. Computer-aided design and scale-up of crystallization processes: Integrating approaches and case studies. Chem. Eng. Res. Des. 2010, 88, 1377–1380. [Google Scholar] [CrossRef]
  22. Vlasov, V.A. Activated complex theory of nucleation. Eur. Phys. J. E 2019, 42, 36. [Google Scholar] [CrossRef]
  23. Rojas Molina, R.; Liese, S.; Alimohamadi, H.; Rangamani, P.; Carlson, A. Diffuso-kinetic membrane budding dynamics. Soft Matter 2020, 16, 10889. [Google Scholar] [CrossRef]
  24. Hao, B.; Huang, J. Research Review on Crystal Growth Mechanism. J. Beijing Inst. Pet. Chem. Technol. 2006, 58–64. [Google Scholar]
  25. Fu, M.-Q.; Bi, Q.-L.; Lü, Y.-J. Kinetics of Spherical Interface in Crystal Growth. Chin. Phys. Lett. 2017, 34, 048102. [Google Scholar] [CrossRef]
  26. Fytopoulos, A.A.; Kavousanakis, M.E.; Van Gerven, T.; Boudouvis, A.G.; Stefanidis, G.D.; Xiouras, C. Crystal Growth, Dissolution, and Agglomeration Kinetics of Sodium Chlorate. Ind. Eng. Chem. Res. 2021, 60, 7367–7384. [Google Scholar] [CrossRef]
  27. Vander Voort, G.; Pakhomova, O.; Kazakov, A. Evaluation of Normal Versus Non-Normal Grain Size Distributions. Mater. Perform. Charact. 2016, 5, 521–534. [Google Scholar] [CrossRef]
  28. Hu, Z. Based on Different Crystal Forms of TiO2 Research on the Structure and Performance of Quantum Dot Sensitized Solar Cells with 2 Photoanodes; Changchun University of Technology: Changchun, China, 2022. [Google Scholar]
Figure 1. Flow chart of TiCl4 hydrolysis to prepare TiO2.
Applsci 13 12213 g001
Figure 2. The curve of the number of TiO2 crystal nuclei over time.
Applsci 13 12213 g002
Figure 3. Variation curve of TiO2 particles with reaction time.
Applsci 13 12213 g003
Figure 4. The change curve of TiO2 nucleus number with time at different temperatures.
Applsci 13 12213 g004
Figure 5. Distribution curves of TiO2 particles at different temperatures.
Applsci 13 12213 g005
Figure 6. Variation curve of TiO2 crystal nucleus number with time under different water amounts.
Applsci 13 12213 g006
Figure 7. Distribution curves of TiO2 particles under different water amounts.
Applsci 13 12213 g007
Figure 8. Variation curve of TiO2 crystal nucleus number with time at different pH values.
Applsci 13 12213 g008
Figure 9. Distribution curves of TiO2 particles at different pH values.
Applsci 13 12213 g009
Figure 10. Variation curve of TiO2 crystal nucleus number with time under different ethanol addition amounts.
Applsci 13 12213 g010
Figure 11. Distribution curves of TiO2 particles under different amounts of ethanol.
Applsci 13 12213 g011
Figure 12. Comparison of calculation and experimental results.
Applsci 13 12213 g012
Figure 13. Product particle characterization diagram.
Applsci 13 12213 g013
Disclaimer/Publisher’s Note: The statements, opinions and data contained in all publications are solely those of the individual author(s) and contributor(s) and not of MDPI and/or the editor(s). MDPI and/or the editor(s) disclaim responsibility for any injury to people or property resulting from any ideas, methods, instructions or products referred to in the content.

