Abstract
A one-dimensional fluid model was employed to investigate the influence of the small secondary electron emission (SEE) coefficient on the characteristic properties of an Ar/O2 gas discharge at atmospheric pressure driven by a dual frequency source. The study includes basic physical quantities such as particle density, electron temperature, the electron heating mechanism, and energy loss. The research results illustrate that with an increase in the secondary electron emission coefficient, the electron density increases, while electron temperature and electric field decrease. The densities of various particles increase to different degrees, except for the metastable molecule and the O atom. The density of the metastable molecule and the density of the O atom are hardly affected by the SEE coefficient; however, the time required for both to reach steady state decreases. The time required for the electron density to reach steady state increases. Electron heating and energy loss increase to varying degrees when the SEE coefficient changes from 0.001 to 0.01.
1. Introduction
Argon and oxygen are widely used as working gases in atmospheric pressure discharges, which also can be applied in many scientific domains, such as metal-surface treatment and biomedical applications [1,2,3]. To generate an Ar/O2 plasma in an atmospheric pressure discharge, many methods are adopted, including capacitively coupled radio-frequency (rf) discharge, pulsed discharge, and so on [4,5,6]. However, there are several issues to be resolved in these discharges, such as the separate control of ion flux and plasma density in plasma processing. In recent years, discharge plasmas driven by dual radio frequency at atmospheric pressure have attracted considerable attention due to their superior discharge characteristics, such as improved electron excitation temperature, current density, and the plume length of the plasma. The concept of dual-radio-frequency-driven discharge is extrapolated from low-pressure discharge, which operates using two distinct power sources. One is a high-frequency (HF) source, which controls plasma density, and the other is a low-frequency source (LF), which controls the ion energy, plasma potential, and the sheath width in low-pressure discharges [7,8].
The discharge driven by a dual-frequency source at atmospheric pressure has a strong nonlinear effect when the two applied frequencies couple, which could affect the excitation and ionization dynamics. Therefore, the plasma density is controlled both by high- and by low-frequency sources. The role of frequency coupling in dual-frequency discharges has been investigated by researchers using numerical simulations. J. Waskoening et al. [7] analyzed the nonlinear frequency coupling in atmospheric-pressure helium plasmas driven by a dual-frequency source. Their research results showed that the associated mode transitions and plasma ionization were governed by the coupling of nonlinear frequencies in the dynamics of the plasma boundary sheath. In addition, the ionization mechanisms were different in low-power mode and high-power mode, which revealed that the different nonlinear coupling mechanisms constituted a determining factor. The total voltage of two frequencies controlled the transitions between low-power mode and high-power mode. The research of C. O’Neill et al. [8] also confirmed that the coupling of nonlinear frequencies governed the dynamics of plasma ionization and the associated mode transition in the plasma boundary sheath. Meanwhile, they pointed out that the temporal and spatial structures of plasma ionization could be manipulated by varying the voltage ratios. Z. L. Zhang et al. [9] also studied the nonlinear phenomenon. They reported that a dual-frequency source could efficiently enhance the plasma characteristics of an atmospheric-pressure dielectric barrier discharge and provided a possible approach to controlling and optimizing key plasma parameters and even enabled separate control of density and gas temperature. They also performed numerical studies on the directional control of electron density and gas temperature in the dielectric barrier discharge using dual frequencies [10]. D. B. Kim et al. [11] conducted experimental studies on the atmospheric pressure discharge plasma driven by a dual-frequency source combining radio frequencies of 2 and 13.56 Mhz. Compared to a single frequency, dual frequencies increased the electron excitation temperature, current density, and the length of the plasma. H. C. Kwon et al. [12] adopted a particle in cell simulation to investigate the electron kinetics in single-frequency microplasmas and dual-frequency microplasmas in helium discharges at atmospheric pressure. They also proposed the concept of effective frequency [13] and pointed out that the dual-frequency capacitively coupled plasma (CCP) discharge could be analyzed similarly to a single-frequency CCP discharge by defining the effective frequency. S. Park et al. [14] reported the electron heating mechanisms both in single-frequency (13.56 Mhz and 4.52 Mhz) and dual-frequency (a combination of 13.56 Mhz and 4.52 Mhz) plasmas. R. Magnan et al. [15] investigated a dual-frequency discharge at atmospheric pressure by conducting experiments as well as numerical modeling. In their work, they focused on the influence of the low-frequency voltage amplitude on the dielectric barrier discharge in an Ar-NH3 mixture. They also investigated the discharge mode transition from α to α-γ mode, which resulted in an increase in the plasma density [16]. The use of Ar/O2 mixtures in dielectric barrier discharges at atmospheric pressure using dual-frequency (13.56 Mhz/200 kHz) excitation was investigated by Y. Liu et al. [17]. In their studies, they analyzed the effect of each frequency component on the dual-frequency-discharge mechanism and pointed out that the dual-frequency discharge exhibited potential for use in applications in plasma-assisted surface processing and plasma-assisted, gas-phase chemical conversion. B. Qi et al. [18] numerically investigated the characteristics of argon-dielectric-barrier-discharge excitation using dual frequencies at atmospheric pressure. When the low-frequency voltage amplitude was low, the electron flux at the dielectric surface decreased; however, the ion flux was unchanged. Although the dual-radio-frequency-driven discharge could increase the opportunities for plasma manipulation, it also increases the complexity of the discharge.
In our previous studies, we investigated the effects of high-frequency, secondary-electron emission coefficient on the characteristics of helium-discharge plasma driven by dual frequencies at atmospheric pressure. When combining a low-frequency source with a high-frequency source, the effects of the low-frequency source on the basic characteristics of the Ar/O2-discharge plasma at atmospheric pressure have not been thoroughly clarified. On the foundation of our previous studies, this paper investigates the characteristics of Ar/O2 atmospheric pressure discharge driven by a dual-frequency source. A one-dimensional fluid model has been used to describe a dual-frequency system in Section 2. The dependence of several discharge parameters on the basic plasma characteristics is presented and discussed in Section 3. Finally, the conclusions are summarized in the Section 4.
2. Description of Models
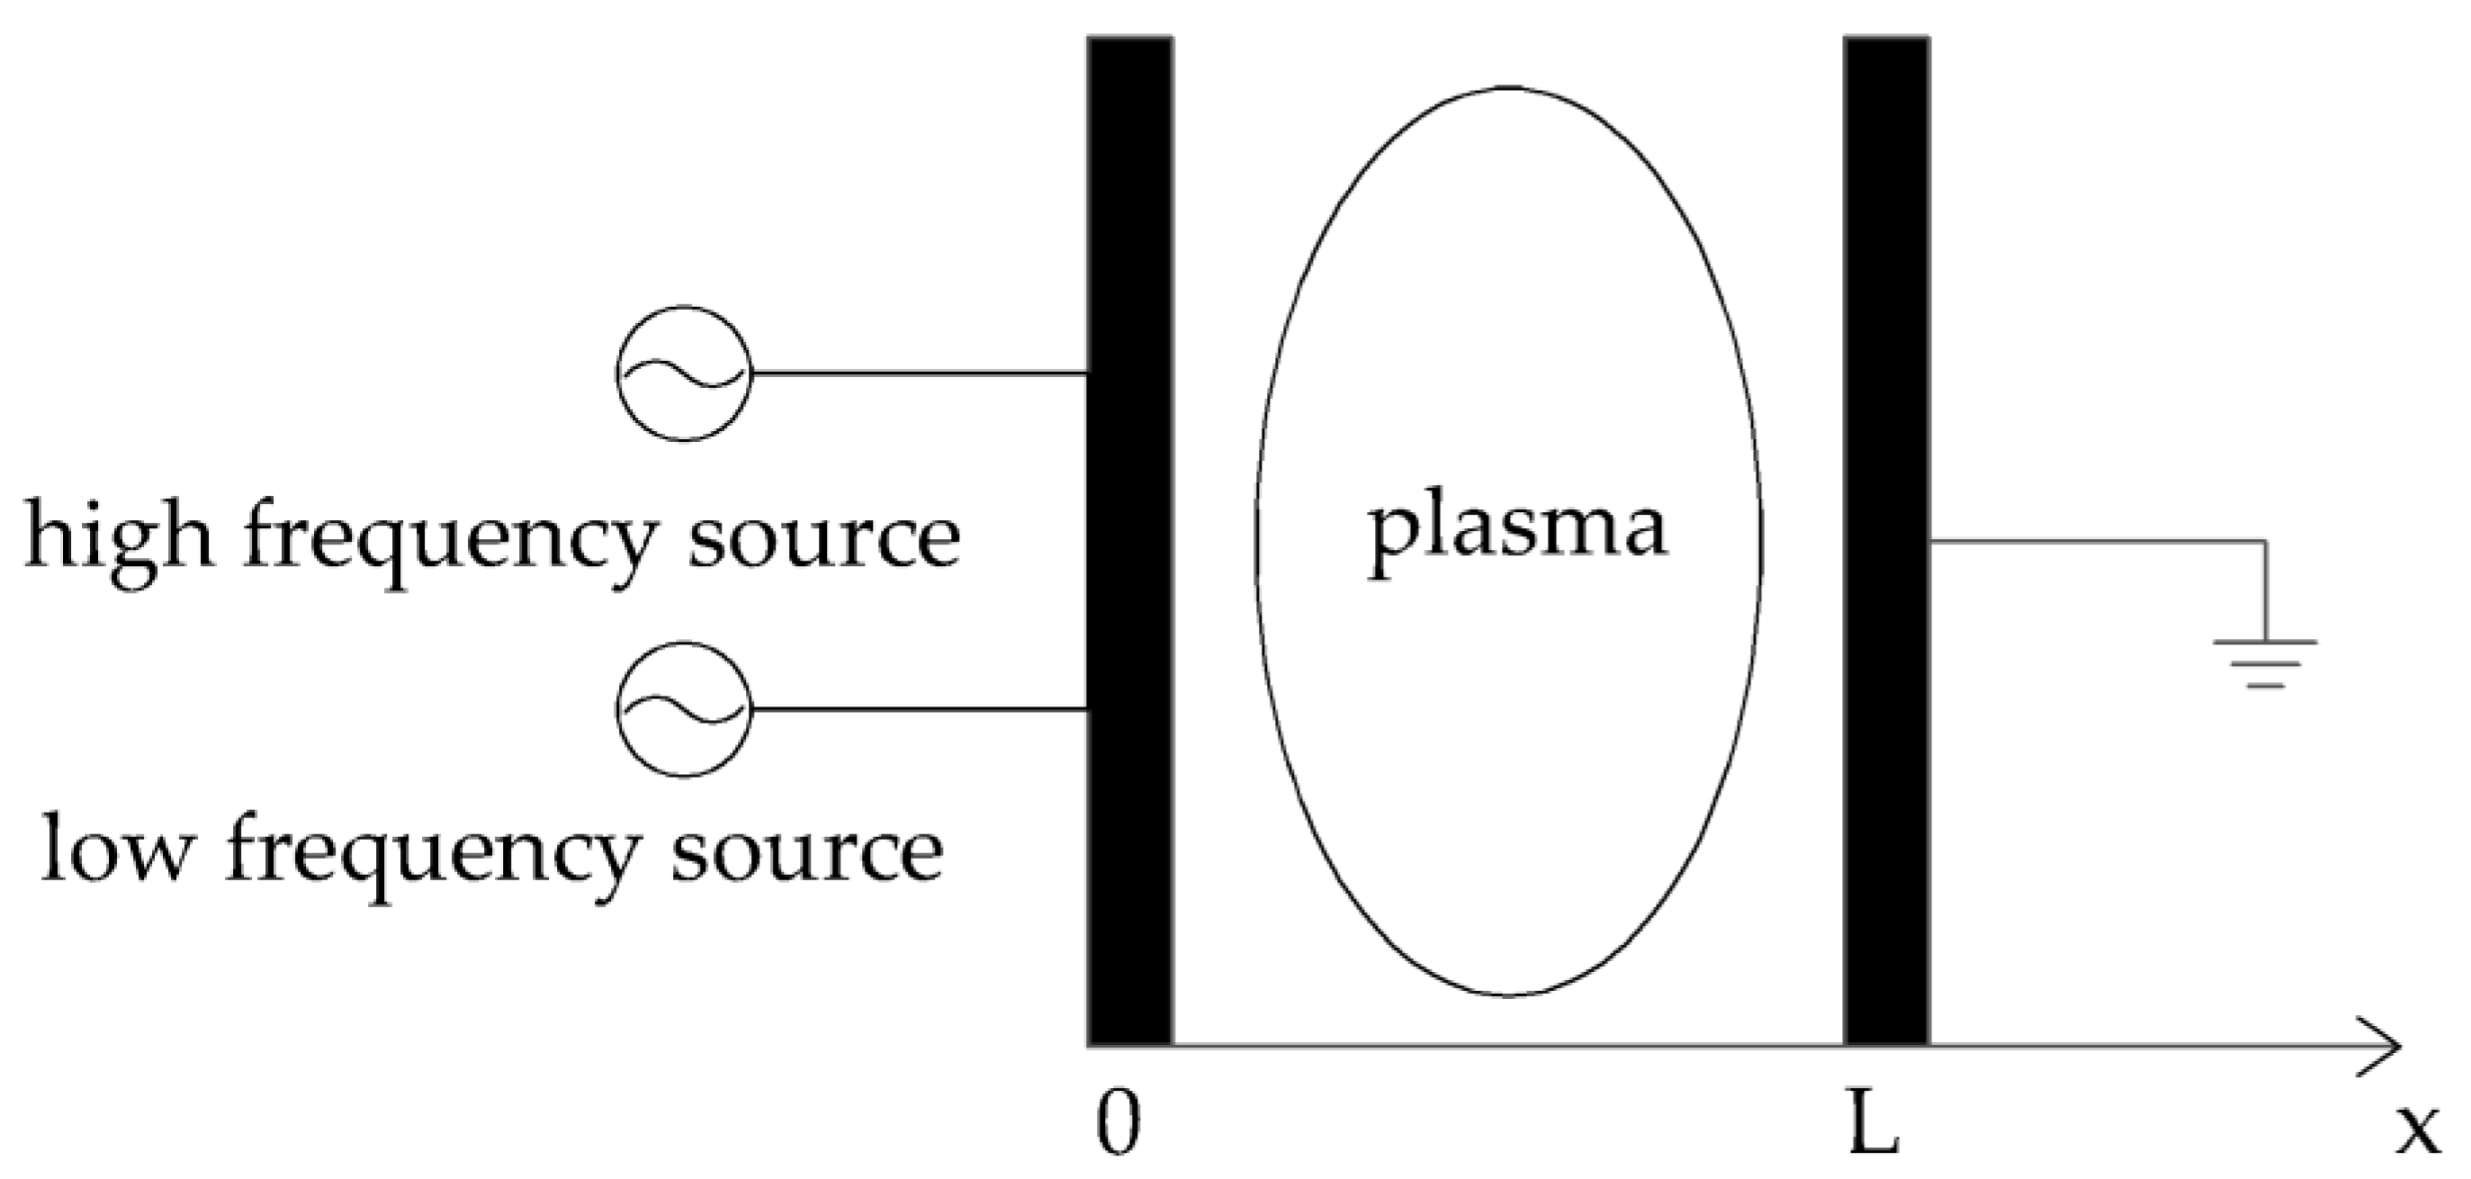
In this paper, two parallel-plate metal electrodes are used to generate the gas-mixture discharge. The discharge model is shown in Figure 1. The left-plate electrode is driven by a dual-frequency source. The dual-radio-frequency source can be expressed as follows: , where HF represents the high-frequency source and LF represents the low-frequency source. The voltage of the high-frequency source is 200 V, the high frequency is the typical radio frequency 13.56 Mhz. The voltage of the low-frequency source is 100 V and the low frequency is 2 Mhz. The right-plate electrode is grounded. In Figure 1, the letter L on the -axis represents the distance between the two plates. In this study, we chose a typical distance of 0.2 mm for the atmospheric pressure discharge. Generally, electrodes are separated by millimeters in atmospheric pressure discharges. The fluid model includes the particles’ continuity equations, the electron momentum equation, and the electron energy equation. The momentum equation was replaced by the drift–diffusion approximation in the atmospheric pressure discharge. On the foundation of our previous study, the model used here incorporates ten species and nineteen chemical reactions, which are listed in Table 1.
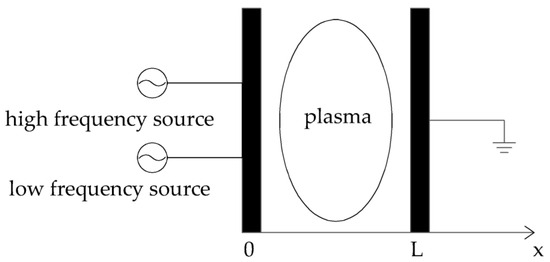
Figure 1.
Discharge model.

Table 1.
Reaction process in an argon-oxygen discharge.
In fact, the real reactions in the Ar/O2 atmospheric pressure discharge are more complex than those are listed in Table 1. For an argon discharge or oxygen discharge, the main particles listed in Table 1. are sufficient for the simple discharge model [22], and the main dominant collision processes are included. Thus, the model can predict the Ar/O2 atmospheric pressure discharge characteristics. The basic assumptions are the same as those in Refs. [24,25]. According to these assumptions, the equations can be written as follows:
where e, i, n, and m denote electrons, positive ions, negative ions, and metastable atoms, respectively. In addition, n, J, and S denote density, flux, and the source term, respectively.
Here, μ denotes the mobility of the particles, and D is the diffusion coefficient of the particles. In this study, we obtained these values from Refs. [22,23,26].
Here, is the electron energy flux; is the electron temperature in units of eV; e denotes the elementary charge; denotes the Boltzmann coefficient; E is taken to denote the electric field; is the background gas number density; is the coefficient of energy loss between electrons and particles j; is the reaction coefficient between electrons and particles j. The Poisson equation is as follows:
The relationship between the electric field and the electric potential is as follows:
Here, is the permittivity of free space, and V is the electric potential. The gas temperature is fixed at 300 K. The boundary conditions are listed in Table 2 [22,27,28]. The boundary conditions are very important and complex in the numerical calculations. In this study, the complex boundary conditions are not considered. The electron flux at the wall is caused by the secondary emission and recombination with the wall. The fluxes of ions are determined by the electric drift. For the neutral species, these are unaffected by the electric drift and are due to the fact that the mass of the particles is much higher than that of electrons; we can assume that these are zero at the wall. The electron temperature was set to 0.5 eV according to Ref. [22]. The electron temperature of 1 eV at the walls was used to test the model. And it showed that the bulk plasma density was not affected; the electron temperature at the interface between the plasma and sheath changed slightly, however. γ and are the SEE coefficient and the electron recombination coefficient, respectively. and γ can represent the electrode characteristics in a simulation. The secondary emission coefficient is a key parameter of the electrode, and it is also uncertain. As shown in previous research, it is normally set to 0.01. In this study, γ was changed from 0.001 to 0.01. was taken from Ref. [22]. The initial conditions are as follows (particle density is given in Ref. [22]):
Table 2.
Boundary conditions in the model.
We also examined other initial particle density distributions, such as a uniform distribution. The final results show that the effect on the discharge characteristics is negligible. We assumed the electron temperature to be constant at 0.5 eV.
The numerical method was described as follows: the center difference scheme and the implicit scheme were adopted in space and in time, respectively. For space, 400 uniform meshes were set. And for time, a time step of 104 in one high frequency period was used. The simulation program was developed in house using the Fortran programming language.
3. Results and Discussion
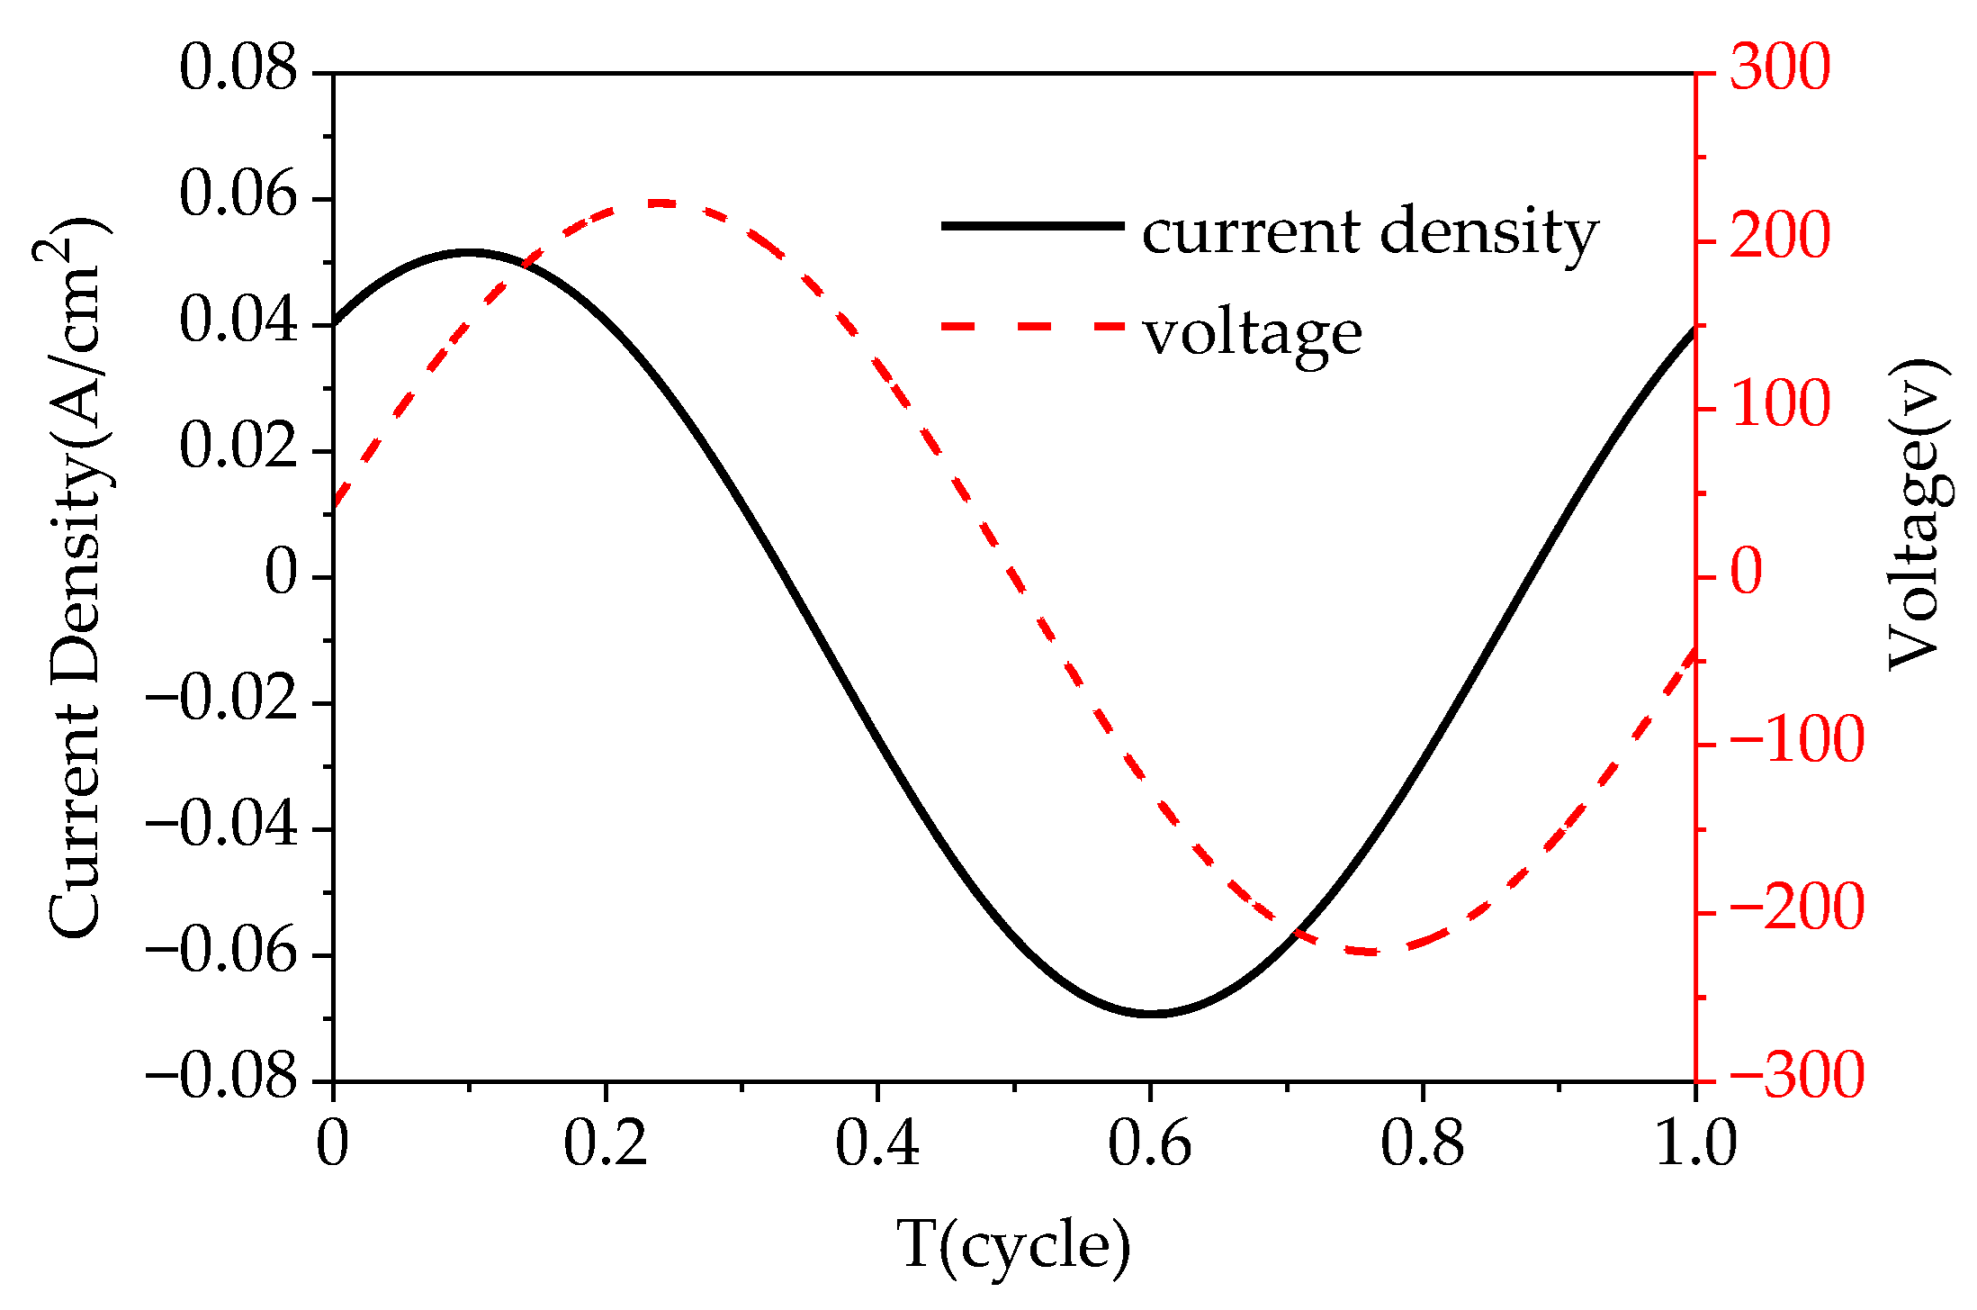
In this study, the ratio of oxygen to argon was 1:1000. Figure 2 shows the current density and applied-voltage wave forms in one cycle. The total current density was determined according to the formula ; the form of the conduction current density was set as [29,30,31]. In the above equation, V is the applied voltage, and is the particle flux. The current density curve and voltage curve are sinusoidal; the current phase angle is earlier than voltage. This is the discharge characteristic of a typical continuous RF-capacitive coupling discharge, which is similar to experimental results in radio-frequency, atmospheric-pressure Ar/O2 discharges [20]. And the characteristic of the capacitive coupling discharge was also reported in experimental results for a dual-frequency, He-gas discharge plasma [32].
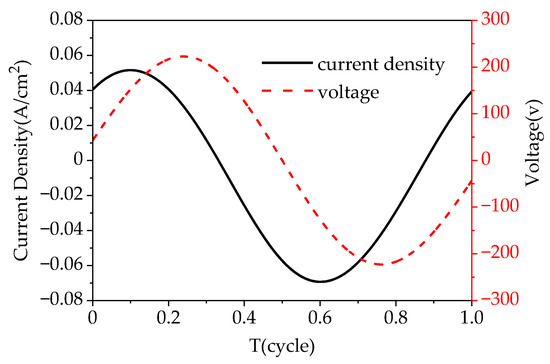
Figure 2.
Waveforms of the plasma current density and voltage in one cycle.
To further understand the basic characteristics of the Ar/ discharge plasma at atmospheric pressure driven by a dual-radio-frequency source, we simulated changes in physical parameters, such as the electron temperature, particle density, electric field, ionization, and so forth, when the secondary electron emission (SEE) coefficient was 0.001, 0.005, and 0.01.
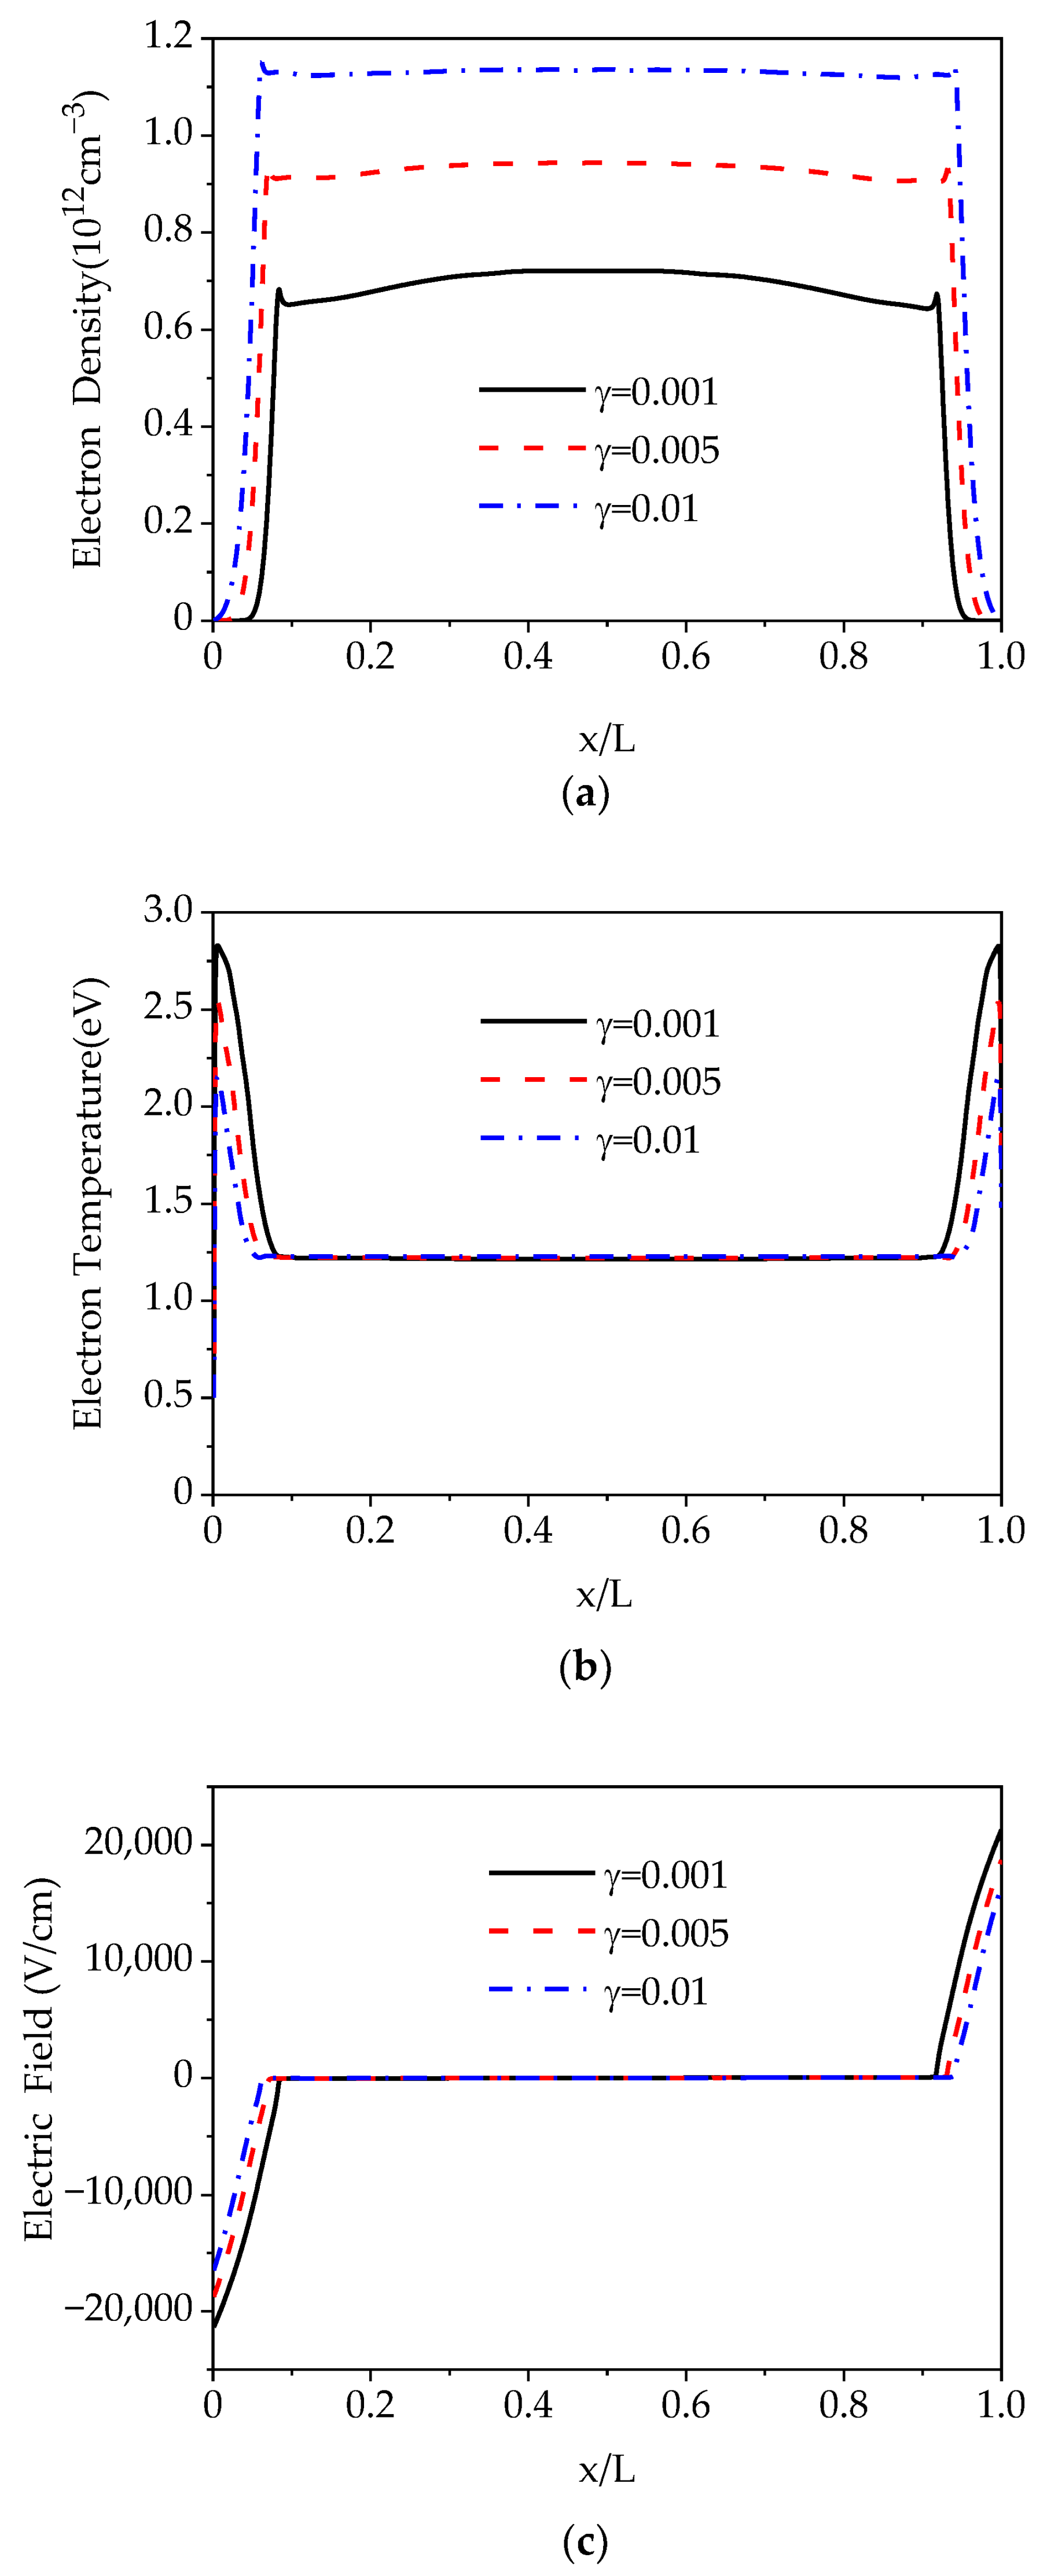
Figure 3 shows the spatial distributions of cycle-averaged electron density, electron temperature, and electric field as the SEE coefficient is increased from 0.001 to 0.01. According to Figure 3a, we can see that the electron density increases with as the SEE coefficient increases. When the SEE coefficient increases to 0.01, the electron density is roughly twice that with a SEE of 0.001. As we all know, secondary electrons are produced by the collisions of ions and electrodes. In the sheath region, extra electrons from the wall are accelerated by sheath’s electric field and multiply rapidly. Thus, the electron density and the ionization rate rise in the discharge space. As the electron density increases, the electron temperature in the sheath decreases from 2.83 eV to 2.15 eV; the electron temperature in the plasma remains almost constant, as the electric field is strong in the sheath region, causing the collision frequency between electrons and argon atoms or oxygen molecules to increase; energy loss then increases, as shown in Figure 3b. The electric field intensity decreases as the SEE increases, as shown in Figure 3c. In our study, the electron density increased from approximately cm−3 to cm−3. This result corresponds well to the results of the experimental study of Ar/O2 at atmospheric pressure [33]. In that study, the researchers used oxygen-to-argon ratios of 0.3% and 0.6%; the electron density and the electron temperature changed slightly. The electron density increased from approximately cm−3 to cm−3, and the electron temperature increased from approximately 1.37 eV to 1.43 eV.
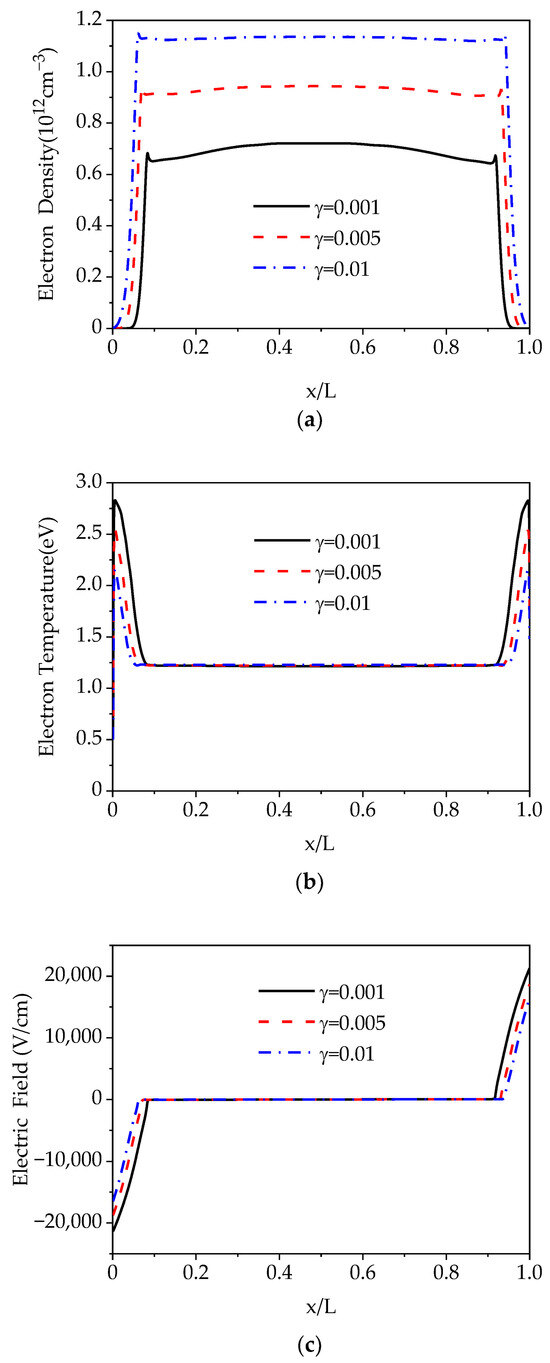
Figure 3.
Spatial distributions of cycle-averaged (a) electron density, (b) electron temperature, (c) electric field, with a SEE coefficient of 0.001, 0.005, and 0.01.
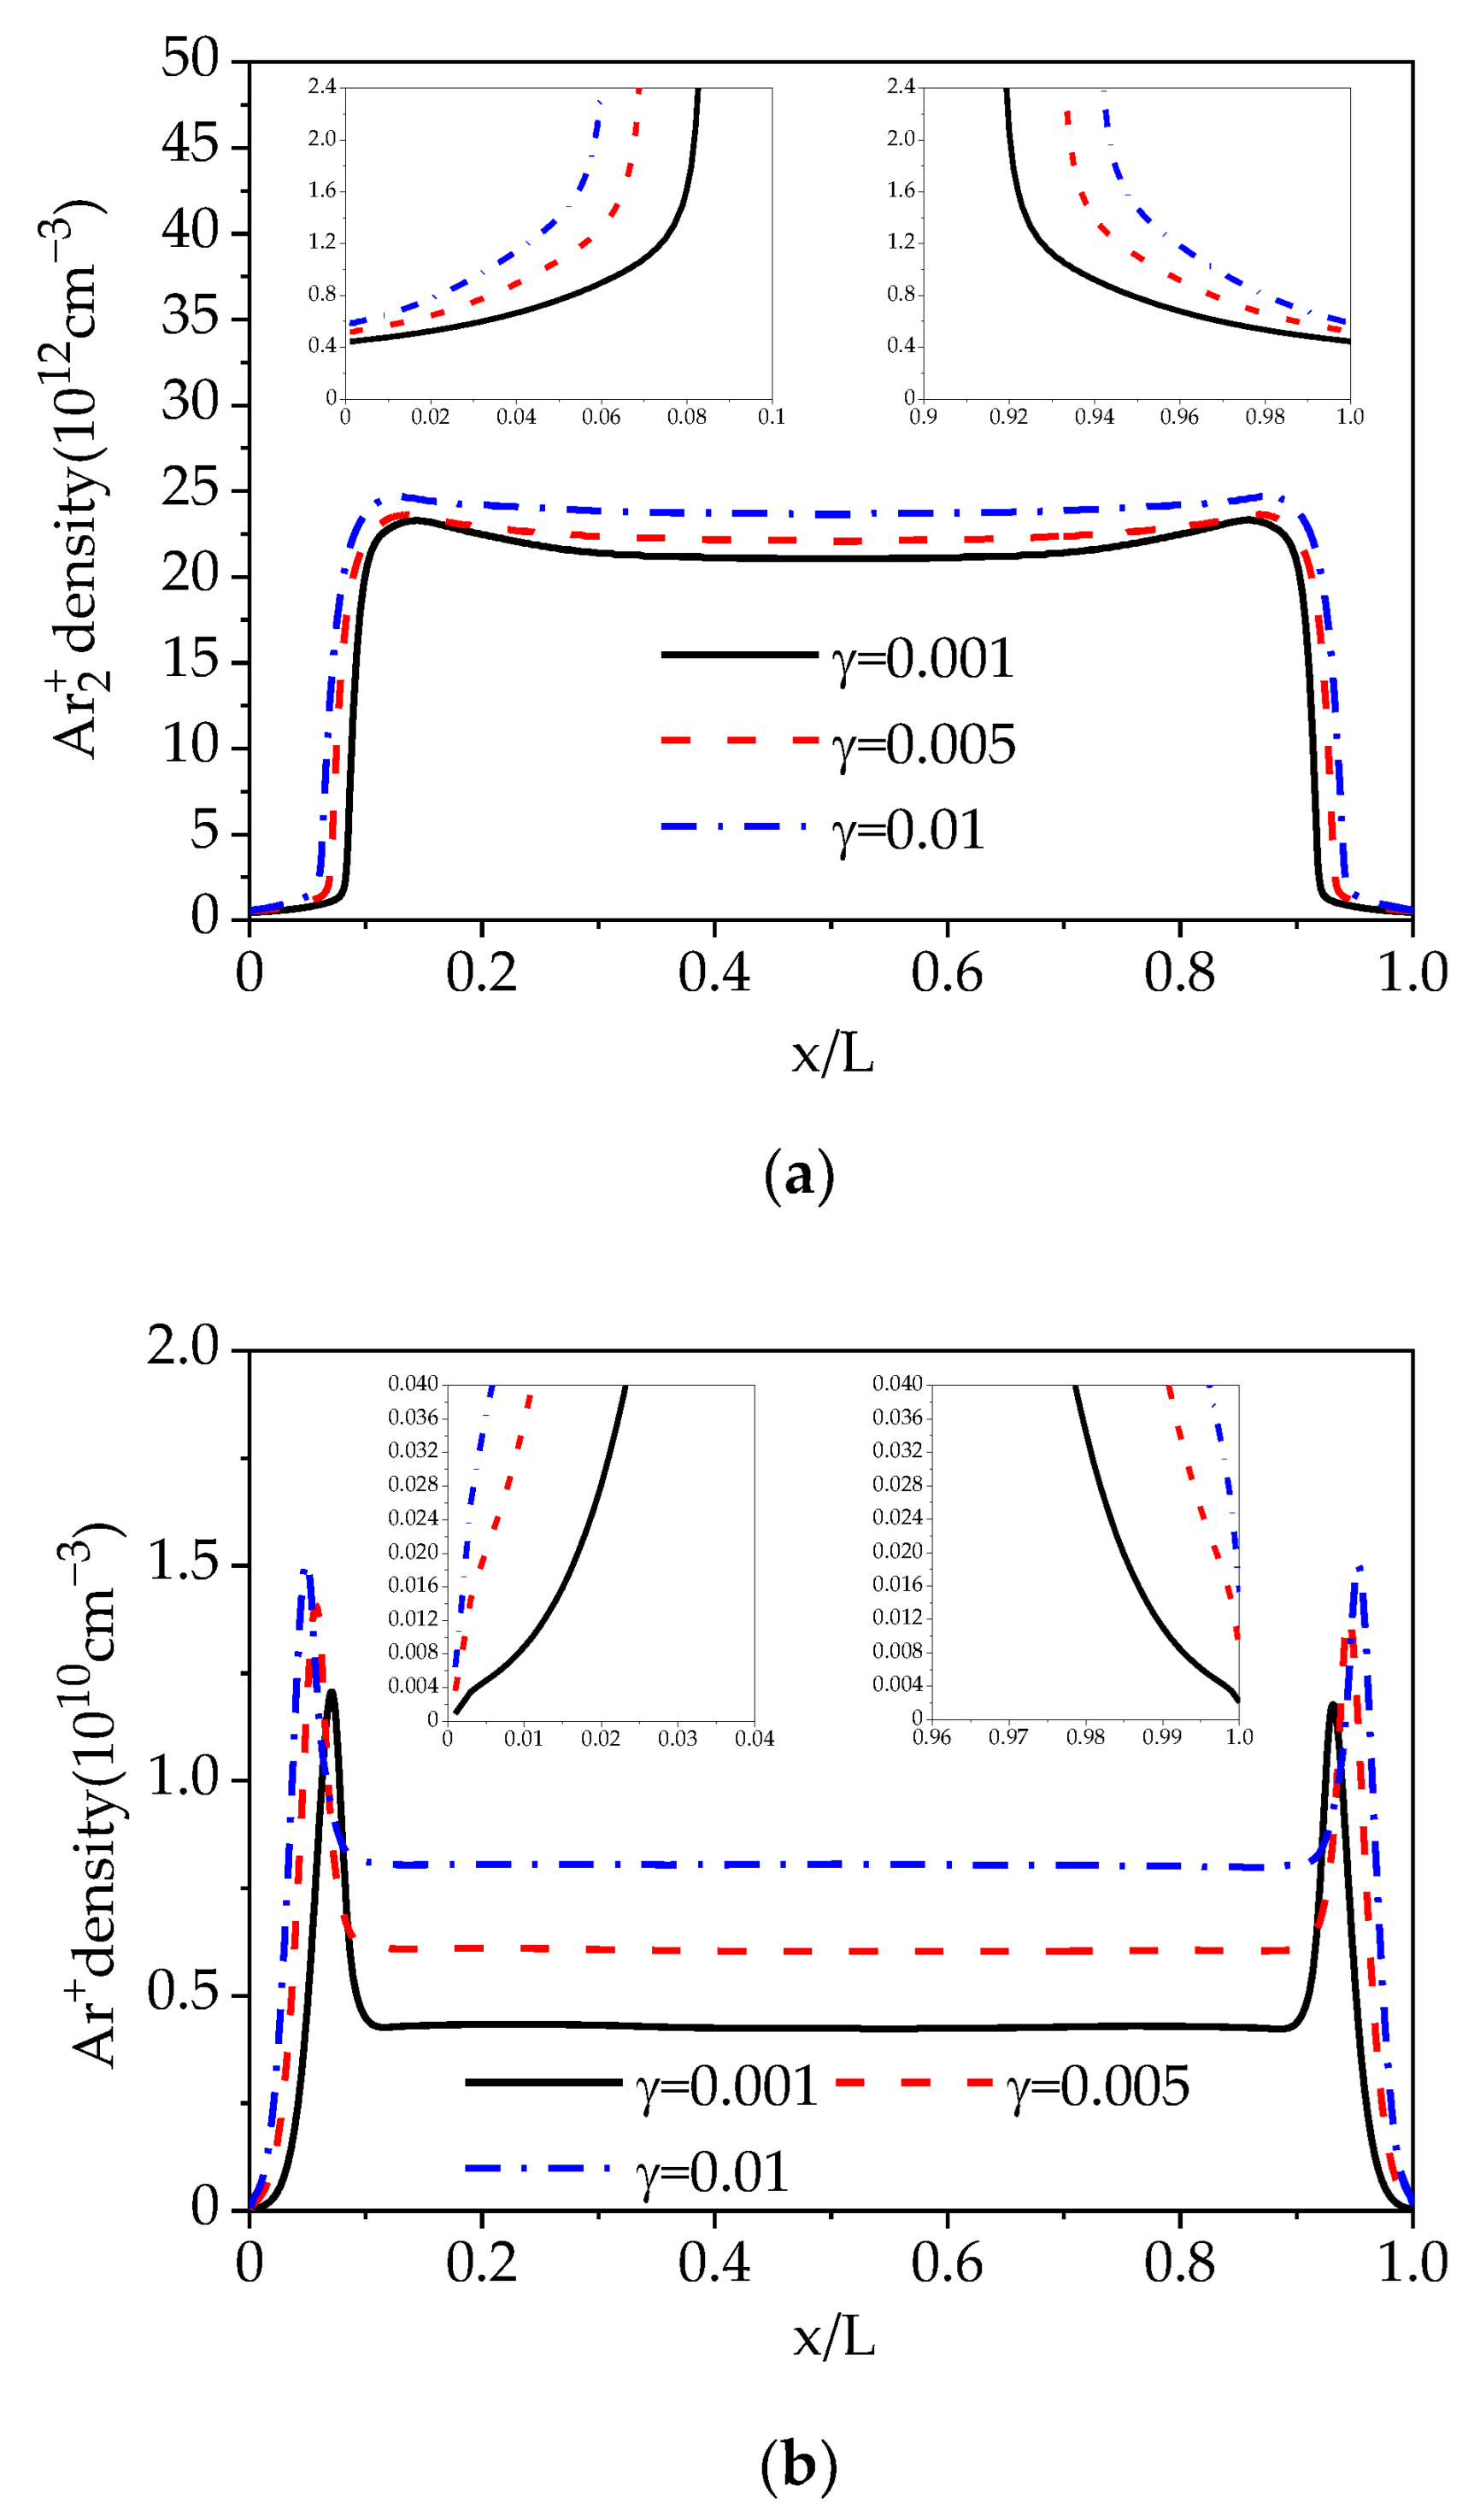
The spatial distributions of cycle-averaged ion density, ion density, and metastable atom density when varying the SEE coefficient from 0.001 to 0.01 are shown in Figure 4. They are symmetrically distributed in the discharge space, uniformly distributed in the plasma region and in the peaks of different degrees in the sheath regions. In quantity, ion density is the lowest. Although ionization produced many ions, the number of ions decreased due to the gradual dominance of reactions 5 and 13 in Table 1. Most of the ions are converted into ions. density is much higher than density, and the main positive argon ions are ions. This result is similar to the results of the numerical study on a pure argon discharge at atmospheric pressure, which also confirmed that, in an atmospheric-pressure argon discharge, the positive ions were largely ions [34]. From Figure 4 we can see that ions react more violently in the sheath region; the fluctuation from the plasma region to the sheath peak is greater than is the case for the other two particles. Additionally, the ion, ion, and metastable atom density increase when the SEE coefficient is increased. The change in the ion density is smaller. As shown in Figure 4a, the ion density decreases rapidly in the sheath regions, and the ions remain present on both electrode walls.
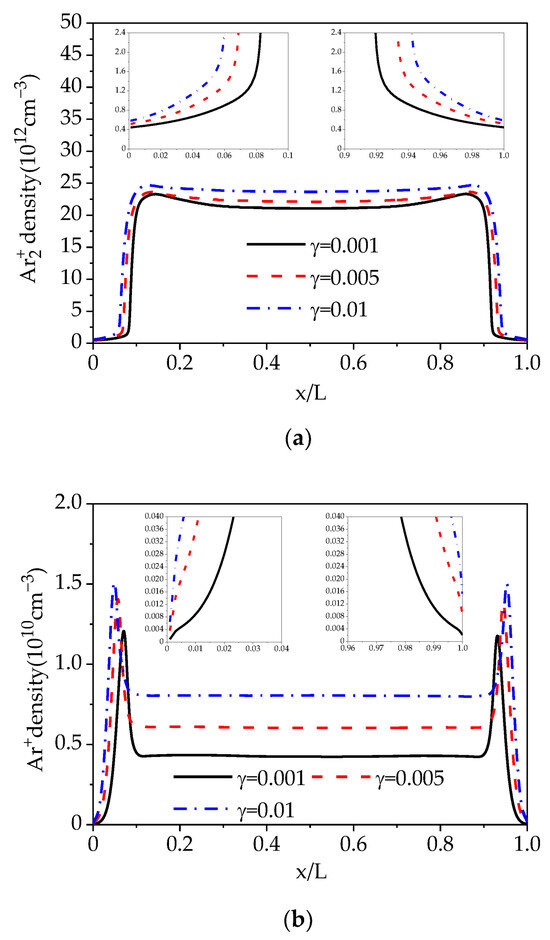
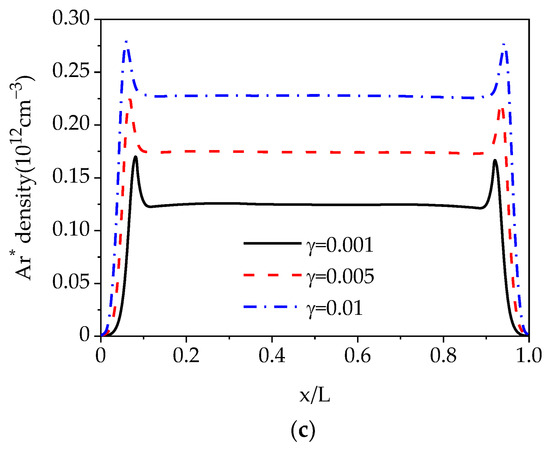
Figure 4.
Spatial distributions of cycle-averaged (a) ion density, (b) ion density and (c) metastable atom density at SEE coefficients of 0.001, 0.005, and 0.01.
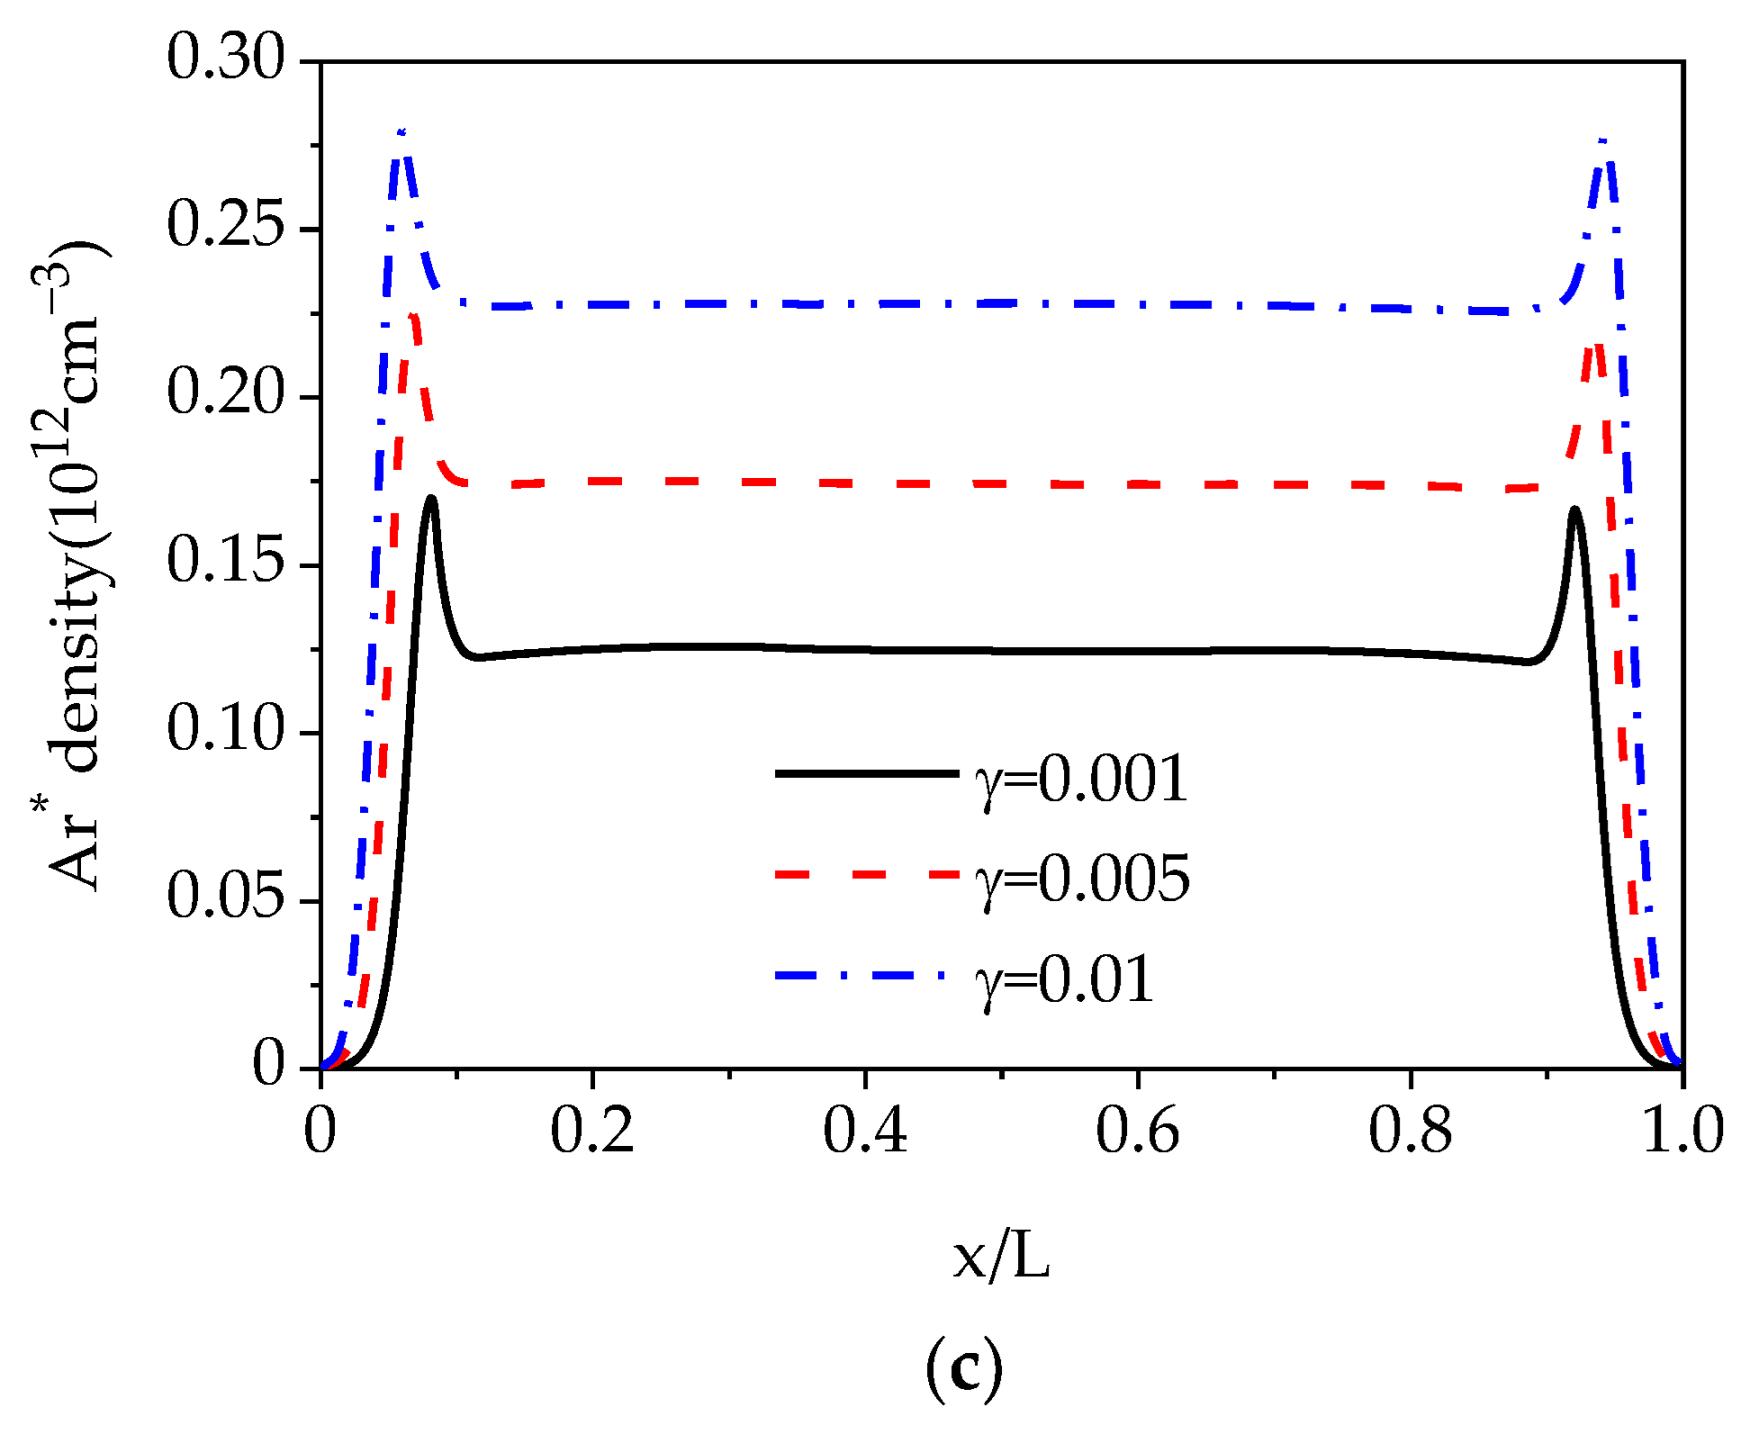
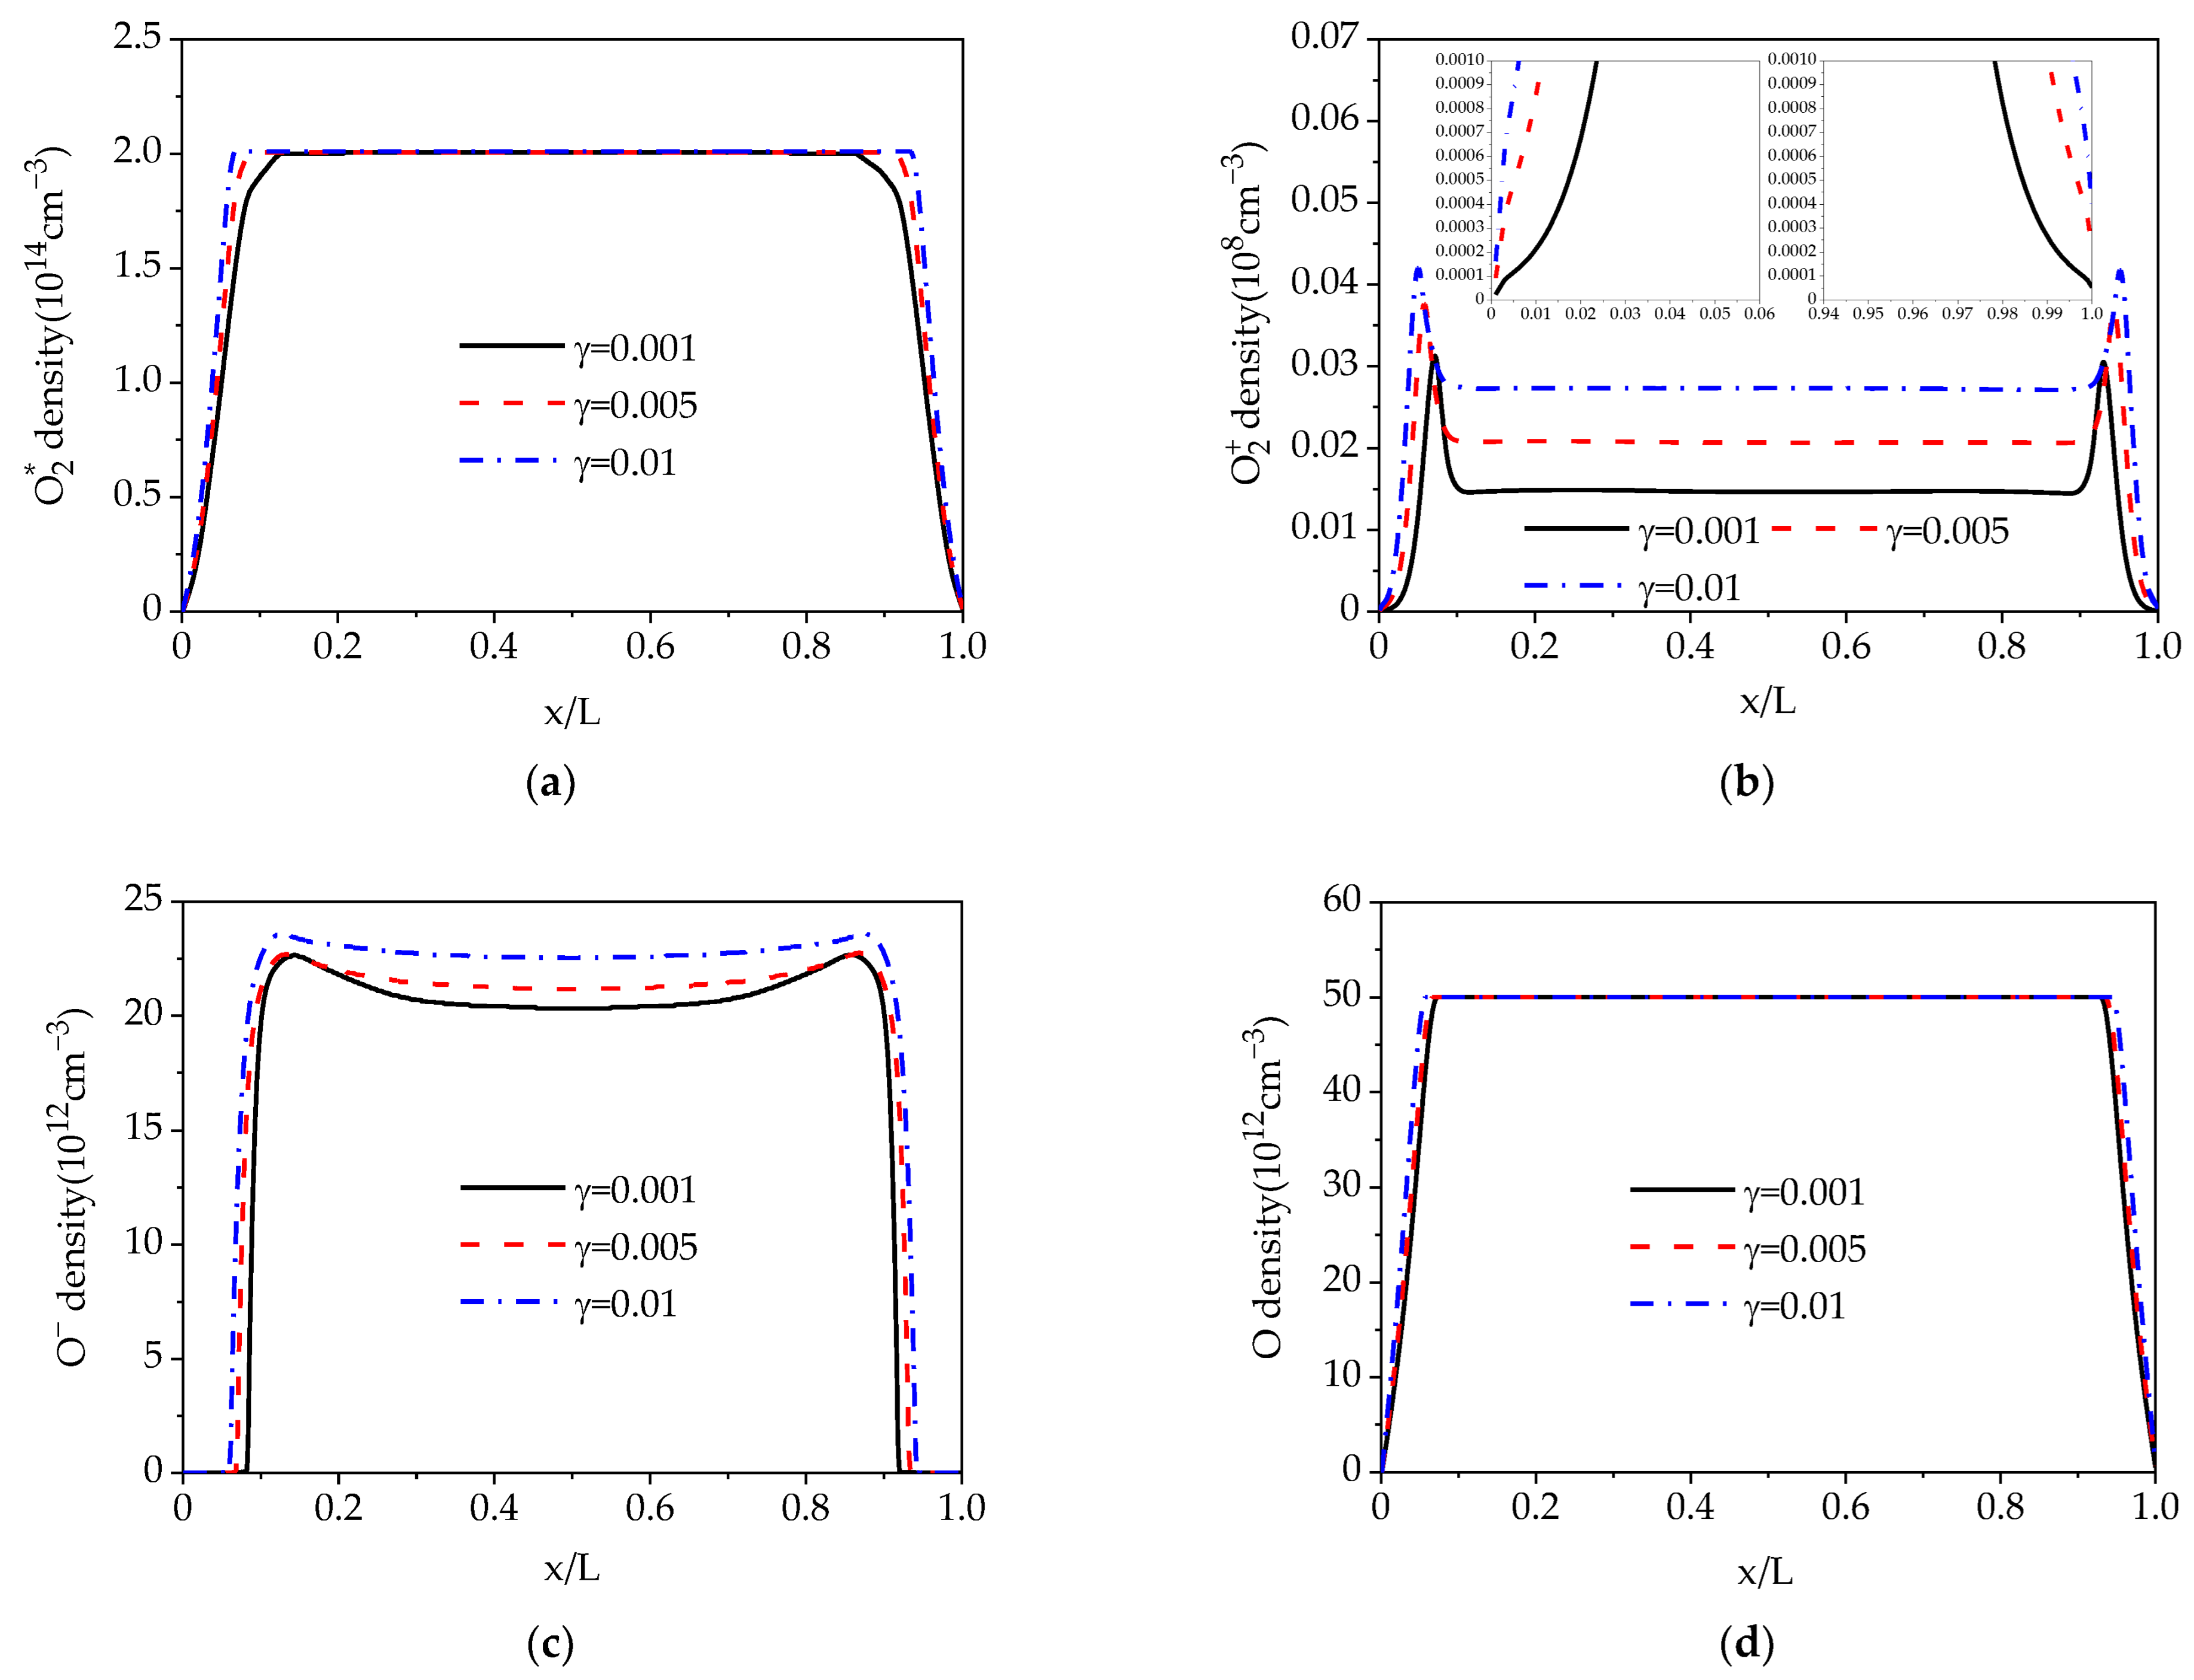
Figure 5 shows the spatial distributions of various cycle-averaged oxygen particle densities as the SEE coefficient was increased from 0.001 to 0.01. In spatial distributions, the sheath thickness decreased slightly as the SEE coefficient increased, and particle density was symmetrically distributed. As evidenced by the numbers of particles, the metastable molecule and O atom density were not affected by the SEE coefficient, as shown in Figure 5a,d. Although secondary electron emissions resulted in increased electron density, the process of electron loss via dissociative electron attachment (Reaction 8 in Table 1) increased, resulting in more ions generated. The concentration of is 0.1% in the gas mixture, which means it was nearly equal to that in the pure discharge at a pressure in the double digits (measured in Torr). The main process of generation is the excitation of the molecule (Reaction 15 in Table 1), which balances the process of loss. As a result, the density is not affected by the SEE coefficient. The processes of O atom generation depend on the ion density, which is why the O atom density is also unaffected by the SEE coefficient. The ion density obviously increases across the entire discharge space as the SEE coefficient increases, and two peaks appear in the sheath region in Figure 5b, because the ions are mainly produced by the direct ionization of electrons and oxygen, which is closely related to the electron density. The effect of secondary electron emission on the ion density is observed mainly in the plasma region. The ion density increases slightly in the plasma region, as seen in Figure 5c. In addition, the ion cannot penetrate the sheath due to the influence of the strong electric field in the sheath; thus the ion density is almost zero near the electrode wall. Compared to the electron density (Figure 3a), the ion density is much higher than the electron density in the Ar/O2 discharge and is nearly two orders of magnitude more than the electron density. Similar conclusions appeared in Refs. [20,33].
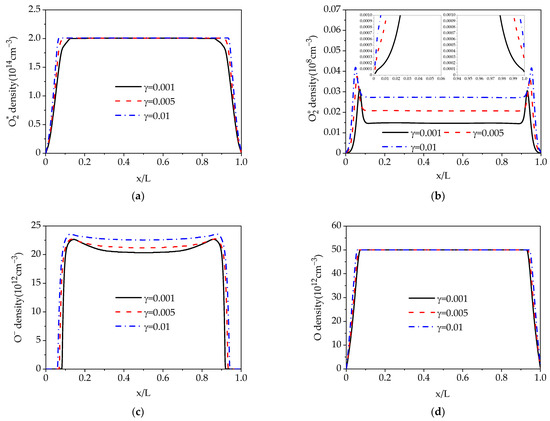
Figure 5.
Spatial distributions of cycle-averaged (a) metastable molecule density, (b) ion density, (c) ion density, and (d) O atom density at SEE coefficients of 0.001, 0.005, and 0.01.
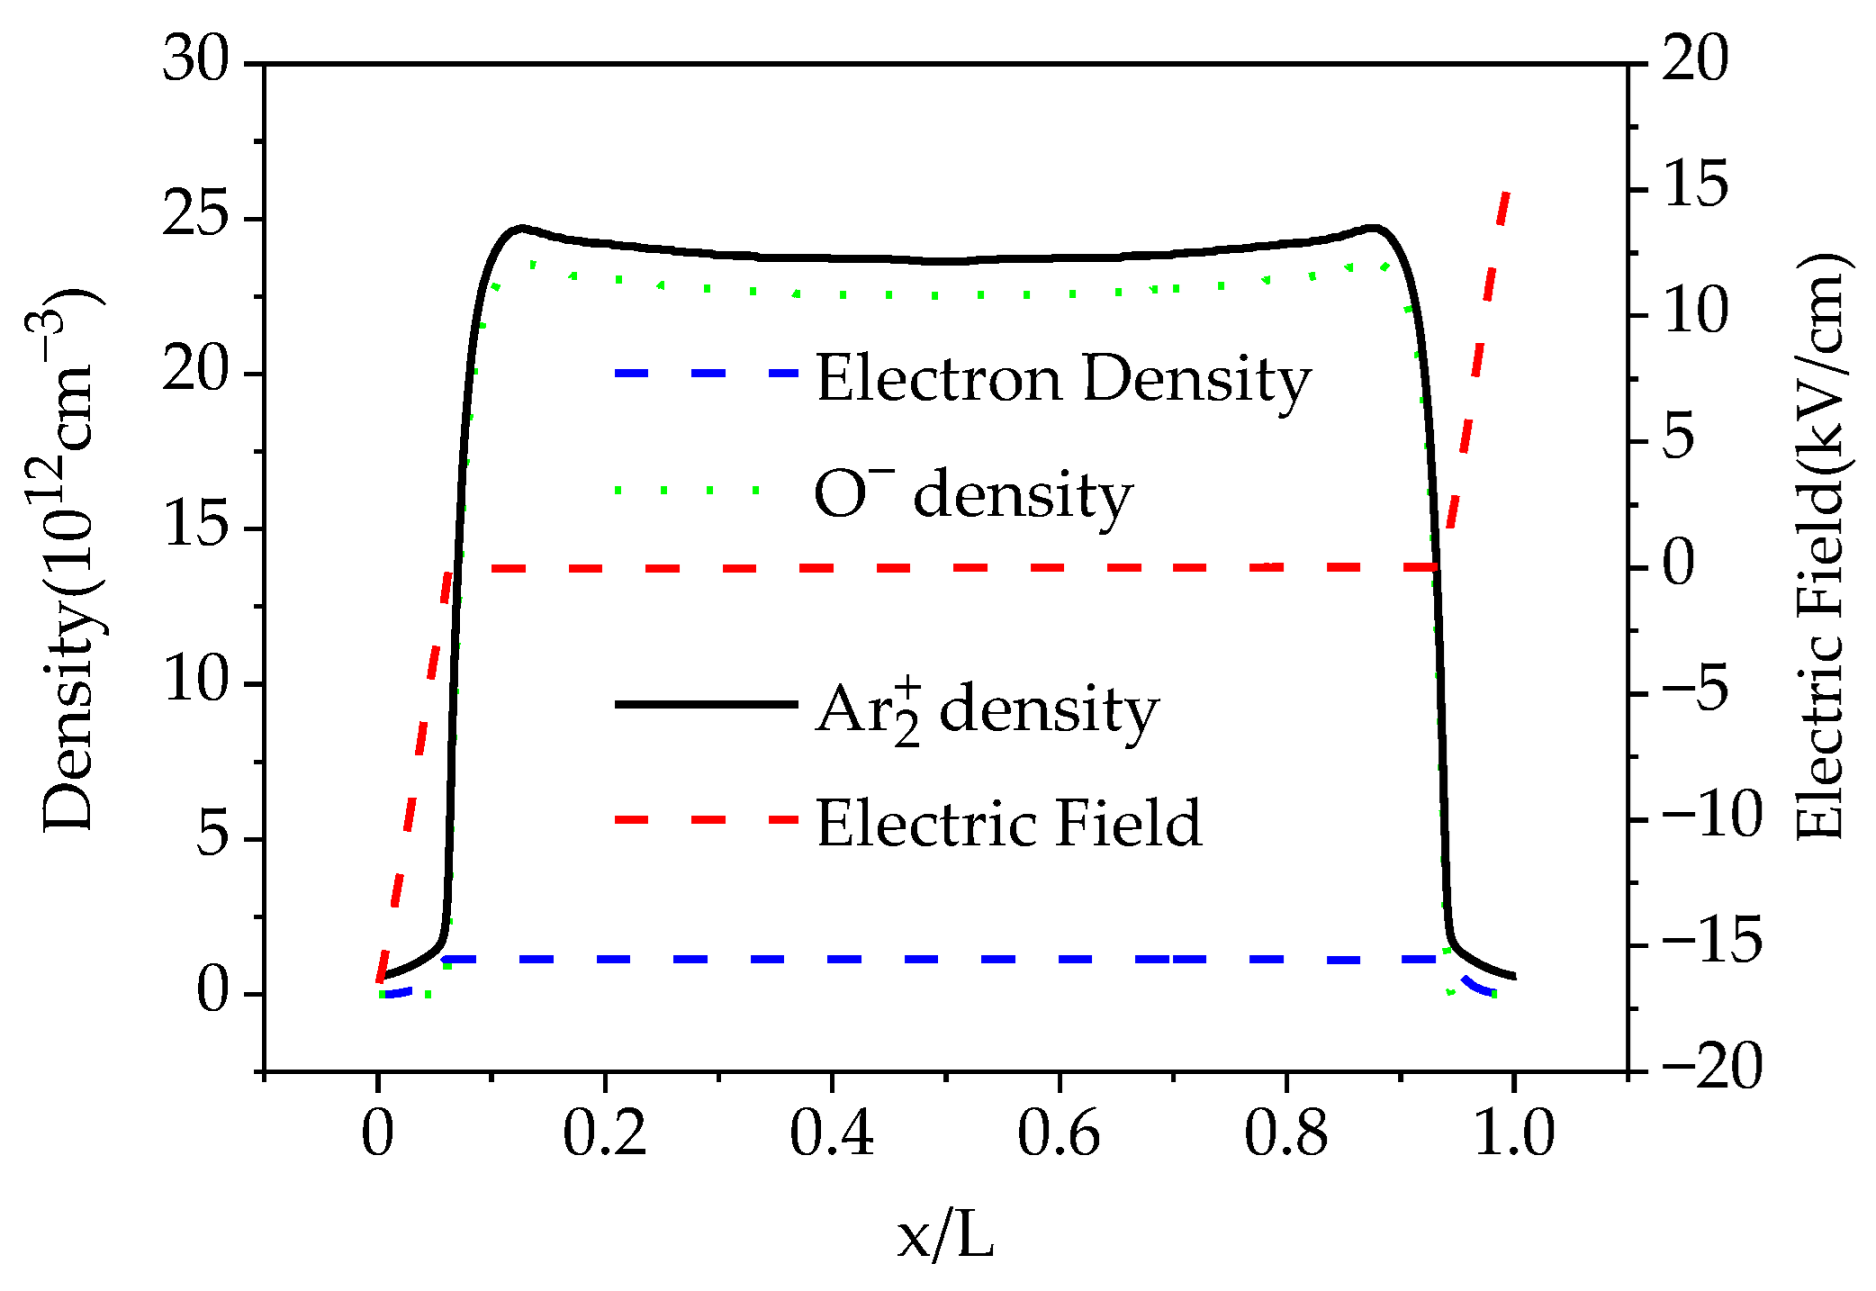
The above analysis of particle densities clearly shows that the positive ions are mainly ions in the plasma, and the negative ions are mainly ions. Figure 6 shows the spatial distributions of the main particle density and electric field when the SEE coefficient is set to 0.01. Due to the large electron mobility, the electron density is higher than the ion density in the sheath. Overall, the density of positively charged particles in the sheath is higher than that of negatively charged particles. This is because of the electron loss at the wall. The distributions of particle density are symmetrical in the double sheath near the electrode walls on both sides. The total charge density at the cathode and anode is positive, while directly determining the distribution of the electric field. It is also a characteristic of continuous-power-driven discharge.
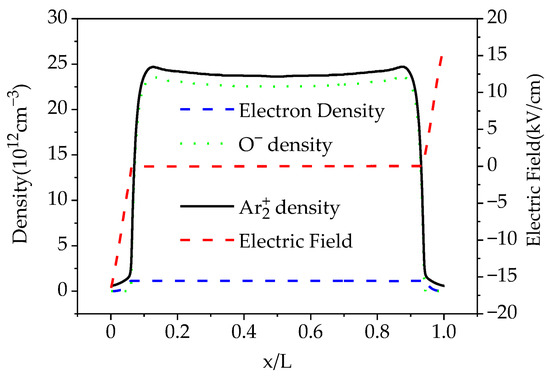
Figure 6.
Spatial profiles of the density of the main ions and the electric field when the SEE is set to 0.01.
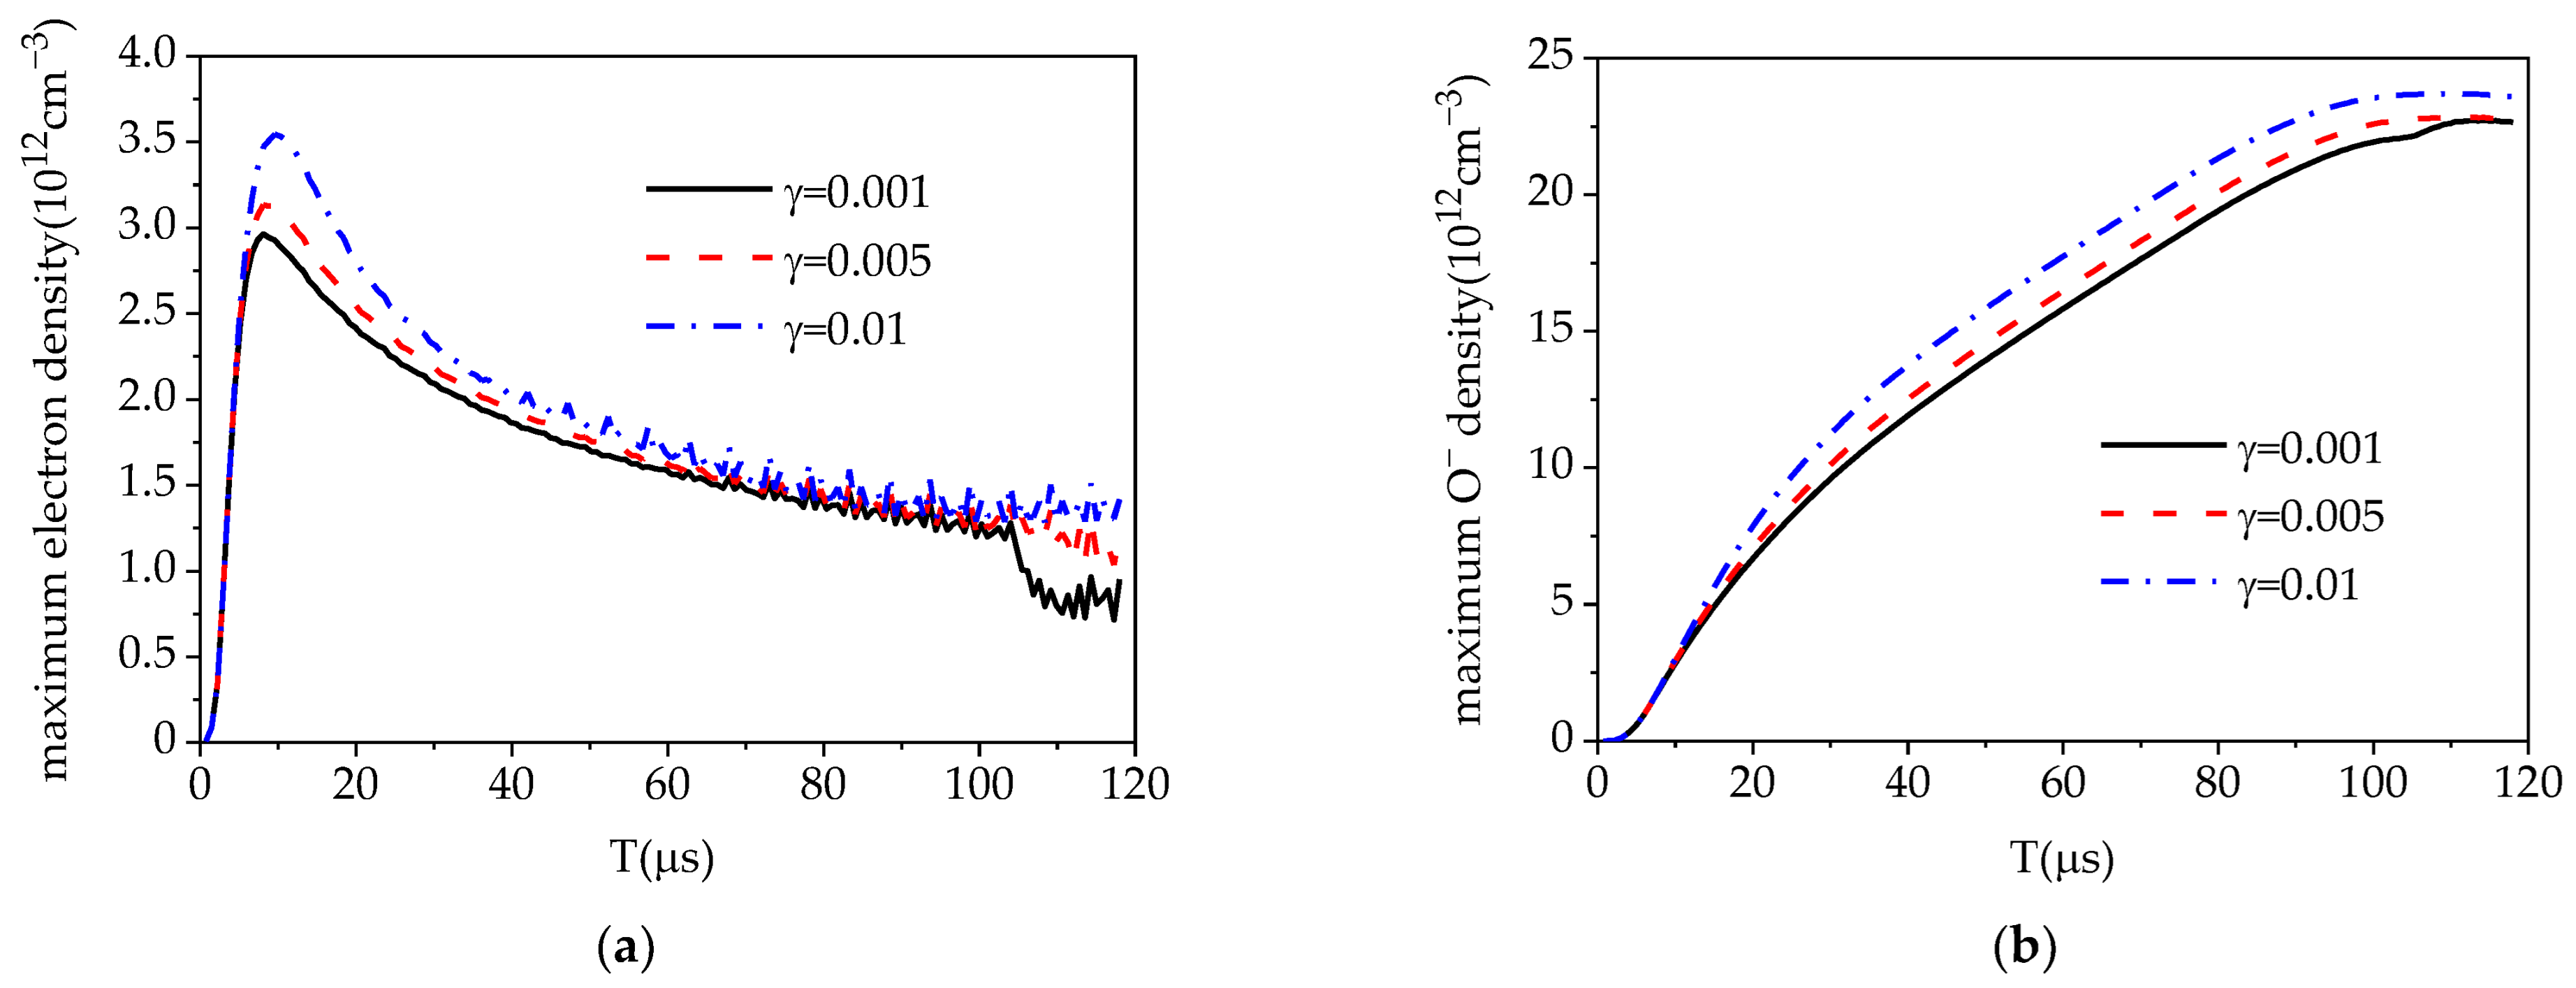
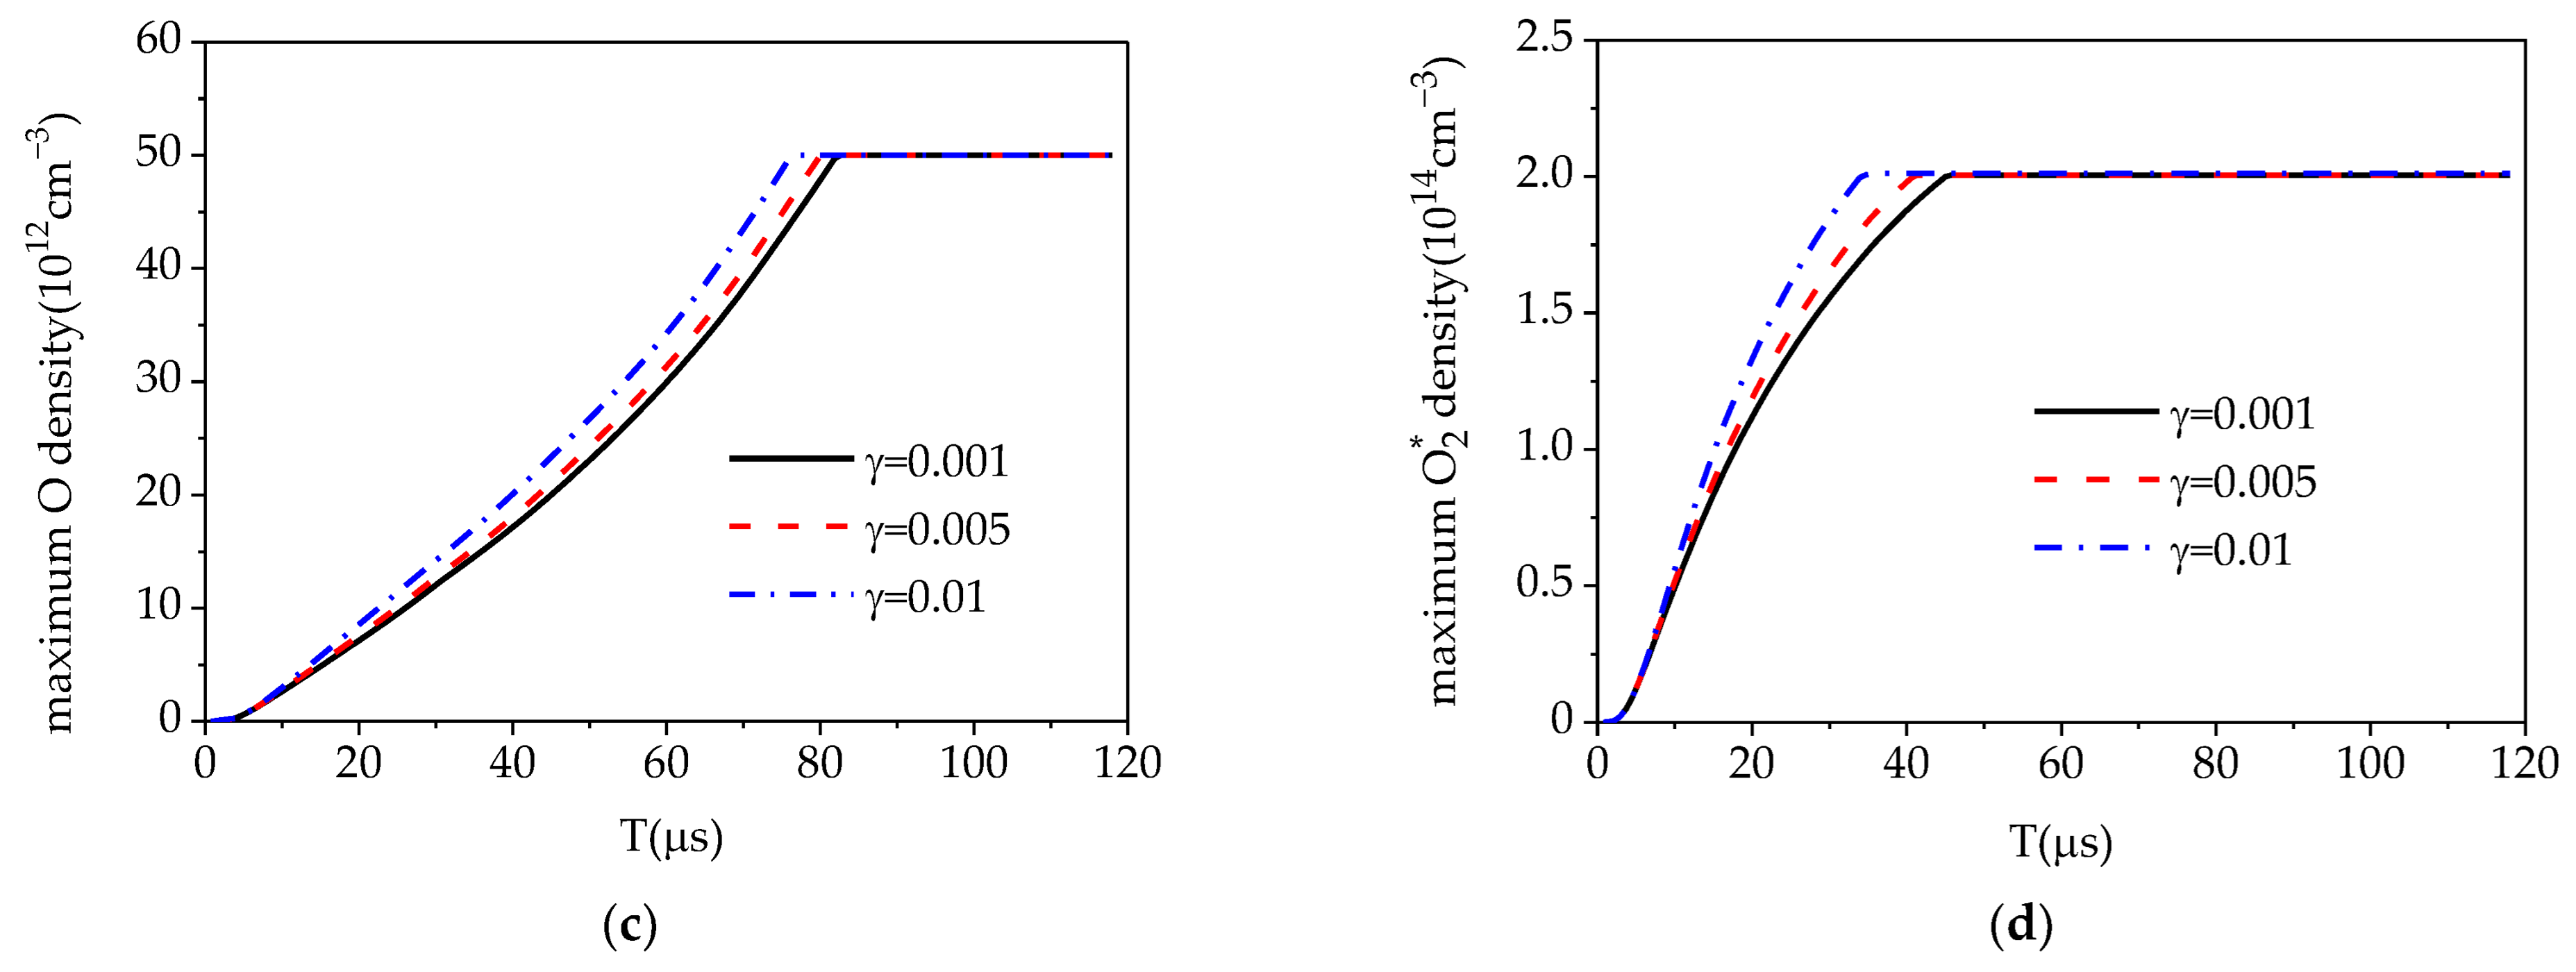
The time required for the maximum density to stabilize can be used to estimate the discharge time from non-self-maintained to self-maintained. Figure 7a shows the maximum electron density over time as the SEE coefficient increases from 0.001 to 0.01. The maximum electron density rises rapidly at the beginning of discharge because of ionization and then gradually decreases until it becomes stable due to dissociative electron attachment. In addition, the maximum electron density increases as the SEE coefficient increases. Figure 7b–d show the maximum ion density, maximum O atom density, and maximum metastable molecule density over time. They gradually increase with time until they are stable. The time required for the maximum density to reach steady state is the shortest for the metastable density molecule; however, the maximum ion density needs the longest time to stabilize. We can also clearly see that the time required for the maximum density to reach steady state decreases as the SEE coefficient increases, as shown in Figure 7c,d.
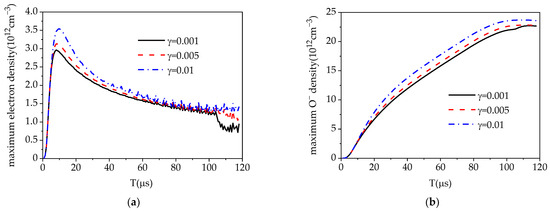

Figure 7.
Variation of time the maximum of (a) electron density, (b) ion density, (c) O atom density, and (d) metastable molecular density at different SEE coefficients.
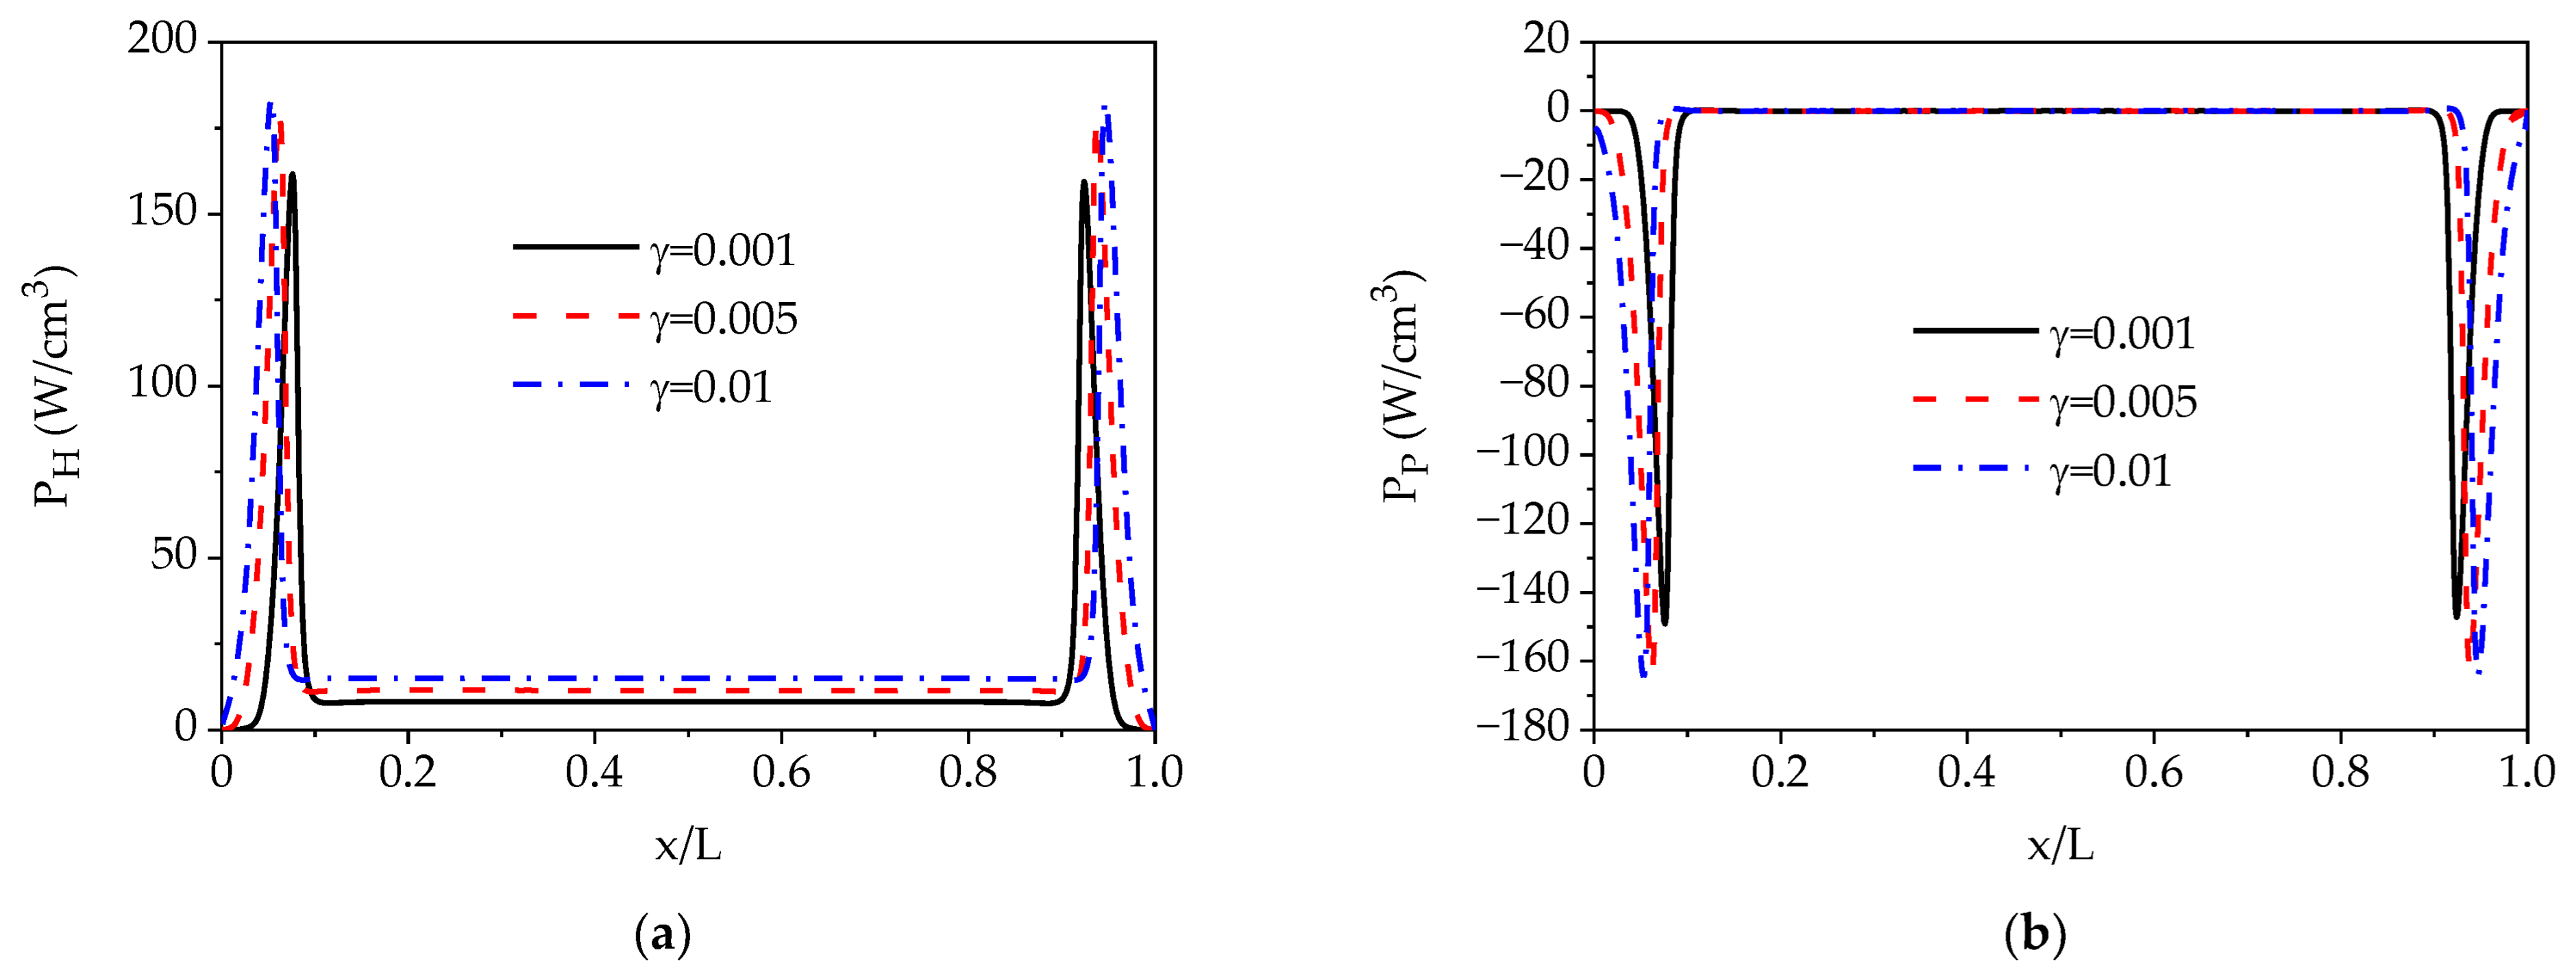
Figure 8 shows the spatial distributions of cycle-averaged electron ohmic heating and collisionless pressure heating mechanisms as the SEE coefficient increases from 0.001 to 0.01. The spatial distribution of electron ohmic heating is shown in Figure 8a. From the electron energy equation, electron heating can be written as , electron ohmic heating is , and collisionless pressure heating is [35,36,37]. Electron ohmic heating appears in the form of double peaks in the sheath regions, which is due to a strong electric field accelerating electrons in the sheath. The spatial distribution of collisionless pressure heating is shown in Figure 8b. We can see that the distribution of collisionless pressure heating appears in the form of double peaks in the sheath regions. From the formula , collisionless pressure heating depends on the electron density gradient in electric fields. The electric field and electron density gradient in the plasma center area are smaller, but the plasma density gradient is larger in the sheath regions, hence the larger collisionless pressure heating in the sheath regions. As the SEE coefficient is increased, collisionless pressure heating increases slightly in the sheath regions and does not change in the bulk plasma. This shows that the effect of the SEE coefficient is greater for electron ohmic heating, as shown in Figure 8a.
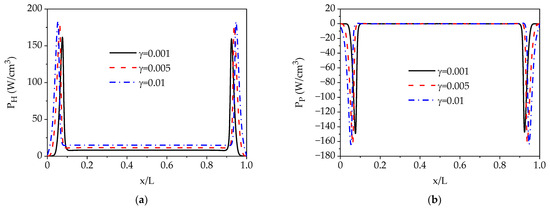
Figure 8.
Spatial distributions of cycle-averaged (a) electron ohmic heating and (b) collisionless pressure heating at SEE coefficients of 0.001, 0.005, and 0.01.
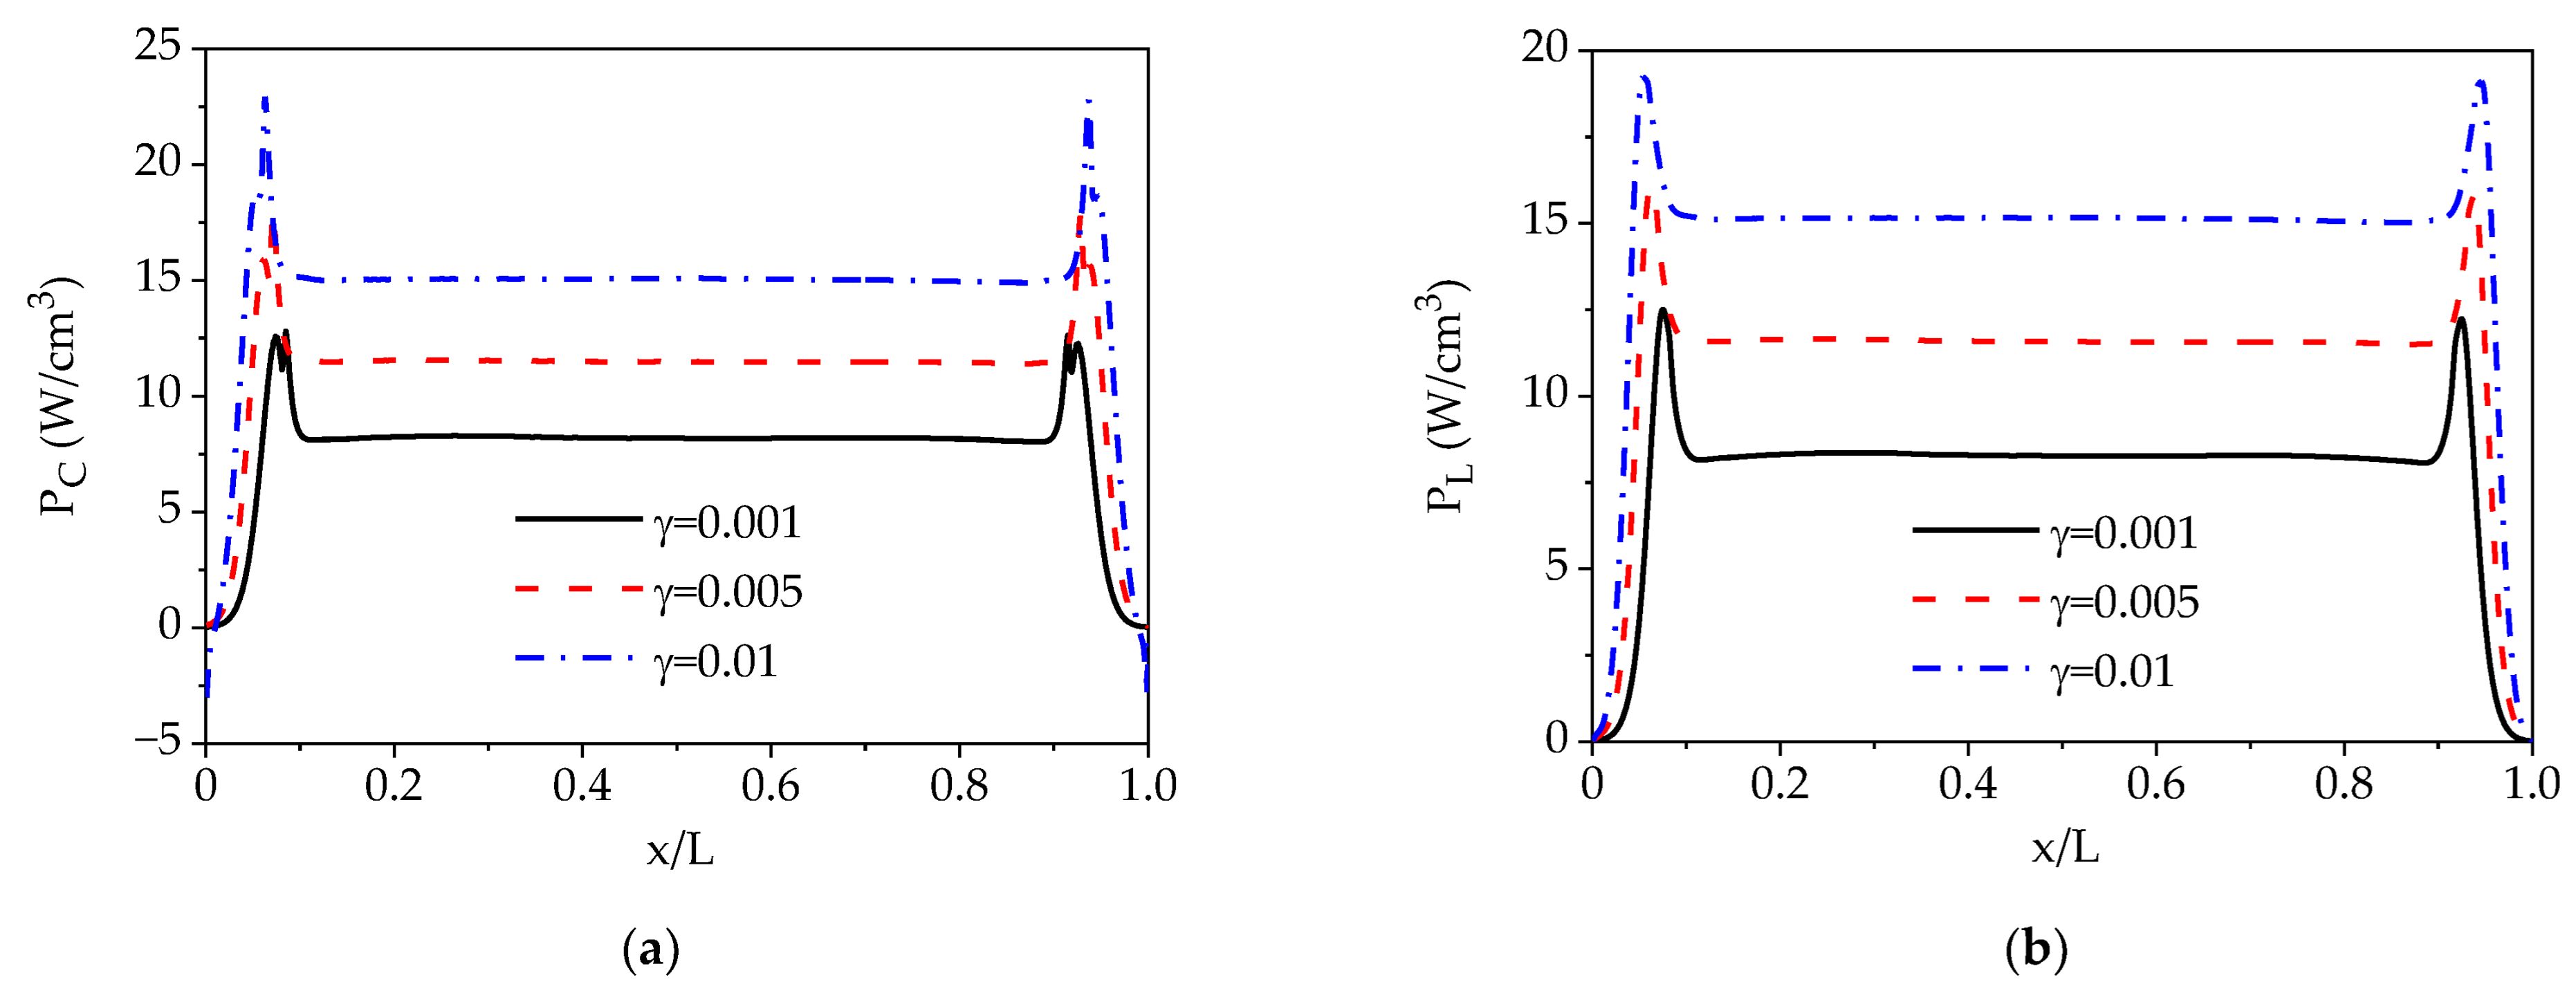
The spatial distributions of cycle-averaged electron heating and electron power dissipation at different SEE coefficients are shown in Figure 9. As we know, electron heating is the sum of electron ohmic heating and collisionless pressure heating (). From Figure 8, we know that electron ohmic heating is dominant and is greater than collisionless pressure heating, which contributes to positive electron heating in most of the region and negative electron heating near the electrodes. The negative value can be considered to be the result of “diffusion cooling”. When the SEE coefficient is increased, electron ohmic heating increases, as shown in Figure 8a, resulting in more frequent collisions between electrons and neutral particles, which leads to electron heating and also increases with increasing SEE coefficient, as shown in Figure 9a. Figure 9b shows the spatial distributions of electron power dissipation. Electron power dissipation can be written as . The electrons obtain energy from the electric field and lose energy by colliding with neutral particles. As the SEE coefficient is increased, electron density increases gradually across the entire discharge space, and electron energy loss also increases as a result.
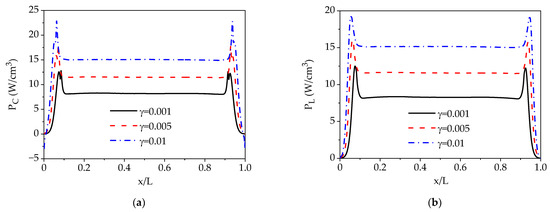
Figure 9.
Spatial distributions of cycle-averaged (a) electron heating and (b) electron power dissipation heating at SEE coefficients of 0.001, 0.005, and 0.01.
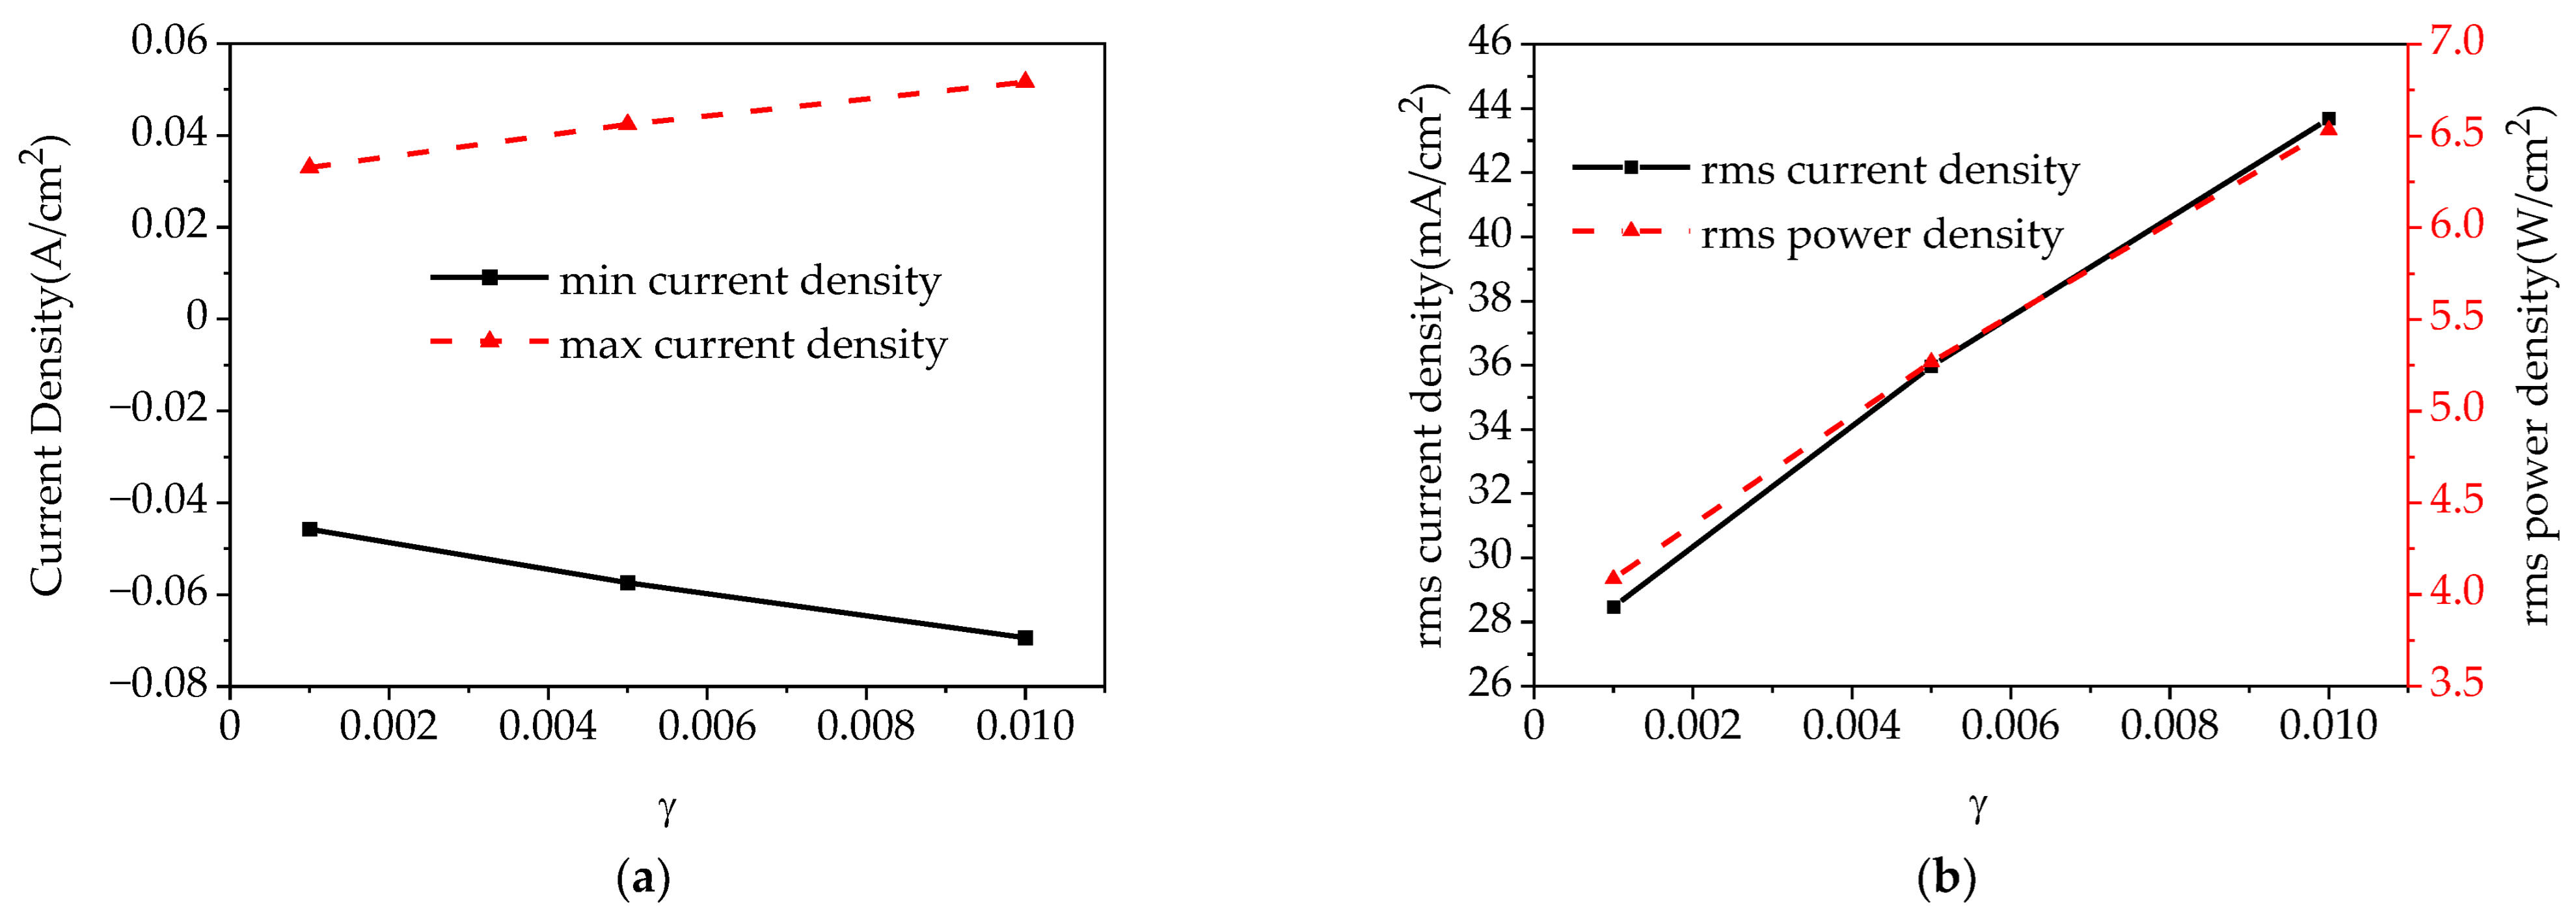
The effects of the SEE coefficient on the effective current density and effective power density were also considered based on the numerical calculations. The ion beam bombards the electrode, resulting in secondary electron generation. In Figure 10a, as the SEE increases, the maximum current density increases and the minimum value is negative growth. The positive and negative current density correspond to the electric field. The current density can be calculated using the above equations: , , and . For electrons and ions, the diffusion term is smaller than the mobility term; thus it can be deduced that the positive and negative current density are related to the electric field. The effective current density was used instead of peak current density for analyzing the characteristic of discharge. The effective value is determined according to the formula [38]. is a certain quantity. Clearly, the form of the effective value is a root mean square (RMS) value. The power density P can be assumed to be , where T is a circle [39,40]. The method for calculating effective power density is as the same as that used for effective current. The effective current density and effective power increase with increasing SEE coefficient. This is because the charged-particle density increased with the SEE coefficient. Obviously, the growth of the SEE coefficient can effectively regulate the effective current density and effective power density during discharge.
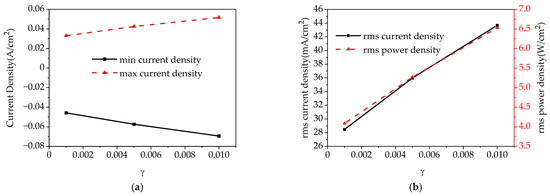
Figure 10.
(a) Current density, (b) effective current density and effective power density as the SEE increases.
4. Conclusions
In summary, we have simulated and discussed the influence of a small SEE coefficient on the characteristic properties of an Ar/O2 discharge plasma driven by a dual-radio-frequency source at atmospheric pressure. The discharge characteristic is similar to that of a typical continuous RF capacitive coupling discharge. We also studied the time-averaged electron density, electron temperature, and neutral particle densities at different SEE coefficients. The numerical results showed that secondary electron emission can improve the ionization rate and help to generate a large area of uniform plasma. We also found that the electron temperature decreases slightly in the sheath when the electron density is effectively increased. A lower temperature is beneficial for plasma deposition and for the application of various material surface treatments. The densities of the metastable molecule and the O atom are almost unaffected by the SEE coefficient, while the densities of other particles increase to varying degrees. As the SEE coefficient increases, the density of and neutral oxygen (O) need less time to reach steady state; this does not apply to electron density. In addition, we also analyzed the mechanisms of electron heating and energy loss. We found that electron energy loss and the electron heating mechanism increase significantly with increasing SEE coefficient. As the SEE coefficient increases, both the effective current density and effective power density increase due to the increase in charged-particle densities.
Author Contributions
Conceptualization, Y.W. and Y.L.; methodology, Y.W.; software, Y.W.; validation, M.C., Y.W. and Y.L.; formal analysis, Y.L.; investigation, M.C.; resources, M.C.; data curation, M.C.; writing—original draft preparation, M.C.; writing—review and editing, Y.W.; visualization, M.C.; supervision; Y.W.; project administration, Y.W.; funding acquisition, Y.W. All authors have read and agreed to the published version of the manuscript.
Funding
This research was funded by Scientific Research Funds Project of Liaoning Education Department of China, grant number No. L2019049.
Institutional Review Board Statement
Not applicable.
Informed Consent Statement
Not applicable.
Data Availability Statement
Data is contained within the article.
Conflicts of Interest
All authors declare no conflict of interest.
References
- Wu, S.Q.; Nie, L.L.; Lu, X.P. Atmosheric-pressure Non-equilibrium Plasma Jets. High Voltage Eng. 2015, 41, 2602–2624. [Google Scholar]
- Shi, J.J.; Kong, M.G. Mode transition in radio-frequency atmospheric argon discharge with and without dielectric barriers. Appl. Phys. Lett. 2007, 90, 101502. [Google Scholar] [CrossRef]
- Zhang, D.Z.; Wang, Y.H.; Wang, D.Z. The nonlinear behaviors in atmospheric dielectric barrier multi pulse discharge. Plasma Sci. Technol. 2016, 18, 826–831. [Google Scholar] [CrossRef]
- Li, S.Z.; Wu, Q.; Zhang, J.L.; Wang, D.Z.; Uhm, H.S. Development of an atmospheric-pressure homogeneous and cold Ar/O2 plasma source operating in glow discharge. Phys. Plasmas 2010, 17, 063506. [Google Scholar] [CrossRef]
- Zhu, H.L.; Su, Z.X.; Dong, Y. Experimental studies on striations in helium glow discharge. Appl. Phys. Lett. 2017, 111, 054104. [Google Scholar] [CrossRef]
- Qian, M.Y.; Ren, C.S.; Wang, D.Z.; Feng, Y.; Zhang, J.L. Atmospheric pressure cold Argon/Oxygen Plasma Jet Assisted by Preionization of Syringe Needle Electrode. Plasma Sci. Technol. 2010, 12, 561–565. [Google Scholar]
- Waskoenig, J.; Gans, T. Nonlinear frequency coupling in dual radio-frequency driven atmospheric pressure plasma. Appl. Phys. Lett. 2010, 96, 181501. [Google Scholar] [CrossRef]
- Neill, C.O.; Waskoenig, J.; Gans, T. Electron Heating in Dual-Radio-Frequency-Driven Atmospheric-Pressure Plasmas. IEEE Trans. Plasma Sci. 2011, 39, 2588–2589. [Google Scholar] [CrossRef]
- Zhang, Z.L.; Nie, Q.Y.; Wang, Z.B.; Gao, X.T.; Kong, F.R.; Sun, Y.F.; Jiang, B.H. Numerical studies of in dependent control of electron density and gas temperature via nonlinear coupling in dual-frequency atmospheric pressure dielectric barrier discharge plasmas. Phys. Plasmas 2016, 23, 073501. [Google Scholar] [CrossRef]
- Zhang, Z.L.; Nie, Q.Y.; Wang, X.G.; Zeng, J.C. Numerical investigation of the directional control of electron density and gas temperature in atmospheric pressure dielectric barrier discharge by using low- and high-frequency coupling modulation. Phys. Plasmas 2021, 28, 083508. [Google Scholar] [CrossRef]
- Kim, D.B.; Moon, S.Y.; Jung, H.; Gweon, B.; Choe, W. Study of a dual frequency atmospheric pressure corona plasma. Phys. Plasmas 2010, 17, 053508. [Google Scholar] [CrossRef]
- Kwon, H.C.; Kim, H.Y.; Won, I.H.; Lee, H.W.; Shin, H.K.; Lee, J.K. Enhanced transportation of energetic electrons in dual-frequency atmospheric microplasmas. Phys. Plasmas 2013, 20, 023506. [Google Scholar] [CrossRef]
- Kwon, H.C.; Rehman-ur-Aman; Won, I.H.; Park, W.T.; Lee, J.K. Negative resistance phenomenon in dual-frequency capacitively coupled plasma-enhanced chemical vapor deposition system for photovoltaic manufacturing process. J. Appl. Phys. 2012, 111, 023305. [Google Scholar] [CrossRef]
- Park, S.; Choe, W.; Moon, S.Y.; Shi, J.J. Electron Information in Single-and Dual-Frequency Capacitive Discharges at Atmospheric Pressure. Sci. Rep. 2018, 8, 7516. [Google Scholar] [CrossRef] [PubMed]
- Magnan, R.; Hagelaar, G.J.M.; Chaker, M.; Massines, F. Atmospheric pressure dual RF-LF frequency discharge: Influence of LF voltage amplitude on the RF discharge behavior. Plasma Sources Sci. Technol. 2020, 29, 035009. [Google Scholar] [CrossRef]
- Magnan, R.; Hagelaar, G.; Chaker, M.; Massines, F. Atmospheric pressure dual RF-LF frequency discharge: Transition from α to α-γ-mode. Plasma Sources Sci. Technol. 2021, 30, 015010. [Google Scholar] [CrossRef]
- Liu, Y.; Starostin, S.A.; Peeters, F.J.J.; van de Sanden, M.C.M.; de Vries, H.W. Atmospheric- pressure diffuse dielectric barrier discharges in Ar/O2 gas mixture using 200 kHz/13.56 MHz dual frequency excitation. J. Phys. D Appl. Phys. 2018, 51, 114002. [Google Scholar] [CrossRef]
- Qi, B.; Tian, X.; Zhang, T.; Wang, J.; Wang, Y.S.; Si, J.H.; Tang, J. Numerical simulation of the argon dielectric barrier discharge driven by dual frequency at atmospheric pressure. AIP Adv. 2023, 13, 065327. [Google Scholar] [CrossRef]
- Dimitris, P.; Lymberopoulos; Demetre, J.E. Fliud simulations of glow discharges: Effect of metastable atoms in argon. J. Appl. Phys. 1993, 73, 3668–3679. [Google Scholar]
- Moravej, M.; Yang, X.; Hicks, R.F.; Penelon, J.; Babayan, S.E. A Radio-Frequency Nonequilibrium Atmospheric Pressure Plasma Operating with Argon and Oxygen. J. Appl. Phys. 2006, 99, 093305. [Google Scholar] [CrossRef]
- Pan, G.S.; Tan, Z.Y.; Pan, J.; Wang, X.L.; Shan, C.H. A comparative study on the frequency effects of the electrical characteristics of the pulsed dielectric barrier discharge in He/O2 and in Ar/O2 at atmospheric pressure. Phys. Plasmas 2016, 23, 043508. [Google Scholar] [CrossRef]
- Lieberman, M.A.; Lichtenberg, A.J. Principles of Plasma Discharges and Materials Processing, 2nd ed.; John Wiley & Sons, Inc.: Hoboken, NJ, USA, 2005. [Google Scholar]
- Gudmundsson, J.T.; Marakhtanov, A.M.; Patel, K.K.; Gopinath, V.P.; Lieberman, M.A. On the plasma parameters of a planar inductive oxygen discharge. J. Phys. D Appl. Phys. 2000, 33, 1323–1331. [Google Scholar] [CrossRef]
- Passchier, J.D.P.; Goedheer, W.J. A two-dimensional fluid model for an argon rf discharge. J. Appl. Phys. 1993, 74, 3774–3781. [Google Scholar] [CrossRef]
- Richards, A.D.; Thompson, B.E.; Sawin, H.H. Continuum modeling of argon radio frequency glow discharges. Appl. Phys. Lett. 1987, 50, 491–493. [Google Scholar] [CrossRef]
- Greb, A.; Gibson, A.R.; Niemi, K.; O’Connell, D.; Gans, T. Influence of surface conditions on plasma dynamics and electron heating in a radio-frequency driven capacitively coupled oxygen plasma. Plasma Sources Sci. Technol. 2015, 24, 044003. [Google Scholar] [CrossRef]
- Graves, D.B.; Jensen, K.F. A Continuum Model of DC and RF Discharges. IEEE Trans. Plasma Sci. 1986, 14, 78–91. [Google Scholar] [CrossRef]
- Graves, D.B. Fluid model simulations of a 13.56-Mhz rf discharge: Time and space dependence of rates of electron impact excitation. J. Appl. Phys. 1987, 62, 88–94. [Google Scholar] [CrossRef]
- Wang, X.C.; Gao, S.H.; Zhang, Y.T. Numerical study on peak current in pulse-modulated radio-frequency discharges with atmospheric helium-oxygen admixtures. Plasma Sci. Technol. 2022, 24, 085401. [Google Scholar] [CrossRef]
- Wang, Q.; Sun, J.Z.; Ding, Z.F.; Wang, D.Z. Numerical simulation of atmospheric-pressure helium discharge driven by combined radio frequency and trapezoidal pulse sources. Phys. Plasmas 2010, 17, 053506. [Google Scholar] [CrossRef]
- Ge, L.; Zhang, Y.T. A simple model for the calculation of plasma impedance in atmospheric radio frequency discharges. Plasma Sci. Technol. 2014, 16, 924–930. [Google Scholar] [CrossRef]
- Huang, X.J.; Dai, L.; Guo, Y.; Zhang, J.; Shi, J.J. Dual-frequency glow discharges in atmospheric helium. Phys. Plasmas 2015, 22, 103515. [Google Scholar] [CrossRef]
- Li, S.Z.; Wu, Q.; Zhang, J.L.; Wang, D.Z.; Uhm, H.S. Discharge characteristics of a radio-frequency capacitively coupled Ar/O2 glow discharge at atmospheric pressure. Thin Solid Films 2011, 519, 6990–6993. [Google Scholar] [CrossRef]
- Balcon, N.; Hagelaar, G.J.M.; Boeuf, J.P. Numerical Model of an argon atmospheric pressure RF discharge. IEEE Trans. Plasma Sci. 2008, 36, 278–2787. [Google Scholar] [CrossRef]
- Surendra, M.; Dalvie, M. Moment analysis of rf parallel plate discharge simulations using the particle-in cell with Monte Carlo collisions technique. Phys. Rev. E 1993, 48, 3914–3924. [Google Scholar] [CrossRef]
- Lafleur, T.; Chabert, P.; Booth, J.P. Electron heating in capacitively coupled plasmas revisited. Plasma Sources Sci. Technol. 2014, 23, 035010. [Google Scholar] [CrossRef]
- Chabert, P.; Braithwaite, N. Physics of Radio-Frequency Plasmas; Cambridge University Press: Cambridge, UK, 2011. [Google Scholar]
- Zaplotnik, R.; Kregar, Z.; Bišćan, M.; Vesel, A.; Cvelbar, U.; Mozetič, M.; Milošević, S. Multiple vs. single harmonics AC-driven atmospheric plasma jet. Europhys. Lett. 2014, 106, 25001. [Google Scholar] [CrossRef]
- Song, X.X.; Tan, Z.Y.; Chen, B.; Zhang, Y.T. A Computation study on the discharge characteristics of atmospheric dielectric barrier discharge at a constant power. Plasma Sci. Technol. 2013, 15, 1025–1030. [Google Scholar] [CrossRef]
- Chi, Y.Y.; Zhang, Y.T. Theoretical study on the Characteristics of Atmospheric Radio Frequency Discharges by Altering Electrode Gap. Plasma Sci. Technol. 2014, 16, 582–587. [Google Scholar] [CrossRef]
Disclaimer/Publisher’s Note: The statements, opinions and data contained in all publications are solely those of the individual author(s) and contributor(s) and not of MDPI and/or the editor(s). MDPI and/or the editor(s) disclaim responsibility for any injury to people or property resulting from any ideas, methods, instructions or products referred to in the content. |
© 2023 by the authors. Licensee MDPI, Basel, Switzerland. This article is an open access article distributed under the terms and conditions of the Creative Commons Attribution (CC BY) license (https://creativecommons.org/licenses/by/4.0/).