Article

Prediction of Remaining Fatigue Life of In-Service Bridge Cranes

1
College of Mechanical Engineering, Xinjiang University, Urumqi 830047, China
2
Xinjiang Special Equipment Inspection and Research Institute, Urumqi 830011, China
*
Author to whom correspondence should be addressed.
Appl. Sci. 2023, 13(22), 12250; https://doi.org/10.3390/app132212250
Submission received: 17 October 2023 / Revised: 6 November 2023 / Accepted: 6 November 2023 / Published: 12 November 2023

Abstract

:
At present, bridge crane accidents occur frequently, resulting in significant losses and casualties; to ensure the safe use of in-service bridge cranes, it is necessary to predict the residual fatigue life of in-service bridge cranes. Firstly, a static analysis of the most dangerous working conditions of in-service bridge cranes is carried out to find the fatigue failure point. Subsequently, a three-parameter Weibull distribution model is established for the characteristic parameters affecting the acquisition of the stress spectrum. Latin hypercubic sampling is applied to randomly sample the characteristic parameters to produce a random sample set of characteristic parameters for use in obtaining the stress–time history. The amplitude and mean values of the stress spectra are obtained by cycle counting using the rainflow counting method. Finally, Forman’s formula and Miner’s continuous damage accumulation theory were used to derive the remaining life prediction equations for constant and variable amplitude loads. Comparing the remaining life obtained from the simulation and test, the error is about 9.145%, which proves that the remaining life obtained from the simulation is more accurate. The results show that the combined method of simulation and testing is feasible and can predict the remaining life more accurately. In the past, the prediction of residual life was performed with either testing or simulation, which is long and costly. Simulation is low-cost and takes a short time, but the accuracy is not high. In this paper, the combination method of testing and simulation improves the efficiency of production and reduces the cost of use.

1. Introduction

A bridge crane is an important tool and equipment for the realization of mechanization and automation of production processes in hoisting transportation and modern industrial production. Bridge cranes play an important role in the production activities in China. With the increasingly extensive application of bridge cranes in various production departments, their safety hazards are becoming increasingly prominent. The sudden fracture caused by fatigue cracks will often cause major property loss and personal injury following the resulting bridge crane accident. Therefore, it is very important to estimate the remaining life of the bridge crane in service. The general methods to obtain a stress spectrum include the field test method [1] and simulation method [2]. A stress spectrum with high reliability can be obtained by the field test method for long-time test measurement, but the field working condition is complex, the measurement time is long, the test cost is high, and it is difficult to realize in a short time. Although the simulation method is low in cost and short in simulation time, it is difficult to align with the actual working conditions. To obtain a stress spectrum with high reliability, this paper uses the LHS sampling method in a Monte Carlo numerical simulation [3,4] to randomly sample the measured characteristic parameters [3] affecting the stress spectrum of the in-service bridge crane. The finite element analysis software is used to build the dynamic simulation model of the bridge crane under the cyclic condition, then the stress spectrum is obtained by the rainflow counting method, the field test data is compared, and then the residual fatigue life calculation is carried out to predict the residual life.
Due to the complex factors affecting the fatigue of metal structures, it is difficult to accurately estimate the work cycle of the residual fatigue life of the metal structure of bridge cranes. Currently, the fatigue life estimation methods commonly used domestically and abroad mainly include the following: damage mechanics method [5], nominal stress method [6], local stress and strain method [7,8], fracture mechanics method [9,10], etc. Among them, the fracture mechanics method can be used globally for fatigue crack extension life prediction [11] with cracks already present. The metal structure of the bridge crane bears less stress and requires a long service life (generally 30 years, ranging from 15 years to 50 years). The main girder of the bridge crane is of welded construction, with initial defects such as air holes and slag inclusions. Based on the damage tolerance design theory [12,13,14], the initial defects of the metal structure can be measured using non-destructive testing [15,16,17]. Fatigue testing of the crane’s model beams revealed that the formation of visible cracks was very short-lived and began with the initial defects described above. Therefore, the initial defects can be considered as the initial cracks, and its life is considered as the life of the crack growth. The method of fracture mechanics is used to estimate the residual fatigue life of bridge cranes with a stress spectrum.
Xiong Li [4] et al. used the linear elastic fracture mechanics method to predict the service life of an in-service bridge crane. Due to the presence of plastic deformation in the region of the crack tip produced by the bridge crane, linear elastic fracture mechanics are not fully applicable, and such cannot be calculated using only linear elastic fracture mechanics. Wang Chunhua [18] et al. calculated the remaining life of the bridge crane in service by using the damage tolerance design method for the bridge crane with the finite element analysis software but did not verify by comparing it with field test data, which has its limitations. Xu Gening [19] et al. calculated the service life of the crane with the root-mean-square method, but the root-mean-square method is an average algorithm. The main load borne by the bridge crane is a multi-stage variable amplitude load, and the error caused by the root-mean-square method will be large. This paper mainly adopts the formula of Forman [20] and the cumulative theory of Miner continuous damage, and derives the calculation formula of the fatigue residual life of the box girder under the constant and variable amplitude load of the bridge crane. The eight-level stress spectra obtained by the rainflow counting method for simulation under different working conditions were brought into the residual fatigue life calculation formulas for constant-amplitude loading and variable-amplitude loading, and the results obtained were compared with the test data. A more accurate method of predicting the remaining fatigue life of in-service overhead cranes is provided.

2. Fatigue Characteristic Analysis

2.1. Determining Fatigue Failure Point Locations

The fatigue failure point is mostly located at the point of stress concentration. According to the finite element analysis and test measurement, the fatigue failure fracture of the bridge crane is mainly caused at the 1—lower cover plate-web tension flange weld joint and 2—transverse diaphragm-web lower end weld joint in the welding box girder span [3], as shown in Figure 1. Figure 2 is a real photo of the main beam of the crane producing cracks, as can be seen from the figure, the length of the cracks is about 100 mm, to prevent the cracks from expanding to the critical size, leading to instability and fracture, resulting in a major safety accident, the cracks should be repaired promptly.
In Figure 1, a 1 —thickness of the upper cover plate, size 10 mm; a 2   —thickness of the lower cover plate, size 8 mm; b 1 , b 2 —thickness of front and rear webs, size 10 mm; c 1 , c 2 —the width of the upper and lower covers, size 625 mm; h 1 —the distance from the top surface of the upper cover plate to the bottom surface of the lower cover plate, size 1518 mm; 3—bottom cover; 4—horizontal partition; 5—top plate; 6—ventral plate.
Q235 steel is used for the QB40/16 t-21.6 m in-service bridge crane. According to GB/T 700-2006, the specific parameters are shown in Table 1.

2.2. Static Structural Analysis

The following is the stress distribution of the girder of the bridge crane trolley located in the middle of the span, as shown in Figure 3. The main beam model type is a shell. The finite element analysis software Ansys is used to analyze the static structure of the bridge box girder, and the stress program and strain program are obtained, as shown in Figure 4 and Figure 5.
In Figure 3, F q —Uniform load of box girder (including dead weight, railing, track, etc. Crane girder uniform load refers to the crane beam in the horizontal direction of the uniform distribution of the load, and is based on the design specifications of the crane beam and the use of the requirements of the determination, usually expressed in terms of the weight of the load per meter of length. As the crane beam carries heavy loads, the determination of the uniform load is very important, which determines the range of weight that the crane beam can carry as well as the safety performance.), N / m ;   L 1 , L 2 —the distance from the center of mass of the equipment to the end beam is the traveling mechanism of the crane, m;   c —wheel track of front and rear trolleys, m; d—the upper cover is 21.6 m long and 0.65 m wide; h—the maximum distance between the upper cover and the lower cover is 1.5 m;   P G j —load of two crane operating mechanisms,   N ; P 1 j , P 2 j —wheel force of front and rear wheels, respectively,   N .
It can be seen from the stress nephogram in Figure 4 that the maximum stress occurs at the web weld at the mid-span position, with a size of 148.18 MPa. It can be seen from the strain nephogram in Figure 5 that the maximum displacement occurs in the middle of the span, and the maximum displacement is 23.52 mm. The maximum stress and displacement of the box girder are less than the allowable deflection and allowable stress (The permissible deflection and permissible stress of QB40/16 t-21.6 m main beam are 31.875 mm and 176 MPa, respectively, as shown in GBT 3811-2008 [21] crane design specification.) of the main girder, and the stress concentration easily occurs at the place with the maximum stress, resulting in fatigue fracture failure. Through the static structure analysis, the fatigue failure point is 407 element nodes.

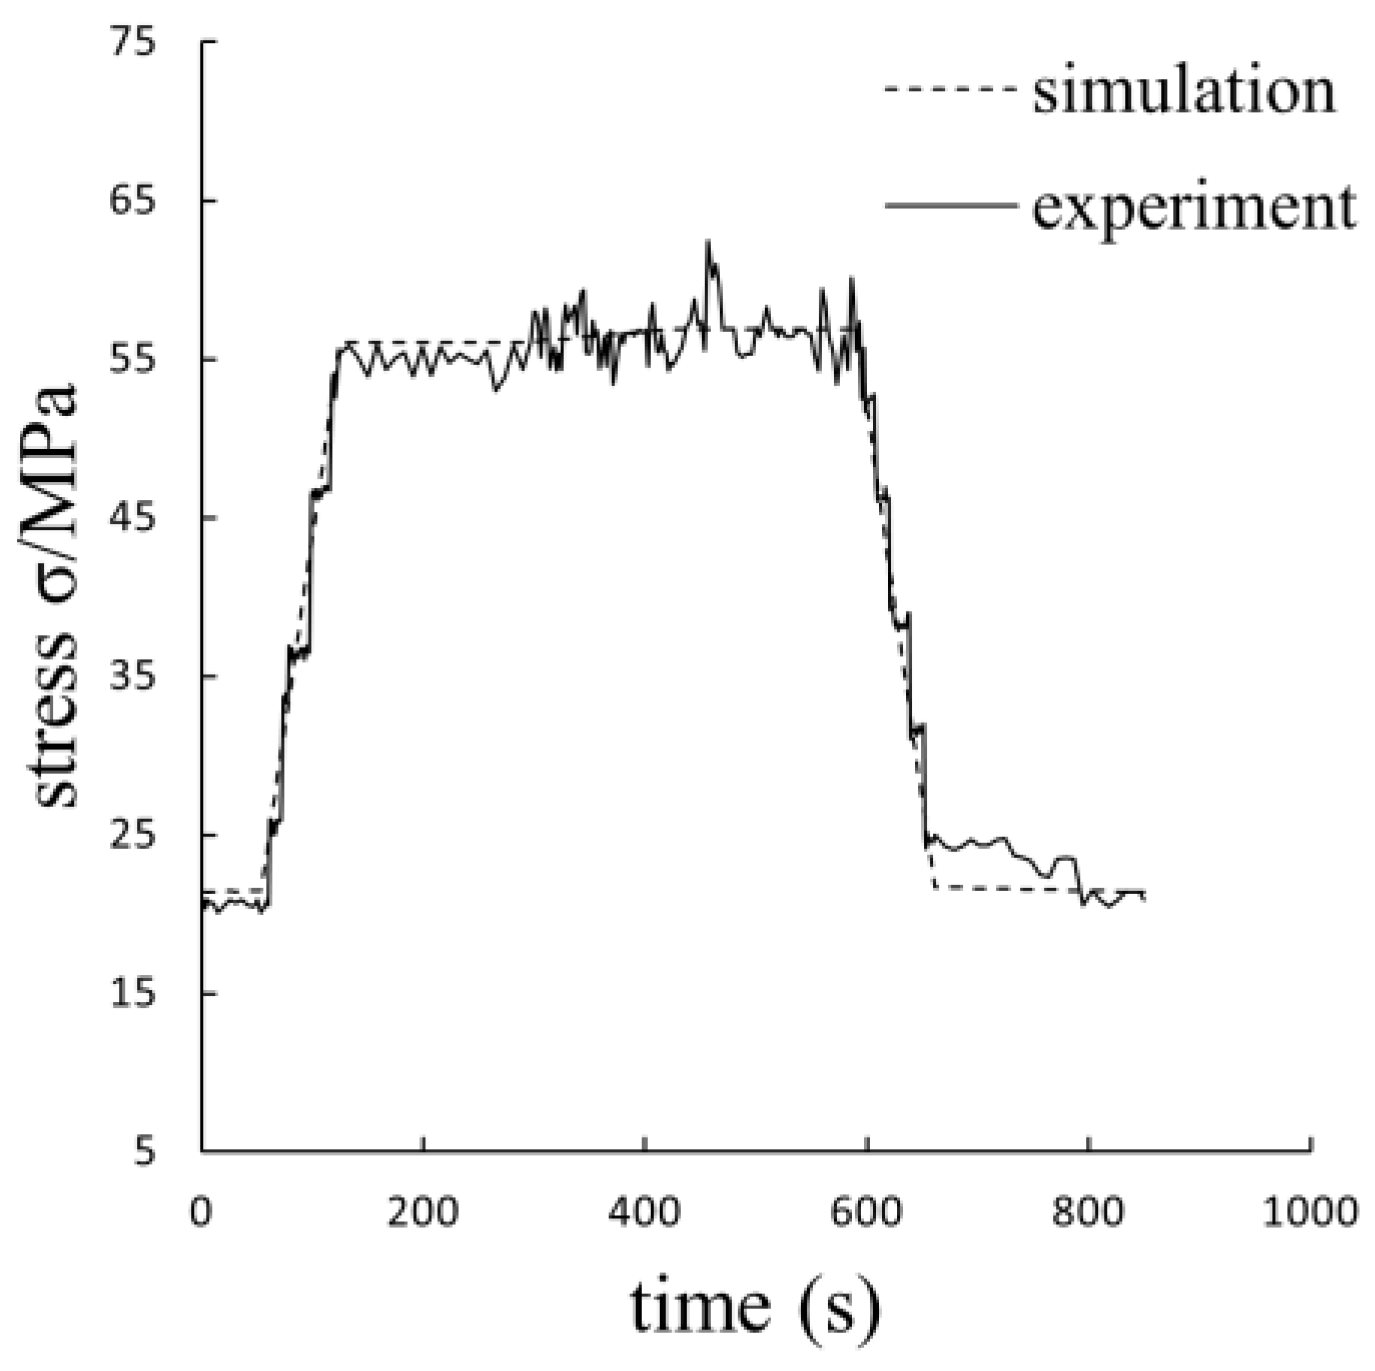
2.3. Stress–Time History Simulation of Fatigue Failure Point

One working cycle of the bridge crane refers to the process of lifting and moving the weight from the ground to the designated position, then unloading, and then moving the weight to the next cycle. Due to the different actual working conditions of each bridge crane, the stress–time history of the bridge crane can only be counted according to the actual working conditions of one bridge crane. The maximum lifting capacity of the bridge crane used in this study is 40 t, and the working level is A3 (According to the crane design specification, the crane working level is classified according to the utilization level of the crane and the load status, and the A3 level is light.) and the span is 21.6 m. The established simulation model is a transient dynamic simulation with finite element analysis software to obtain the stress–time history of the fatigue failure point at the mid-span position of the box-type beam of the bridge crane. Figure 6 shows the stress–time history of a lifting cycle of the bridge crane, wherein sections 1-2 are the curves of the no-load trolley moving from the cross-end position of the main beam to the lifting object, sections 2-3-4 are the curves of the lifting object and the curve of the trolley moving from the lifting position to the unloading position, 5-6-7 are the curve of the unloading process, and 7-8 is the curve of the no-load trolley moving to the next cycle of lifting position.
Latin hypercubic sampling [3,4] is a method of approximate random sampling from a multivariate parameter distribution which belongs to the stratified sampling class of techniques and is commonly used in computer experiments or Monte Carlo numerical simulations. In this method, the sample space is divided into several equal sub-intervals (hypercube), and one sample point is randomly selected in each sub-interval. Such a sampling method can improve the randomness and representativeness of the sample point and avoid sampling error and variance. The LHS method is a sampling method that can improve the accuracy and reliability of the Monte Carlo numerical simulation method, and it is widely used in numerical analysis, prediction, and simulation in different fields. Therefore, to improve the reliability of the simulation, the LHS method is introduced in the Monte Carlo numerical simulation to simulate the load lifting and unloading position of each cycle, whether the trolley crosses the span, lifting load weight, and other parameters [3]. The specific method is shown as follows.
In this paper, n random numbers x i (i = 1, 2, 3,∙…, n) are generated in the interval from 0 to 1, and then the random number x i is converted into a random number K i in the i-th interval.
K i = x i + i 1 / n , i = 1,2 , 3 , , n
The upper boundary of the i-th interval is i/n, and the lower boundary is (i − 1)/n, which can be known from Equation (1):
( i 1 ) / n < K i < i / n
Thus, only one constrained random number K i is generated in each interval, and the random realization of the random variable is obtained by solving for K i as:
R j i = F x j 1 K i , j = 1,2 , 3 , , n
where R j i is the i-th random realization corresponding to the j-th random variable; F x j 1 K i is the function of the cumulative distribution corresponding to the j-th random variable.
If the cumulative distribution function corresponding to each characteristic parameter is known, the LHS method can be used to generate random values for each cyclic characteristic parameter. Observing the statistics of the number of times per day lifting heavy objects for a period of time, with the gradual increase in the number of days t, the average number of times per day lifting gradually tends to stabilize; this paper takes the value of the average number of times per day lifting simulation N a , then obtains the total number of times the simulation lifting as follows:
N b = N a t

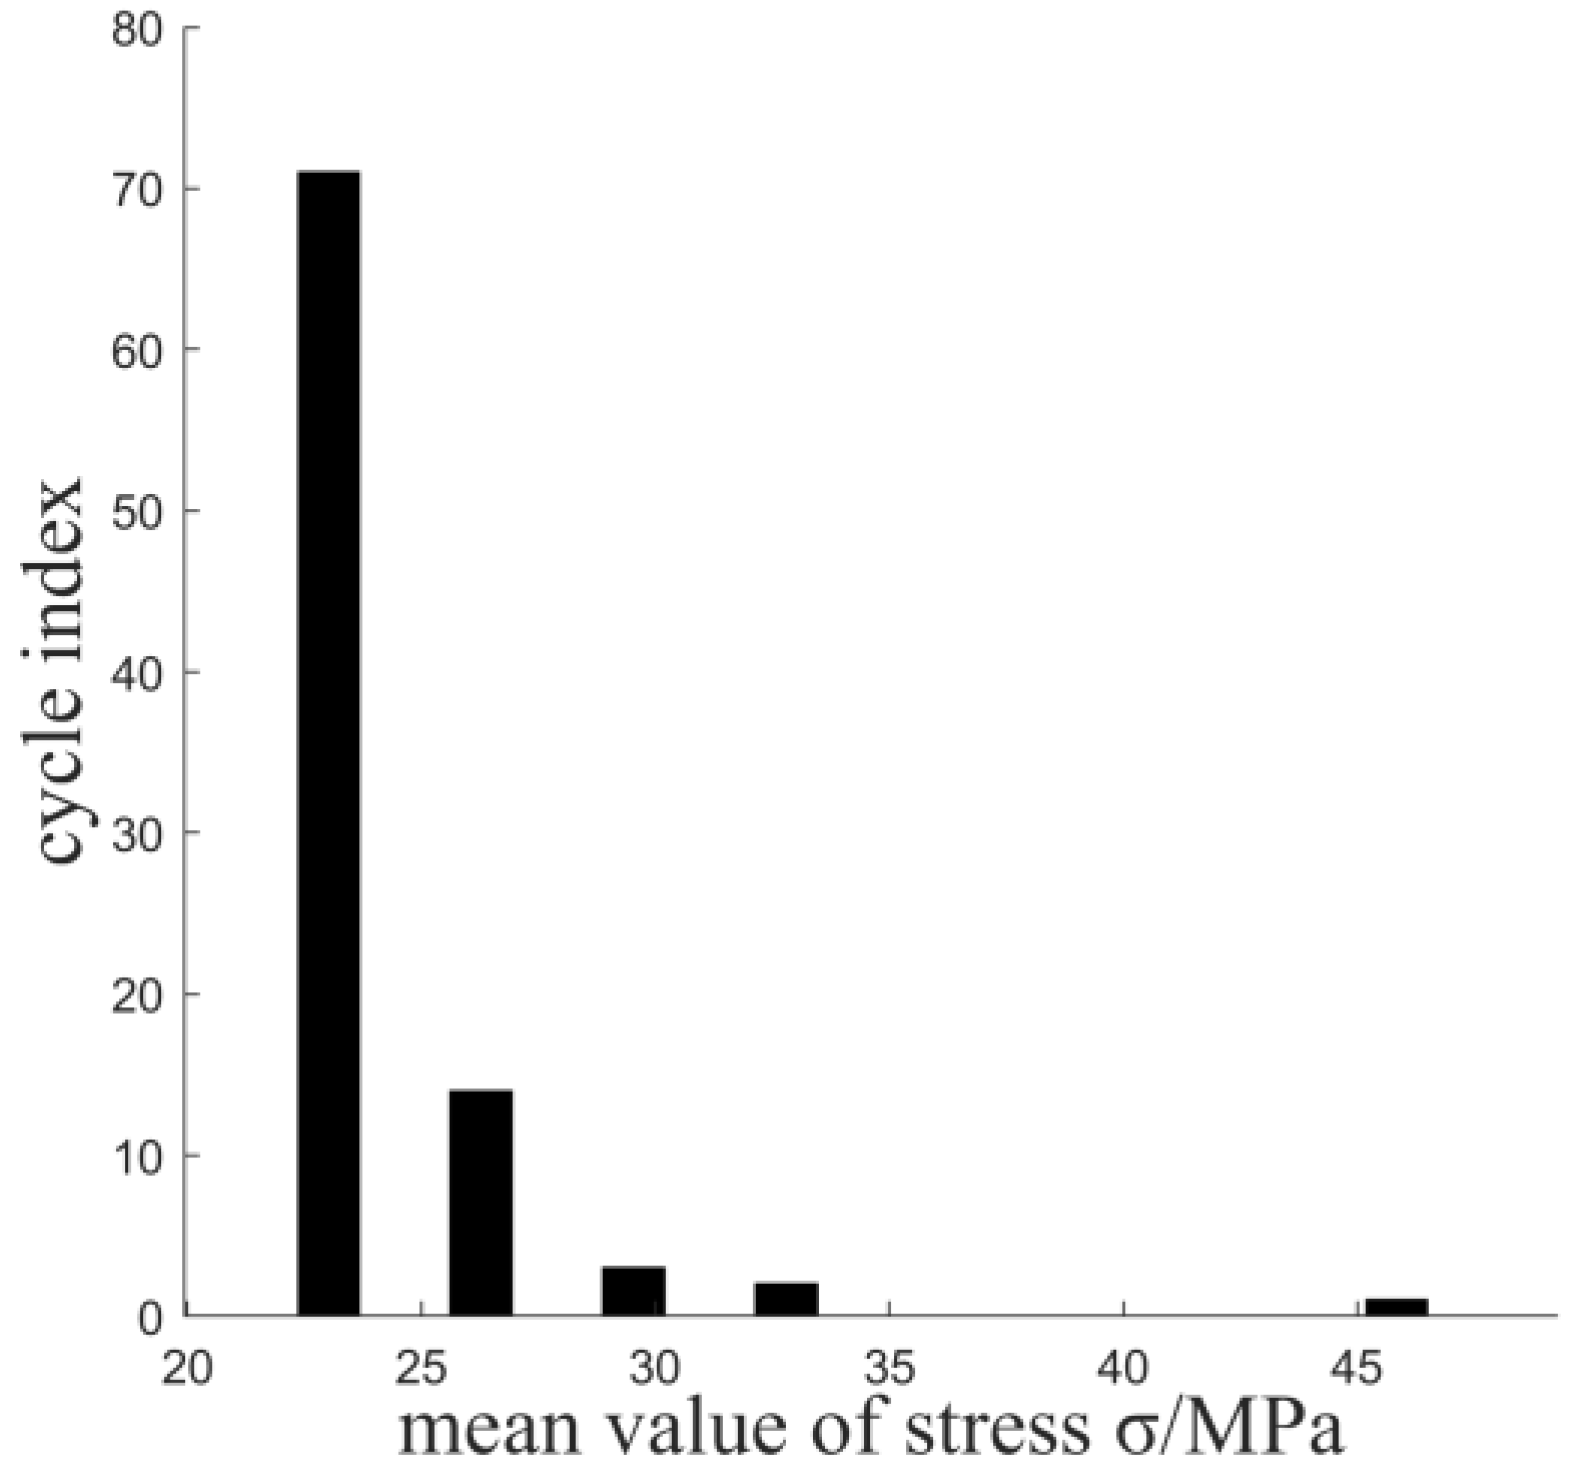
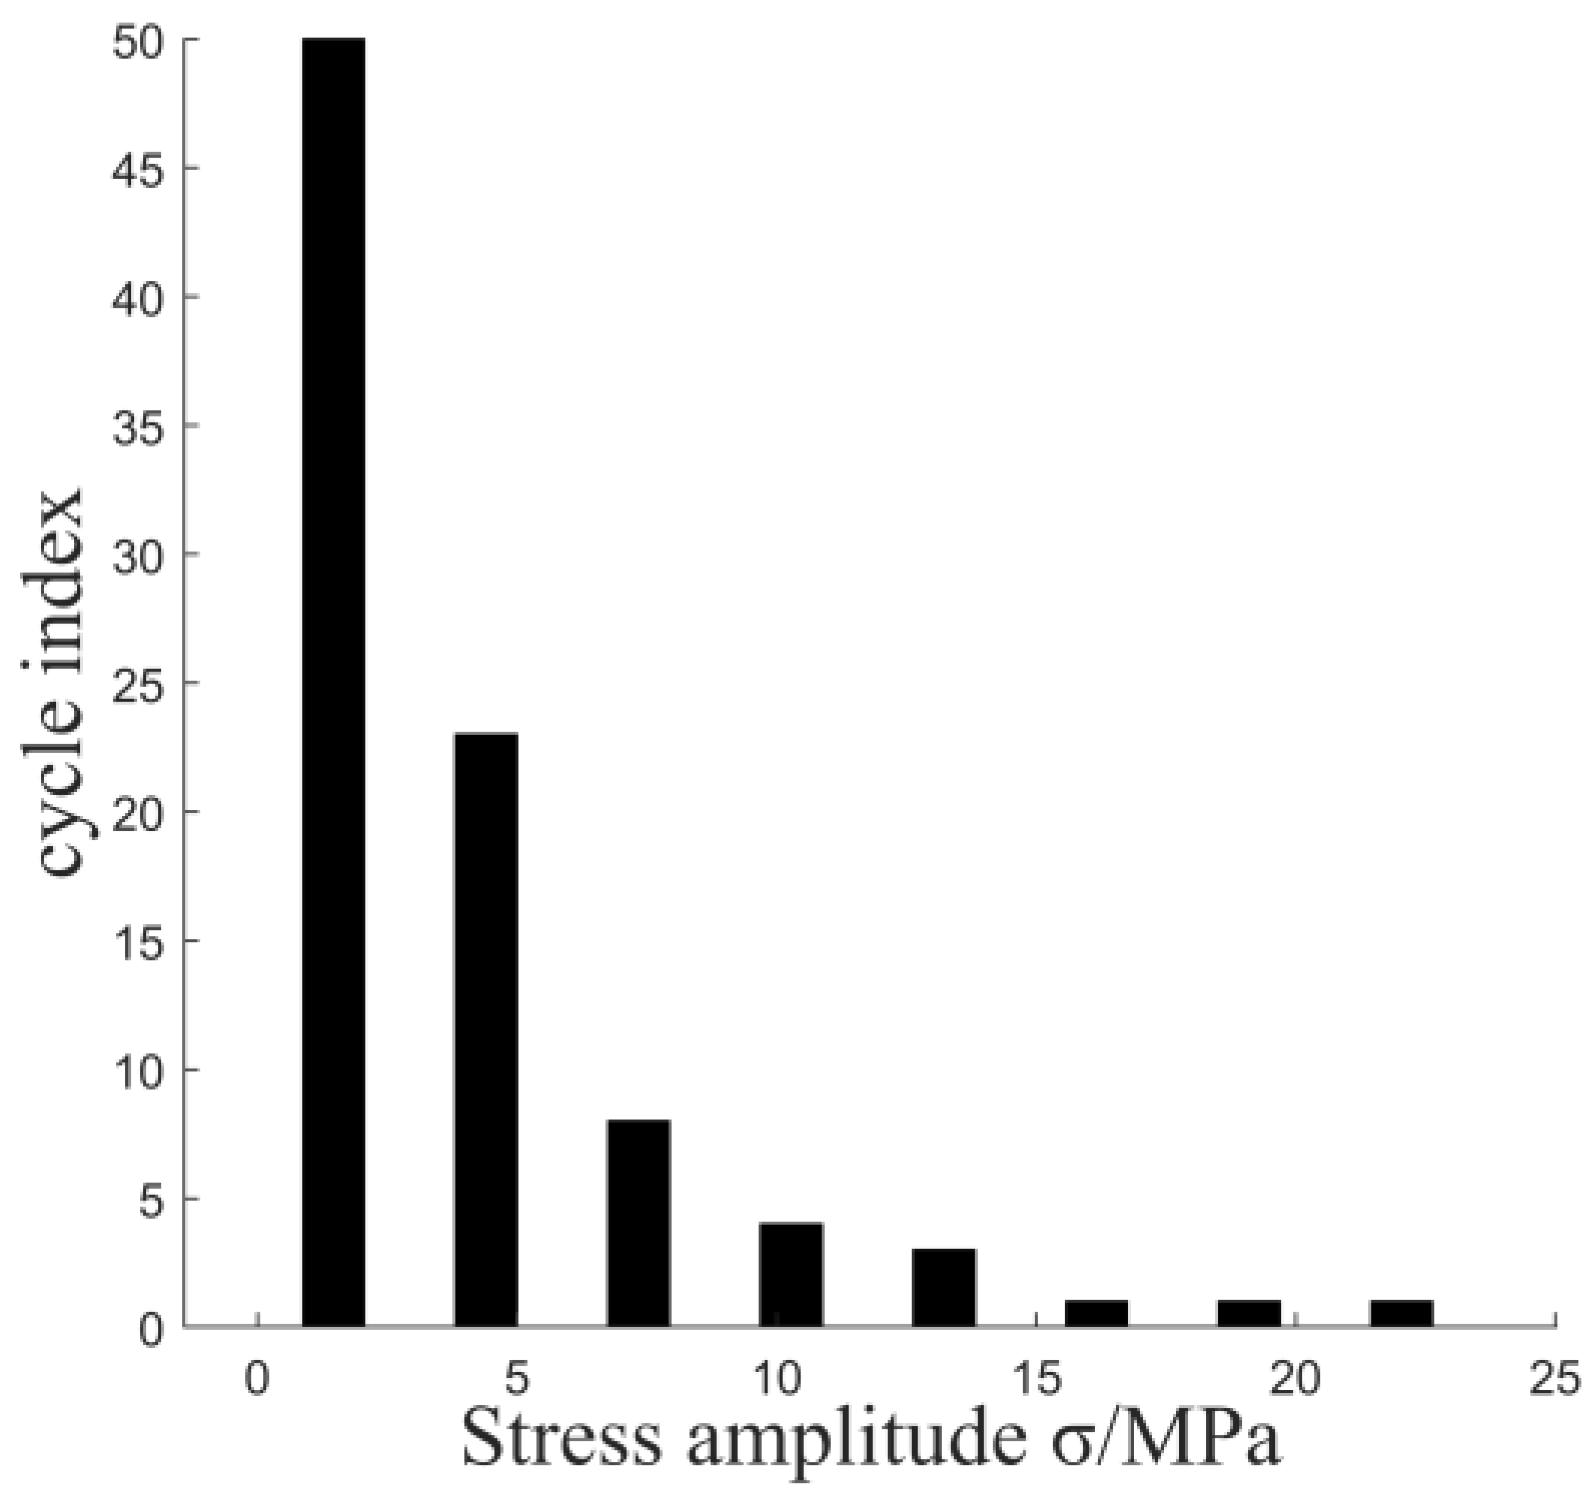
3. Rainflow Counting Method and Stress Spectrum Acquisition

The two-parameter rainflow [22] counting method is a method used to obtain stress spectra for metallic structural components. It divides the load history by taking the amplitude and mean value as two parameters and calculates the stress amplitude and stress mean value corresponding to the obtained mini-cycles, which can be used for fatigue life estimation and compilation of fatigue load spectra. Because the two-parameter rainflow counting method takes into account both dynamic strength (magnitude) and static strength (mean value), it is in line with the inherent characteristics of fatigue loading itself. Therefore, it is widely used in fatigue life for statistics and analysis of data.
The load history to which most engineering components are subjected is complex and consists of a combination of variations in multiple loads. This combination effect can lead to fatigue damage of metal components. Therefore, the study of fatigue life and the reliability of metal components requires the analysis of their stress spectra.
The stress spectrum of an overhead crane refers to the plot of the relationship [3] between the magnitude of stress and the frequency number of stress occurrences of the main box girder under different operating conditions, which are obtained by statistically processing a certain number of stress–time histories; regarding the acquisition of the stress spectrum, the relevant literature has many mature methods to acquire the stress–time histories of the fatigue failure points through field experiments or simulation model dynamics simulations and to obtain the stress–time histories at the point of fatigue failure by using the two-parameter rainflow counting method cycle counting to obtain the desired stress spectrum.

4. Fatigue Residual Life Prediction of Bridge Crane

4.1. Fatigue Crack Expansion Correction Equation

The main box girder of an overhead crane is mainly a welded structure, and the welded parts cannot avoid stress concentration and welding defects, so fatigue cracks will occur, and the starting point of these cracks is usually at the weld. These initial welding defects can be regarded as initial cracks, and their fatigue life mainly depends on the life of the crack extension. The bridge crane crack extension formula mainly uses the Paris crack extension formula to derive the fatigue life of structural components. However, the formula does not consider the effect of the stress ratio on the life of structural members, so the calculated fatigue life results deviate from the life of members in actual use. In this paper, Forman’s formula [20] (R > 0), which only considers the effect of stress ratio in fracture mechanics, is used to derive the crack extension life.
d a d N = C k m 1 R K c k
where a is the crack length; C, m are material constants—according to the literature [23], for Q235 steel, c = 2.61 × 10 13 , m = 3; ΔK is the range of stress intensity factors,   Δ K = f σ π a   [20,24,25]; K c is the fracture toughness of the material; R is the stress ratio.

4.2. Residual Life Prediction Equation for Constant-Amplitude Loading

When the bridge crane’s main girder structure is subjected to the load of the transverse load, the initial length of the crack a 0 and the critical length of the crack a c are known, and the integral of Equation (5) is carried out to obtain the fatigue crack extension life [20] of the crack from the expansion of the initial length a 0 to the critical length a c   (the number of load cycles experienced N a ). After determining the critical crack size a c , the crack extension life N a under equal amplitude loading can be calculated from Equation (6).
N a = ( 1 R ) K c C f Δ σ π m 0.5 m 1 1 a 0 0.5 m 1 1 a C 0.5 m 1 1 C f Δ σ π m 1 0.5 m 1.5 1 a 0 0.5 m 1.5 1 a C 0.5 m 1.5
where f is the correction factor ( f = f × K t , where K t   is the stress concentration factor. For general weld size, the stress concentration factor is about 1.191–2.073 [26]; here, take the average concentration factor K t = 1.5. By checking the table of correction coefficients, It can be found that f   = 0.8, thus the stress intensity factor correction factor f = 0.8 × 1.5 = 1.2 can be obtained); when dealing with fatigue assessment stresses, Δσ is used as the nominal stress, which is calculated globally.

4.3. Residual Life Prediction Equations for Variable-Amplitude Loads

Bridge cranes are subjected to variable amplitude loads [27] as they are loaded and unloaded with different weights of goods in actual operation. To realize the residual fatigue life prediction of bridge cranes under variable-amplitude loads, the variable-amplitude loads can be converted into constant-amplitude loads with different amplitudes. In this paper, the stress spectra of eight levels of bridge cranes are obtained by a combination of simulation and measurement, and the number of load cycles n i corresponding to each level of stress amplitude is obtained. By obtaining the newly converted stress spectra and substituting them into the specified Equation (5), the fatigue life N i   of each level of stress amplitude σ i under the load cycles of the bridge crane is computed. According to the Miner’s successive cumulative damage theory, the accumulated damage D under multistage loading can be expressed as follows:
D = i = 1 k ( n i / N i )
where k is the stress spectral level and takes values from 1 to 8.
Further the number of load cycles of the total bridge crane can be obtained as N c :
N c = i = 1 k ( n i / D )
Substitute Equation (6) into Equation (8) to obtain the fatigue life prediction formula for an overhead travelling crane under variable-amplitude load:
N c = i = 1 k n i D = i = 1 k n i i = 1 k n i N a i
where N a i is the constant-amplitude load life corresponding to each level of stress amplitude σ i , which can be obtained from Equation (6).

4.4. Residual Fatigue Life Prediction Process

The remaining fatigue life prediction process of the bridge crane is shown in Figure 7, and the location of the fatigue failure point is first determined by static structural analysis. The three-parameter Weibull distribution model is established by the characteristic parameter samples of this location, and the rainflow counting method is applied to count them cyclically to obtain the stress spectrum. Finally, the stress spectrum obtained from simulation and test is brought into the constant-amplitude and variable-amplitude load remaining life prediction formula to obtain the remaining fatigue life of the bridge crane.

5. Project Examples

We conducted special equipment inspection on the bridge crane in a certain machinery factory building. the fatigue load spectrum of the bridge crane was obtained using the above method and the remaining fatigue life of the bridge crane was predicted. The maximum rated lifting capacity of the prototype is 40/16 t, with a span of 21.6 m at both ends and a working level of A3. The main beam structure material is Q235 steel. The characteristic parameter data of this bridge crane were collected for 15 d of operation, and the obtained characteristic parameter samples were subjected to probability distribution fitting and goodness-of-fit tests to find out the model that best portrayed the distribution characteristics of the characteristic parameters [28]. As shown in Table 2, α, β, and γ are the random variable, scale parameter, and shape parameter of the three-parameter Weibull distribution, respectively.
Using the LHS method [3,4], a feature parameter sample set is generated containing 300 random number sample points in Matlab, as shown in Figure 8.
Figure 9 shows the stress–time history of a lifting cycle between simulation and on-site testing used to compare the accuracy of the simulation. The lifting weight is 40 t, the lifting distance is 2.99 m, the unloading position is 10.49 m, and the lifting height is 10 m. The simulation results show that the maximum stress of the trolley at the mid-span position is 56.9 MPa, while the actual on-site test results show a maximum mid-span stress of 62.45 MPa, with a difference of 8.89%. This proves that the data obtained from the simulation is more accurate.
As shown in Figure 10, the number of lifting and unloading times of the measured bridge crane for 10 days was counted, and the average daily lifting and unloading times n = 25 were obtained.
We performed dynamic simulation through a simulation model to obtain the stress–time history of the fatigue failure point of the measured bridge crane. Figure 11 shows the stress–time history curves of the 25 lifting cycles listed.
Figure 12 and Figure 13 show the 8-level stress spectrum mean and 8-level stress spectrum amplitude obtained from the 4-day lifting cycle simulation using Matlab’s two-point rainflow counting method. Under this working condition, the stress cycle tends to exhibit a pulsating cycle. By calculation, the stress ratio R = 0.40~0.99 was obtained, and the stress ratios were all greater than 0.
So far, there is no unified standard to determine the boundary of the initial crack formation stage in the total crack propagation life of the crane box beam structure. In engineering applications, the initial crack length a 0 is generally recognized as a microcrack caused by welding. According to the literature [29,30,31], the value range of a 0 is approximately 0.5–2.0 mm. Here, the initial crack length a 0 is taken as 0.5 mm.
According to the experimental data, the critical crack length a c value [15,16] in the range of 80~120 mm is more appropriate; here, the value of a c is taken to be 100 mm. C,m are material constants—according to literature [21], for Q235 steel, c = 2.61 × 10 13 , m = 3.
The eight levels of stress spectrum and the corresponding number of cyclic working times n i   obtained by the rainflow counting method were brought into Equation (6) for the prediction of the remaining life of constant-amplitude loads to obtain the number of cyclic times that this overhead crane was subjected to the action of the transverse amplitude load at each level of stress amplitude N i . Subsequently, the number of working times at each level of stress amplitude N i and the number of cyclic times that this crane was subjected to the action of the transverse amplitude load at each level of stress amplitude N i were brought into Equation (9) to find the total life of the bridge crane N c   = 231,501 cycles. That is, the total life is roughly about 25.37 years. Similarly, the measured stress spectrum obtained from the field test is brought into the above equation to obtain the remaining fatigue life of the crane. The calculation results are shown in Table 3.
Bring the 8-level stress spectrum obtained by the rainflow counting method and the corresponding number of cycles n i   into the remaining life prediction Formula (6) of constant-amplitude load to obtain the number of cycles N i of the bridge crane under the action of transverse load at each level of stress amplitude. Subsequently, the number of working cycles n i   for each level of stress amplitude and the number of cycles N i under the action of transverse loads at each level of stress amplitude are brought into Equation (9), and the total service life of the bridge crane N c   = 210,331 cycles is obtained. The total lifespan is approximately 25.37 years. Similarly, the measured stress spectrum obtained from the field test is brought into the above equation to obtain the remaining fatigue life of the crane. The calculation results are shown in Table 3.

6. Conclusions

This paper provides a method for obtaining the load spectrum of an overhead crane, which is accomplished by field tests, measurements, comparisons, and simulations. Compared with the load spectrum obtained by actual measurement, the load spectrum obtained by this method is more consistent and can replace the load spectrum obtained by experiment. In addition, the method is more convenient and faster.
The stress spectrum of the metal crane structure was obtained by finite element simulation analysis. Subsequently, the cycling technique was performed on the crane-loaded stress spectrum using the rainflow counting method, and then, after determining the working stresses under specific operating conditions, it was found that the stress cycle showed a tendency of the pulsating cycle with a stress ratio R between 0.40 and 0.99.
For the tested prototype, by comparing the residual fatigue life of the simulated and tested stress spectra, the error is about 9.145%, which proves the feasibility of the method. The remaining life obtained by simulation is about 25.37 years, and the method has the advantages of lower cost and shorter cycle time.
There are still many shortcomings in this paper, such as not considering the influence of corrosion and other factors on the remaining life of the bridge crane, and the working conditions considered are relatively simple, which may cause some errors. In the future, the work will continue to be refined and improved.

Author Contributions

Methodology, investigation, writing—original draft, editing, visualization, data curation, conceptualization, and funding acquisition, Y.L.; review, A.J.; provision of study materials, D.Y. and B.Z.; partial model experiments, Y.D. All authors have read and agreed to the published version of the manuscript.

Funding

This works was funded by National Natural Sciences Foundation of China, Grant/Award Number: 51968069.

Institutional Review Board Statement

Not applicable.

Informed Consent Statement

Not applicable.

Data Availability Statement

Data are contained within the article.

Conflicts of Interest

The authors declare no conflict of interest.

References

  1. Maeda, Y.M.; Yoshimi, C.D.; Yoshihisa, E. Stress spectrum of the jib of rough terrain crane carrying a load. JSME 2003, 12, 257–258. [Google Scholar]
  2. Fengyi, L.; Shuang Wang, B.; Gening, X. An improved method for constructing crane load spectrum v-SVRM prediction model. J. Eng. Des. 2015, 22, 412–419. [Google Scholar]
  3. Wang, A.; Xu, G.; Gao, Y. Acquisition of random stress spectrum and fatigue remaining life estimation of bridge cranes. Chin. J. Mech. Eng.-En. 2012, 48, 192–198. [Google Scholar] [CrossRef]
  4. Xiong, L.; Li, D. Simulation estimation of crane structural life. JSJU 2002, 3, 265–268. [Google Scholar]
  5. Ge, Z.; Huang, X. Predicting fatigue performance of asphalt mixtures using damage mechanics theory. J. Transp. Eng. 2003, 3, 40–42+51. [Google Scholar]
  6. Yan, Z.; Liu, C. Fatigue life estimation of welded structures based on the nominal stress method. China Water Transport. 2021, 21, 43–44. [Google Scholar]
  7. Ding, G.; Zhu, H.; Wu, J.; Guan, T.; Dong, H. Fatigue life analysis of key components of spring-operated mechanism based on local stress-strain method. Proc. CSEEE 2023, 1, 1–9. [Google Scholar]
  8. Xiong, W.; Xiang, X.; Yu, Q. Estimation of fatigue life of wire ropes for overhead cranes based on local stress-strain method. Mec. Sci. Tech. 2015, 34, 47–50. [Google Scholar]
  9. Zhang, L.; Sun, Z.; Zhang, F. Estimation of fatigue life and crack size of submarine pressure-resistant hulls by fracture mechanics method under random loading. Ship. Sci. Tech. 2006, 28, 27–31. [Google Scholar]
  10. Mai, J.; Li, H.; Pei, W. Study of concrete surface temperature cracking by fracture mechanics method. J. Hyd. Eng. 2002, 77, 31–36. [Google Scholar]
  11. Guo, J.; Sun, G. Estimation of fatigue life of welded steel structures by fracture mechanics method. Hoisting Conveying Mach. 1999, 10, 9–12. [Google Scholar]
  12. Yao, C.; Wang, Y.; Yang, W. Reliability Study of Metal Structure of Bridge Crane Based on Damage Tolerance Theory. Heat Treat. Met. 1958, 1, 453–456. [Google Scholar]
  13. Zhao, S. Fatigue Resistant Design Manual, 2nd ed; Machinery Industry Press: Beijing, China, 2015; pp. 358–391. [Google Scholar]
  14. Jiang, B. Reliability Study of Metal Structure of Bridge Crane Based on Damage Tolerance Theory. J. Taiyuan Univ. St. 2012, 13, 1–7. [Google Scholar]
  15. Zhou, Z. A review of non-destructive testing methods for mechanical cracks. EME 2017, 10, 1138–1143. [Google Scholar]
  16. Wu, B. Application of non-destructive testing technology in lifting machinery safety inspection. Sci. Technol. Innov. 2022, 9, 171–173+176. [Google Scholar]
  17. Huang, J. Non-destructive testing in the inspection of box girder cranes. Guangdong Shipbuild. 2008, 3, 71–72. [Google Scholar]
  18. Wang, C.; Zhang, B. Fatigue cracks in box girders of overhead cranes and their remaining life. Mech. Des. Res. 2014, 30, 144–147. [Google Scholar]
  19. Xu, G.; Zuo, B. Research on fatigue residual life assessment method of crane structure. Chin. J. S. Sci. 2007, 17, 126–132. [Google Scholar]
  20. Yang, X.; Chen, C. Fatigue and Fracture, 3rd ed.; Huazhong University of Science and Technology Press: Wuhan, China, 2018; pp. 104–109. [Google Scholar]
  21. National standard GB/T3811-2008 Crane Design Code; Beijing Crane Transport Machinery Design and Research Institute: Beijing, China, 2012.
  22. Wang, S.; Jia, C.; Xu, G. Experimental study on Variable amplitude fatigue of box girder of bridge type crane. J. Taiyuan Univ. Sci. Technol. 1996, 17, 51–56. [Google Scholar]
  23. Cheng, W.; Wang, J. Simulation Estimation of Fatigue Crack Extension Life of Bridge and Gantry Cranes. J. L. Trans. Mach. 2001, 2, 1–4. [Google Scholar]
  24. Li, S. Mechanical Fatigue and Reliability, 1st ed.; Science Press: Beijing, China, 2006; pp. 123–128. [Google Scholar]
  25. Cheng, J.; Zhao, S. Mechanics of Fracture, 1st ed.; Science Press: Beijing, China, 2008; pp. 57–99. [Google Scholar]
  26. Li, Y. Effect of stress concentration factor on tensile fatigue properties of low carbon martensite. Mater. Mech. Eng. 1984, 23, 3–9. [Google Scholar]
  27. Zhang, Q.; Wang, H.; Hu, N. Research on damage and fatigue life prediction of the main girder of gantry crane under hoisting load. J. Eng. Des. 2015, 22, 461–468. [Google Scholar]
  28. Wang, A.; Xu, G.; Yang, P.; Gao, Y. Bridge Crane Lift Load Distribution Fitting and Inspection. J. Mech. Ste. 2011, 33, 921–926. [Google Scholar]
  29. Pan, C. Fatigue performance of box-shaped main girders of overhead cranes. Hoisting Conveying Mach. 1984, 1, 17–36. [Google Scholar]
  30. Ma, J.; Lv, G. An objective quantity describing the length of the initial crack at the notch root. Mach. Sci. Technol. 1997, 6, 94–97. [Google Scholar]
  31. Liu, B.; Zhuang, D.; Qiu, J. Preparation of load spectrum of coal mining machine haulage system based on rainflow counting method. Coal Tech. 2011, 42, 219–223. [Google Scholar]
Figure 1. Location of fatigue failure point of cross-section of main beam at mid-span position.
Applsci 13 12250 g001
Figure 2. Crack extension real photo.
Applsci 13 12250 g002
Figure 3. Stress diagram of main box beam during trolley midspan.
Applsci 13 12250 g003
Figure 4. Equivalent stress cloud of the main beam.
Applsci 13 12250 g004
Figure 5. Total displacement diagram of the main beam.
Applsci 13 12250 g005
Figure 6. Stress–time history curve of a lifting cycle.
Applsci 13 12250 g006
Figure 7. Residual fatigue life evaluation process.
Applsci 13 12250 g007
Figure 8. The random sample set of feature parameters.
Applsci 13 12250 g008
Figure 9. Comparison of simulation and experiment for one cycle.
Applsci 13 12250 g009
Figure 10. Statistics of lifting times within 10 days.
Applsci 13 12250 g010
Figure 11. Stress–time course curves for 25 lifting cycles.
Applsci 13 12250 g011
Figure 12. Plot of the mean value of the 8-level stress spectrum.
Applsci 13 12250 g012
Figure 13. Amplitude plot of the 8-level stress spectrum.
Applsci 13 12250 g013
Table 1. Performance parameters of Q235 steel.
Density   ( g / c m 3 ) Modulus   of   Elasticity   ( E ) Poisson s   Ratio   ( μ ) Tensile   Strength   σ b Yield Strength
7.852.1 × 105 MPa0.3 370 500   M P a 235   M P a
Table 2. Distribution of characteristic parameters of QB40/16 t overhead cranes.
Characteristic ParameterMaximum Likelihood Estimated Parameter Values
Lifting weightα = 7.960β = 0.926γ = 3.330
Lifting positionα = 6.210β = 2.0540
Unloading locationα = 6.314β = 1.9630
Whether the car is over the spanα = 0.58600
Table 3. Comparison of simulation and test result calculations.
ParameterSimulation ResultTest ResultsInaccuracies
number of cycles231,501 times210,331 times9.145%
remaining life25.37 years23.05 years
Disclaimer/Publisher’s Note: The statements, opinions and data contained in all publications are solely those of the individual author(s) and contributor(s) and not of MDPI and/or the editor(s). MDPI and/or the editor(s) disclaim responsibility for any injury to people or property resulting from any ideas, methods, instructions or products referred to in the content.

