Abstract
This paper describes experimental studies of cutting the outer layer of onions in a machine processing process. For this purpose, an original, globally innovative machine design with a modular structure was used, which was constructed in a real scale. For the purposes of carrying out the experimental studies, a test stand was constructed, a plan and programme for the studies were adopted, and a research methodology was developed. The results gained and the data obtained from the equations of the regression function for the developed machine design were used to construct systems of independent variables for which the dependent variable reaches extreme values. The unit energy consumption of the onion peeling process increases together with an increase in the number of air nozzles and the air pressure supplying the unit for removing the skins, while an increase in the material feeding speed and in the distance of the air nozzles results in a decrease in the energy consumption of the process.
1. Introduction
The onion is characterised by its important nutritional and health-promoting properties [,,,]. It contains vitamins, minerals, and powerful plant compounds that support the immune system, and the healing properties of onions have been known since ancient times. All types of onions have health-promoting, anti-inflammatory, antibacterial, and immune-boosting effects, hence it is an ideal remedy for all kinds of upper respiratory infections. It is also used to treat wounds and burns.
Nowadays, the onion is also used by humans as a flavor addition to dishes, being an ingredient in most salads and canned food. The great importance of the discussed topic is evidenced by the fact that, currently, onion production amounts to over 85 million tons, and the cultivated area in the world is over 4.4 million hectares []. This topic is also important in Europe due to its share in world production, which is 15%.
Irrespective of their further destination, after harvesting, onions are first of all subjected to a procedure to remove the outer, dried layers of the scale and to cut off the tips. Despite the continuous development of medical and food processing techniques, the abovementioned procedures are mainly performed manually. As the main reason for the lack of comprehensive automation of the onion processing process and, in particular, of the first stage that is peeling, one should mention the high energy consumption of the process, the unsatisfactory efficiency, and the greater amount of waste generated than in the case of manual peeling. Consequently, there exists a need to identify the energy consumption of the cutting process in the machine processing of onions.
The leading manufacturers of onion peeling machines include producers from China, the USA, England, and the European Union.
Known design solutions of machines for the industrial processing of ionic material operate in three systems: the first system involves cutting off the onion skin, blowing it, and then cutting off the ends, the second system involves cutting off the onion skin and blowing it off without cutting off the ends, and the third system involves first cutting off the ends material, then cutting off and blowing off the scales.
Despite the existence on the food processing industry market of onion peeling machines, there is a lack of data in the available literature regarding ongoing research on the existing design solutions. The topics dealt with include the cutting and grinding of plant material [,,] and the efficiency of machinery operation [,] with consideration also of methods for processing onions [,,,,,,] and of the ecological aspects of processes [,], taking into account materials intended for consumption or energy purposes in the manufacturing and processing systems. On the other hand, there is a lack of results available in the publications from the conducted studies on vegetable cutting, especially related to the mechanisation of the onion peeling process. Manufacturers of machines available on the market do not provide detailed information to the public on the effectiveness of the machines, i.e., research is not conducted or the data is not disclosed. The scientific studies presented in this article make an important contribution to the development of knowledge for the design and operation of machines used for the mechanical peeling of onions. There are currently no scientific publications that describe this issue in detail.
Therefore, it is not possible to clearly identify which features and design parameters of an industrial onion peeling machine have a decisive impact on the energy consumption of the process. Therefore, within the framework of the study, the authors attempted to solve the research problem in this area by answering the following question: what is the impact of selected design parameters of the authors’ onion peeling machine on the energy consumption of the process?
2. Materials and Methods
In order to obtain an answer to the research problem indicated above, a test stand experiment was planned according to a scheme showing correlations between independent variables, dependent variables, constant factors, and disturbing factors.
In the experiment, the independent variables included material speed vp, depth of cuts in the outer shell dn, number of air nozzles nd, distance of air nozzles from the cut material hd, air pressure supplying the nozzle system p, while the unit energy consumption Ej was selected as the dependent variable.
The studies were conducted within fixed ranges of temperature and humidity for both environment and material tested and for a specific onion variety. The parameters were described as constant factors: onion variety oc, onion diameter dc, ambient humidity wo, ambient temperature To.
The material in the main studies was onions of the Bonus variety, due to the processing susceptibility and high popularity of this variety.
The independent and dependent variables were defined on the basis of an analysis of the literature on the theory and design of agricultural and processing machinery and preliminary own research. The values of the independent variables that were adopted in the experimental studies are summarised in Table 1, while the dependent variable was defined as the unit energy consumption for carrying out the process and Ej was determined to be the ratio of the sum of the energy consumed to carry out the process of cutting off the ends and removing the outer scales to the weight of the onion peeled per unit time.

Table 1.
Independent variable values determined in research.
Scientific research was conducted for materials with diameters of 50–70 mm in a warehouse where the humidity and ambient temperature were controlled. The number of repetitions in the experiment was based on previous trials and statistical calculations. The number of repetitions was set to 10 with a significance level of α = 0.05 and the permissible estimation error was d = 2%. The station where research on the energy consumption of onion cutting was carried out was built by the authors [].
Figure 1 shows a view of the test stand.
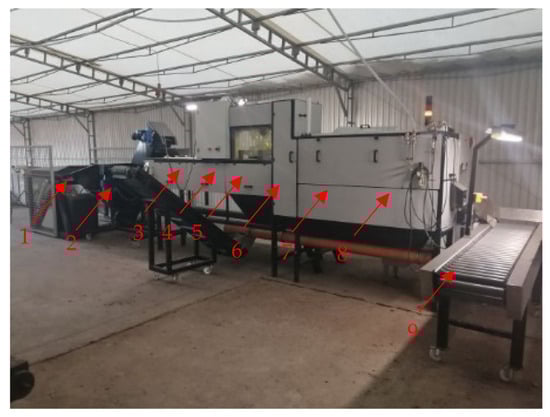
Figure 1.
The main test stand: 1—block pallets dumper, 2—material feeder, 3—take-up conveyor, 4—end-cutting system, 5—shell cutting system, 6—shell blowing system, 7—visual quality control system, 8—correction system, 9—inspection table.
The cutting system was designed as two discs with a diameter of 200 mm (Figure 2). The copying system installed in the station makes it possible to change the spacing of the knives depending on the size of the material being cut.
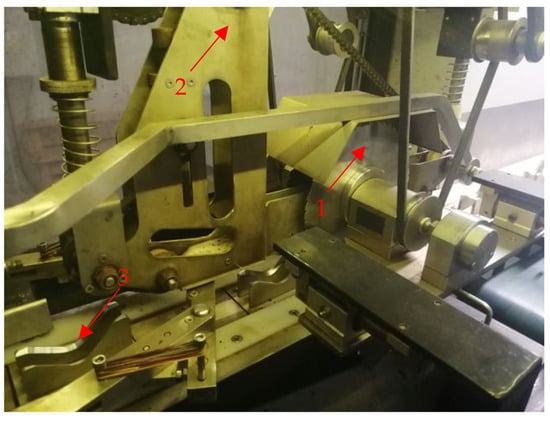
Figure 2.
End-cutting arrangement: 1—disc knife, 2—reaction arm, 3—onion supply to the cutting zone.
The technological process involving peeling the onion is carried out by first cutting off the ends of the material by disc knives (Figure 3), followed by the cutting and blowing off of the skins (Figure 4). In order to perform a measurement of the load torque of the motor driving the disc knives performing the heel trimming and the residual chive, constructional alterations were made to the test stand by changing the method of driving one of the cutting knives. While during the operation of the machine under processing conditions the cutting knives are driven via a belt transmission system by a single motor built into a chamber located directly above the end-cutting and skin-incision space, a separate drive of one of the knives was used for the torque measurement by means of an additional induction motor. This operation consisted of fixing the motor in such a way as to allow it to rotate freely around an axis that was the axis of symmetry of the drive shaft.
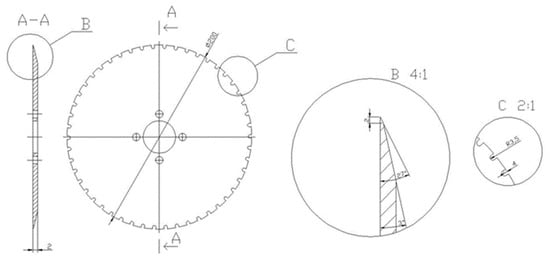
Figure 3.
Dimensions of disc cutting knives.
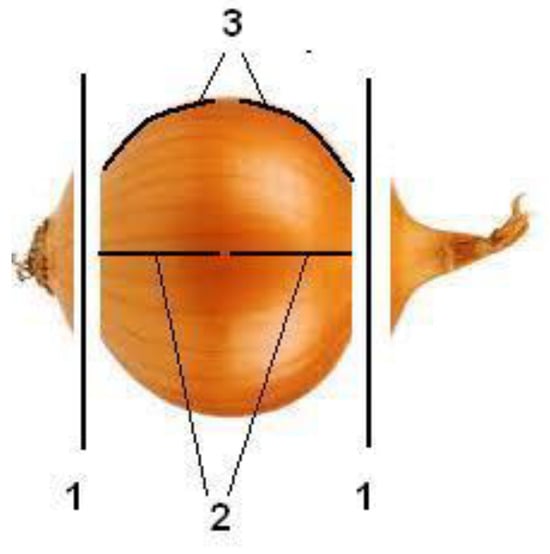
Figure 4.
Location of cutting operations on onions: 1—locations of end cuts by disc knives, 2—locations of skin cuts carried out by a pair of knives working along a horizontal plane, 3—locations of skin cuts carried out by a pair of knives working along a vertical plane.
This method of fixing, when the engine was in operation, generated a moment of force that caused the engine to rotate around the axis of symmetry of the shaft. This phenomenon was used to measure the torque value by attaching a reaction arm of known length (150 mm) to the motor and measuring the reaction force at the point of contact between the arm and the test stand frame. In order to measure the reaction force moment Figure 5), a tensometer beam SES-09074 was used and a system was built to measure the value of this force. This circuit was based on the use of an ATMEGA328 microcontroller tile, an amplifier/signal converter with an HX711 circuit, and PC software.
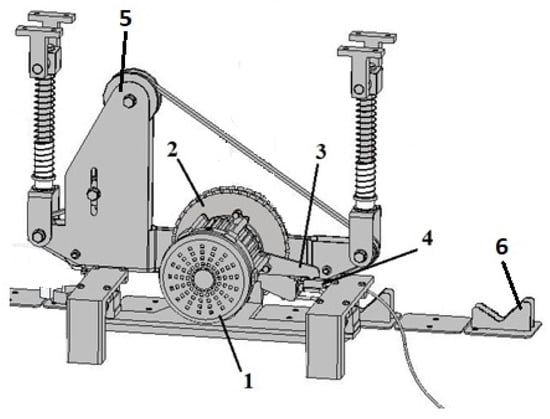
Figure 5.
Schematic of the test stand for determining the cutting work of the disc knife: 1—motor driving the disc knife, 2—disc knife, 3—reaction arm, 4—tensometer beam, 5—clamping system, 6—onion supply to the cutting zone.
The results of the reaction force measurements were used to calculate the reaction force torque equal to the load moment on the engine shaft according to the formula:
where:
- Mr—reaction force moment,
- Fr—reaction force,
- rr—radius of action of the reaction forces.
Unit energy is a function of the energy consumed by the cutting unit in relation to the quantity of material cut per unit time and can accordingly be expressed by the formula:
where:
- Ejc—unit cutting power,
- N—power consumed by the cutting unit,
- W—capacity of the machine.
Assuming the following relationship:
and taking into account that the measuring operation was carried out on one of the two knives of the cutting unit, it can be written:
where:
- Ejc—unit energy of the cutting process ,
- Mr—load moment on the cutting unit equal to the force reaction moment [Nm],
- n—rotational speed of the cutting knives ,
- W—machine performance .
The unit energy consumption was calculated from the relationship:
where:
- Ejz—unit energy consumption of the compressed air flow of the skin-blowing device ,
- Ew—internal energy derived from the work carried out during the adiabatic compression of 1 Nm3 of air to a given pressure p ,
- qpG—volume flow rate of the air flowing through the GreenTec MQL47003 ,
- nd—number of GreenTec MQL 47,003 nozzles,
- W—machine performance .
The total unit energy consumption was calculated as the sum of the unit energy consumption to perform the cutting process and the peeling process in the skin removing unit:
By substituting the Formulas (3)–(5) into Equation (6), the final form of the equation describing the total unit energy consumption for the onion peeling process was obtained for the machine with disabled visual quality control function and the module making adjustments:
While in the case of the nozzles used in the skin blowing apparatus the air flow occurs continuously, in the case of the amendment module it is initiated by the appearance of the onion in the skin removal zone. In order to measure the total time of air flow through the Silvent MJ5 nozzles, onion presence sensors were used in the form of mechanical limiters which are the source of a discrete signal for a universal counter counting the number of onions treated with air per minute. Knowing the set treatment time of one onion, the value of which was set to 3 s during the preliminary tests, and the mass flow of onions passing through the correction module, it was possible to calculate the unit energy consumption according to the formula:
where:
- Ejm—unit energy consumption of the compressed air flow of the correction module device ,
- Ew—internal energy derived as a result of the work done during the adiabatic compression of 1 Nm3 of air to a given pressure p device ,
- qpS—volume flow rate of the air flowing through the Silvent MJ5 nozzle device ,
- tmp—duration time of a single treatment of the onion blowing off the skin in the module making the corrections [s],
- nmp—volume of onions peeled by the correction module per minute ,
- Wmp—the mass stream of onions passing through the correction module .
In order to determine the unit energy consumption of the machine with the correction module activated, the value was determined as follows:
After taking into account relations (4), (5), and (8), Formula (9) was transformed into a formula expressing the total unit energy consumption for the realization of the process of peeling onions for the machine with the activated function of the visual quality control and the module making corrections:
where:
- mt = mr—mi—weight of onions leaving the correction module.
In order to determine the impact of selected features and design parameters on shaping the performance characteristics of the onion peeling machine, tests were conducted on a test stand. The results of the conducted experiments made it possible to determine the impact of independent variables on shaping the values of dependent variables. The unit energy consumption was determined on the basis of the results of mass, time, and reaction force measurements. The unit energy consumption of the onion peeling process Ej was estimated from Equation (7), and the average error of this quantity was estimated using a complete differential according to the relation:
where:
- ΔEj—average error of measurement of the unit energy consumption of the onion peeling process for the machine with visual quality control and correction module deactivated for the respective test position ],
- Ej—total unit energy consumption n of the onion peeling process for the machine with the deactivated visual quality control function and the touch-up module for the respective test point ],
- Fr—reaction force measured with a tensometer beam measuring system [N].
After differentiating Equation (11), the final form of the formula describing the average error of measurement of the unit energy consumption for the execution of the onion peeling process for the machine with the visual quality control function deactivated and the module making the corrections was obtained:
The unit energy consumption of the onion peeling process for a machine with the visual quality control function and correction module Ej1 activated was estimated according to Equation (9), and the average error of this quantity was estimated using the integral differential method based on the following equation:
where:
- ΔEj1—average error of measurement of the total energy consumption of the onion peeling process for the machine with visual quality control and correction module activated for the respective test point ],
- Ej1—total energy consumption of the onion peeling process for the machine with visual quality control and test point correction module activated for the respective test point ],
- mt—weight of onions leaving the correcting module [kg].
The final form of the expression describing the average error of measurement of the unit energy consumption for the onion peeling process for a machine with the activated visual quality control function and the module making the corrections was obtained after differentiation of Equation (13):
Based on the measurement errors of the systems and instruments specified by the manufacturers, the following measurement errors were assumed:
- dm = 1 kg,
- dt = 0.1 s,
- dFr = 0.008 N.
On the basis of the assumed values of measurement errors and by applying the formulas presented above, the average measurement errors of all dependent variables for each test point were calculated. The extreme values of the results obtained for the individual dependent variables are shown in Table 2.
Table 2.
Extreme values of measurement errors of dependent variables.
3. Results
The results from the experiment are presented in Table 3, while Table 4 contains selected statistics for the dependent variable.
Table 3.
The results of the experimental tests obtained during the implementation of the experiment according to the five-factor cross combination.
Table 4.
Range of statistical values for individual dependent variables.
In Table 3, the experimental results (arithmetic mean values of the dependent variables) obtained for the five-factor cross combination of the independent variables are summarized.
The analysis of the regression function for the unit energy consumption of the Ej process was performed in five stages. The results from the final stage of the regression function analysis are summarized in Table 5.
Table 5.
The results of the regression function analysis for the machine performance.
Table 5 presents the results from the regression function analysis for the unit energy consumption of the onion peeling process Ej.
As a result of the conducted significance test of the individual structural parameters of the equation, the coefficients a3, a5, a6, a8, and a9 were found to be statistically insignificant, so that, finally, the Ej function took the form of:
As a result of the conducted test of the adequacy of the regression function, the value of the F = 559.88 statistic was obtained and, on the basis of the finding of the inequality
, the null hypothesis on the inadequacy of the regression function was rejected. From the derived equation of the regression function (15), it follows that the value of unit energy consumption Ej is dependent on all the explanatory variables with the exception of skin notch depth dn.
Figure 6 and Figure 7 present examples of graphical interpretations of the dependence of unit energy consumption Ej on individual independent variables.
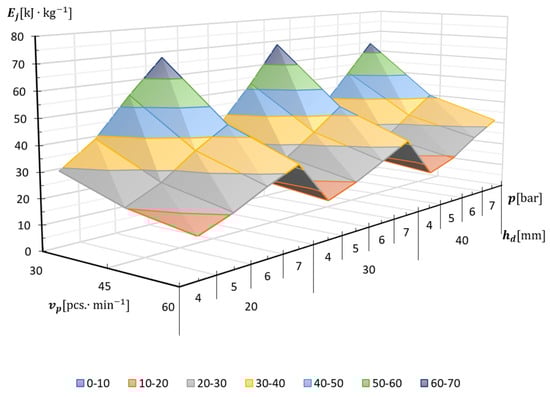
Figure 6.
Impact of material feed speed , air pressure , and air nozzle distance on the unit energy consumption Ej.
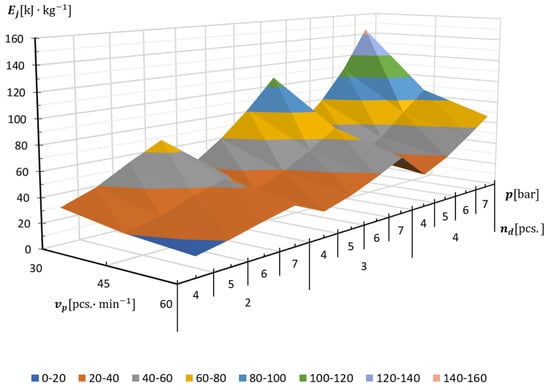
Figure 7.
Impact of material feed speed , air pressure , and number of air nozzles on the unit energy consumption Ej.
From the test results presented, it can be seen that the value of Ej decreases according to the graph of the polynomial function of the second degree as the material feed rate vp increases. The lowest values of Ej obtained for material feed rate and obtained for the combinations of values of the independent variables shown in the graphs represented on average 41.86% of the values of obtained for . Detailed results are presented in Figure 8. For a constant value of vp, the unit energy consumption of the process Ej was found to increase strongly together with the increase in the number of peeling nozzles nd and the value of the pressure p of the air supplying them. An increase in the distance of the air nozzles from the material hd, on the other hand, was found to result in a slight decrease in the unit energy intensity of the process Ej.
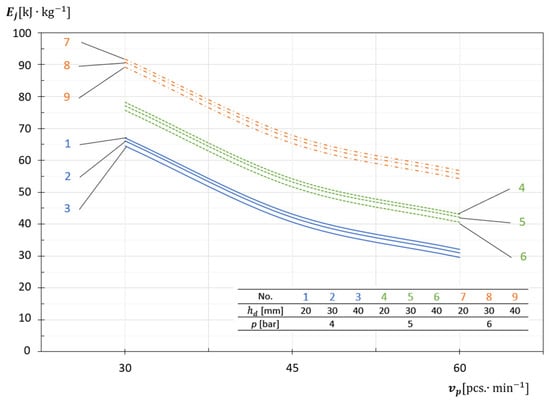
Figure 8.
Impact of material feed rate on shaping the unit energy intensity of the machine at constant parameters dn = 1.5 mm and nd = 4 pcs.
Figure 9 illustrates the dependence of unit energy consumption Ej on the air pressure supplying the skin removal system p. From these graphs, a strong positive correlation between these quantities can be evinced. In the case of the system of the variables describing the values included in the graphs, the unit energy consumption for the peeling process Ej at the pressure p = 4 bar was, on average, 50.46% lower than that at p = 7 bar.
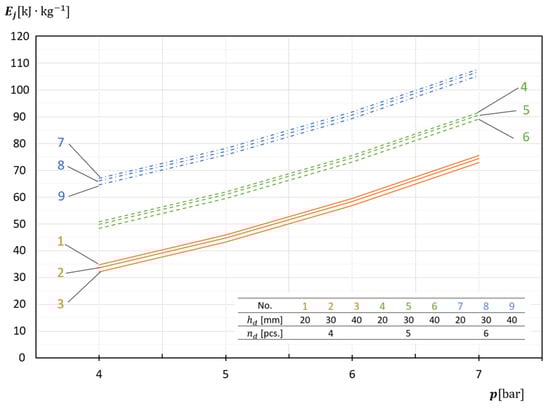
Figure 9.
Impact of air pressure feeding the skin removal system on shaping the unit energy intensity of the machine at constant parameters dn = 1.5 mm and vp = 30 pcs.·min−1.
In the case of constancy of the other explanatory variables, this dependence can be approximated by a decreasing linear function. The highest values of Ej obtained for the value hd = 20 mm were, on average, 9.70% higher than the values obtained for hd = 40 mm.
Analyzing the remaining data, the Ej values obtained with the combinations of values of the independent variables considered in the graphs for nd = 2 were, on average, 56.55% lower than those obtained for nd = 4.
Finally, the extreme values of the dependent variables are presented in Table 6.
Table 6.
Systems of independent variables for the lowest and highest values of dependent variables.
4. Conclusions
- Within the framework of the realisation of the study, the energy consumption of the onion cutting process under machine peeling conditions was tested. The energy consumption indicated as the unit energy consumption for the realization of the process Ej was estimated using the ratio of the sum of the energy consumed for the process of cutting the ends and removing the outer skins to the weight of the onion peeled per unit time.
- The unit energy consumption Ej for execution of the onion peeling process increases together with an increase in the number of air nozzles nd and the air pressure supplying the skin removal unit p. An increase in the material feeding speed vp and in the distance of the air nozzles from the material hd results in a decrease in the unit energy consumption.
- Considering the unit energy consumption of the realization of the onion peeling process Ej as a quotient of the energy consumed per unit time and the performance of the machine, it can be concluded that the value of the energy depends only on the number of skin removal nozzles and the air pressure supplying them, as well as on the unit cutting energy Ejc, which, as the studies have shown, is a quantity independent of the considered system of variables. Therefore, it should be assumed that the lowest values of unit energy consumption Ej will be achieved for those systems of independent variables for which the highest values of machine performance have been obtained. However, taking into account the high multivariate correlation coefficient, the value of the standard deviation of the residuals and the high value of the F statistic indicating the strong adequacy of the regression function, the relationships shown in the graphs should be assumed to be true.
Author Contributions
Conceptualization, M.Z. and A.B.; methodology, A.B.; formal analysis, M.Z., M.W. and W.T.; investigation, A.B. and M.W.; writing—original draft preparation, M.Z. and A.B.; writing—review and editing, M.Z.; visualization, M.Z.; supervision, A.B. All authors have read and agreed to the published version of the manuscript.
Funding
The research was carried out with a grant from the Minister of Science and Higher Education as part of scientific research conducted at the Faculty of Mechanical Engineering of the PBŚ, at number BN-WIM-8-2023.
Institutional Review Board Statement
Not applicable.
Informed Consent Statement
Not applicable.
Data Availability Statement
The data presented in this study are available in this article.
Conflicts of Interest
The authors declare no conflict of interest and the funders had no role in the design of the study, in the writing of the manuscript, or in the decision to publish the results.
References
- McCallum, J.; Clarke, A.; Pither-Joyce, M.; Shaw, M.; Butler, R.; Brash, D.; Scheffer, J.; Sims, I.; Van Heusden, S.; Shigyo, M.; et al. Genetic Mapping of a Major Gene Affecting Onion Bulb Fructan Content. Theor. Appl. Genet. 2006, 112, 958–967. [Google Scholar] [CrossRef] [PubMed]
- Rashmi, H.B.; Negi, P.S. Chemistry and Physiology of Fruits and Vegetables. In Advances in Food Chemistry: Food Components, Processing and Preservation; Springer Nature: Berlin/Heidelberg, Germany, 2022. [Google Scholar]
- Vojvodić Cebin, A.; Šeremet, D.; Mandura, A.; Martinić, A.; Komes, D. Onion Solid Waste as a Potential Source of Functional Food Ingredients. Eng. Power Bull. Croat. Acad. Eng. 2020, 15, 7–13. [Google Scholar]
- Roldán-Marín, E.; Krath, B.N.; Poulsen, M.; Binderup, M.L.; Nielsen, T.H.; Hansen, M.; Barri, T.; Langkilde, S.; Pilar Cano, M.; Sánchez-Moreno, C.; et al. Effects of an Onion By-Product on Bioactivity and Safety Markers in Healthy Rats. Br. J. Nutr. 2009, 102, 1574–1582. [Google Scholar] [CrossRef] [PubMed]
- Bochat, A.; Zastempowski, M.; Wachowicz, M. Cutting Tests of the Outer Layer of Material Using Onion as an Example. Materials 2021, 14, 2360. [Google Scholar] [CrossRef] [PubMed]
- Du, D.D.; Wang, J. Research on Mechanics Properties of Crop Stalks: A Review. Int. J. Agric. Biol. Eng. 2016, 9, 10–19. [Google Scholar] [CrossRef]
- Si, S.; Zhang, B.; Huang, J.; Shen, C.; Tian, K.; Liu, H.; Zhang, Y. Bending Mechanics Test and Parameters Calibration of Ramie Stalks. Sci. Rep. 2023, 13, 8666. [Google Scholar] [CrossRef] [PubMed]
- Igathinathane, C.; Pordesimo, L.O.; Schilling, M.W.; Columbus, E.P. Fast and Simple Measurement of Cutting Energy Requirement of Plant Stalk and Prediction Model Development. Ind. Crops Prod. 2011, 33, 518–523. [Google Scholar] [CrossRef]
- Lisowski, A.; Klonowski, J.; Sypuła, M.; Chlebowski, J.; Kostyra, K.; Nowakowski, T.; Strużyk, A.; Świętochowski, A.; Dąbrowska, M.; Mieszkalski, L.; et al. Energy of Feeding and Chopping of Biomass Processing in the Working Units of Forage Harvester and Energy Balance of Methane Production from Selected Energy Plants Species. Biomass Bioenergy 2019, 128, 105301. [Google Scholar] [CrossRef]
- Kruszelnicka, W.; Kasner, R.; Bałdowska-Witos, P.; Flizikowski, J.; Tomporowski, A. The Integrated Energy Consumption Index for Energy Biomass Grinding Technology Assessment. Energies 2020, 13, 1417. [Google Scholar] [CrossRef]
- El-Ghobashy, H.; Bhansawi, A.; Ali, S.A.; Afify, M.T.; Emara, Z. Development and Evaluation of Onion Peeling Machine. Plant J. 2004, 38, 663–682. [Google Scholar] [CrossRef]
- Ravichandran, P.; Anbu, C.; Sathish Kumar, S.; Sakthivel, A.; Thenralarasu, S. Design and Fabrication of Automatic Onion Peeling and Cutting Machine. Int. J. Sci. Technol. Res. 2019, 8, 2067–2070. [Google Scholar]
- Woźniak, P.; Nosal, S.; Bieńczak, A. Analysis of Technology and Machining Devices for Cleaning Onion in the Food Industry. MATEC Web Conf. 2021, 343, 01006. [Google Scholar] [CrossRef]
- Kumawat, L.; Raheman, H. Determination of Engineering Properties of Onion Crop Required for Designing an Onion Harvester. Cogent Eng. 2023, 10, 2191404. [Google Scholar] [CrossRef]
- Tereshkin, O.; Horielkov, D.; Dmytrevskyi, D.; Chervonyi, V. The Study of Influence of the Process of Mechanical Additional Cleaning on the Surface Onion Layer at Combined Process of Cleaning. EUREKA Life Sci. 2016, 6, 24–30. [Google Scholar] [CrossRef][Green Version]
- Srivastava, A.; VanEe, G.; Ledebuhr, R.; Welch, D.; Wang, L. Design and Development of an Onion-Peeling Machine. Appl. Eng. Agric. 1997, 13, 167–173. [Google Scholar] [CrossRef]
- Nor, N.H.M.; Hassan, M.F.; Ali, M.H.M.; Tuparman, M.H. Design and Development of Shallots Skin Peeler Machine. J. Ind. 2019, 1, 2. [Google Scholar]
- Piotrowska, K.; Kruszelnicka, W.; Bałdowska-Witos, P.; Kasner, R.; Rudnicki, J.; Tomporowski, A.; Flizikowski, J.; Opielak, M. Assessment of the Environmental Impact of a Car Tire throughout Its Lifecycle Using the LCA Method. Materials 2019, 12, 4177. [Google Scholar] [CrossRef] [PubMed]
- Kruszelnicka, W. Design Features of Comminution Disc and Their Relation with CO2 Emission in Disc Life Cycle. Proc. J. Phys. Conf. Ser. 2021, 1781, 012015. [Google Scholar] [CrossRef]
Disclaimer/Publisher’s Note: The statements, opinions and data contained in all publications are solely those of the individual author(s) and contributor(s) and not of MDPI and/or the editor(s). MDPI and/or the editor(s) disclaim responsibility for any injury to people or property resulting from any ideas, methods, instructions or products referred to in the content. |
© 2023 by the authors. Licensee MDPI, Basel, Switzerland. This article is an open access article distributed under the terms and conditions of the Creative Commons Attribution (CC BY) license (https://creativecommons.org/licenses/by/4.0/).