Article

Innovative Acoustic-Hydraulic Method for High-Performance Fine Liquid Atomization

1
Faculty of Physics and Technology, Tomsk State University, 634050 Tomsk, Russia
2
Biysk Technological Institute (Branch) of Polzunov Altai State Technical University, 659305 Biysk, Russia
3
Institute for Problems of Chemical and Energetic Technologies of the Siberian Branch of the RAS, 659322 Biysk, Russia
*
Author to whom correspondence should be addressed.
Appl. Sci. 2023, 13(22), 12330; https://doi.org/10.3390/app132212330
Submission received: 29 October 2023 / Revised: 10 November 2023 / Accepted: 13 November 2023 / Published: 15 November 2023
(This article belongs to the Section Acoustics and Vibrations)

Abstract

:

Featured Application

The acoustic-hydraulic nozzle can be used in technological tasks where both high droplet dispersion and high productivity in creating an aerosol flow are required.

Abstract

Spray technology is widely used in various industries, including medicine, food production, mechanical engineering, and nanopowder manufacturing. Achieving high dispersion and a narrow particle size distribution is crucial for many applications. Ultrasonic spraying is commonly used to achieve this. On the other hand, hydraulic nozzles provide high atomization performance. Combining these two technologies promises to offer significant benefits, but the complex processes that occur simultaneously in such a device require careful study. This work proposes a fundamental design for an acoustic-hydraulic nozzle and investigates the physical processes when a liquid is sprayed using this nozzle, both theoretically and experimentally. The study identifies the critical modes of spraying and confirms that the simultaneous use of ultrasound and hydraulic pressure can produce a fine spray (droplet size less than 50 μm vs. 150–500 μm for hydrodynamic spray) with high productivity (5–10 mL/s vs. 0.5 mL/min for ultrasonic spray). This approach has significant potential for modern industries and technologies.

1. Introduction

Liquid atomization is a crucial manufacturing process that finds application in a diverse range of fields. Over time, numerous spraying methods and devices have been developed based on different physical principles, including hydraulic, pneumatic, and mechanical, and their combinations [1].
The hydraulic atomization of liquid is the most conventional method, wherein the liquid is converted into droplets when it flows through the nozzle hole under high pressure. This process is extensively employed in industries and agriculture for the application of various solutions, chemicals, fertilizers, etc. [2]. Hydraulic atomization allows for high atomization performance at high pressures (up to 1000 mL/s), but the droplet size is 100–500 μm or more.
Combined types of nozzles include, for example, impingement-type nozzles [3], impinging jet nozzles [4], impact-type pneumatic nozzles [5], centrifugal-pneumatic type nozzles [6], and others.
This variety of spraying methods is caused by the requirements of specific technological applications: in some cases, high dispersion and a narrow droplet size distribution are required; in others, certain spray geometry is required; in others, a stable spray speed, etc. There are a number of tasks that require both high droplet dispersion and high productivity of spray creation. Simultaneous fulfillment of such requirements is difficult to achieve. The novelty of this work lies in the development of a new method of liquid spraying, combining high dispersion and high productivity.
Simultaneously high aerosol production and high droplet dispersion are required in technological processes such as aerosol drying, aerosol coating, aerosol surface treatment, and aerosol drug delivery.
In aerosol drying, for example, the material is subjected to spraying to create an aerosol, which then quickly dries, forming fine dispersed particles with high surface activity [7]. In aerosol coating, high droplet dispersion allows for uniform coating application on the surface, and high aerosol production ensures efficient coverage of large areas [8].
In aerosol surface treatment, high droplet dispersion helps to evenly distribute the treating substance, and high aerosol production accelerates the treatment process [9]. In aerosol drug delivery, high droplet dispersion is necessary to ensure rapid and uniform penetration of the drug into the body, and high aerosol production allows for the delivery of the required amount of medication in a short period of time [10].
One innovative spraying method is ultrasonic spraying, which uses ultrasonic vibrations to create fine droplets of liquid. Ultrasonic liquid atomization is widely used in various applications (medical inhalers, reactors, dryers, powder atomization, etc. [11,12]). The advantage of this method is the stable and predictable relationship between operating parameters, spraying speed, and droplet diameter [13,14]. Additionally, ultrasonic spraying results in the narrowest droplet size distribution compared to other spraying methods. However, the downside of using ultrasonic spraying is low productivity, and the higher the droplet dispersion, the lower the productivity of droplet creation [15]. For example, when generating droplets with a diameter of up to 10 μm, productivity can be as low as 0.1 mL/(s∙cm2).
On the other hand, hydraulic spraying makes it possible to obtain an aerosol with high productivity (tens of mL/s). However, with this spraying method, the droplet dispersion is low, and the higher the productivity, the lower the droplet dispersion (for example, 1000 microns at 25 L/min). Although many combined spraying methods have been created [1], no attempts have been made to combine ultrasonic and hydraulic spraying. This may be due to the complexity of organizing such spraying and the physical processes accompanying it.
We propose a model scheme for the design of an acoustic-hydraulic nozzle with the goals of combining the advantages of acoustic and hydraulic spray methods and achieving high droplet dispersion with high productivity.
The purpose of this work is to experimentally and theoretically study acoustic-hydraulic spraying to obtain a fine spray with high productivity. Our tasks are to determine the spraying mechanisms, conditions, and operating parameters of an acoustic-hydraulic nozzle depending on the conditions and physical and chemical properties of the liquid.

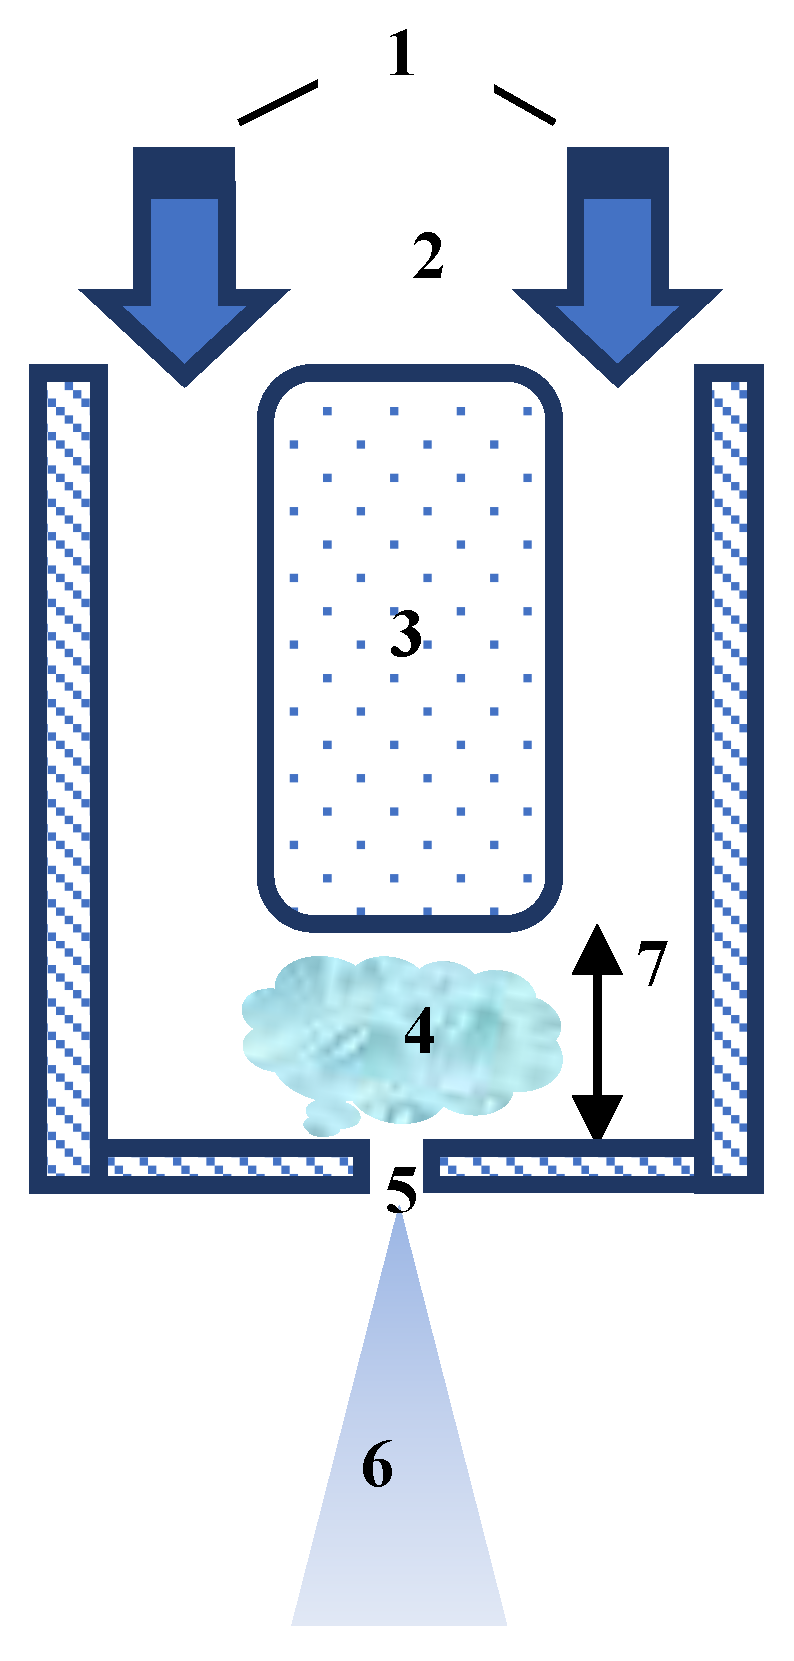
2. Materials and Methods

We considered the following design of an acoustic-hydraulic nozzle (Figure 1). In direction 1, liquid is supplied to cylindrical tube 2 under pressure p. The ultrasonic emitter 3 with flat oscillating surface oscillates along the axis of the tube. In zone 4, the liquid cavitates under the influence of ultrasonic radiation and flows out of outlet 5 in the form of a spray of drops 6. The outlet is located opposite the end surface of the emitter at a distance of 7.
The main geometric parameters of the nozzle used in the calculations:
  • The area of the end part of the ultrasonic emitter 3—S1;
  • The area of the outlet 5—S2;
  • The cross-sectional area of the tube 2—S3;
  • The height of the cavitation zone (distance from the surface of emitter to the outlet) 7—L.
Using a nozzle, we sprayed the settled tap water. Water contains a small amount of impurities (hardness salts). Droplet size was measured using a Spraytec instrument (Malvern Instruments, Malvern, UK). The operating principle of the measuring system was based on laser diffraction. The Spraytec system allowed us to measure particle dispersion with a frequency of up to 10 kHz in the range from 0.1 to 2000 microns with an accuracy better than ±1%. Particle size calculations were performed using a proprietary multiple scattering analysis algorithm. An example of a histogram and statistical characteristics of the particle size distribution obtained using the Spraytec system is shown in Figure 2. Statistical data measured using Spraytec system for different pressure values at an intensity of 70 W/cm2 are shown in the Supplementary Materials (Figures S1–S8).
The experimental setup scheme is shown in Figure 3a. Figure 3b shows the operation of the experimental setup.
The operating pressure range of the sprayed liquid was 2–9 bar, the radiation intensity was up to 100 W/cm2 (the maximum amplitude of ultrasonic vibrations was up to 40 μm).
To describe the mechanisms of sputtering and the physical processes occurring during this process, we used mathematical modeling methods.

3. Mathematical Model of the Acoustic-Hydraulic Nozzle

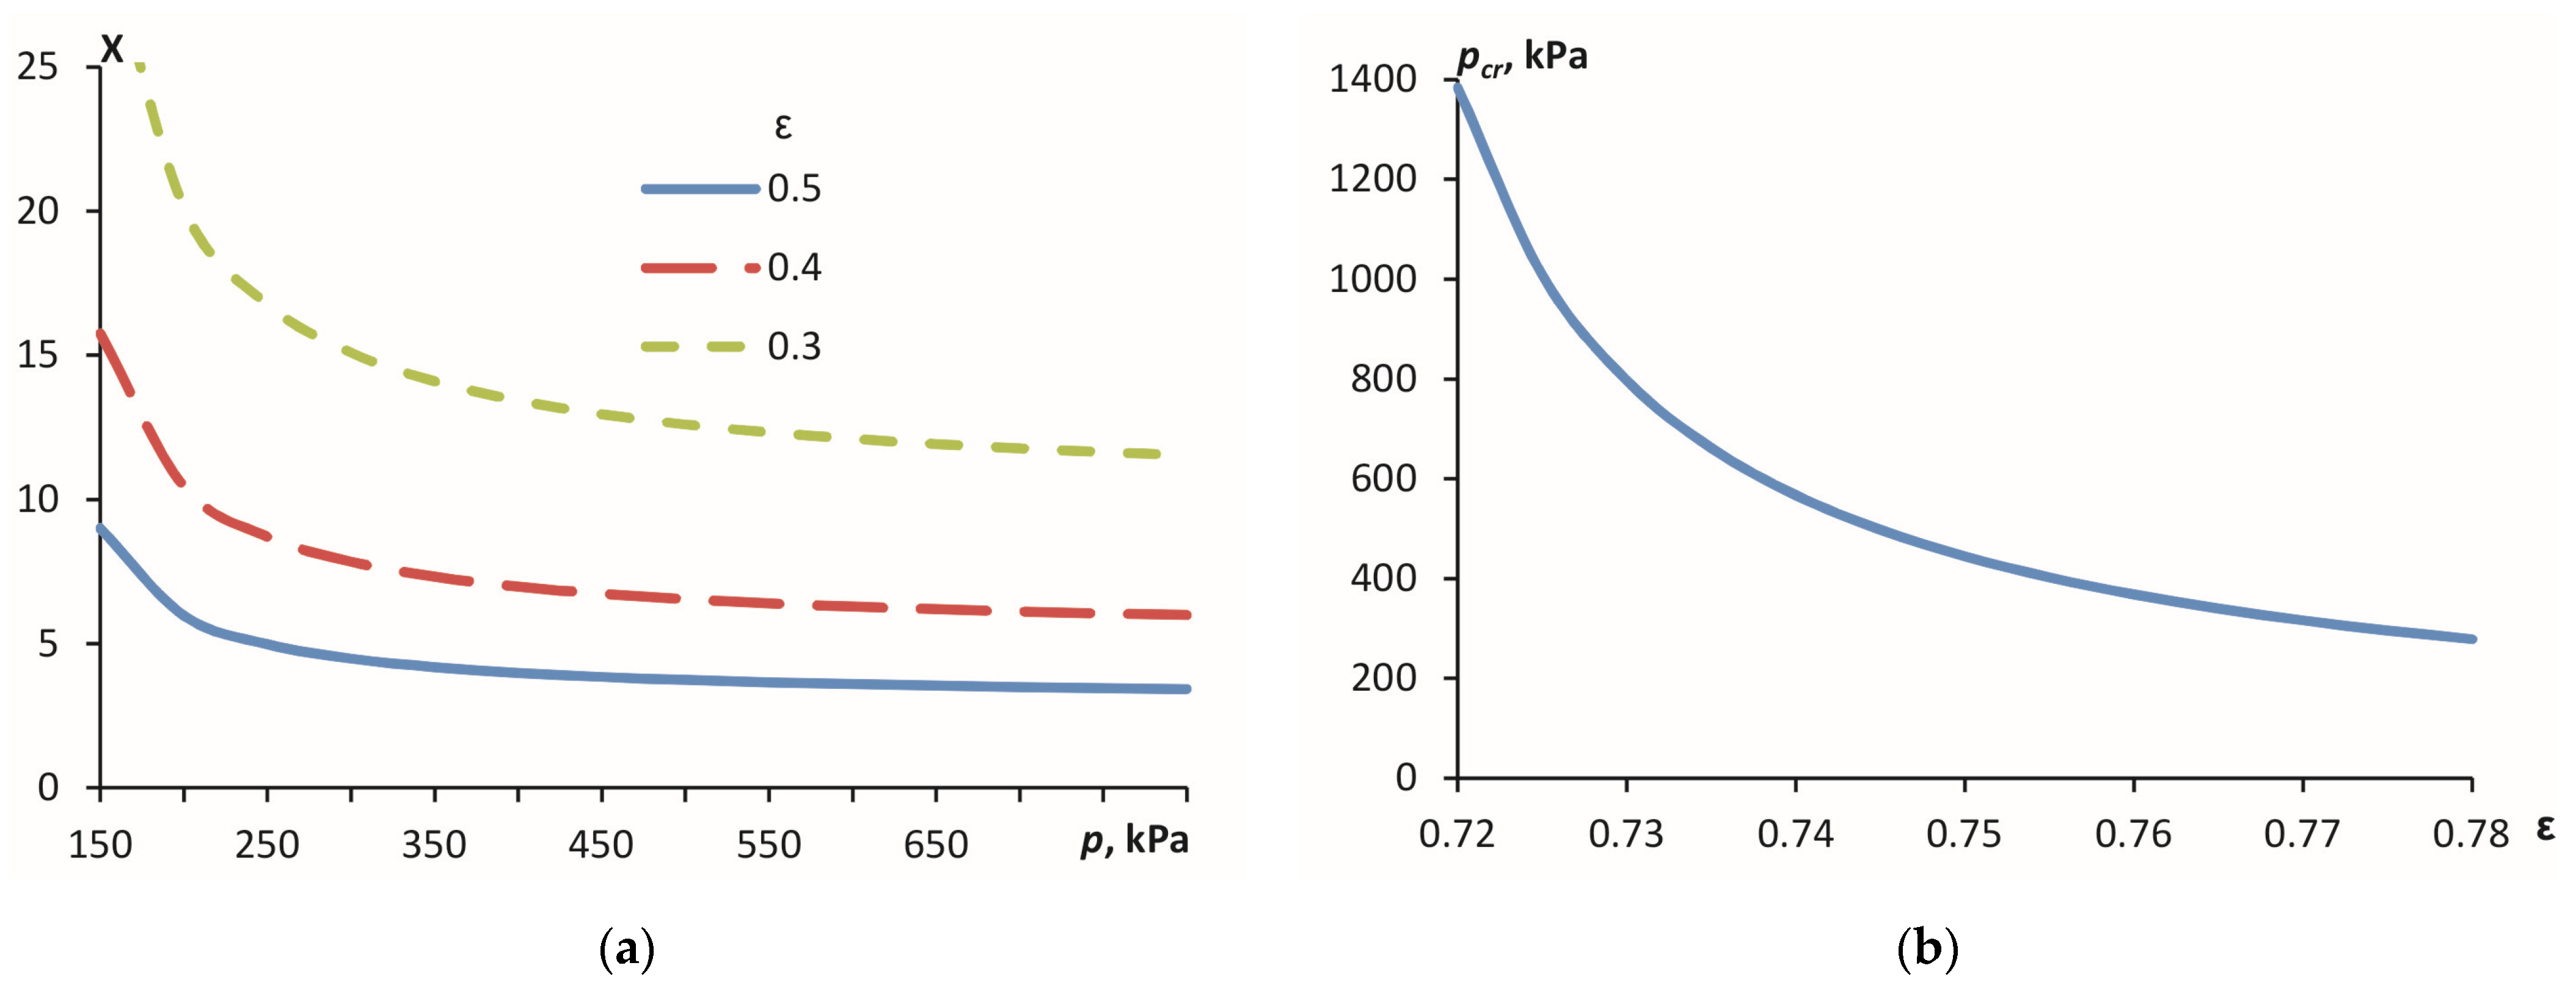
3.1. Hydrodynamic Processes:Hydrodynamic Cavitation Threshold

In the system under consideration, processes occurred that involved the movement of fluid under the influence of hydrostatic pressure and ultrasonic vibrations. Under certain conditions, both hydrodynamic cavitation and ultrasonic cavitation processes can occur. These conditions are as follows.
The hydrodynamic cavitation threshold occurs at a certain fluid supply pressure:
X = ( p p s ) ( 1 ε 2 ) ε 2 ( p p a ) 1 ,
where p is the hydrostatic pressure of the liquid flow, ps is the vapor pressure of the liquid, pa is the atmospheric pressure, ε = S2/S1, S1 is the cross-sectional area of the cavitation zone, and S2 is the area of the outlet.
This expression was obtained by jointly solving the continuity equation and the Bernoulli equation in the inlet section into the cavitation zone:
V x = 2 ( p p a ) ρ ( 1 ε 2 ) , V 1 = ε V x .
where V1 is the flow velocity in the cavitation zone, Vx is the flow velocity after the outflow, and ρ is the density of the liquid.
The hydrodynamic cavitation number is defined as X = 2 ( p p s ) ρ V 1 2 [16]. For X > 1, the flow regime is pre-cavitation; for X < 1, developed cavitation is observed. From Equation (1) we obtain the cavitation pressure threshold:
p c r = p a ξ p s ξ 1 ,
where ξ = ε 2 1 ε 2 . At pressures above pcr, hydrodynamic cavitation occurs.
It should be noted that the pressure p1 in the cavitation zone differs from the liquid pressure at the inlet to the structure p. By solving the system of continuity and Bernoulli equations in two sections—at the entrance and exit to the cavitation zone—we obtain an expression for the pressure in the cavitation zone:
p 1 = p + ξ ( p p a ) ( ( S 1 S 0 ) 2 1 ) ,
where S0 = S3S1 is the cross-sectional area of the annular part of the structure (flow area before entering the cavitation zone).
The volumetric flow rate of the liquid is expressed by the equation:
Q = V x S 2 = S 2 2 ( p - p a ) ρ ( 1 ε 2 ) .
We will evaluate the performance of the nozzle under consideration in accordance with expression (5).

3.2. Ultrasonic Exposure: Acoustic Cavitation Threshold

In the cavitation zone of the structure, between the end of the emitter and the outlet, conditions for the development of cavitation were created. Even with a low intensity of ultrasonic exposure, bubbles filled with water vapor appear in the liquid in this area. The size of the bubbles depends significantly on the intensity of the sound field:
D c 2 ω I ρ c .
This expression is obtained from the following considerations. The amplitude of the displacement of liquid particles in a sound wave A is related to the ultrasound intensity I [W/m2], the speed of sound c, and the frequency ω by the known relationship: I = A 2 ω 2 c ρ 2 [17]. When a wave passes through a liquid in the unloading phase, discontinuities of size A are formed in it, and in the compression phase, gas bubbles with a diameter Dc are formed at the site of these discontinuities. The diameter of the cavitation bubble corresponds to the size of the gap A.
From Equation (6), it follows that the higher the ultrasound intensity, the larger the diameter of the bubbles formed. In this case, with the development of cavitation, the wave resistance Wl = ρ·c decreases significantly in accordance with the increase in the volume fraction of vapors in the liquid [17], which means that the diameter of the bubbles also increases.
We consider the following qualitative physical picture of the development of cavitation. At a minimum intensity of ultrasound of Imin in the liquid volume, cavitation bubbles in the amount of N0 are formed on existing inhomogeneities (cavitation nuclei), which, in accordance with Equation (6), will have a minimum size of ~Imin1/2. Their number does not increase with increasing intensity, but their size, and, accordingly, volume gradually increase. The mode of developed cavitation occurs when a certain bubble size Dcr is reached. In this case, the volume of bubbles Wg becomes comparable to the volume of liquid Ww, and the continuity of the medium is disrupted. In the mode of developed cavitation, as confirmed experimentally, the cavitation coefficient K = Wg/Ww remains unchanged and corresponds to approximately 0.2 ÷ 0.3 [18]. This limit is probably determined by the strength properties of the liquid. The volume of liquid in our case is determined as Ww = S1·L. If the ultrasound intensity increases further, the size of the bubbles will continue to increase and their number will decrease. We denote the intensity corresponding to the mode of developed cavitation as Icr. We will define this regime as critical and find the conditions for its occurrence.
With a further increase in intensity at a constant total volume of bubbles, their number N decreases in accordance with a power law with an exponent of 3/2. This means that the number of bubbles drops quickly at first and then more gradually. We can conditionally select an intensity value Imax such that the change in the number of bubbles relative to the change in intensity is small. That is, a further increase in intensity practically does not affect the number of bubbles in the liquid. It can be shown that the bubble diameter in this regime will be approximately e times greater than Dcr, and the intensity Imax ~ eIcr.
The above considerations correspond to the case of the absence of excess hydrostatic pressure in the liquid. The size of the bubbles, of course, also depends on the pressure in the liquid. According to the Boyle-Mariotte law:
D c 3 ~ 1 p .
Thus, the critical volume of bubbles will be proportional to the ratio of the critical value of intensity to the power of 3/2 and pressure:
D c r 3 ~ I c r 3 / 2 p .
This means that, depending on the hydrostatic pressure, a noticeable cavitation effect from ultrasonic exposure will be observed at different values of ultrasound intensity: the higher the pressure, the higher the ultrasound intensity required for developed cavitation and vice versa.
As follows from dependencies (6) and (7), the diameter of the cavitation bubble is proportional to the square root of the ultrasound intensity and inversely proportional to the ultrasound frequency and the cube root of the hydrostatic pressure:
D c = 2 ω p a p 3 I ρ c .
We will consider the critical diameter Dcr to be a free parameter of the model. In accordance with it, at a given hydrostatic pressure, the critical (threshold) intensity of developed cavitation is determined:
I c r = D c r 2 ω 2 ρ c 4 ( p p a ) 2 / 3 .
Note that, in accordance with Equation (10), the critical intensity will be proportional to the hydrostatic pressure to the power of 2/3. The higher the pressure in the liquid, the higher the required ultrasound intensity for the onset of developed cavitation.
The number of bubbles will be determined as the ratio of the gas volume to the volume of one bubble, calculated according to formula (9):
N = 4 W g π D 3 = K W w 2 π ( p p a ) ω 3 ( ρ c ) 3 / 2 I 3 / 2 .
As will be shown below, the size of the droplets depends significantly on the size of the bubbles and their number.

3.3. Droplet Size upon Expiration of Cavitated Liquid

What happens to the bubble after its nucleation? As shown in [18], under conditions of continuous flow, cavitation bubbles do not collapse, but only grow.
It can be assumed that when the cavitated liquid flows into the atmosphere, each bubble will carry with it a layer of liquid, inversely proportional to the number of bubbles: Ww/N. This volume will determine the maximum volume of the drop. Then, taking into account Equations (9) and (11), its diameter is:
D 0 = 2 ω p a K p 3 I ρ c = D c K 3 .
Thus, the maximum droplet diameter is 1.5–1.7 times larger than the diameter of the cavitation bubble. This model does not take into account the surface energy of the liquid carried by the cavitation bubble. On the other hand, a gas bubble surrounded by liquid, when exposed to atmospheric pressure, will behave like a soap bubble. It will expand to a certain maximum size, determined by surface tension forces, and only then will it collapse into fragments with sizes on the order of the thickness of the liquid layer at that moment [19]. Below we will describe this model in more detail.
Since the outflow occurs quickly, the cavitation expansion can be considered adiabatic:
D max D c = ( p p min ) 1 3 γ ,
where γ is the adiabatic index of liquid vapor, pmin is the minimum pressure in the bubble at the moment of destruction, and Dmax is the maximum diameter of the bubble before destruction.
The moment of bubble destruction can be explained using the principle of energy correlation of bubble surface, as in [20] where the potential collapse mechanism of foam was explained. The bubble expands as long as the surface energy of the liquid layer σ·Sc is greater than the internal energy of the vapor inside it pminWc, where Wc is the volume of the cavitation bubble, Sc is its surface, and σ is the surface tension. When these energies become equal, it will collapse. From here, we obtain the minimum pressure in the bubble at the moment of destruction:
p min = 6 σ D max .
Solving Equations (9), (13) and (14) together, we obtain the value of the bubble diameter before destruction:
D max = ( p 6 σ ) 1 3 γ 1 D c 3 γ 3 γ 1 .
The volume of liquid that the bubble carried with it is π D 0 3 6 , where the diameter D0 is determined by expression (12). We denote the outer diameter of the bubble before destruction by Dend. Then from the law of conservation of mass it follows: D 0 3 D c 3 = D e n d 3 D max 3 . From here,
D e n d = D max 3 + D c 3 ( 1 / K 3 1 ) 3 .
It can be assumed that the minimum droplet size will be equal to the thickness of the liquid layer upon destruction of the cavitation bubble. The thickness of the water layer at the moment of destruction, and therefore the size of the droplets, will be Ddrop = (DendDmax)/2. Or, taking into account Equation (13):
D d r o p = k ( D max 3 + D c 3 ( 1 / K 3 1 ) 3 D max ) / 2 .
A joint solution of Equations (9), (15) and (17) will give an estimate of the minimum size of droplets formed during spraying, depending on the characteristics of ultrasonic influence, pressure, and properties of the liquid. Analysis of these equations shows that the process of disintegration of cavitation bubbles in the air and the formation of droplets, as well as the size of the formed droplets, significantly depends on the intensity and frequency of ultrasound (9) and the surface tension of the liquid (15). Similar dependencies were found, for example, in the processes of foam destruction under ultrasonic standing wave [20].
In Equation (17), the coefficient k is introduced, which is a free parameter of the model. If k = 1, then Equation (17) gives a lower estimate for the droplet size. However, the size of all droplets will not be minimal; a spectrum of particle sizes up to the maximum D0 is realized.
Thus, we proposed a mathematical model of the processes occurring in an acoustic-hydraulic nozzle and theoretically determined the critical modes, productivity, and droplet size of the resulting aerosol. The model has two free parameters that need to be determined experimentally—Dcr and k. If our reasoning is correct, then the experimental dependencies will have a character corresponding to that described theoretically, including the critical nature of spaying.

4. Results and Discussion

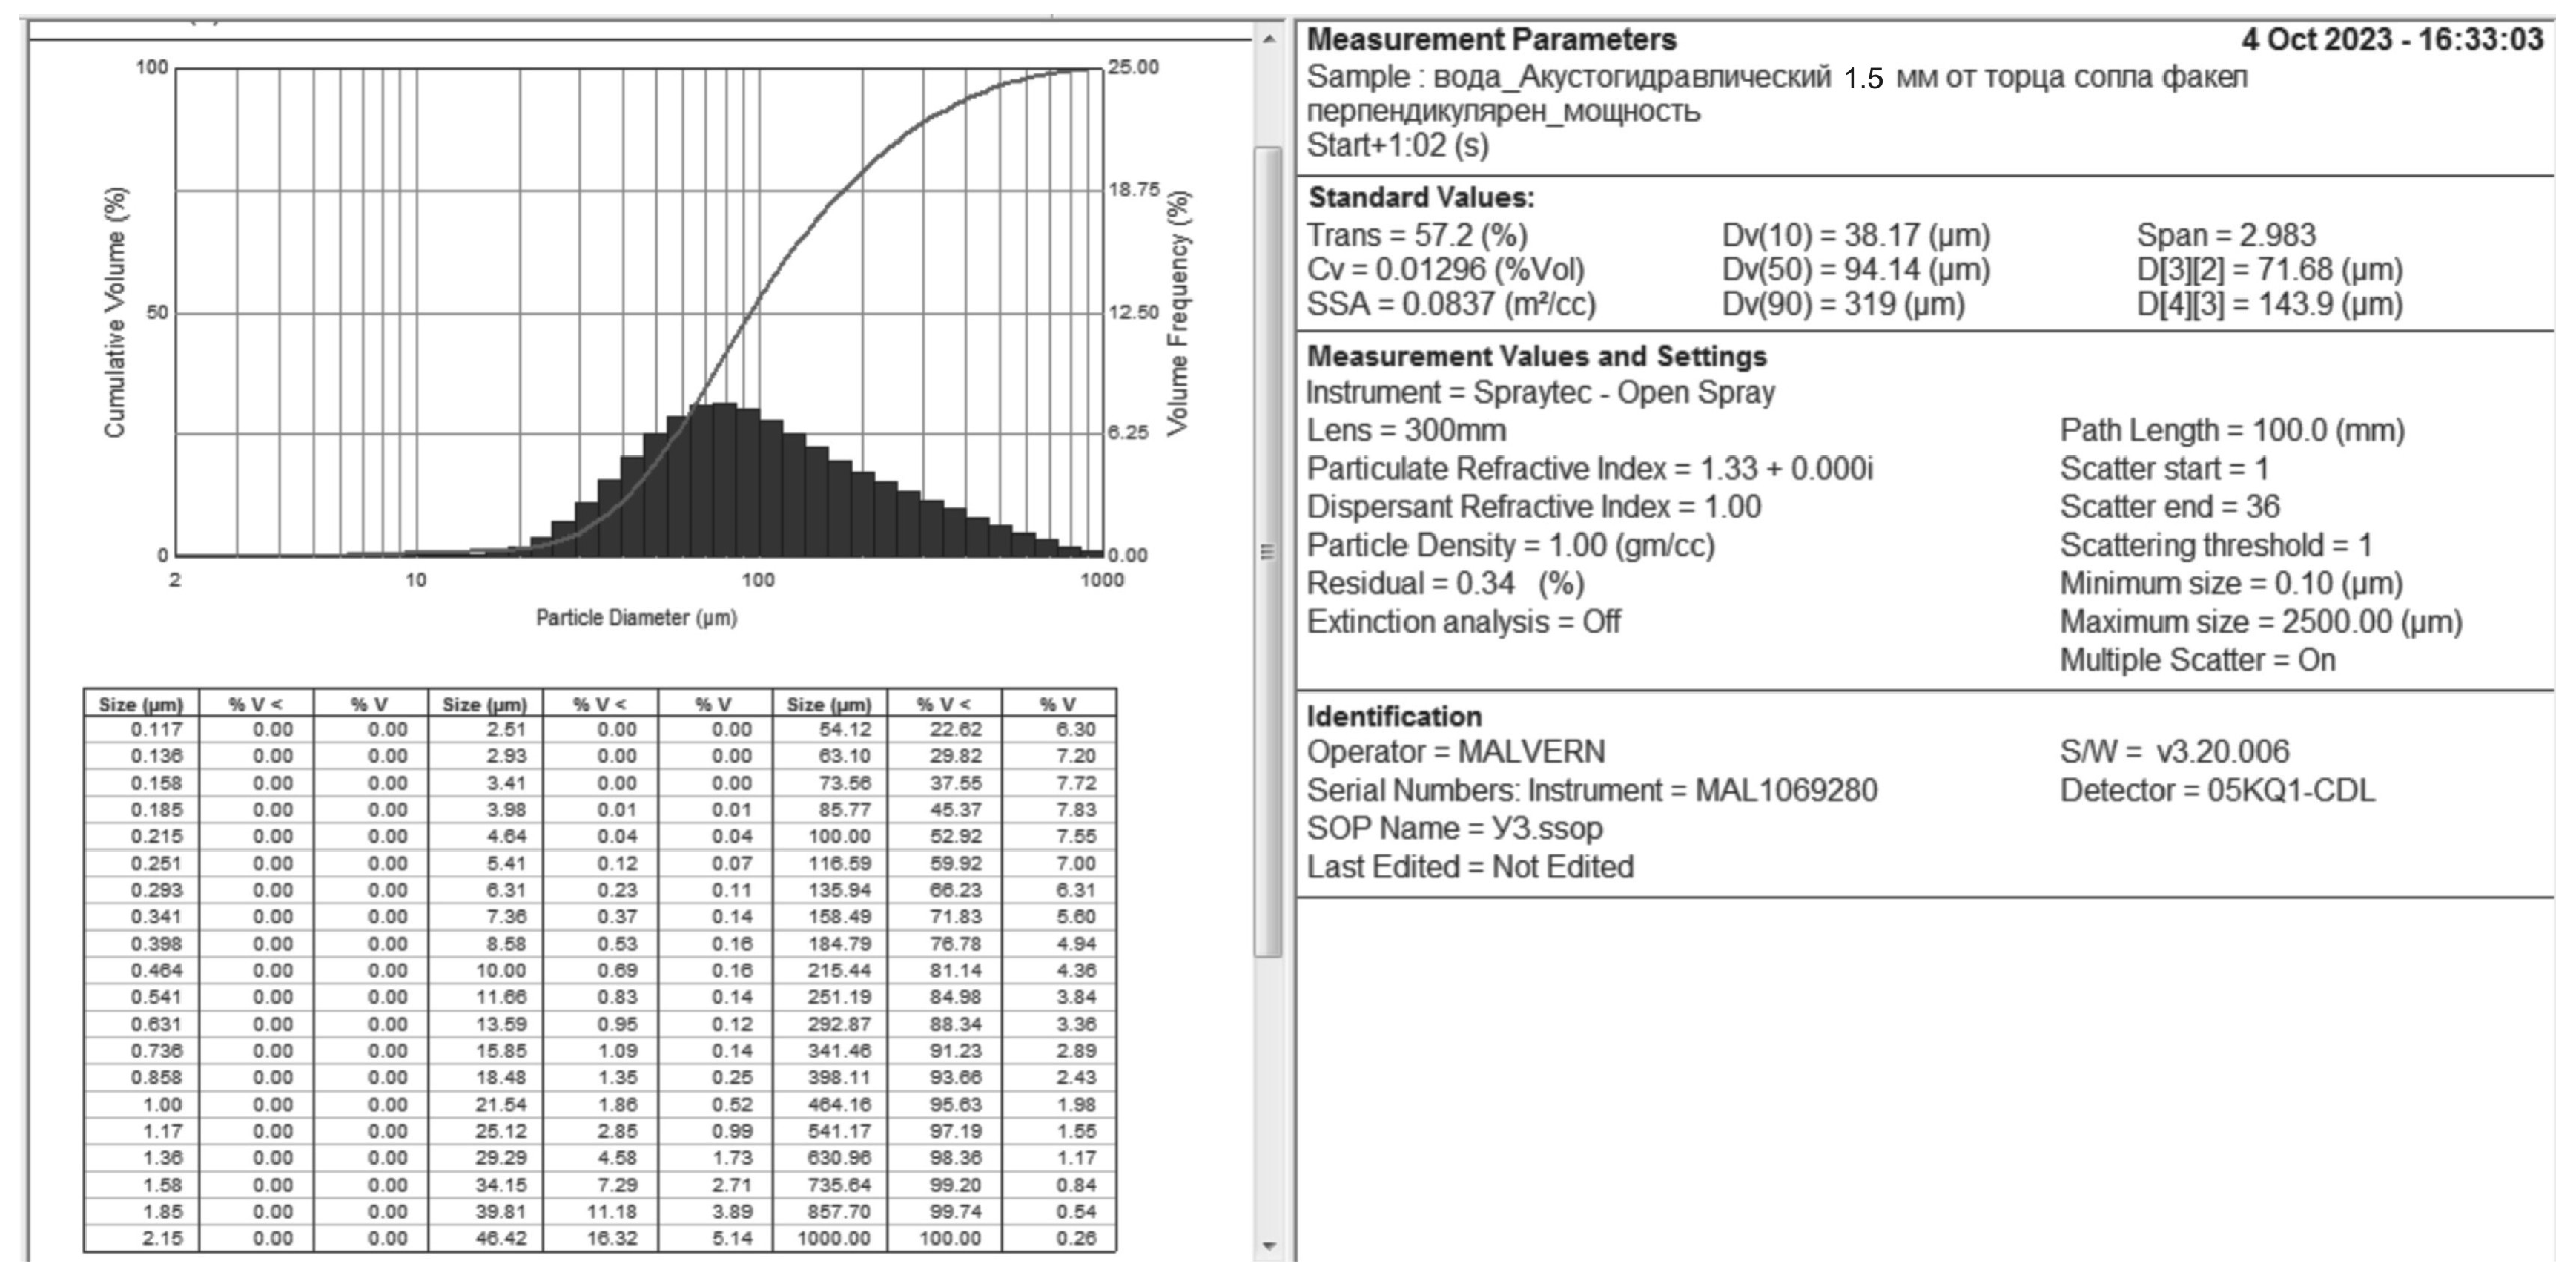
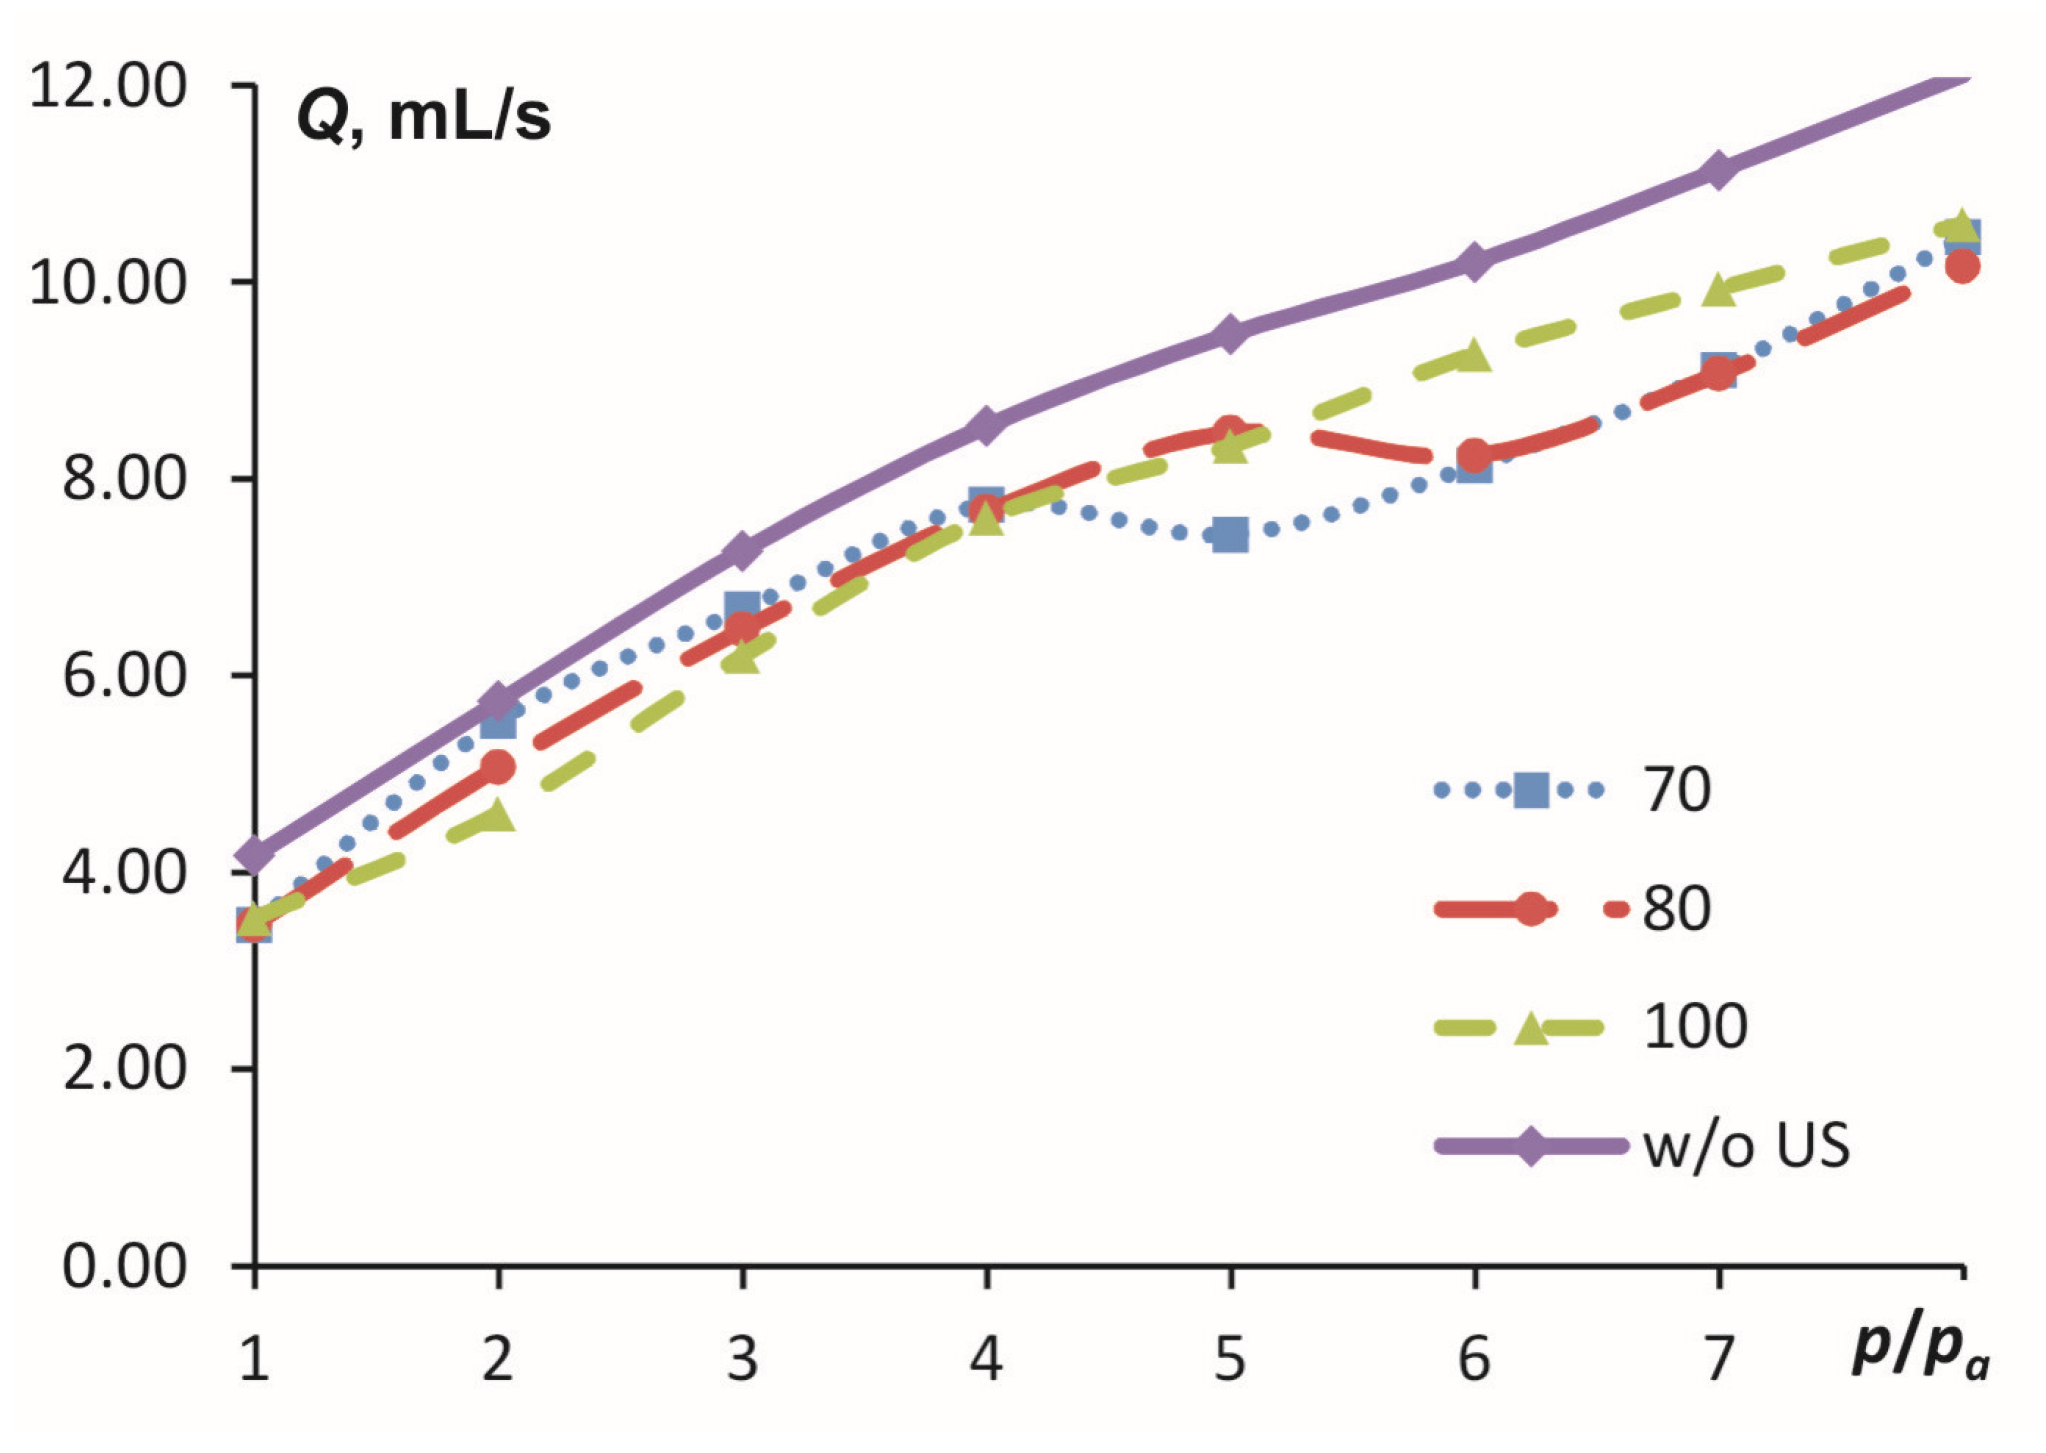
4.1. Experimental Results: Droplet Sizes, Critical Spraying Mode

The geometric parameters of the nozzle used in the experiment were as follows:
  • Outlet area S1 = 0.38 mm2;
  • Area of the cavitation zone S2 = 50 mm2;
  • Cross-sectional area of the tube S3 = 78.5 mm2;
  • Height of the cavitation zone L = 1.5 cm.
The frequency of ultrasonic radiation was ω = 22.5 kHz, the intensity varied in the range from 30 to 100 W/cm2, and the hydraulic pressure p was from 200 kPa to 900 kPa.
At a fixed intensity, the following picture was observed with increasing pressure. Up to a certain pressure pcr, the resulting droplets were relatively large in size (hundreds of micrometers), then the droplet size decreased significantly and remained approximately constant with further increases in pressure (Table 1). This spraying mode corresponds to cavitation flow and was established at pressure pcr and intensity Icr. The critical values of the intensity Icr depending on the pressure are given in Table 2. With increasing intensity, the critical pressure pcr of the transition to the cavitation mode becomes higher, and vice versa, with increasing pressure, a higher intensity of the transition to the cavitation mode is required.
It should be noted that in the absence of ultrasound, the characteristic droplet size is of the order of 500 μm and higher in a given pressure range.
The productivity (volume flow rate) of the liquid increased with pressure in all experiments, however, when passing through the critical point (pcr, Icr), the nature of the growth changed (Figure 4). In any case, spraying without the use of ultrasound occurred at a slightly higher speed than with ultrasound (curve “w/o US” in Figure 4).
Apparently, the decrease in flow rate is associated with an increase in the hydraulic resistance of the nozzle, due to the large volume of cavitation bubbles in the mode of developed cavitation.

4.2. Calculation Results: Comparison of Theoretical and Experimental Results

4.2.1. Possibility of Hydrodynamic Cavitation

Figure 5a shows the dependence of the cavitation number on pressure for different values of the geometric parameter ε, and Figure 5b shows the dependence of the critical pressure, above which cavitation mode may occur in the structure under consideration.
Based on the conditions of the problem, our design did not implement the hydrodynamic cavitation mode, since the parameter ε = 0.005 was significantly less than those for which cavitation is possible at relatively low pressures. However, when implementing a design approaching the threshold of hydraulic cavitation, new effects may arise that require further research. Perhaps the addition of hydrodynamic cavitation to acoustic cavitation will contribute to an even greater increase in dispersion than we observed in our case.
The volumetric flow rate of liquid in the nozzle is shown in Figure 6. It should be noted that the geometric parameter does not have a significant effect on the flow rate. The above calculation does not take into account ultrasonic influence. As can be seen from the experiment (Figure 4) and will be shown theoretically below, ultrasonic action reduces the outflow velocity and volume flow, but only slightly.
In any case, the use of hydrodynamic spraying in our combined method allowed us to achieve fairly high productivity with increasing pressure.

4.2.2. Ultrasonic Cavitation

Figure 7 shows the dependence of the diameter of cavitation bubbles on pressure and frequency of exposure at different intensity values.
With increasing pressure, the size of the bubbles decreases in accordance with Equation (9). Also, the size of the bubbles decreases with increasing frequency of exposure, but increases with increasing intensity. According to the mathematical model described above, the size of the bubbles is the determining factor in the formation of droplets.
The free parameter of the problem is Dcr. When compared with experimental data, it was found that its value is approximately 30 µm. Figure 8 shows the dependence of the critical intensity of ultrasonic exposure, calculated in accordance with Equation (10) together with experimental values (Table 2).

4.2.3. Droplet Size

The main achievement of mathematical modeling was the prediction of the critical (threshold) nature of droplet formation. The droplet size calculated in accordance with Equation (17) (free parameter k = 300) is shown in Figure 9.
Figure 9 demonstrates the critical nature of the occurring phenomena. Upon transition to the cavitation outflow mode, the droplet size becomes minimal (and with a further increase in pressure or intensity, it only slightly increases).
A couple of process control parameters are fluid pressure and ultrasound intensity. At certain values of these parameters, the spraying transitions to cavitation mode. In this case, the droplet size becomes minimal and practically does not change with a further increase in pressure or intensity. Thus, to achieve a minimum droplet size, it is sufficient to increase the intensity at a given pressure or the pressure at a given intensity to threshold values, and not increase further.
In accordance with Equation (10), the critical intensity is proportional to the hydrostatic pressure to the power of 2/3. In this case, the critical conditions in terms of pressure and intensity correspond to the observed ones: the higher the pressure, the higher the intensity required for the transition to the cavitation outflow regime, and vice versa. Therefore, the critical point in Figure 9a shifts to the right with increasing intensity, and in Figure 9b it shifts to the right with increasing pressure.
The free model parameter k = 300 (Equation (17)) was chosen based on comparison with the experiment. The physical meaning of this coefficient is the excess of the characteristic size of an ensemble of droplets over the minimum possible size calculated in accordance with the “soap bubble” destruction model. Figure 10 shows experimental points (Table 1) and calculated curves for droplet size.
The figure demonstrates the transition of spraying to cavitation mode, which is confirmed both theoretically and experimentally. This occurs when critical values for pressure and intensity are reached in accordance with Equation (10). It should be noted that there is no exact coincidence of the calculation results with the experiment (and such a goal was not set), since the experimental value of the droplet size is a statistical characteristic of the droplet size distribution (Sauter diameter), and the calculation uses a certain theoretical characteristic droplet size, and not the distribution by size.
The size of droplets during ultrasonic spraying using the capillary wave mechanism is estimated using Lang’s equation [21]:
d u s = 0.34 8 π σ ρ ω 2 3 .
Thus, the higher the frequency, the smaller the droplet. With the classic method of ultrasonic spraying, the droplet size at a frequency of 22.5 kHz, the Sauter mean diameter of the droplets is D32 = 100…120 µm. Moreover, the 22.5 kHz frequency used in our design is energetically more favorable than higher frequencies.
When spraying with hydraulic nozzles, the size of the droplets depends on the liquid pressure in the nozzle: the higher the pressure, the smaller the droplets. On the other hand, the flow rate (or volumetric flow rate) of the liquid is important: the lower the flow rate, the higher the dispersion [22]. The corresponding empirical formulas depend on the fundamental design of the nozzle, but at a pressure of 8…9 atm and a volume flow rate of 10…12 mL/s, the droplet diameter does not decrease less than 100…150 µm (at lower pressure values, the droplet size is significantly larger). In our design of an acoustic-hydraulic nozzle, when switching to cavitation mode, a finer spray was achieved (D32 < 50 µm) with a productivity almost equal to that of a hydraulic nozzle. Figure 11 shows the calculated and experimental dependences of the volumetric flow rate of liquid at two intensity levels and in the absence of ultrasonic influence.
As can be seen from the figure, both theory and experiment show the critical nature of the flow depending on pressure and ultrasound intensity. During the transition to the cavitation mode, the volume flow rate decreases, and then the flow rate increases again with pressure. At the same time, the reduction in flow rate in cavitation mode compared to the case of the absence of ultrasonic influence is not significant (5–10%). Meanwhile, in the cavitation mode, the dispersion of droplets is significantly higher compared to hydraulic spraying.

5. Conclusions

The development of new liquid atomization devices and methods that can produce a fine spray at high throughput is of significant interest for various technological applications. For example, high dispersion together with high productivity of aerosol creation are required in the technological processes of aerosol drying, aerosol coating, surface treatment, and spraying of drugs.
In this study, we proposed and investigated a new design of an acoustic-hydraulic nozzle that combines the benefits of the hydraulic spray method (high productivity) and ultrasonic spraying (high droplet dispersion). The proposed theoretical model was validated through experimental data, and we identified critical conditions for intensity and pressure, which are the controlling parameters of the device. These conditions enable the implementation of the cavitation spray mode and achieve the desired process characteristics.
Our results demonstrate that the proposed design can achieve droplet sizes of less than 50 microns with a productivity of about 5–10 mL/s at an exposure frequency of 22.5 kHz when creating conditions of cavitation spraying. Such a small droplet size at the used ultrasonic frequency of 22.5 kHz and the achieved spraying productivity is not attainable by either ultrasonic or hydraulic spraying methods separately, as demonstrated theoretically and experimentally.
Overall, our findings suggest that the acoustic-hydraulic nozzle has significant potential in various technological applications that require high-throughput, fine spray production. Further improvement of the proposed method will concern the optimization of spray conditions for different liquids differing in viscosity, density, and surface tension. Also, the case of the presence of hydrodynamic cavitation along with acoustic cavitation has not yet been studied. This mode can occur when the geometric characteristics of the nozzle are changed in order to increase the performance of the nozzle. In general, further parametric study of the acoustic-hydraulic nozzle may open up new prospects for the use of the proposed method.

Supplementary Materials

The following supporting information can be downloaded at: https://www.mdpi.com/article/10.3390/app132212330/s1, Figure S1: Statistical characteristics of the particle size distribution for p = 200 kPa. Figure S2: Statistical characteristics of the particle size distribution for p = 300 kPa. Figure S3: Statistical characteristics of the particle size distribution for p = 400 kPa. Figure S4: Statistical characteristics of the particle size distribution for p = 500 kPa. Figure S5: Statistical characteristics of the particle size distribution for p = 600 kPa. Figure S6: Statistical characteristics of the particle size distribution for p = 700 kPa. Figure S7: Statistical characteristics of the particle size distribution for p = 800 kPa. Figure S8: Statistical characteristics of the particle size distribution for p = 900 kPa.

Author Contributions

Conceptualization, A.S. and O.K.; methodology, D.G.; investigation, R.D.; resources, S.T.; writing—original draft preparation, O.K.; writing—review and editing, supervision, A.S.; project administration, A.S.; funding acquisition, S.T. All authors have read and agreed to the published version of the manuscript.

Funding

This study was carried out with a grant from the Russian Science Foundation № 23-19-00875, https://rscf.ru/project/23-19-00875/ (accessed on 29 October 2023).

Institutional Review Board Statement

Not applicable.

Informed Consent Statement

Not applicable.

Data Availability Statement

Data is contained within the article or Supplementary Materials.

Conflicts of Interest

The authors declare no conflict of interest.

Nomenclature

Avibration amplitude (m)
csound speed (m/s)
D0diameter of the cavitation element (m)
D32Sauter diameter of droplets (m)
Dcdiameter of the bubbles (m)
Dcrcritical diameter of cavitation bubbles (m)
Ddropminimum diameter of the droplet (m)
Denddiameter of the cavitation element before destruction (m)
Dmaxmaximum diameter of the bubble before destruction (m)
Iultrasound intensity (W/m2)
Icrcritical intensity (W/m2)
kincreasing coefficient for droplet diameter
Lheight of the cavitation zone (m)
Nnumber of cavitation bubbles
phydrostatic pressure (Pa)
paatmospheric pressure (Pa)
pcrcavitation pressure threshold (Pa)
pminminimum pressure in the bubble (Pa)
psvapor pressure of the liquid (Pa)
Qvolumetric flow rate of the liquid (m3/s)
S1area of the end part of the ultrasonic emitter (m2)
S2area of the outlet (m2)
S3cross-sectional area of the tube (m2)
Scarea of the surface of cavitation bubble (m2)
V1flow velocity in the cavitation zone (m/s)
Vxflow velocity after the outflow (m/s)
Wcvolume of cavitation bubble (m3)
Wgvolume of gas (m3)
Wlwave resistance (kg/(m2·s)) =ρ·c
Wwvolume of liquid (m3)
Greek letters
γadiabatic index of liquid vapor
εS2/S1
ρliquid density (kg/m3)
σliquid surface tension (N/m)
ωultrasound frequency (Hz)
Dimensionless numbers
Kcavitation coefficient
Xhydrodynamic cavitation threshold

References

  1. Vasilyev, Y.A.; Domrina, E.S.; Kaufman, S.V.; Maiorova, A.I. Classification of atomization devices. J. Phys. Conf. Ser. 2019, s1359, 012131. [Google Scholar] [CrossRef]
  2. Gong, J.; Fan, W.; Peng, J. Application analysis of hydraulic nozzle and rotary atomization sprayer on plant protection UAV. Int. J. Precis. Agric. Aviat. 2019, 2, 25–29. [Google Scholar] [CrossRef]
  3. Inoue, C.; Watanabe, T.; Himeno, T. Liquid sheet dynamics and primary breakup characteristics at impingement type injector. In Proceedings of the 45th AIAA/ASME/SAE/ASEE Joint Propulsion Conference & Exhibit, Denver, CO, USA, 2–5 August 2009; p. 5041. [Google Scholar] [CrossRef]
  4. Moiz, A.A.; Naber, J.; Lee, S.Y.; Barros, S.; Atkinson, W. High-Speed Spray-to-Spray Collision Study on Two-Hole Impinging Jet Nozzles; SAE Technical Paper 2015-01-0948; SAE International: Warrendale, PA, USA, 2015. [Google Scholar] [CrossRef]
  5. Wang, P.; Yang, W. Pneumatic rotary nozzle structure optimization design and airflow characteristics analysis. Adv. Mech. Eng. 2023, 15, 16878132231195016. [Google Scholar] [CrossRef]
  6. Lefebvre, A.H.; McDonell, V.G. Atomization and Sprays; CRC Press: Boca Raton, FL, USA, 2017. [Google Scholar]
  7. Nandiyanto, A.B.D.; Okuyama, K. Progress in developing spray-drying methods for the production of controlled morphology particles: From the nanometer to submicrometer size ranges. Adv. Powder Technol. 2011, 22, 1–19. [Google Scholar] [CrossRef]
  8. Hanft, D.; Exner, J.; Schubert, M.; Stöcker, T.; Fuierer, P.; Moos, R. An overview of the aerosol deposition method: Process fundamentals and new trends in materials applications. J. Ceram. Sci. Technol. 2015, 6, 147–182. [Google Scholar] [CrossRef]
  9. Schubert, M.; Hanft, D.; Nazarenus, T.; Exner, J.; Schubert, M.; Nieke, P.; Moos, R. Powder aerosol deposition method—Novel applications in the field of sensing and energy technology. Funct. Mater. Lett. 2019, 12, 1930005. [Google Scholar] [CrossRef]
  10. Dolovich, M.B.; Dhand, R. Aerosol drug delivery: Developments in device design and clinical use. Lancet 2011, 377, 1032–1045. [Google Scholar] [CrossRef] [PubMed]
  11. Gallego-Juárez, J.A.; Graff, K.F.; Lucas, M. (Eds.) Power Ultrasonics: Applications of High-Intensity Ultrasound; Woodhead Publishing: London, UK, 2023. [Google Scholar]
  12. Kustron, P.; Korzeniowski, M.; Sajbura, A.; Piwowarczyk, T.; Kaczynski, P.; Sokolowski, P. Development of High-Power Ultrasonic System Dedicated to Metal Powder Atomization. Appl. Sci. 2023, 13, 8984. [Google Scholar] [CrossRef]
  13. Guerra-Bravo, E.; Lee, H.-J.; Baltazar, A.; Loh, K.J. Vibration Analysis of a Piezoelectric Ultrasonic Atomizer to Control Atomization Rate. Appl. Sci. 2021, 11, 8350. [Google Scholar] [CrossRef]
  14. Ramisetty, K.A.; Pandit, A.B.; Gogate, P.R. Investigations into Ultrasound Induced Atomization. Ultrason. Sonochem. 2013, 20, 254–264. [Google Scholar] [CrossRef] [PubMed]
  15. Khmelev, V.N.; Shalunov, A.V.; Khmelev, S.S.; Tsyganok, S.N. Ultrasound. Devices and Technologies: Monograph; AltSTU Publishing House: Biysk, Russia, 2015. (In Russian) [Google Scholar]
  16. Brennen, C.E. Cavitation and Bubble Dynamics; Cambridge University Press: Cambridge, UK, 2014. [Google Scholar]
  17. Rosenberg, L.D. Physical Foundations of Ultrasonic Technology; Nauka: Moscow, Russia, 1970. (In Russian) [Google Scholar]
  18. Kedrinsky, V.K. Hydrodynamics of explosion. Appl. Mech. Tech. Phys. 1987, 28, 491–515. [Google Scholar] [CrossRef]
  19. Kudryashova, O.B.; Muravlev, E.V.; Vorozhtsov, B.I. Generation of a Fine Aerosol in a Cavitation Regime. J. Eng. Phys. Thermophys. 2020, 93, 1138–1146. [Google Scholar] [CrossRef]
  20. Wang, Z.H.; Liu, X.Y.; Zhang, H.Q.; Wang, Y.; Xu, Y.F.; Peng, B.L.; Liu, Y. Modeling of kinetic characteristics of alkaline-surfactant-polymer-strengthened foams decay under ultrasonic standing wave. Petrol. Sci. 2020, 19, 1825–1839. [Google Scholar] [CrossRef]
  21. Lang, R.J. Ultrasonic atomization of liquids. J. Acoustic. Soc. Am. 1962, 34, 6–8. [Google Scholar] [CrossRef]
  22. Pages, D.G.; Galustov, V.S. Fundamentals of Liquid Spraying Technique; Chemistry: Moscow, Russia, 1984. (In Russian) [Google Scholar]
Figure 1. Acoustic-hydraulic nozzle scheme: 1—liquid supply direction, 2—cylindrical tube, 3—ultrasonic emitter, 4—cavitation zone, 5—outlet, 6—liquid drops, 7—cavitation zone height L.
Applsci 13 12330 g001
Figure 2. Example of a histogram and statistical characteristics of the particle size distribution formed using the developed nozzle (obtained using Spraytec).
Applsci 13 12330 g002
Figure 3. Scheme of the experimental setup (a) and operation of the experimental setup (b): 1—nozzle, 2—liquid drops, 3—laser probe beam (Spraytec), 4—laser beam source (Spraytec), 5—laser beam receiver (Spraytec). The nozzle is located 15 cm above the beam.
Applsci 13 12330 g003
Figure 4. Experimental dependence of volume flow Q on pressure p/pa and ultrasound intensity I.
Applsci 13 12330 g004
Figure 5. The number of hydrodynamic cavitation X depending on pressure p (a) and the dependence of the critical pressure pcr of hydrodynamic cavitation on the geometric parameter ε = S2/S1 (b).
Applsci 13 12330 g005
Figure 6. Volumetric fluid flow Q depending on pressure and geometric parameter ε = S2/S1.
Applsci 13 12330 g006
Figure 7. Dependence of the size of cavitation bubbles Dc on pressure p for different values of ultrasound intensity I ((a), frequency ω = 22.5 kHz) and frequency ω ((b), intensity I = 100 W/cm2).
Applsci 13 12330 g007
Figure 8. Critical ultrasound intensity Icr as a function of pressure p/pa for different values of the critical bubble size Dcr. The model calculation at Dcr = 30 µm most accurately describes the experimental points.
Applsci 13 12330 g008
Figure 9. Characteristic size of droplets Ddrop depending on pressure p/pa (a) and ultrasound intensity I (b).
Applsci 13 12330 g009
Figure 10. Experimental and calculated dependences of the characteristic droplet size Ddrop on the pressure p/pa for different levels of ultrasound intensity I.
Applsci 13 12330 g010
Figure 11. Volumetric flow rate of liquid Q: calculated curves and experimental points for two values of ultrasound intensity I.
Applsci 13 12330 g011
Table 1. Sauter mean diameter of liquid droplets D32 (µm) depending on pressure and ultrasound intensity.
p/pa 23456789
Icr, W/cm27019014612611171443942
802171391229873773528
Table 2. Critical pressure depending on ultrasound intensity.
p/pa23456789
Icr, W/cm2263149558286104112
Disclaimer/Publisher’s Note: The statements, opinions and data contained in all publications are solely those of the individual author(s) and contributor(s) and not of MDPI and/or the editor(s). MDPI and/or the editor(s) disclaim responsibility for any injury to people or property resulting from any ideas, methods, instructions or products referred to in the content.

