Article

Triaxial Test of Coarse-Grained Soils Reinforced with One Layer of Geogrid

by
Mindaugas Zakarka
*,
Šarūnas Skuodis
and
Neringa Dirgėlienė
Department of Reinforced Concrete Structures and Geotechnics, Vilnius Gediminas Technical University, LT-10223 Vilnius, Lithuania
*
Author to whom correspondence should be addressed.
Appl. Sci. 2023, 13(22), 12480; https://doi.org/10.3390/app132212480
Submission received: 22 October 2023 / Revised: 14 November 2023 / Accepted: 17 November 2023 / Published: 18 November 2023

Abstract

:
Geosynthetics play a pivotal role in modern infrastructure projects, with geogrids serving as a common choice for enhancing bearing capacity and reducing soil settlement in road construction. This study investigates the influence of density and uniformity coefficients on geogrid-reinforced sandy and gravelly soils through a series of consolidated drained triaxial tests. The research covers six distinct soil types from Lithuania, each characterized by particle size distribution analysis and classified using various standards. A polyester biaxial geogrid is employed, and test specimens are prepared with and without geogrid reinforcement. Triaxial compression tests are performed at different cell pressures, mirroring real-world conditions in road construction. The results highlight the critical role of cell pressure in the reinforcement effect, with higher pressures reducing the geogrid’s influence. The study also emphasizes the importance of soil type, as gravel soils consistently exhibit higher deviatoric stress than sandy soils. Notably, the geogrid enhances cohesion but reduces the angle of internal friction in most cases. Overall, this research provides valuable insights into the intricate interplay between soil properties, geogrid reinforcement, and cell pressure, shedding light on the mechanical behavior of geosynthetic-reinforced soils in road construction applications.

1. Introduction

Geosynthetics are widely employed in diverse infrastructure projects. While their initial applications were focused on soil reinforcement, separation, filtration, and drainage [1,2], geosynthetics have since found expanded utility. They are now employed in preventing asphalt cracks [3,4], addressing significant settlement concerns beneath pile-supported embankments [5], fabricating stone columns [6], constructing shallow strip foundations [7,8], protecting pipelines [9], and reducing CO2 [10], among other uses. In road infrastructure, geogrids are a common choice, specifically designed for enhancing load-bearing capacity and reducing soil settlement [11,12,13]. Although both functions involve mechanical improvements, the properties required to fulfill them are distinctively different [14].
Much research has been done to study the behavior of soil reinforced with geogrids using numerical simulation, analytical methods, laboratory experiments, and in situ experiments. While it has been acknowledged that different laboratory experiments can effectively replicate the behavior of soil and geogrids in specific components of embankments [15], a significant portion of these tests has been carried out using the direct shear apparatus [16]. These experiments encompass diverse aspects, such as different soil types, particle sizes, soil densities, and moisture contents [17,18,19,20,21], as well as variations in the type of geogrids, aperture sizes, and shapes [22,23,24,25]. An important parameter found to increase the reinforcement effect is the number of geogrid-reinforcement layers [26]. These studies have a shared objective: to obtain a precise understanding of how soil and geogrids interact, thus optimizing the effective use of geogrids [27]. In addition, the angle of internal friction and cohesion obtained during direct shear tests are used in modeling with software packages. The precision of the results is influenced by the reproduction of the stress applied to the sample [28], so tests with a triaxial pressure apparatus, during which it is possible to set the lateral pressure, have the advantage [29,30].
The change in the angle of internal friction, the change in cohesion, and the effect of geogrid reinforcement are the main properties obtained by the triaxial pressure apparatus tests for samples without geogrids and with geogrids [31]. The results obtained showed that the geogrid creates apparent cohesion and a small change in the angle of internal friction [32]. The effect of the geogrid is better reflected through the reinforcement effect, which is expressed as the ratio of the maximum deviatoric stress with the geogrid to the maximum deviatoric stress without the geogrid [33]. Obtained results depend on the type of soil, the type of geogrid, and the confining pressure at which the tests were carried out [34].
The type of soil significantly influences triaxial pressure tests, with the geogrid’s effectiveness tied to soil properties [35]. While most tests focus on coarse-grained soils for laboratory convenience, the influence of cohesive soils is also considered [36]. The following parameters affecting deviatoric strength are attributed to soil type: soil compaction, average particle size, and density [34]. Recent research has highlighted the influence of the uniformity coefficient on soil shear strength [37].
Geogrid selection is a critical factor in soil reinforcement. Even when geogrids share the same tensile strength, the mesh size influences the strength of the specimen [38]. Notably, whether biaxial or triaxial, geogrid variations do not impact the results of triaxial tests [39]. In laboratory testing, a specimen with a diameter of 100 mm and a height of 200 mm exhibited maximum strength parameters when the geogrid was positioned at 80% of the specimen’s height [40]. Experimental data reveal that geogrid-reinforcement coefficients increase with the number of geogrid layers. For geogrids used in embankment sites, it is recommended to maintain a separation of 20 cm between layers [28]. It is recommended to ensure that the optimal distance between geogrids does not exceed the diameter of the specimen [41]. Tests incorporating multiple geogrid layers simulate conditions found in bridge abutments [42]. This practice aims to replicate real-world scenarios, emphasizing that tests conducted with a large-scale triaxial device correspond closely to those performed under field conditions [43].
In geotechnical practice, it is common to apply high confining pressures, typically exceeding 100 kPa. However, it is essential to highlight a knowledge gap related to low confining pressures [44]. A comprehensive literature review indicated a more pronounced geogrid effect when lower pressures were applied to the samples [45]. The conducted studies have unveiled the intricate stresses generated by dynamic loads in road structures [46]. Hence, there is a critical need to analyze, calculate, and precisely select stress values within the structure, particularly in the context of a road embankment [47]. To address these considerations, the decision was made to employ static loads, aligning with the specifications outlined in standard documents. Subsequently, stress distribution analysis was conducted based on these static loads [48].
Based on these findings, the aim of the study is to conduct tests that closely simulate road construction conditions. Consolidated drained (CD) triaxial tests were carried out with small confining pressures of 20, 50, and 70 kPa, specifically calculated to replicate real-world road structures [48]. The primary objective is to investigate the influence of density and uniformity coefficient on cohesion, angle of internal friction, and the reinforcement effect for a single layer of geogrid-reinforced sandy and gravelly soils.

2. Experimental Setup
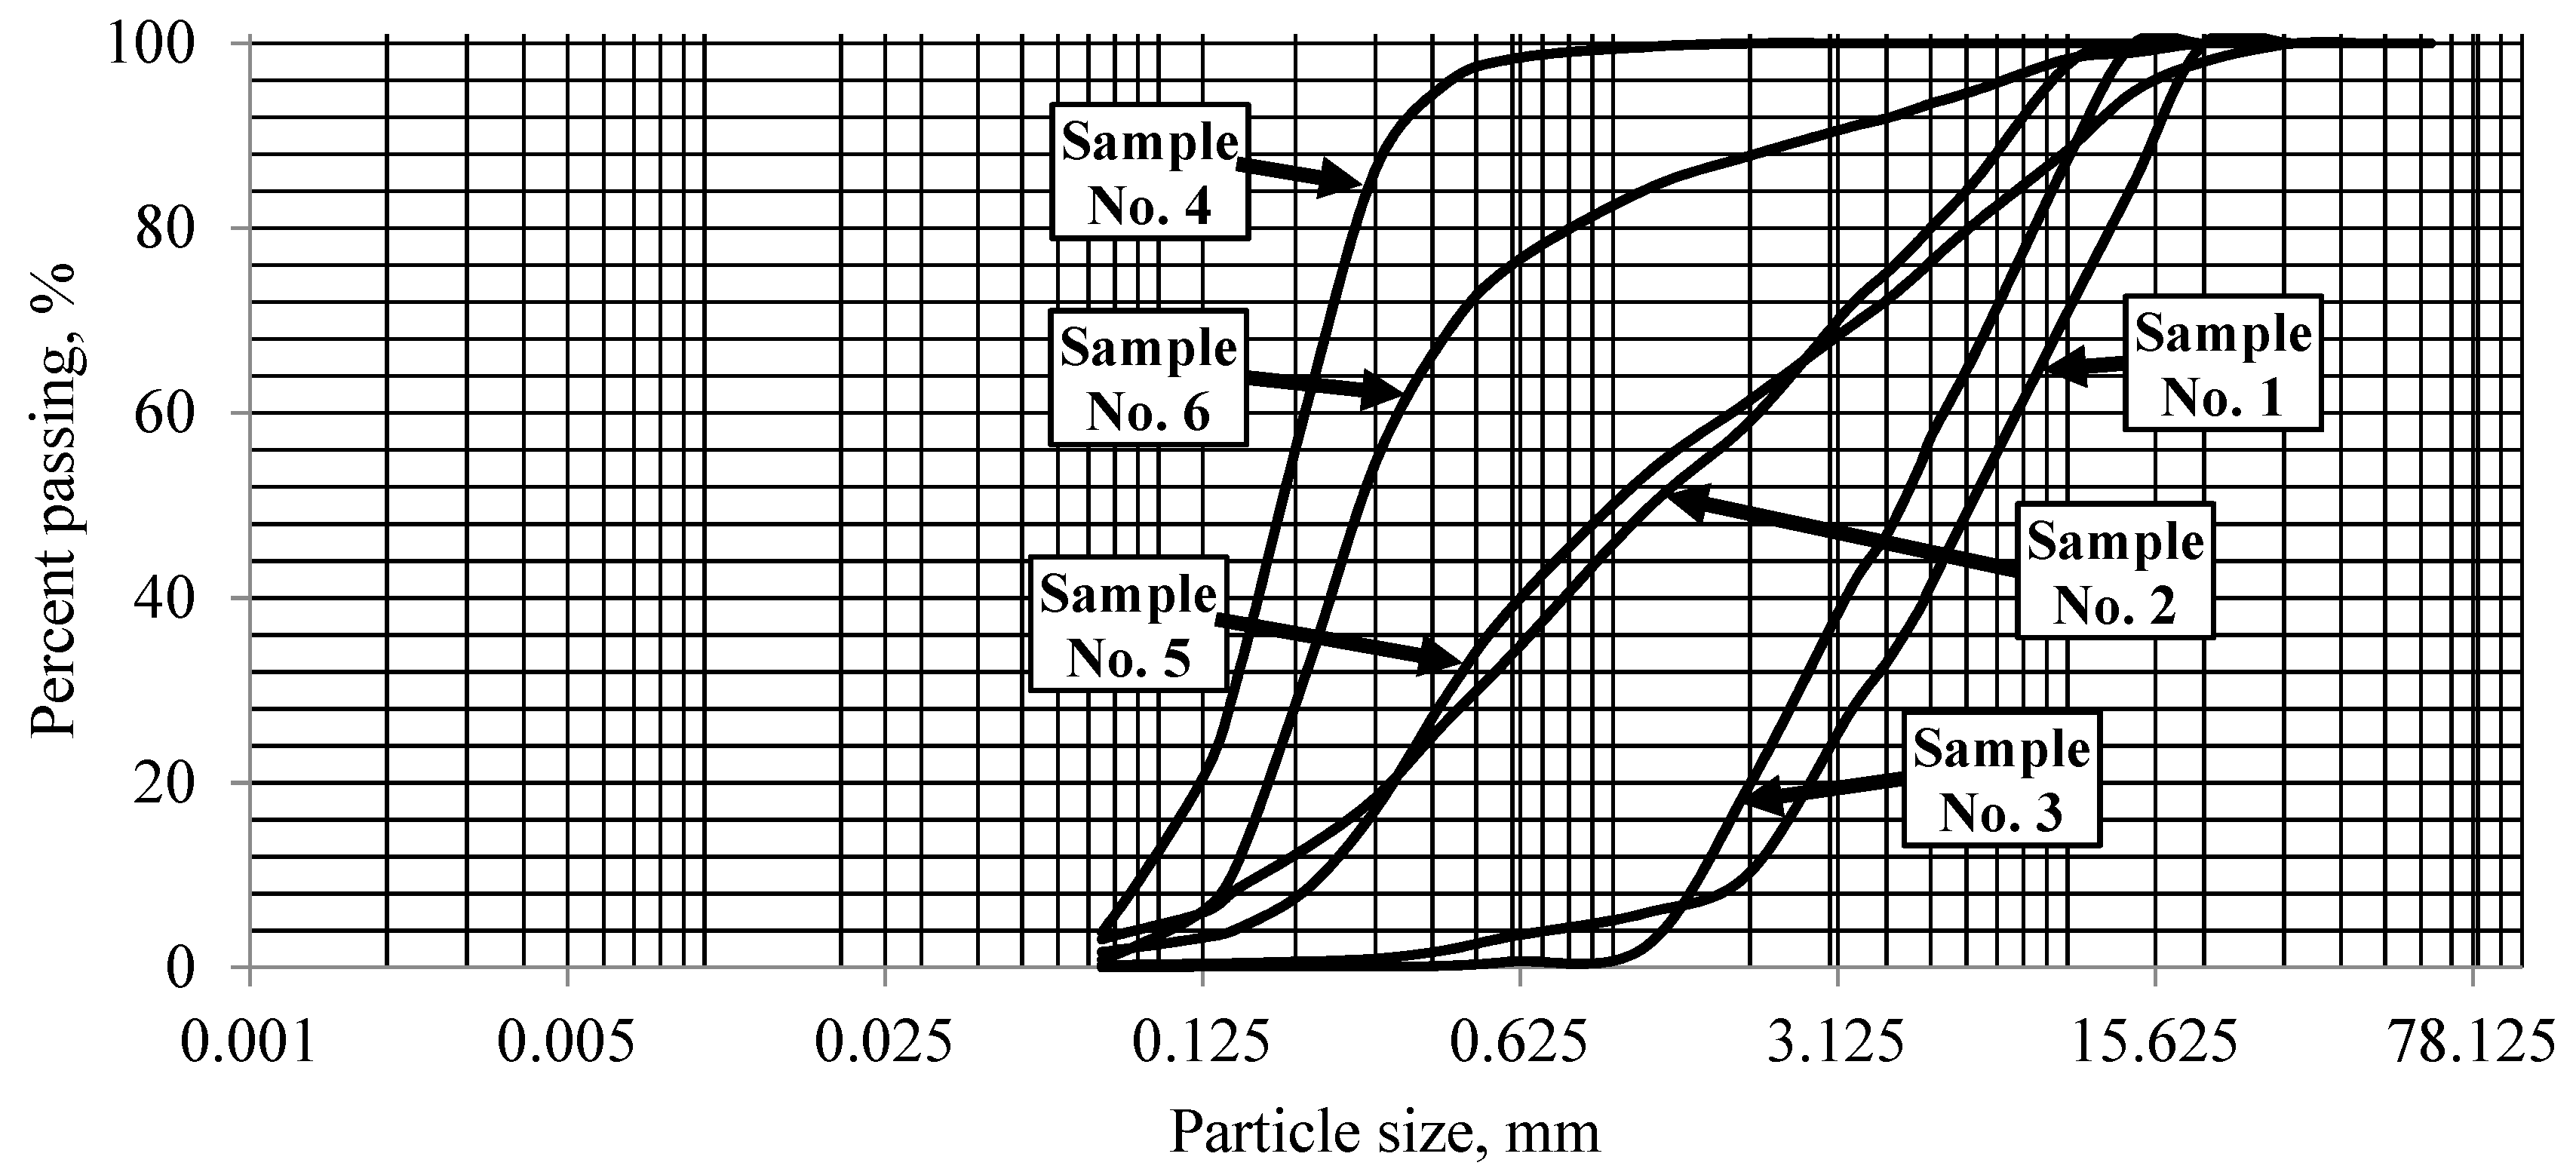
2.1. Soil

For this study, six soil types were selected—three gravelly and three sandy soils from different locations in Lithuania. The determination of the particle size distribution was obtained using sieve analysis according to LST EN ISO 17892-4:2017 [49]. Particles larger than 14 mm were removed before the analysis to avoid interference during triaxial compression testing.
These soils were classified according to LST 1331:2022 [50]—the primary Lithuanian road construction classification. LST EN ISO 14688-2:2018 [51] and the Unified Soil Classification System (USCS) were also included to provide a broader perspective. The particle size distribution is illustrated in Figure 1, with the average particle size d50 values ranging from 0.19 to 1.05 for sandy soils and 1.23 to 6.13 for gravelly soils. These values, particularly the uniformity coefficient (CU), were used in our subsequent analysis. The average particle size (d50) and the uniformity coefficient (CU) are detailed in Table 1.
To ensure uniform testing conditions for the coarse soils, each sample needed to be prepared by recompacting it. To achieve consistent compaction, it was decided to compact the samples to their optimal water content, to reach their optimal density. The Proctor compaction test was conducted according to LST EN 13286-2:2013 [52] to determine the optimal water content and density. The results of these tests are presented in Table 2. It was established that gravel samples should be prepared with water content ranging from 3.0% to 7.5%, resulting in a density between 1.90 and 2.23 g/cm3. For sandy samples, the determined optimal water content range was between 8.0% and 14.3%, leading to a density range between 1.86 and 2.16 g/cm3. The density of the prepared soil samples was utilized in the subsequent analysis.

2.2. Geogrid

The geogrid employed in this study was a biaxial, flexible polyester (PET) geogrid. Its mesh size measured 25 × 25 mm, and it exhibited an ultimate tensile strength of ≥40 kN/m, as provided by the manufacturer’s specifications. The selection of this geogrid with a tensile strength of 40 kN/m aligns with common practices in embankment reinforcement in Baltic countries. It is important to note that specific tests regarding the geogrid’s properties were not conducted within the scope of this study, and the physical and mechanical properties are based on the manufacturer’s data. Table 3 provides an overview of the physical and mechanical properties according to the manufacturer’s data.
To prepare the test specimens, the geogrids were cut into circular shapes, as depicted in Figure 2. The diameter of the selected geogrid was deliberately set to be 3–5 mm smaller than the 100 mm diameter of the soil sample. This sizing choice was essential to prevent potential damage to the membrane and edge effects during testing [53].

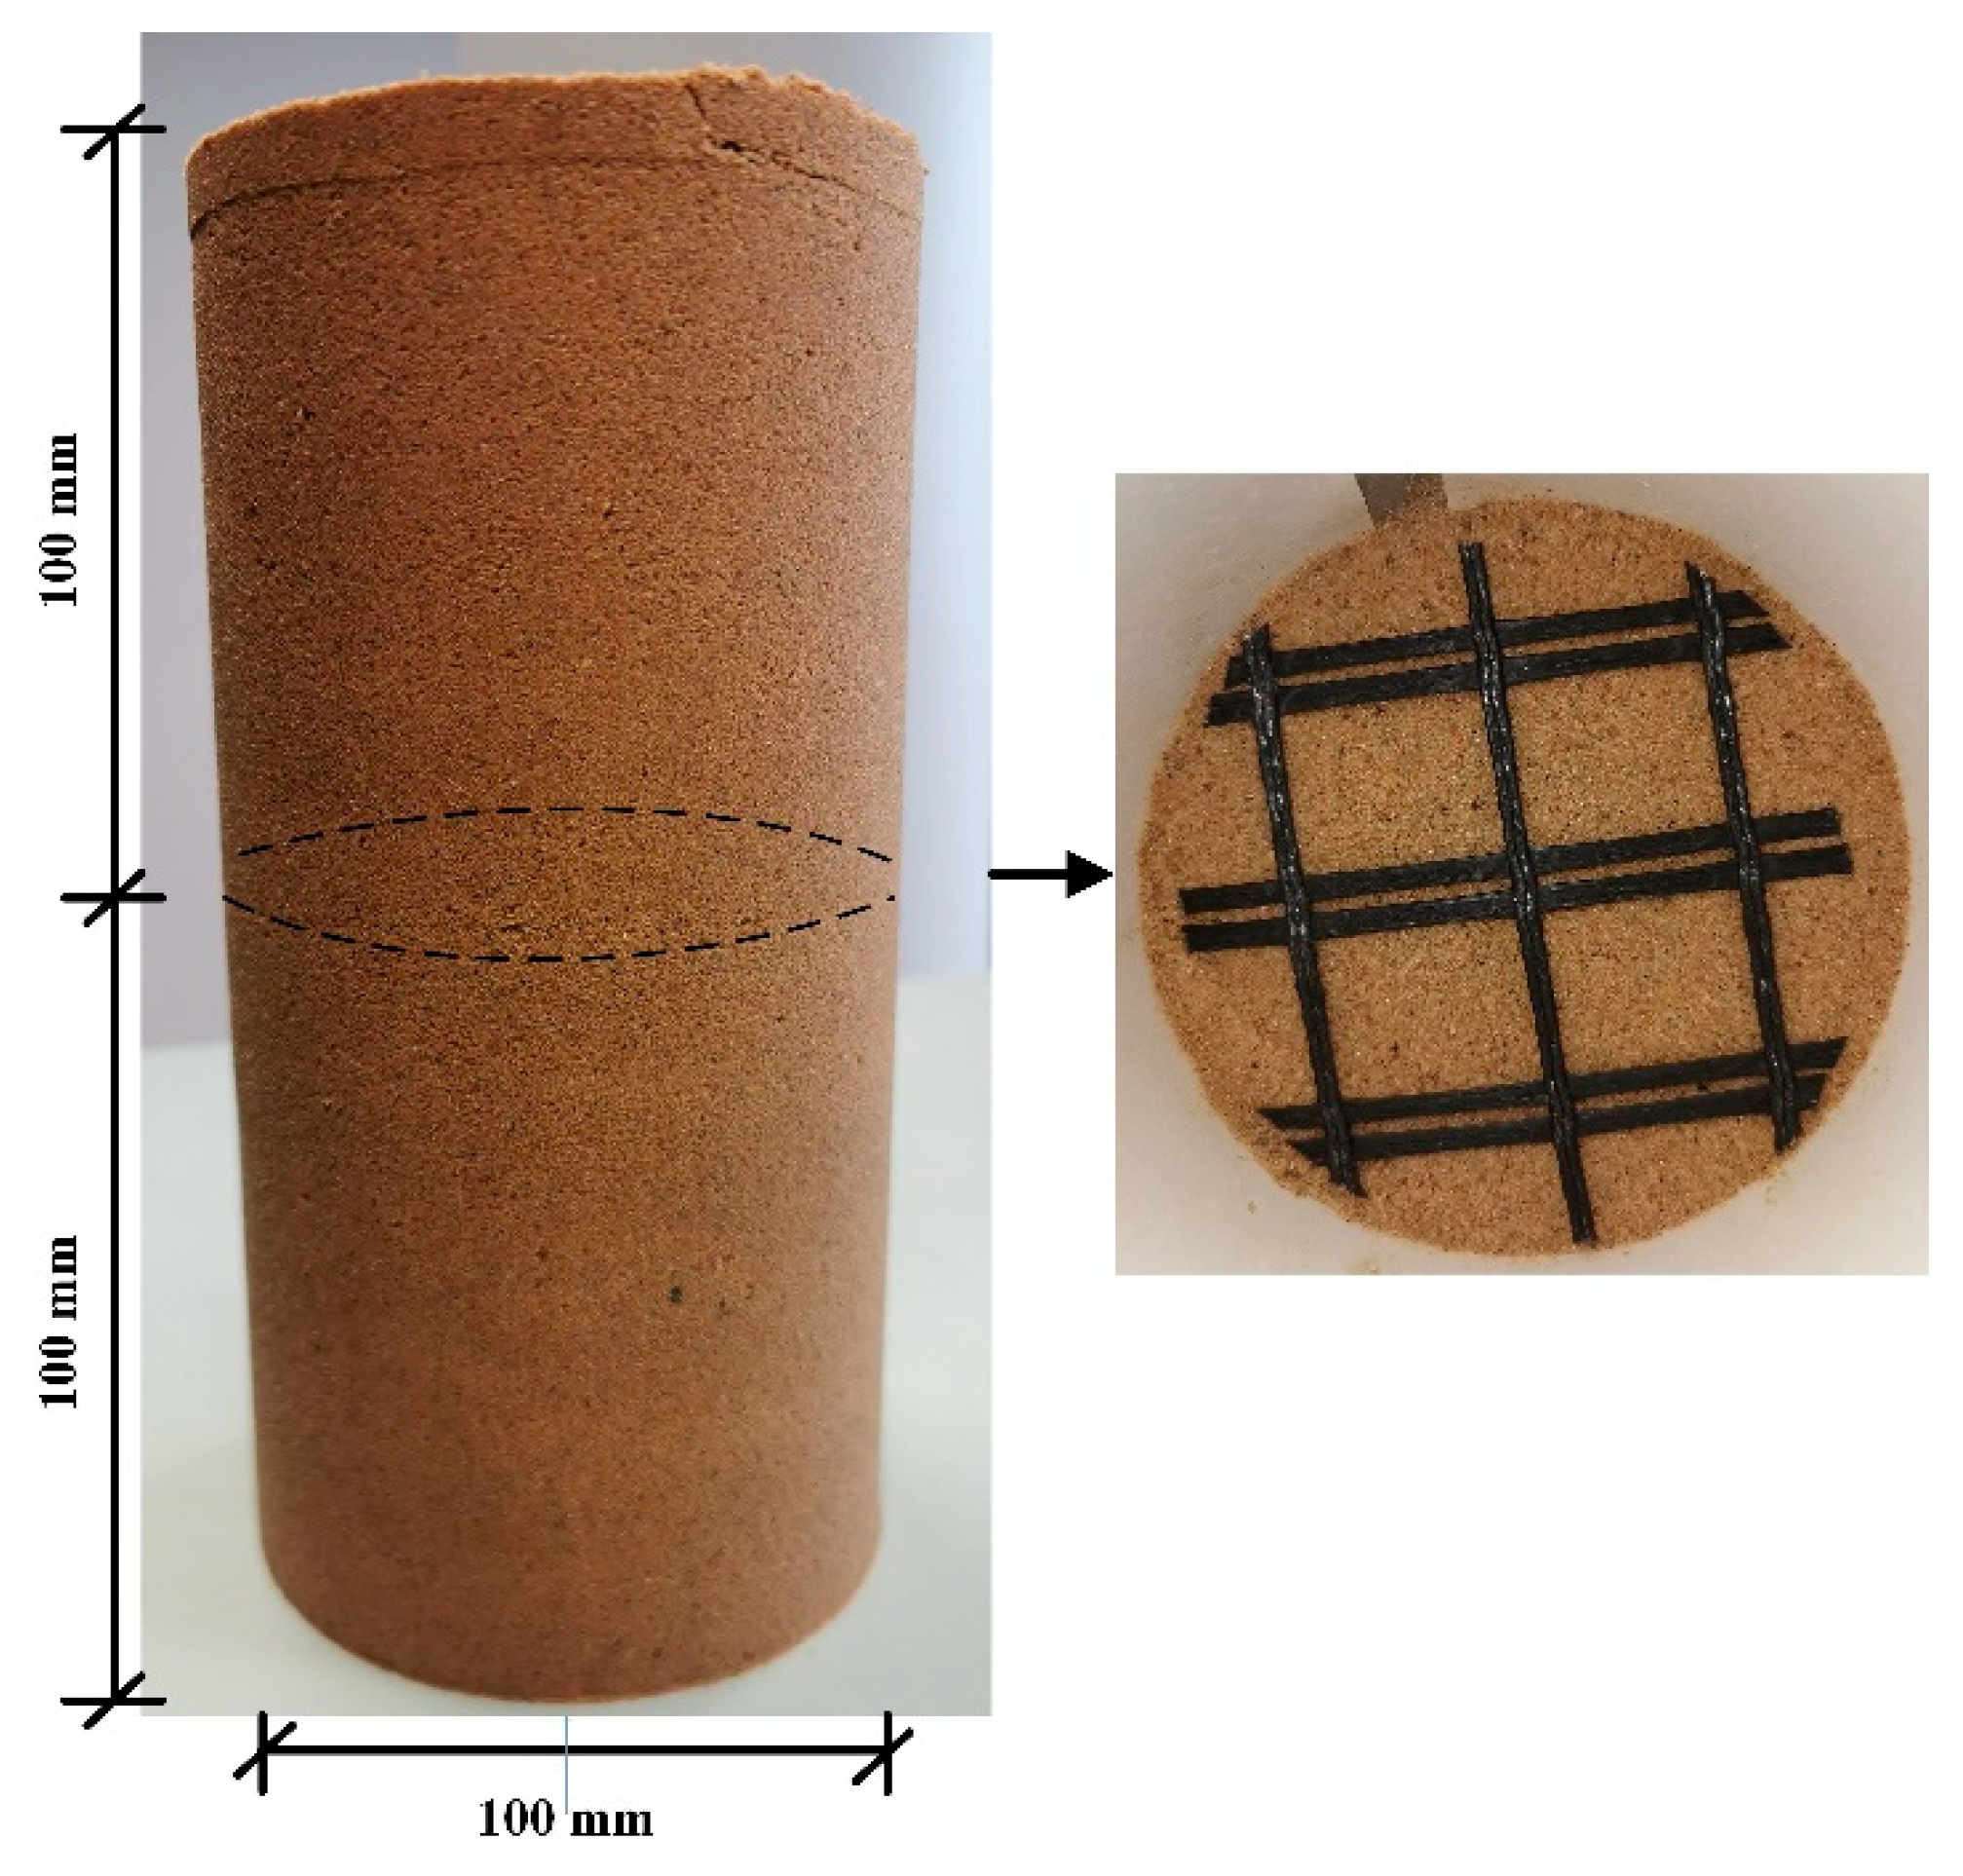
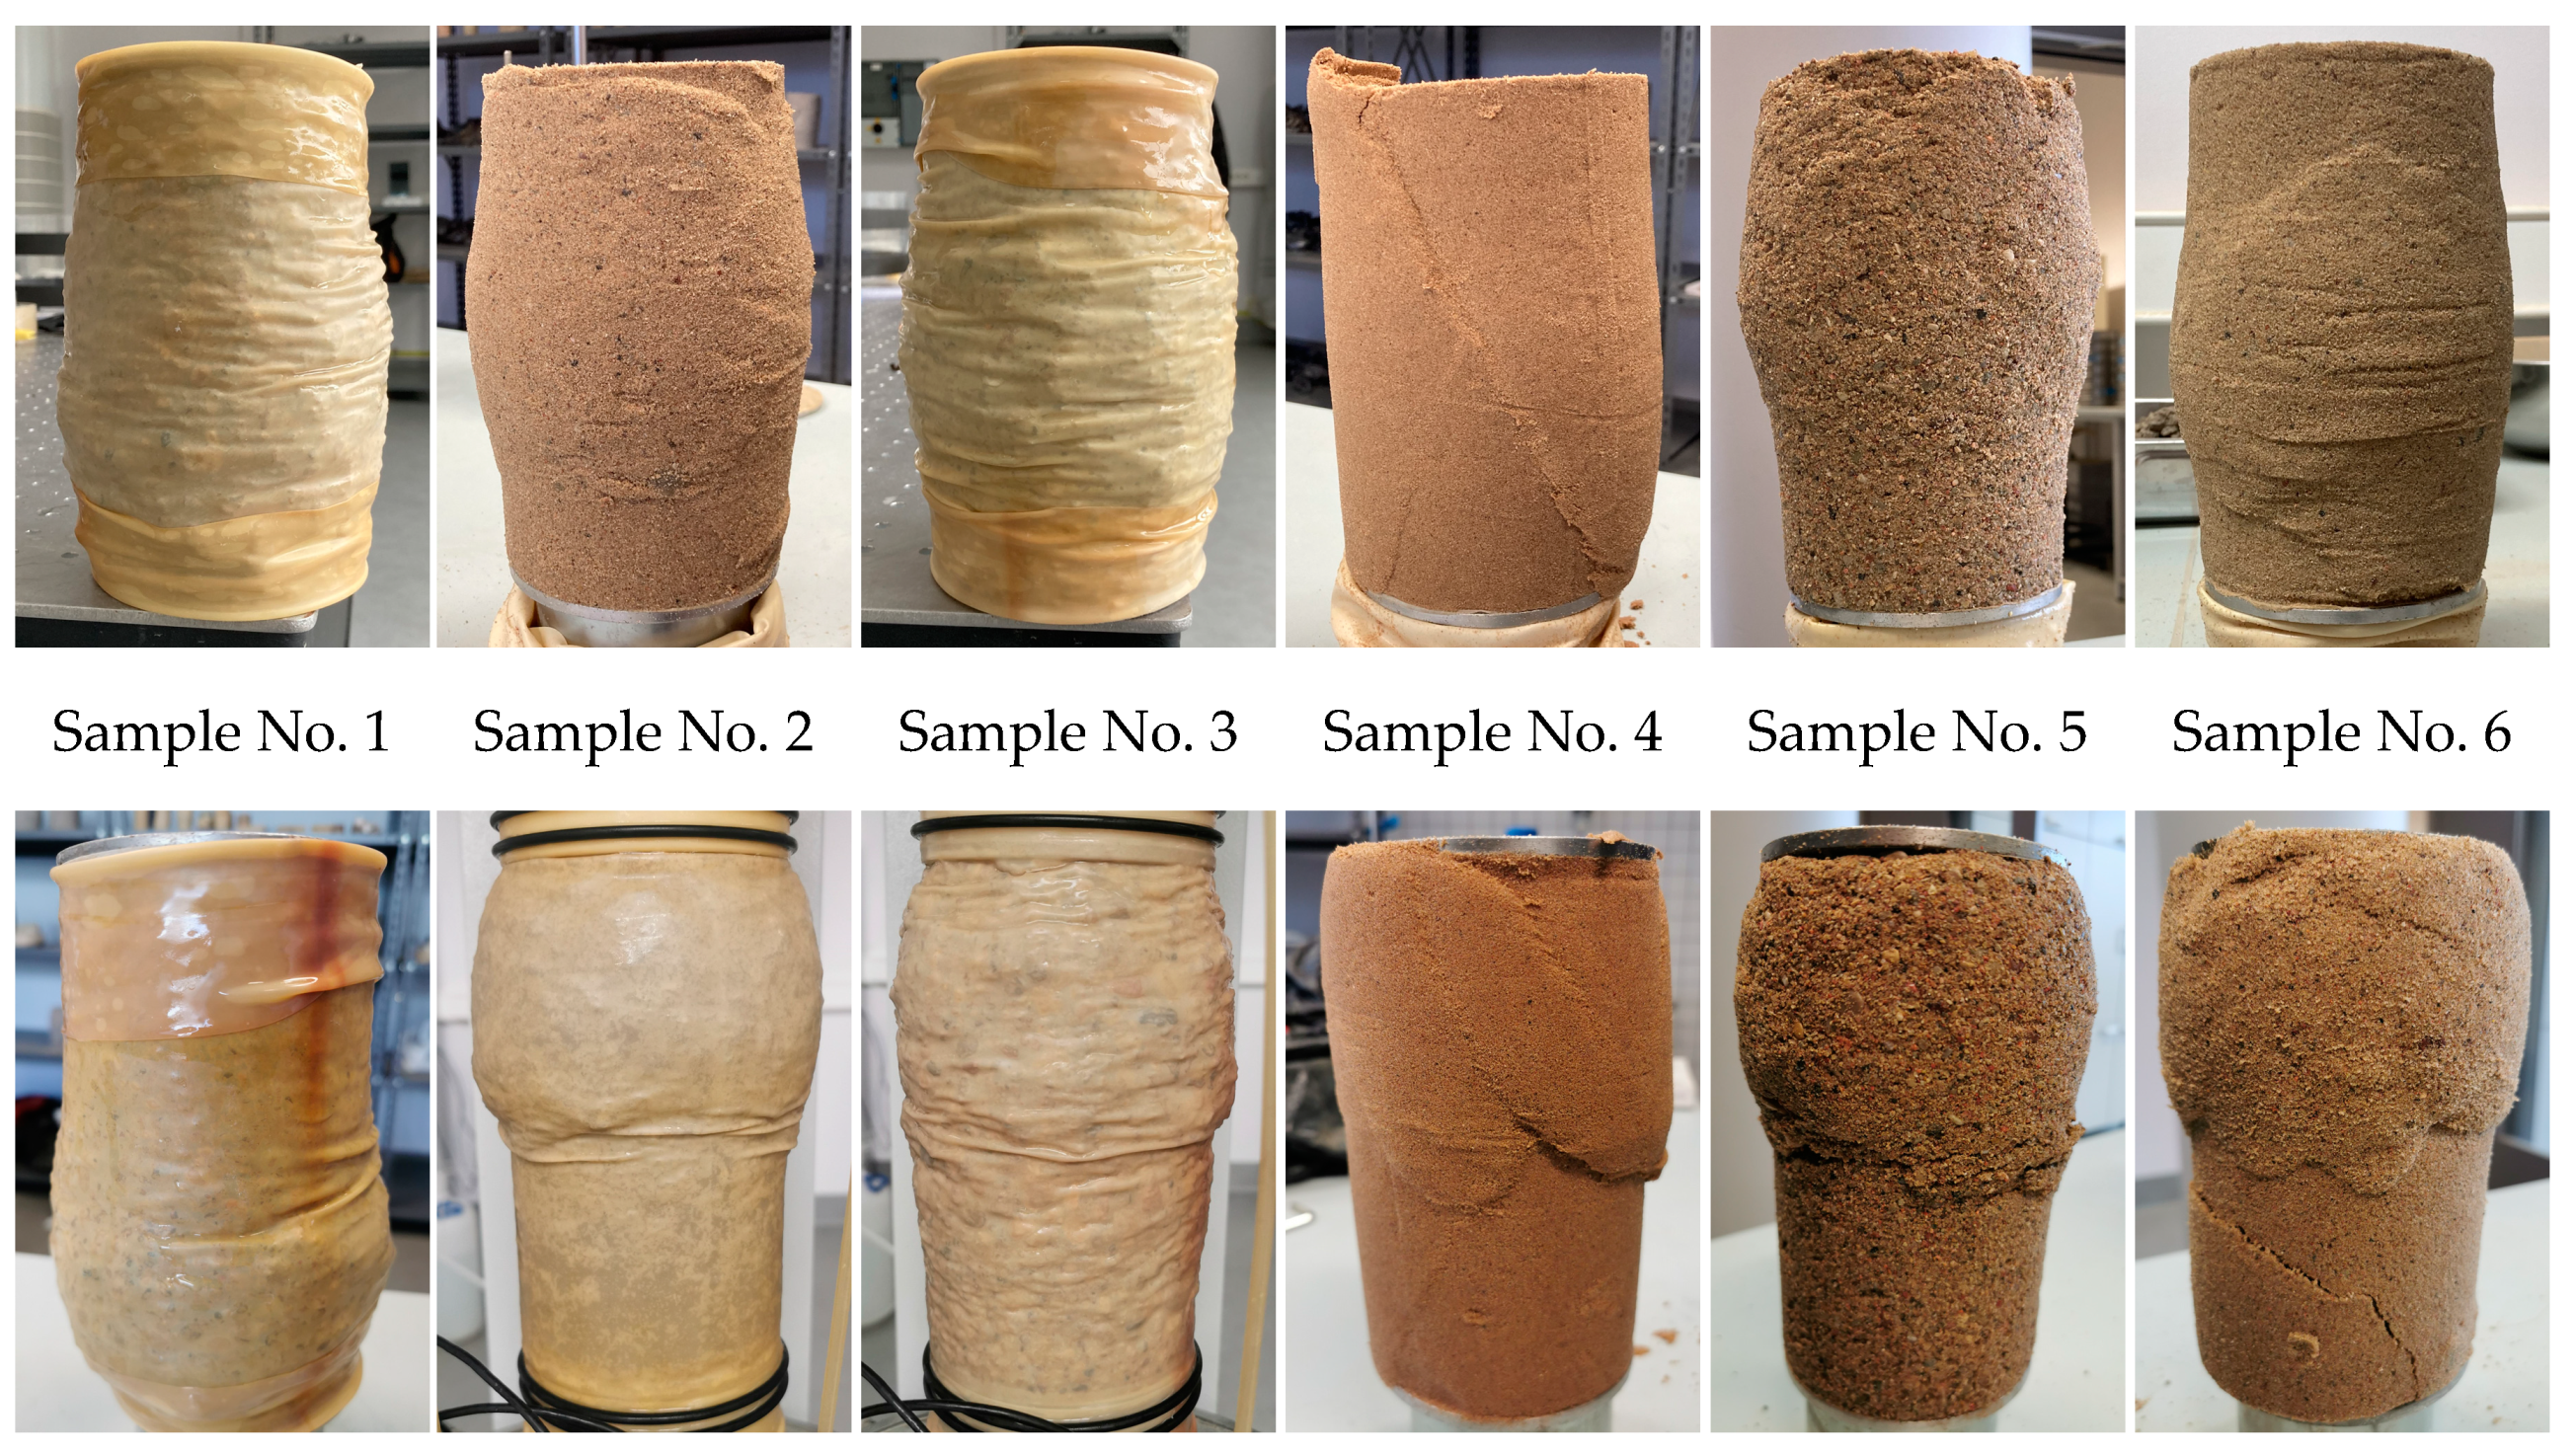
2.3. Sample Preparation

Two types of cylinder specimens were prepared for the triaxial compression tests. The first type of specimen consisted of only sandy and gravelly soil without geogrids. The second type of specimen was prepared with geogrids in the middle of the specimen (Figure 2). The diameter of the specimens was 100.0 mm, and the height was 200.0 mm. The samples were remolded in ten layers at an optimal water content and an optimal density based on the Proctor compaction test (Table 2). When a geogrid was inserted in the middle of the specimen, five layers were compacted first, followed by the placement of the geogrid, and then the remaining five layers were compacted. The soils used for the tests are non-cohesive, so the samples were prepared in a membrane, which helped to keep the samples stable.

2.4. Experimental Program

In total, 42 consolidated drained (CD) triaxial compression tests were conducted for six different types of soils. Initially, tests were performed on soils without geogrid reinforcement, followed by tests on geogrid-reinforced soils. Three different cell pressures σ3 were applied during the consolidation and loading phases: 20, 50, and 70 kPa, which were based on stress calculation for road construction by Zakarka [48]. The conditions for the test were selected according to LST EN ISO 17892-9:2018 [54]. Additional tests at cell pressures of 100, 200, and 300 kPa were conducted for one soil type to investigate the impact of cell pressure on geogrid-reinforced samples. The test conditions were selected in accordance with LST EN ISO 17892-9:2018 [54].
The absence of a dedicated saturation stage aligns with the aim of simulating real-world scenarios, where soils may not always be fully saturated. The acceptable B-value for the tests was maintained by adjusting the water content during mixing to ensure optimal compaction and representative mechanical behavior without a specific saturation phase. The consolidation duration was determined in accordance with the guidelines of the standard LST EN 17892-9:2018. However, in all cases, the consolidation duration was less than 30 min. As per the standard, the rate of vertical displacement of the load frame is dependent on the consolidation duration. To ensure consistency, the decision was made to standardize the consolidation duration and select a uniform rate of strain. In all cases, the soil underwent a 30 min consolidation period, with the rate of vertical displacement of the load frame set at 0.950% per minute. The tests were carried out by loading the specimen up to 15% of the vertical deformation. The results were interpreted using the Mohr–Coulomb criterion τ = σ’ tanϕ´ + c [55].

3. Test Results

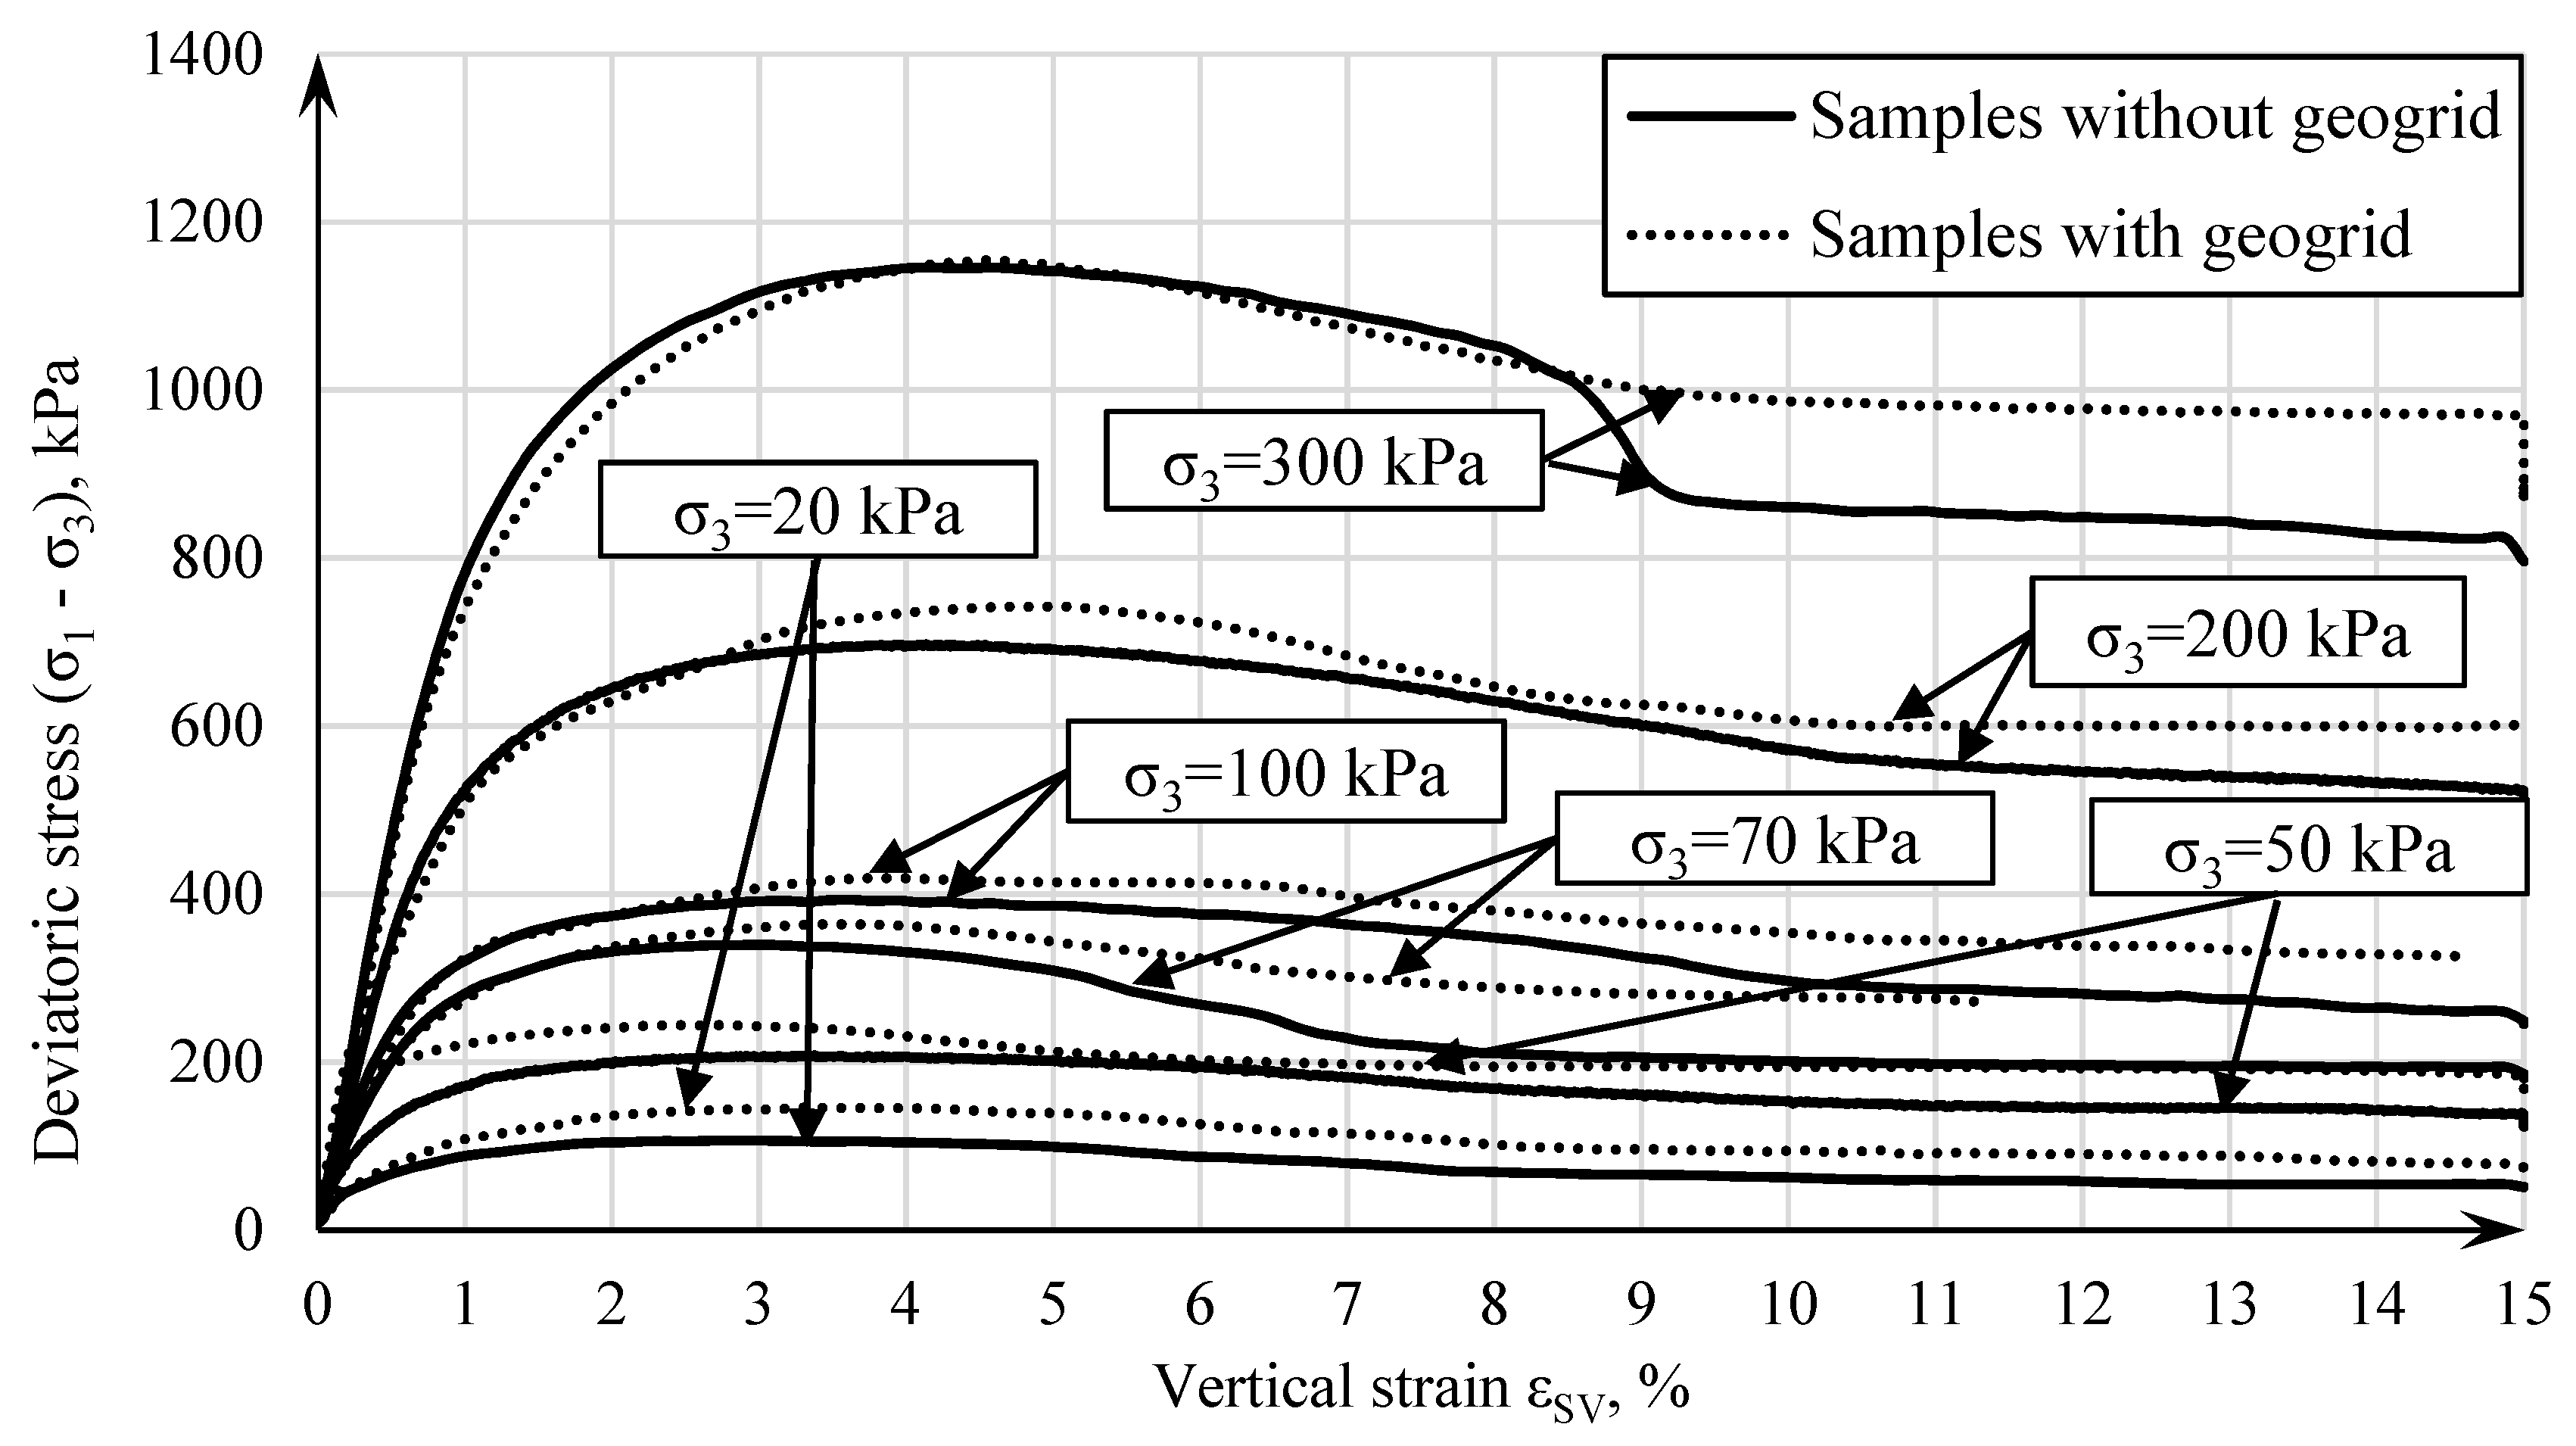
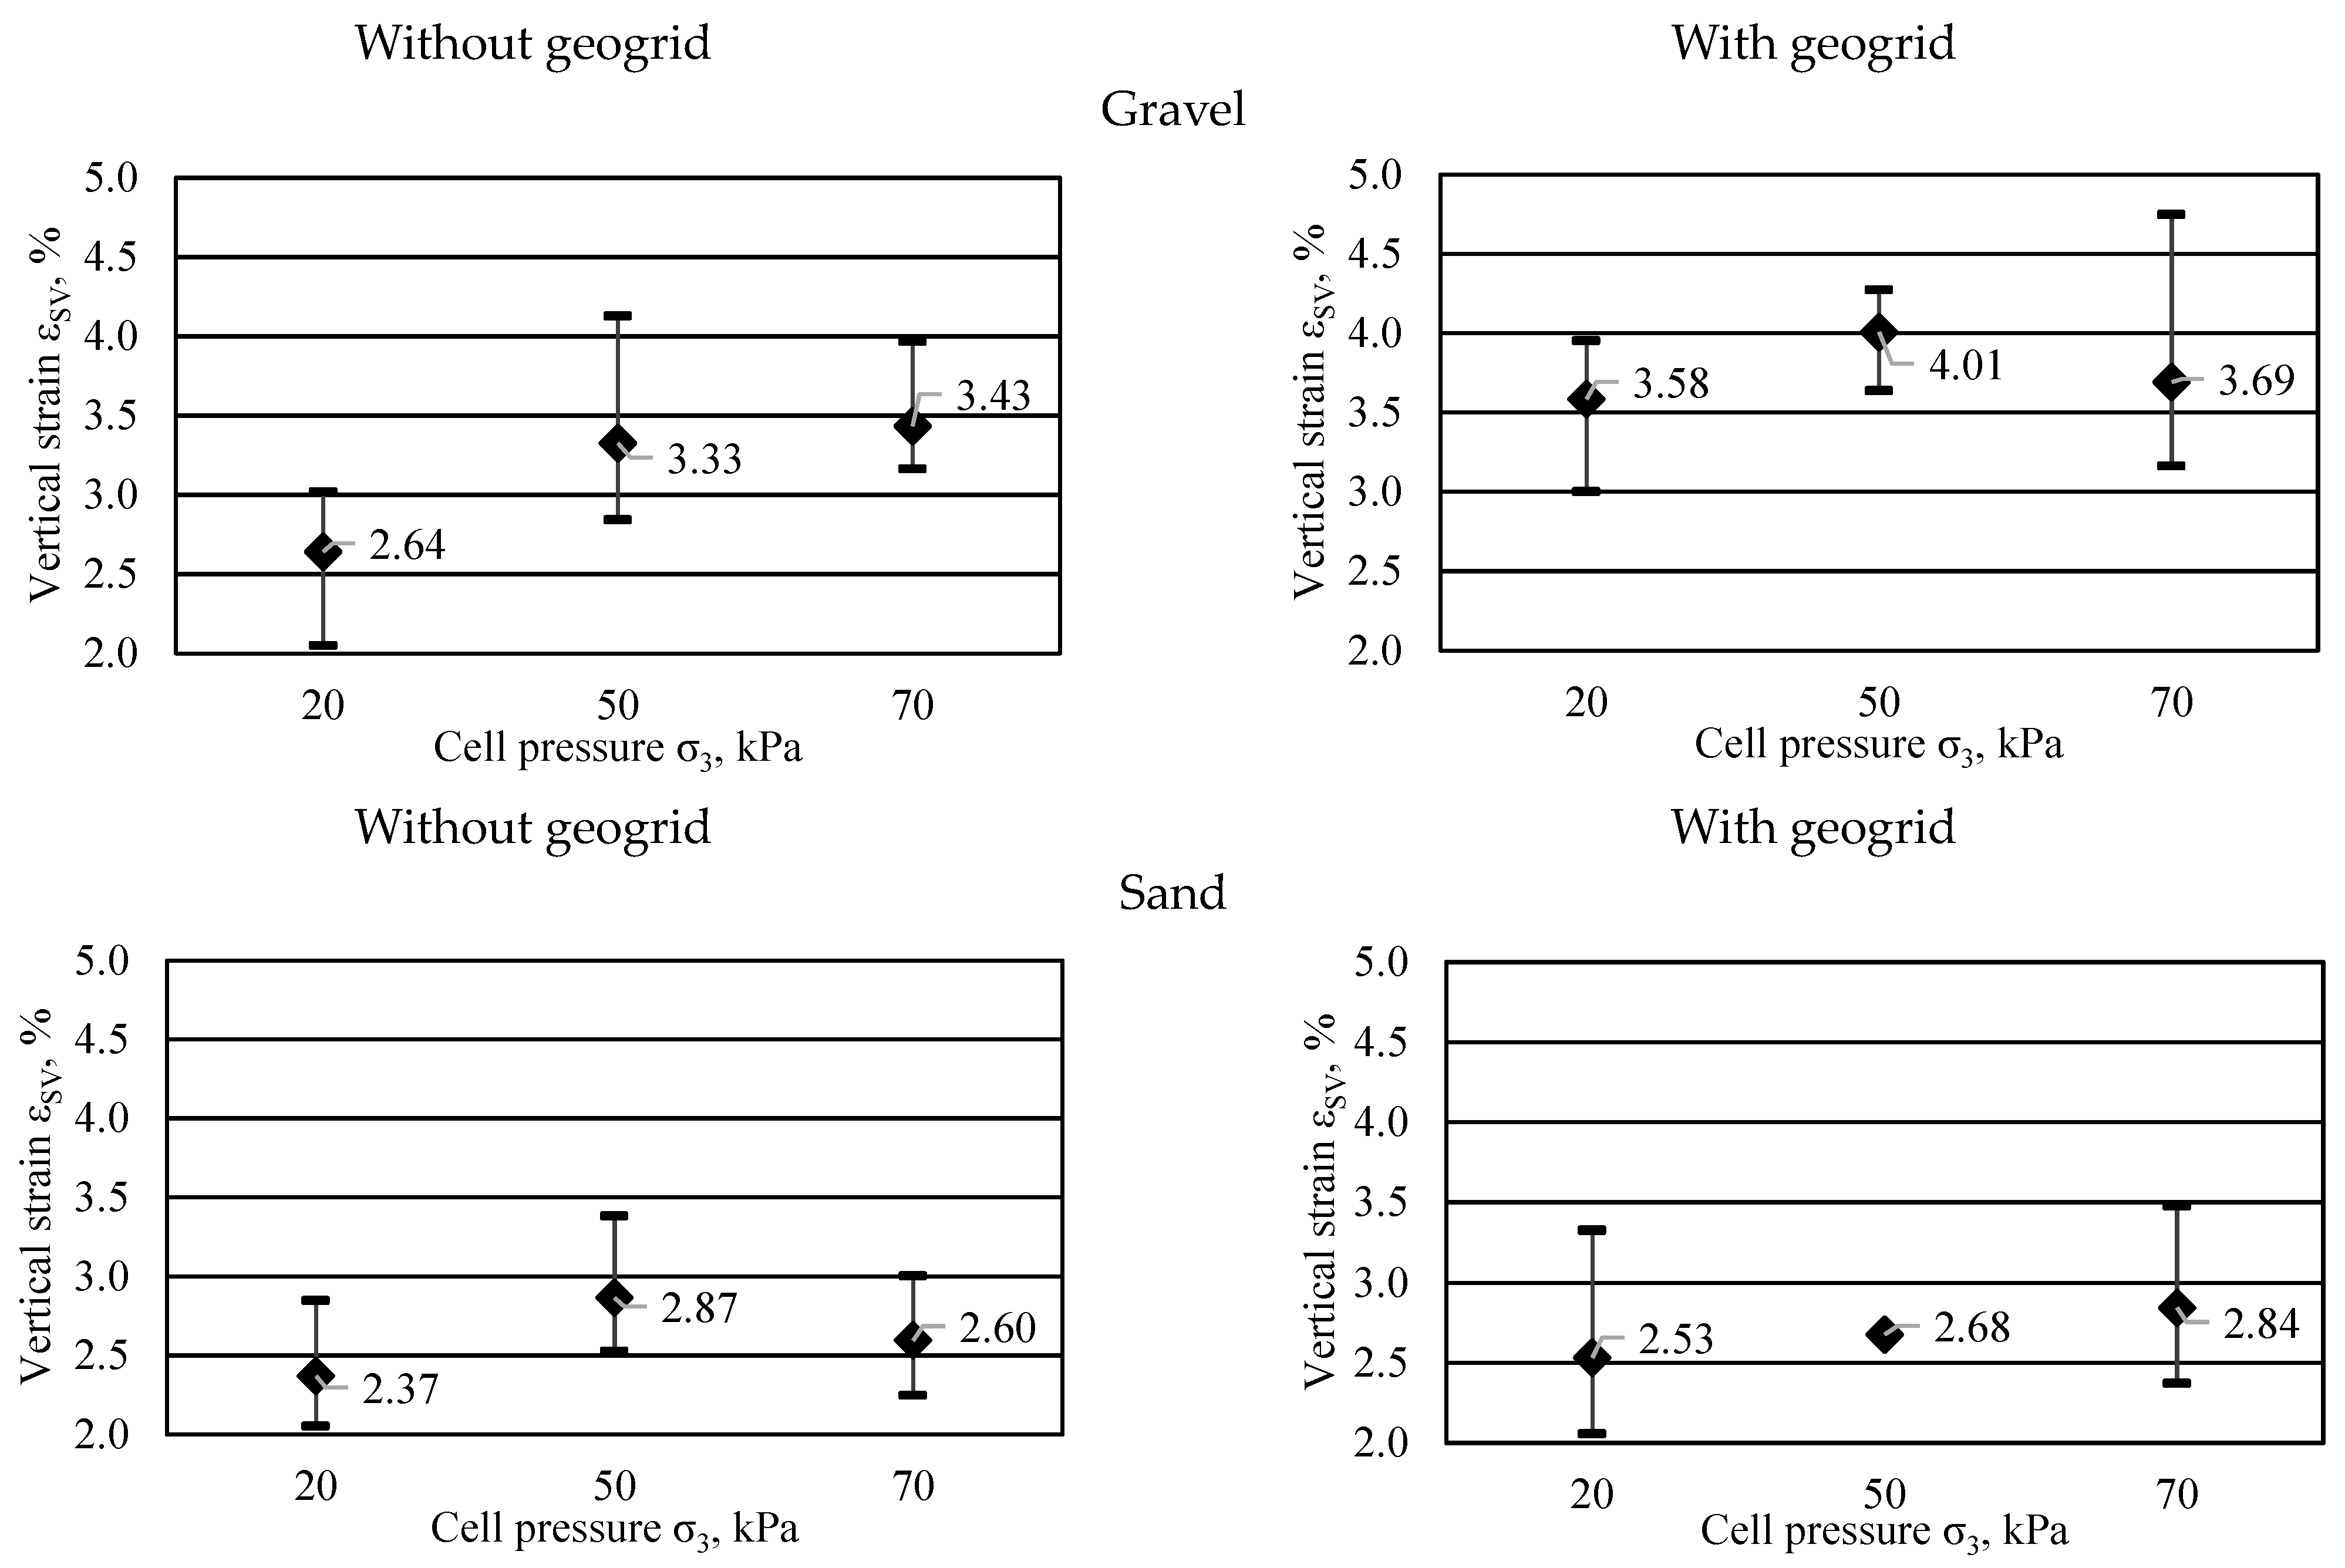
3.1. Influence of Cell Pressure on Mechanical Properties

Road structures appear to have lower stress than most building structures and their foundations transfer stress to the soil strata. However, the influence of cell pressure on the mechanical properties of the soil and its improvement with geogrids was chosen to check sand sample No. 4 (Figure 3 and Table 4). A higher pressure σ3 in the triaxial pressure device results in larger deviatoric stress. The ratio of the maximum deviatoric stress with the geogrid to the maximum deviatoric stress without the geogrid is called the reinforcement effect. The reinforcement effect, or influence of the geogrid, decreases as stress σ3 increases. The reinforcement effect for cell pressures of 20 to 70 kPa ranged from 1.37 to 1.07, and for cell pressure 100–300 kPa ranged from 1.07 to 1.01 (Table 4). Based on these results, further tests were performed only at cell pressures of 20, 50, and 70 kPa.
In several tests with a geogrid reinforcement at the lowest cell pressure of 20 kPa, two peak deviatoric stresses appeared during shear (Figure 4). The first peak appeared when the vertical strain was equal to 2–3%. This tendency was common in all soils reinforced with geogrids. The second peak began to appear at a 5% vertical strain and reached its maximum at the end of the test (15% vertical strain). Notably, the deviatoric stress value for the second peak was greater than that of the first peak.
In cases where two peak values appeared, it was clear that the load was primarily carried by the geogrid itself, with minimal contribution from the surrounding soil. This phenomenon was also evident in post-test images of the geogrid (Figure 5b), which showed substantial damage and deformation of the geogrid. Conversely, in cases where only a single deviatoric stress peak was observed, the geogrid returned to its initial state without significant long-term damage (Figure 5a).
These observations suggest a complex interplay between the geogrid and the surrounding soil and could have significant implications for the performance of geogrid-reinforced structures. Only the deviatoric stress values of the first peak were evaluated for further analysis of the results.

3.2. Geogrid Influence

Post-test images provide visual evidence of the different behaviors exhibited by specimens without and with geogrid reinforcement (see Figure 6). Notably, the presence of geogrid in the specimens introduces a significant change in how the shearing surfaces are formed.
In the case of specimens without geogrid reinforcement (Figure 6 above), the shearing surfaces extend uniformly across the entire height of the specimen. This results in a relatively uniform distribution of shear forces throughout the specimen, as is typical in triaxial compression testing.
However, when geogrid reinforcement is introduced (Figure 6 below), the shearing surfaces are localized either in the upper or lower part of the specimen. This localization indicates that geogrid reinforcement plays a pivotal role in redistributing and concentrating shear forces. This concentrated behavior might explain the presence of two deviatoric stress peaks in tests with geogrid reinforcement, as observed earlier (Figure 4).
It is important to mention that although the soils used for the tests are classified as non-cohesive, they contained fine particles, the amount of which did not exceed 5%, and also the suction effect due to the water in the sample allowed the samples to be kept stable after the test. Stable gravelly soils were not maintained in almost all cases; therefore, their photos are with a membrane.
The maximum deviatoric stresses and their dependency on cell pressure are presented in Table 5. The influence of cell pressure on the increase in deviatoric stress in geogrid-reinforced specimens is notable. At a cell pressure of 20 kPa, the reinforcement effect showed a range from 1.05 to 1.37. When the cell pressure increased to 50 kPa, the reinforcement effect still showed a substantial range, spanning from 1.09 to 1.31. As the cell pressure further increased to 70 kPa, the range of the reinforcement effect remained considerable, varying from 1.02 to 1.13. These results demonstrated that cell pressure was the dominant factor influencing reinforcement, overshadowing the influence of soil type, whether sand or gravel, which did not significantly affect the observed outcomes.

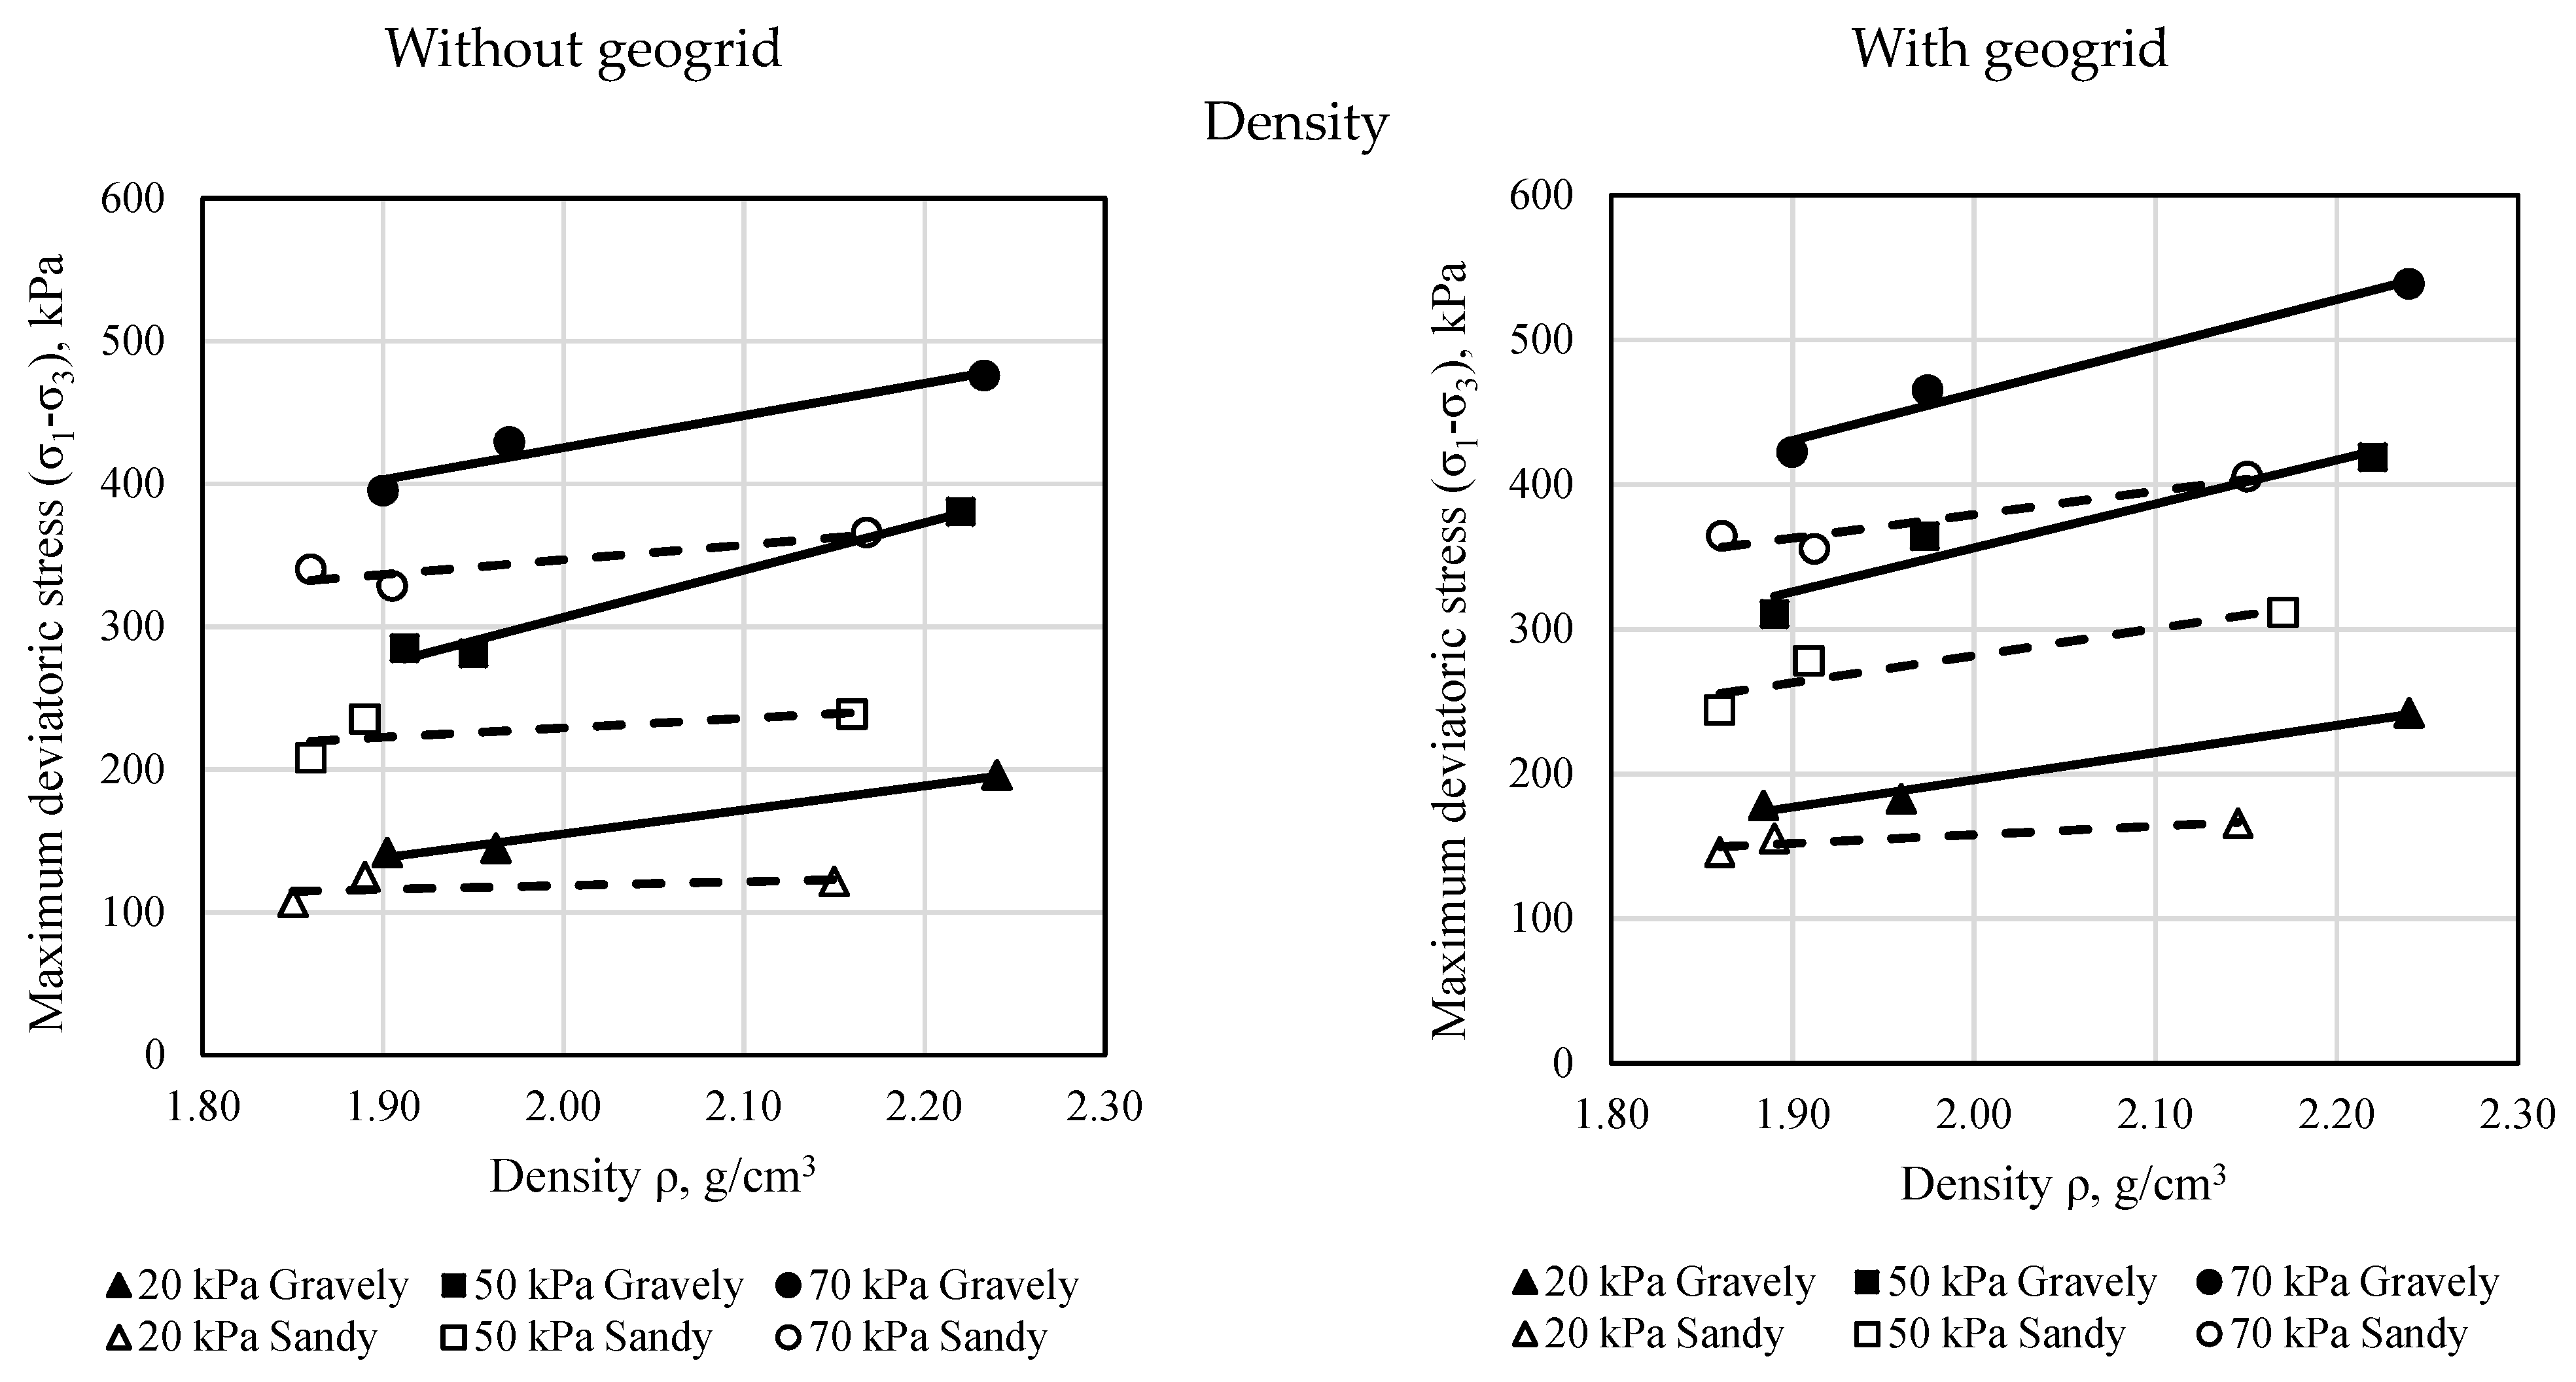
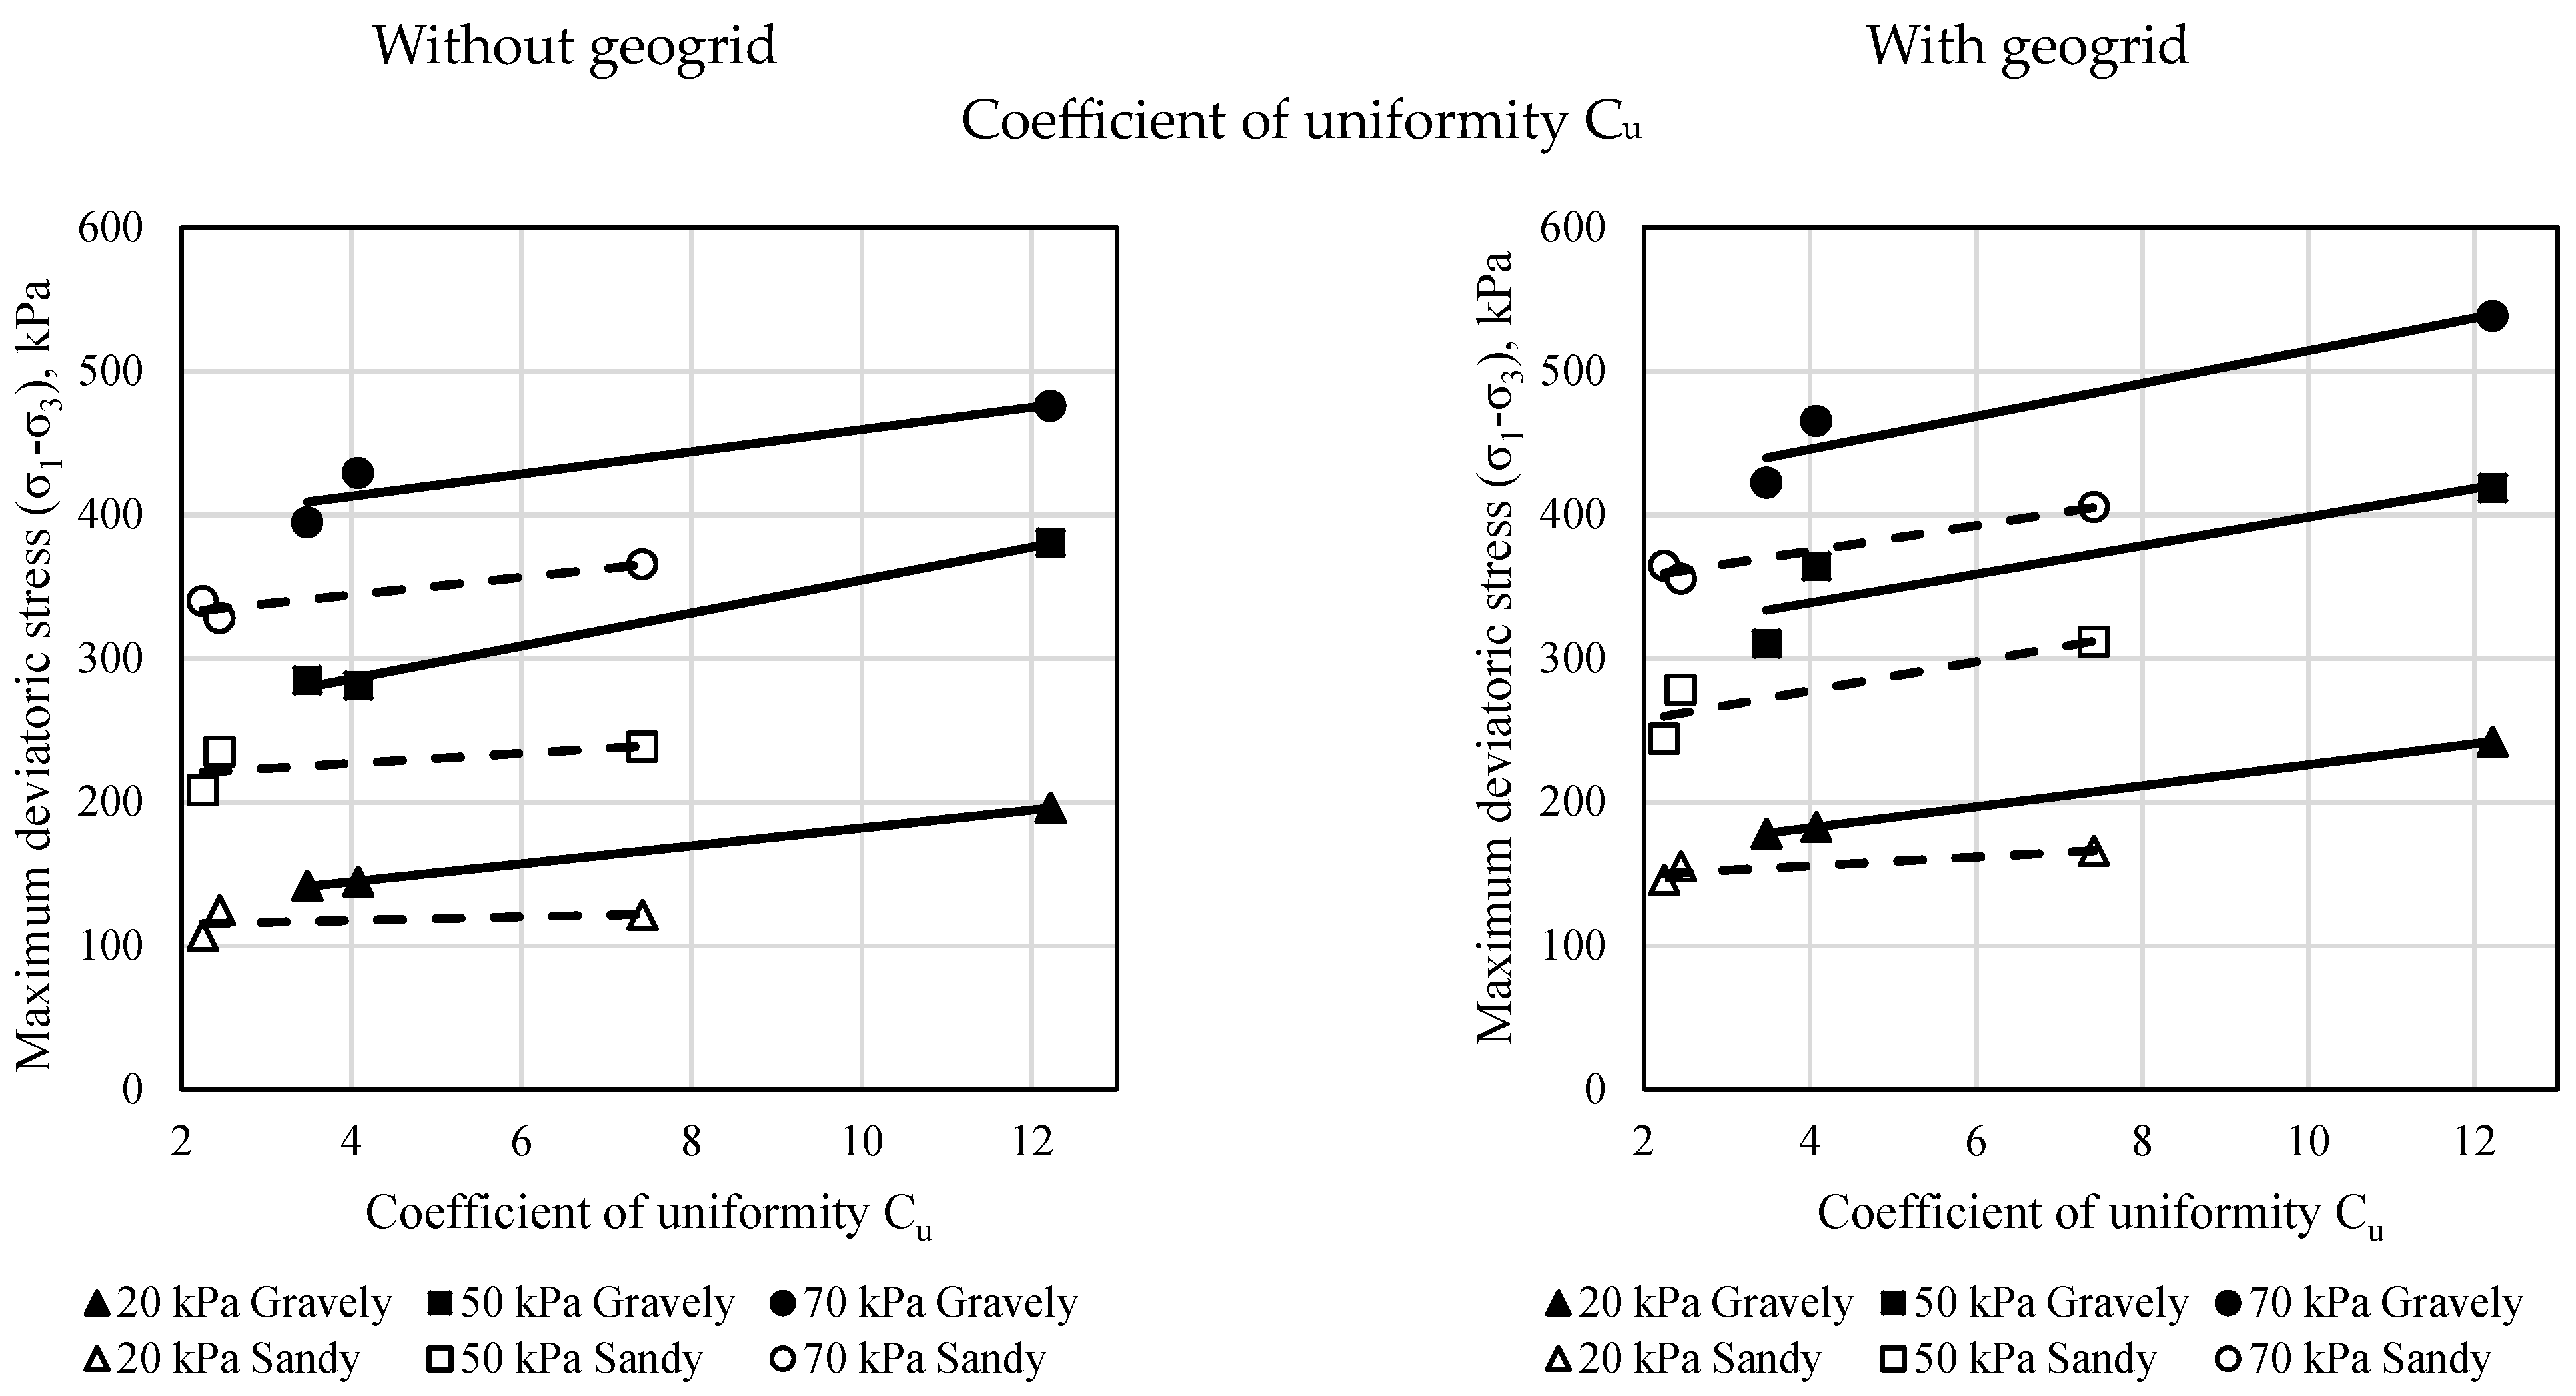
3.3. Dependence on Soil Properties

The type of soil was observed to exert a noteworthy influence on the vertical strain at which the maximum deviatoric stress was achieved. Figure 7 illustrates the influence of vertical strain based on soil type and the geogrid reinforcement. In gravel samples without geogrids, the vertical strain ranged from 2.64 to 3.43, while in the presence of geogrid reinforcement, it extended from 3.58 to 4.01. In contrast, sand samples displayed lower values of vertical strain, within the range of 2.37 to 2.87. Moreover, the influence of the geogrid on sand samples was less pronounced, with the vertical strain ranging from 2.53 to 2.84. This signifies the geogrid’s distinct influence in various soil types, with gravel samples exhibiting a more substantial response to reinforcement in terms of vertical strain when compared to sand samples.
The influence of the geogrid on the angle of internal friction and cohesion values is presented in Table 6. The geogrid had a positive influence on the angle of internal friction only for soil No. 2, increasing it by 0.41°. For the other samples, the angle of internal friction decreased from 0.23 to 0.73°. The geogrid increased cohesion for all investigated soil samples. The apparent cohesion of the gravel soils increased from 7.03 to 10.10 kPa, and the apparent cohesion of the sandy soils increased from 3.61 to 9.94 kPa.
The type of soil has an influence on deviatoric stress. Deviatoric stress was higher for gravelly soil than for sandy soil at all cell pressures, as shown in Figure 8. A strong dependence of deviatoric strength on the initial specimen density was observed. When the sand samples were not reinforced with geogrids, the deviatoric stress increased slightly with increasing density. For sandy soils reinforced with geogrids, deviatoric strength increased more with increasing density, whereas for gravel soils, this phenomenon was not as pronounced.
The dependence of deviatoric strength on the coefficient of uniformity was also observed, as depicted in Figure 8. It is important to note that sandy and gravelly soils must be evaluated separately. The slope angles of the curves exhibited little variation with soil type or cell pressure, but the x-axis crossing points had higher values for gravelly soil compared to sandy soil.
Conclusively, the soil’s mechanical properties are predominantly determined by density or the coefficient of uniformity. This assertion is supported by the observation that gravelly soil consistently exhibits higher deviatoric strength compared to sand. Examining the relationship between Cu and density in Figure 9 reveals a consistent trend: as Cu increases, density also increases. This correlation holds true for both sandy and gravelly soils, indicating that the soil type does not significantly influence this particular association.
Furthermore, there is no discernible dependence on the average particle size (d50) or the percentage of gravel particles. Shifting our focus to d50 and optimal water content (Figure 9), an inverse relationship becomes evident: as d50 increases, optimal water content decreases. This trend is more pronounced for gravelly soils, especially when considering both sandy and gravelly soils together. However, when specifically addressing sandy soils, this relationship is not as distinctly defined.

4. Conclusions

A series of triaxial compression tests were performed on coarse soils reinforced with geogrids to study the effect of soil type and geogrid influence on the mechanical properties of the soils.
Based on the test results, it was found that:
  • The choice of cell pressure in the triaxial device is crucial, as it significantly affects the reinforcement effect (the influence of the geogrid). Higher cell pressure corresponds to a reduced reinforcement effect.
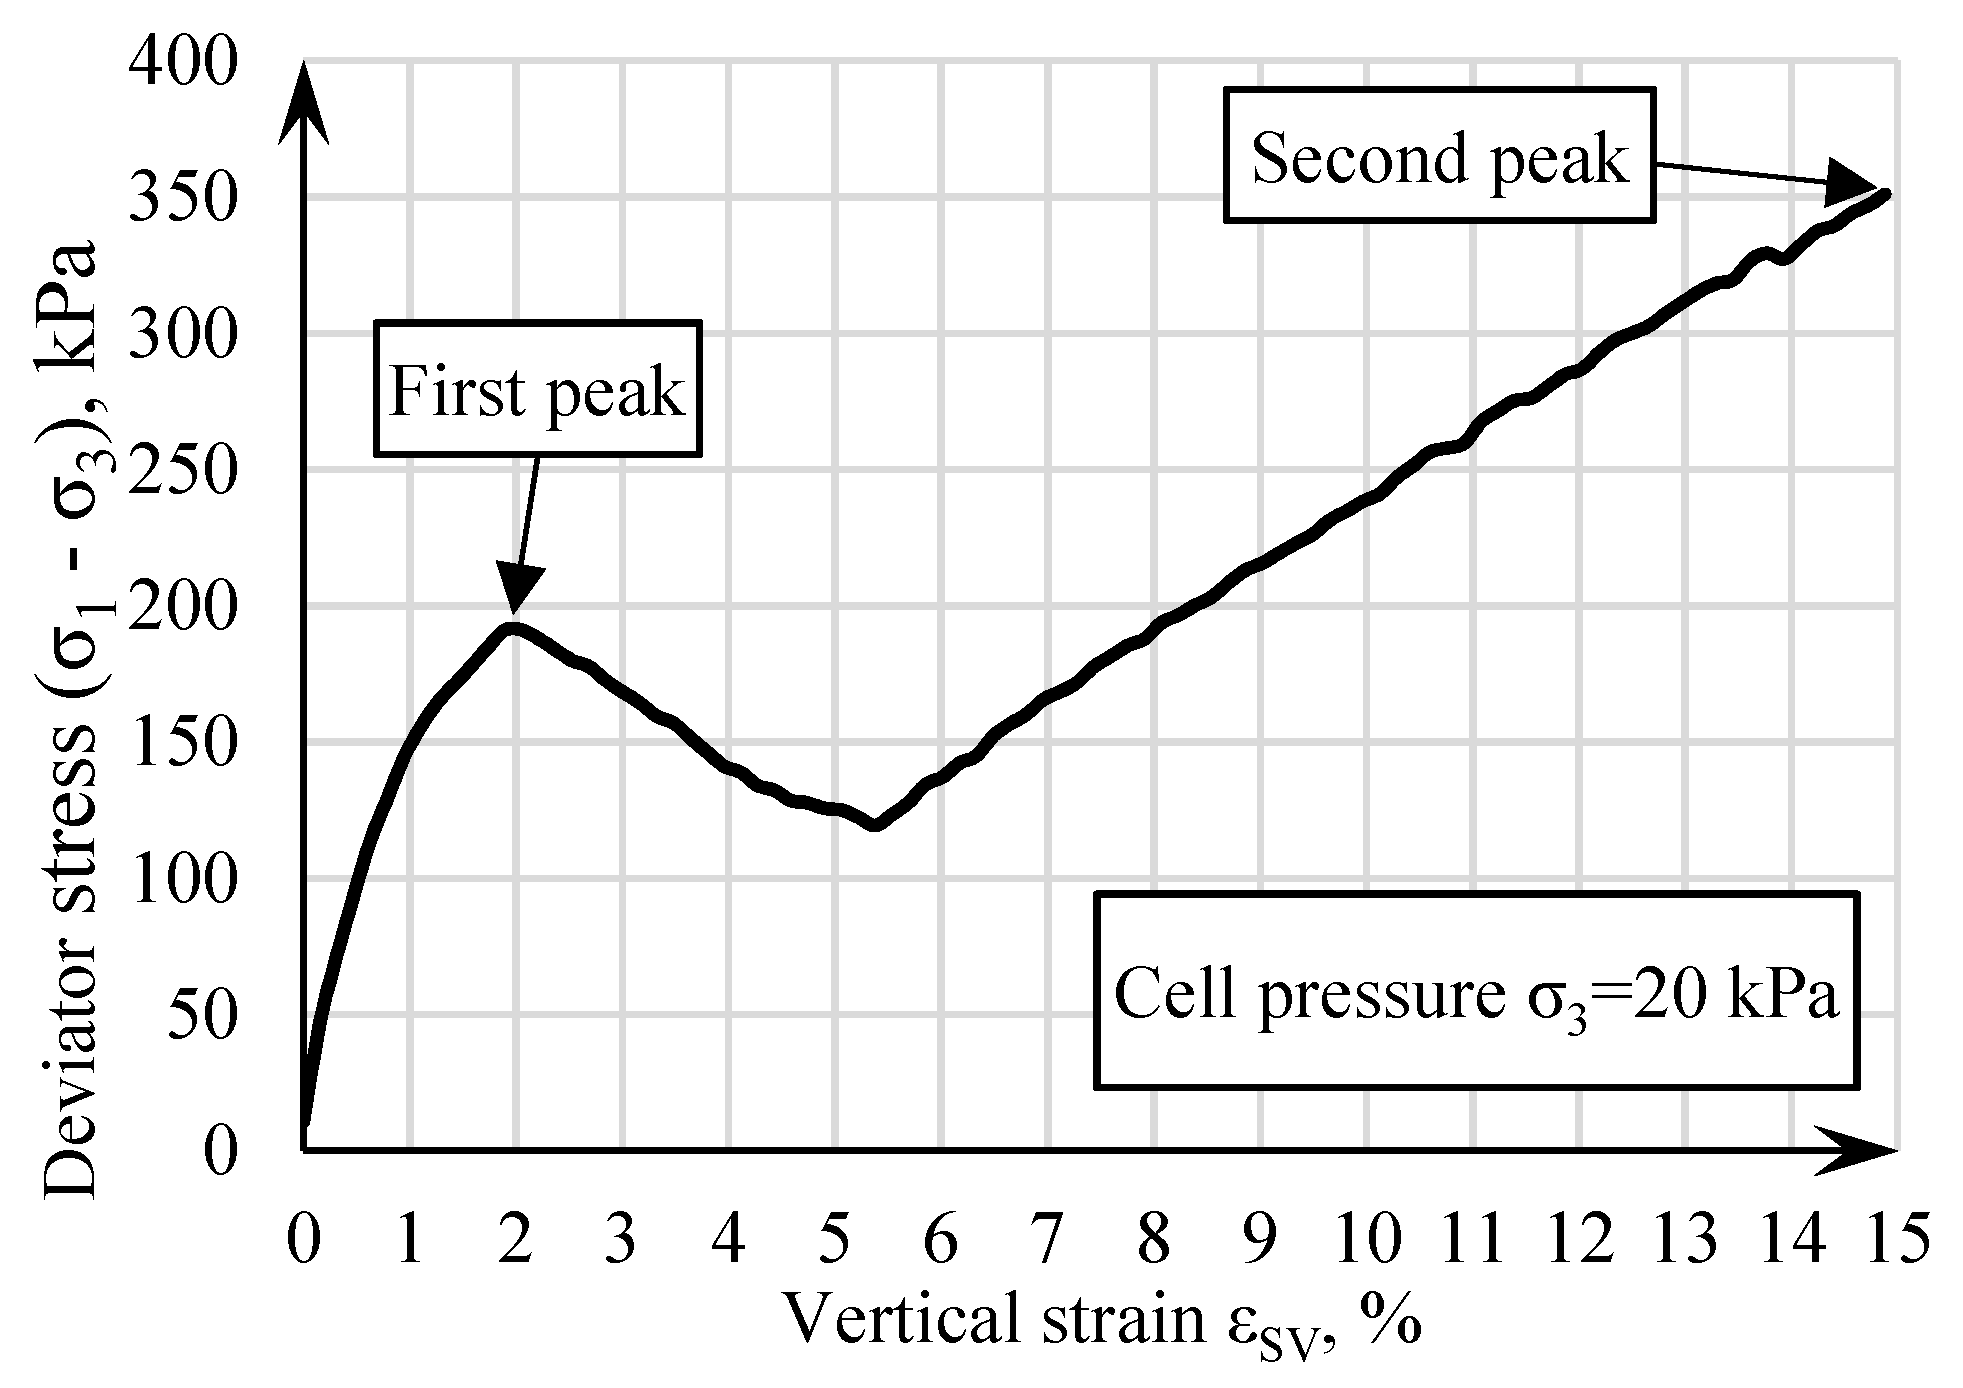
  • At a cell pressure of 20 kPa, two peak values of deviatoric stress were observed, and this phenomenon was consistent across a few soils reinforced with geogrids.
  • Gravelly soils exhibited higher vertical strains at which the maximum deviatoric stress was reached compared to sandy soils.
  • The vertical strains at which the maximum deviatoric stress was reached were higher for gravelly soils compared to sandy soils.
  • The introduction of geogrids resulted in a slight reduction in the angle of internal friction but notably increased cohesion values in both sandy and gravelly soils. This increase in apparent cohesion was more pronounced in gravelly soils.
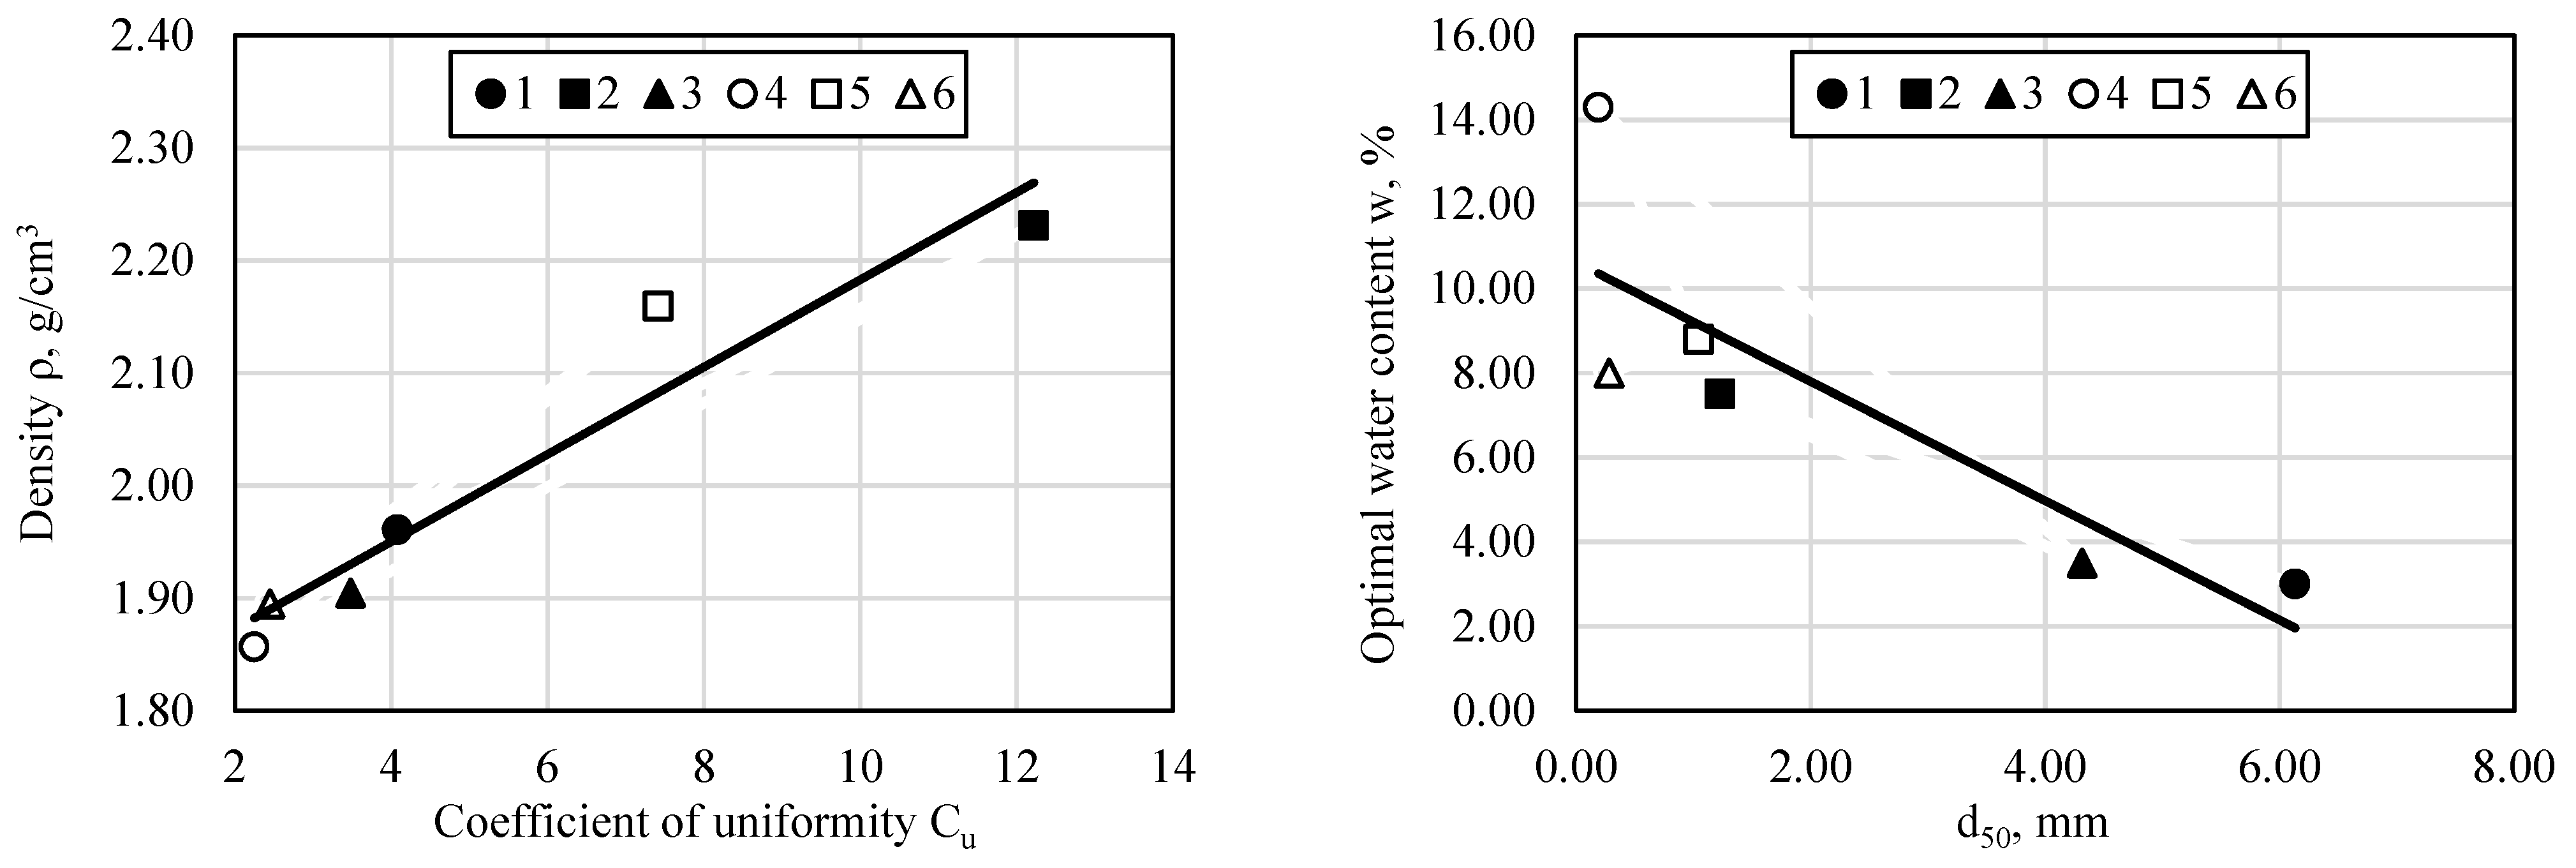
  • A strong dependence of deviatoric strength on the initial specimen density was observed, with deviatoric strength increasing as density increased. This influence of density was more noticeable in gravelly soils than in sandy soils.
  • Deviatoric strength was found to correlate with the coefficient of uniformity, with higher values corresponding to higher coefficients of uniformity. Gravelly soils consistently exhibited higher deviatoric strength values compared to sandy soils.

Author Contributions

Conceptualization, Š.S.; methodology, N.D.; validation, M.Z., Š.S. and N.D.; formal analysis, M.Z.; investigation, M.Z.; resources, M.Z.; data curation, M.Z.; writing—original draft preparation, M.Z.; writing—review and editing, Š.S.; visualization, M.Z.; supervision, Š.S.; project administration, M.Z. All authors have read and agreed to the published version of the manuscript.

Funding

This study was supported by Vilnius Gediminas Technical University Excellency center project “Civil Engineering Research Centre”, project No: 10.6-64-10.2-12545.

Institutional Review Board Statement

Not applicable.

Informed Consent Statement

Informed consent was obtained from all subjects involved in the study.

Data Availability Statement

Data are cointained within the article.

Acknowledgments

The equipment and infrastructure of the Civil Engineering Scientific Research Center of Vilnius Gediminas Technical University were employed for investigations. The authors sincerely thank HUESKER Synthetic GmbH for supporting the research with geogrids and for allowing the publication of this research work, and anonymous reviewers for their constructive comments and suggestions for improving the quality of this article.

Conflicts of Interest

The authors declare no conflict of interest. The funders had no role in the design of the study; in the collection, analyses, or interpretation of data; in the writing of the manuscript; or in the decision to publish the results.

References

  1. Shackelford, C.D. Geoenvironmental Engineering. In Reference Module in Earth Systems and Environmental Sciences; Elsevier: Amsterdam, The Netherlands, 2013; p. B9780124095489054245. ISBN 978-0-12-409548-9. [Google Scholar]
  2. Šiukščius, A.; Vorobjovas, V.; Vaitkus, A.; Mikaliūnas, Š.; Zariņš, A. Long Term Behaviour of An Asphalt Pavement Structure Constructed on a Geogrid-Reinforced Subgrade Over Soft Soils. BJRBE 2019, 14, 384–404. [Google Scholar] [CrossRef]
  3. Roodi, G.H.; Zornberg, J.G.; Yang, L.; Kumar, V.V. Cross-Shear Test for Geosynthetic-Reinforced Asphalt. Transp. Geotech. 2023, 38, 100902. [Google Scholar] [CrossRef]
  4. Zofka, A.; Maliszewski, M.; Zofka, E.; Paliukaitė, M.; Žalimienė, L. Geogrid Reinforcement of Asphalt Pavements. Balt. J. Road Bridge Eng. 2017, 12, 181–186. [Google Scholar] [CrossRef]
  5. Liu, K.-F.; Feng, W.-Q.; Cai, Y.-H.; Xu, H.; Wu, P.-C. Physical Model Study of Pile Type Effect on Long-Term Settlement of Geosynthetic-Reinforced Pile-Supported Embankment under Traffic Loading. Transp. Geotech. 2023, 38, 100923. [Google Scholar] [CrossRef]
  6. Miranda, M.; Da Costa, A.; Castro, J.; Sagaseta, C. Influence of Geotextile Encasement on the Behaviour of Stone Columns: Laboratory Study. Geotext. Geomembr. 2017, 45, 14–22. [Google Scholar] [CrossRef]
  7. Izadi, A.; Nalkiashari, L.A.; Payan, M.; Chenari, R.J. Bearing Capacity of Shallow Strip Foundations on Reinforced Soil Subjected to Combined Loading Using Upper Bound Theorem of Finite Element Limit Analysis and Second-Order Cone Programming. Comput. Geotech. 2023, 160, 105550. [Google Scholar] [CrossRef]
  8. Yaghoobi, B.; Fathipour, H.; Payan, M.; Jamshidi Chenari, R. Bearing Capacity of Footings on Geosynthetic-Reinforced Soils under Combined Loading. Geosynth. Int. 2023, 2023, 385. [Google Scholar] [CrossRef]
  9. Scheiner, S.; Pichler, B.; Hellmich, C.; Eberhardsteiner, J. Loading of Soil-Covered Oil and Gas Pipelines Due to Adverse Soil Settlements—Protection against Thermal Dilatation-Induced Wear, Involving Geosynthetics. Comput. Geotech. 2006, 33, 371–380. [Google Scholar] [CrossRef]
  10. Poberezhnyi, V.; Hangen, H.; Lenze, B. Environmental Benefits of Geosynthetics in Construction Projects. In Modern Building Materials, Structures and Techniques; Barros, J.A.O., Kaklauskas, G., Zavadskas, E.K., Eds.; Lecture Notes in Civil Engineering; Springer Nature: Cham, Switzerland, 2023; Volume 392, pp. 597–604. ISBN 978-3-031-44602-3. [Google Scholar]
  11. Bhardwaj, A.; Mittal, S. Influence of Biaxial Geogrid at the Ballast Interface for Granular Earth Railway Embankment. BJRBE 2022, 17, 1–20. [Google Scholar] [CrossRef]
  12. Sert, T.; Akpınar, M.V. Investigation of Geogrid Aperture Size Effects on Subbasesubgrade Stabilization of Asphalt Pavements. Balt. J. Road Bridge Eng. 2012, 7, 160–168. [Google Scholar] [CrossRef]
  13. Zakarka, M.; Skuodis, Š. Analysis of Soil-Geogrid Interaction and Alternative Soil Layer Approach for Improved Road Embankment Stability. In Modern Building Materials, Structures and Techniques; Barros, J.A.O., Kaklauskas, G., Zavadskas, E.K., Eds.; Lecture Notes in Civil Engineering; Springer Nature: Cham, Switzerland, 2023; Volume 392, pp. 643–649. ISBN 978-3-031-44602-3. [Google Scholar]
  14. Zornberg, J.G. Functions and Applications of Geosynthetics in Roadways. Procedia Eng. 2017, 189, 298–306. [Google Scholar] [CrossRef]
  15. Makkar, F.M. A Review on the Behaviour of Soil against Different Geosynthetic Interfaces. In Proceedings of the International Conference on Geotechnics for High Speed Corridors, Thiruvananthapuram, India, 24–27 July 2019. [Google Scholar]
  16. Madani, N.; Hosseinpour, I.; Payan, M.; Senetakis, K. Cyclic and Postcyclic Interface Characteristics of Geotextile-Embedded Sand-Rubber Composites. J. Mater. Civ. Eng. 2023, 35, 04022418. [Google Scholar] [CrossRef]
  17. Han, B.; Ling, J.; Shu, X.; Gong, H.; Huang, B. Laboratory Investigation of Particle Size Effects on the Shear Behavior of Aggregate-Geogrid Interface. Constr. Build. Mater. 2018, 158, 1015–1025. [Google Scholar] [CrossRef]
  18. He, Z.; Mo, H.; Siga, A.; Zou, J. Research on the Parameters of Nonlinear Hyperbolic Model for Clay-Geogrid Interfaces Based on Large Scale Direct Shear Tests. Transp. Geotech. 2019, 18, 39–45. [Google Scholar] [CrossRef]
  19. Stacho, J.; Sulovska, M.; Slavik, I. Determining the Shear Strength Properties of a Soil-Geogrid Interface Using a Large-Scale Direct Shear Test Apparatus. Period. Polytech. Civ. Eng. 2020, 64, 989–998. [Google Scholar] [CrossRef]
  20. Tiwari, N.; Satyam, N. An Experimental Study on Strength Improvement of Expansive Subgrades by Polypropylene Fibers and Geogrid Reinforcement. Sci. Rep. 2022, 12, 6685. [Google Scholar] [CrossRef] [PubMed]
  21. Zhang, J.; Ji, M.; Jia, Y.; Miao, C.; Wang, C.; Zhao, Z.; Zheng, Y. Anisotropic Shear Strength Behavior of Soil–Geogrid Interfaces. Appl. Sci. 2021, 11, 11387. [Google Scholar] [CrossRef]
  22. Gao, J.; Liu, L.; Zhang, Y.; Xie, X. Deformation Mechanism and Soil Evolution Analysis Based on Different Types Geogrid Reinforced Foundation. Constr. Build. Mater. 2022, 331, 127322. [Google Scholar] [CrossRef]
  23. Infante, D.J.U.; Martinez, G.M.A.; Arrua, P.A.; Eberhardt, M. Shear Strength Behavior of Different Geosynthetic Reinforced Soil Structure from Direct Shear Test. Int. J. Geosynth. Ground Eng. 2016, 2, 17. [Google Scholar] [CrossRef]
  24. Liu, F.Y.; Zheng, Q.T.; Wang, J.; Fu, H.T.; Gao, Z.Y.; Ni, J.F. Effect of Particle Shape on Shear Behaviour of Aggregate-Geogrid Interface under Different Aperture Ratios. Int. J. Pavement Eng. 2022, 23, 2099–2109. [Google Scholar] [CrossRef]
  25. Liu, W.; Li, H.; Yang, Y.; Xu, P.; Dai, Z.; Yang, G.; Wang, H.; Wang, Z. Study on Improvement Characteristics of a Novel Geotextile with Stitched Transverse Ribs. Appl. Sci. 2023, 13, 1536. [Google Scholar] [CrossRef]
  26. Zhang, G.; Yang, Y.; Su, F. Parameter Optimization of Geogrid-Reinforced Foundations Based on Model Experiments and Numerical Simulations. Appl. Sci. 2019, 9, 3592. [Google Scholar] [CrossRef]
  27. Feng, S.-J.; Wang, Y.-Q. DEM Simulation of Geogrid–Aggregate Interface Shear Behavior: Optimization of the Aperture Ratio Considering the Initial Interlocking States. Comput. Geotech. 2023, 154, 105182. [Google Scholar] [CrossRef]
  28. Xue, J.; Liu, Z.; Chen, J. Triaxial Compressive Behaviour of Geotextile Encased Stone Columns. Comput. Geotech. 2019, 108, 53–60. [Google Scholar] [CrossRef]
  29. Bai, J.; Diao, Y.; Jia, C.; Liu, C.; Zhang, M.; Wang, C. A Review of Advances in Triaxial Tests: Instruments, Test Techniques and Prospects. KSCE J. Civ. Eng. 2022, 26, 3325–3341. [Google Scholar] [CrossRef]
  30. Lang, R.; Yang, A.; Yan, S. Analysis of Stress-Strain Characteristics of Geogrid Reinforced Crushed Gravel. KSCE J. Civ. Eng. 2019, 23, 549–555. [Google Scholar] [CrossRef]
  31. Chen, X.; Zhang, J.; Li, Z. Shear Behaviour of a Geogrid-Reinforced Coarse-Grained Soil Based on Large-Scale Triaxial Tests. Geotext. Geomembr. 2014, 42, 312–328. [Google Scholar] [CrossRef]
  32. Wu, C.-S.; Hong, Y.-S. Laboratory Tests on Geosynthetic-Encapsulated Sand Columns. Geotext. Geomembr. 2009, 27, 107–120. [Google Scholar] [CrossRef]
  33. Mindiastiwi, T.; Wu, P.-K.; Siswanto, A.B.; Salim, M.A. Triaxial Testing on Geogrid-Reinforced Granular Soils. IOP Conf. Ser. Mater. Sci. Eng. 2021, 1200, 012030. [Google Scholar] [CrossRef]
  34. Ding, X.; Luo, Z.; Ou, Q. Mechanical Property and Deformation Behavior of Geogrid Reinforced Calcareous Sand. Geotext. Geomembr. 2022, 50, 618–631. [Google Scholar] [CrossRef]
  35. Raisinghani, D.V.; Viswanadham, B.V.S. Evaluation of Permeability Characteristics of a Geosynthetic-Reinforced Soil through Laboratory Tests. Geotext. Geomembr. 2010, 28, 579–588. [Google Scholar] [CrossRef]
  36. Mohamadi Merse, M.; Hosseinpour, I.; Payan, M.; Jamshidi Chenari, R.; Mohapatra, S.R. Shear Strength Behavior of Soft Clay Reinforced with Ordinary and Geotextile-Encased Granular Columns. Int. J. Geosynth. Ground Eng. 2023, 9, 79. [Google Scholar] [CrossRef]
  37. Rasti, A.; Adarmanabadi, H.R.; Pineda, M.; Reinikainen, J. Evaluating the Effect of Soil Particle Characterization on Internal Friction Angle. Am. J. Eng. Appl. Sci. 2021, 14, 129–138. [Google Scholar] [CrossRef]
  38. Skuodis, Š.; Dirgėlienė, N.; Medzvieckas, J. Using Triaxial Tests to Determine the Shearing Strength of Geogrid-Reinforced Sand. Stud. Geotech. Et Mech. 2020, 42, 341–354. [Google Scholar] [CrossRef]
  39. Han, B.; Ling, J.; Shu, X.; Song, W.; Boudreau, R.L.; Hu, W.; Huang, B. Quantifying the Effects of Geogrid Reinforcement in Unbound Granular Base. Geotext. Geomembr. 2019, 47, 369–376. [Google Scholar] [CrossRef]
  40. Ahmed Kamel, M.; Chandra, S.; Kumar, P. Behaviour of Subgrade Soil Reinforced with Geogrid. Int. J. Pavement Eng. 2004, 5, 201–209. [Google Scholar] [CrossRef]
  41. Nguyen, M.D.; Yang, K.H.; Lee, S.H.; Wu, C.S.; Tsai, M.H. Behavior of Nonwoven-Geotextile-Reinforced Sand and Mobilization of Reinforcement Strain under Triaxial Compression. Geosynth. Int. 2013, 20, 207–225. [Google Scholar] [CrossRef]
  42. Fathipour, H.; Payan, M.; Jamshidi Chenari, R. Limit Analysis of Lateral Earth Pressure on Geosynthetic-Reinforced Retaining Structures Using Finite Element and Second-Order Cone Programming. Comput. Geotech. 2021, 134, 104119. [Google Scholar] [CrossRef]
  43. Thắng, H.V. Determination of the Confining Effect of Geogrid Rein-Forcement from Large Scale Triaxial Tests. CTU J. 2016, 4, 6. [Google Scholar] [CrossRef]
  44. Pavanello, P.; Carrubba, P.; Moraci, N. Geosynthetic Interface Friction at Low Normal Stress: Two Approaches with Increasing Shear Loading. Appl. Sci. 2022, 12, 1065. [Google Scholar] [CrossRef]
  45. Miranda, M.; Da Costa, A. Laboratory Analysis of Encased Stone Columns. Geotext. Geomembr. 2016, 44, 269–277. [Google Scholar] [CrossRef]
  46. Cui, X.; Du, Y.; Hao, J.; Bao, Z.; Jin, Q.; Li, X.; Zhang, S.; Zhang, X. Three-Dimensional Spatial Stress State of Highway Subgrade under Vehicle Load: Experimental Evidence and Evaluation Model. Int. J. Pavement Eng. 2023, 24, 2268795. [Google Scholar] [CrossRef]
  47. Zu, F.; Du, C.; Han, C.; Xu, L.; Peng, Q. Applicable Conditions of Room-and-Pillar Mining Goaf Treatment Methods under a Traffic Load. Appl. Sci. 2023, 13, 2024. [Google Scholar] [CrossRef]
  48. Zakarka, M. Analysis of the Traffic Load–Induced Stresses of Embankment. Sci. Future Lith. 2022, 14, 15179. [Google Scholar] [CrossRef]
  49. LST EN ISO 17892-4:2017; Geotechnical Investigation and Testing—Laboratory Testing of Soil—Part 4: Determination of Particle Size Distribution. Lithuanian Standards Board: Vilnius, Lithuania, 2017.
  50. LST 1331:2022; Soils for Use in Roads and Their Buildings Construction—Classification. Lithuanian Standards Board: Vilnius, Lithuania, 2022.
  51. LST EN ISO 14688-2:2018; Geotechnical Investigation and Testing—Identification and Classification of Soil—Part 2: Principles for a Classification. Lithuanian Standards Board: Vilnius, Lithuania, 2018.
  52. LST EN 13286-2:2010/AC:2013; Unbound and Hydraulically Bound Mixtures—Part 2: Test Methods for Laboratory Reference Density and Water Content—Proctor Compaction. Lithuanian Standards Board: Vilnius, Lithuania, 2013.
  53. Latha, G.M.; Varman, N.A.M. Static and Cyclic Load Response of Reinforced Sand through Large Triaxial Tests. JGS Spec. Publ. 2016, 2, 2342–2346. [Google Scholar] [CrossRef]
  54. LST EN ISO 17892-9:2018; Geotechnical Investigation and Testing—Laboratory Testing of Soil—Part 9: Consolidated Triaxial Compression Tests on Water Saturated Soils. Lithuanian Standards Board: Vilnius, Lithuania, 2018.
  55. Dirgėlienė, N.; Skuodis, Š.; Vasys, E. The Behaviour of Stress Variation in Sandy Soil. Open Geosci. 2022, 14, 13–23. [Google Scholar] [CrossRef]
Figure 1. Particle size distribution curves (sample numbering coincides with the numbering given in Table 1).
Applsci 13 12480 g001
Figure 2. Preparation of the samples example used in the triaxial cell: (left)—prepared soil sample; (right)—geogrid top view in the middle of the sample.
Applsci 13 12480 g002
Figure 3. Influence of cell pressure on the mechanical properties of soil No. 4.
Applsci 13 12480 g003
Figure 4. Relationship between deviatoric stress and vertical strain of soil No. 5.
Applsci 13 12480 g004
Figure 5. Geogrid appearance after testing: (a) single peak during shear; (b) dual peaks during shear.
Applsci 13 12480 g005
Figure 6. The shape of failure: (above)—without geogrid; (below)—with geogrid.
Applsci 13 12480 g006
Figure 7. Vertical strain at maximum deviatoric stress.
Applsci 13 12480 g007
Figure 8. The relationship between the density and the maximum deviatoric stress, and between the coefficient of uniformity and the maximum deviatoric stress.
Applsci 13 12480 g008aApplsci 13 12480 g008b
Figure 9. Variations of soil properties with Cu and d50.
Applsci 13 12480 g009
Table 1. Classification of soils based on grading.
Sample No.Soil Classification Systemd10d30d50d60CUCC
LST 1331:2022LST EN ISO 14688-2Unified Soil Classification System
1ŽBGrPGrP1.953.626.137.944.080.85
2ŽGGrMGrP0.170.511.232.1012.220.72
3ŽPGrPGrP1.542.644.315.373.480.84
4SBSaUSaP0.090.150.190.212.251.08
5SGSaMSaP0.230.441.051.697.420.51
6SPSaUSaP0.140.200.280.352.450.79
Table 2. Physical properties of soils.
Sample No. *Water Content Determined by Standard Proctor Compaction Test w, %Dry Density of the Soil Determined by the Standard Proctor Compaction Test ρd, g/cm3Sample Density (Prepared) ρ, g/cm3
13.001.901.96
27.502.082.23
33.501.831.90
414.301.651.86
58.801.982.16
68.001.751.90
* Sample numbering coincides with the numbering given in Table 1.
Table 3. Physical and mechanical properties of the geogrid.
PropertyUnitValue
Mesh sizemm25 × 25
Mass per unit areag/m2260
Ultimate tensile strengthkN/m≥40
Strain at nominal tensile strength%≤10
Table 4. Effect of cell pressure on maximum deviatoric stress for soil No. 4.
σ3, kPaDeviatoric Stress (σ1–σ3), kPaReinforcement Effect Rσ
Without GeogridWith Geogrid
20106.94145.981.37
50208.04244.191.17
70339.94364.481.07
100393.21419.121.07
200697.33742.131.06
3001146.011154.491.01
Table 5. Summary of the results of the triaxial compression test for maximum deviatoric stress and reinforcement effect.
Sample No. *Test ConditionsMaximum Deviatoric Stress, kPaReinforcement Effect Rσ
σ3 = 20 kPaσ3 = 50 kPaσ3 = 70 kPaσ3 = 20 kPaσ3 = 50 kPaσ3 = 70 kPa
1Without geogrid144.68281.32428.961.261.301.08
With geogrid182.92364.40465.12
2Without geogrid195.97380.48475.561.241.101.13
With geogrid242.31418.88538.55
3Without geogrid141.78284.98394.801.261.091.07
With geogrid178.30310.54422.40
4Without geogrid106.94208.04339.941.371.171.07
With geogrid145.98244.19364.48
5Without geogrid121.65238.46365.491.371.311.11
With geogrid166.10311.58405.40
6Without geogrid124.75234.97328.171.251.181.08
With geogrid155.48278.17355.52
Average1.291.191.09
* Sample numbering coincides with the numbering given in Table 1.
Table 6. Summary of the results of the triaxial compression test for the angle of internal friction and cohesion.
Sample No. *Without GeogridWith GeogridDifference
φmean, °cmean, kPaφmean, °cmean, kPaφmean, °cmean, kPa
148.380.0048.157.03−0.237.03
248.466.2948.8716.390.4110.10
346.350.8545.769.31−0.598.47
444.240.0043.983.61−0.263.61
545.440.0044.719.94−0.739.94
643.101.8142.3810.65−0.308.84
* Sample numbering coincides with the numbering given in Table 1.
Disclaimer/Publisher’s Note: The statements, opinions and data contained in all publications are solely those of the individual author(s) and contributor(s) and not of MDPI and/or the editor(s). MDPI and/or the editor(s) disclaim responsibility for any injury to people or property resulting from any ideas, methods, instructions or products referred to in the content.

