Article

Variability of Air Pollutants in the Indoor Air of a General Store

1
Interdisciplinary School of Doctoral Studies, “Aurel Vlaicu” University, 2 Elena Drăgoi, 310330 Arad, Romania
2
Institute for Research, Development and Innovation in Technical and Natural Sciences, Faculty of Food Engineering, Tourism and Environmental Protection, Aurel Vlaicu University of Arad, Elena Drăgoi St., No. 2, 310330 Arad, Romania
3
2nd Department of Internal Medicine, Iuliu Hatieganu University of Medicine and Pharmacy, 400347 Cluj-Napoca, Romania
*
Author to whom correspondence should be addressed.
Appl. Sci. 2023, 13(23), 12572; https://doi.org/10.3390/app132312572
Submission received: 24 October 2023 / Revised: 16 November 2023 / Accepted: 20 November 2023 / Published: 22 November 2023

Abstract

:

Featured Application

The potential application of this study’s findings is to inform and guide workplace health and safety policies and practices in the retail sector.

Abstract

This research investigates different facets of indoor air quality and the corresponding health symptoms within a retail environment. Formaldehyde, classified as a Group B carcinogenic substance, was found within safe limits indoors, primarily originating from surface coatings, flooring products, textiles, and furniture. Monoterpenes, lactic acid, and particulate matter levels were also assessed, with varying indoor–outdoor ratios. Notably, we identified a relatively low concentration of PM2.5, possibly influenced by enhanced cleaning practices during the COVID-19 pandemic. Symptom assessment revealed that many young workers experienced work-related symptoms, notably fatigue, nose-, throat-, and skin-related issues, aligning with previous findings. Although we could not conclusively link these symptoms to sick building syndrome (SBS) or formaldehyde exposure, it underscores the importance of further investigation. Notably, we observed no gender-based differences in symptom prevalence, but this study’s limited size requires caution in generalization. This study contributes to understanding indoor air quality and associated symptoms in an economically significant sector, emphasizing the need for continued research, especially considering the potential impact on workforce health in the broader context.

1. Introduction

Retail establishments are indoor environments where individuals spend a significant amount of their time while they are not at home. The US Bureau of Labor Statistics shows that the time spent by persons aged 15 years and over purchasing goods and services was 40.8 min/day in 2021 [1]. Even though this time is decreasing compared with the pre-pandemic period (45 min/day in 2019) and because of the growth of online shopping, people often go shopping not just to acquire stuff but also to alleviate emotional distress [2,3]. In Australia, a survey conducted from November 2020 to July 2021 showed that males shopped for 60 min/day while females shopped for 66 min [4]. The average time spent shopping by men and women in Europe is around 60 min, according to a survey in all European countries [5]. Customer satisfaction in the store is impacted by the thermal environment, with the comfort of occupants relying on both the thermal conditions and human thermal comfort. In contrast to residential and office structures, individuals are more likely to exit unfavorable indoor environments in retail establishments [6]. Because humans spend so much time inside, indoor air quality (IAQ) significantly impacts human health and has received a great deal of attention in recent decades [7,8,9,10,11,12,13]. Indoor environments expose individuals to a range of air pollutants, including various size fractions of particulate matter (PM1, PM2.5, PM10) and gaseous pollutants such as carbon monoxide (CO), carbon dioxide (CO2), nitrogen dioxide (NO2), ozone (O3), sulfur dioxide (SO2), and volatile organic compounds (VOCs). The origins of these pollutants can be diverse, stemming from sources like smoking, cooking, building materials, furnishings, space heaters, pesticides, personal care products, office equipment, cleaning products, and paints. Additionally, outdoor pollutants can infiltrate indoor spaces through ventilation [14,15,16]. Formaldehyde is emitted by carpets, pressed wood products, building materials, and consumer items. It is produced as a byproduct of indoor secondary chemical processes, and larger quantities have been discovered in offices and retail establishments at a level of 28.5 µg/m3 [17]. The levels of formaldehyde in indoor air are contingent on factors such as the ratio of product surface to air volume, the product’s nature, temperature, product age, relative humidity, and emission rates [18,19]. Formaldehyde air levels found in homes ranged from 9.7 to 47.7 μg/m3, while outside, the concentrations ranged from 0.96 to 3.37 μg/m3 [20]. Formaldehyde levels inside newly renovated homes in China averaged 153 g/m3 from 2011 to 2015 [21]. Formaldehyde can irritate the eyes, sinuses, and mouth, even at low concentrations [22,23]. Formaldehyde can affect respiratory function and produce skin rashes at higher concentrations [24].
Elevated concentrations of 2-butoxyethanol, D-limonene, and toluene were likewise identified in general stores across the United States, corresponding to sources like cleaning, polishing, and waxing agents, as well as adhesives, paints, and compounds containing solvents [17]. The quantities of volatile organic compounds (VOCs) within retail establishments are significantly higher than those in typical microenvironments such as homes, workplaces, and even cars [25,26]. An investigation of total volatile organic compounds (TVOCs) concentrations in 32 different retail stores in the Greater Memphis Area, Tennessee, U.S.A. showed that store-level TVOC concentrations ranged from 30 to 869 μg/m3 [25]. Evidence of cross-contamination between adjacent establishments and a noticeable variation in BTEX concentrations were detected in Chinese and New Jersey retail malls [27,28]. VOC concentrations can differ by three orders of magnitude between retailers, according to measurements taken in fourteen outlets in Texas and Pennsylvania [29]. Long-term exposure to some VOCs is believed to cause health issues for people, including the chance of cancer, whereas short-term exposure to low VOC concentrations often does not affect most individuals [30,31].
Particulate matter in indoor air refers to tiny particles that are suspended in the air and can be inhaled by people indoors. These particles can come from various sources, including dust, pet dander, pollen, smoke, and fumes from cooking or burning fuel. A high concentration of particulate matter with mean levels of 20.2 ± 7.3 μg/m3 (ranging from 1.4 μg/m3 to 278.5 μg/m3) for PM2.5 and 21.3 ± 7.2 μg/m3 (ranging from 2.9 μg/m3 to 279.0 μg/m3) for PM10 were found in 13 grocery stores in the Lisbon District (Portugal) [32]. The same range of concentrations was found for nine shopping malls in Hong Kong, with a maximum PM2.5 concentration of 217 μg/m3 [33]. Indoor particulate matter can negatively affect human health, particularly for individuals with respiratory or cardiovascular problems. Long-term exposure to indoor particulate matter has been linked to various health problems, including lung cancer, asthma, and heart disease [34,35]. Prolonged exposure to indoor air pollutants can determine the development of “sick building syndrome” (SBS). This syndrome was described especially in association with office buildings and refers to a higher-than-normal prevalence of various symptoms concerning the eyes, the skin, the respiratory tract, or the head [36]. These symptoms can affect 20–30% of office workers [37], while nasal symptoms (25.3%) and skin-related symptoms (19%) are most frequently reported [38]. Few studies investigated the presence of SBS in general stores [39].
In Romania, in 2021, no exceedances of the annual limit value for particulate matter were recorded. From TVOCs, only benzene is measured, and the average concentration is about 2 µg/m3 [40]. For the Romania National Air Quality Network’s local station CS-1, the one nearest to our experimental locations, the annual mean value of PM10 in 2021 was 12.21 µg/m3 [41]. A recent study conducted in Bucharest, Romania, showed that the particulate matter concentration in indoor air is 60 µg/m3 for PM10 and 40 µg/m3 for PM2.5 [42].
The western part of Romania has diverse stores, especially in large cities. Resita (an industrial town with around 60,000 inhabitants) has a mix of local businesses, grocery stores, clothing boutiques, and some specialty shops. In any event, there are few general shops with different departments. To our knowledge, there are no studies regarding indoor air quality inside the general shops in Romania.
Our study aims to assess the concentration of formaldehyde, total volatile organic compounds, monoterpenes, BTEX, lactic acid, and particulate matter in three different shop departments and outside to understand which compounds affect people and store workers in general stores while shopping or working. A secondary objective of the research was to explore the frequency of typical symptoms of SBS among the store’s employees.

2. Materials and Methods
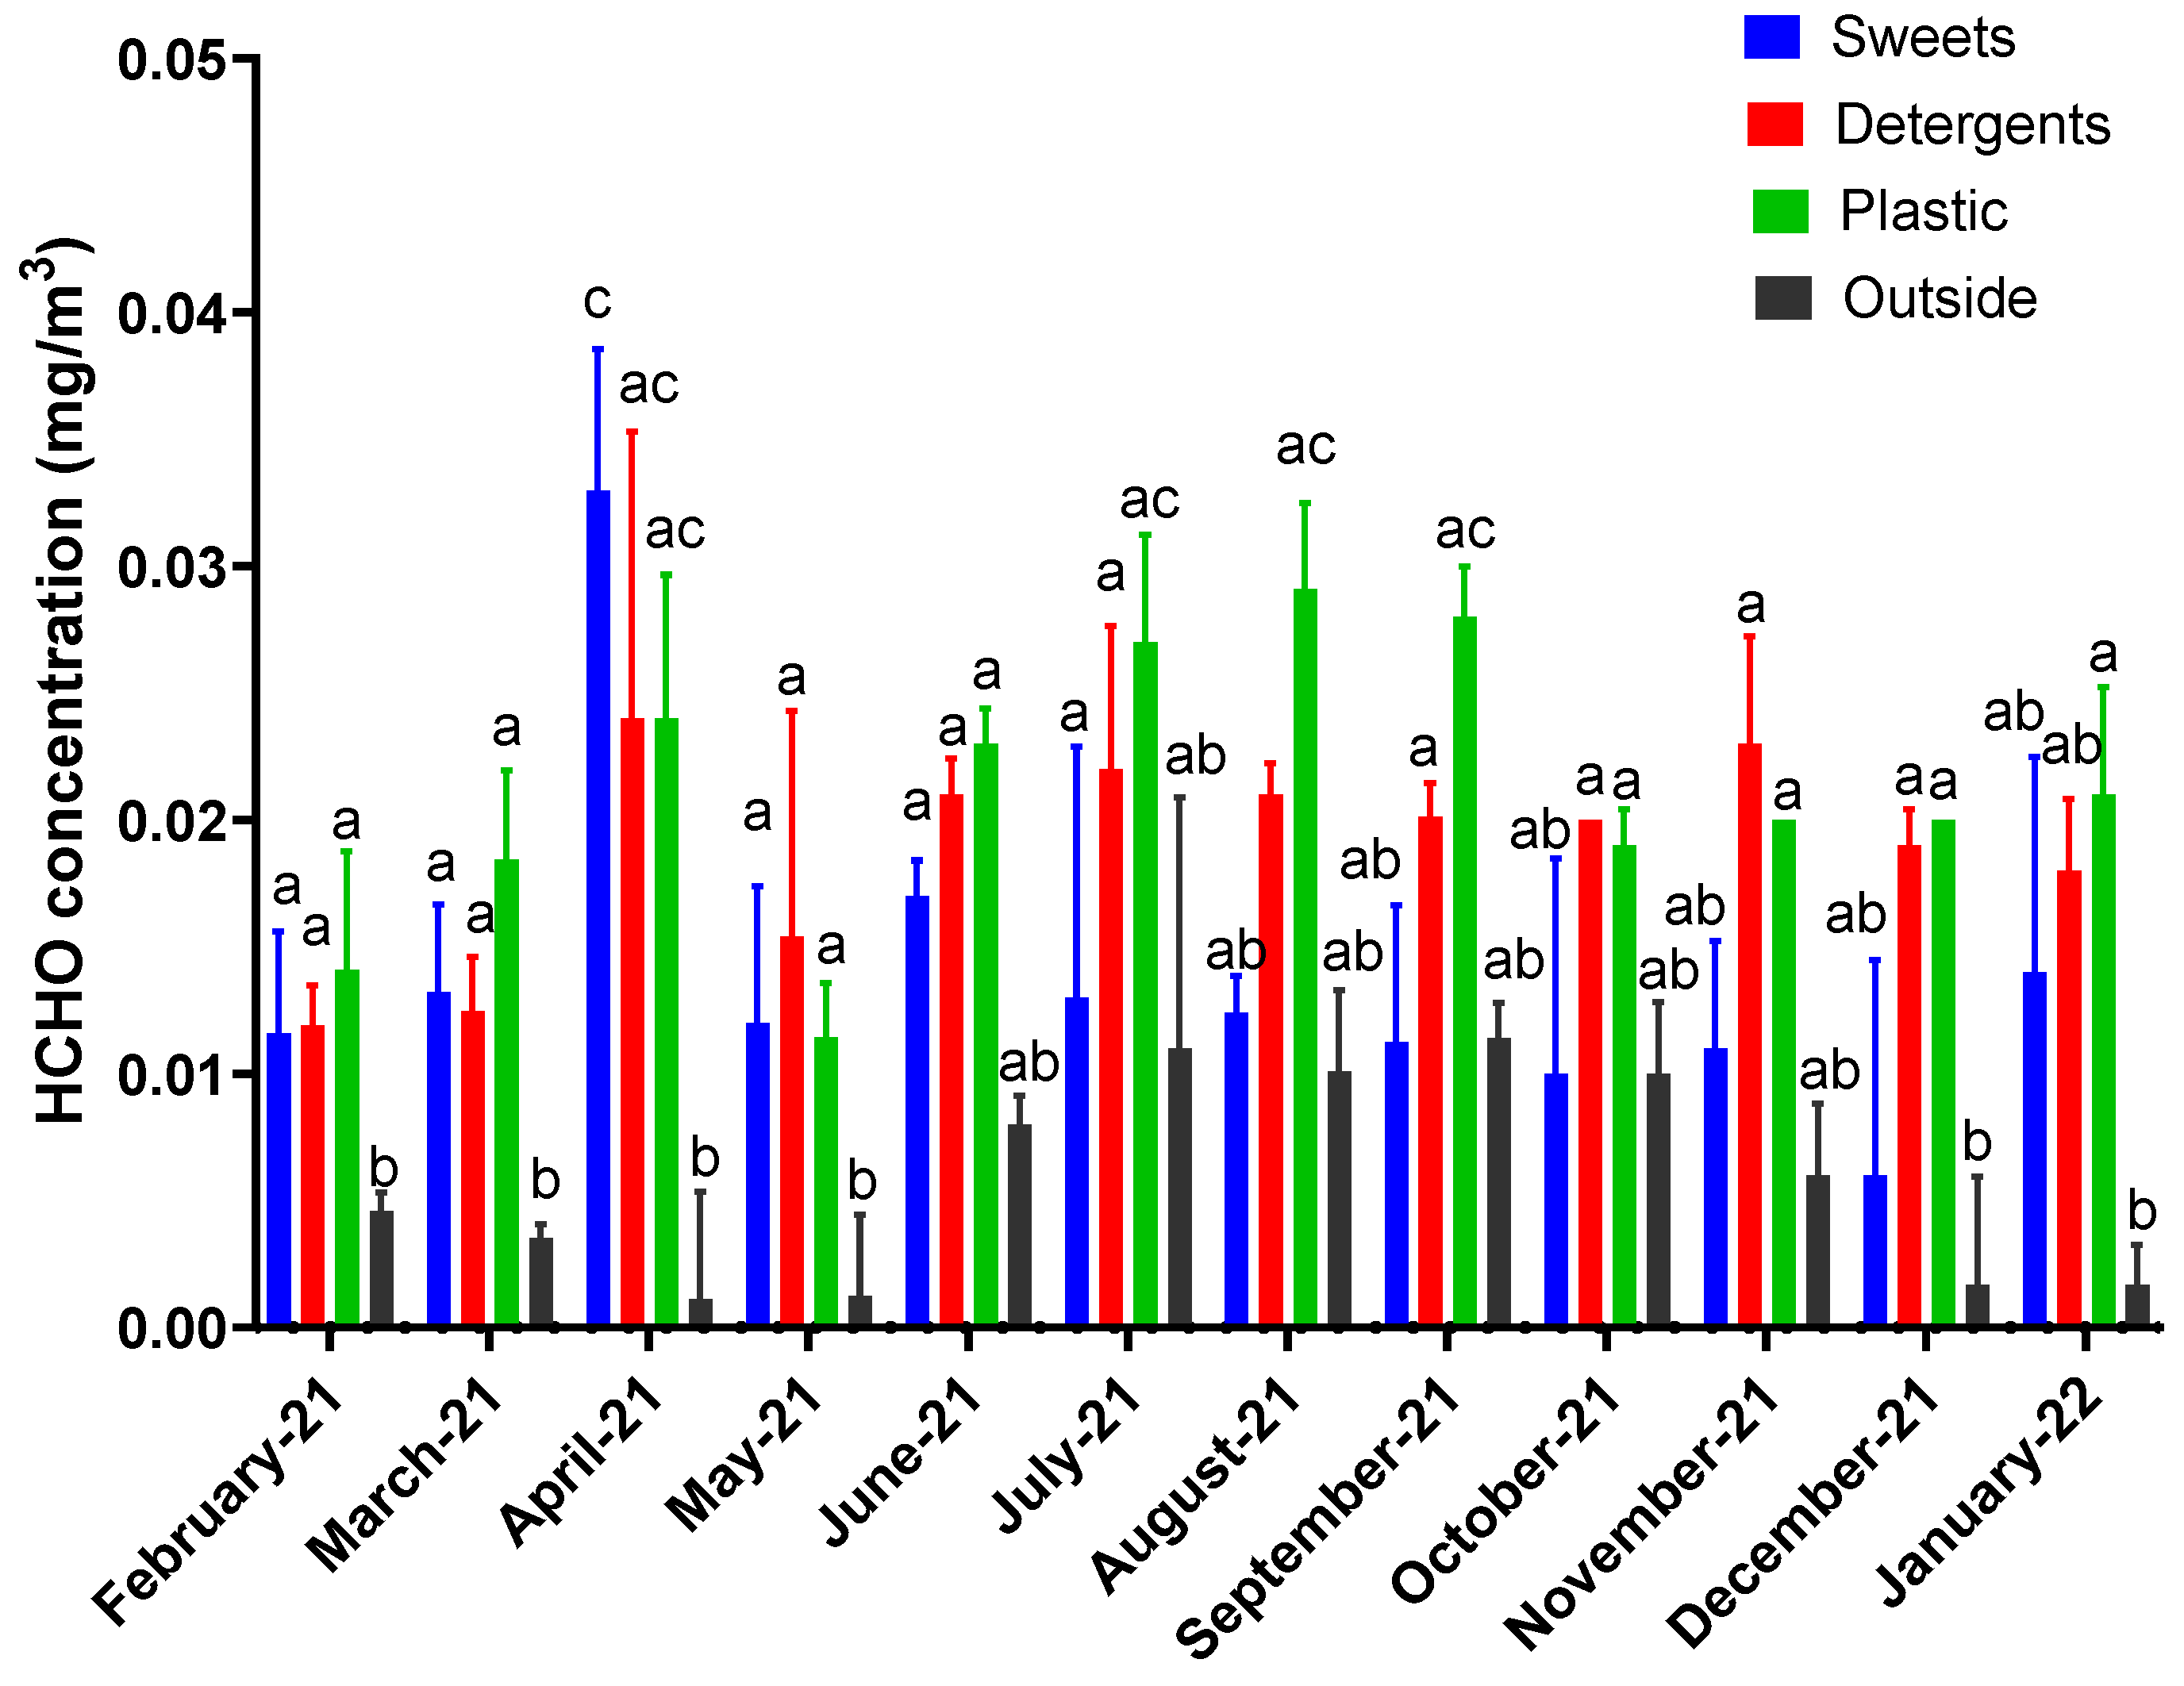
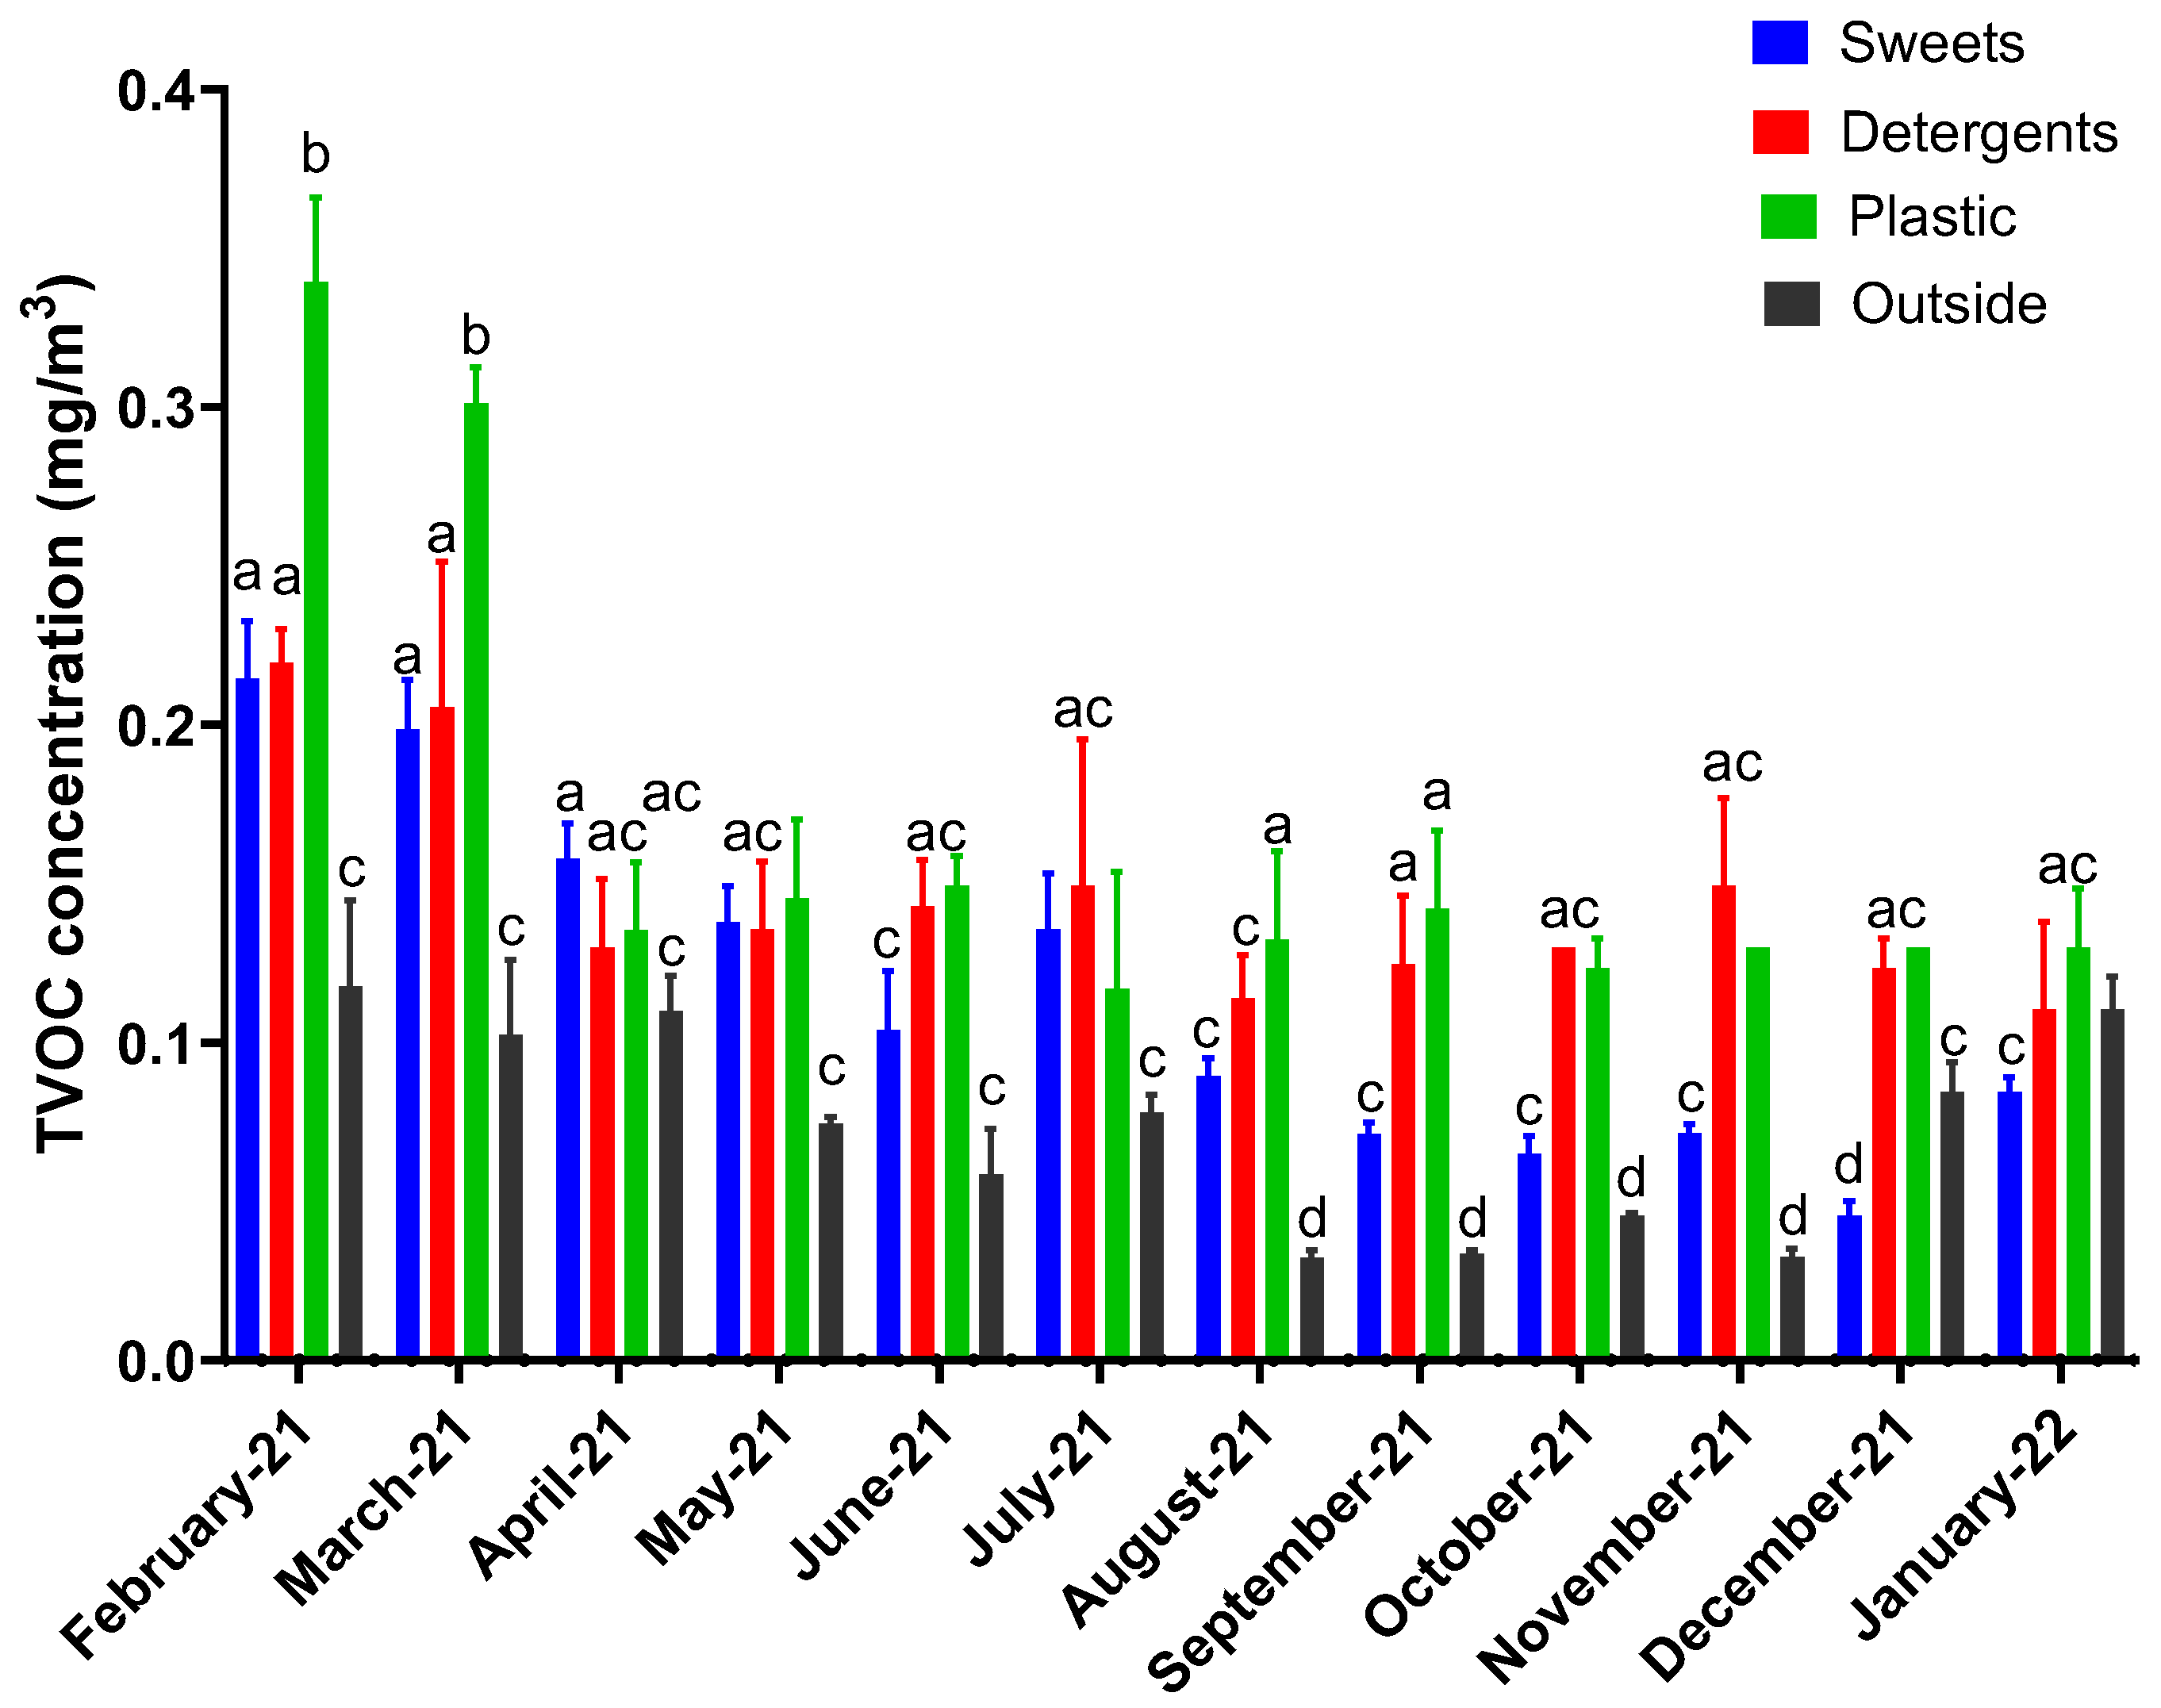
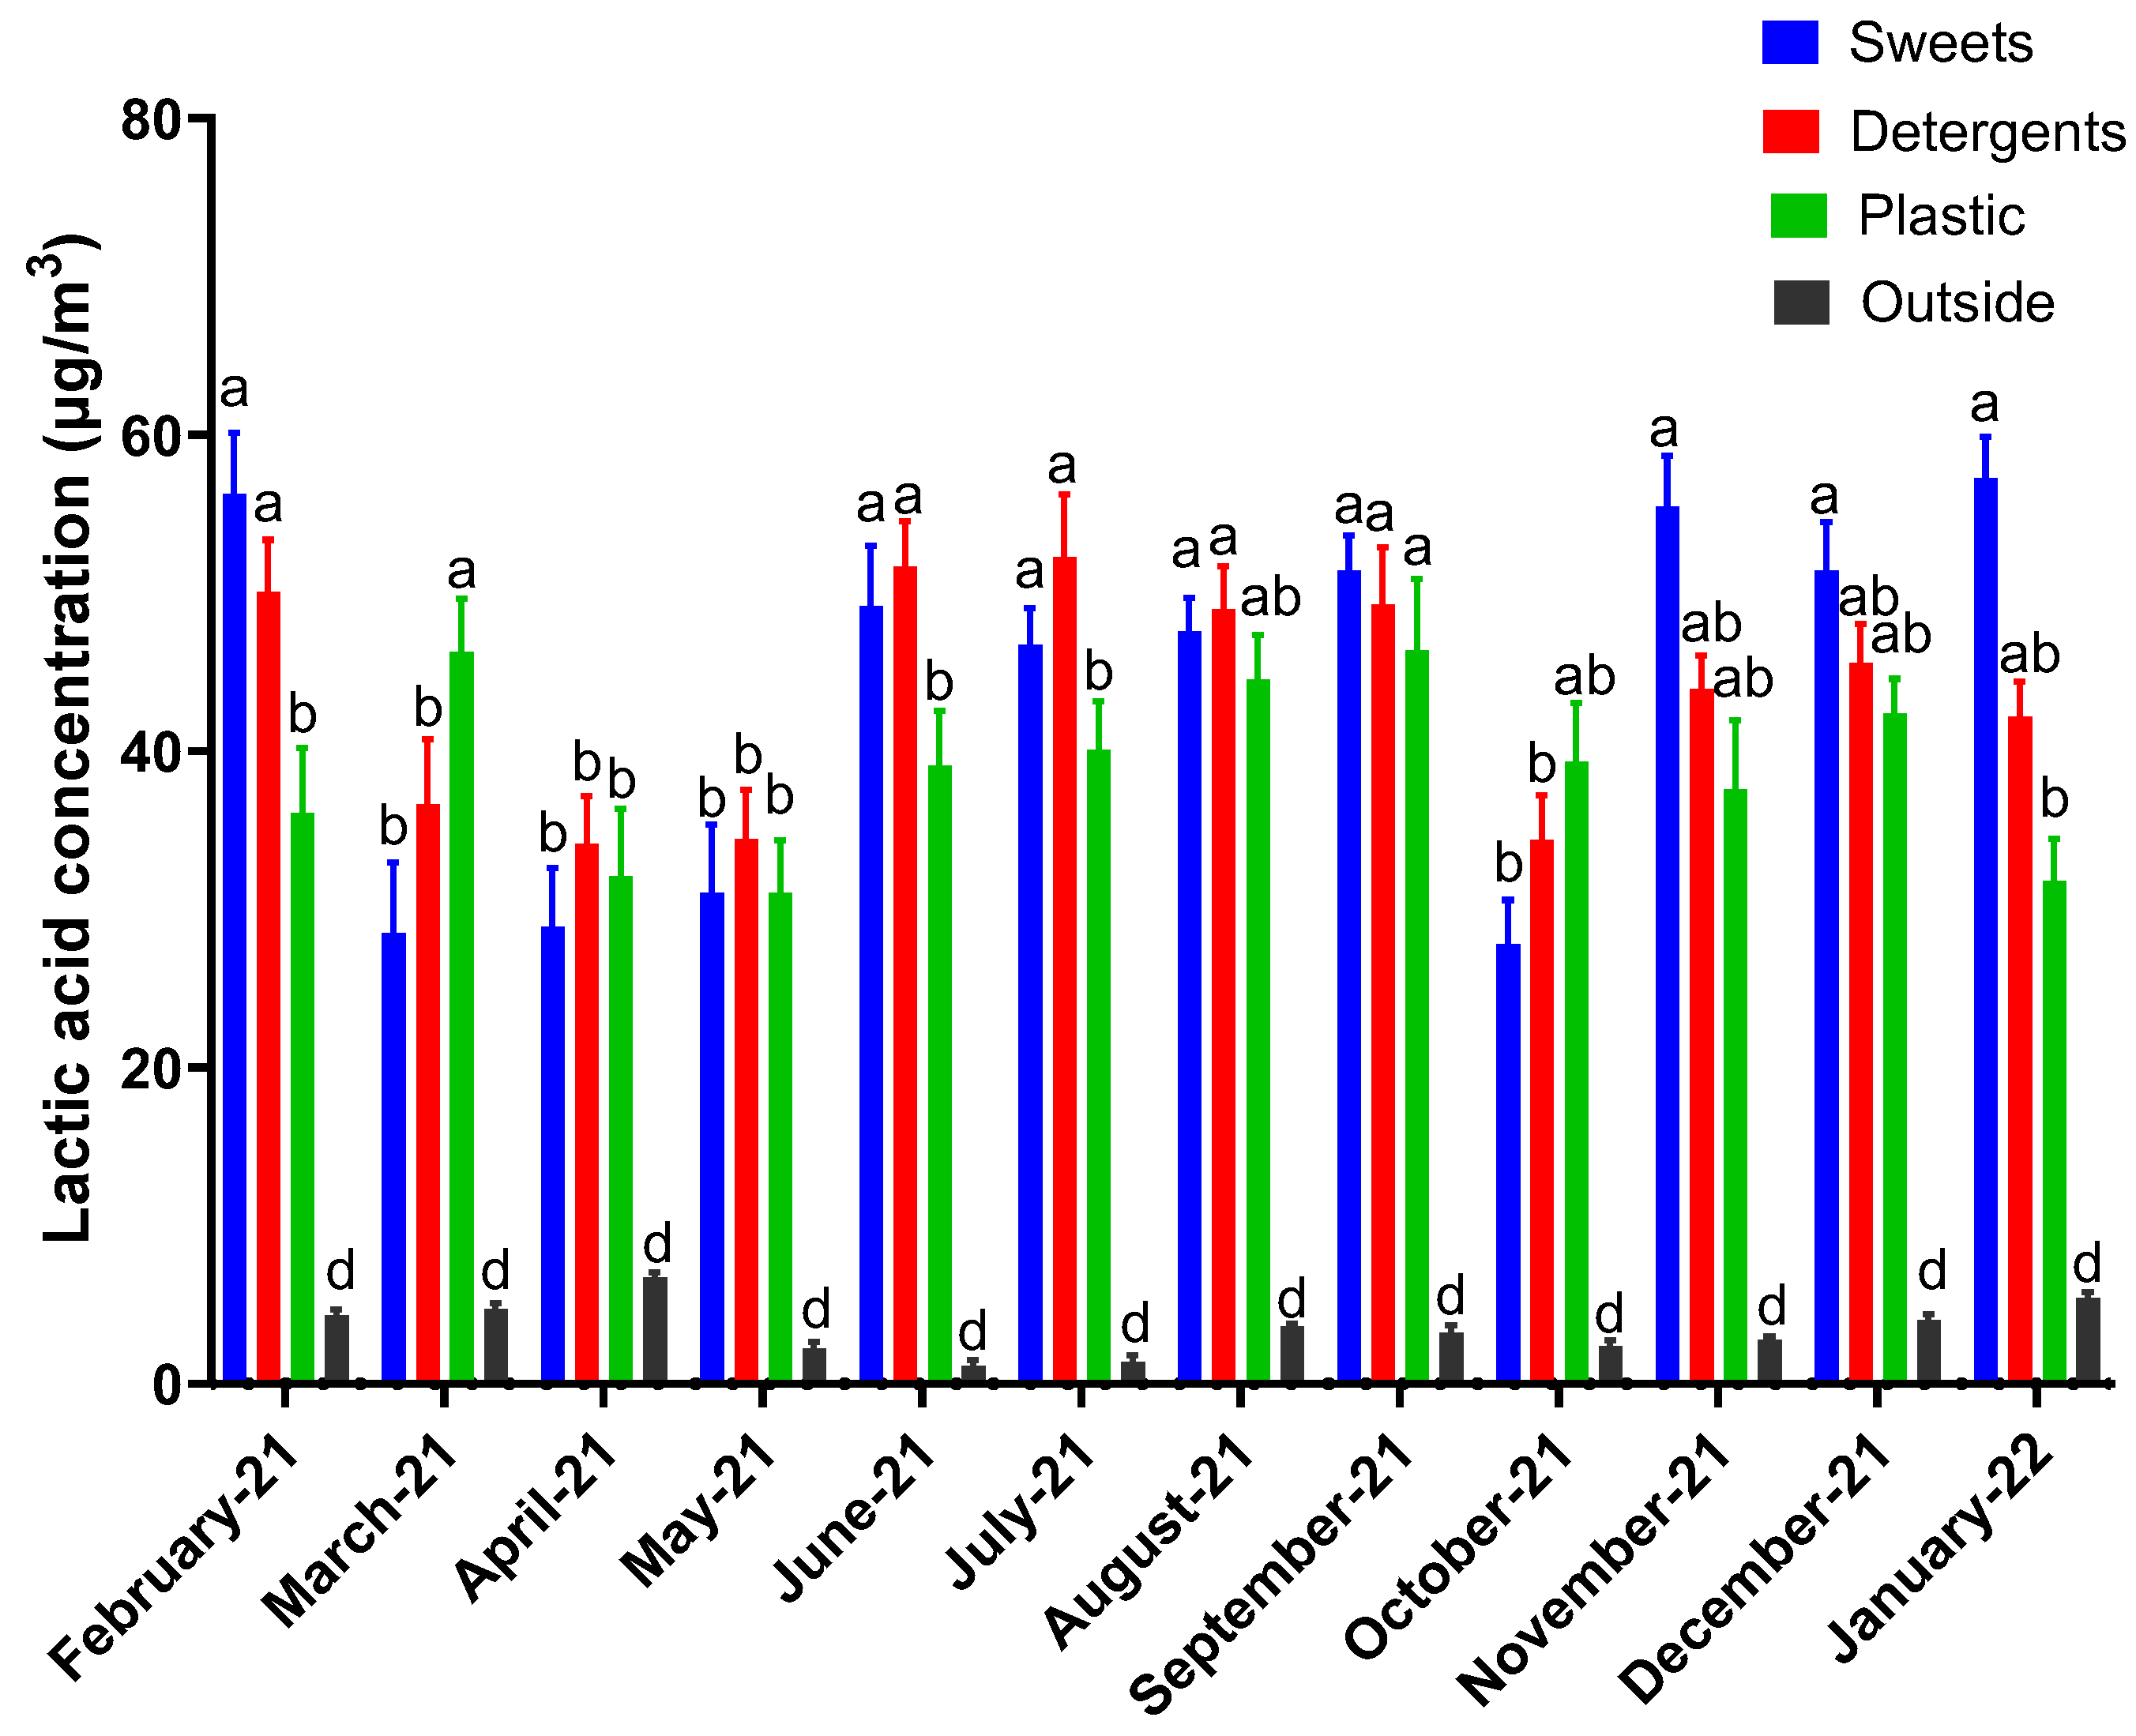
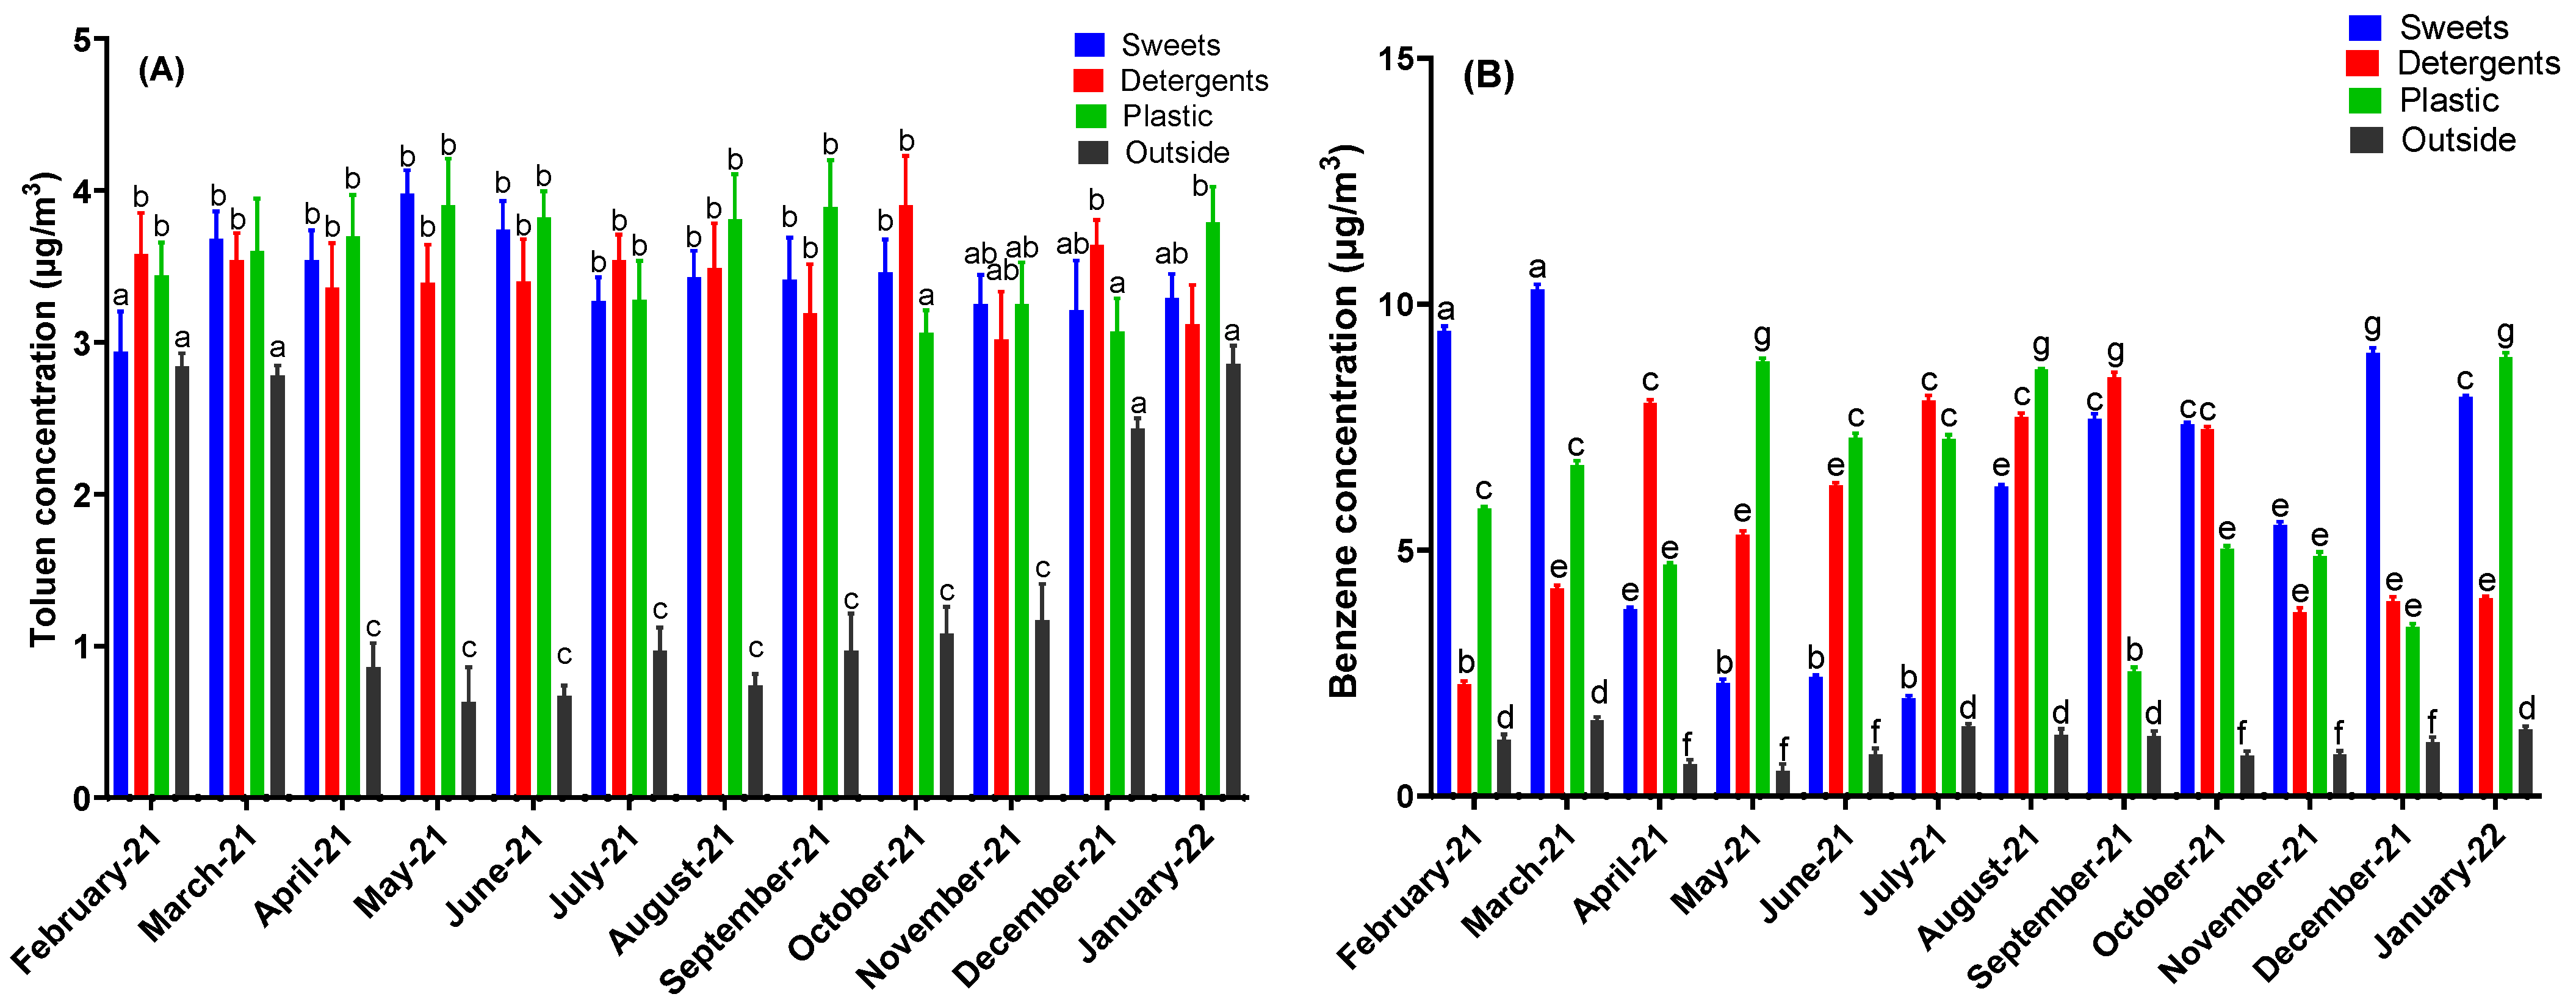
The samples were collected between February 2021 and January 2022 from 3 different departments (sweets, detergents, and plastics) of a general store and the air from outside (on the parking side of the shop). The store is located in western Romania, Resita town (coordinates latitude 45°19′15″ N, longitude 21°52′02″ E; Figure S1). The store’s location prevents interference of the city center as much as possible. The general store has different departments. The sweets department is located on the west side, the detergents in the middle, and the plastics on the east side. The departments in the store are almost the same size. The sampling (using the analyzer and passive sampling with tubes) was taken from every department at a level of 1 m from the floor and as much as possible in the middle of the department. The sampling occurred in the store’s parking lot 10 m from the entrance door for the outside measurements. In order to consolidate and match the analyzer determinations with passive sampling (which has 30 min of sampling in tubes), the measurements took 30 min, and the reading was performed after stabilization. Every month, four measurements were taken at the same hour (at noon) and on the same day (Wednesday). The measurements for total volatile organic compounds, PM1, PM2.5, PM10, and formaldehyde, were taken with a Dienmern DM 106 (Shenzhen Dienmern Testing Technology Co., Ltd., Shenzhen, China) professional air analyzer and the Honeywell MultiRAE (Sunnyvale, CA, USA). For all determinations, the detection limit was 1 µg/m3.
The analysis of lactic acid, benzene, ortho and para-xylene, toluene, and monoterpene was carried out using gas chromatography–mass spectrometry. The method follows the same procedure as in Noe et al. [43] with small modifications. A sample volume of 6000 mL was obtained using a constant airflow from a sample pump (model 210-1003 MTX; SKC Inc., Houston, TX, USA) at a rate of 200 mL per minute. This pump was employed for the sampling of volatile organic compounds. Stainless steel cartridges (10.5 cm length, 4 mm inner diameter; Supelco, Bellefonte, PA, USA) containing Carbotrap C 20/40 mesh (0.1 g), Carbopack B 40/60 mesh (0.1 g), and Carbotrap X 20/40 mesh (0.1 g) adsorbents (Supelco, Bellefonte, PA, USA) were utilized for the quantitative analysis of airborne volatiles. An automated cartridge desorber and a Shimadzu 2010 Plus GC–MS apparatus (Shimadzu Corporation, Kyoto, Japan) were used to analyze the adsorbent cartridges. For tube desorption, the helium purge flow was set at 40 mL min−1, the primary desorption temperature at 250 °C, and the primary desorption time was 6 min. The cold trap had been set to −20 °C. A capillary column, OPTIMA-624 (0.25 mm i.d., 60 m length, 1.4 µm film thickness; Macherey–Nagel, Düren, Nordrhein-Westfalen, Germany), was utilized for the separation of compounds. The mass spectrometer operated in electron-impact (EI) mode at 70 eV, with a scan range of 38–600 m/z. The transfer line temperature was set at 250 °C, and the ion-source temperature at 200 °C. Compound identification was carried out using the NIST spectral library ver. 14. Quantifying various compounds followed the earlier detailed procedure [44].
One-way ANOVA and Tukey’s multiple comparisons test used the GraphPad Prism version 10.0.0 for Windows (GraphPad Software, San Diego, CA, USA, www.graphpad.com) (accessed on 11 November 2023). Data were considered significantly different for p < 0.05). Continuous variables were compared using the 2-way ANOVA test or Mann–Whitney test, depending on the normal or abnormal distribution of data. A p-value < 0.05 was considered statistically significant. In the figures, data marked with distinct letters are considered significantly different (p < 0.05), whereas data sharing identical letters are not deemed significantly different (p > 0.05). Spearman correlation coefficient was used to evaluate the association between monoterpene and formaldehyde concentration. For symptom analysis, we used descriptive statistics. To assess and compare proportions, the z-test, a statistical method that examines the difference between observed proportions and expected values, was employed in this analysis.
The inhalation method for conducting the health risk assessment (HRA) of formaldehyde is endorsed by the US EPA. The detailed procedure can be found in the work by Popitanu et al. [45] and Latif et al. [46], according to [47]. Briefly, the chronic daily intake (CDI) (mg/kg·day) was calculated using Equation (1) as follows:
CDI = (CA × IR × ET × EF × ED)/(AT × BW)
where
CA = contaminant concentration in air (mg/m3);
IR = inhalation rate (m3 h−1) for an adult (0.55);
ET = exposure time (8 h day−1);
EF = exposure frequency (219 days year−1);
ED = exposure duration (24 years for an adult);
AT = 25 year × 365 day/year × 24 h/day = 219 (h) for the adverse health effect or AT = 70 year × 365 day/year × 24 h/day = 631.2 (h) for the lifetime cancer risk [47];
BW = Body weight (70 kg for adults).
Hazard Quotient (HQ) for formaldehyde was estimated as Equation (2):
HQ = CDI/RfC
Inhalation reference concentration (RfC) = 9.8 mg/m3 [48].
If HQ > 1, there is a potential health risk from exposure, and if HQ < 1, there is likely to be an acceptable risk of a non-carcinogenic health effect.
The life cancer risk (LCR) was calculated as follows:
LCR = IUR × CDI
IUR = Inhalation Unit Risk; 1.3 × 10⁻⁵ (μg/m3) [48].
When the LCR exceeds 1.00 × 10⁻⁶, exposure will probably result in cancer development over an extended period. If the lifetime risk of developing cancer is equal to or lower than 1.00 × 10⁻⁶, it can be considered an acceptable level of cancer risk from exposure to environmental factors.
To evaluate the potential impact of this work environment on employees, we applied a standardized questionnaire developed based on previous studies on SBS at the end of the study period [49]. The number of the subjects was 30. Participants expressed a positive response if any of the symptoms listed occurred twice within the past 12 months. These symptoms included dry eyes, itching or watering eyes, nasal congestion, a runny nose, dry throat, throat pain, difficulty breathing, headaches, chest pain, skin issues (dryness, rash, itching), fatigue, and flu-like symptoms. There was also an open question for any other symptom the participants considered related to the work environment. In order to identify possible confounding factors, subjects were asked about known allergies, acute respiratory tract infections in the past week, known medical history of eye, ear–nose–throat (ENT), and pulmonary or cardiac diseases. The questionnaire is presented in a Supplementary File S2.

3. Results

The formaldehyde concentrations did not significantly differ for different departments (one way ANNOVA, p = 0.67), but were significantly higher than the outside concentrations (p < 0.05) (Figure 1). The monthly average formaldehyde concentration inside the store varied from 0.013 mg/m3 in May to 0.027 mg/m3 in April, while the outside concentrations varied from 0.002 mg/m3 to 0.011 mg/m3. The maximum concentration of formaldehyde was found in the sweets department in April. The medium outside formaldehyde concentration over the year was 0.006 ± 0.004 mg/m3.
The concentration of total volatile organic compounds was not significantly different for different departments (p = 0.107) (Figure 2). The annual medium values were significantly higher for the detergents and plastics departments (compared with outside 0.14 ± 0.03 mg/m3 and 0.16 ± 0.07 mg/m3, respectively) compared with outside value (0.07 ± 0.03 mg/m3). In the case of the sweets department, the TVOC concentration over the year was not significantly different compared with the outside value (p > 0.05). Generally, the highest concentration of TVOCs was found in February 2021 for all departments (with a maximum of 0.339 ± 0.026 mg/m3 in the plastic departments), while the highest TVOC concentration outside of the store was found in winter (with a maximum in February of 0.117 ± 0.028 mg/m3).
The average values of lactic acid concentration over the year for sweets, detergents, and plastics departments were 44 ± 11 µg/m3, 43 ± 7 µg/m3, and 38 ± 5 µg/m3, respectively, while the outside average value over the year was 3.5 ± 1.7 µg/m3 (Figure 3). There was not a general trend among departments, but from November to February, lactic acid concentrations in the sweets department were significantly higher than in the other two departments. Overall, the lactic acid concentrations were ten times higher inside than outside. The outside concentration of lactic acid varied from 1.15 µg/m3 in June to 6.15 µg/m3 in April.
The concentrations of BTEX and monoterpene over one year are presented in Figure 4. The average concentration of toluene in the sweets department is 3.43 ± 0.28 µg/m3, in the detergents department is 3.43 ± 0.24 µg/m3, in the plastics department 3.56 ± 0.32 µg/m3 with no statistical differences between medium annual value for departments (p = 0.495). Outside the store, the concentration of toluene was 1.50 ± 0.92 µg/m3, significantly lower than inside the shop (p < 0.05). The toluene concentrations outside the shop in the cold months (December-March; 2.72 ± 0.20 µg/m3) were higher than in the warm period (0.89 ± 0.19 µg/m3). Regarding the concentration of toluene in the different departments, there was a variation between months (p < 0.05, 2-way ANOVA) but small statistical differences between departments ((p = 0.029, 2-way ANOVA).
In the case of benzene (Figure 4B), the annual concentration in the sweets department was 6.2 ± 2.9 µg/m3, in the detergents department was 5.79 ± 2.1 µg/m3, and in the plastics department was 6.1 ± 2.1 µg/m3. The annual average outdoor benzene concentration was 1.05 ± 0.32 µg/m3. The highest benzene concentration was found in the sweets department in February 2021 at a level of 10.3 ± 0.1 µg/m3 while the lowest was found in July at 1.99 ± 0.05 µg/m3. Even more, benzene concentrations in different departments vary a lot across the year.
The annual average xylene concentration (Figure 4C) in the sweets department was 60.7 ± 20.7 µg/m3, in the detergents department was 49.4 ± 15.9 µg/m3, and in the plastics department was 56.0 ± 15.2 µg/m3. For almost all months, the concentration of xylene was higher in the sweets department than in the detergents and plastics departments (p < 0.05). The concentration of xylene outside was between 4.77 ± 0.48 µg/m3 in July and 8.65 ± 0.62 µg/m3 in January.
The annual average monoterpene concentration (Figure 4D) in the sweets department was 88.3 ± 14.7 µg/m3, in the detergents department was 88.99 ± 4.8 µg/m3, and in the plastics department was 86.8 ± 4.5 µg/m3. There is no difference between the monoterpene concentration in different departments (2-way ANOVA, p = 0.164), but there are significant differences between months (2-way ANOVA, p < 0.05). Furthermore, the highest concentrations of monoterpenes were found in April and May in the sweets departments (120.9 ± 4.2 µg/m3 and 113.9 ± 3.5 µg/m3, respectively). The concentration of monoterpenes outside the store varies from 11.63 ± 1.7 µg/m3 in June to 34.3 ± 2.9 µg/m3 in March, with an average of 21.3 ± 7.5 µg/m3.
The concentration of airborne particulate matter (PM) is presented in Figure 5. PM1, PM 2.5, and PM10 concentrations are higher outside than inside the shop. There is no clear trend regarding PM concentrations in different departments. Furthermore, the PM concentration in the sweets departments is higher in February and March, but in the rest of the year, it is not significantly different from other departments. The yearly average of outside PM1 concentration was 10.4 ± 3.4 µg/m3, PM2.5 concentration was 19.0 ± 4.7 µg/m3, and PM10 concentration was 25.4 ± 5.2 µg/m3. The highest PM2.5 concentration value was found in October at a level of 24.0 ± 0.8 µg/m3. In the department store, the lowest concentrations of airborne particulate matter were found in October and November.
In order to estimate the health effects for inhabitants exposed to formaldehyde, the chronic daily intake (CDI) values for all departments were evaluated (Table 1).
The average CDI value for formaldehyde over the year is in the store at 3.60 mg/day kg, with a maximum of 6.60 mg/day kg in the sweets department and a minimum of 1.2 mg/day kg in the same department. The average intake is 3 times higher than the average concentration outside of the store (1.17 mg/day kg). The average LCR across the store was 6.7 × 10⁻⁶, which means that 6.7 persons at 1,000,000 has a high risk of cancer due to formaldehyde.
Thirty-one employees responded to our questionnaire, 22 (70.9%) females. The mean age of the group was 37.3 ± 10.4 years old (between 19 and 55 years). One subject was previously known for allergies, none of the subjects had an upper or lower airway infection in the previous week, and four reported concurrent diseases. Two of the four subjects with concurrent diseases reported six and eight symptoms, respectively, while the other two reported having only one symptom from the SBS list. Twenty-three (74%) subjects had at least one symptom, 25.8% had two to three symptoms, and four (12.9%) subjects had four or more symptoms. The median number of symptoms per patient was 1 (IQ range = 0.5–2.5, range: 0–8) (Figure 6A). Regarding the distribution of gender, a similar proportion of male subjects (77.7%) experienced symptoms compared to female subjects (72.7%) (p = 0.77). The employees reporting four or more symptoms were younger (median age 30 years old—range 26–45). The symptoms mentioned more often were fatigue (38.7%), skin problems (22.6%), throat-related issues (22.6%), headache, and flu-like symptoms (each reported by 16.1% of subjects), followed by dry eyes and chest pain (Figure 6B).

4. Discussion

Formaldehyde is categorized as a Group B carcinogenic material under the Integrated Risk Information System (IRIS) of the United States Environmental Protection Agency (EPA). It has been recognized as a compound that presents potential hazards to human health. The formaldehyde concentration inside the store ranged from 6 to 33 µg/m3, which is below 100 µg/m3 (the threshold for public-use facilities) and in the same range as reported in a previous study completed in Hong Kong (range from 15 to 60 µg/m3) [33]. In any event, the primary sources of formaldehyde in the store were surface coatings, multi-layer flooring products, textiles, and furniture, which could be responsible for emissions at a level of μg/(m2 h) [50,51]. Even though the store has ventilation, Sidheswaran et al. showed that certain categories of filters have a positive correlation between humidity levels and the emissions of formaldehyde [52]. The secondary origin of formaldehyde may stem from the reaction of monoterpenes, specifically α-pinene, β-pinene, 3-carene, and limonene, with ozone and other reactive species like the hydroxyl radical (OH•). It has been estimated that the formaldehyde oxidation mechanism accounts for a range of 1.0% to 11.2% of the overall emissions [53]. As the concentration of monoterpenes in the different departments achieved almost 100 µg/m3, the formaldehyde could also be formed in this way in the store. Indeed, there is a positive correlation between the concentration of monoterpene in the shop and the concentration of formaldehyde (nonparametric Spearman correlation coefficient (rs) = 0.308), while the outside of the shop was rs = 0.182.
The Environmental Protection Agency (EPA) establishes objectives for the lifetime cancer risk (LRC) at levels of 10−6 and 10−4, which are determined by the highest concentration of pollutants near the emission source, corresponding to 1 and 100 individuals per one million people, respectively. In our study, the LRC is more than 10−6, which is not negligible. The concentration of formaldehyde outside varies from 1.7 µg/m3 to 8.0 µg/m3, which is the same range as another study which showed that formaldehyde concentrations varied from 1 ppb to 30 ppb in urban regions and from 1 ppb to 5 ppb in the non-urban areas [54].
The concentration of total volatile organic compounds in the shop was between 339 and 32 µg/m3, which is lower than the concentrations found in a shopping mall in Guangzhou, South China [28]. All indoor microenvironments (departments) have higher TVOC concentrations than outdoors. Among different departments, the TVOC concentrations in all departments had the highest concentration in winter. This could be explained by using a heating system and the high contributions from outside air (as the inside/outside ratio is, on average, 1.6 in winter while in summer it is 2.5).
The many departments in the shop manufacture diverse goods or components that possess differing levels of TVOC content, resulting in discrepancies in emissions. In our case, the concentrations were not significantly different between departments, but in the plastics and detergents sections, there are more sources of TVOCs than in the sweets section. The type of materials, chemicals, equipment, and processes used in different departments were the same, which could explain such a slight variation. If the main sources for TVOCs in the sweets department could possibly be the ingredients and the materials used for packaging sweets [55], such as plastic wraps or containers, in the plastics and detergents departments, the main sources were the products themselves.
Among TVOCs, BTEX could have an important contribution to indoor air quality. In our case, benzene and toluene concentrations were very low, while the concentrations of ortho- and para-xylene were in the same range as in other studies [28,56]. Indoor-to-outdoor ratios for BTEX were observed to exceed 2, indicating that the influence of indoor pollution sources was more prominent than that of outdoor sources. Toluene, xylenes, ethylbenzene, and benzene have been identified as constituents of automotive exhaust emissions [57]. The regular use of cleaning solvents inside the building for the purpose of floor cleaning, as well as the presence of disinfectants, might potentially serve as significant contributing factors, given that BTEX compounds are commonly found in cleaning agents. The monoterpene concentration in the shop ranged from 76 to 121 µg/m3, while outside, the values were significantly lower (11–34 µg/m3). Our values were lower than the ones found in joinery shops in Sweden (10–214 µg/m3), which demonstrated quite an important impact on the workers [58]. While the sources of monoterpenes outside are mainly biotic, inside the shop, the main sources were perfumes, deodorizers, and cleaning products.
Indoor air quality (IAQ) ensures a healthy and efficient atmosphere in shops and other industrial facilities. The regulation for the different chemicals’ maximum levels differs between countries (see the review regarding European legislation in [59]). For example, the WHO maximum guidance for formaldehyde is 100 µg/m3, while the regulation varies between 120 µg/m3 in Germany and 50 µg/m3 in Finland. In our cases, the formaldehyde concentration did not exceed 100 µg/m3, while the TVOCs were under 500 µg/m3. Implementing an indoor air quality (IAQ) method to manage volatile organic compounds (VOCs) in businesses is a thorough and effective technique that fosters a healthy and ecologically conscious workplace. Shops may safeguard employee health, adhere to laws, and support sustainability by identifying sources, applying control measures, and maintaining acceptable indoor air quality (IAQ).
Lactic acid is the predominant chemical constituent found in human sweat. It is emitted from our skin, undergoes atmospheric dispersion, and adheres to various surfaces, including walls. Lactic acid concentration ranged from 27 to 57 µg/m3, the same limit as found in the University of Colorado Art Museum [60]. As the indoor–out-door ratio is 15, the outdoor portion of lactic acid is low.
The concentrations of PM outside the shop were significantly higher than inside. Anthropogenic activities provide the primary source of particulate matter (PM). The abovementioned activities encompass various processes, including agricultural operations, industrial activities, burning wood and fossil fuels, building and demolition operations, and the dispersion of road dust into the atmosphere. In our case, the indoor-to-outdoor average ratio was 0.48, indicating that the outdoor influx was the main source for indoor PM.
The variations in particulate matter (PM) concentrations between winter and summer are mostly ascribed to a combination of meteorological, atmospheric, and human variables. Heightened heating requirements in the winter months result in the incineration of fossil fuels, such as wood and coal. These activities emit particulate matter (PM) into the atmosphere, contributing to elevated PM levels throughout the winter. In addition, during the winter, traffic conditions such as icy roads and snow clearance activities can lead to higher vehicle emissions and the release of particles from road surfaces, hence increasing PM levels. The same trend has been found in Beijing, Suning, and Islamabad, where PM10 and PM2.5 were simultaneously collected. The concentrations of both PM10 and PM2.5 in winter exceed those in summer in those three cities [61]. Winter is the season most susceptible to severe haze pollution, mostly due to significant emissions from fossil fuel combustion and frequent unfavorable weather conditions [62].
We found a much lower concentration of PM 2.5 in the store than in other studies [33,63,64], which could be clarified by a better cleaning strategy implemented during the COVID-19 pandemic. Generally, before the COVID-19 pandemic, the general cleaning in the shop had been performed every week using regular disinfectants. In contrast, during the pandemic period, every day, disinfection took place three times a day.
Regarding symptom assessment, our study showed that in a relatively young group of workers, most experienced at least one symptom that might be attributed to the work environment. Fatigue, nose-, throat-, and skin-related symptoms were the most frequent, similar to other studies [38]. Some data subjects reporting more symptoms are at increased risk of sickness absence than those without symptoms [65]. In our study, 12.9% of patients had four or more symptoms. Work absenteeism, if present, might be related to SBS. We did not collect any data regarding sick leave. The prevalence of symptoms was reported in the same proportion by women and men in our study, but the study group was very small. In other studies, women reported more symptoms compared to men (2.7 vs. 2.2, p < 0.001), and people reporting more symptoms were younger than those not reporting symptoms [66]. In addition, it seems that the primary determinant of the prevalence of symptoms is the psychosocial work environment and not aspects related to the physical work environment [66]. We did not investigate these aspects with our questionnaire.
Previous studies performed on pathology lab employees reported that occupational exposure to formaldehyde can cause wheezing, burning eyes, and cough [65]. Formaldehyde can also irritate sinuses or produce skin rashes. As expected, the air concentrations of formaldehyde in our study were significantly smaller than in a pathology lab (the mean value reported by Jalali et al. [65] was 0.64 mg/m3). We cannot definitely link the workers’ symptoms to this substance. However, many subjects had trouble breathing, and eye, nose, and skin symptoms. To our knowledge, only a limited number of studies have investigated SBS symptoms in subjects working in stores. One of them evaluated the perception of indoor air quality in underground shopping centers and reported SBS symptoms in half of the workers [39]. One significant constraint in our study is the absence of comprehensive data related to the onset, persistence, and frequency of symptoms. In addition, our study group was very small. In some studies, the diagnosis of SBS is based on symptoms at least 1 day/week, with the subject reporting an association between their symptoms and their working environments [38]. In our study, any symptom present at least twice during the last year was recorded, and five workers already had allergies/other diseases. Therefore, we cannot attribute all the symptoms to SBS, because at least some could be related to their previously known disorder/allergy. However, our study draws attention to an important economic section which in our country represents more than 15% of the total number of employees [67].

5. Conclusions

Formaldehyde levels in the store are below the threshold for public-use facilities but are primarily derived from surface coatings, flooring, textiles, and furniture. Monoterpenes in the store could contribute to formaldehyde formations, with a positive correlation between their concentration and formaldehyde. Lifetime cancer risk (LRC) exceeds 10−6, indicating a non-negligible health risk due to formaldehyde exposure. Total volatile organic compounds (TVOCs) concentrations are higher indoors than outdoors, especially in winter, potentially due to heating systems and outdoor air contribution. Cleaning solvents and disinfectants influence BTEX compounds in the store. PM concentrations are lower inside the store, possibly due to improved cleaning strategies during the COVID-19 pandemic. Our study highlights the prevalence of symptoms among relatively young workers, with fatigue, nose-, throat-, and skin-related issues being the most common. While we could not link these symptoms to the work environment, the potential association with sick building syndrome (SBS) warrants further investigation. It is important to note that psychosocial factors may significantly affect symptom prevalence. Despite limitations such as a small study group and lack of comprehensive symptom data, our findings shed light on a crucial aspect of the economy, as this workforce segment represents a substantial portion of the total employed population. Additional investigation is required to explore the connection between workplace conditions and symptoms within this industry.

Supplementary Materials

The following supporting information can be downloaded at: https://www.mdpi.com/article/10.3390/app132312572/s1, Figure S1. Satellite photos of the sampling zone. The position of the sampling site is marked with a red pin. File S2: Questionnaire for the workplace environment.

Author Contributions

Conceptualization, L.C. and T.S.-B.; methodology, A.T., A.L., C.M., D.C. and D.M.C.; software, A.L., C.M. and D.M.C.; validation, A.T., A.L., C.M., D.C., T.S.-B., D.M.C. and L.C.; formal analysis, A.T., A.L. and T.S.-B.; investigation, A.T., A.L., C.M., T.S.-B., D.C. and D.M.C.; data curation, A.L., C.M. and T.S.-B.; writing—original draft preparation, A.T., T.S.-B. and L.C.; writing—review and editing, A.L., D.M.C. and L.C.; supervision, L.C.; project administration, L.C.; funding acquisition, A.T. and L.C. All authors have read and agreed to the published version of the manuscript.

Funding

This research was funded by CNFIS-UEFISCDI, project number PN-III-P4-ID-PCE-2020-0410.

Institutional Review Board Statement

The study was conducted according to the guidelines of the Declaration of Helsinki and was approved by the Ethics Committee of Aurel Vlaicu University, Romania (no. 23/10.12.2019).

Informed Consent Statement

Informed consent was obtained from all subjects involved in this study.

Data Availability Statement

The data presented in this study are available in the article.

Conflicts of Interest

The authors declare no conflict of interest.

References

  1. U.S. Bureau of Labor Statistics. American Time Use Survey. Available online: https://www.bls.gov/tus/tables.htm (accessed on 11 February 2023).
  2. Mishra, S.; Singh, A.; Kar, S.K.; Ganesan, S. Compulsive buying behavior and its association with emotional distress, depression, and impulsivity in general population: An online survey. CNS Spectr. 2023, 28, 592–596. [Google Scholar] [CrossRef] [PubMed]
  3. Kang, M.; Johnson, K.K.J.C.; Journal, T.R. Retail therapy: Scale development. Cloth. Text. Res. J. 2011, 29, 3–19. [Google Scholar] [CrossRef]
  4. Australian Bureau of Statistics. How Australians Use Their Time. Available online: https://www.abs.gov.au/statistics/people/people-and-communities/how-australians-use-their-time/latest-release (accessed on 11 February 2023).
  5. European Communities. How Europeans Spend Their Time Everyday Life of Women and Men; European Communities: Luxemburg, 2004. [Google Scholar]
  6. Zhao, S.; Yang, L.; Gao, S.; Li, M.; Yan, H.; Zhai, Y. Field investigation on the thermal environment and thermal comfort in shopping malls in the cold zone of China. Build. Environ. 2022, 214, 108892. [Google Scholar] [CrossRef]
  7. Reda, I.; AbdelMessih, R.N.; Steit, M.; Mina, E.M. Experimental assessment of thermal comfort and indoor air quality in worship places: The influence of occupancy level and period. Int. J. Therm. Sci. 2022, 179, 107686. [Google Scholar] [CrossRef]
  8. Tian, X.; Zhang, Y.; Lin, Z. Predicting non-uniform indoor air quality distribution by using pulsating air supply and SVM model. Build. Environ. 2022, 219, 109171. [Google Scholar] [CrossRef]
  9. Kempton, L.; Daly, D.; Kokogiannakis, G.; Dewsbury, M. A rapid review of the impact of increasing airtightness on indoor air quality. J. Build. Eng. 2022, 57, 104798. [Google Scholar] [CrossRef]
  10. Chen, Y.-H.; Tu, Y.-P.; Sung, S.-Y.; Weng, W.-C.; Huang, H.-L.; Tsai, Y.I. A comprehensive analysis of the intervention of a fresh air ventilation system on indoor air quality in classrooms. Atmos. Pollut. Res. 2022, 13, 101373. [Google Scholar] [CrossRef]
  11. Berger, J.; Essah, E.; Blanusa, T.; Beaman, C.P. The appearance of indoor plants and their effect on people’s perceptions of indoor air quality and subjective well-being. Build. Environ. 2022, 219, 109151. [Google Scholar] [CrossRef]
  12. Cheng, Z.; Lei, N.; Bu, Z.; Sun, H.; Li, B.; Lin, B. Investigations of indoor air quality for office buildings in different climate zones of China by subjective survey and field measurement. Build. Environ. 2022, 214, 108899. [Google Scholar] [CrossRef]
  13. Shayegan, Z.; Bahri, M.; Haghighat, F. A review on an emerging solution to improve indoor air quality: Application of passive removal materials. Build. Environ. 2022, 219, 109228. [Google Scholar] [CrossRef]
  14. Abdel-Salam, M.M.M. Indoor exposure of elderly to air pollutants in residential buildings in Alexandria, Egypt. Build. Environ. 2022, 219, 109221. [Google Scholar] [CrossRef]
  15. Madaniyazi, L.; Jung, C.-R.; Fook Sheng Ng, C.; Seposo, X.; Hashizume, M.; Nakayama, S.F. Early life exposure to indoor air pollutants and the risk of neurodevelopmental delays: The Japan Environment and Children’s Study. Environ. Int. 2022, 158, 107004. [Google Scholar] [CrossRef] [PubMed]
  16. Abdel-Salam, M.M.M. Relationship between residential indoor air quality and socioeconomic factors in two urban areas in Alexandria, Egypt. Build. Environ. 2022, 207, 108425. [Google Scholar] [CrossRef]
  17. Wu, X.M.; Apte, M.G.; Maddalena, R.; Bennett, D.H. Volatile organic compounds in small- and medium-sized commercial buildings in California. Environ. Sci. Technol. 2011, 45, 9075–9083. [Google Scholar] [CrossRef] [PubMed]
  18. Meyer, B.; Hermanns, K. Reducing Indoor Air Formaldehyde Concentrations. J. Air Pollut. Control Assoc. 1985, 35, 816–821. [Google Scholar] [CrossRef] [PubMed]
  19. Hwang, S.H.; Lee, G.B.; Kim, I.S.; Park, W.M. Formaldehyde and carbon dioxide air concentrations and their relationship with indoor environmental factors in daycare centers. J. Air Waste Manag. Assoc. 2017, 67, 306–312. [Google Scholar] [CrossRef] [PubMed]
  20. Rovira, J.; Roig, N.; Nadal, M.; Schuhmacher, M.; Domingo, J.L. Human health risks of formaldehyde indoor levels: An issue of concern. J. Environ. Sci. Health Part A Toxic/Hazard. Subst. Environ. Eng. 2016, 51, 357–363. [Google Scholar] [CrossRef]
  21. Fang, L.; Liu, N.; Liu, W.; Mo, J.; Zhao, Z.; Kan, H.; Deng, F.; Huang, C.; Zhao, B.; Zeng, X.; et al. Indoor formaldehyde levels in residences, schools, and offices in China in the past 30 years: A systematic review. Indoor Air 2022, 32, e13141. [Google Scholar] [CrossRef]
  22. Bernardini, L.; Barbosa, E.; Charão, M.F.; Brucker, N. Formaldehyde toxicity reports from in vitro and in vivo studies: A review and updated data. Drug Chem. Toxicol. 2022, 45, 972–984. [Google Scholar] [CrossRef]
  23. Zhang, H.; Zheng, Z.; Yu, T.; Liu, C.; Qian, H.; Li, J. Seasonal and diurnal patterns of outdoor formaldehyde and impacts on indoor environments and health. Environ. Res. 2022, 205, 112550. [Google Scholar] [CrossRef]
  24. Tian, M.; Xia, P.; Yan, L.; Gou, X.; Giesy, J.P.; Dai, J.; Yu, H.; Zhang, X. Toxicological Mechanism of Individual Susceptibility to Formaldehyde-Induced Respiratory Effects. Environ. Sci. Technol. 2022, 56, 6511–6524. [Google Scholar] [CrossRef] [PubMed]
  25. Jia, C.; Cao, K.; Valaulikar, R.; Fu, X.; Sorin, A.B. Variability of Total Volatile Organic Compounds (TVOC) in the Indoor Air of Retail Stores. Int. J. Environ. Res. Public Health 2019, 16, 4622. [Google Scholar] [CrossRef]
  26. Sexton, K.; Mongin, S.J.; Adgate, J.L.; Pratt, G.C.; Ramachandran, G.; Stock, T.H.; Morandi, M.T. Estimating Volatile Organic Compound Concentrations in Selected Microenvironments Using Time–Activity and Personal Exposure Data. J. Toxicol. Environ. Health Part A 2007, 70, 465–476. [Google Scholar] [CrossRef] [PubMed]
  27. Eklund, B.M.; Burkes, S.; Morris, P.; Mosconi, L. Spatial and temporal variability in VOC levels within a commercial retail building. Indoor Air 2008, 18, 365–374. [Google Scholar] [CrossRef] [PubMed]
  28. Tang, J.; Chan, C.Y.; Wang, X.; Chan, L.Y.; Sheng, G.; Fu, J. Volatile organic compounds in a multi-storey shopping mall in guangzhou, South China. Atmos. Environ. 2005, 39, 7374–7383. [Google Scholar] [CrossRef]
  29. Nirlo, E.L.; Crain, N.; Corsi, R.L.; Siegel, J.A. Volatile organic compounds in fourteen U.S. retail stores. Indoor Air 2014, 24, 484–494. [Google Scholar] [CrossRef] [PubMed]
  30. Xiang, L.; Wu, S.; Hua, Q.; Bao, C.; Liu, H. Volatile Organic Compounds in Human Exhaled Breath to Diagnose Gastrointestinal Cancer: A Meta-Analysis. Front. Oncol. 2021, 11, 606915. [Google Scholar] [CrossRef]
  31. Kumar, P.; Singh, A.B.; Arora, T.; Singh, S.; Singh, R. Critical review on emerging health effects associated with the indoor air quality and its sustainable management. Sci. Total Environ. 2023, 872, 162163. [Google Scholar] [CrossRef]
  32. Baptista, T.; Almeida-Silva, M.; Silva, D.; Diogo, C.; Canha, N. Indoor air quality assessment in grocery stores. Appl. Sci. 2022, 12, 12940. [Google Scholar] [CrossRef]
  33. Li, W.-M.; Lee, S.C.; Chan, L.Y. Indoor air quality at nine shopping malls in Hong Kong. Sci. Total Environ. 2001, 273, 27–40. [Google Scholar] [CrossRef]
  34. Hamanaka, R.B.; Mutlu, G.M. Particulate matter air pollution: Effects on the cardiovascular system. Front. Endocrinol. 2018, 9, 680. [Google Scholar] [CrossRef] [PubMed]
  35. Karuna, S.; Dhananjay, T. Particulate Matter and Human Health. In Environmental Health; Takemi, O., Ed.; IntechOpen: Rijeka, Croatia, 2021; Chapter 3. [Google Scholar]
  36. Yussuf, S.M.; Dahir, G.; Salad, A.M.; Hayir, T.M.M.; Hassan, S.A.; Gele, A. Sick building syndrome and its associated factors among adult people living in Hodan district Moqadishu Somalia. Front. Built Environ. 2023, 9, 1218659. [Google Scholar] [CrossRef]
  37. Lu, C.-Y.; Tsai, M.-C.; Muo, C.-H.; Kuo, Y.-H.; Sung, F.-C.; Wu, C.-C. Personal, psychosocial and environmental factors related to sick building syndrome in official employees of Taiwan. Int. J. Environ. Res. Public Health 2018, 15, 7. [Google Scholar] [CrossRef] [PubMed]
  38. Surawattanasakul, V.; Sirikul, W.; Sapbamrer, R.; Wangsan, K.; Panumasvivat, J.; Assavanopakun, P.; Muangkaew, S. Respiratory symptoms and skin sick building syndrome among office workers at University Hospital, Chiang Mai, Thailand: Associations with indoor air quality, AIRMED Project. Int. J. Environ. Res. Public Health 2022, 19, 10850. [Google Scholar] [CrossRef]
  39. Kim, J.; Jang, M.; Choi, K.; Kim, K. Perception of indoor air quality (IAQ) by workers in underground shopping centers in relation to sick-building syndrome (SBS) and store type: A cross-sectional study in Korea. BMC Public Health 2019, 19, 632. [Google Scholar] [CrossRef] [PubMed]
  40. Raport Privind Calitatea Aerului in Romania in Anul 2021. Available online: http://www.anpm.ro/raportare-anuala (accessed on 9 November 2023).
  41. Raport Preliminar Privind Calitatea Aerului Inconjurator in Judetul Caras-Severin pe anul 2021. Available online: http://www.anpm.ro/documents/17201/48339360/Raport+anual+preliminar+2021_CA.pdf/254524b2-9716-45ea-a357-8be4f48b7664 (accessed on 9 November 2023).
  42. Popescu, L.L.; Popescu, R.S.; Catalina, T. Indoor particle’s pollution in Bucharest, Romania. Toxics 2022, 10, 757. [Google Scholar] [CrossRef] [PubMed]
  43. Noe, S.M.; Huve, K.; Niinemets, Ü.; Copolovici, L. Seasonal variation in vertical volatile compounds air concentrations within a remote hemiboreal mixed forest. Atmos. Chem. Phys. 2012, 12, 3909–3926. [Google Scholar] [CrossRef]
  44. Kännaste, A.; Copolovici, L.; Niinemets, U. Gas Chromatography-Mass Spectrometry Method for Determination of Biogenic Volatile Organic Compounds Emitted by Plants. In Plant Isoprenoids: Methods and Protocols; RodriguezConcepcion, M., Ed.; Methods in Molecular Biology; Humana Press: New York, NY, USA, 2014; Volume 1153, pp. 161–169. [Google Scholar]
  45. Popitanu, C.; Cioca, G.; Copolovici, L.; Iosif, D.; Munteanu, F.-D.; Copolovici, D. The seasonality impact of the BTEX pollution on the atmosphere of Arad City, Romania. Int. J. Environ. Res. Public Health 2021, 18, 4858. [Google Scholar] [CrossRef]
  46. Latif, M.T.; Abd Hamid, H.H.; Ahamad, F.; Khan, M.F.; Mohd Nadzir, M.S.; Othman, M.; Sahani, M.; Abdul Wahab, M.I.; Mohamad, N.; Uning, R.; et al. BTEX compositions and its potential health impacts in Malaysia. Chemosphere 2019, 237, 124451. [Google Scholar] [CrossRef]
  47. Means, B. Risk Assessment Guidance for Superfund. Volume I: Human Health Evaluation Manual (Part A); EPA/540/1-89/002; Office of Emergency and Remedial Response, U.S. Environmental Protection Agency: Washington, DC, USA, 1989. [Google Scholar]
  48. National Research Council (US). Committee to Review EPA’s Draft IRIS Assessment of Formaldehyde. In Review of the Environmental Protection Agency’s Draft IRIS Assessment of Formaldehyde; National Academies Press (US): Washington, DC, USA, 2021. [Google Scholar]
  49. Raw, G.J.; Roys, M.S.; Whitehead, C.; Tong, D. Questionnaire design for sick building syndrome: An empirical comparison of options. Environ. Int. 1996, 22, 61–72. [Google Scholar] [CrossRef]
  50. Liu, X.; Mason, M.A.; Guo, Z.; Krebs, K.A.; Roache, N.F. Source emission and model evaluation of formaldehyde from composite and solid wood furniture in a full-scale chamber. Atmos. Environ. 2015, 122, 561–568. [Google Scholar] [CrossRef]
  51. An, J.-Y.; Kim, S.; Kim, H.-J. Formaldehyde and TVOC emission behavior of laminate flooring by structure of laminate flooring and heating condition. J. Hazard. Mater. 2011, 187, 44–51. [Google Scholar] [CrossRef] [PubMed]
  52. Sidheswaran, M.; Chen, W.; Chang, A.; Miller, R.; Cohn, S.; Sullivan, D.; Fisk, W.J.; Kumagai, K.; Destaillats, H. Formaldehyde emissions from ventilation filters under different relative humidity conditions. Environ. Sci. Technol. 2013, 47, 5336–5343. [Google Scholar] [CrossRef] [PubMed]
  53. Mendez, M.; Blond, N.; Blondeau, P.; Schoemaecker, C.; Hauglustaine, D.A. Assessment of the impact of oxidation processes on indoor air pollution using the new time-resolved INCA-Indoor model. Atmos. Environ. 2015, 122, 521–530. [Google Scholar] [CrossRef]
  54. Salthammer, T. Formaldehyde sources, formaldehyde concentrations and air exchange rates in European housings. Build. Environ. 2019, 150, 219–232. [Google Scholar] [CrossRef]
  55. Ashraf, J.Z.; Pati, S.; Fatchurrahman, D.; Amodio, M.L.; Colelli, G. Screening of volatile organic compounds emitted from different packaging materials: Case study on fresh-cut artichokes. Front. Sustain. Food Syst. 2023, 7, 1178104. [Google Scholar] [CrossRef]
  56. Won, S.R.; Ghim, Y.S.; Kim, J.; Ryu, J.; Shim, I.-K.; Lee, J. Volatile organic compounds in underground shopping districts in Korea. Int. J. Environ. Res. Public Health 2021, 18, 5508. [Google Scholar] [CrossRef] [PubMed]
  57. Bari, M.A.; Kindzierski, W.B.; Wheeler, A.J.; Héroux, M.-È.; Wallace, L.A. Source apportionment of indoor and outdoor volatile organic compounds at homes in Edmonton, Canada. Build. Environ. 2015, 90, 114–124. [Google Scholar] [CrossRef]
  58. Eriksson, K.A.; Levin, J.O.; Sandström, T.; Lindström-Espeling, K.; Lindén, G.; Stjernberg, N.L. Terpene exposure and respiratory effects among workers in Swedish joinery shops. Scand. J. Work Environ. Health 1997, 23, 114–120. [Google Scholar] [CrossRef]
  59. Settimo, G.; Manigrasso, M.; Avino, P. Indoor air quality: A focus on the European legislation and state-of-the-art research in Italy. Atmosphere 2020, 11, 370. [Google Scholar] [CrossRef]
  60. Pagonis, D.; Price, D.J.; Algrim, L.B.; Day, D.A.; Handschy, A.V.; Stark, H.; Miller, S.L.; de Gouw, J.; Jimenez, J.L.; Ziemann, P.J. Time-resolved measurements of indoor chemical emissions, deposition, and reactions in a University Art Museum. Environ. Sci. Technol. 2019, 53, 4794–4802. [Google Scholar] [CrossRef]
  61. Lv, D.; Chen, Y.; Zhu, T.; Li, T.; Shen, F.; Li, X.; Mehmood, T. The pollution characteristics of PM10 and PM2.5 during summer and winter in Beijing, Suning and Islamabad. Atmos. Pollut. Res. 2019, 10, 1159–1164. [Google Scholar] [CrossRef]
  62. Li, Q.; Zhang, H.; Jin, X.; Cai, X.; Song, Y. Mechanism of haze pollution in summer and its difference with winter in the North China Plain. Sci. Total Environ. 2022, 806, 150625. [Google Scholar] [CrossRef] [PubMed]
  63. Nicole, W. Cannabis consumption in dispensaries: Public health implications of an emerging practice. Environ. Health Perspect. 2021, 129, 084001. [Google Scholar] [CrossRef] [PubMed]
  64. Orru, H.; Olstrup, H.; Kukkonen, J.; López-Aparicio, S.; Segersson, D.; Geels, C.; Tamm, T.; Riikonen, K.; Maragkidou, A.; Sigsgaard, T.; et al. Health impacts of PM2.5 originating from residential wood combustion in four nordic cities. BMC Public Health 2022, 22, 1286. [Google Scholar] [CrossRef] [PubMed]
  65. Jalali, M.; Moghadam, S.R.; Baziar, M.; Hesam, G.; Moradpour, Z.; Zakeri, H.R. Occupational exposure to formaldehyde, lifetime cancer probability, and hazard quotient in pathology lab employees in Iran: A quantitative risk assessment. Environ. Sci. Pollut. Res. 2021, 28, 1878–1888. [Google Scholar] [CrossRef] [PubMed]
  66. Marmot, A.F.; Eley, J.; Stafford, M.; Stansfeld, S.A.; Warwick, E.; Marmot, M.G. Building health: An epidemiological study of “sick building syndrome” in the Whitehall II study. Occup. Environ. Med. 2006, 63, 283. [Google Scholar] [CrossRef]
  67. Institutul National de Statistica. Statistical Database (TEMPO), FOM105E (Number of Employees at the End of the Month in the Economy Section and Division Level). Available online: https://insse.ro/cms/ro/content/date-deschise (accessed on 10 September 2023).
Figure 1. Monthly variations in formaldehyde concentration over one-year measurements in 3 different departments and outside. Data with distinct characters indicate significant differences (p < 0.05), whereas data sharing identical symbols do not exhibit significant differences (p > 0.05). The values are averages of three independent measurements.
Applsci 13 12572 g001
Figure 2. Monthly variations in total volatile organic compounds (TVOCs) concentration over one-year measurements in 3 different departments and outside. Data with distinct characters indicate significant differences (p < 0.05), whereas data sharing identical symbols do not exhibit significant differences (p > 0.05). The values are averages of three independent measurements.
Applsci 13 12572 g002
Figure 3. Monthly variations in lactic acid concentration over one-year measurements in 3 different departments and outside. Data with distinct characters indicate significant differences (p < 0.05), whereas data sharing identical symbols do not exhibit significant differences (p > 0.05). The values are averages of three independent measurements.
Applsci 13 12572 g003
Figure 4. Monthly variations in toluene (A), benzene (B), xylene (C), and monoterpene (D) concentrations over one-year measurements in 3 different departments and outside. Data with distinct characters indicate significant differences (p < 0.05), whereas data sharing identical symbols do not exhibit significant differences (p > 0.05).
Applsci 13 12572 g004aApplsci 13 12572 g004b
Figure 5. Monthly variations in PM1 (A), PM2.5 (B), and PM10 (C) concentrations over one-year measurements in 3 different departments and outside. Data with distinct characters indicate significant differences (p < 0.05), whereas data sharing identical symbols do not exhibit significant differences (p > 0.05). The values are averages of three independent measurements.
Applsci 13 12572 g005
Figure 6. (A) Distribution of the number of symptoms per patient in the study group (n = 31); (B) the count of reported symptoms per category.
Applsci 13 12572 g006
Table 1. Chronic daily intake (CDI), hazard quotient (HQ), and lifetime cancer risk (LCR) of formaldehyde in different departments of the store and outside.
MonthCDI (mg day−1 kg−1)HQLCR
SweetsDetergentsPlasticsOutsideSweetsDetergentsPlasticsOutsideSweetsDetergentsPlasticsOutside
February2.322.382.820.920.130.130.160.054.43 × 10−64.54 × 10−65.38 × 10−61.76 × 10⁻⁶
March2.642.493.680.710.150.140.210.045.04 × 10−64.76 × 10−67.03 × 10−61.35 × 10⁻⁶
April6.604.804.800.220.370.270.270.011.26 × 10−69.16 × 10−69.16 × 10−64.20 × 10⁻⁷
May2.403.082.290.250.130.170.130.014.58 × 10−65.88 × 10−64.37 × 10−64.73 × 10⁻⁷
June3.404.204.601.600.190.240.260.096.49 × 10−68.02 × 10−68.78 × 10−63.05 × 10⁻⁶
July2.604.405.402.200.150.250.300.124.96 × 10−68.40 × 10−61.03 × 10−54.20 × 10⁻⁶
August2.484.205.822.020.140.240.330.114.73 × 10−68.02 × 10−61.11 × 10−53.86 × 10⁻⁶
September2.254.035.602.280.130.230.310.134.29 × 10−67.69 × 10−61.07 × 10−54.35 × 10⁻⁶
October2.004.003.802.000.110.220.210.113.82 × 10−67.64 × 10−67.25 × 10−63.82 × 10⁻⁶
November2.204.604.001.200.120.260.220.074.20 × 10−68.78 × 10−67.64 × 10−62.29 × 10⁻⁶
December1.203.804.000.340.070.210.220.022.29 × 10−67.25 × 10−67.64 × 10−66.49 × 10⁻⁷
January2.803.604.200.340.160.200.240.025.34 × 10−66.87 × 10−68.02 × 10−66.49 × 10⁻⁷
Disclaimer/Publisher’s Note: The statements, opinions and data contained in all publications are solely those of the individual author(s) and contributor(s) and not of MDPI and/or the editor(s). MDPI and/or the editor(s) disclaim responsibility for any injury to people or property resulting from any ideas, methods, instructions or products referred to in the content.

