Article

Numerical Analysis of Interbedded Anti-Dip Rock Slopes Based on Discrete Element Modeling: A Case Study

1
School of Civil and Resource Engineering, University of Science and Technology Beijing, Beijing 100083, China
2
CCTEG Shenyang Research Institute, Fushun 113122, China
3
State Key Laboratory of Coal Mine Safety Technology, Fushun 113122, China
4
College of Science, Qingdao University of Technology, Qingdao 266033, China
*
Author to whom correspondence should be addressed.
Appl. Sci. 2023, 13(23), 12583; https://doi.org/10.3390/app132312583
Submission received: 24 October 2023 / Revised: 11 November 2023 / Accepted: 13 November 2023 / Published: 22 November 2023

Abstract

:
Varying geological conditions and different rock types lead to complex failure modes and instability of interbedded anti-dip rock slopes. To study the characteristics of failure evolution of interbedded anti-dip slopes, a two-dimensional particle flow code (PFC2D) based on the discrete element method (DEM) was utilized to establish an interbedded anti-dip rock slope numerical model for the Fushun West Open-pit Mine based on the true geological conditions and field investigations. The slope model with an irregular surface consists of interbedded mudstone and brown shale as two different rock layers, and a number of small-scale rock joints are randomly distributed in the rock layers. The influence of different inclination angles (20° and 70°) of the rock layer and slope angles (60° and 80°) on the stability of interbedded anti-dip rock slopes was considered. The evolution of the failure progress was monitored by the displacement field and force field. The simulation results showed that the rock joints in the rock stratum promoted crack initiation and increased the crack density but did not change its shear-slip failure mode. A large inclination angle of the rock layers and slope angle can lead to topping slip failure along the slip zone. However, shear-slip instability generally occurs in interbedded anti-dip rock slopes with small inclination angles of the rock layer and small slope angles. These results can contribute to a better understanding of the failure mechanism of interbedded anti-dip rock slopes under different geological conditions and provide a reference for disaster prevention.

1. Introduction

An anti-dip rock slope is a common geological structure where the stratum dips inward toward the outer surface of the slope [1,2,3,4]. Generally, an anti-dip rock slope is more stable than a conventional dip rock slope. However, unstable anti-dip slopes and their related geohazards are also common in slope engineering due to excavation and disturbances. Statistical analysis shows that approximately ~33% of slope failures occur on anti-dip rock slopes [5], and toppling is the primary failure pattern for anti-dip rock slopes [6,7,8]. A large displacement causes slope failure, which is induced by the nonhomogeneous rock joints and bedding plane [9,10,11]. The mechanical properties and failure modes of anti-dip rock slopes with different rock layers are more complex than a rock slope, which is only composed of one single rock layer [8].
Four different methods are commonly used to study the stability of anti-dip rock slopes: (a) in situ investigations [12,13], (b) laboratory similar testing with rock-like materials [14,15,16], (c) theoretical and analytical methods (e.g., the limit equilibrium method) [17,18,19], and (d) numerical simulation methods [5,20,21]. In situ investigations can provide valuable information about a rock slope before (e.g., the geological condition) and after (e.g., the failure characteristics) slope failure but cannot reveal the evolutionary process or instability mechanism of the slope. Besides, the influence of different factors (such as different rock types, slope angles, and internal discontinuities) on rock slope stability also cannot be comprehensively considered. In laboratory similar tests, the size effect of the rock slope cannot be reflected, and the properties of similar materials also differ significantly from those of real rock materials. Similarly, the theoretical method cannot fully account for the heterogeneous characteristics and unconventional size of a slope. Considering the above limitations, numerical simulations based on on-site geological surveys play a prominent role in analyzing slope stability [22,23,24].
A number of studies have been conducted using the numerical simulation method to throw light on the stability and failure mechanisms of anti-dip rock slopes, and many meaningful results have been obtained [7,25,26]. Various numerical modeling approaches can offer different advantages. To solve the nonlinear stress distribution of anti-dip slopes, their toppling failure was first analyzed using the finite element method (FEM) by Orr et al. [27]. Then, Song et al. [28] studied the seismic responses of anti-dip slopes using three-dimensional FEM. The seismic failure mode of these slopes was identified through analyses of the dynamic responses of the slopes.
To further simulate the sliding, rotation, and collapse characteristics of anti-dip slopes, the discrete element method (DEM) has been gradually adopted by many scholars. Dong et al. [7] employed the discrete element method to simulate the excavation process of an anti-dip slope, and the slope stability after excavation was analyzed and compared with the data from field monitoring. Ren et al. [21] investigated the dynamic effects and failure mechanism of anti-dip bedding rock slopes under seismic loading using three-dimensional DEM, and the amplification effect, changes in the Fourier spectrum, failure mechanism, and permanent displacement of the slope caused by the applied seismic action were analyzed. In addition to the traditional FEM and DEM mentioned above, some novel numerical simulation methods (e.g., DDA, CDEM, and FDEM) have also been applied to analyze the stability of different rock slopes [3,29,30,31].
In summary, although different numerical simulation methods have been extensively used in the stability analysis of anti-dip slopes, the complexity of their failure and instability can be attributed to different geological conditions. Many factors (e.g., the slope surface morphology, distribution of internal rock joints, and inclination angle of the rock stratum for the layered rock slope) also have important influences on the stability of anti-dip slopes. For example, due to the non-uniformity of slope materials and an unreasonable slope excavation design, a major slope collapse accident occurred in an open-pit mine in Inner Mongolia, resulting in 53 deaths and an economic loss of ~204.325 million yuan. Moreover, the simulations of anti-dip interbedded rock slopes should also consider the different rock types. The stability and failure mechanisms of anti-dip interbedded rock slopes warrant more in-depth study.
As the largest open-pit coal mine in Asia, in the Fushun West mine, toppling-sliding failures occur in some slopes. Due to the complexity of the geological conditions, slopes always have a high sliding risk, which endangers mine workers. Based on the true geological conditions of the Fushun West open-pit mine, DEM numerical modeling was performed, and the influences of embedded rock joints, inclination angles of the rock stratum, and the slope angles of anti-dip interbedded rock slopes on the overall stability and crack propagation were investigated in this study. The failure mechanisms of anti-dip interbedded rock slopes with the aforementioned influencing factors were revealed. These results can serve as a foundation for disaster prevention of interbedded rock slopes.

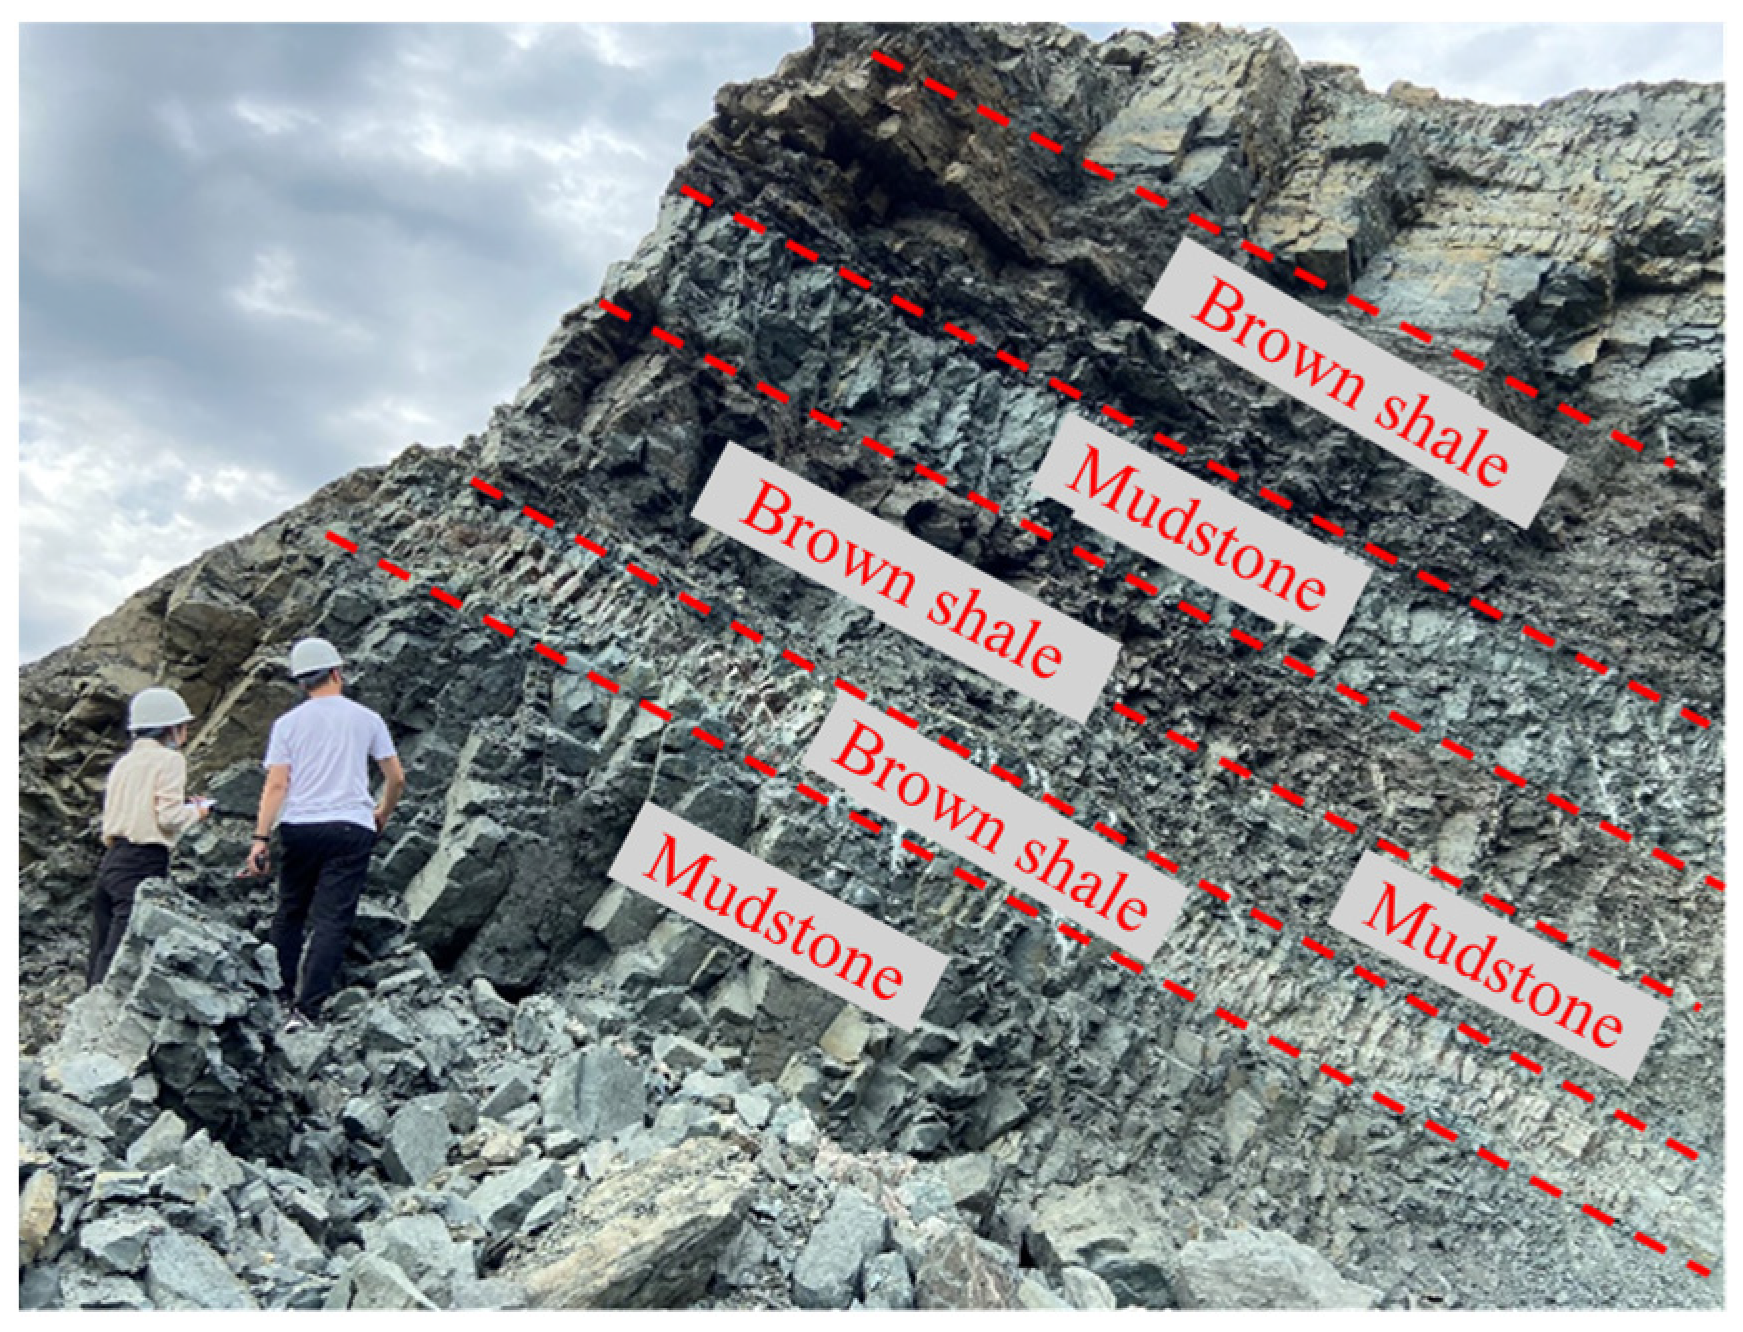
2. Geological Background

Fushun West Open-pit Mine is located in Liaoning Province of China. According to field investigations, the northern rock slope of the mine consists of interbedded layers of soft brown shale and mudstone, accounting for approximately 88% of the total area of the slope. Figure 1 provides a visual representation of these two lithology layers, which are well-arranged with an inclination angle ranging from 15° to 25° for each rock stratum. In situ measurements indicate that the thickness of the mudstone layer is greater than that of the brown shale, with a ratio of approximately 3:1. The typical thickness of the mudstone layers falls between 1 m and 10 m. However, the thickness of the brown shale ranges from 0.3 m to 22 m. Notably, joints can be observed in the rock slope, with inclination angles primarily between 70° and 90°.

3. Engineering Geological Model

3.1. Model Setup

Particle Flow Code (PFC) 5.0 is a common calculation and analysis software based on the discrete element method (DEM), and it is widely utilized in research on rocks and rock-like materials [5]. In PFC 2D, rock samples can be represented by disk-shaped particles, and the interactions between particles are achieved through contact bonds. In particular, the parallel bond model (PBM) can transmit both force and moment between the particles [32], which is extensively used in simulating deformation behaviors and strength characteristics of natural rock or cement mortar materials [5,33,34,35]. The smooth joint model (SJM) is used to simulate the behavior of a planar interface created by a rock joint in a parallel bond model [36]. A linear model (LM) can provide the behavior of an infinitesimal interface that does not resist relative rotation [37]. One crack occurs when a contact bond fractures. Additionally, the mechanical behavior of particles in PFC adheres to Newton’s second law [38]. The deformation and the stress equilibrium state of the sample are calculated by iterative analysis until the end of the simulation tests.
In this study, a representative simplified model was utilized based on the true geological conditions of the Fushun West Open-pit Mine in order to investigate the stability and failure process of an anti-dip rock slope with interbedded mudstone–brown shale (Figure 2a). The simulated slope model consists of mudstone and brown shale strata. The thickness of each mudstone stratum is 3 m, and the thickness of each brown shale stratum is 1.5 m. According to this investigation, joints with inclination angles ranging from 70° to 90° exist in the strata of mudstone. Therefore, joints with 75° inclination angles and 3 m length were set inside the mudstone layer.
The numerical model was established based on the following procedures. Firstly, the contours of mudstone and brown shale were drawn with multi-segment lines in a certain area using CAD 2014. These contours were later imported into PFC 2D, resulting in the generation of corresponding particles within their respective regions. The height and width of the slope were set to 30 m and 60 m, respectively. To optimize the computational efficiency, the actual mineral particle size was scaled up within the numerical model. The size of the mudstone particles ranged from 0.1 m to 0.15 m randomly, while the size of the brown shale particles followed a random distribution ranging from 0.12 m to 0.18 m.
PBM was utilized to simulate the contact between the particles and reproduce the rock behavior within the model. LM was used to act as the interlayer contact between the mudstone and brown shale particles, while SJM was adopted for the simulation of the rock joint. Notably, the designed lines were digitalized in CAD and then imported into the PFC 2D numerical model to act as the joint. Additionally, four measuring circles were strategically arranged on the side of the slope surface to monitor the stress and strain state during the landslide simulation. In this study, three boundaries of the simulation model were constrained by a rigid wall. The excess particles outside the slope wall were directly deleted to simulate the excavation of the mining process. Then, we began to calculate under gravity to reach a new equilibrium. In PFC 2D, the safety factor can be calculated by the gravity increase method, which is defined as the ratio of the gravitational acceleration in the limit state to that in the initial state, according to [39,40]. This study did not concentrate on the stability analysis by calculating the safety factor and instead focused on the failure process and mechanical damage mechanism.

3.2. Parameter Calibration

The micro-parameters in PFC differ from the macro-mechanical parameters of materials. Consequently, it is common and essential to adjust the micro-parameters of various groups in the numerical model until the modeled macro-mechanical properties (such as the compressible strength, tensile strength, shear strength, and elastic modulus, etc.) are consistent with the results from the laboratory tests.
The shear strength parameters of mudstone and brown shale were obtained from the field investigation data (as shown in Table 1). To get similar macro-shear strength parameters, biaxial compression tests and direct shear tests were conducted in this study. Under a confining pressure of 0, 5, or 10 MPa, a set of biaxial compression tests was carried out to obtain the stress–strain curves. Then, a Mohr–Coulomb failure envelope was depicted to calculate the relevant strength and deformation parameters [35,40,41,42]. If the obtained macro-parameters (cohesion, internal friction angle, and Yong’s modulus in this study) were similar to the field investigation data, the micro-parameters of PBM were considered to be available. The SJM parameters come from shear tests of a fractured specimen. The strength and stiffness of the LM were lower than that of the bond in the two sides of the bedding plane in this study.
The calibrated micro-parameters of the PBM are shown in Table 2, and the calibrated micro-parameters of the LM and SJM are shown in Table 3.

3.3. Numerical Test Scheme

This study mainly focused on the influence of the rock joint, dip angle of the rock stratum, and slope angle on the stability of the interbedded anti-dip rock slope. The rock slope includes interbedded mudstone strata and brown shale strata, and the thickness of each mudstone and brown shale layer is 3 m and 1.5 m, respectively. The specific numerical test scheme is shown as follows:
(1)
Effect of a joint in the rock layers on the stability of the interbedded anti-dip rock slope. A slope-free surface was designed with an irregular step shape based on the true excavation sequence (Figure 1), and the dip angle of each rock layer was set to 20°. For the model containing joints, joints with a 70° inclination angle and a 3 m length were located in the vicinity of the free slope surface, which was perpendicular to the bedding plane (Figure 2a). Furthermore, one slope without joints was designed to compare the failure characteristics (Figure 2b).
(2)
Effect of the inclination angle of the rock layers on the stability of the anti-dip interbedded rock slope. The irregular slope-free surface was simplified into a straight line in the numerical model, and the inclination angle of the rock stratum was set to 20° or 70° (Figure 2c,d).
(3)
Effect of the slope angle on the stability of the anti-dip interbedded rock slope. The slope angle was designed to be 60° (Figure 2d) or 80° (Figure 2e) in this scheme.

4. Results

4.1. Influence of Joints in Rock Strata on the Stability of Interbedded Anti-Dip Rock Slopes

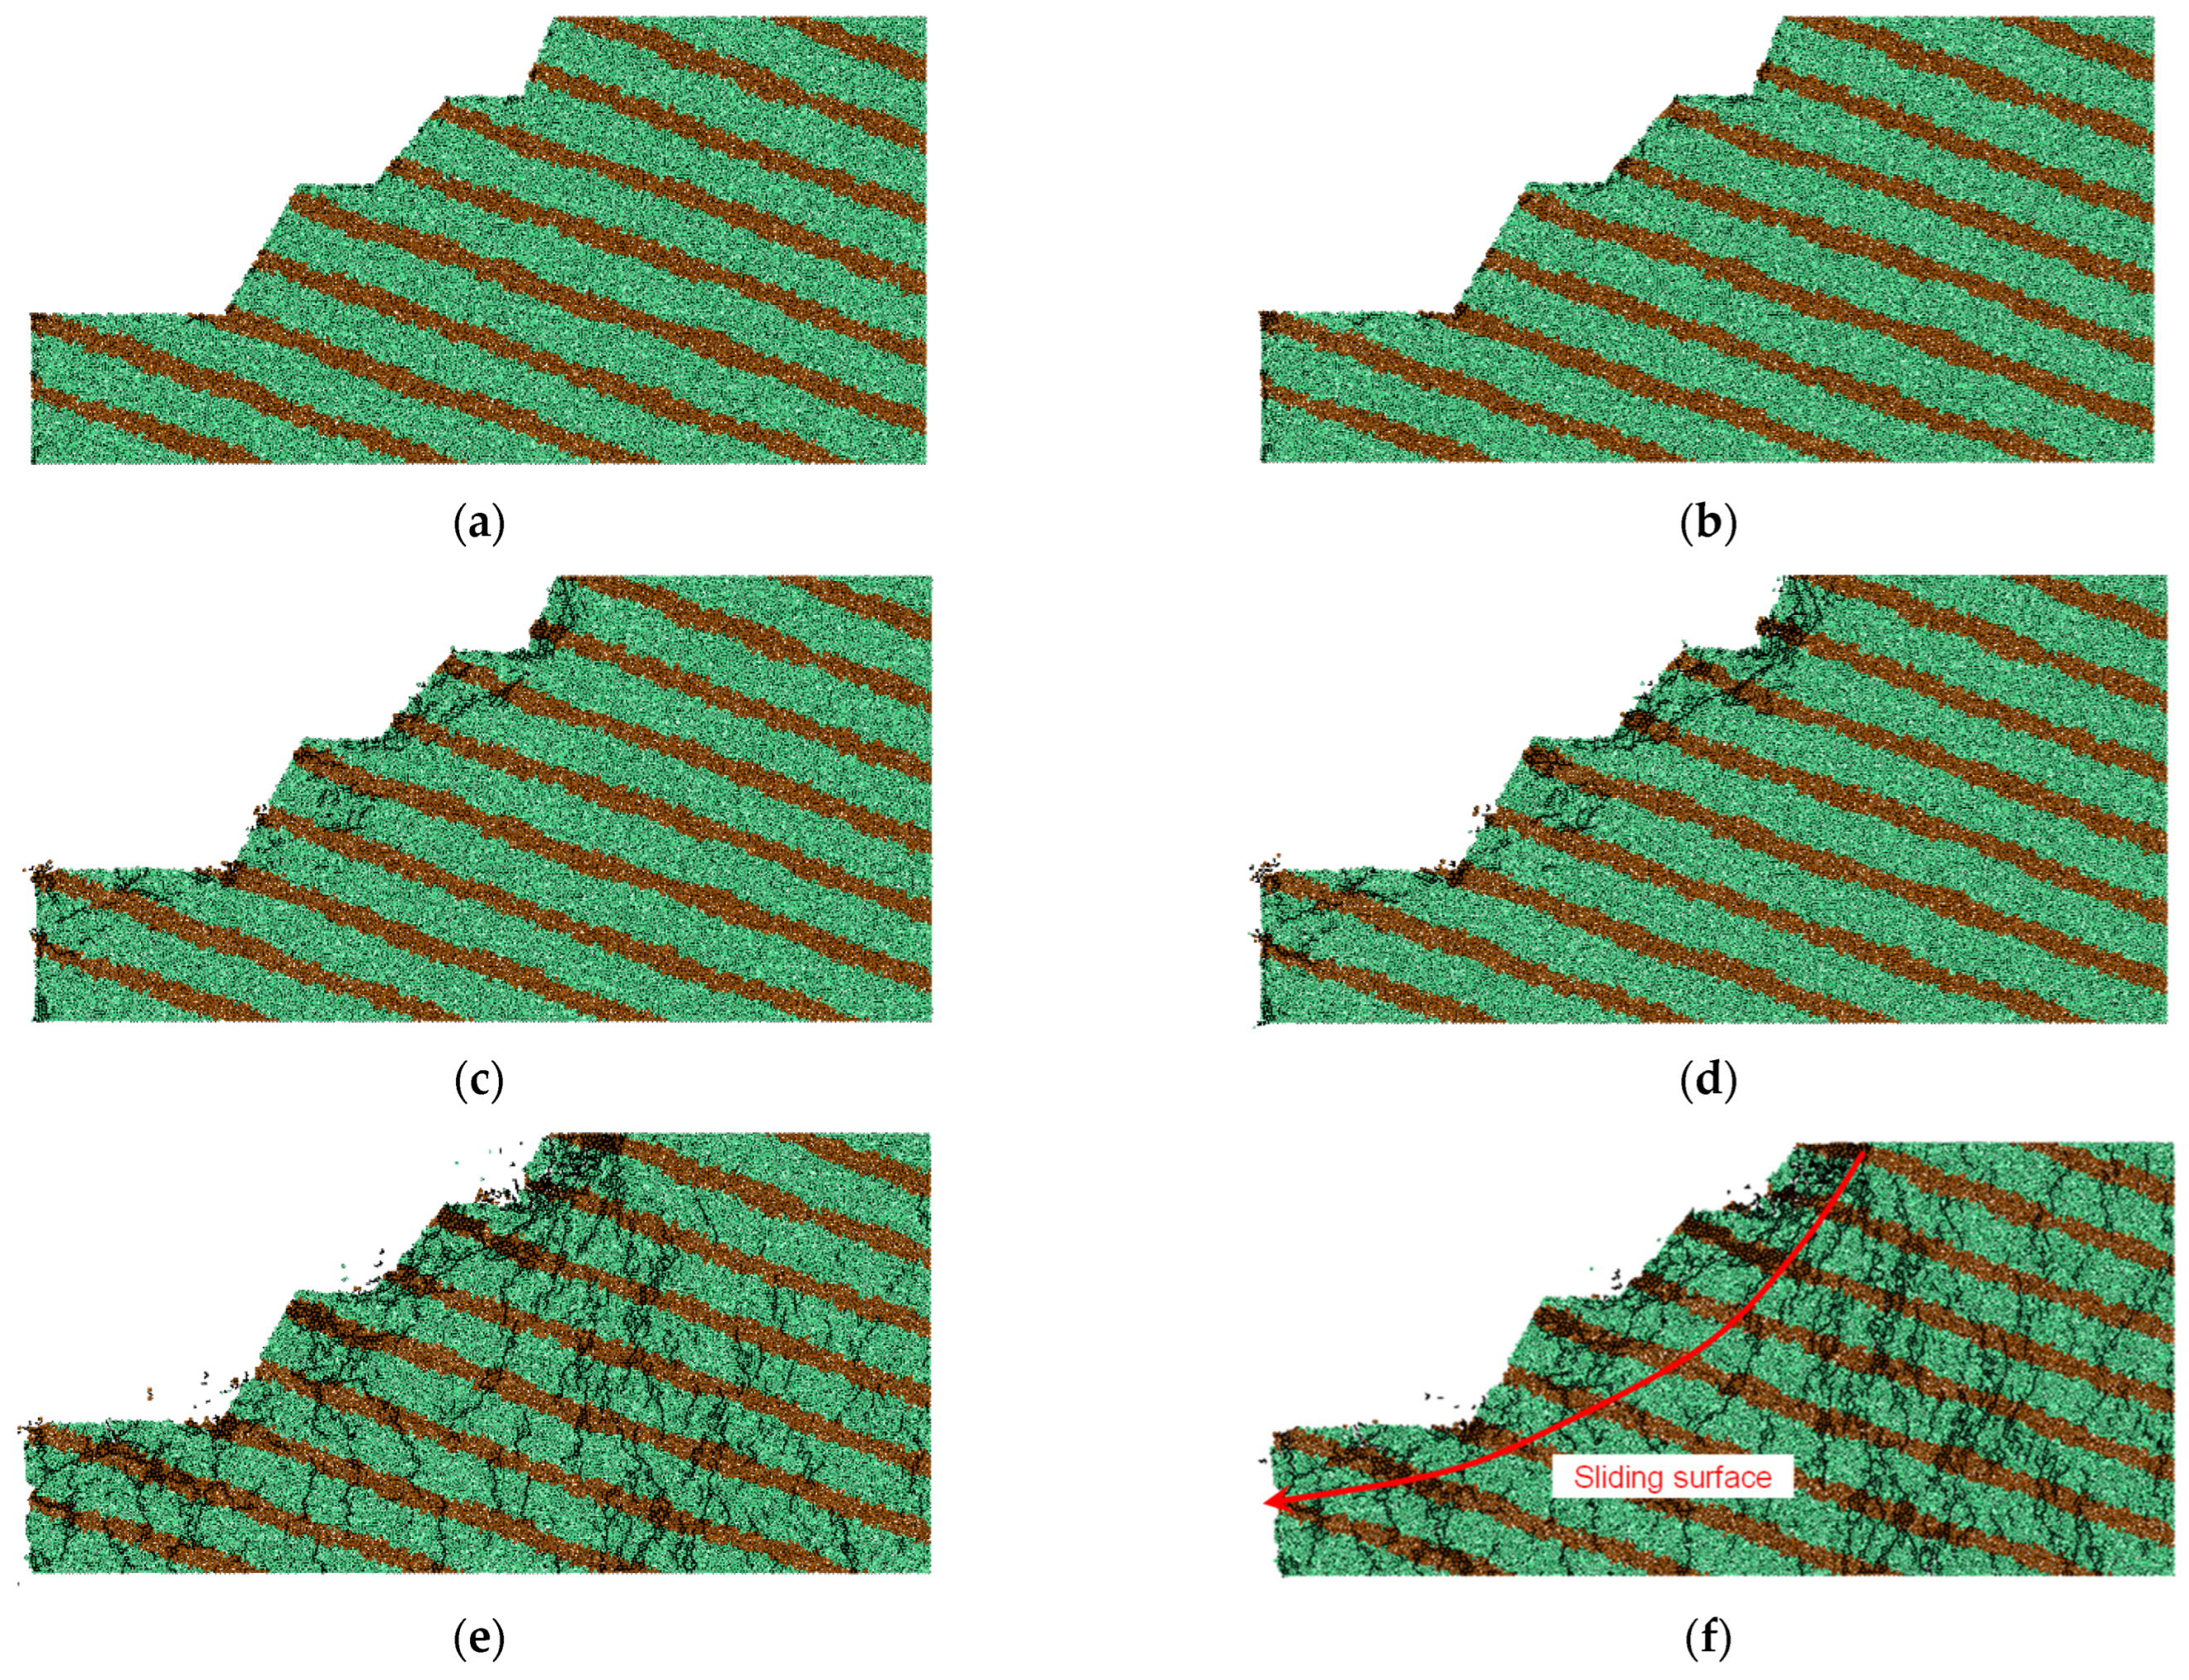
4.1.1. Failure Characteristic of the Slopes with Joints

The evolving characteristics of the crack distribution, displacement field, and force field during a landslide were analyzed, and the failure mechanisms of the interbedded anti-dip rock slope influenced by these randomly distributed rock joints were studied. We recorded the state of the slope at six moments (i.e., time steps = 100, 200, 1000, 5000, 10,000, and 30,000) to facilitate analysis.
As depicted in Figure 3a, when the time step = 100, the cracks initially occurred around the joints in the brown shale strata. The excavation and unloading process resulted in noticeable displacements between adjacent particles near the joints, as the strength of a pre-existing joint is weaker compared to intact rock. Additionally, the shear strength of brown shale is smaller than that of mudstone, resulting in an earlier appearance of cracks in the brown shale layers. As the time step increased, the number of cracks gradually rose. When the time step was 200, more cracks formed around the slope surface (Figure 3b). When the time step reached 1000 (Figure 3c), the small cracks propagated and coalesced. New cracks were formed between the two different rock strata due to their weak contact strength. According to the distribution of the cracks at the 5000 time step (Figure 3d), the number of cracks around the joints continued to increase, mainly distributed along the directions of the joints. As the time step increased to 10,000 (Figure 3e), more cracks occurred inside the rock slope, and their location was far away from the rock slope surface. Additionally, these new cracks were almost perpendicular to the rock strata orientation. At the time step of 30,000 (Figure 3f), the crack density significantly increased, with a large number of small cracks gathering and connecting along the bedding direction and the slope sliding surface. The rock mass near the slope surface fragmented into small blocks and then slid along the sliding surface.
An analysis of slope stability relies on the understanding of its deformation characteristics, which serve as crucial indicators of rock slope destruction and instability. The displacement field monitored during the calculation process provided more valuable information about the deformation characteristics of the whole slope.
According to Figure 4a, the largest displacement occurred along the slope surface at the time step of 100, and the area in the vicinity of the joints also showed a larger displacement than the other areas. With the increasing time step, the overall displacement of the slope increased (Figure 4b). In contrast to the displacement at a time step of 100, the displacement of the area around the joints significantly decreased, indicating that the contact of the joint surfaces became tighter under gravity. For the 1000 time step (Figure 4c), the displacement increased as the distance to the slope surface increased. Furthermore, following the direction of the red arrow, the color gradient from light blue to dark blue became clear, and the color layering and transition were very obvious. Cracks were more likely to develop due to the change of the deformation. When the time step reached 5000 (Figure 4d), the rock mass of the slope top became fragmented, leading to a sharp decrease in the carrying capacity of the rock slope. Simultaneously, significant deformation occurred at the top of the slope, accompanied by the dropping of small fragments. Subsequently, the deformation extended further from the slope surface toward the interior of the slope, and the area of the dark blue decreased as the test proceeded (Figure 4e,f). From Figure 4f, the crack coalescence resulted in the downward sliding of rock blocks, ultimately leading to a larger deformation and overall damage to the rock slope.
Figure 5 shows the evolution of the contact force chain in the slope with joints. As the time step increased, the number of contacts decreased while the number of cracks increased. Initially, the compressive contact force chain covered almost the whole slope. Due to the higher strength of the compressive contact force chain compared to the tensile contact force chain, the initiation of micro-cracks is difficult under compressive stress. However, the number of tensile contact force chains gradually increased over time. At the same time, a few small shear micro-cracks initially developed, followed by the occurrence of tensile micro-cracks in the brown shale strata. The shear cracks predominantly aligned parallel to the free surface of the rock slope.
Figure 6 depicts the stress distribution at the measuring circles on the rock slope with joints. In the initial stage of the simulated test, particles near the slope surface slid downwards and accumulated at the slope toe due to the effects of gravity. As a result, both the horizontal and the vertical stresses increased at the beginning. Subsequently, micro-cracks were generated from the locations around the measuring circles, resulting in the stress decreasing. When the small cracks propagated, coalesced, and connected, the stress in the vicinity of the measuring circles tended to approach zero. Under the influence of the overlying load and gravity, the stress level gradually increased with the increasing distance from the measuring circle to the top of the slope. The distribution of the stress at the measuring circle locations was related to the crack distribution and changes in displacement during the slope failure process.
Shear-slip failure dominated the instability of the interbedded anti-dip rock slope with joints. The failure started from the step toes on the slope and the pre-existing joints. In addition, the existence of the pre-existing joints promoted shear dislocation within the rock slope, ultimately resulting in shear failure and instability.

4.1.2. Slope Stability without the Presence of Joints

To reveal the effect of the joints on the stability of the anti-dip interbedded rock slope, one simulated model without joints was established to compare the differences in slope failure between them (Figure 2b). Compared with the rock slope with joints in Section 4.1.1, the main differences between the anti-dip interbedded rock slope with and without joints lie in the micro-crack distribution near the pre-existing joints and the velocity of the slope instability.
From Figure 7, the cracks initially occurred at the slope toe of the step and subsequently propagated, expanded, and coalesced upwards towards the top of the slope. The number of cracks was smaller than the rock slope with joints. The cracks almost developed parallel to the slope surface, resulting in a sliding surface. The comparison of the failure modes showed that the pre-existing joints did not significantly affect the cracking patterns of the interbedded anti-dip rock slopes, and the cracks developed at similar positions but at a later time. In other words, the existence of joints induced the generation of cracks on the sliding surface, increased the crack density, and accelerated the process of slope failure.
The stress distributions observed from the contact force chain evolution in the two kinds of rock slopes (i.e., with and without pre-existing joints) were also similar (Figure 5 and Figure 8). However, it is worth noting that the number of contacts in the rock slope without joints was slightly higher than that in the slope with joints, which indicated that large strength and high stability occurred in the rock slope without pre-existing joints.
Figure 9 shows a comparison of horizontal stresses at identical locations of the measuring circles. Measuring circles A–D and E–H are from the slope with and without joints, respectively. The horizontal stress from the slope without joints was slightly higher at the beginning of the slide, and the stress difference between the two kinds of slopes was overall small. The stresses all gradually decreased to zero as the landslide progressed. There were two reasons for the similar changes in stress: (1) The influence range of the initial joints was limited in this large slope model, and the location of the measuring circles was different from the location of the initial joints. Therefore, pre-existing joints have a small effect on the rock mass in the location of the measuring circles. (2) The measuring circles were near the sliding surface, and numerous cracks were distributed on the sliding surface. When the cracks coalesced, the stresses were nearly zero.

4.2. Influence of the Dip Angle of Rock Layers on the Stability of an Anti-Dip Interbedded Rock Slope
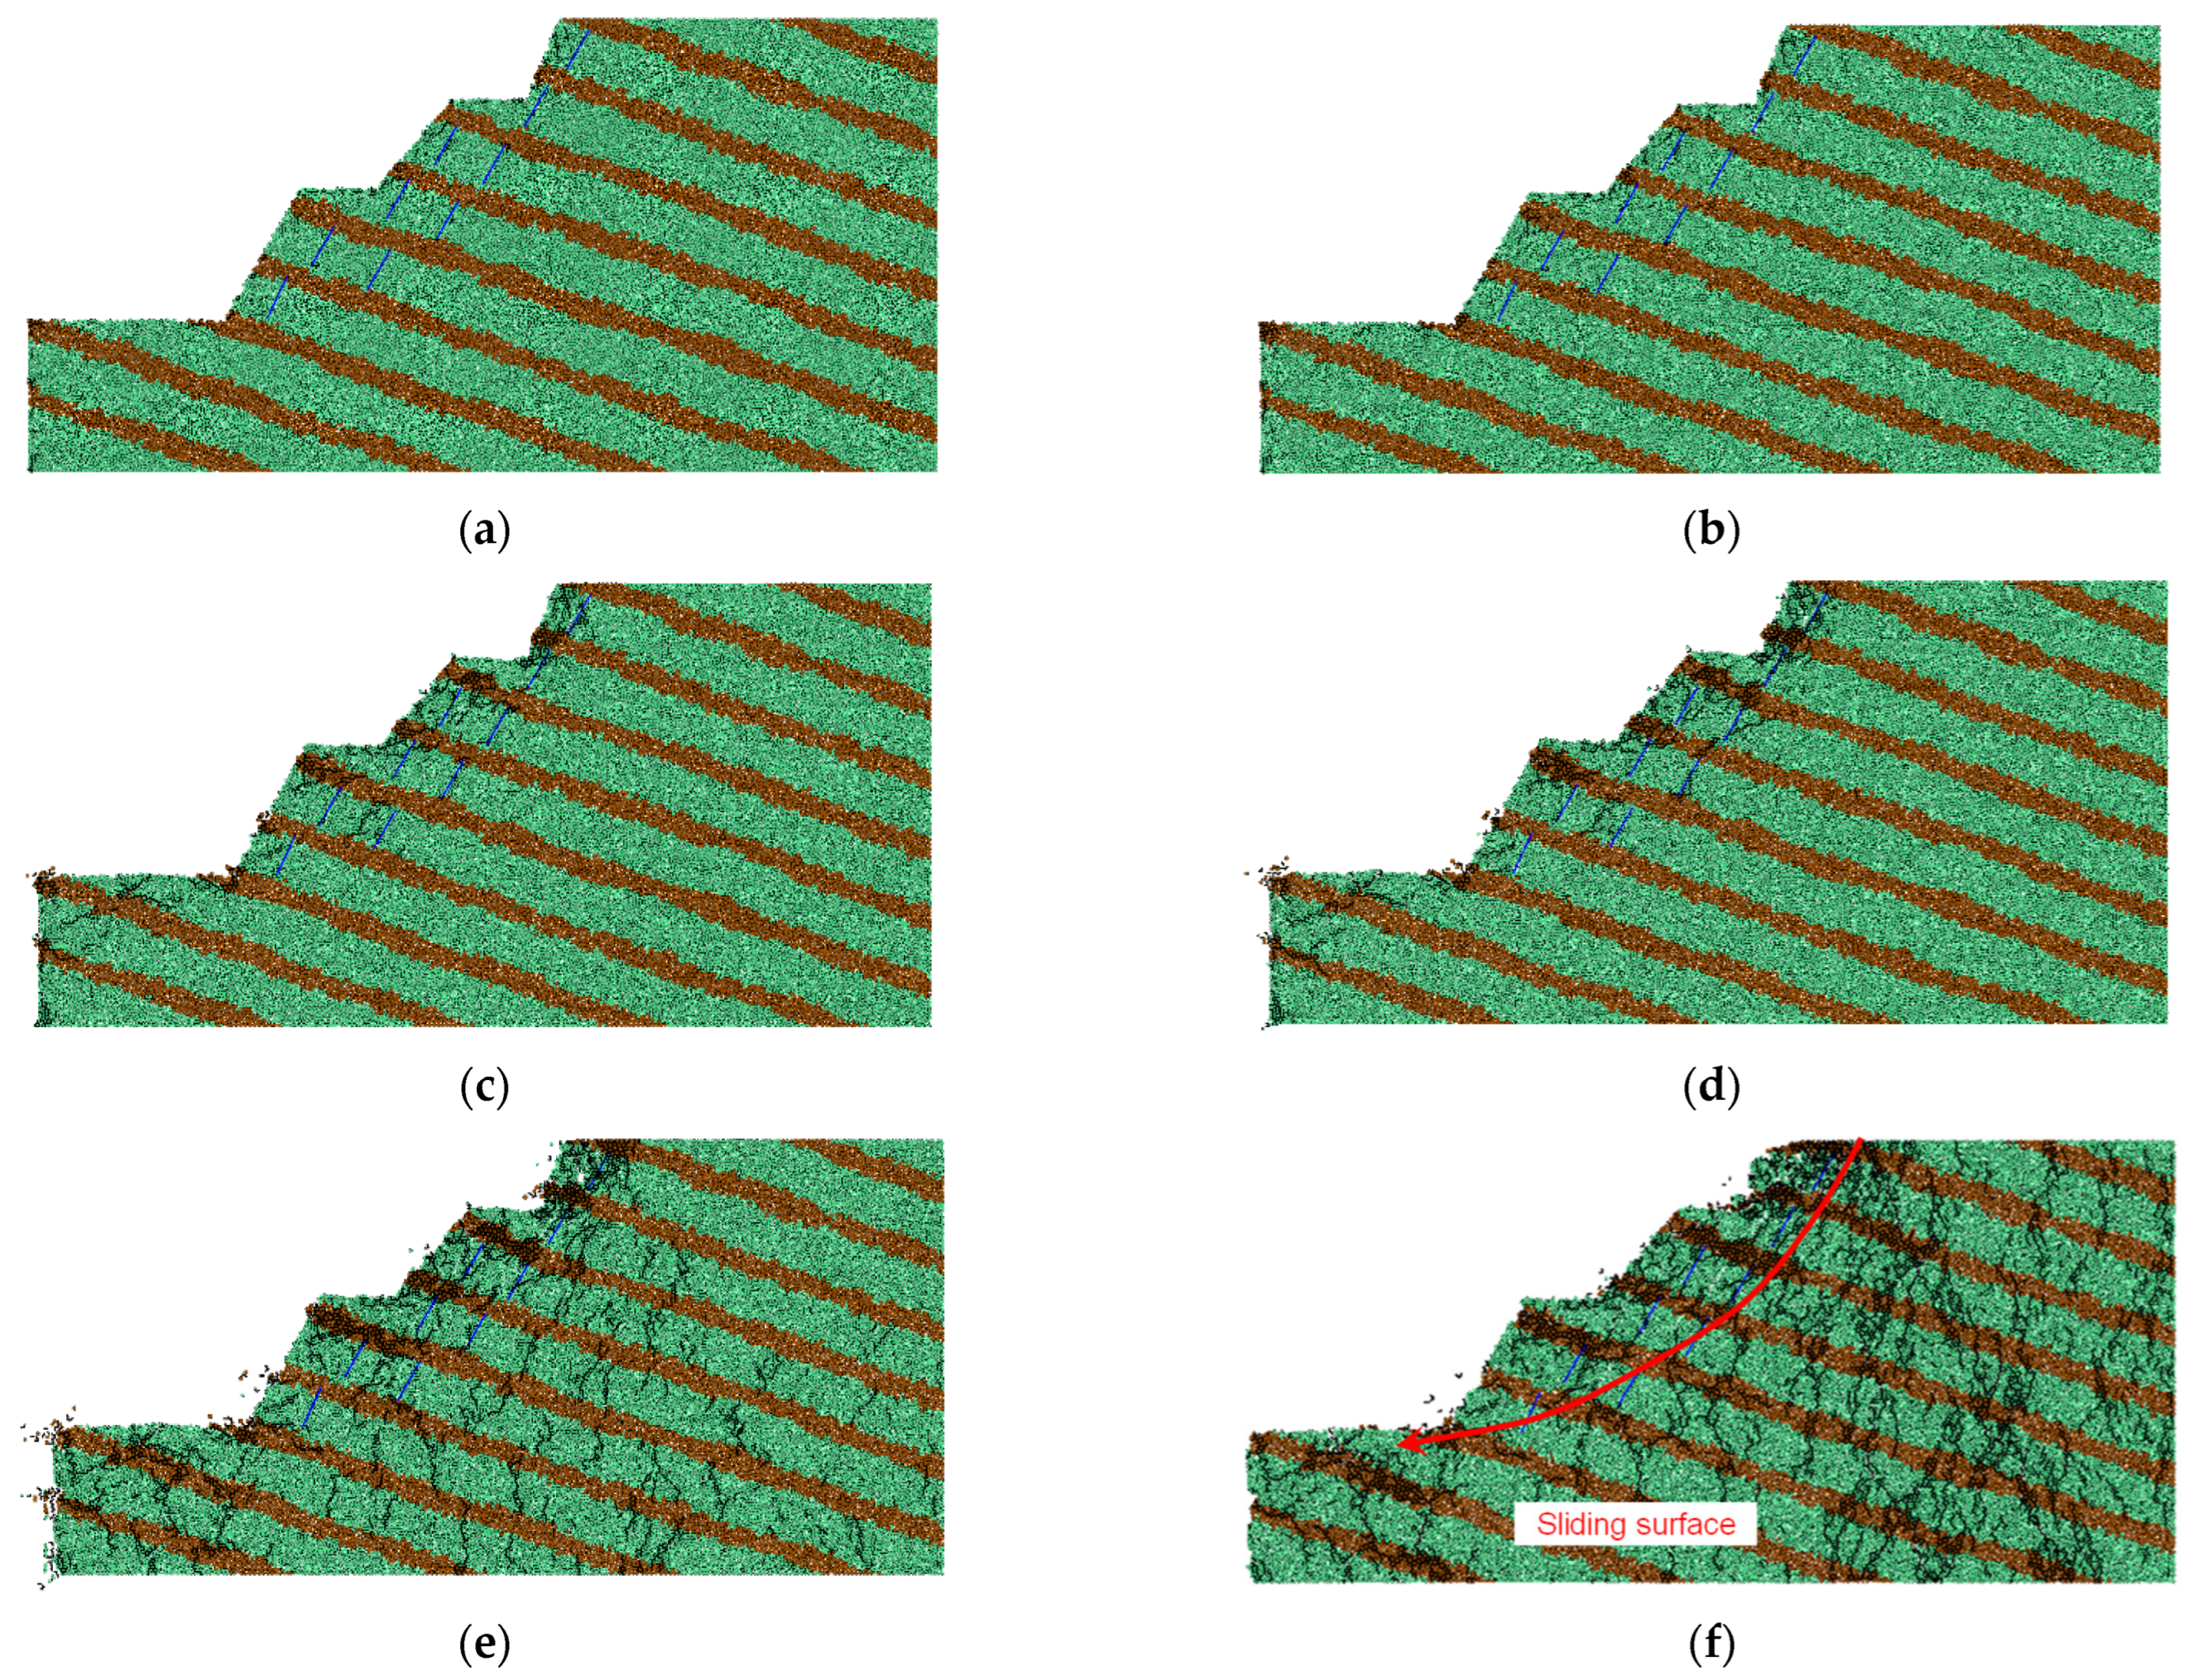
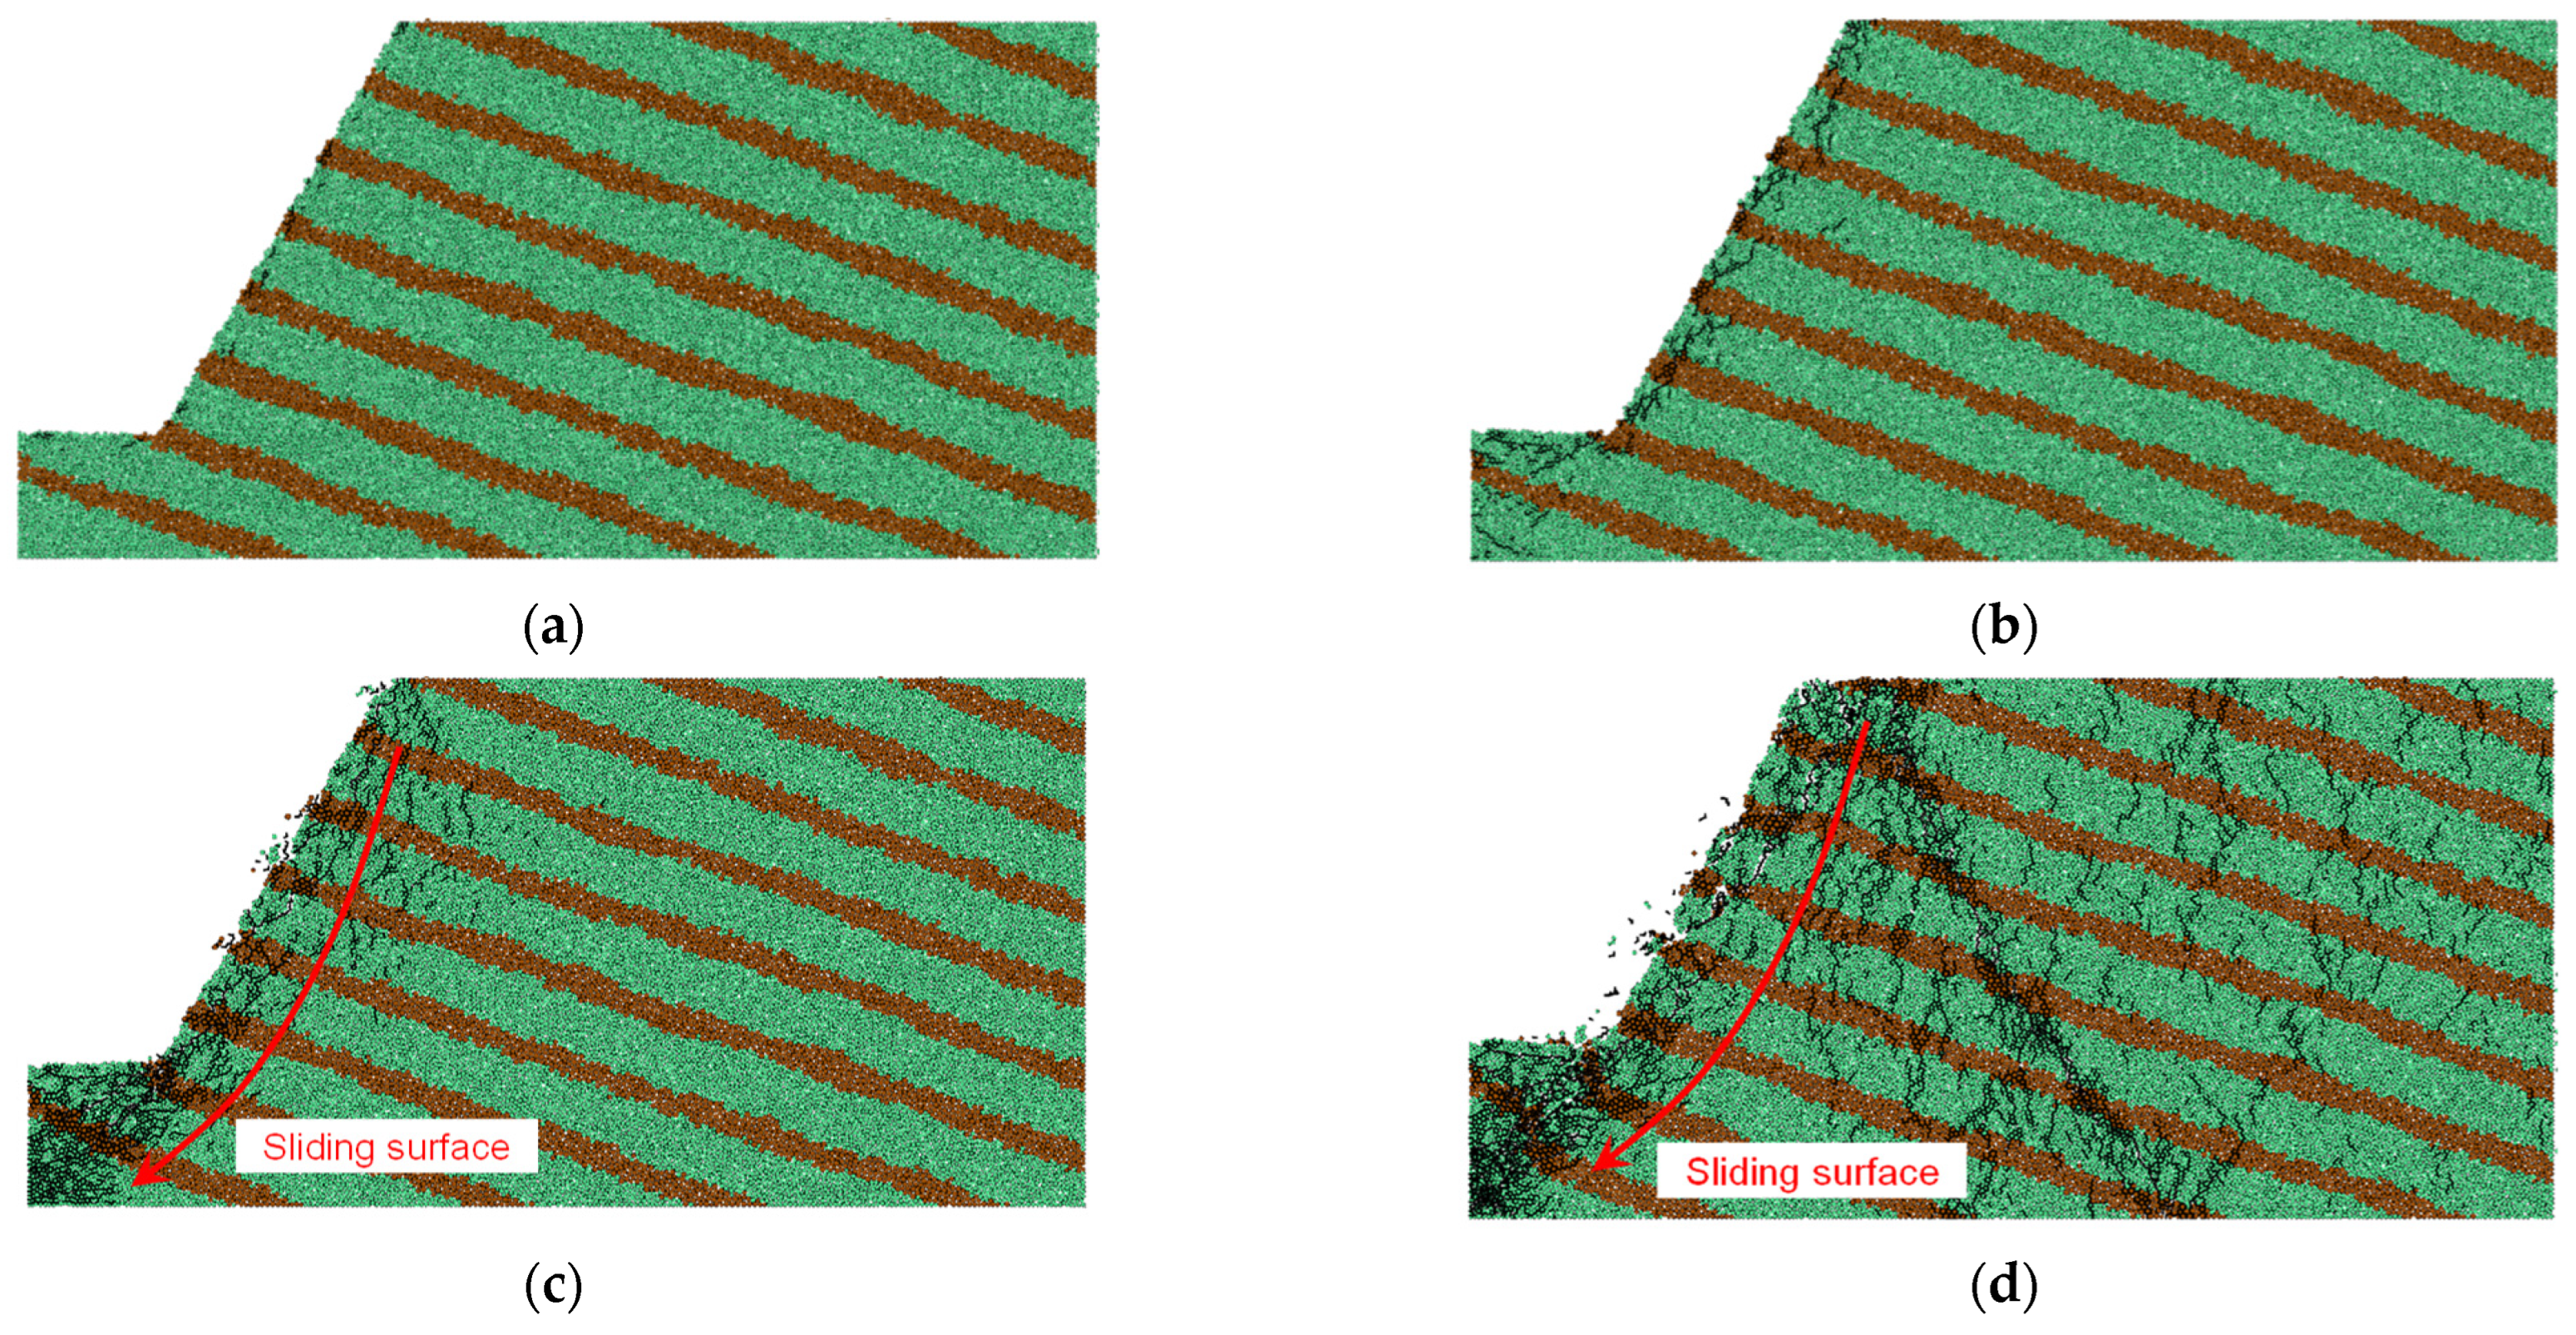
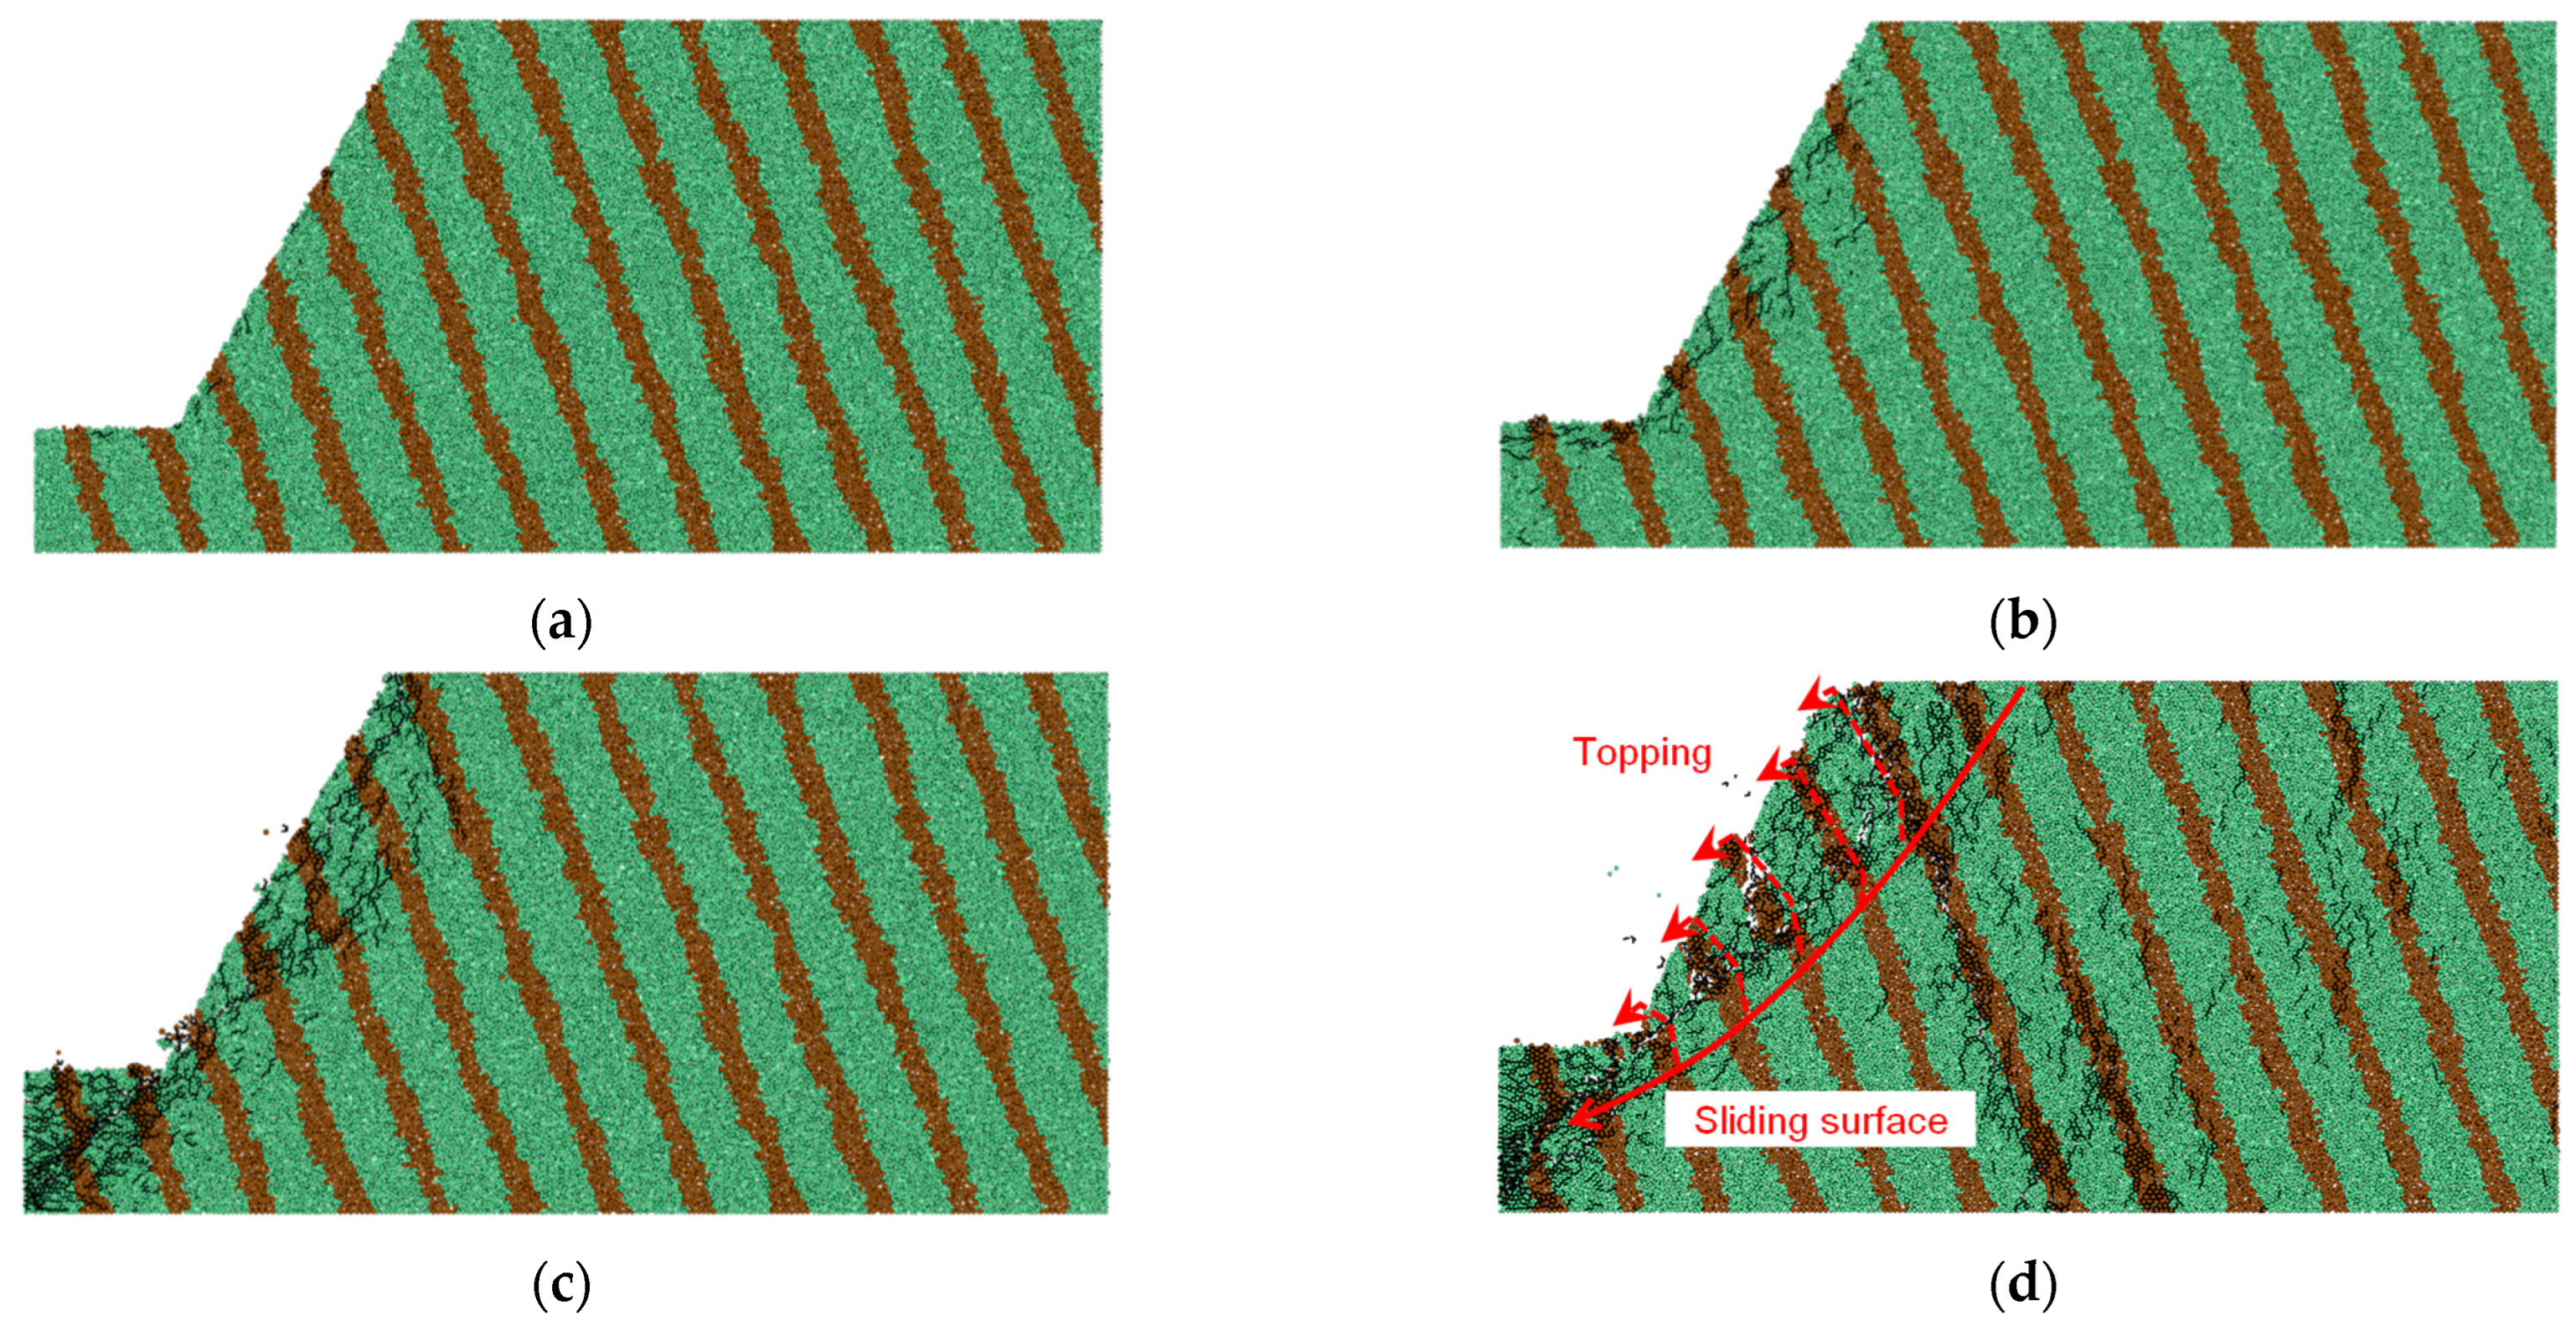
The dip angle of the rock layers can affect the sliding surfaces, which has an important effect on the mechanical behaviors of an interbedded anti-dip rock slope. In this section, how the dip angle of the rock strata influences the failure mode and mechanisms was analyzed and discussed.

4.2.1. Failure Mode

Figure 10 and Figure 11 depict the crack evolution in rock slopes with different rock strata dip angles (20° or 70°).
The cracks initiated from the slope toe, the edge of the slope surface, and the top of the slope (Figure 10a), and subsequently propagated and extended toward the inside of the slope (Figure 10b), leading to the generation of a curved sliding surface. Then, a curved sliding zone along the slope surface formed (Figure 10c). Due to gravity and the overlying squeezing effect, the small rock blocks cut by the cracks began to slip downward or fall outward. With the increase of the time step, large rock blocks slid along the sliding surface, which induced the final shear-slip instability of the interbedded anti-dip rock slope.
Compared with the interbedded anti-dip slope with 20° dip angle of the rock stratum, cracks do not occur on the top of the slope at first (Figure 11a) but on the slope toe under the action of gravity and the overlying load from rock mass when the dip angle of the rock stratum is 70°. The cracks propagated nearly perpendicular to the rock strata (Figure 11b). The low interlayer contact strength between the two rock layers and the large dip angle of the rock layers led to the easier initiation of micro-cracks. Subsequently, the deformation of the upper part of the slope became pronounced, and long cracks occurred along the bedding plane (Figure 11c). With the further development of interlayer fractures, the fracture and slip of the rock mass at the bottom of the slope caused the overlying rock mass to lose its support. The rock mass along the fractured surface became increasingly fragmented and then slid along the sliding surface, while the rock mass in the middle and upper sections of the slope exhibited noticeable bending and fracturing. Finally, a combined failure involving toppling and sliding took place in the interbedded slope with a rock dip angle of 70° (Figure 11d).

4.2.2. Analysis of Failure

(1)
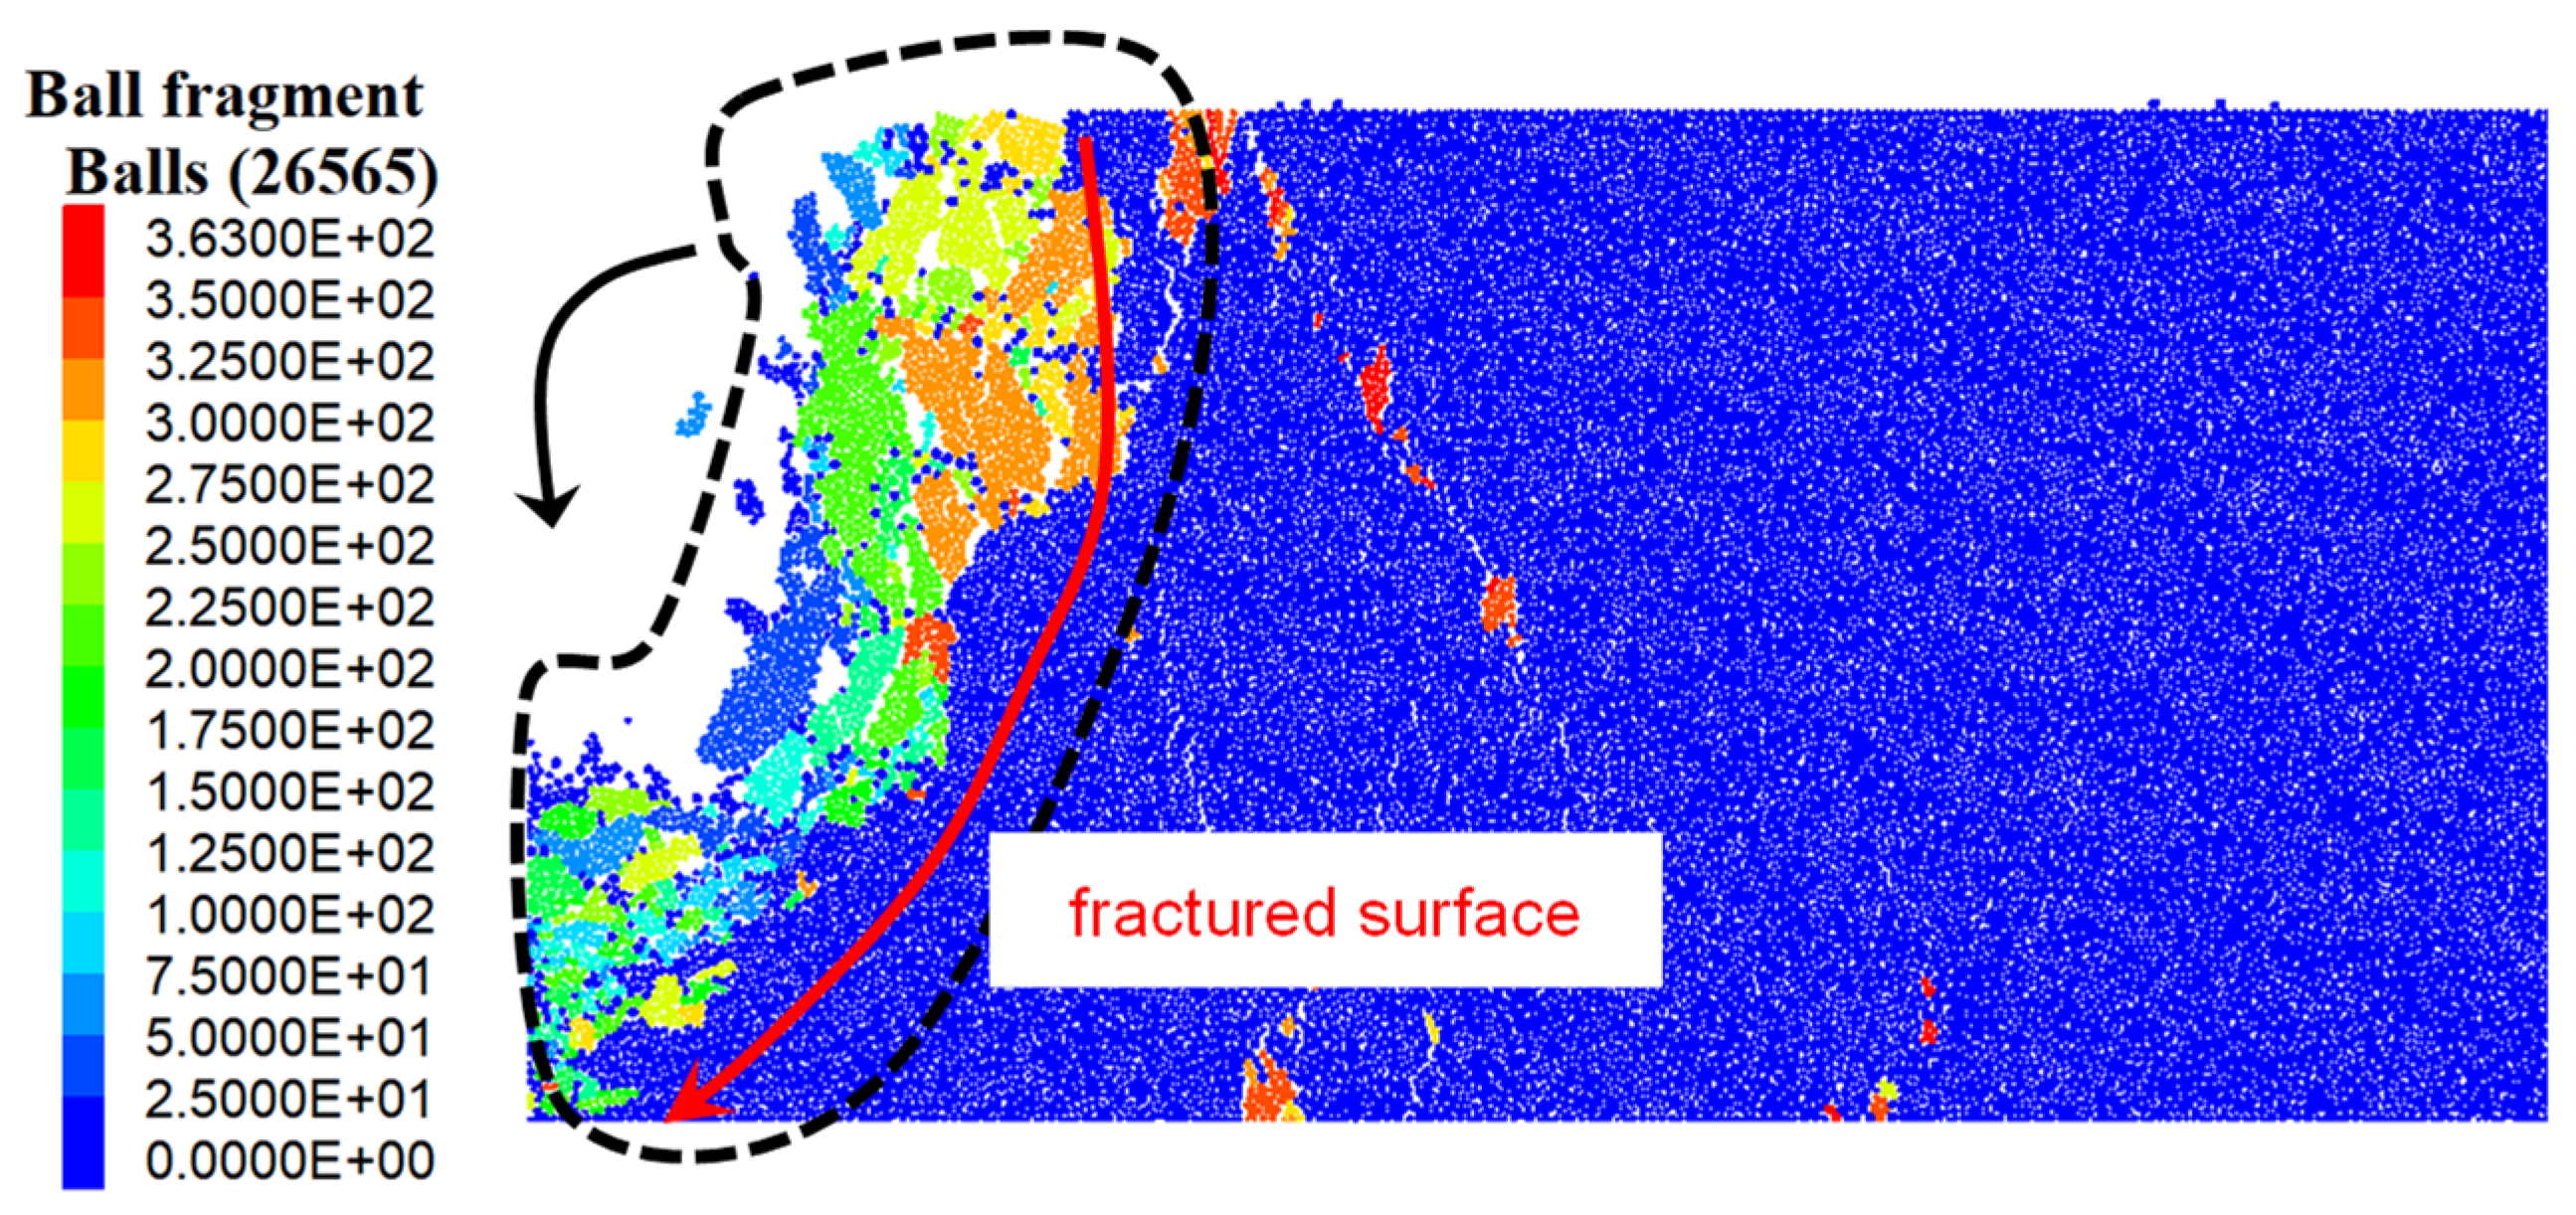
Fragmentation Characteristics
The fragmentation patterns of the anti-dip interbedded rock slope with different dip angles are shown in Figure 12. The rock slope model with a 20° dip angle of rock layers produced a greater number of fragments compared with the slope model with a 70° dip angle. In addition, the size of the fragments showed different characteristics in the two slopes with different dip angles. There were larger fragments in the interbedded anti-dip rock slope with a 70° dip angle. Large rock fragments or blocks typically toppled over rather than sliding along the sliding surface. The varying numbers and sizes of the fragments also indicate the differences in the rock slopes with two kinds of dip angles.
(2)
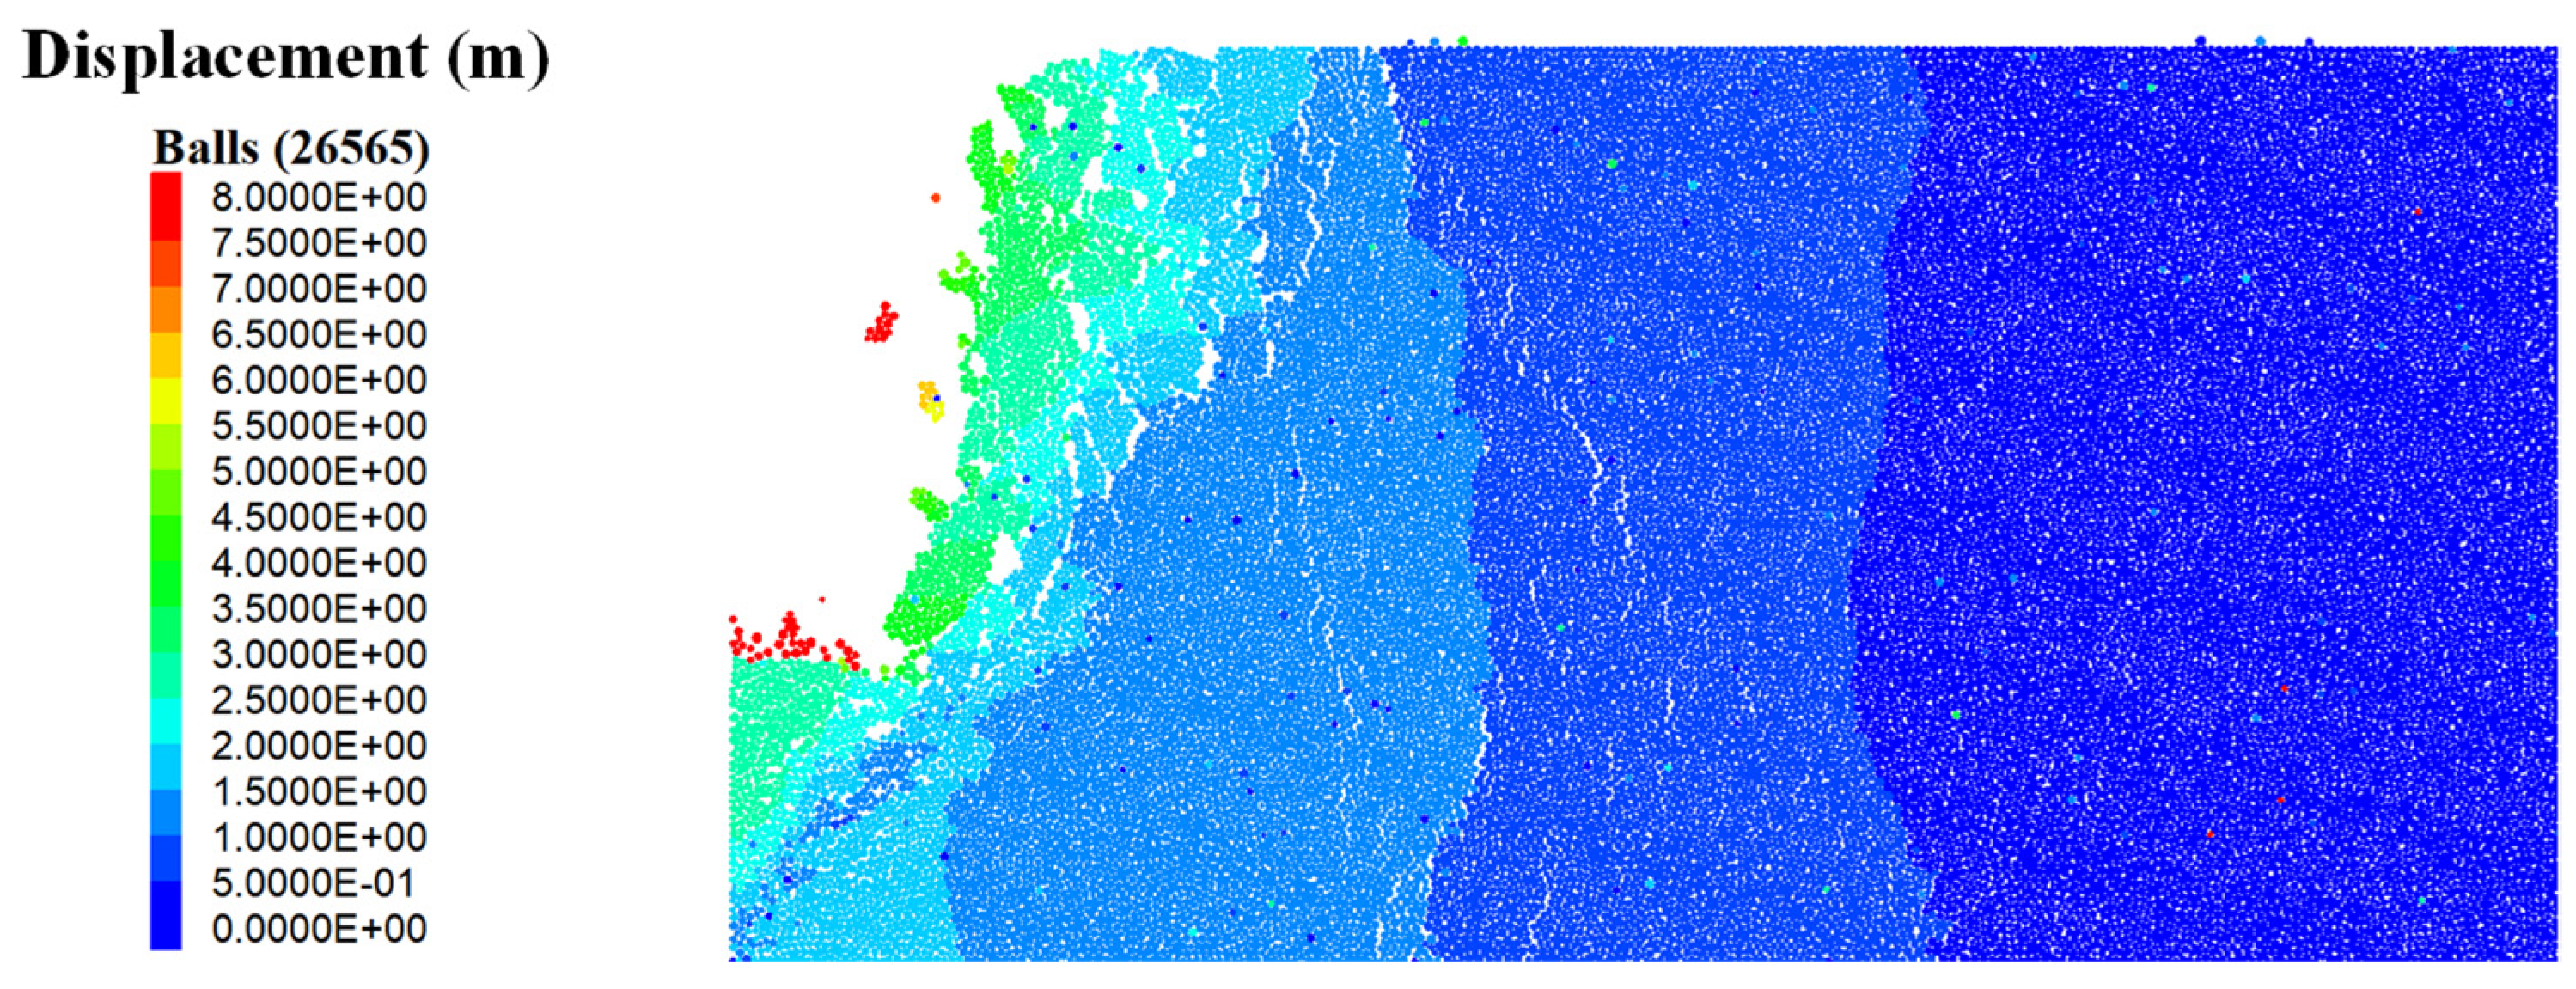
Deformation characteristics
As shown in Figure 13a, the deformation was small for locations that were far away from the slope surface when the dip angle of the rock stratum was 20°. The rock mass on the sliding fracture zone surface was highly fragmented and primarily underwent shear deformation and movement along the slope surface, suggesting that shear-sliding instability occurred in the slope. Figure 13b shows the displacement field of the slope model at a 70° dip angle of rock strata. It can be observed that the deformation range of the sliding fracture zone increased. Furthermore, the upper part of the fragments experienced greater displacement than the lower part, indicating a tendency for downward rotation and toppling of these fragmented rock masses. The formation of these larger rock fragments primarily arose from the prominent shear dislocation phenomena within the middle rock mass caused by the different lithology of the brown shale and the mudstone, ultimately leading to bedding separation in the rock slope. In addition to its own gravity, the rock mass at a relatively low position of the slope bore the pressure from the overlying rock layers. This pressure facilitated crack formation and crack connection, resulting in the formation of a continuous sliding surface. Additionally, the upper rock mass was susceptible to shearing and downward movement due to the loss of support from the lower rock mass. Eventually, this progression transformed into a combined failure characterized by tilting and sliding during the later stage of the landslide.
(3)
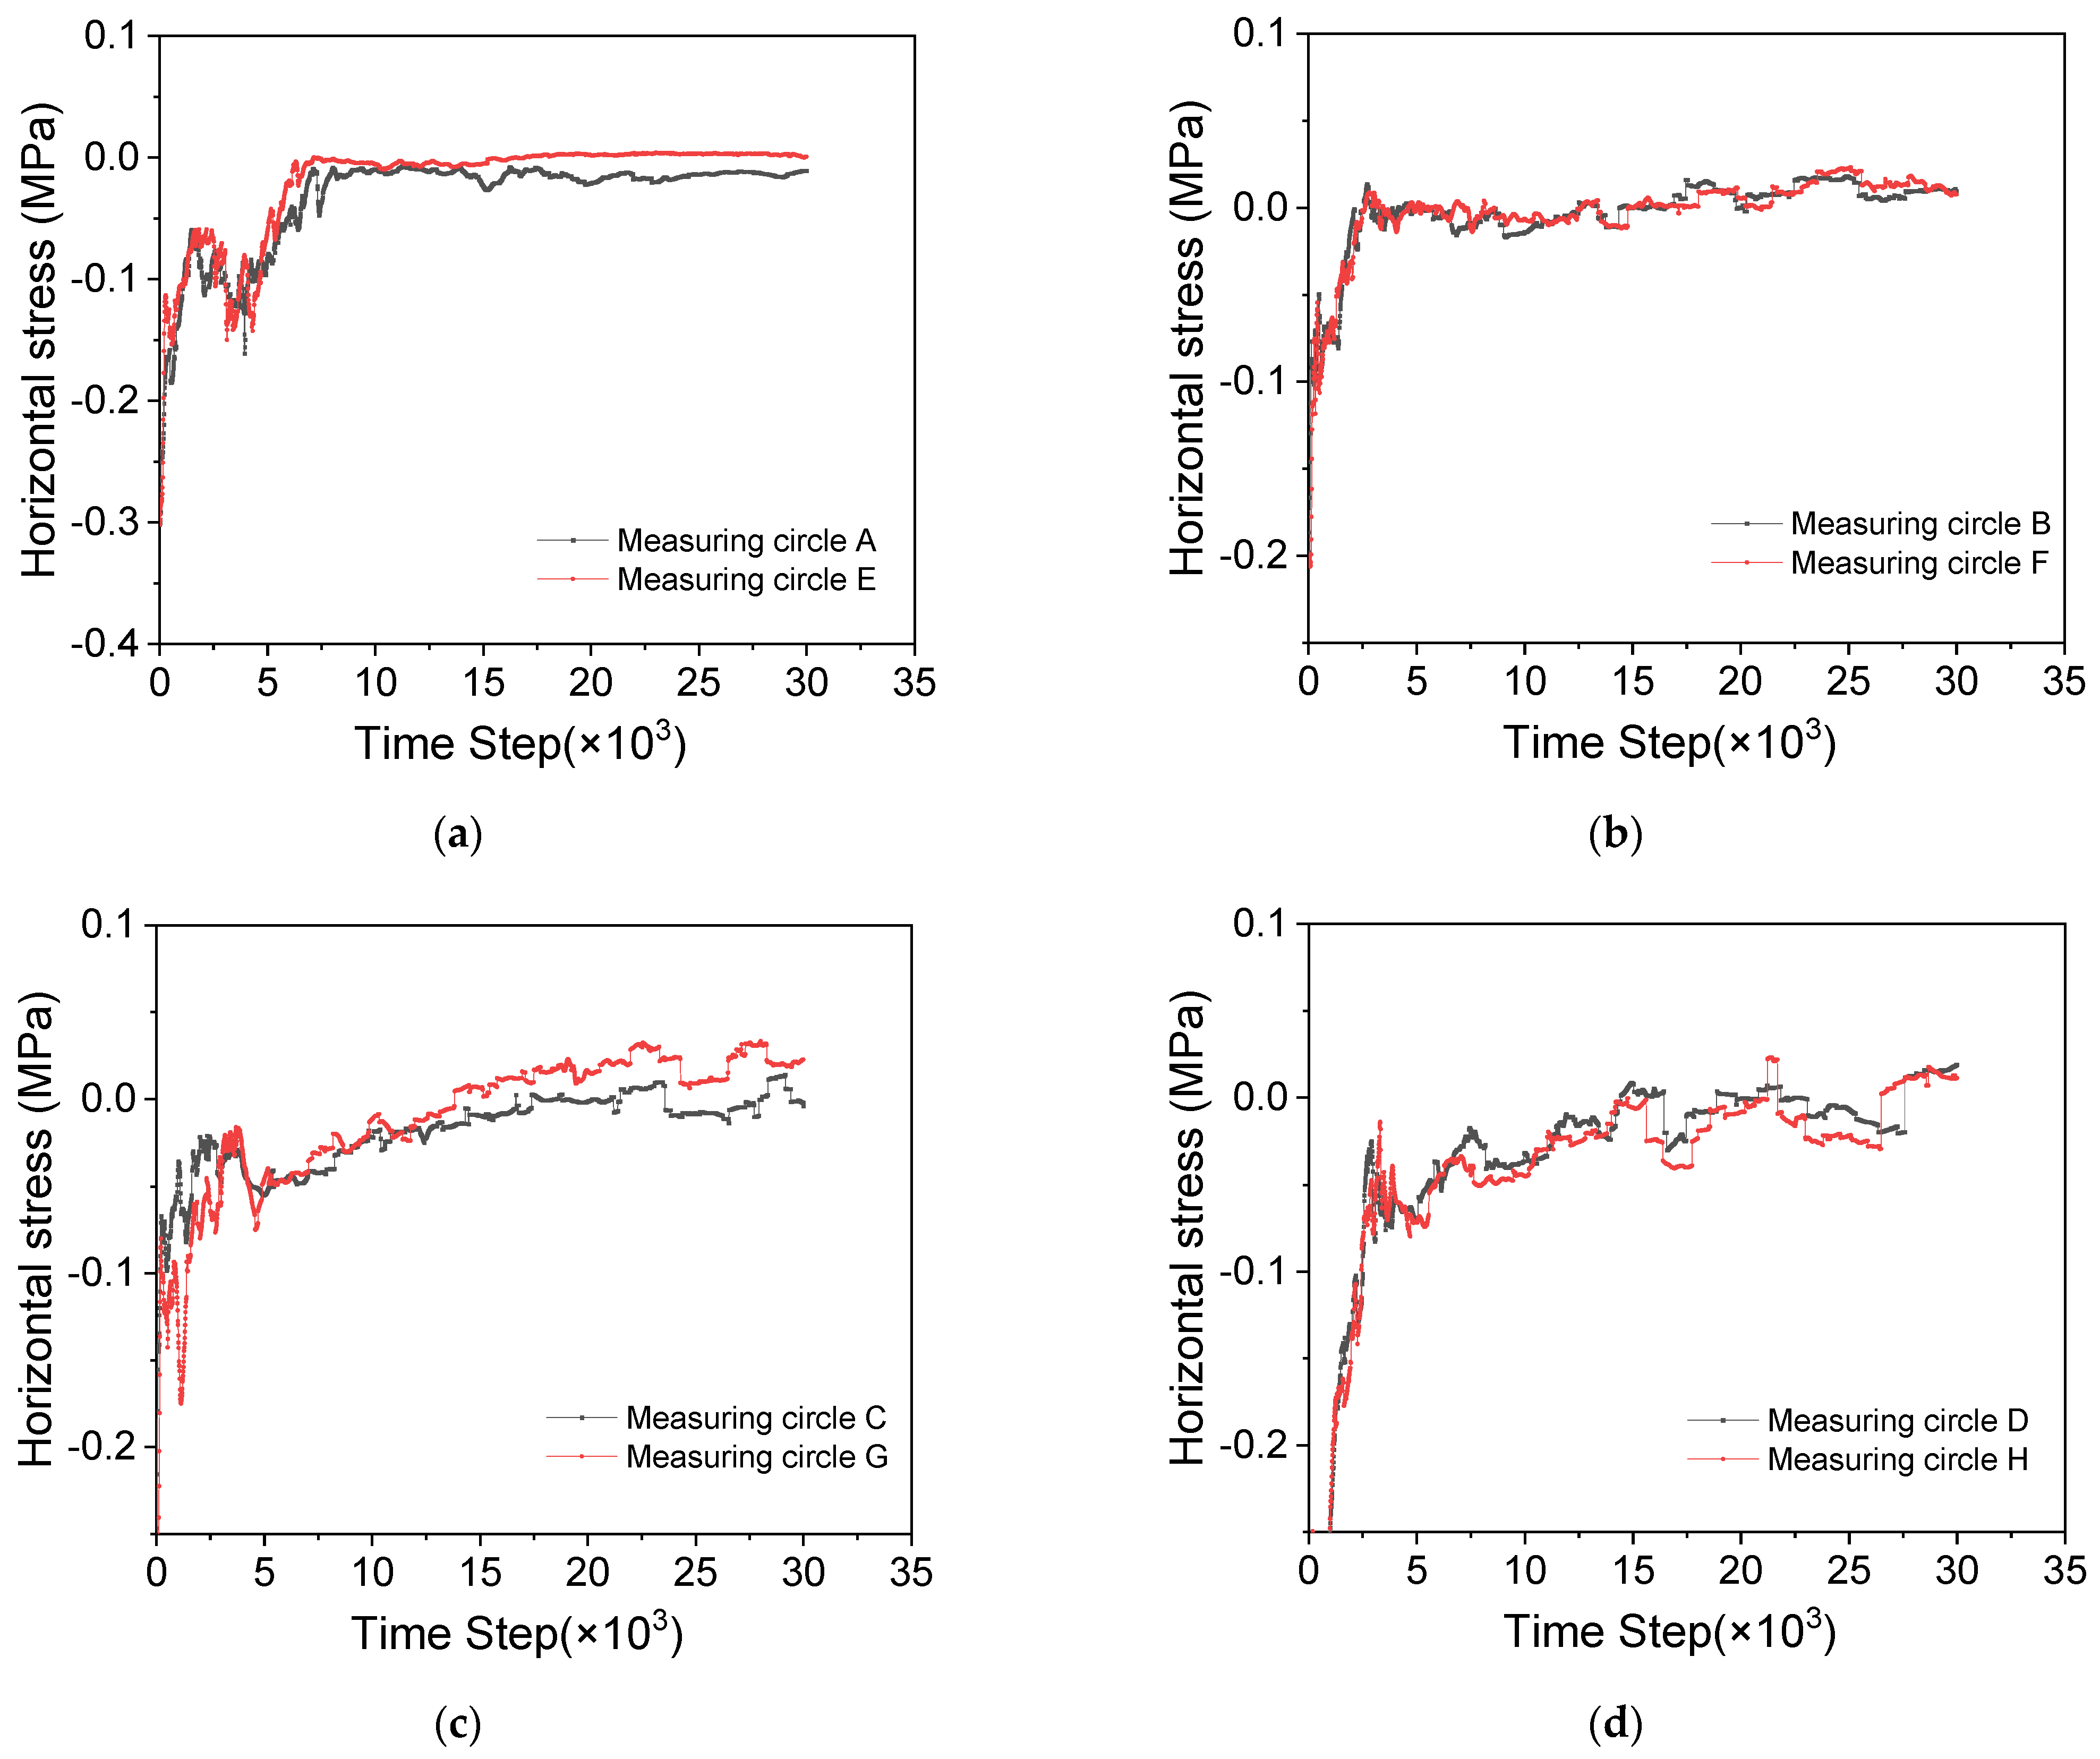
Stress distribution characteristics
It can be observed that shear cracks mainly appeared perpendicular to the bedding plane in the thicker mudstone layer, while tensile cracks were more common in the brown shale layer in the thinner failure stage (Figure 10, Figure 11 and Figure 14). Additionally, the overlying rock stratum of the slope was subjected to compression, while the lower layer was subjected to tension due to the influence of the overlying load and its own gravity during the sliding process. The range of tensile contacts in Figure 14b was more concentrated between the sliding surface and the toppling surface. Therefore, it was more likely to overturn and collapse on the rock mass in this area. Generally, a small dip angle of the rock strata leads to long rock strata, which means a long lever arm. The minimum force moment that causes the rock layers to rotate is assumed to be a constant. For longer rock strata, the force causes the fragmented rock from the rock layers to be small. Consequently, folding and toppling of the rock blocks is difficult for an interbedded anti-dip slope with a small dip angle of rock strata. In contrast, it is easy to realize the toppling for a slope with a large dip angle.
In conclusion, the failure mode of the anti-dip interlayer rock slope model is related to the dip angle of the strata. When the dip angle of the rock strata is small, the failure mode is shear-sliding. As the dip angle of the rock strata increases, the gravitational moment changes for each rock stratum, leading to a transformation from shear-sliding failure to toppling-sliding failure for the slope.

4.3. Influence of the Slope Angle on the Stability of an Anti-Dip Interbedded Rock Slope

A high and steep rock slope can lead to rollover or toppling, especially in geological formations of interbedding. Therefore, it is significant to investigate the failure mechanisms of high and steep rock slopes with large slope angles. In this section, numerical simulation was conducted to examine the influence of the slope angle on the stability of anti-dip interbedded rock slopes. The slope angle was set to 60° or 80°.

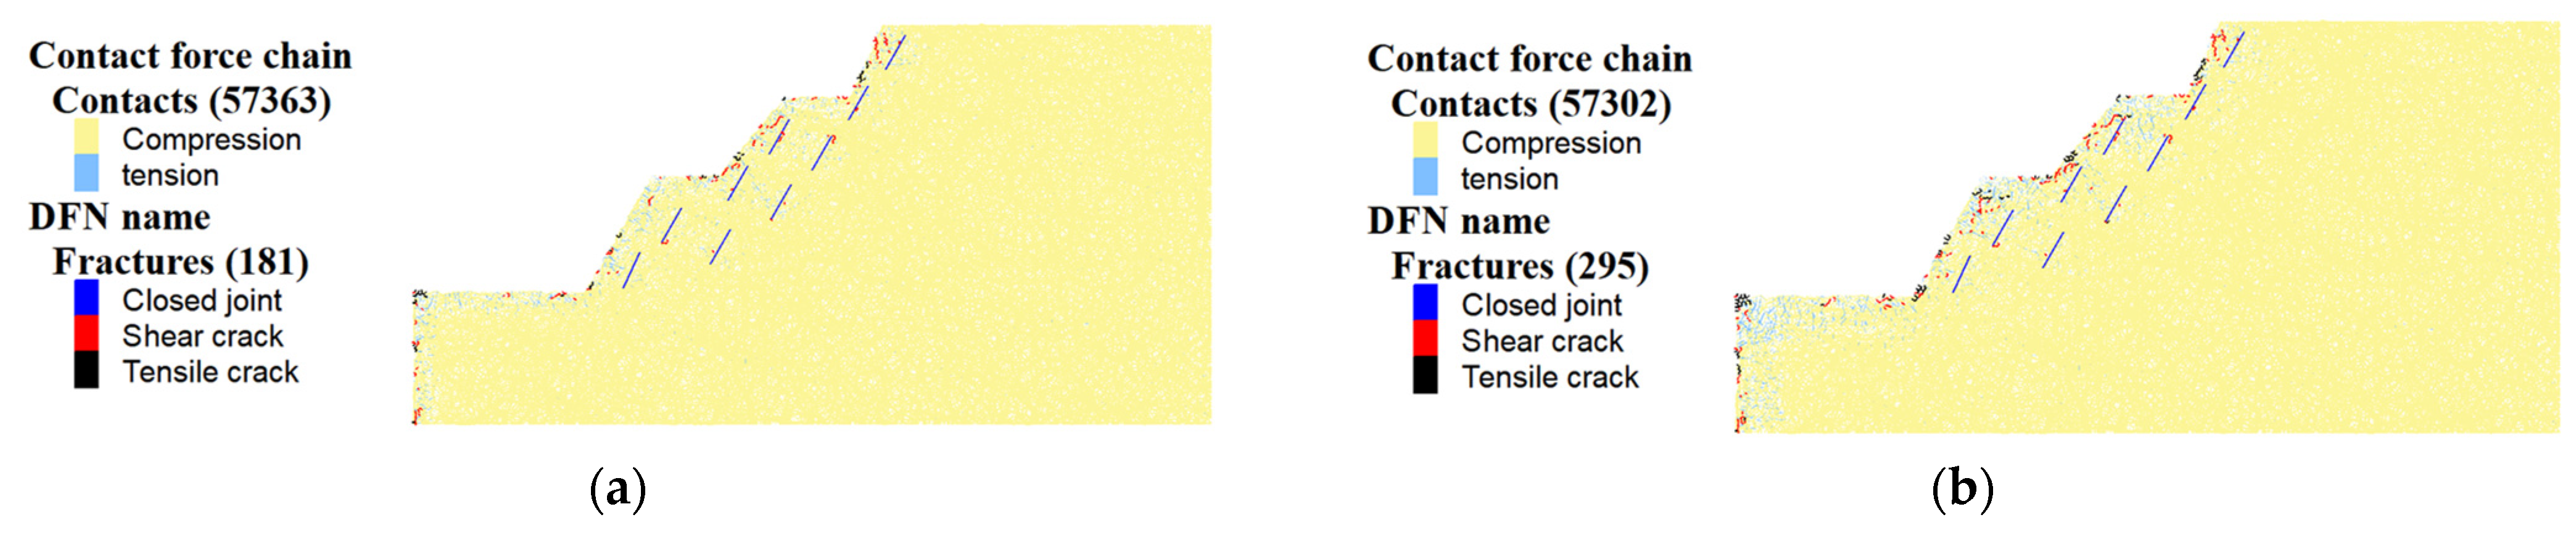
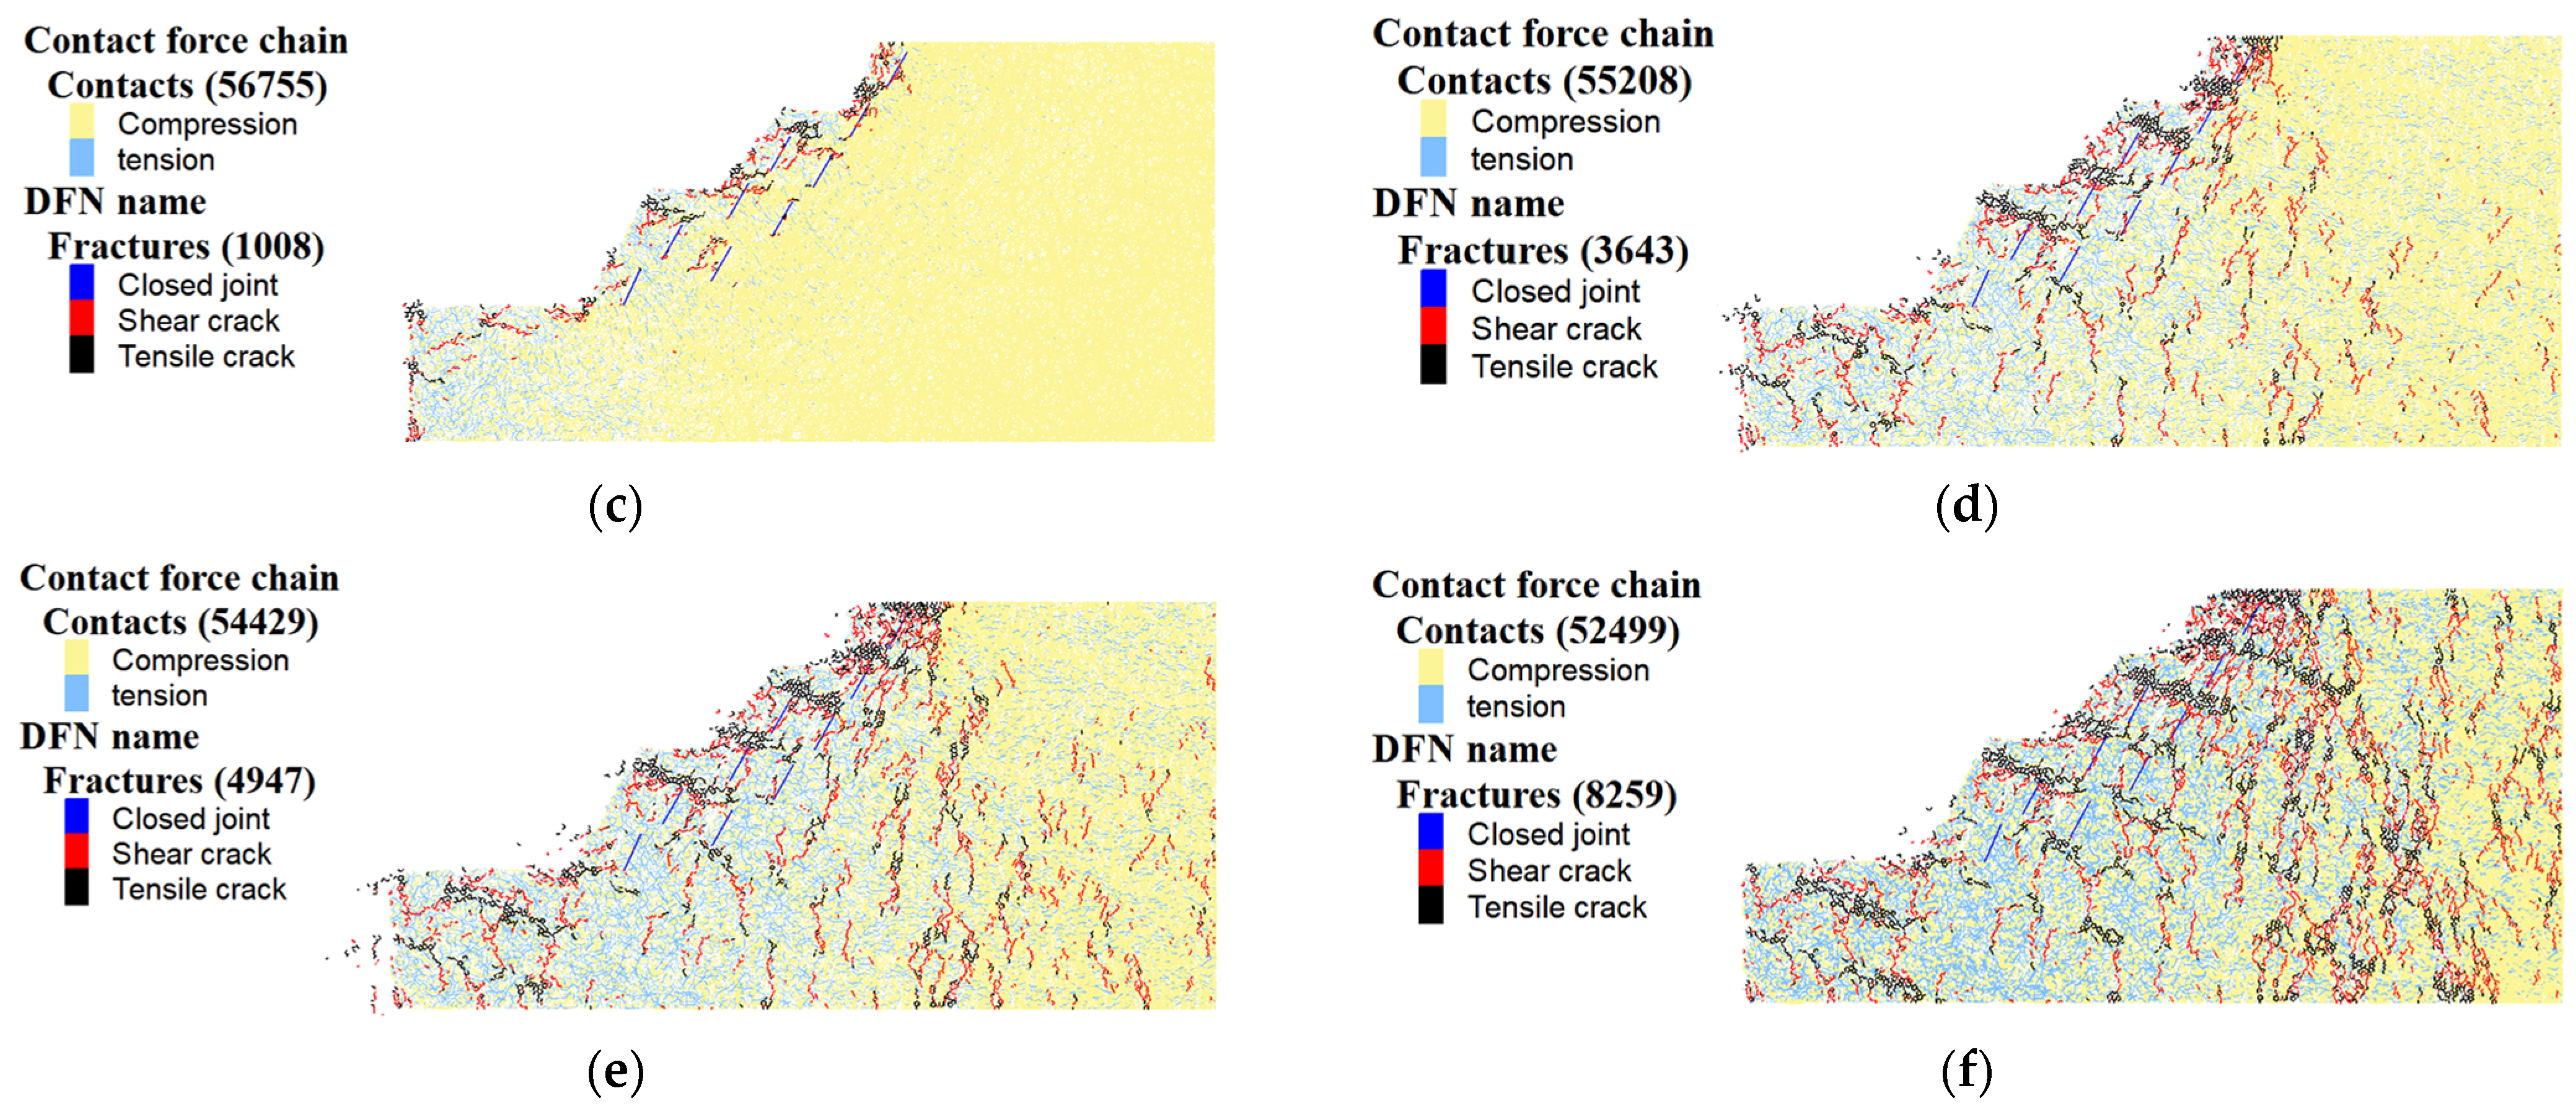
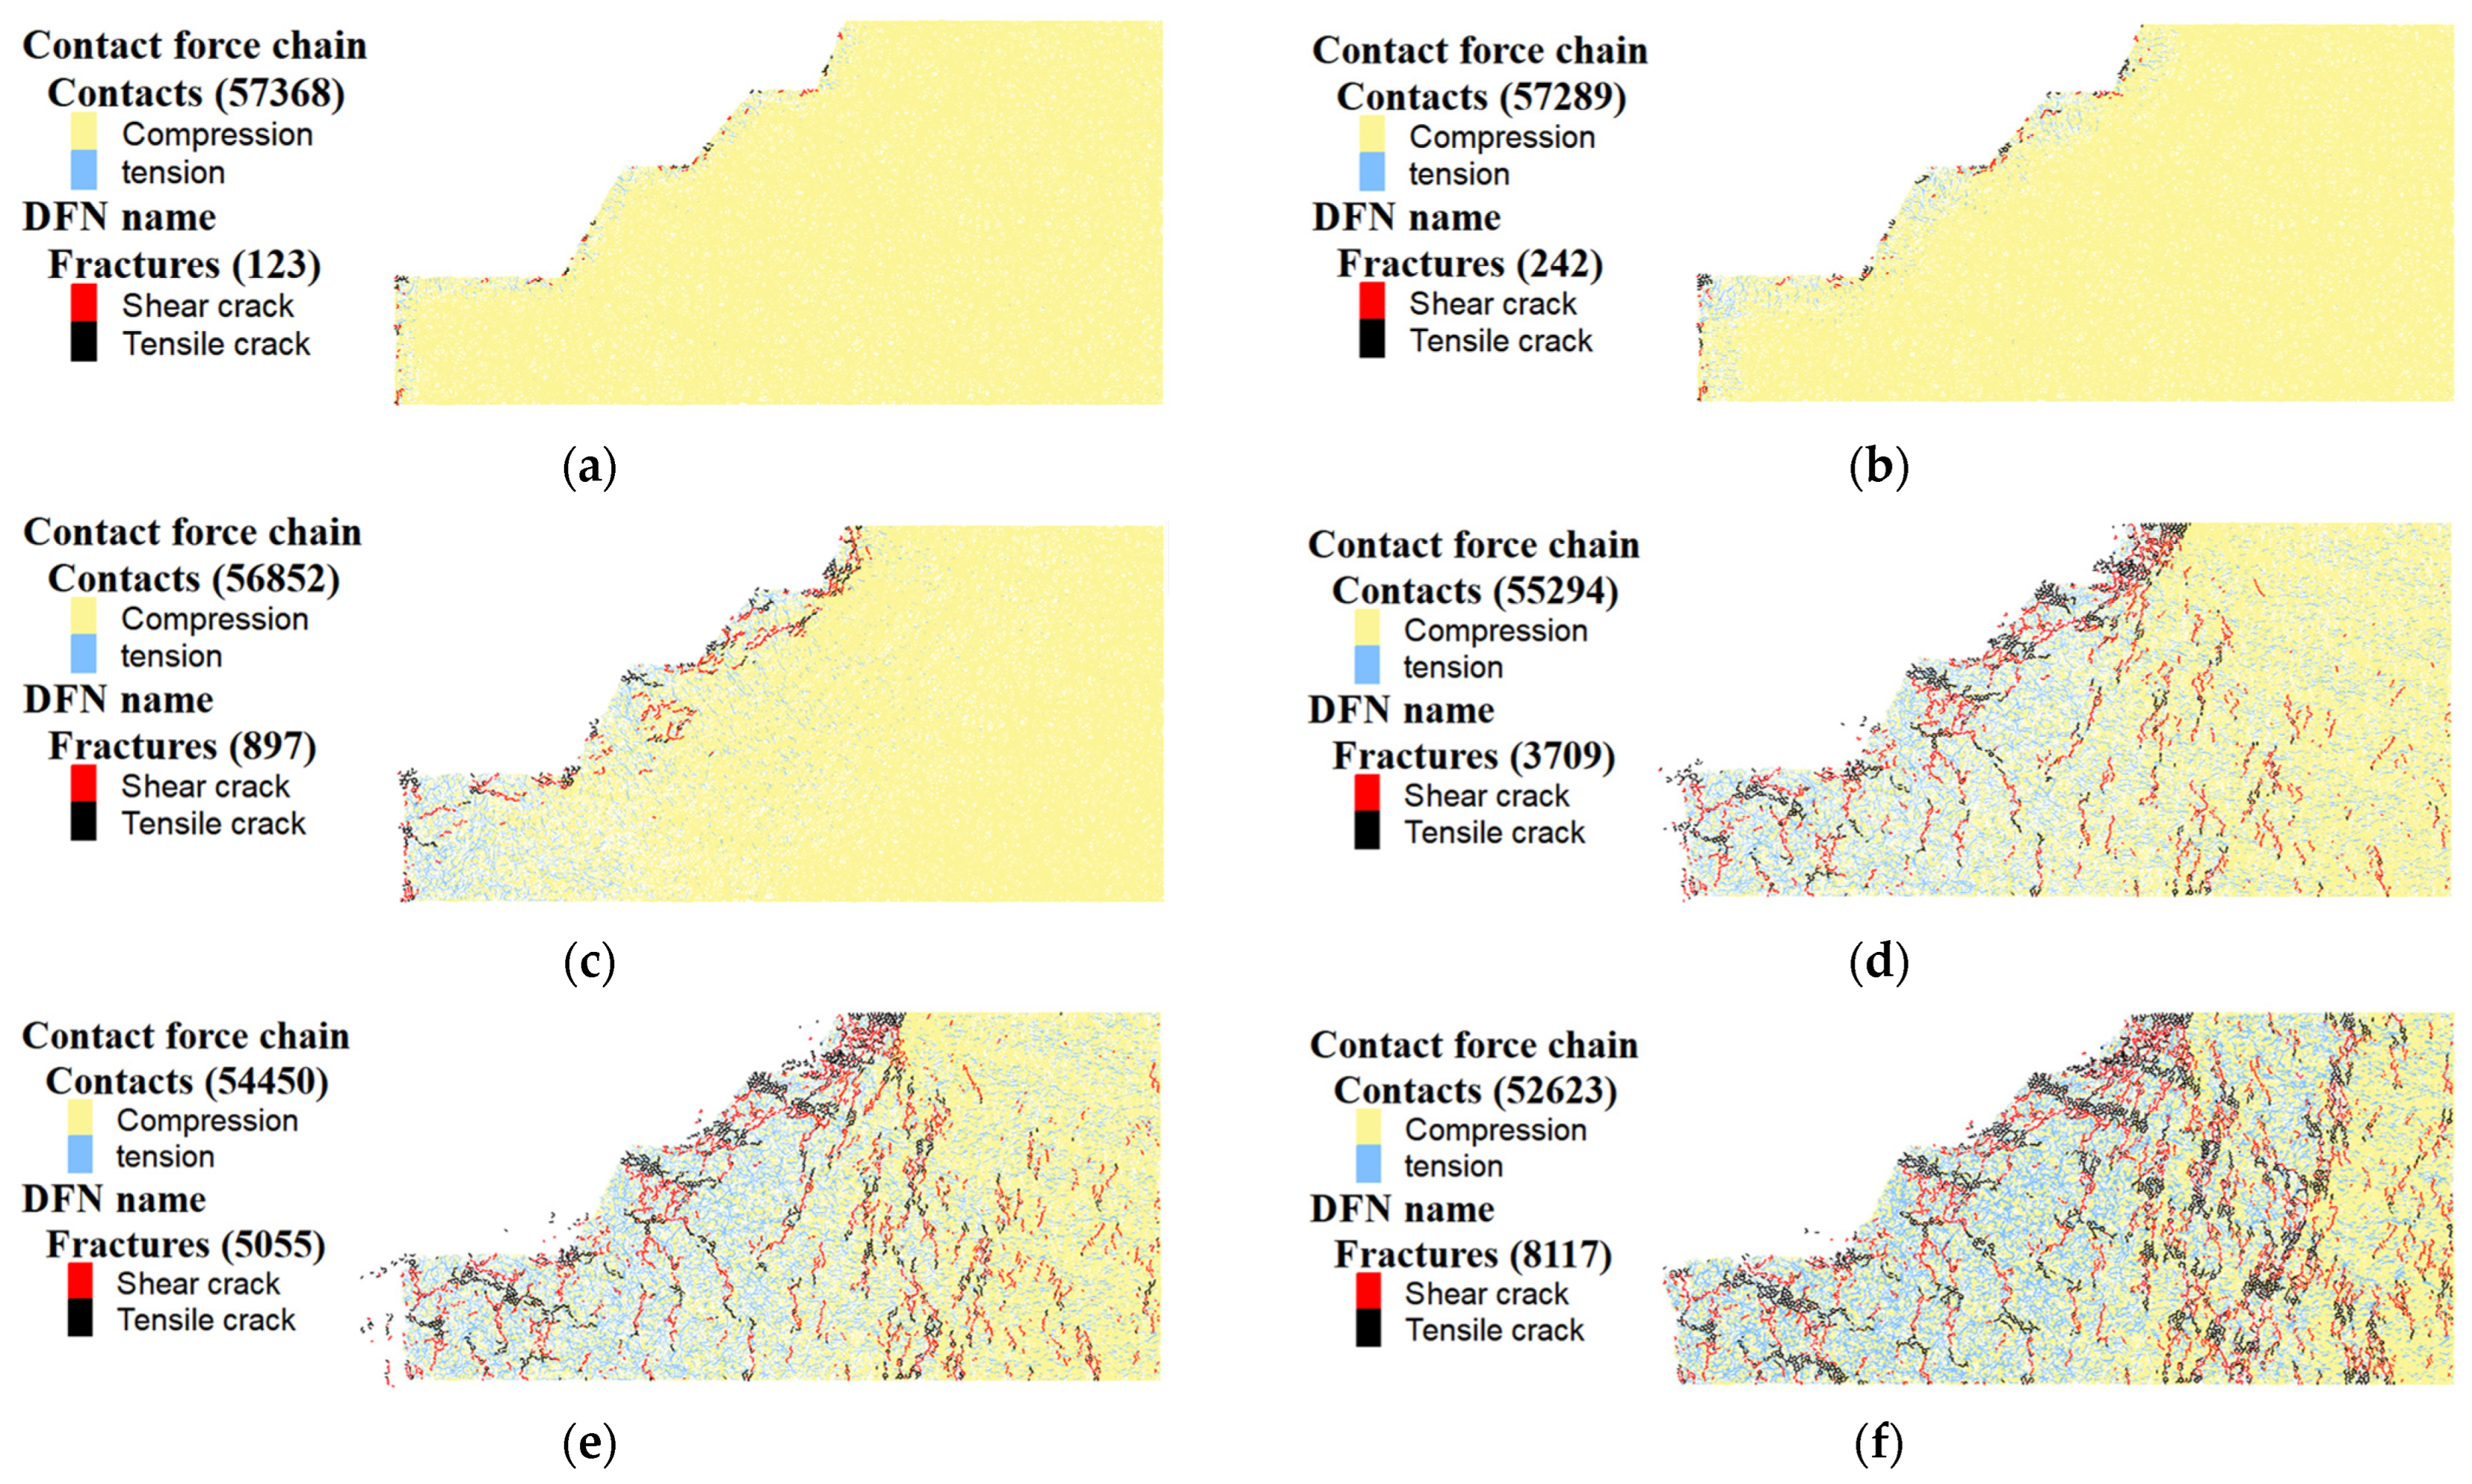
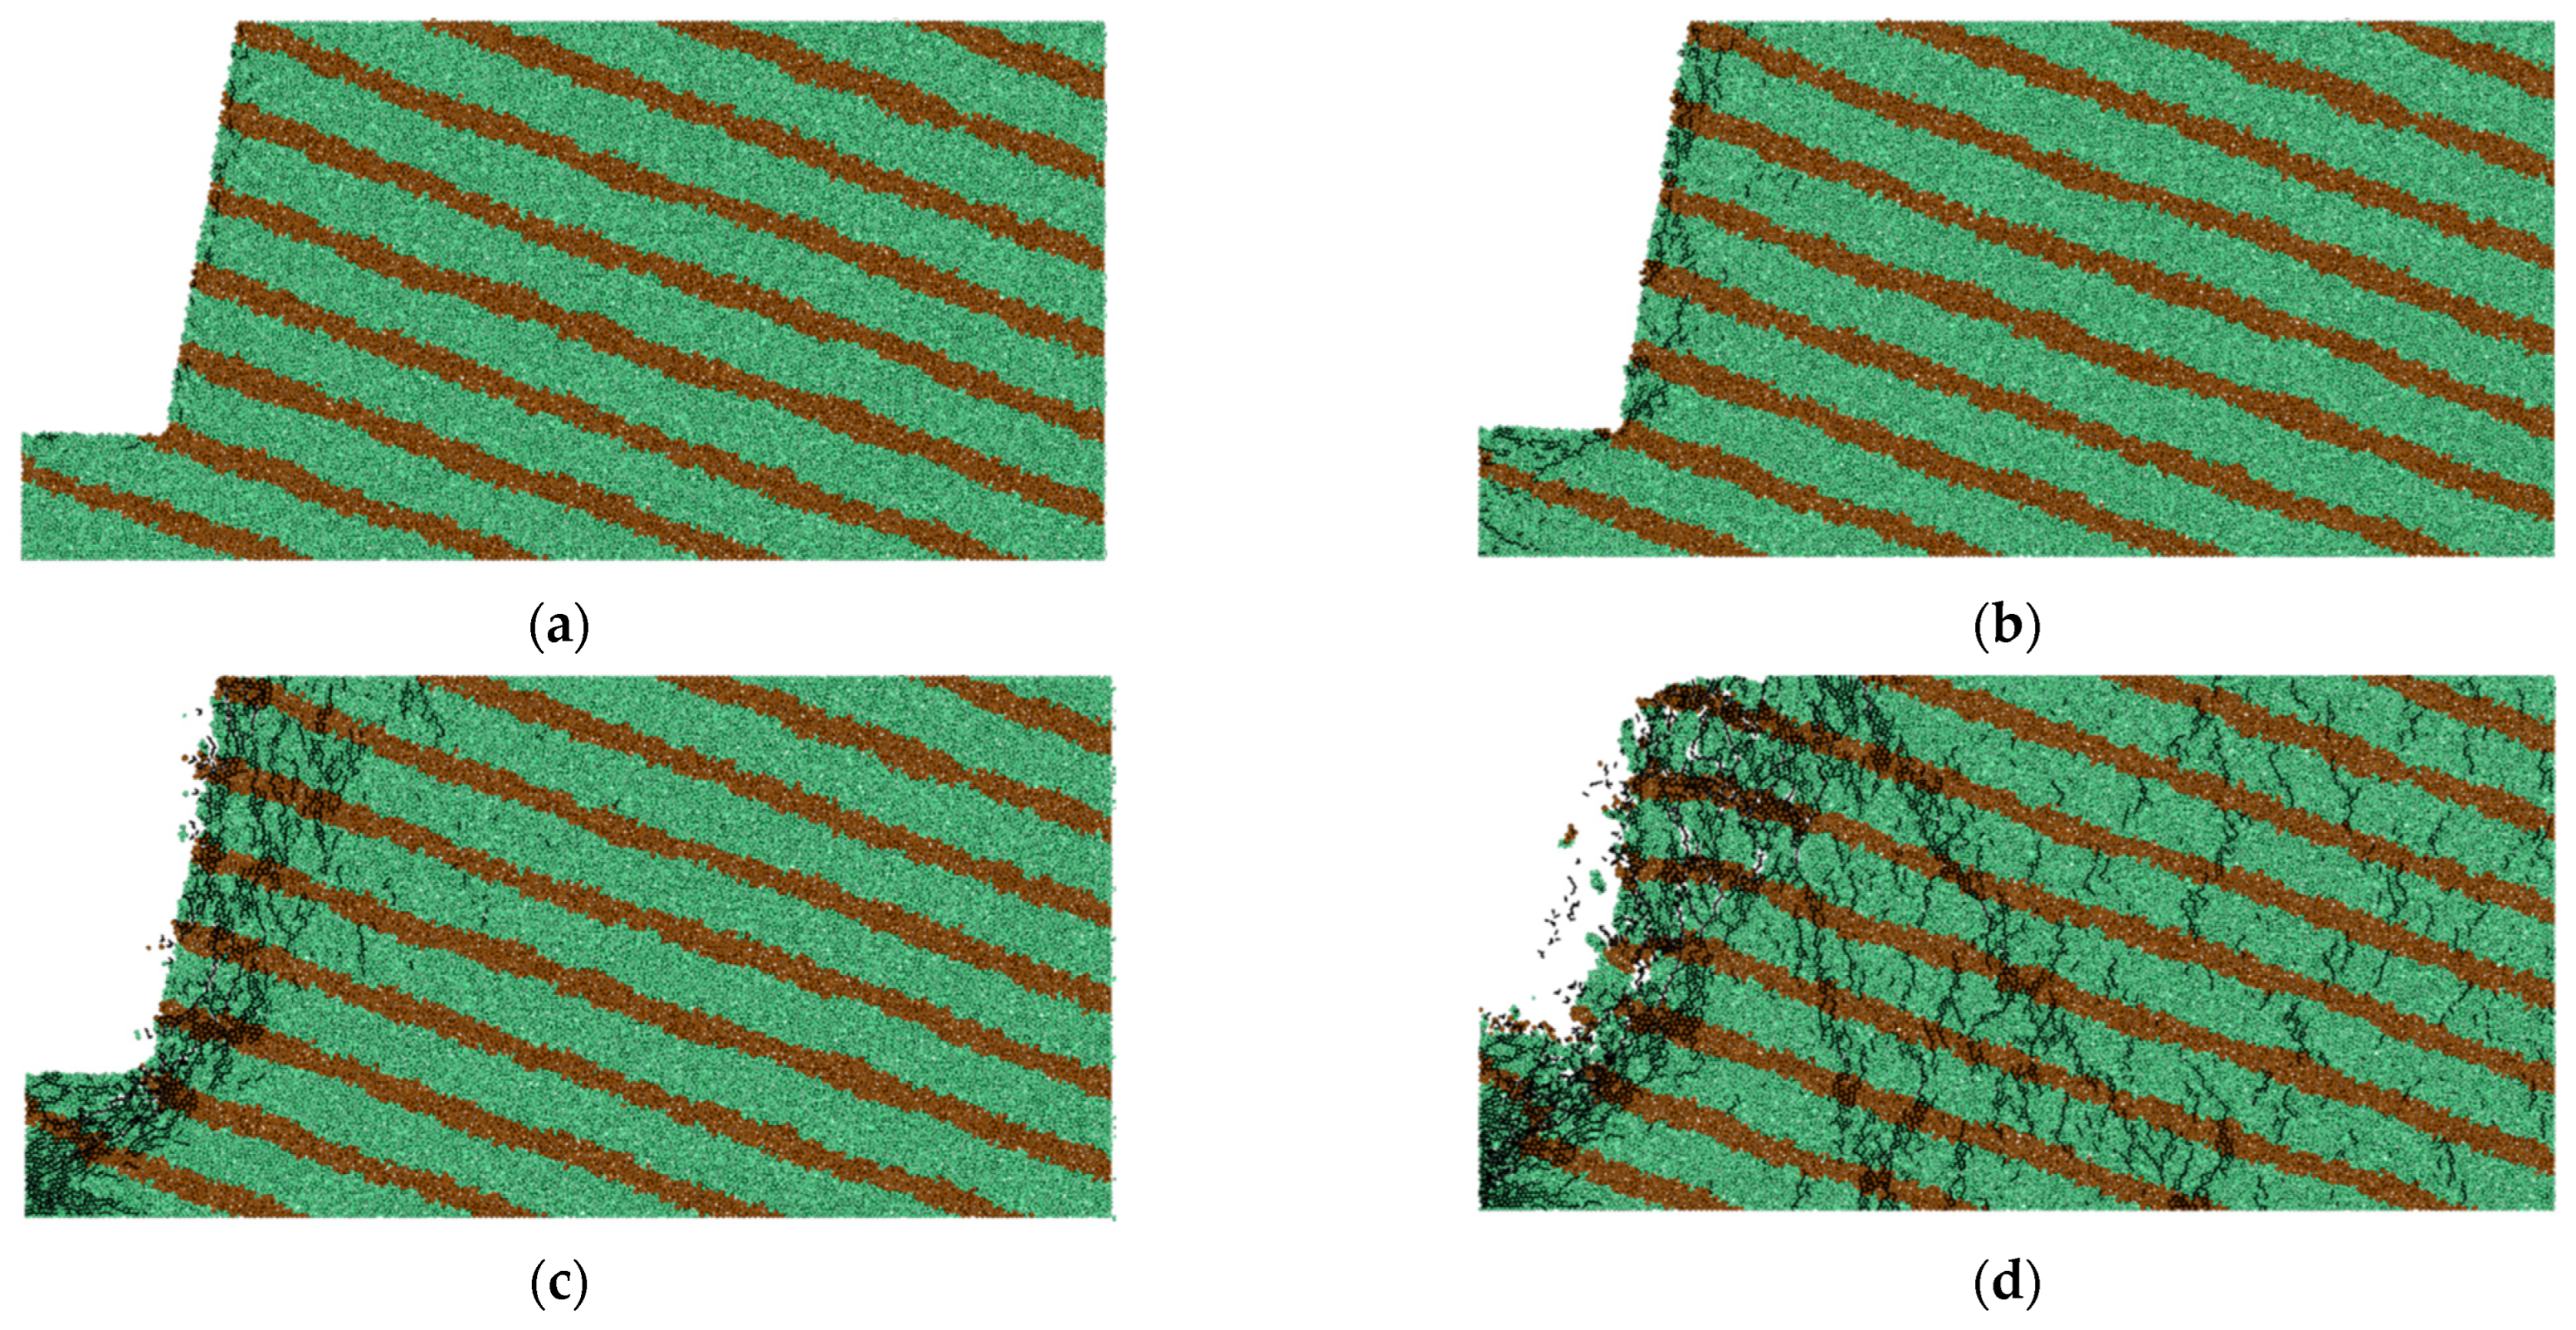
4.3.1. Cracks Distribution Characteristics

The results of a slope model with a gentle angle of 60° have been displayed in Section 4.2. Figure 15 reveals the crack evolution in the slope with a slope angle of 80°. The interbedded anti-dip rock slope bent downward under the influence of the gravitational moment, causing relative shear displacement between the two rock strata and new crack initiation (Figure 15a,b). As the number of cracks increased, the bending deformation continued to develop (Figure 15c). The cracks not only occurred between the bedding plane between the two kinds of rock strata but were also generated inside the rock strata. The cracks within the rock strata were oriented perpendicular to the interlayer structural plane. These cracks connected rapidly and formed an arc-shaped sliding surface. Additionally, rock blocks slid from the upper position and gradually piled up at the slope toe, leading to tension at the slope crest and a downward collapse.
The failure modes were different for the two kinds of rock slopes with different slope angles. The failure mode of the slope with an 80° slope angle was a toppling-sliding compound failure, which was similar to the slope with a 70° dip angle of the rock strata. However, shear-sliding failure occurred in the rock slope with a 60° slope angle.
There are multiple deformation zones in an interbedded anti-dip rock slope. Each deformation zone comes from one rock stratum. The rock stratum unit is taken as the research object (Figure 16a shows one rock stratum in the rock slope), and only the gravity of the rock stratum is considered in the analysis. The stress state of the research object is shown in Figure 16a. The gravitational moment can be calculated as:
M = F S = 1 2 m g l cos θ
where mg, l, and θ are the gravity, length, and dip angle of the rock stratum, respectively. A larger gravitational moment M will lead to easier folding and toppling failure of the rock slope. The rock strata from a rock slope with different slope angles (60° or 80°) at the same height level are shown in Figure 16b,c. The length l1 and mass m1 of the rock strata from the slope with 60° are all smaller than the length l2 and mass m2 of the rock strata from the slope with 80°. Therefore, the gravitational moment of the rock slope with an 80° slope angle is larger, which can account for the blocky toppling failure in the interbedded anti-dip rock slope with an 80° slope angle.

4.3.2. Comparative Analysis of Fragmentation, Stress, and Displacement

Compared with the interbedded anti-dip rock slope with a 60° slope angle in Figure 12a, the slope with an 80° slope angle in Figure 17 exhibits a larger number of rock fragments and larger size rock fractured blocks. Additionally, the fractured zone in the slope with an 80° angle was wider and larger because the fracture surface of this rock slope is much steeper. The sloped surface of a small slope angle of 60° is relatively gentle, causing rock fragments to tend to slide along the surface under the influence of its gravity. Simultaneously, the upper small fragments push and compress the lower fractured rocks, which accelerates the sliding and the accumulation of small rubble.
Figure 18 illustrates the displacement field of a rock slope with an 80° slope angle at the end of the calculation. The largest value of deformation was about 8 m, which was concentrated on the slope toe. The range of the entire fractured zone spanned approximately 1.5–5.5 m, and most areas concentrated on 3–5 m. Combined with the positions of the particles, it can be inferred that the rock blocks fall from the top of the rock strata. The displacement gradually decreases from the surface of the slope toward the interior, displaying mechanical characteristics similar to a cantilever beam. Comparing the displacement field of the slope model with a slope angle of 60° in Figure 13a, it is clear that the deformation in the 80° slope angle is significantly greater, which induces a highly unstable folding and collapse failure mode.
From Figure 19, the positions close to the free slope surface were primarily dominated by tensile stresses, while the positions away from the free slope surface were mainly governed by compressive stresses. Similar to the 60° slope angle model in Figure 14a, tensile cracks mainly occurred in the brown shale layer, whereas shear cracks mainly occurred in the mudstone layers. However, the distribution range of the interlayer micro-cracks was different. In the model with a 60° slope angle, the cracks in the brown shale were relatively short. However, in the corresponding 80° slope model, the length of the cracks was longer, resulting in a significant separation effect between the different rock layers. Therefore, toppling failure can easily occur in rock bedding planes. Additionally, the orientations of the interlayer cracks in the two rock slopes were different. In the slope with a 60° slope angle, the cracks in the mudstone layers primarily aligned parallel to the slope surface. This alignment promoted shear-sliding behavior along the slope surface and the formation of a sliding surface. Conversely, in the slope with an 80° slope angle, the tensile cracks in the mudstone layers aligned in a different direction relative to the slope surface. This alignment led to the displacement in layers and facilitated the mechanical behavior of outward toppling and overturning of the rock mass. Furthermore, the number of cracks in the slope with an 80° slope angle was larger than that of the slope with a 60° slope angle. The failure of a high, steep rock slope is more serious, and the failure mode is a combination of tilting and sliding.

5. Discussion

The sizes of the mudstone and brown shale were 0.1–0.15 m and 0.12–0.18 m, respectively, which is larger than their real grain size. The PFC particles were not the same as the mineral grains of the real rock. The mineral grains within the real rock are irregular, but the particles in PFC are circular. The individual particles in PFC do not represent mineral grains, but their assemblies can represent irregular shapes [43]. If the macroscopic characteristics of experimental tests and simulation tests are similar, the particle size is considered credible and can represent the properties of the slope. The large size of the particles in the simulation leads to a smaller number of particles and helps to improve the computational efficiency. On the other hand, if the numerical model adopts a smaller particle size that is different from the calibrated particle size parameters, the crack initiation and propagation would be different. For example, the crack number decreases with increasing particle size, but the influencing range of cracks and the length of individual cracks increases with particle size [44]. Elekes and Parteli presented a model by DEM that accurately predicts the angle of repose as a function of particle size on the Earth and in planetary environments [45]. The above theory may be worthy of a deeper study into rock or sand slope stability with PFC in the future. In addition, a rock mass is a heterogeneous structure containing different mineral compositions. The proposed grain-based model (GBM) by Potyondy [46] uses PFC to generate a polygonal grain structure and fill it with fine particles. This simulation approach can simulate the microstructure of a rock mass, which is widely used in the rock engineering field [34,47,48]. A slope stability analysis with GBM should also be considered in the future.

6. Conclusions

Based on the geological background of the northern slope in the Fushun open-pit mine, the stability and failure mode of an anti-dip interbedded rock slope were simulated by PFC 2D. The influence of different factors, such as interlayer joints, the dip angle of the rock layers, and the slope angle, on the stability of a rock slope were investigated in this study. The main conclusions are listed as follows:
  • For the interbedded anti-dip rock slope numerical model with an irregular slope surface and joints, the pre-existing joints in the rock stratum promote the shear dislocation of particles, resulting in crack initiation. The failure mode is shear-slip instability failure.
  • The existence of joints induces the generation of cracks in the rock slope, increases the crack density, and accelerates the process of slope failure but does not change its failure mode.
  • The inclination angle of the rock stratum affects the instability state of the interbedded anti-dip rock slope. When the dip angle of the rock stratum is small, shear-slip instability failure occurs. The gravitational moment increases with an increasing dip angle, which leads to toppling-slip compound failure along the slip zone.
  • Shear-slip failure occurs in an interbedded anti-dip rock slope with a small slope angle. However, the failure mode of an anti-dip interbedded rock slope with a large slope angle is a flexural toppling-slip compound failure. The overturning and toppling characteristics of a slope with a large slope angle are obvious.
  • These simulation results can contribute to a better understanding of the failure mechanisms of interbedded anti-dip rock slopes under different geological conditions and provide a reference for disaster prevention.

Author Contributions

Methodology, Z.Y., H.J. and F.M.; Validation, Z.X.; Formal analysis, Z.X.; Investigation, J.H.; Resources, H.J.; Writing—original draft, M.L.; Writing—review & editing, Z.Y.; Supervision, F.M.; Funding acquisition, F.M. All authors have read and agreed to the published version of the manuscript.

Funding

We gratefully acknowledge financial support from the Taishan Scholars Program (2019KJG002, 2019RKB01083) and the Natural Science Foundation of Shandong Province (ZR2022QD004, ZR2023QE074).

Data Availability Statement

The data presented in this study are available on request from the corresponding author. The data are not publicly available due to privacy.

Conflicts of Interest

The authors declare that they have no known competing financial interest or personal relationship that could have appeared to influence the work reported in this paper.

References

  1. Alejano, L.R.; Gómez-Márquez, I.; Martínez-Alegría, R. Analysis of a Complex Toppling-Circular Slope Failure. Eng. Geol. 2010, 114, 93–104. [Google Scholar] [CrossRef]
  2. Gu, D.; Huang, D. A Complex Rock Topple-Rock Slide Failure of an Anaclinal Rock Slope in the Wu Gorge, Yangtze River, China. Eng. Geol. 2016, 208, 165–180. [Google Scholar] [CrossRef]
  3. Li, Z.; Wang, J.; Li, L.; Wang, L.; Liang, R.Y. A Case Study Integrating Numerical Simulation and GB-InSAR Monitoring to Analyze Flexural Toppling of an Anti-Dip Slope in Fushun Open Pit. Eng. Geol. 2015, 197, 20–32. [Google Scholar] [CrossRef]
  4. Liu, Y.; Huang, D.; Peng, J.; Guo, Y. Analysis of the Effect of Rock Layer Structure on the Toppling Failure Evolution of Soft-Hard Interbedded Anti-Dip Slopes. Eng. Fail. Anal. 2023, 145, 107005. [Google Scholar] [CrossRef]
  5. Xie, L.; Zhu, Q.; Qin, Y.; Wang, J.; Qian, J. Study on Evolutionary Characteristics of Toppling Deformation of Anti-Dip Bank Slope Based on Energy Field. Sustainability 2020, 12, 7544. [Google Scholar] [CrossRef]
  6. Wang, R.; Zhao, W.; Nian, T.; Liu, C.; Wu, H. Centrifuge Model Test on Anti-Dip Rock Slopes with Unequal Thicknesses Subjected to Flexural Toppling Failure. KSCE J. Civ. Eng. 2022, 26, 2575–2587. [Google Scholar] [CrossRef]
  7. Dong, M.; Zhang, F.; Lv, J.; Fei, Y.; Li, Z. Study of Stability Influencing Factors of Excavated Anti-Dip Rock Slope. KSCE J. Civ. Eng. 2020, 24, 2293–2303. [Google Scholar] [CrossRef]
  8. Liu, C.H.; Jaksa, M.B.; Meyers, A.G. Toppling Mechanisms of Rock Slopes Considering Stabilization from the Underlying Rock Mass. Int. J. Rock Mech. Min. Sci. 2010, 47, 348–354. [Google Scholar] [CrossRef]
  9. Johari, A.; Fazeli, A.; Javadi, A.A. An Investigation into Application of Jointly Distributed Random Variables Method in Reliability Assessment of Rock Slope Stability. Comput. Geotech. 2013, 47, 42–47. [Google Scholar] [CrossRef]
  10. Johari, A.; Mehrabani Lari, A. System Probabilistic Model of Rock Slope Stability Considering Correlated Failure Modes. Comput. Geotech. 2017, 81, 26–38. [Google Scholar] [CrossRef]
  11. Shahsavar, J.; Johari, A.; Binesh, S. Stochastic Analysis of Rock Slope Stability Considering Cracked Rock Masses. In Proceedings of the International Conference on Civil Engineering: Modern and Practical Findings, Shiraz, Iran, 8 December 2021. [Google Scholar]
  12. Huang, D.; Ma, H.; Huang, R.; Peng, J.; Luo, S. Deep-Seated Toppling Deformations at the Dam Site of the Miaowei Hydropower Station, Southwest China. Eng. Geol. 2022, 303, 106654. [Google Scholar] [CrossRef]
  13. Ning, Y.; Zhang, G.; Tang, H.; Shen, W.; Shen, P. Process Analysis of Toppling Failure on Anti-Dip Rock Slopes Under Seismic Load in Southwest China. Rock. Mech. Rock. Eng. 2019, 52, 4439–4455. [Google Scholar] [CrossRef]
  14. Cheng, H.; Han, L.; Wu, Z.; Zhou, X. Experimental Study on the Whole Failure Process of Anti-Dip Rock Slopes Subjected to External Loading. Bull. Eng. Geol. Environ. 2021, 80, 6597–6613. [Google Scholar] [CrossRef]
  15. Gong, Y.; Yao, A.; Li, Y.; Li, Y.; Li, Y.; Sun, Y. Model Test Study on Sliding-Toppling Composite Deformation Evolution of Anti-Dip Layered Rock Slope. Bull. Eng. Geol. Environ. 2023, 82, 194. [Google Scholar] [CrossRef]
  16. Chen, C.-C.; Li, H.-H.; Chiu, Y.-C.; Tsai, Y.-K. Dynamic Response of a Physical Anti-Dip Rock Slope Model Revealed by Shaking Table Tests. Eng. Geol. 2020, 277, 105772. [Google Scholar] [CrossRef]
  17. Zheng, Y.; Chen, C.; Liu, T.; Xia, K.; Liu, X. Stability Analysis of Rock Slopes against Sliding or Flexural-Toppling Failure. Bull. Eng. Geol. Environ. 2018, 77, 1383–1403. [Google Scholar] [CrossRef]
  18. Zhang, G.; Wang, F.; Zhang, H.; Tang, H.; Li, X.; Zhong, Y. New Stability Calculation Method for Rock Slopes Subject to Flexural Toppling Failure. Int. J. Rock Mech. Min. Sci. 2018, 106, 319–328. [Google Scholar] [CrossRef]
  19. Zheng, Y.; Chen, C.; Meng, F.; Liu, T.; Xia, K. Assessing the Stability of Rock Slopes with Respect to Flexural Toppling Failure Using a Limit Equilibrium Model and Genetic Algorithm. Comput. Geotech. 2020, 124, 103619. [Google Scholar] [CrossRef]
  20. Wang, R.; Zheng, Y.; Chen, C.; Zhang, W. Theoretical and Numerical Analysis of Flexural Toppling Failure in Soft-Hard Interbedded Anti-Dip Rock Slopes. Eng. Geol. 2023, 312, 106923. [Google Scholar] [CrossRef]
  21. Ren, Z.; Chen, C.; Sun, C.; Wang, Y. Dynamic Analysis of the Seismo-Dynamic Response of Anti-Dip Bedding Rock Slopes Using a Three-Dimensional Discrete-Element Method. Appl. Sci. 2022, 12, 4640. [Google Scholar] [CrossRef]
  22. Liu, X.; Liu, Y.; Lu, Y.; Li, X.; Li, P. Numerical Analysis of Evaluation Methods and Influencing Factors for Dynamic Stability of Bedding Rock Slope. J. Vibroeng. 2017, 19, 1937–1961. [Google Scholar] [CrossRef]
  23. Deng, Z.; Liu, X.; Liu, Y.; Liu, S.; Han, Y.; Liu, J.; Tu, Y. Model Test and Numerical Simulation on the Dynamic Stability of the Bedding Rock Slope under Frequent Microseisms. Earthq. Eng. Eng. Vib. 2020, 19, 919–935. [Google Scholar] [CrossRef]
  24. Yang, C.; Feng, N.; Zhang, J.; Bi, J.; Zhang, J. Research on Time-Frequency Analysis Method of Seismic Stability of Covering-Layer Type Slope Subjected to Complex Wave. Environ. Earth Sci. 2015, 74, 5295–5306. [Google Scholar] [CrossRef]
  25. Li, H.; Lv, Y.; Liu, Y.; Li, J.; Yao, W.; Qiao, W. Seismic Response of the Stratified Anti-Dip Rock Slope. Disaster Adv. 2013, 6, 204–213. [Google Scholar]
  26. Jia, J.; Pei, X.; Liu, G.; Cai, G.; Guo, X.; Hong, B. Failure Mechanism of Anti-Dip Layered Soft Rock Slope under Rainfall and Excavation Conditions. Sustainability 2023, 15, 9398. [Google Scholar] [CrossRef]
  27. Orr, C.M.; Swindells, C.F.; Windsor, C.R. Open Pit Toppling Failures: Experience versus Analysis; International Association for Computing Methods and Advances in Geomechanics: Perth, WA, Australia, 1991; pp. 505–510. [Google Scholar]
  28. Song, D.; Liu, X.; Huang, J.; Wang, E.; Zhang, J. Characteristics of Wave Propagation through Rock Mass Slopes with Weak Structural Planes and Their Impacts on the Seismic Response Characteristics of Slopes: A Case Study in the Middle Reaches of Jinsha River. Bull. Eng. Geol. Environ. 2021, 80, 1317–1334. [Google Scholar] [CrossRef]
  29. Gong, W.J.; Tao, Z.G.; He, M.C.; Hou, H.J. Feasibility Analysis on the Support of Rock Slopes Against Flexural Toppling Failure Using the DDA Method-A Case Study. KSCE J. Civ. Eng. 2022, 26, 3847–3862. [Google Scholar] [CrossRef]
  30. Song, D.; Shi, W.; Wang, C.; Dong, L.; He, X.; Wu, E.; Zhao, J.; Lu, R. Numerical Investigation of a Local Precise Reinforcement Method for Dynamic Stability of Rock Slope under Earthquakes Using Continuum-Discontinuum Element Method. Sustainability 2023, 15, 2490. [Google Scholar] [CrossRef]
  31. Liu, G.; Ma, F.; Zhang, M.; Guo, J.; Jia, J. Y-Mat: An Improved Hybrid Finite-Discrete Element Code for Addressing Geotechnical and Geological Engineering Problems. Eng. Comput. 2022, 39, 1962–1983. [Google Scholar] [CrossRef]
  32. Pierce, M.; Mas Ivars, D.; Potyondy, D.; Cundall, P. A Synthetic Rock Mass Model for Jointed Rock. In Proceedings of the 1st Canada-US Rock Mechanics Symposium—Rock Mechanics Meeting Society’s Challenges and Demands, Vancouver, Canada, 1 May 2007; Volume 1. [Google Scholar]
  33. Potyondy, D.O.; Cundall, P.A. A Bonded-Particle Model for Rock. Int. J. Rock Mech. Min. Sci. 2004, 41, 1329–1364. [Google Scholar] [CrossRef]
  34. Liu, L.; Li, H.; Li, X.; Zhou, C.; Zhang, G. Simulation on Heterogeneous Rocks with a Flaw Using Grain-Based Discrete-Element Method. Géotech. Lett. 2021, 11, 1–10. [Google Scholar] [CrossRef]
  35. Tang, P.; Chen, G.-Q.; Huang, R.-Q.; Wang, D. Effect of the Number of Coplanar Rock Bridges on the Shear Strength and Stability of Slopes with the Same Discontinuity Persistence. Bull. Eng. Geol. Environ. 2021, 80, 3675–3691. [Google Scholar] [CrossRef]
  36. Huang, D.; Wang, J.; Liu, S. A Comprehensive Study on the Smooth Joint Model in DEM Simulation of Jointed Rock Masses. Granul. Matter 2015, 17, 775–791. [Google Scholar] [CrossRef]
  37. Cundall, P.A.; Strack, O.D.L. A Discrete Numerical Model for Granular Assemblies. Géotechnique 1979, 29, 47–65. [Google Scholar] [CrossRef]
  38. Itasca Consulting Group Inc. PFC2D Particle Flow Code in 2 Dimensions User’s Guide; Itasca: Minneapolis, MN, USA, 2016. [Google Scholar]
  39. Li, L.C.; Tang, C.A.; Zhu, W.C.; Liang, Z.Z. Numerical Analysis of Slope Stability Based on the Gravity Increase Method. Comput. Geotech. 2009, 36, 1246–1258. [Google Scholar] [CrossRef]
  40. Tang, P.; Chen, G.-Q.; Huang, R.-Q.; Zhu, J. Brittle Failure of Rockslides Linked to the Rock Bridge Length Effect. Landslides 2020, 17, 793–803. [Google Scholar] [CrossRef]
  41. Labuz, J.F.; Zang, A. Mohr–Coulomb Failure Criterion. Rock. Mech. Rock. Eng. 2012, 45, 975–979. [Google Scholar] [CrossRef]
  42. Wang, C.; Tannant, D.D.; Lilly, P.A. Numerical Analysis of the Stability of Heavily Jointed Rock Slopes Using PFC2D. Int. J. Rock Mech. Min. Sci. 2003, 40, 415–424. [Google Scholar] [CrossRef]
  43. Zhang, Z.; Dou, Z.; Xu, H.; Liu, Z. Shear behavior of Beishan granite fractures after thermal treatment. Eng. Fract. Mech. 2019, 213, 223–240. [Google Scholar]
  44. Meng, F.; Song, J.; Yue, Z.; Zhou, H.; Wang, X.; Wang, Z. Failure Mechanisms and Damage Evolution of Hard Rock Joints under High Stress: Insights from PFC2D Modeling. Eng. Anal. Bound. Elem. 2022, 135, 394–411. [Google Scholar] [CrossRef]
  45. Elekes, F.; Parteli, E.J.R. An Expression for the Angle of Repose of Dry Cohesive Granular Materials on Earth and in Planetary Environments. Proc. Natl. Acad. Sci. USA 2021, 118, e2107965118. [Google Scholar] [CrossRef] [PubMed]
  46. Potyondy, D.O. A Grain-Based Model for Rock: Approaching the True Microstructure. In Proceedings of the rock mechanics in the Nordic Countries, Kongsberg, Norway, 9–12 June 2010. [Google Scholar]
  47. Peng, J.; Wong, L.N.Y.; Teh, C.I. Influence of Grain Size Heterogeneity on Strength and Microcracking Behavior of Crystalline Rocks. JGR Solid Earth 2017, 122, 1054–1073. [Google Scholar] [CrossRef]
  48. Hu, X.; Xie, N.; Zhu, Q.; Chen, L.; Li, P. Modeling Damage Evolution in Heterogeneous Granite Using Digital Image-Based Grain-Based Model. Rock. Mech. Rock. Eng. 2020, 53, 4925–4945. [Google Scholar] [CrossRef]
Figure 1. Local geological structure and rock stratum distribution of the rock slope.
Applsci 13 12583 g001
Figure 2. Numerical model. (a) Interbedded rock slope with joints, (b) Interbedded rock slope without joints, (c) Interbedded rock slope with a 20° dip angle stratum and 60° slope angle, (d) Interbedded rock slope with a 70° dip angle stratum and 60° slope angle, (e) Interbedded rock slope with a 20° dip angle stratum and 80° slope angle. The uppercase letters A–P are measuring circles.
Applsci 13 12583 g002
Figure 3. Crack progression for a slope with closed joints. (a) Time step = 100, (b) Time step = 200, (c) Time step = 1000, (d) Time step = 5000, (e) Time step = 10,000, (f) Time step = 30,000.
Applsci 13 12583 g003
Figure 4. Displacement progression for a slope with closed joints. (a) Time step = 100, (b) Time step = 200, (c) Time step = 1000, (d) Time step = 5000, (e) Time step = 10,000, (f) Time step = 30,000.
Applsci 13 12583 g004
Figure 5. Contact force chain progression of a slope with closed joints. (a) Time step = 100, (b) Time step = 200, (c) Time step = 1000, (d) Time step = 5000, (e) Time step = 10,000, (f) Time step = 30,000.
Applsci 13 12583 g005aApplsci 13 12583 g005b
Figure 6. Stress distribution status around the measuring circles in a slope with closed joints. (a) Horizontal stress, (b) Vertical stress.
Applsci 13 12583 g006
Figure 7. Crack progression for a slope without joints. (a) Time step = 100, (b) Time step = 200, (c) time step = 1000, (d) Time step = 5000, (e) Time step = 10,000, (f) Time step = 30,000.
Applsci 13 12583 g007
Figure 8. Contact force chain progression of a slope without closed joints. (a) Time step = 100, (b) Time step = 200, (c) Time step = 1000, (d) Time step = 5000, (e) Time step = 10,000, (f) Time step = 30,000.
Applsci 13 12583 g008
Figure 9. The comparison of horizontal stresses in the locations of the measuring circles. A–D are from a slope with joints, and E–H are from a slope without closed joints. (a) Horizontal stress in the locations of measuring circle A (from a slope with joints) and B (from a slope without joints), (b) Horizontal stress in the locations of measuring circle B (from a slope with joints) and F (from a slope without joints), (c) Horizontal stress in the locations of measuring circle B (from a slope with joints) and F (from a slope without joints), (d) Horizontal stress in the locations of measuring circle D (from a slope with joints) and H (from a slope without joints).
Applsci 13 12583 g009
Figure 10. Crack progression for a slope with a 20° inclination angle of rock strata. (a) Time step = 200, (b) Time step = 1000, (c) Time step = 5000, (d) Time step = 30,000.
Applsci 13 12583 g010
Figure 11. Crack progression for a slope with a 70° inclination angle of rock strata. (a) Time step = 200, (b) Time step = 1000, (c) Time step = 5000, (d) Time step = 30,000.
Applsci 13 12583 g011
Figure 12. Fragmentation patterns of slopes with (a) 20° and (b) 70° dip angles when the time step was 30,000.
Applsci 13 12583 g012
Figure 13. Displacement field of slopes with (a) 20° and (b) 70° dip angles of rock strata when the time step was 30,000.
Applsci 13 12583 g013
Figure 14. Contact force chain of slopes with (a) 20° and (b) 70° dip angles of rock strata when the time step was 30,000.
Applsci 13 12583 g014
Figure 15. Crack progression for a slope with an 80° slope angle. (a) Time step = 200, (b) Time step = 1000, (c) Time step = 5000, (d) Time step = 30,000.
Applsci 13 12583 g015
Figure 16. (a) The stress state of the simplified model of one rock stratum, (b) the simplified model of the anti-dip interbedded rock slope with a 60° slope angle, (c) the simplified model of the anti-dip interbedded rock slope with an 80° slope angle.
Applsci 13 12583 g016
Figure 17. Fragmentation pattern of a slope with an 80° slope angle when the time step was 30,000. The black arrow represents the direction of toppling.
Applsci 13 12583 g017
Figure 18. Displacement field of a slope with an 80° slope angle when the time step was 30,000.
Applsci 13 12583 g018
Figure 19. Contact force chain of a slope with an 80° slope angle when the time step was 30,000.
Applsci 13 12583 g019
Table 1. Strength parameters from the field investigation data and PFC 2D.
Strength ParametersRock Type
MudstoneBrown Shale
Field Investigation DataPFC 2DField Investigation DataPFC 2D
ρ (kg/m3)2300230021002100
c (0.1 MPa)1.501.6232.96
φ (°)30.030.017.016.2
E (GPa)32.8532.93
Note: ρ is density, c is cohesion, φ is frictional angle, and E is Yong’s modulus. c and φ are calculated by τ = c + σntanφ, which is an envelope line of Mohr’s circle according to the biaxial tests. E is the ratio of the 50% uniaxial compression strength and the 50% axial strain, which is from the uniaxial compression test.
Table 2. Calibrated micro-mechanical properties of the PBM.
Rock TypeParticle ParametersParallel Bond Parameters
R (m)Ec (GPa)Kn/Ks E ¯ c (GPa) K ¯ n / K ¯ s Normal Strength (MPa)Shear Strength (MPa)µ
Mudstone0.1–0.150.0641.00.0641.03.861.560.20
Brown shale0.12–0.180.0481.40.0481.41.661.220.25
Note: There is no direct functional relationship between the micro- and macro-parameters. Thus, the micro-parameters cannot be obtained from the equations in PFC. R is particle size, Ec is the particle contact module, Kn and Ks are the normal stiffness and tangential stiffness of the particle, respectively. E ¯ c is the parallel bond module, K ¯ n and K ¯ s are the normal stiffness and tangential stiffness of the parallel bond, respectively, and μ is the friction coefficient of the parallel bond.
Table 3. Calibrated micro-mechanical properties of the LM and SJM.
ModelKn (GPa)Ks (GPa)Tensile Strength (MPa)Cohesion (MPa)Dilation Angle (°)µ
LM0.030.03///0.05
SJM0.020.020.10.500.7
Note: Kn, Ks, and μ are the normal stiffness, tangential stiffness, and friction coefficient of the contact bond, respectively.
Disclaimer/Publisher’s Note: The statements, opinions and data contained in all publications are solely those of the individual author(s) and contributor(s) and not of MDPI and/or the editor(s). MDPI and/or the editor(s) disclaim responsibility for any injury to people or property resulting from any ideas, methods, instructions or products referred to in the content.

