Abstract
This study delves into the analysis of interface crack propagation originating from a right-angle corner along the bonding plane between the two plates composed of dissimilar materials. The research explores three distinct crack front shapes: concave, triangular, and convex (quarter-circle). The obtained results, meticulously presented in this paper, offer valuable insights into the nature of the crack propagation along these geometries. The findings elucidate that in the case of a convex crack front, the edges demonstrate a significantly accelerated propagation compared to the rest of the crack front. Conversely, for the triangular and concave crack fronts, the central region experiences faster propagation compared to the edges. These revelations lead to a generalized conclusion regarding the stability of different crack front shapes, highlighting the triangular crack front as the most stable configuration in this context. The implications of these observations provide essential knowledge for understanding and managing crack propagation in composite structures, offering potential applications in various engineering domains.
1. Introduction
In stratified materials with a bimaterial interface, under the influence of residual stresses or external loads, cracks may appear within either constituent material at the interface or propagate along the interface itself. The fracture process is intricately influenced by multiple factors including the sample’s geometry, type and magnitude of loading, toughness of the base material(s), and toughness of the interface.
The mechanical characteristics of multilayer materials are frequently governed by the strength and integrity of the interface connecting the constituent materials. In many instances, the initial crack initiates at this interface. Notably, delamination in composite materials often initiates at the corners, primarily due to stress concentration.
This interface failure corresponds to a distinct stress state, particularly evident in the theoretically elastic bimaterial corners. This state is contingent on the material properties and the corner geometry. The mechanics of delamination propagation from such corners extends into three dimensions, necessitating a 3D modeling approach for comprehensive study.
Applying the fracture mechanics approach to analyze delamination, it is crucial to recognize that the assumed initial shape of the delamination profoundly affects the fracture mechanics parameters derived from numerical analyses. Careful consideration of this initial shape assumption is therefore imperative to accurately understand and predict of delamination behavior in layered materials.
The design stress for the initiation and propagation of the plane strain edge cracks is a pivotal parameter frequently employed in the structural design of layered materials. Certain practical applications involve dynamic factors such as varying film thickness, changing residual stress levels, or evolving interface toughness over time. In such dynamic scenarios, accurate prediction of the longevity of the coating requires a comprehensive assessment of the relationship between the crack driving forces and the initial flaw size, which is fundamental for determining the service life of the coating.
The prominent contribution to investigation of the static fracture at the bimaterial interface was provided by the ground-breaking work of Rice (1988) [1], as well as papers by Hutchinson and Suo (1992) [2], Wang, Shih and Suo (1992) [3] and by Nikolic and Djokovic (2011) [4]. Qu and Bassani in 1993 presented a thorough examination of a critical mechanical scenario: a crack strategically positioned at the interface separating the two anisotropic materials. Their investigation delivered the crucial insights into the stress field around the crack tip and its corresponding Stress Intensity Factors (SIFs) [5].
Furthermore, Nikolic and Djokovic (2012) delved deeper into the application of Linear Elastic Fracture Mechanics (LEFM) principles, particularly focusing on the intricate interplay of interface cracks in the context of coating delamination on a cylindrical substrate [6]. This collaborative research extended the understanding of fracture mechanics and crack propagation dynamics in complex material systems.
Extensive analysis of the stress intensity factors for the three-dimensional (3D) interface cracks, originating from the bimaterial corner, has been notably lacking in the existing body of literature.
Following is a brief review of the available literature, where the several contributing factors to the limited investigation of SIFs for the 3D interface cracks were highlighted. Foremost among these is the inherent complexity associated with interface cracks, where the SIFs for both Mode I and Mode II crack propagation become interdependent. This intricacy arises from the fact that, unlike homogeneous materials, the SIFs for interface cracks are coupled, making it challenging to isolate and interpret them in the conventional manner. This unique characteristic necessitates a reevaluation of established fracture mechanics concepts and methodologies when addressing the 3D interface crack behavior.
The interface fracture is characteristic to various types of materials, steel, reinforced concrete, ceramics, polymer materials, human tissue, i.e., wherever the two different materials are joined along the common surface [7,8,9,10,11]. The mechanical behavior and structural integrity of materials, especially those structured as composite or layered systems, are profoundly influenced by the robustness of the interfaces bridging different constituents. These interfaces often serve as critical loci where initial cracks typically initiate, making them pivotal to the overall fracture mechanics and failure mechanisms within such materials.
In a significant study, Nakamura (1991) conducted an extensive 3D analysis, focusing on a bimaterial plate featuring a central crack. A notable discovery was the characterization of the stress distribution around the crack tip by an asymptotic bimaterial K-field, which was confined to a small fraction of the plate’s thickness, emphasizing the localized nature of the stress effects. Furthermore, authors have shown that the phase angles exhibit strong dependency on the bimaterial properties, with significant anti-plane mode deformations, particularly near the crack front and in close proximity to the free surface [12].
Expanding on this, Nakamura and Kamath (1992) delved into a 3D finite element (FE) analysis of the crack growth and decohesion in a compliant thin film bonded to a rigid substrate. They indicated that in scenarios without decohesion, the stress intensity factor (SIF) along the leading edge of the crack reached a steady state when the crack length was approximately twice the film thickness. This phenomenon resulted in a nearly parabolic crack front along the leading edge [13].
In a complementary study, Lee and Rosakis (1993) conducted a detailed investigation to understand the intricate 3D field existing at a crack front within the bimaterial interface. They revealed a singular field at the crack tip and emphasized how material property mismatch along the interface induced a 3D strip along the bimaterial interface ahead of the crack tip [14].
Building on this, Gosz et al. (1998) contributed by deriving the novel domain integrals that allowed for the accurate extraction of mixed-mode SIFs along curved, three-dimensional bimaterial interface cracks. The results, including the SIFs and phase angles, exhibited excellent agreement with analytical solutions, validating the effectiveness and accuracy of the proposed approach [15].
Ayhan and Nied (1999) and (2001) have considered the three-dimensional interface cracking in electronic packages, which appears due to the thermal cycling and/or moisture diffusion, originating at edges and corners, where there is the high stress concentration. Authors concluded that the 3D fracture results cannot be anticipated based only on the 2D calculations [16,17].
In a notable contribution to the field, Chaudhuri (2006) derived the 3D asymptotic stress field in the proximity of a bimaterial penny-shaped interfacial discontinuity, employing the eigenfunction expansion method, and considering five distinct discontinuity-surface boundary conditions. He concluded that the interpretation of the macroscopic analysis should be viewed as a preliminary approximation when attempting to comprehend the intricate microscopic state of stress near the circumferential front of a bimaterial interfacial penny-shaped anti-crack [18].
Building on Chaudhuri’s pioneering work, Ayhan, Kaya, and Nied (2006) introduced an innovative computational technique utilizing enriched crack tip elements, which were engineered to model the asymptotic behavior of interface crack tips. The analysis covered various bimaterial combinations under uniform remote tension and thermal loading [19].
In a related advancement, Nagai, Ikeda, and Miyazaki (2007) presented an efficient numerical method for calculating the SIFs associated with the 3D interface cracks between dissimilar anisotropic materials, using the M1 integral, obtained through the moving least-square method, and was implemented as a post-processing technique following Finite Element Method (FEM) simulations. The research displayed the method’s superior accuracy when compared to the direct extrapolation (DE) method [20].
The work of Ho and Tay (2009) delves into a profound exploration of the influence of initial delamination shapes on the mechanics of 3D interfacial delamination within the IC packages, considering the three distinct front shapes, concave, straight, and convex. Notably, their findings reveal intriguing insights into the maximum energy release rate (ERR) associated with each of these front shapes [21]. Their findings provided valuable insights into optimizing the design strategies and materials to mitigate delamination risks in electronic packaging and related applications.
In a noteworthy exploration, Yan et al. (2011) conducted an in-depth investigation into the application of the cohesive zone model (CZM) to elucidate the complex phenomenon of interface crack initiation within nanoscale components. They derived a unified criterion for the crack initiation at the edge of the interface, leveraging two pivotal CZM parameters. It was discerned that as the cohesive energy increased, the critical lateral force needed for crack initiation also increased [22].
Nagai, Ikeda, and Miyazaki (2012) employed their previously established numerical method involving the M1-integral to thoroughly evaluate stress intensity factors for three-dimensional interface cracks existing between dissimilar anisotropic materials. Their methodology encompassed a comprehensive investigation, ranging from analyzing double edge cracks in jointed dissimilar isotropic semi-infinite plates under uniform cooling, to external circular interface cracks subjected to uniform changes in temperature and a uniform temperature gradient [23].
In a parallel research endeavor, Delette et al. (2012) meticulously examined the effect of residual stresses on the propagation of interface cracks within dissimilar brittle (ceramic) materials. They investigated the influence of anti-plane mode on interface crack propagation and critically evaluated the validity of the 2D models, as well as the effects of mixed loading, incorporating both thermal and mechanical stresses. The authors underscored the prominent role of the anti-plane mode, particularly near the edges, and the Mode I contribution in causing an increase in ERR [24].
In a different way of inquiry, Veluri and Jensen (2013) directed their focus towards modeling the shape of the interface crack front and determining the critical stress for steady-state crack propagation, involving a rigorous estimation of the strain energy release rate, crack front profiles, and 3D mode mixity along the interface crack front. Their results contributed to a deeper understanding of the aspects of crack propagation at interfaces under specific stress conditions, aiding in the assessment of crack stability and growth in bonded materials [25].
Langlois et al. (2015) have proposed a method to derive the SIFs for the 3D cracks with the curved crack front, which is a combination of the direct integration method and the X-FEM (extended finite element method) localized multigrid approach. They applied the three-grid method, since the third grid provides an increased accuracy in determination of the SIFs. The authors stated that the proposed method can be easily adapted for solving other 3D crack problems [26].
In a significant study, Oda et al. (2019) conducted a detailed analysis concerning the relationship between the stress intensity factor (SIF) of a circumferential crack and adhesive thickness in a bonded round bar. They concluded that the dimensionless SIFs for a small interface crack and a small edge crack, both located near the interface in a butt jointed plate, remained constant, regardless of the adhesive thickness [27].
Expanding on this research, Djoković et al. (2019, 2020) delved into a comprehensive analysis focusing on the propagation of a corner crack within two long plates made of dissimilar materials. Their research encompassed a thorough examination of various crack front shapes and presented results detailing the normalized stress intensity factors and energy release rate variations for the three crack propagation modes. Notably, they scrutinized how these factors varied concerning the angle measuring the distance from the symmetry plane [28,29].
These studies collectively contributed to understanding the crack behavior and propagation in bonded structures, particularly in dissimilar material configurations. These findings offer essential insights that can inform material design, engineering practices, and fracture mechanics analyses, paving the way for enhanced structural integrity and reliability across various applications and industries.
In the following, the growth of an interface crack from a right angle along the joint plane between the two plates of different materials is considered, for different shapes of the crack front: concave, triangular and convex. For the analysis of the growth of the angular interface crack under the mixed mode conditions, the modified Paris law was used, to check how each of the considered shapes of the crack front behaves as the crack propagates, i.e., which of the crack front shapes should be considered as the most stable. The objective was to check and verify the findings of the same authors’ previous works [28,29]—that of the three considered shapes of the interface crack front, the straight one is the most stable.
2. Problem Formulation
During this research, we performed an in-depth analysis of the propagation behavior of an interface corner crack that initiates from a right angle within the joint plane connecting the two plates made of the dissimilar materials. The focus was on comprehensively investigating three distinct shapes that the crack front may assume, as illustrated in Figure 1.
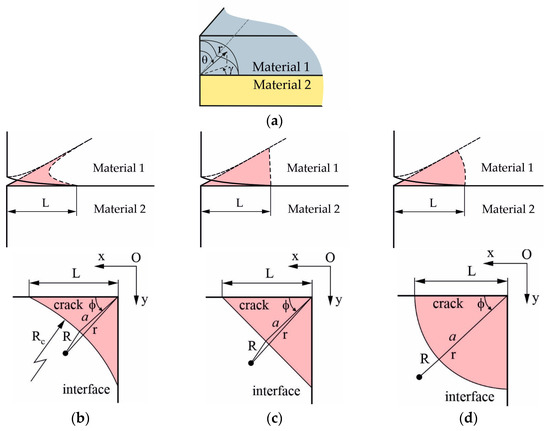
Figure 1.
The three-dimensional bimaterial angle with a crack at the interface (a), for different shapes of the crack front: (b) concave, (c) triangular, and (d) convex.
The central objective of this study was to unravel the intricate mechanics governing the propagation of a crack at this critical interface. Various geometric parameters were considered, such as the crack length denoted by a, within the cylindrical coordinate system (r, θ, γ) to precisely describe the crack’s spatial parameters.
Within the complex domain of stress analysis near the crack tip, positioned at the interface between these dissimilar materials, the stress field reveals itself as a composite of two fundamental types of fields. The first is the coupled oscillatory field, characterized by the complex stress intensity factor denoted as K, represented as a combination of K1 and iK2. The second is the non-oscillatory stress field, characterized by the real stress intensity factor, KIII. This intricate stress field near the interface crack tip is fundamental to comprehending crack behavior and propagation in this heterogeneous material junction. The stress field in the vicinity of the interface crack tip has the form [2]:
where: are the angular functions, which correspond to tensile forces, in-plane shear and anti-plane shear across the interface, respectively.
For the material above the interface, material 1, functions have the form [4]:
For material 2 below the interface angular functions have the forms analogous to those in Equation (2), one just has to simply change −π to π and vice versa, everywhere. The mode III functions are the same as for a homogeneous solid [4]:
These angular functions depend on the elastic characteristics of the bimaterial combination via the parameter ε, called the oscillatory index, which is defined as [1]:
where β is one of the two Dundurs parameters [30]:
where: Ei—is the Young elasticity modulus, μi—the shear modulus and νi—the Poisson’s ratio of material i, κi = 3 − 4νi for the plane strain and κi = (3 − νi)/(1 + νi) for the plane stress, i, j again stand for the corresponding interface parameters.
In tackling the problem of a crack situated at an interface, achieving a comprehensive solution hinges on the precise knowledge of the individual stress intensity factors, namely KI, KII, and KIII. Alternatively, understanding the energy release rate G along with the corresponding phase angles ψ and ϕ also provides an equivalent and comprehensive depiction of the solution.
The significance of these parameters lies in their ability to encapsulate the mechanics of crack propagation and behavior at the interface. Stress intensity factors are fundamental indicators of the stress field near the crack tip, crucial for evaluating the crack stability and growth potential. The energy release rate G is a key measure of the energy made available for crack advancement, providing a deeper understanding of the fracture process. Additionally, the phase angles ψ and ϕ are pivotal to characterize the mode mixity, essentially quantifying the contribution of different loading modes to crack propagation.
Together, these parameters constitute a vital framework for describing and predicting crack behavior at the interface, aiding engineers and researchers in devising effective crack prevention, control, and material design strategies in various applications. The energy release rate in the event of an interfacial crack is defined as [2]:
where
with for the plane strain state and for the plane stress state, while the indices 1 and 2 are referring to properties of the material above and below the interface, respectively.
In the case of the interface crack, ε ≠ 0, influences of the tensile and shear loads in the vicinity of the crack tip are not separated. To measure the relative dependence of the shear and normal forces (namely the Mode II to Mode I loads), it is necessary to determine the characteristic length L. For the oscillatory field, the mixed mode (ψ and ϕ) in the K space is being defined as, Figure 2 [3]:
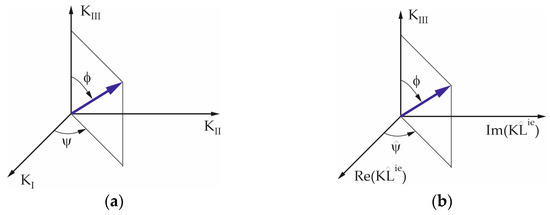
Figure 2.
Mode mixity defined as solid angles in the K space: (a) for ε = 0, (b) for ε ≠ 0.
The selection of the characteristic length L is somewhat discretionary, yet for a given material setup it may remain constant and uninfluenced by the dimensions and form of the specimen. An optimal choice for L involves considering the length of the elastic region relative to the overall sample dimensions, as elucidated in reference [1].
This study delves into the progressive advancement of the interface crack originating from a right-angled corner, following the plane of conjunction between two distinct material plates. The investigation spans across diverse crack front geometries, highlighting this progression in Figure 3. This analytical exploration enhances comprehension of crack propagation dynamics along the interface and its relationship with various crack front shapes.
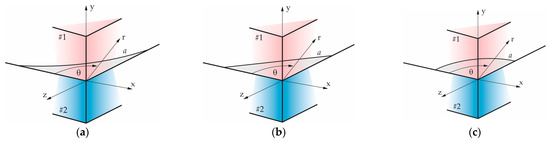
Figure 3.
Different shapes of the crack front for the corner interfacial crack: (a) concave, (b) triangular, (c) convex.
In Figure 3, a comprehensive view of the interface crack front is presented, displaying its intriguing variability in shape—concave, straight (triangular), or convex. The crack length, denoted as a, is a fundamental parameter in this representation, while r and θ serve as essential polar coordinates that aid in characterizing the crack’s geometric intricacies.
To delve into the mechanics of crack propagation, we adopt the modified Paris law—a valuable tool for analyzing the dynamic advancement of the crack. This law allows us to discern a critical threshold where the stress intensity factor KI surpasses the intrinsic material property, the fracture toughness KIc. Beyond this threshold, the crack experiences an unstable growth phase, significantly impacting the material’s structural integrity.
The crack growth equation, a pivotal component of our analysis, delineates the nuanced relationship between the incremental extension of the crack, Δa, and the corresponding increase in the number of loading cycles, ΔN. The pioneering work of Paris and Erdogan in 1963 has laid the foundation for our understanding, demonstrating that the stress intensity factor variation accurately characterizes the subcritical crack propagation. This extends our understanding from rapid or critical fractures to the subcritical realm, which is particularly crucial in fatigue loading conditions [31]. This knowledge forms a cornerstone for comprehending interface crack behavior and its progression under cyclic loading, shedding light on the complex interplay of mechanical forces and material characteristics. They also established that the crack propagation rate is the linear function of the stress intensity factor variation in the logarithmic form, i.e., [31,32,33,34]:
where the crack length a changes from the initial to the critical value that leads to facture, while N is the number of the load cycles, C and m are the material constants and ΔK = Kmax − Kmin is the variation of the stress intensity factor, namely the difference between its values at the maximum and minimum loads.
The interface crack growth, in the mixed mode conditions, can be described as [32]:
Considering the difficulties in calculating the phase angles ψ and ϕ, defined by Equation (8), it is assumed here that the interface corner crack growth, in the mixed mode conditions, can be represented by the simple function of the energy release rate variation [32]:
where, for the further calculations, the constants C and m are taken to be C = 4 × 10⁻¹³ J/m2 and m = 6.
3. Results and Discussion
In this investigation, our focus lies on understanding the crack propagation, a phenomenon primarily dictated by the energy release rate. All the simulations were executed in the Mathematica® programming package.
Figure 4 portrays the normalized energy release rate, a crucial parameter offering profound insights into the crack propagation process, for all three crack front shapes under consideration.
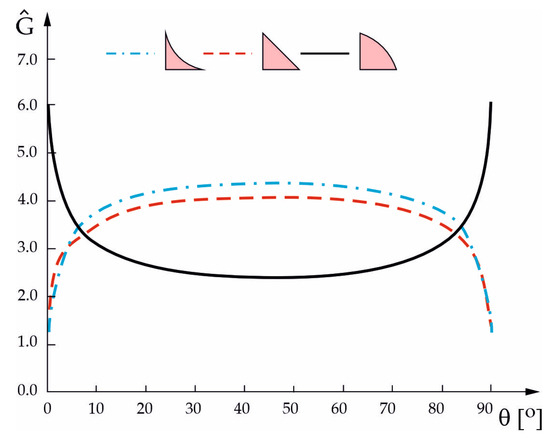
Figure 4.
Normalized energy release rate for the three shapes of the crack front for the crack at the Al2O3/steel interface in terms of the angle θ.
The interface under scrutiny constitutes Al2O3/steel, characterized by specific material properties. These include E1 = 375 GPa and ν1 = 0.27 for one material, and E2 = 216 GPa and ν2 = 0.28 for the other, as documented in reference [24]. Additionally, the material combination is defined by Dundurs parameters α = 0.2663 and β = 0.0779, while the oscillatory index is denoted by ε = −0.025.
The statement presented in [29], that the most stable shape of the crack front is the triangular one, is confirmed for this material configuration as well, Figure 5.
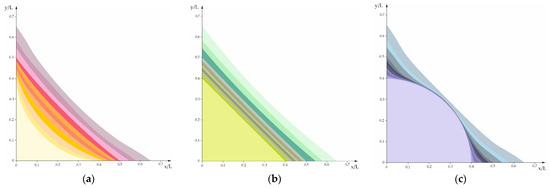
Figure 5.
Presentation of the corner crack front shape for the crack at the Al2O3/steel interface. (a) Concave, (b) triangular, (c) convex.
Examining Figure 5 provides valuable insights into the crack propagation dynamics. Notably, the quarter-circle-shaped crack exhibits swift progression near the free surface zone but considerably slower advancement in the central region. Conversely, this trend is inverted for concave and triangular cracks, where the central front advances at a faster pace compared to the edge areas. These observations collectively suggest that the triangular shape of the corner crack front presents a higher degree of stability. To substantiate these findings, two additional material combinations were subjected to testing, involving the propagation of corner cracks with three different front shapes: concave, straight, and convex.
In the case of crack propagation illustrated in Figure 6, the bimaterial combination (grey cast iron/PMMA) encompasses distinct material properties: E1 = 130 GPa, ν1 = 0.22, E2 = 2.4 GPa, ν2 = 0.33. Additionally, this setup incorporates Dundurs parameters α = 0.9613 and β = 0.2419, along with an oscillatory index ε = −0.079. These parameters define the material behavior crucial for understanding crack propagation, and their selection is based on extensive experimentation and analysis. By examining these combinations, we gain a comprehensive understanding of how material properties interact with crack geometry, shedding light on stability and progression mechanisms in interface cracks.
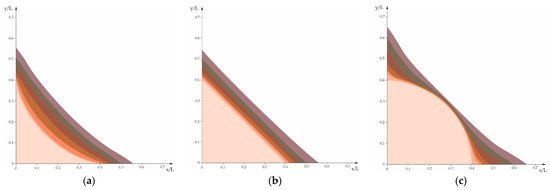
Figure 6.
The propagation of the interfacial corner crack for the bimaterial combination grey cast iron/PMMA. (a) Concave crack front, (b) triangular crack front, (c) convex crack front.
The bimaterial combination (silicon/epoxy) in the crack propagation case presented in Figure 7, possesses the following properties E1 = 128 GPa, ν1 = 0.28, E2 = 12 GPa, ν2 = 0.33, with Dundurs parameters α = 0.8232 and β = 0.2043 and the oscillatory index ε = −0.066.
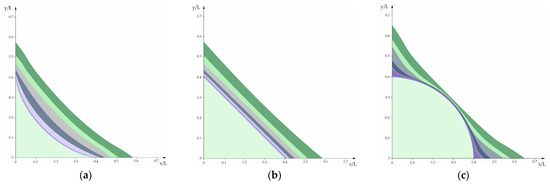
Figure 7.
The propagation of the interfacial corner crack for the bimaterial combination silicon/epoxy. (a) Concave crack front, (b) triangular crack front, (c) convex crack front.
Both Figure 6 and Figure 7 provide compelling visual evidence demonstrating distinct patterns in crack propagation concerning different crack front shapes. In the case of the concave crack front shape, the periphery or edge areas exhibit a more rapid propagation compared to the central region of the front. Conversely, when dealing with the convex shape of the crack front this trend is notably reversed. This observation sheds the light on the intricate interplay between the crack geometry and a propagation dynamics. The crack front shape evidently plays a crucial role in influencing how the crack propagates within a material. Understanding these dynamics is paramount as it directly impacts the structural integrity and reliability of the material or component in question.
From the calculations of the mode mixity, it was concluded that the highest energy release rate, for all the shapes of the crack front, is in the middle of the crack front. That implies that the middle of the crack front will propagate first. Based on this, Ho and Tay [21] concluded that the convex shape would evolve into the concave one. However, since the mode mixity is relatively constant along the crack front, regardless of the initial shape, it follows that the convex shape would have to “go through” the straight form first, before changing to the concave one. Now, as for the concave shape, the edge areas, close to the free surface, propagate at a slower rate than for the straight shape, it is not logical that the convex crack front (and for that matter the straight one as well) would suddenly exhibit variation in the energy release rate in the reverse sense. Thus, our conclusion holds, that both the concave and convex shape would move towards becoming the straight line, which implies that the initially straight-line shaped crack front is the most stable one.
4. Conclusions
In this comprehensive research endeavor, we meticulously examined the intricate growth patterns of an interface crack originating at a right-angle corner and progressing along the plane where the two dissimilar material plates are conjoined. The study takes a nuanced approach by exploring the diverse geometrical formations of the crack front, encompassing concave, triangular, and convex shapes. These variations in crack front geometry are pivotal to understanding how they influence and modulate the crack propagation process.
To unravel the underlying mechanisms governing the crack growth, we employ the modified Paris’s law, a mathematical framework well-suited for analyzing the growth behavior of angular interface cracks under mixed mode conditions. This analytical tool enables us to discern critical thresholds where stress intensity factors and fracture toughness interact, delineating the stability of different crack front shapes.
Our investigation vividly illustrates the evolution of the crack front for the three distinct shapes—concave, triangular, and convex—at the interface between Al2O3 and steel. By closely examining the crack advancement patterns, we arrive at a noteworthy and consistent conclusion across various material combinations. The results unequivocally affirm the stability of the triangular crack shape, presenting it as the most structurally sound and predictable configuration.
This profound revelation has far-reaching implications. Armed with a deep comprehension of the bimaterial combination parameters and crack front geometry, we gain the remarkable ability to foresee and ascertain the most stable crack front shape in a given scenario. This predictive capacity is a powerful tool in engineering and material science, guiding the design and construction of structures with enhanced durability and structural resilience. It lays the foundation for advancements in various domains, ensuring safer and more reliable material utilization in critical applications.
The simulation and calculations in this article were conducted by application of the Mathematica® symbolic programming routine. The results are then presented in the form of graphs from which it was concluded which of the three shapes of the crack front is the most stable one, i.e., which one would not change to any of the other two shapes during the crack propagation. This type of problem is interesting for the further study and should involve considering different variations of the bi-material combinations to prevent a delamination of the stratified materials, in the first place.
Author Contributions
Conceptualization, J.M.D. and R.R.N.; methodology, R.R.N.; software, J.M.D.; validation, R.U.; formal analysis, J.M.D. and J.P.; resources, R.U.; data curation, J.M.D.; writing—original draft preparation, J.M.D. and R.R.N.; writing—review and editing, R.R.N.; visualization, J.M.D. and R.R.N.; supervision, R.U.; project administration, J.P.; funding acquisition, R.U. All authors have read and agreed to the published version of the manuscript.
Funding
This research was partially supported by the Ministry of Education, Science and Technological Development of the Republic of Serbia, within the funding of the scientific research work at the University of Belgrade, Technical Faculty in Bor, contract number 451-03-47/2023-01/200131 and the project “Support of research and development capacities to generate advanced software tools designed to increase the resilience of economic entities against excessive volatility of the energy commodity market”, of Operational Programme Integrated Infrastructure, number ITMS2014+ code 313011BUK9, co-funded by the European Regional Development Fund.
Institutional Review Board Statement
Not applicable.
Informed Consent Statement
Not applicable.
Data Availability Statement
Data are contained within the article.
Conflicts of Interest
The authors declare no conflict of interest.
References
- Rice, J.R. Elastic fracture mechanics concepts for interfacial cracks. ASME J. Appl. Mech. 1988, 55, 98–103. [Google Scholar] [CrossRef]
- Hutchinson, J.W.; Suo, Z. Mixed mode cracking in layered materials. Adv. Appl. Mech. 1992, 29, 63–191. [Google Scholar] [CrossRef]
- Wang, T.C.; Shih, C.F.; Suo, Z. Crack extension and kinking in laminates and bicrystals. Int. J. Sol. Struct. 1992, 29, 327–344. [Google Scholar] [CrossRef]
- Nikolic, R.; Djokovic, J. Interfacial Cracks in Bicrystals and Bimaterials. In Crack Growth: Rates, Prediction and Prevention; Kubair, D., Ed.; Nova Publishers, Inc.: New York, NY, USA, 2011; pp. 101–126. [Google Scholar]
- Qu, J.; Bassani, J.L. Interfacial Fracture Mechanics for Anisotropic Bimaterials. ASME J. Appl. Mech. 1993, 60, 422–431. [Google Scholar] [CrossRef]
- Nikolic, R.; Djokovic, J. The LEFM Concept for Interfacial Cracks Application to the Problem of Coating Delamination on Cylindrical Substrates. ASME J. Appl. Mech. 2012, 79, 031005-1–031005-7. [Google Scholar] [CrossRef]
- Wang, S.; Liu, B.X.; Zhang, X.; Chen, C.H.; Fang, W.; Ji, P.G.; Feng, J.H.; Jiang, Y.F.; Yin, F.X. Microstructure and Interface Fracture Characteristics of Hot-Rolled Stainless Steel-Clad Plates by Adding Different Interlayers. Steel Res. Int. 2020, 91, 1900604. [Google Scholar] [CrossRef]
- Congro, M.; Mejía Sanchez, E.C.; Roehl, D.; Marangon, E. Fracture modeling of fiber reinforced concrete in a multiscale approach. Compos. Part B Eng. 2019, 174, 106958. [Google Scholar] [CrossRef]
- Blikharskyy, Z.; Lobodanov, M.; Vegera, P. Investigation of defective reinforced concrete beams with obtained damage of compressed area of concrete. Prod. Eng. Arch. 2022, 28, 225–232. [Google Scholar] [CrossRef]
- Hu, L.; Wang, S.; Liang, L. Interface damage and fracture mechanisms of a ceramic/polymer interface based on atomic-scale simulations. Phys. Chem. Chem. Phys. 2022, 24, 29461–29470. [Google Scholar] [CrossRef]
- Shitole, P.; Gupta, A.; Ghosh, R. Fracture Mechanism and Fracture Toughness at the Interface Between Cortical and Cancellous Bone. J. Biomech. Eng. 2019, 241, 114502. [Google Scholar] [CrossRef]
- Nakamura, T. Three-dimensional stress fields of elastic interface cracks. ASME J. Appl. Mech. 1991, 58, 939–946. [Google Scholar] [CrossRef]
- Nakamura, T.; Kamath, S.M. Three-dimensional effects in thin film fracture mechanics. Mech. Mater. 1992, 13, 67–77. [Google Scholar] [CrossRef]
- Lee, Y.J.; Rosakis, A.J. Interfacial cracks in plates: A three-dimensional numerical investigation. Int. J. Sol. Struct. 1993, 30, 3139–3158. [Google Scholar] [CrossRef]
- Gosz, M.; Dolbow, J.; Moran, B. Domain integral formulation for stress intensity factor computation along curved three-dimensional interface cracks. Int. J. Sol. Struct. 1998, 35, 1763–1783. [Google Scholar] [CrossRef]
- Ayhan, A.O.; Nied, H.F. Finite Element Analysis of Interface Cracking in Semiconductor Packages. IEEE Trans. Compon. Packag. Technol. 1999, 22, 503–511. [Google Scholar] [CrossRef]
- Ayhan, A.O.; Nied, H.F. Analysis of three-dimensional interface cracking in electronic packages. In Proceedings of the ICF10, Honolulu, HI, USA, 2–6 December 2001. [Google Scholar]
- Chaudhuri, R. Three-dimensional asymptotic stress field in the vicinity of the circumference of a bimaterial penny-shaped interfacial discontinuity. Int. J. Fract. 2006, 141, 211–225. [Google Scholar] [CrossRef]
- Ayhan, A.; Kaya, A.; Nied, H. Analysis of three-dimensional interface cracks using enriched finite elements. Int. J. Fract. 2006, 142, 255–276. [Google Scholar] [CrossRef]
- Nagai, M.; Ikeda, T.; Miyazaki, N. Stress intensity factor analysis of a three-dimensional interface crack between dissimilar anisotropic materials. Eng. Fract. Mech. 2007, 74, 2481–2497. [Google Scholar] [CrossRef]
- Ho, S.L.; Tay, A.A.O. Effect of Shapes of Crack Fronts on the Mechanics of 3D Interfacial Delamination in IC Packages. In Proceedings of the 59th Electronic Components and Technology Conference, San Diego, CA, USA, 26–29 May 2009. [Google Scholar]
- Yan, Y.; Sumigawa, T.; Shang, F.; Kitamura, T. Three-Dimensional Cohesive Zone Modeling on Interface Crack Initiation from Nanoscale Stress Concentration. J. Sol. Mech. Mater. Eng. 2011, 5, 117–127. [Google Scholar] [CrossRef][Green Version]
- Nagai, M.; Ikeda, T.; Miyazaki, N. Stress intensity factor analysis of a three-dimensional interface crack between dissimilar anisotropic materials under thermal stress. Eng. Fract. Mech. 2012, 91, 14–36. [Google Scholar] [CrossRef][Green Version]
- Delette, G.; Laurencin, J.; Murer, S.; Leguillon, D. Effect of residual stresses on the propagation of interface cracks between dissimilar brittle materials: Contribution of two and three-dimensional analyses. Eur. J. Mech. A/Solids 2012, 35, 97–110. [Google Scholar] [CrossRef]
- Veluri, B.; Jensen, H.M. Steady-state propagation of interface corner crack. Int. J. Sol. Struct. 2013, 50, 1613–1620. [Google Scholar] [CrossRef]
- Langlois, C.R.; Gravouil, A.; Baietto, M.-C.; Réthoré, J. Three-dimensional simulation of crack with curved front with direct estimation of stress intensity factors. Int. J. Num. Meth. Eng. 2015, 101, 635–652. [Google Scholar] [CrossRef]
- Oda, K.; Kasamura, Y.; Nishi, M.; Tsutsumi, N. Relation between stress intensity factor of circumferential crack and adhesive thickness in bonded round bar. IOP Conf. Ser. Mater. Sci. Eng. 2019, 657, 012041. [Google Scholar] [CrossRef]
- Djoković, J.; Vulović, S.; Nikolić, R.; Hadzima, B. Analysis of Three-Dimensional Interface Corner Cracks. FME Trans. 2019, 47, 29–35. [Google Scholar] [CrossRef]
- Djoković, J.; Nikolić, R.; Bujnak, J.; Hadzima, B.; Tomić, R. Some Aspects of the Three-Dimensional Interface Cracks Analysis. Technol. Gaz. 2020, 27, 1–4. [Google Scholar] [CrossRef]
- Dundurs, J. Elastic Interaction of Dislocations with Inhomogeneities. In Mathematical Theory of Dislocations; Mura, T., Ed.; ASME: New York, NY, USA, 1969; pp. 77–114. [Google Scholar]
- Paris, P.; Erdogan, F. A Critical Analysis of Crack Propagation Laws. J. Basic Eng. 1963, D85, 528–534. [Google Scholar] [CrossRef]
- Snodgrass, J.M.; Pantelidis, D.; Jenkins, M.L.; Bravman, J.C.; Dauskardt, R.H. Subcritical Debonding of Polymer/Silica Interfaces Under Monotonic and Cyclic Loading. Acta Mater. 2002, 50, 2395–2411. [Google Scholar] [CrossRef]
- Bulatović, S.M.; Aleksić, V.D.; Milović, L.P.; Zečević, B.V. Application of Paris’ Law Under Variable Loading. FME Trans. 2022, 50, 72–78. [Google Scholar] [CrossRef]
- Alshoaibi, A.M.; Fageehi, Y.A. Numerical Analysis of Fatigue Crack Growth Path and Life Predictions for Linear Elastic Material. Materials 2020, 13, 3380. [Google Scholar] [CrossRef]
Disclaimer/Publisher’s Note: The statements, opinions and data contained in all publications are solely those of the individual author(s) and contributor(s) and not of MDPI and/or the editor(s). MDPI and/or the editor(s) disclaim responsibility for any injury to people or property resulting from any ideas, methods, instructions or products referred to in the content. |
© 2023 by the authors. Licensee MDPI, Basel, Switzerland. This article is an open access article distributed under the terms and conditions of the Creative Commons Attribution (CC BY) license (https://creativecommons.org/licenses/by/4.0/).