
Multidimensional Data Analysis for Enhancing In-Depth Knowledge on the Characteristics of Science and Technology Parks


Abstract
:Featured Application
Abstract
1. Introduction
2. Objectives
- SO1: To have an overview of the general situation of STPs in Spain;
- SO2: To validate that different types of STPs exist with distinct characteristics and to establish whether they fit the three types proposed in the literature (SPs, TPs, and HPs);
- SO3: To know the main and typical features of the different types of STPs.
3. Resources and Techniques
3.1. Resources
- A dataset built by Francés et al. [2] in which the internal core features affecting the performance of STPs are presented. It presents a tabular format and covers a 16-year period (2004–2019), and 21 selected core features are considered, together with the STP name (STP identifier) and the year, resulting in a dataset with 23 columns. The rows of the dataset correspond to the STP name–year combination that constitutes each instance of the dataset, amounting to 603 instances in total.
3.2. Techniques
3.2.1. Descriptive Techniques
- General statistics references with each core feature, grouped by STPs (all), SP type, TP type, and HP type.
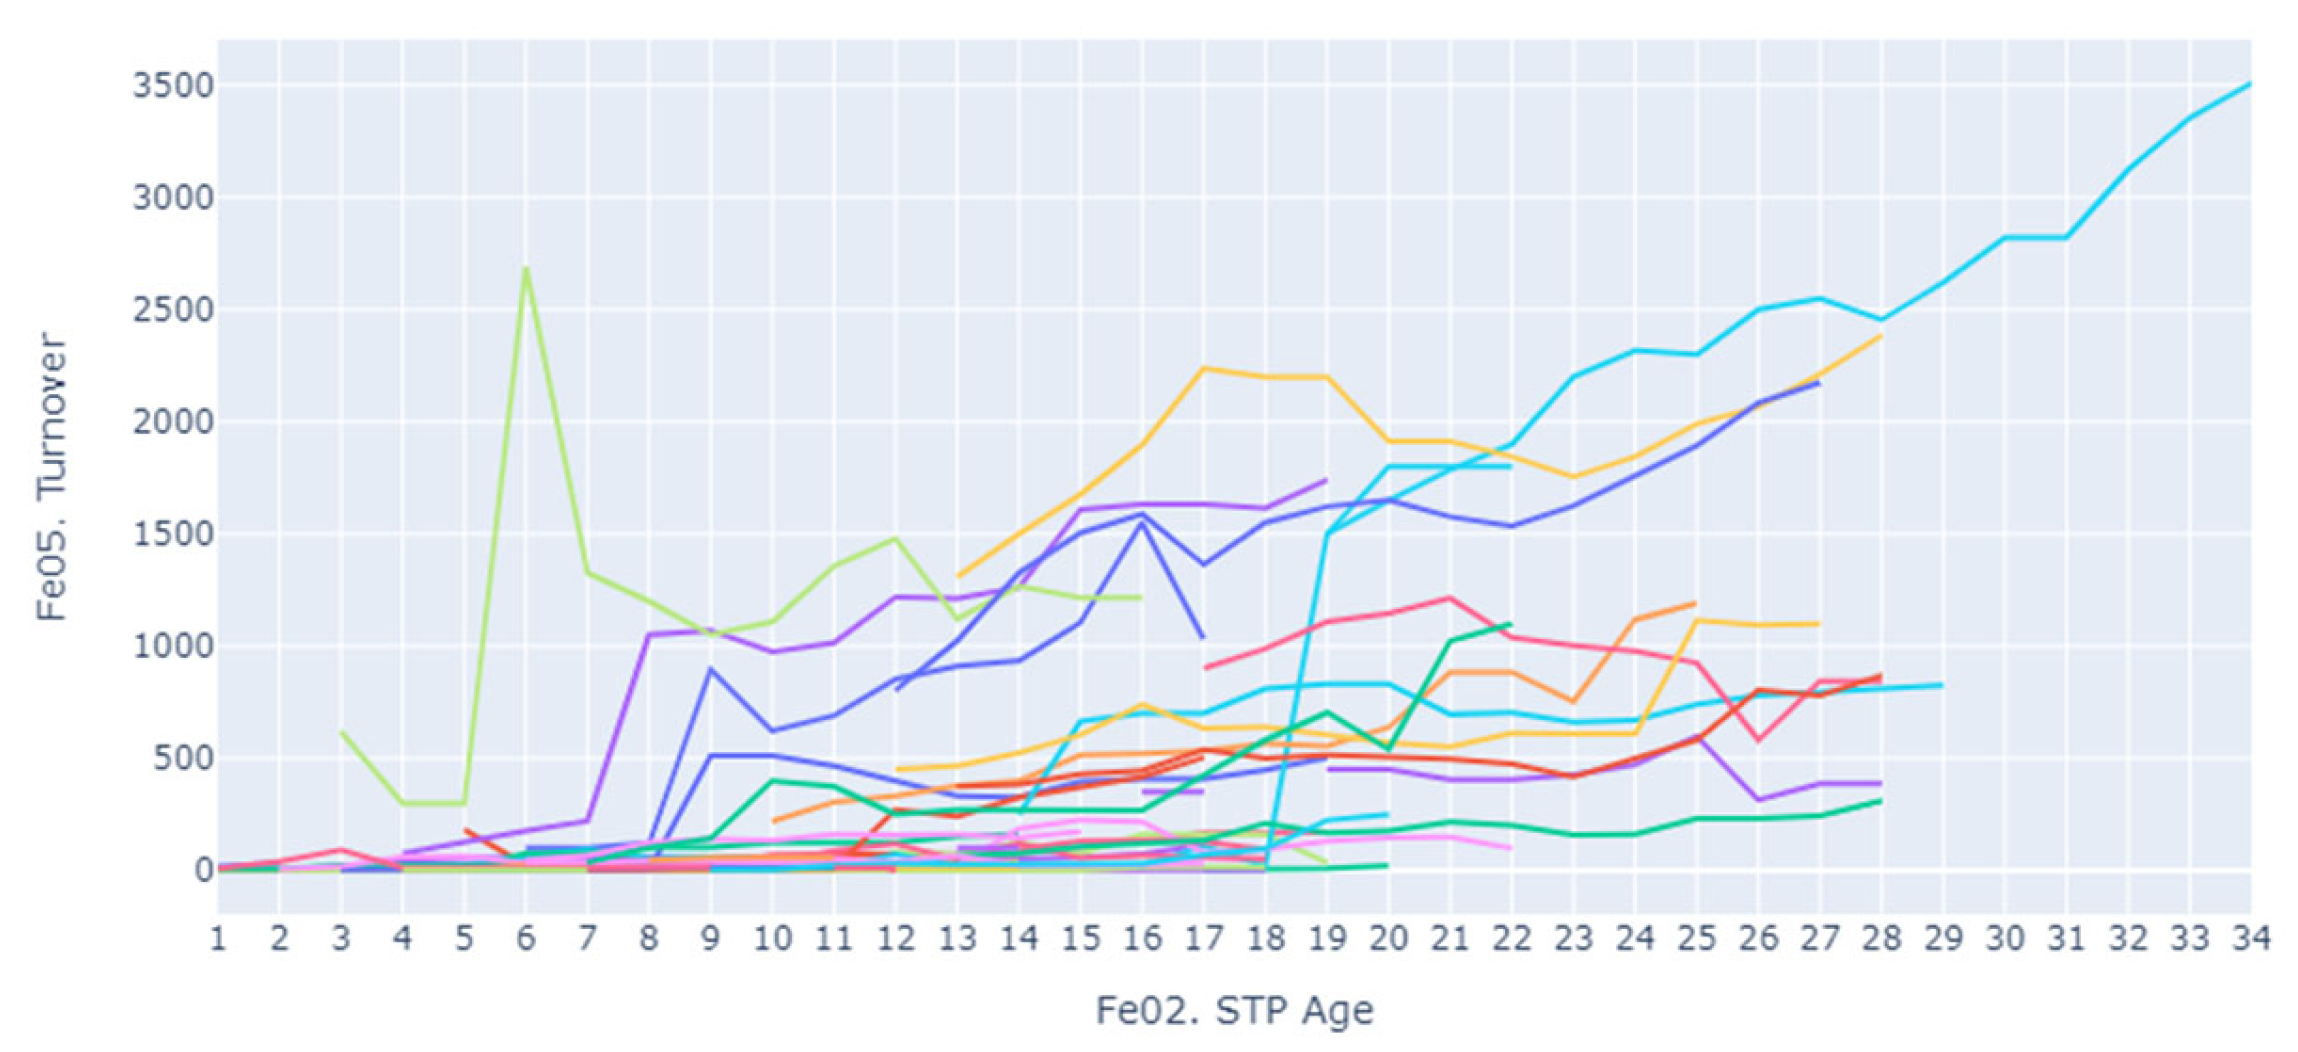
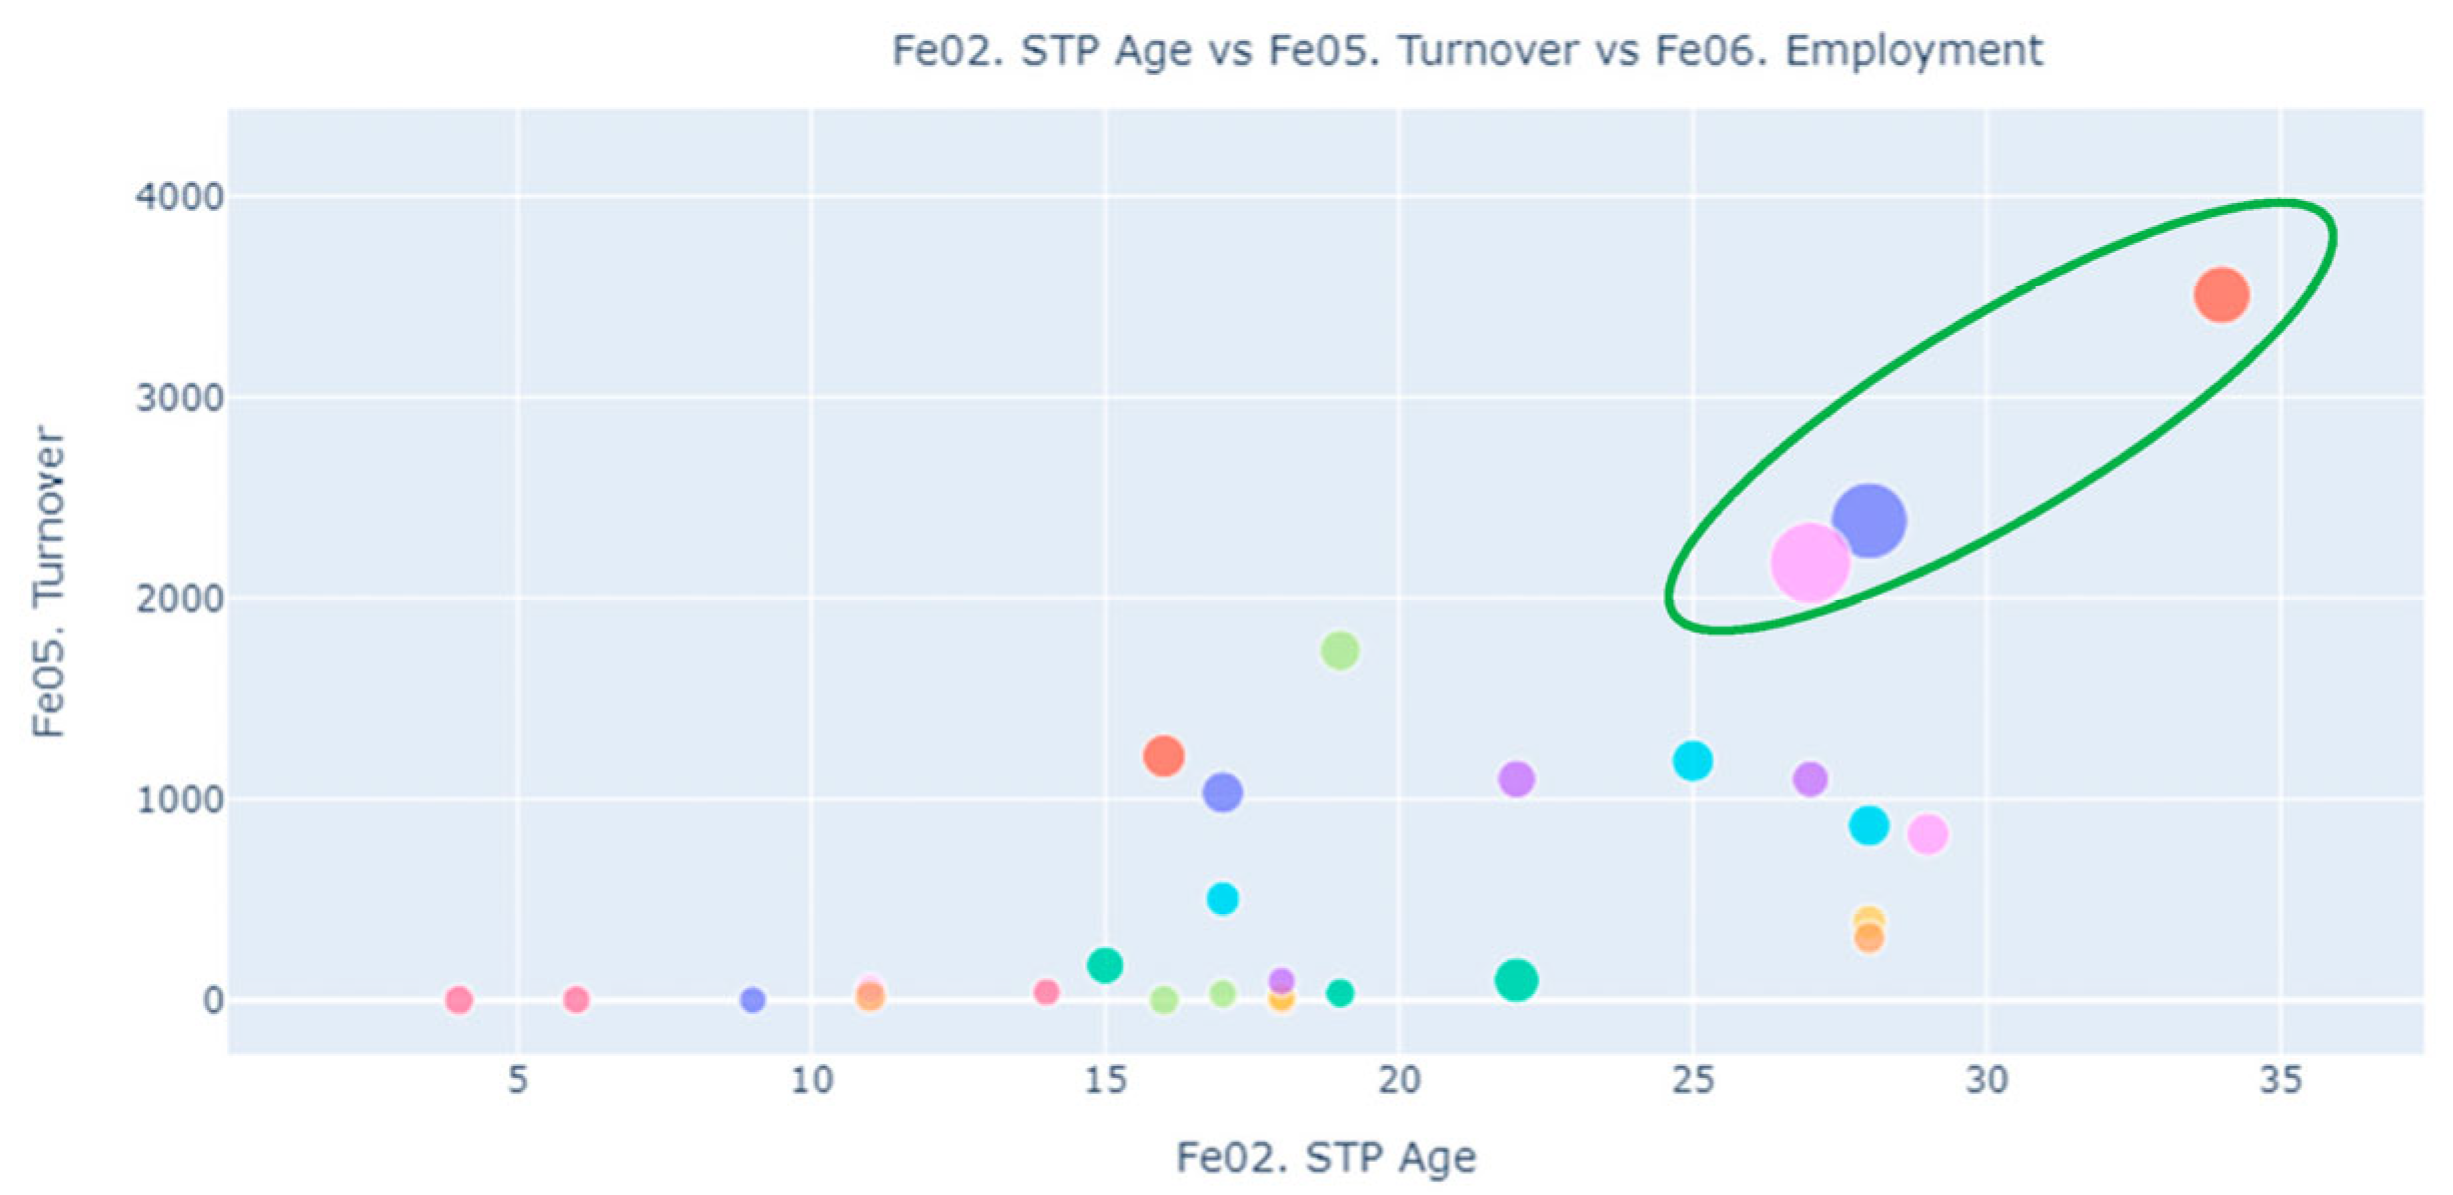
- Multidimensional graphic representation, including the graphic representation of each core feature according to the year or the antiquity of the STPs. Moreover, the graphical representation of three different core features can be obtained, again for all the STPs, for each one or per type (SPs, TPs, and HPs).
- A two-sample test of means allows us to determine whether one group of STPs is significantly different from others for each core feature and to explore significant differences between types of STPs. The permuted Brunner Munzel test [4] is used, which is more appropriate for small sample sizes, as is the case here. This nonparametric test evaluates the null hypothesis where, when values are drawn, one for each sample, the probability of obtaining larger values in both samples is the same.
3.2.2. Machine Learning Applied to Data Analysis
- Decision Tree Learning: This supervised classification method classifies instances through a sequence of questions related to the value of one of the features describing the pattern. The learning consists of building a set of questions that can be represented as a decision tree, hence the name. The goal is that each question can be used not only to describe an instance but a set of them within the same class ensuring generalisation. This structure makes the decision tree an easily explicable machine-learning algorithm.
- Cluster Analysis: K-means [12,13,14] was used, a well-known non-parametric technique for cluster analysis that has numerous fields of application such as healthcare, coronavirus, and urban hotspots, e.g., [15,16,17]. In k-means, each instance is assigned to its nearest centroid, which represents an average of the instances in the cluster. The centroids are updated iteratively until no instance changes its cluster. It may not be well-suited if the expected structure is other than spheric clusters. Not being tied to a specific algorithm, the suitability issue can be addressed by evaluating the results, identifying signals that show the algorithm is not performing as expected and proceeding to study alternatives. Different values for the number of clusters (K) and the silhouette score (s) were used to evaluate the cluster quality. Features were min–max scaled before analysis.
4. Evaluation and Results
4.1. Descriptive Analysis: General Situation of Spanish STPs
4.2. Machine Learning Applied to Data Analysis
4.2.1. Decision Tree Analysis: Dominant Features by STP Type
- The Spanish SP presents a surface area (Fe03. STP Size) under 200,000 m2, Fe13. Incubation ratio > 0.14, and Fe18. Innovative profile 1 > 0.46 as the most significant feature.
- The Spanish TP presents a surface area over 200,000 m2, innovative profile 1 less than 0.46, and average company size 1 > 10.40.
- Spanish HPs are between SPs and TPs but tend to be closer to the SP type, although this is not definitive.
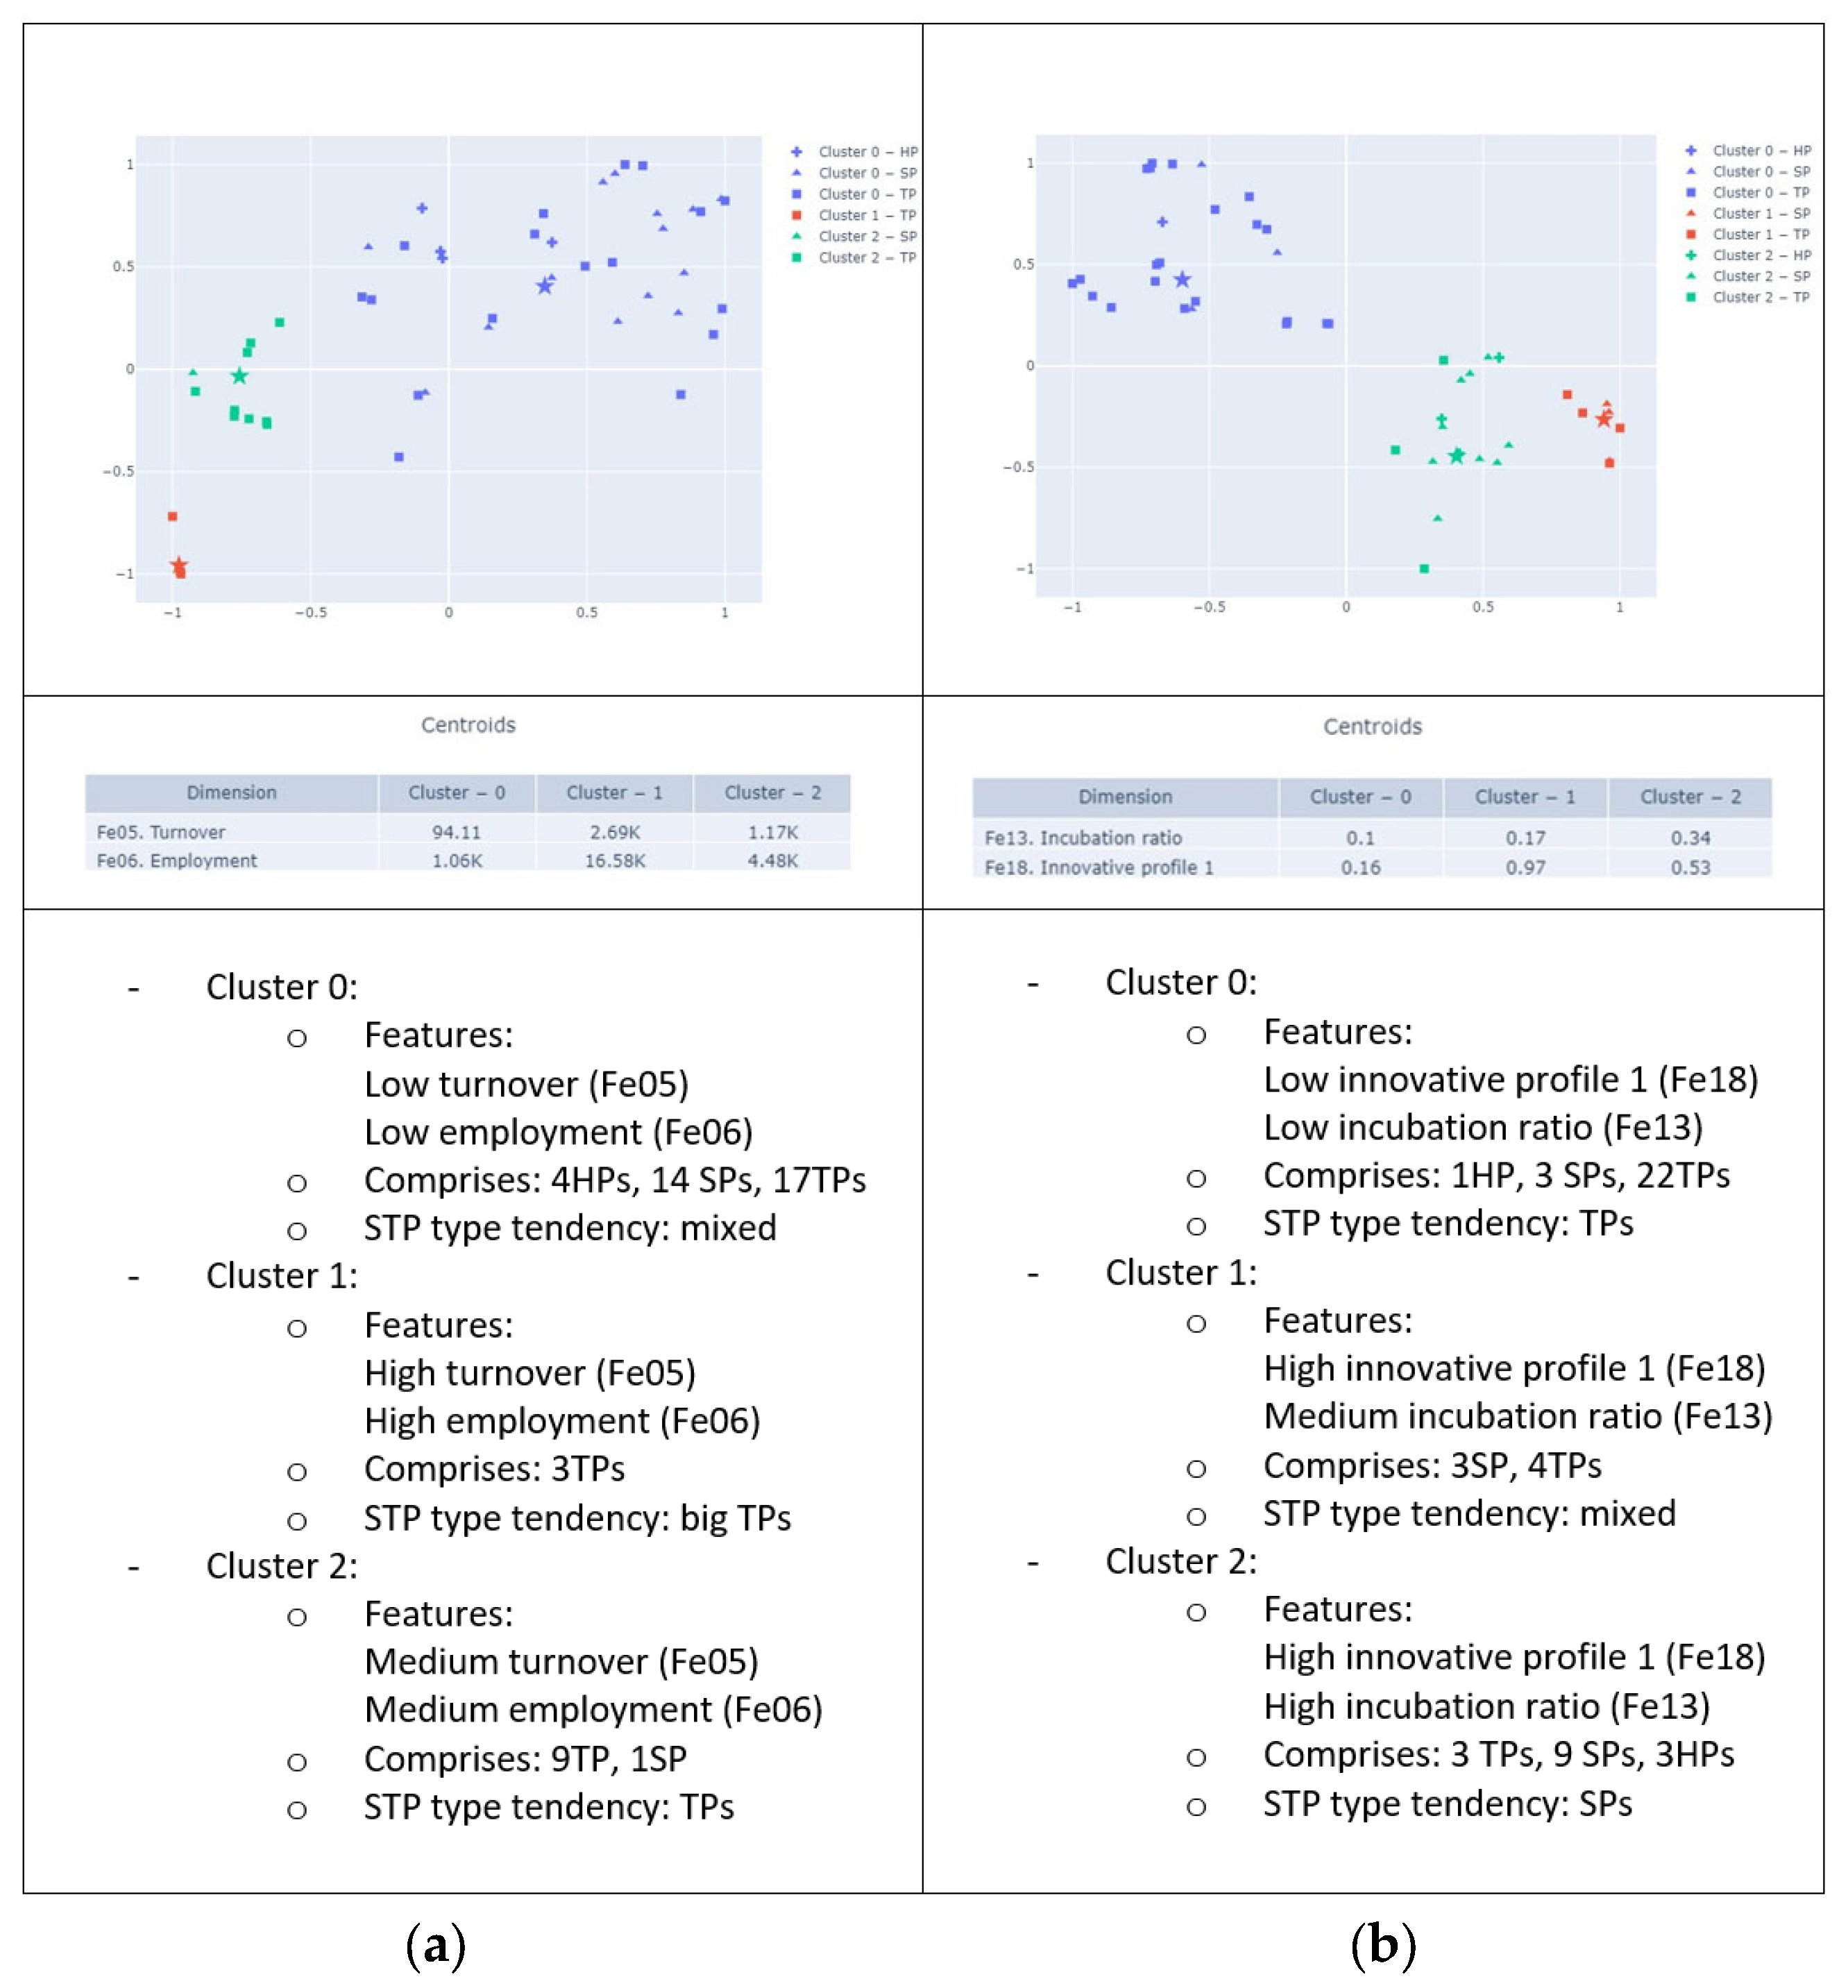
4.2.2. Clustering Analysis: Natural Aggrupation
- 0.71–1.0: well-defined structure;
- 0.51–0.70: “reasonably” well-defined structure;
- 0.26–0.50: weak structure, may be artificial—it is suggested that we try other methods;
- <0.25: no structure has been discovered in the data.
5. Discussion and Validation
- SO1: To have an overview of the general situation of STPs in Spain.
- SO2: To validate that there are different types of STPs with distinct characteristics and whether they correspond to the three types proposed in the literature (SPs, TPs, and HPs).
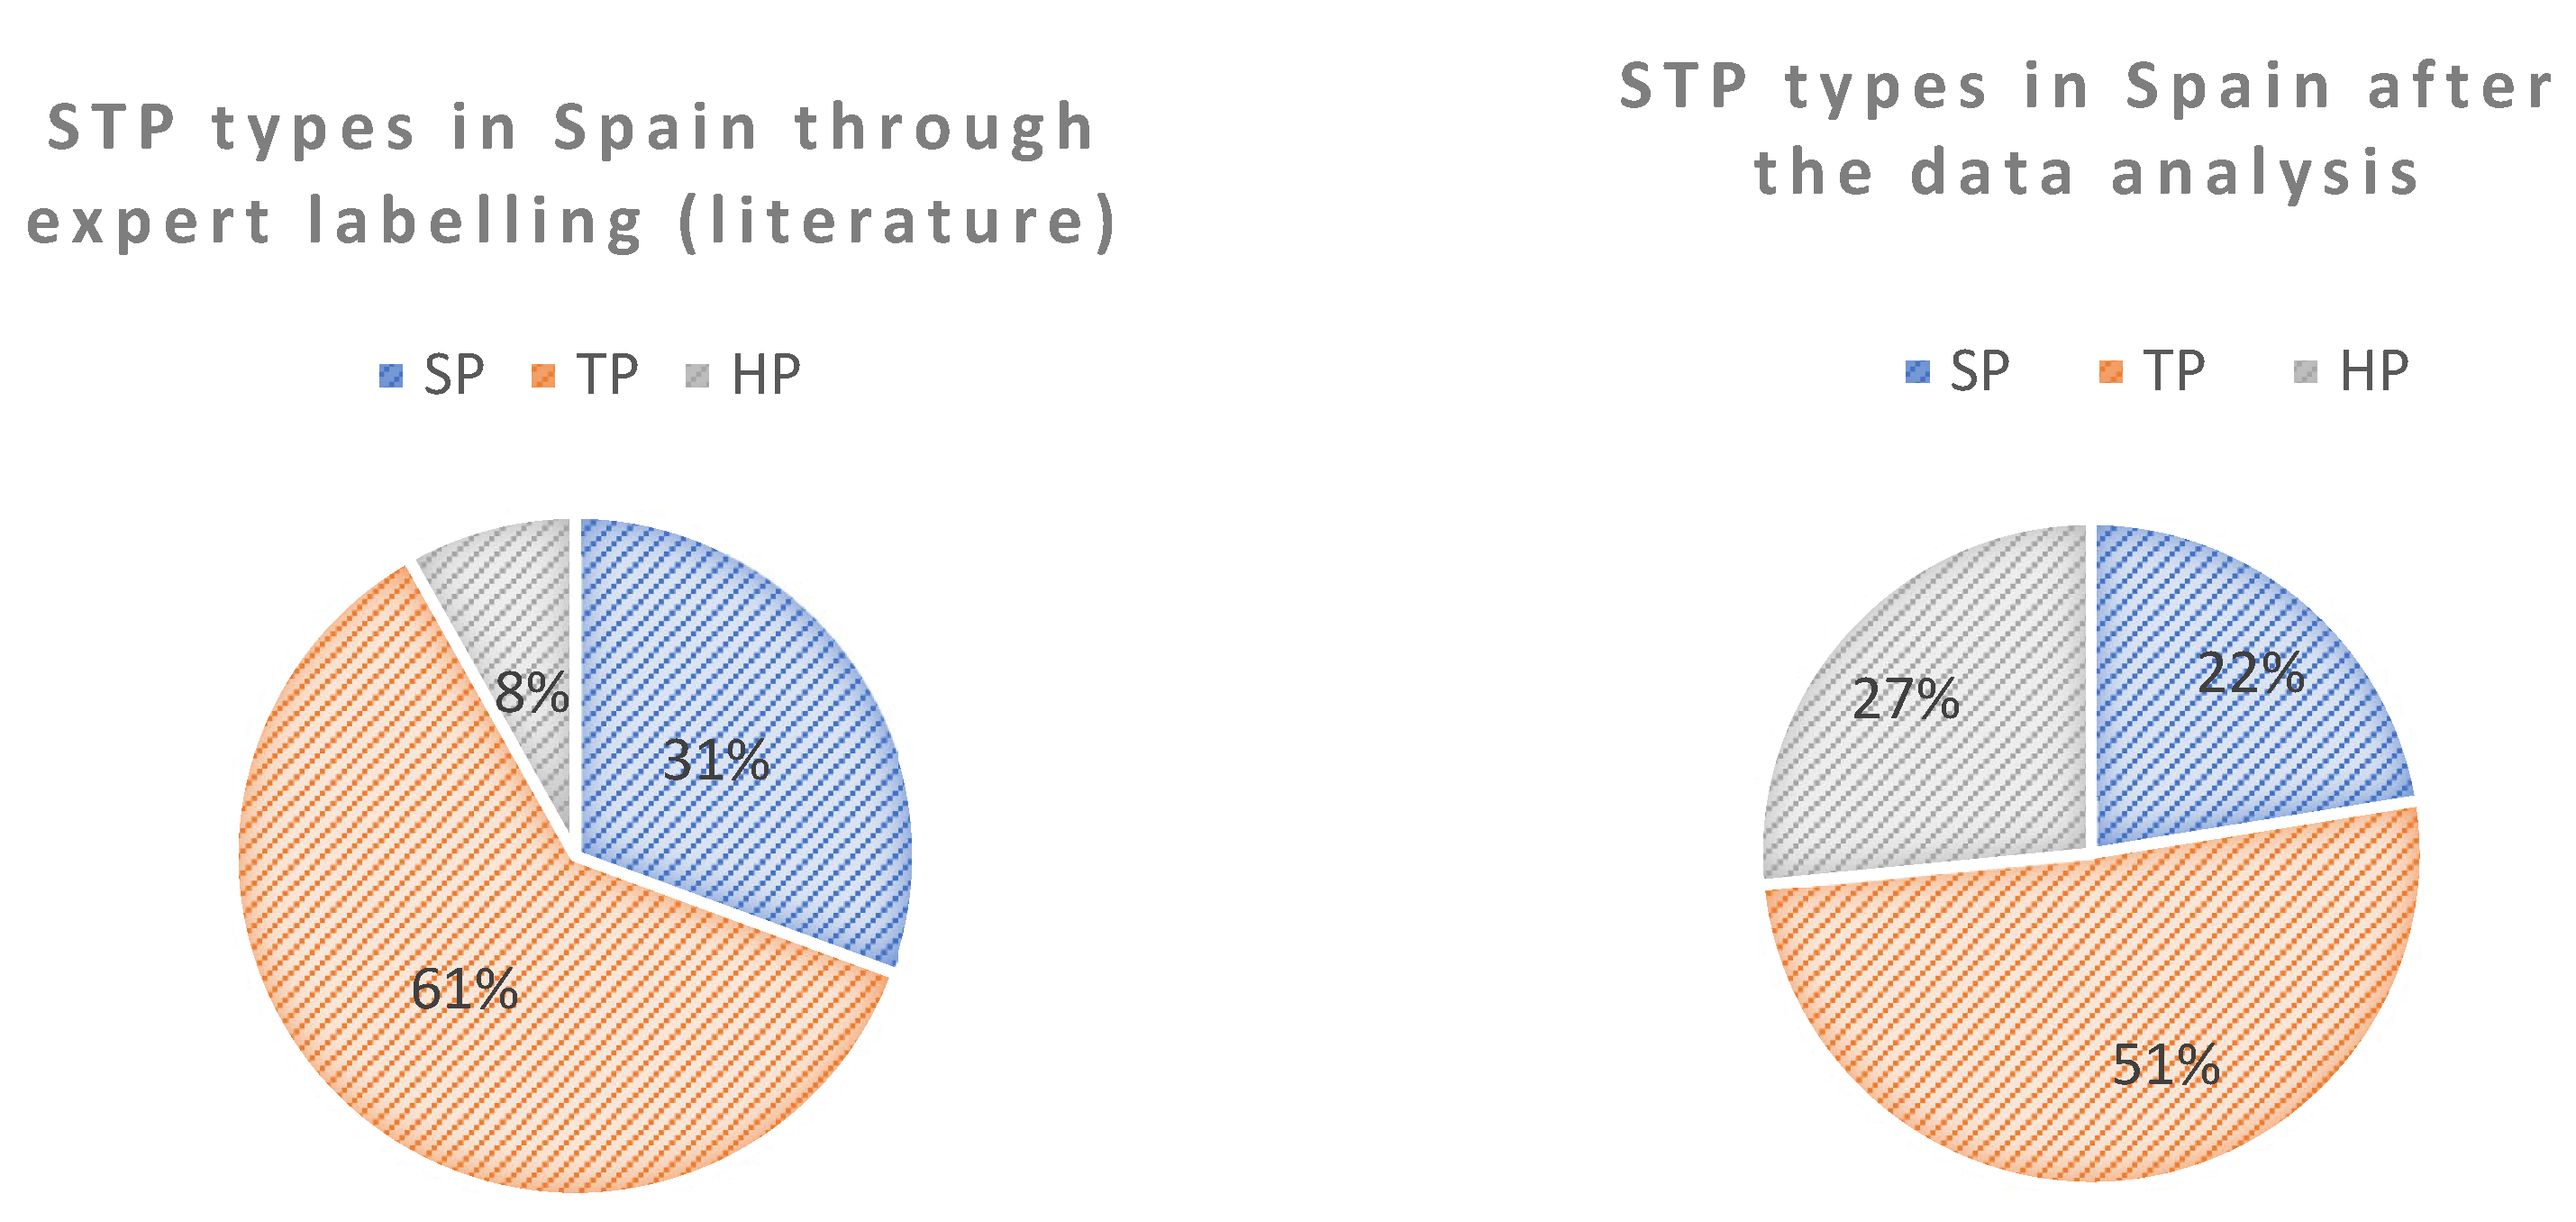
- 11 SPs, representing 73% of the initial sample of 15 SPs;
- 25 TPs, representing 86% of the initial sample of 29 TPs;
- 13 HPs, representing 100% of the initial sample of 4 HPs, plus 4 SPs with behaviour like the TP type, plus 5 TPs with behaviour like the SP type. Finally, there are three times the amount of HPs compared to the original sample.
- SO3: To know the main and typical features of the different types of STPs.
- The typical Spanish SP presents a surface area (Fe03) under 200,000 m2, the incubation ratio > 0.14 being the reference average of 0.34. The innovative profile 1 (Fe18) is the most significant feature and is over 0.46, which is the benchmark value. The typical average Spanish SP case has a turnover (Fe05) of 94 million € and around 1000 employees (Fe06).
- The typical Spanish TP presents a surface area (Fe03) over 200,000 m2 and an innovative profile 1 (Fe18) less than 0.46, with the benchmark average at 0.16. Typically, the representative value of the incubation ratio is 0.1. The typical average Spanish TP case presents an annual turnover (Fe05) of 1170 million € and around 4500 employees (Fe06).
6. Conclusions
- The exploratory and a critical analysis presented in this study deepens the understanding of STPs. The methodology used is effective for achieving this goal. The previously developed STP dataset and the dashboard tool enable the data analysis and the visualisation of the techniques applied as an integrated tool to better analyse STPs.
- It is possible to establish a clear taxonomy of the two main groups, science parks and technology parks, based on their intrinsic features.
- A third expanded group of hybrid parks should be considered to include projects that not only have university and the governmental sector involvement, but also other outliers that cannot be strictly grouped as an SP or TP.
- The typical core features of the SPs and TPs of the Spanish use case have been obtained. SPs are more oriented toward R&D, innovation, and incubation, while TPs present higher values in size, employment, and turnover, for example.
- Relevant differences are clearly detectable in TPs, where a relevant subgroup of “big TPs” can be observed with very remarkable values in terms of turnover and number of employees.
- The descriptive and data analysis presented in this work enable greater accuracy in the classification of STP types.
- It is possible to predict the STP type and the distance from the “prototype STP” for each group, which could assist in STP management and decision making.
Author Contributions
Funding
Institutional Review Board Statement
Informed Consent Statement
Data Availability Statement
Conflicts of Interest
References
- Sanz, L. Los Parques Científicos como espacios multidisciplinares. Encuentros Multidiscip. 2011, 13, 2–9. [Google Scholar]
- Francés, O.; Fernández, J.; Abreu, J.; Gutiérrez, Y.; Palomar, M. How to build a standardised dataset for Science and Technology Parks from heterogenous sources. Data Knowl. Eng. 2023; under review. [Google Scholar]
- Francés, O.; Abreu, J.; Gutiérrez, Y.; Fernández, J.; Palomar, M. PCT Observer Tablero de Parques Científicos/Tecnológicos. 2021. Available online: https://rua.ua.es/dspace/handle/10045/122837 (accessed on 31 October 2023).
- Brunner, E.; Munzel, U. The nonparametric Behrens-Fisher problem: Asymptotic theory and a small-sample approximation. Biom. J. J. Math. Methods Biosci. 2000, 42, 17–25. [Google Scholar] [CrossRef]
- McArdle, J.J. Exploratory data mining using decision trees in the behavioral sciences. In Contemporary Issues in Exploratory Data Mining in the Behavioral Sciences; Routledge: London, UK, 2013; pp. 25–69. [Google Scholar] [CrossRef]
- Hennessy, E.A.; Finch, A.J. Adolescent recovery capital and recovery high school attendance: An exploratory data mining approach. Psychol. Addict. Behav. 2019, 33, 669. [Google Scholar] [CrossRef] [PubMed]
- Bishop, C.M.; Nasrabadi, N.M. Pattern Recognition and Machine Learning; Springer: New York, NY, USA, 2006; Volume 4, p. 738. [Google Scholar]
- He, Z.; Wu, Z.; Xu, G.; Liu, Y.; Zou, Q. Decision tree for Sequences. IEEE Trans. Knowl. Data Eng. 2021, 35, 251–263. [Google Scholar] [CrossRef]
- Liu, J.; Feng, W.; Zhang, Y.; He, F. Improvement of PBFT Algorithm Based on CART. Electronics 2023, 12, 1460. [Google Scholar] [CrossRef]
- Li, X.; Yi, S.; Cundy, A.B.; Chen, W. Sustainable decision-making for contaminated site risk management: A decision tree model using machine learning algorithms. J. Clean. Prod. 2022, 371, 133612. [Google Scholar] [CrossRef]
- Motaghifard, A.; Omidvari, M.; Kazemi, A. Forecasting of safe-green buildings using decision tree algorithm: Data mining approach. Environ. Dev. Sustain. 2023, 25, 10323–10350. [Google Scholar] [CrossRef]
- Li, M.; Frank, E.; Pfahringer, B. Large scale K-means clustering using GPUs. Data Min. Knowl. Discov. 2023, 37, 67–109. [Google Scholar] [CrossRef]
- Nie, F.; Li, Z.; Wang, R.; Li, X. An effective and efficient algorithm for K-means clustering with new formulation. IEEE Trans. Knowl. Data Eng. 2022, 35, 3433–3443. [Google Scholar] [CrossRef]
- Zhao, X.; Nie, F.; Wang, R.; Li, X. Robust fuzzy k-means clustering with shrunk patterns learning. IEEE Trans. Knowl. Data Eng. 2021, 35, 3001–3013. [Google Scholar] [CrossRef]
- Bhopale, A.; Zanwar, S.; Balpande, A.; Kazi, J. Optimised Clustering Based Approach for Healthcare Data Analytics. Int. J. Next-Gener. Comput. 2023, 14. [Google Scholar] [CrossRef]
- Kadali, D.K.; Mohan, R.N.V.; Padhy, N.; Satapathy, S.; Salimath, N.; Sah, R.D. Machine learning approach for corona virus disease extrapolation: A case study. Int. J. Knowl. Based Intell. Eng. Syst. 2022, 26, 219–227. [Google Scholar] [CrossRef]
- Li, Y.; Zhou, X.; Gu, J.; Guo, K.; Deng, W. A Novel K-Means Clustering Method for Locating Urban Hotspots Based on Hybrid Heuristic Initialization. Appl. Sci. 2022, 12, 8047. [Google Scholar] [CrossRef]
- Albahari, A.; Catalano, G.; Landoni, P. Evaluation of national Science Park systems: A theoretical framework and its application to the Italian and Spanish systems. Technol. Anal. Strateg. Manag. 2013, 25, 599–614. [Google Scholar] [CrossRef]
- Rousseeuw, P. Silhouettes: A Graphical Aid to the Interpretation and Validation of Cluster Analysis. J. Comput. Appl. Math. 1987, 20, 53–65. [Google Scholar] [CrossRef]
- Albahari, A.; Barge-Gil, A.; Pérez-Canto, S.; Modrego, A. Technology parks versus science parks: Does the university make the difference? Technol. Forecast. Soc. Change 2017, 116, 13–28. [Google Scholar] [CrossRef]
- Liberati, D.; Marinucci, M.; Tanzi, G.M. Science and technology parks in Italy: Main features and analysis of their effects on the firms hosted. J. Technol. Transf. 2015, 41, 694–729. [Google Scholar] [CrossRef]
- Siegel, D.S.; Westhead, P.; Wright, M. Assessing the impact of university science parks on research productivity: Exploratory firm-level evidence from the United Kingdom. Int. J. Ind. Organ. 2003, 21, 1357–1369. [Google Scholar] [CrossRef]
- Link, A.N.; Scott, J.T. The economics of university research parks. Oxf. Rev. Econ. Policy 2007, 23, 661–674. [Google Scholar] [CrossRef]
- Francés, O.; Abreu, J.; Gutiérrez, Y.; Palomar, M. Estado de los Parques Tecnológicos en Argentina y estudio comparativo con la situación española. In Proceedings of the XX Congreso Latino-Iberoamericano de Gestión Tecnológica y de la Innovación ALTEC 2023, Paraná, Argentina, 22 September 2023. [Google Scholar]


| Type of STP | Definition |
|---|---|
| Science Park (SP) | STP promoted, owned, and managed wholly or partly by universities (or higher education institutions or research institutions) where the university plays a central role in the SP dynamics, and controls and substantially influences the performance of the SP. |
| Technology Park (TP) | STP where the university does not hold a central role in the dynamics and decision making of the STP; even when the university holds some shares in the STP, it signs “soft” collaboration agreements or shares the location with the STP. In conclusion, control and influence in the STP depend on a driver other than the university. |
| Hybrid Park (HP) | STP with an equitable and balanced control and influence of both the university and other drivers (typically regional government, private sector, etc.). It is not possible to discern a priori whether the model is closer to science or technology parks. |
| Internal Key Factor | Core Feature | Definition | Source of Information | |
|---|---|---|---|---|
| F5. STP promotors | Aggregating feature | Fe01. Type of STP | STP model according to Table 1 and author’s expertise. Promotors, STP ownership, management, and university linkage are considered in this classification. | Expert labelling |
| F6. STP management | ||||
| F7. University/STP interactions | ||||
| F8. STP age | Individual features | Fe02. STP age | STP years in operation. | Primary sources |
| F9. STP size | Fe03. STP size | Total surface area of the STP (m2). | Primary sources | |
| F12. Number of companies | Fe04. Companies | Total population of companies in the STP. | Primary sources | |
| F13. Revenue | Fe05. Turnover | Total amount of the cost of goods or services billed by the entities of an STP during a year (in millions of €). | Primary sources | |
| F14. Employees in companies | Fe06. Employment | Total employees in the companies of the STP. | Primary sources | |
| F15. Company profile | Complementary features | Fe07. International companies | Number of STP firms in which more than 10% of the capital is owned by a foreign company or is a branch or subsidiary of a foreign company. | Primary sources |
| Fe08. Incubated companies | Number of companies less than 3 years old incubated at the STP. | Primary sources | ||
| Fe09. Average company size 1 | =Fe06/Fe04 | Knowledge features | ||
| Fe10. Average company size 2 | =Fe05/Fe04 | Knowledge features | ||
| Fe11. Internationalisation | =Fe07/Fe04 | Knowledge features | ||
| Fe12. Productivity | =Fe05/Fe06 | Knowledge features | ||
| Fe13. Incubation ratio | =Fe08/Fe04 | Knowledge features | ||
| F16. R&I | Fe14. Employment R&D | Employees dedicated to R&D activities in the companies of the STP. | Primary sources | |
| Fe15. Investment R&D | Expenditure on R&D made by the STP companies (in millions of €). | Primary sources | ||
| Fe16. Filed patents | National patents filed by the STP entities on a yearly basis. | Primary sources | ||
| Fe17. Granted patents | National patents granted to the STP entities on a yearly basis. | Primary sources | ||
| Fe18. Innovative profile 1 | =Fe14/Fe06 | Knowledge features | ||
| Fe19. Innovative profile 2 | =Fe15/Fe05 | Knowledge features | ||
| Fe20. Patents ratio 1 | =Fe16/Fe04 | Knowledge features | ||
| Fe21. Patents ratio 2 | =Fe17/Fe04 | Knowledge features | ||
| Core Feature | Substantial Difference between SP and TP | Core Feature | Substantial Difference between SP and TP |
|---|---|---|---|
| Fe02. STP age | SP < TP | Fe12. Productivity | SP < TP |
| Fe03. STP size | SP < TP and SP < HP | Fe13. Incubation ratio | TP < SP |
| Fe04. Companies | SP < TP | Fe14. Employment R&D | NO |
| Fe05. Turnover | SP < TP | Fe15. Investment R&D | SP < TP |
| Fe06. Employment | SP < TP and SP < HP | Fe16. Filed patents | NO |
| Fe07. International companies | NO | Fe17. Granted patents | NO |
| Fe08. Incubated companies | NO | Fe18. Innovative profile 1 | TP < SP |
| Fe09. Average company size 1 | SP < TP | Fe19. Innovative profile 2 | TP < HP |
| Fe10. Average company size 2 | SP < TP and SP < HP | Fe20. Patents ratio 1 | NO |
| Fe11. Internationalisation | NO | Fe21. Patents ratio 2 | NO |
| Core Features Considered | K | |||||||||||||||||||||||||||||
|---|---|---|---|---|---|---|---|---|---|---|---|---|---|---|---|---|---|---|---|---|---|---|---|---|---|---|---|---|---|---|
| # | Fe01 | Fe02 | Fe03 | Fe04 | Fe05 | Fe06 | Fe07 | Fe08 | Fe09 | Fe10 | Fe11 | Fe12 | Fe13 | Fe14 | Fe15 | Fe16 | Fe17 | Fe18 | Fe19 | Fe20 | Fe21 | 2 | 3 | 4 | 5 | 6 | 7 | 8 | 9 | 10 |
| 1 | 0.30 | 0.28 | 0.22 | 0.22 | 0.21 | 0.22 | 0.23 | 0.20 | 0.19 | |||||||||||||||||||||
| 2 | 0.30 | 0.31 | 0.31 | 0.26 | 0.28 | 0.27 | 0.30 | 0.26 | 0.23 | |||||||||||||||||||||
| 3 | 0.30 | 0.28 | 0.32 | 0.34 | 0.34 | 0.32 | 0.31 | 0.34 | 0.37 | |||||||||||||||||||||
| 4 | 0.80 | 0.72 | 0.72 | 0.61 | 0.62 | 0.58 | 0.59 | 0.57 | 0.54 | |||||||||||||||||||||
| 5 | 0.50 | 0.56 | 0.57 | 0.44 | 0.39 | 0.35 | 0.37 | 0.37 | 0.41 | |||||||||||||||||||||
Disclaimer/Publisher’s Note: The statements, opinions and data contained in all publications are solely those of the individual author(s) and contributor(s) and not of MDPI and/or the editor(s). MDPI and/or the editor(s) disclaim responsibility for any injury to people or property resulting from any ideas, methods, instructions or products referred to in the content. |
© 2023 by the authors. Licensee MDPI, Basel, Switzerland. This article is an open access article distributed under the terms and conditions of the Creative Commons Attribution (CC BY) license (https://creativecommons.org/licenses/by/4.0/).
Share and Cite
Francés, O.; Abreu-Salas, J.; Fernández, J.; Gutiérrez, Y.; Palomar, M. Multidimensional Data Analysis for Enhancing In-Depth Knowledge on the Characteristics of Science and Technology Parks. Appl. Sci. 2023, 13, 12595. https://doi.org/10.3390/app132312595
Francés O, Abreu-Salas J, Fernández J, Gutiérrez Y, Palomar M. Multidimensional Data Analysis for Enhancing In-Depth Knowledge on the Characteristics of Science and Technology Parks. Applied Sciences. 2023; 13(23):12595. https://doi.org/10.3390/app132312595
Chicago/Turabian StyleFrancés, Olga, José Abreu-Salas, Javi Fernández, Yoan Gutiérrez, and Manuel Palomar. 2023. "Multidimensional Data Analysis for Enhancing In-Depth Knowledge on the Characteristics of Science and Technology Parks" Applied Sciences 13, no. 23: 12595. https://doi.org/10.3390/app132312595
APA StyleFrancés, O., Abreu-Salas, J., Fernández, J., Gutiérrez, Y., & Palomar, M. (2023). Multidimensional Data Analysis for Enhancing In-Depth Knowledge on the Characteristics of Science and Technology Parks. Applied Sciences, 13(23), 12595. https://doi.org/10.3390/app132312595