Article

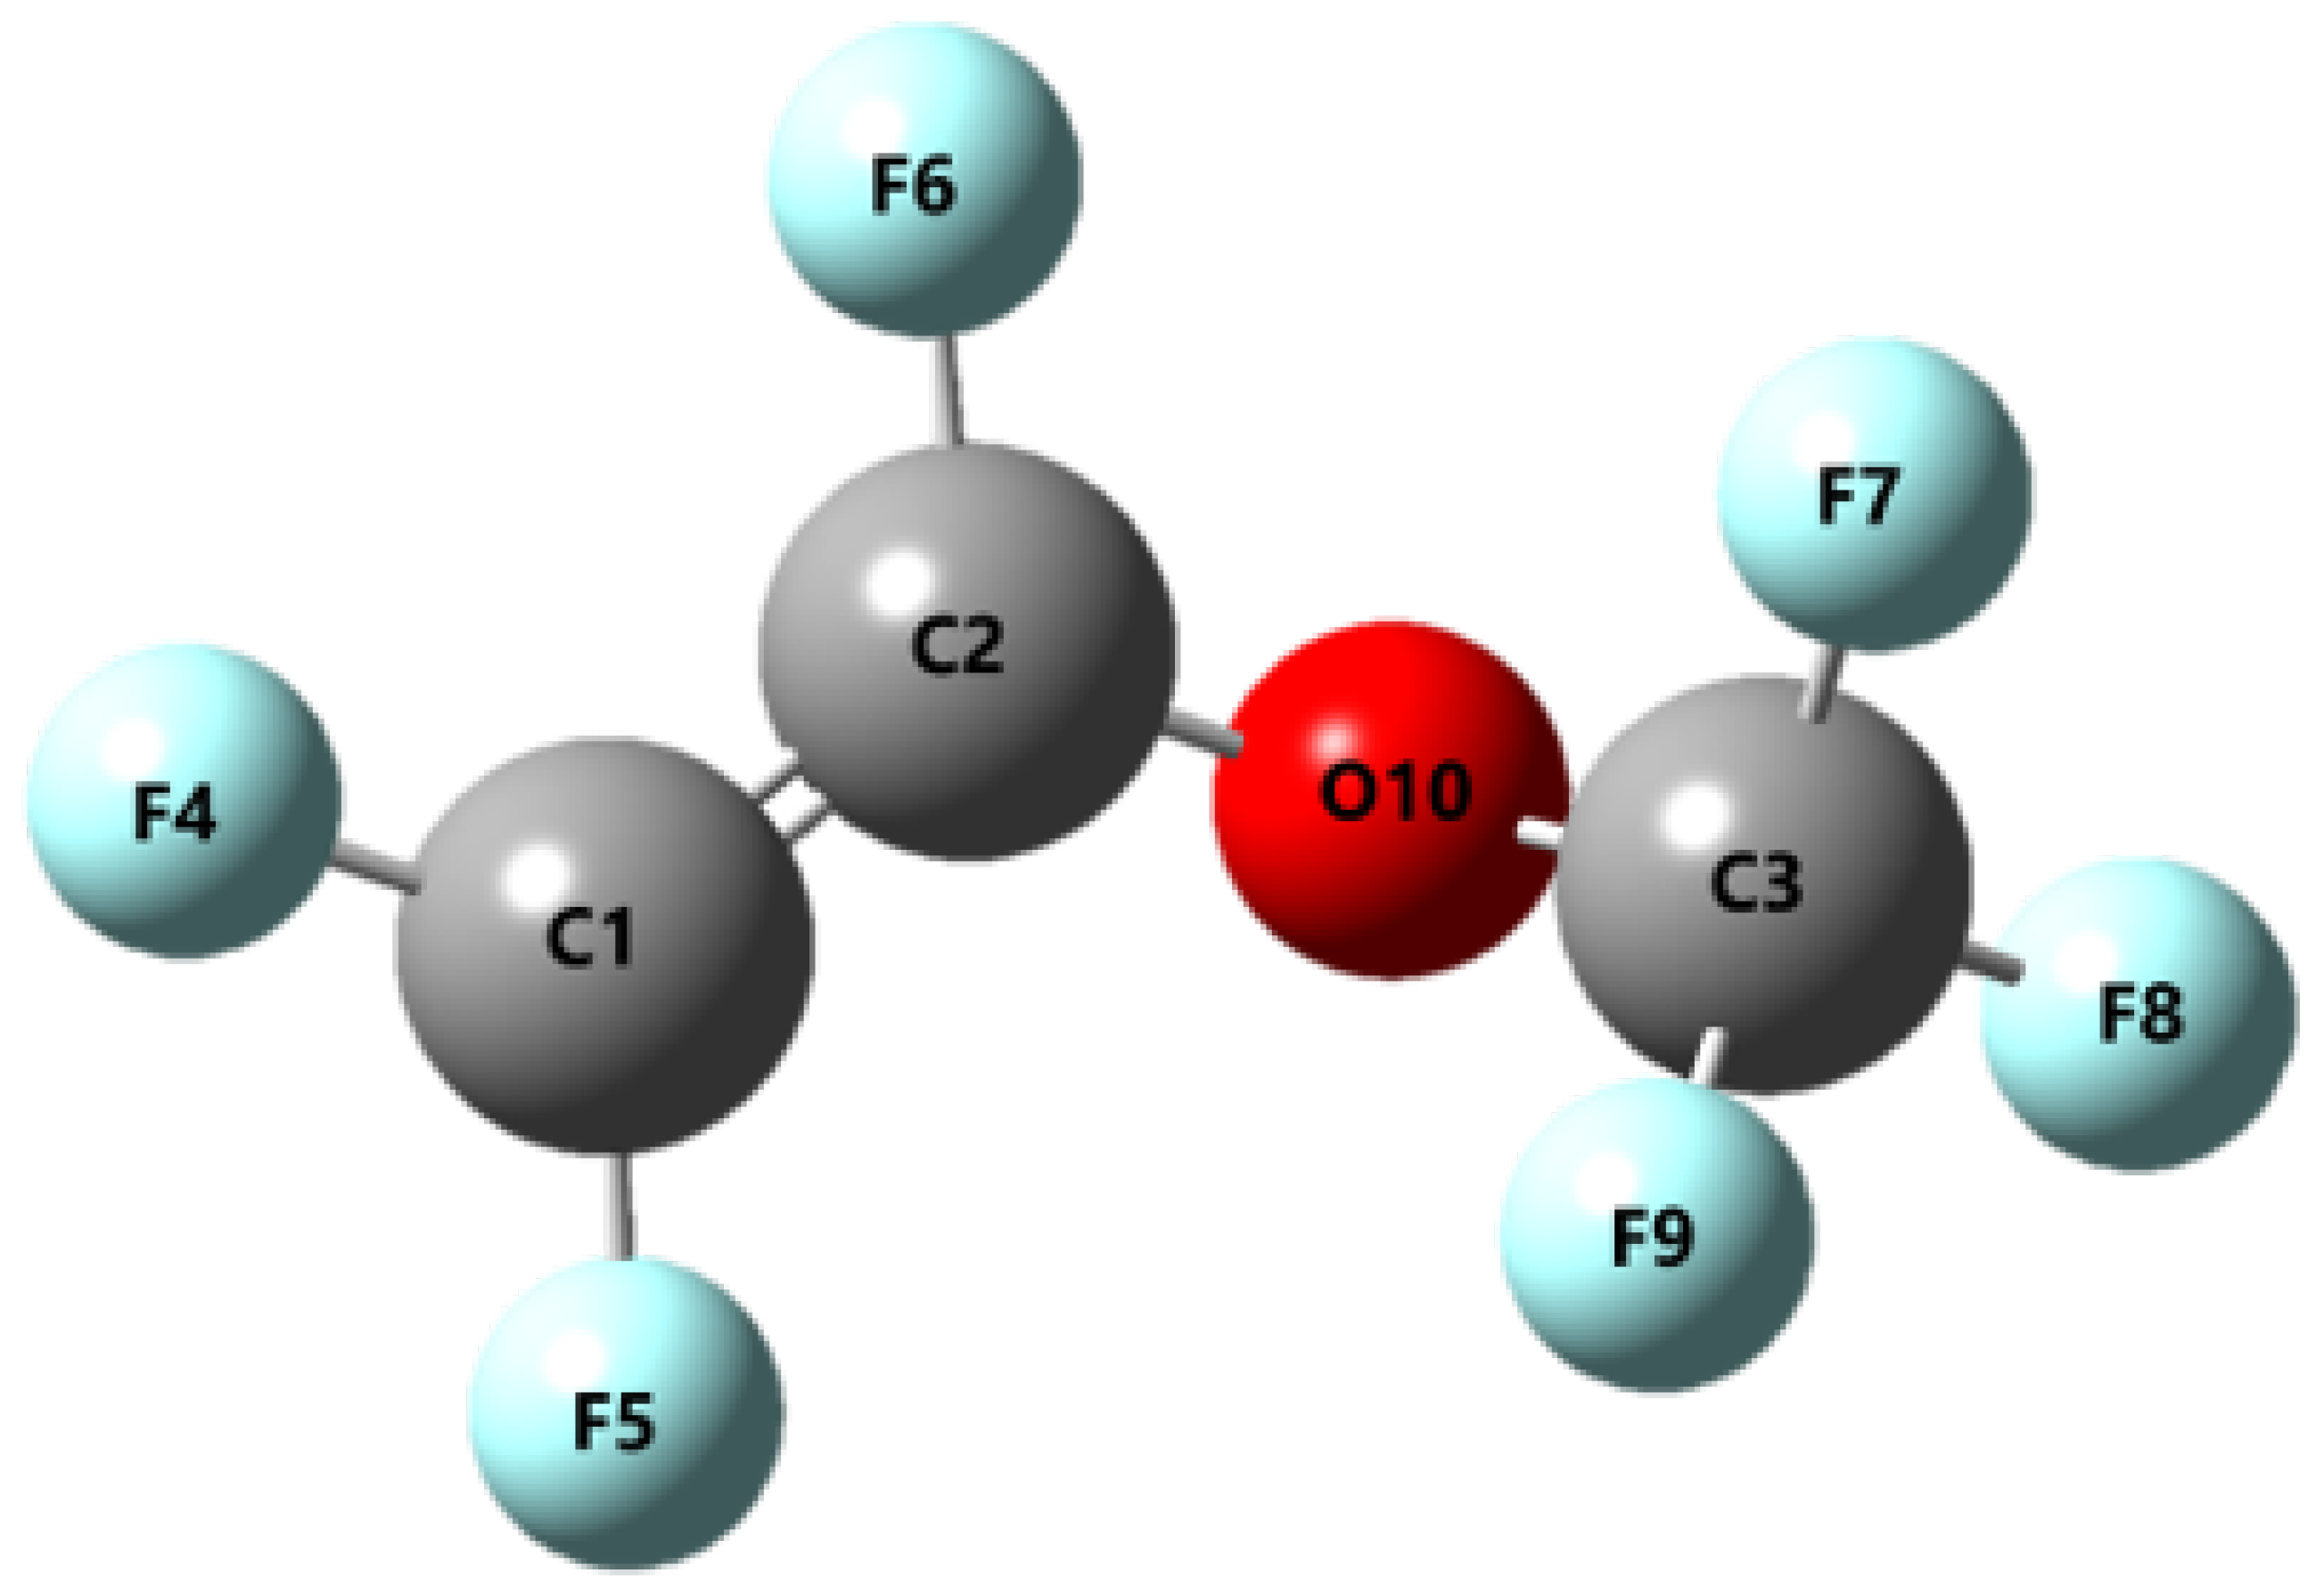
Electron Impact Cross Sections and Transport Studies of C3F6O

1
Division of Plasma Convergence Research, Korea Institute of Fusion Energy, 37 Dongjangsan-ro, Gunsan City 54004, Jeollabuk-do, Republic of Korea
2
Eco-Friendly Power Apparatus Research Center, Korea Electrotechnology Research Institute, 12 Jeongiui-gil, Seongsan-gu, Changwon 51543, Gyeongsangnam-do, Republic of Korea
*
Author to whom correspondence should be addressed.
Appl. Sci. 2023, 13(23), 12612; https://doi.org/10.3390/app132312612
Submission received: 30 October 2023 / Revised: 17 November 2023 / Accepted: 21 November 2023 / Published: 23 November 2023

Abstract

:
Electron impact scattering from C 3 F 6 O is studied in this work. The R-matrix method was used for the calculations of elastic, momentum transfer, and excitation cross sections. The attachment cross section was obtained through a parametric estimator based on the R-matrix outputs. The Binary-Encounter-Bethe (BEB) method was used for computing the ionization cross section. The obtained cross section set was used for the transport studies using the BOLSIG+ code, which is a two-term Boltzmann equation solver. The present calculation was performed for steady-state Townsend experimental conditions for E/N, covering a range of 100–1000 Td. The critical dielectric strength of pure C 3 F 6 O was found to be 475 Td, which is much greater than that of SF 6 (355 Td). The effect of the addition of different buffer gases, such as CO 2 , N 2 , and O 2 , was also examined. For the C 3 F 6 O–CO 2 , C 3 F 6 O–N 2 , and C 3 F 6 O–O 2 mixtures with 65%, 55%, and 60% C 3 F 6 O, respectively, the critical dielectric strength was determined to be essentially the same as that of pure SF 6 . The presence of synergism was confirmed for these gas mixtures. We further derived the Paschen curve using a fitting method with the transport parameters as the basic inputs. The minimum breakdown voltage of C 3 F 6 O accounted for only 55% of that of SF 6 . The buffer gas mixture improved the condition; however, the performance of CO 2 and O 2 mixtures was not satisfactory. The addition of N 2 as the buffer gas significantly improved the breakdown property of the gas. The mixture of ≥99% of N 2 or ≤1% of C 3 F 6 O gave a better breakdown characteristic than SF 6 . Any proportion ≥90% of N 2 or ≤10% of C 3 F 6 O was suitable in the higher pressure ranges. The present work demonstrates the potential of C 3 F 6 O as a substitute gas for SF 6 with a negligible environmental threat.

1. Introduction

In recent years, we have been looking for stable gases with good insulating and breakdown characteristics in light of the replacement of SF 6 in various plasma applications [1,2,3]. SF 6 , as a strong greenhouse gas, represents a significant environmental threat. It also produces some toxic products as a consequence of its decomposition [3]. Thus, we aimed to identify an environmentally friendly gas with a better, or at least similar, insulation performance as that of SF 6 . The evaluation indices of alternative gases that indicate good properties are a high breakdown voltage, a high critical field strength, a positive synergistic effect, a low electron drift velocity, a low diffusion coefficient, a low ionization coefficient, and a high attachment coefficient. Further, the toxicity of decomposition products should also be low as should the low global warming potential (GWP).
In our recent work [4], we conducted a quantum chemistry study on perfluoro-methyl-vinyl-ether (PMVE), C 3 F 6 O, with a GWP of 0.004 [5], see Figure 1. The ionization energy, electron affinity, and band gap suggest that the gas has good electron-absorbing properties and is chemically stable. Further, most of the decomposition and recombination products are nontoxic. Encouraged by the results, we analyzed the electron transport properties of PMVE. Our main aim was to estimate the Townsend coefficients to obtain the dielectric strength of the pure gas. Moreover, it is known that gas mixtures can be used to minimize the negative environmental impact and maximize the dielectric strength. The liquefaction temperature of PMVE is −22 °C [6]. If a lesser liquefaction temperature is needed, the pure gas must be mixed with buffer gases. We selected the most commonly used buffer gases—CO 2 , O 2 , and N 2 —for our analysis. Finding the optimal mixture ratio for the buffer gas is also very important. For the dielectric strength of a gas mixture, the synergistic effect [7] is usually used to evaluate and optimize the choice of gases in the mixture and the mixed ratio.
The determination of Townsend coefficients, dielectric strengths, and the study of synergistic effect requires a transport study. For this task, we solved the electron Boltzmann equation using two-term approximation using BOLSIG+ [8]. Further, this method does not directly give the breakdown voltage. We performed a fitting of the ionization coefficients to plot the breakdown voltage curve and estimate the minimum breakdown voltage [9,10]. As mentioned earlier, any replacement gas should have a higher dielectric strength and breakdown voltage. Buffer gases can again be of great help to obtain an optimal value of both these important properties.
At the heart of transport studies lies the accurate determination of scattering cross sections. In the literature, we found only one recent article dedicated to the cross section measurement of PMVE in the intermediate energy range [11]. The authors report the total scattering cross section in the energy range 15–90 eV. However, we needed a complete cross section set for electron-PMVE scattering. Owing to the lack of such studies in the past, we computed the cross sections using the Quantemol-EC (QEC) software [12]. QEC is based on the well-known R-matrix method [13]. R-matrix provides a reliable dataset in the low-energy region. We obtained elastic, momentum transfer, electronic excitation, rotational excitation, and attachment cross sections. These low-energy cross sections were linearly extrapolated to higher energies using the transport codes. For the ionization cross section, we used the binary-encounter-Bethe (BEB) method [14], which extends from the low to high energy range. This work is the first report of the low-energy cross section and transport parameters of PMVE. The cross sections are reported for an energy range of 1–15 eV and the transport study was performed over the density-normalized electric field strength E/N, between 100 and 1000 Td. The methods adopted for the present work are described in the subsequent section. Following this section, we present our results and discuss the applicability of PMVE as an SF 6 replacement gas. Finally, we conclude our findings in Section 3.

2. Calculation Methods

2.1. Electron Impact Cross Section Calculation

In this section, we outline the methods utilized for the cross section calculation. The R-matrix is a powerful method to study low-energy electron-molecule scattering. Here, we provide a brief overview of the approach. The method is fundamentally based on the division of the configuration space into an inner and outer region. The inner region accommodates the entire N target electron wave function. Due to the indistinguishability of the target and scattering electron, the e e correlation and exchange interaction becomes important and makes the inner region problem complicated. The complex problem in the inner region is solved and propagated to the outer region for the calculation of cross sections. In the outer region, the exchange and correlation effects are negligible, and only a long-range multipolar interaction between the scattering electron and the target states is included, which makes the problem simpler.
The R-matrix serves as a connection between the two areas. Once the R-matrix at the boundary is established, the wave function in the outer area can be determined by extending the R-matrix from the boundary of the two areas to infinity. In the asymptotic limit, the solution consists of various distinct functions that are directly influenced by the coefficients K i j related to the K-matrix. The K-matrix is diagonalized to calculate the sum of eigenphases, which is utilized to determine the location and size of the resonances. Finally, the scattering matrix S is obtained from the K-matrix by means of the following transformation:
S = 1 + i K 1 i K
The T-matrix is then obtained from this S-matrix by the relation
T = S 1
Thus, the K-matrix is used to obtain T-matrices using the definition
T = 2 i K 1 i K
This T matrix is then used to obtain the integral cross sections. A detailed overview of the method can be found in the reference papers [12,13]. The fixed nuclei (FN) T-matrices are used to determine rotational state-to-state cross sections for low partial waves up to l = 4. For dipole-forbidden transitions with J > 1, the cross sections quickly converge. However, for dipole-allowed transitions (J = 1), the FN approximation is not suitable owing to the long-range electron-dipole interaction. To tackle this situation, Born approximation is used to determine the cross sections for l > 4. These cross sections then estimate the contribution of partial waves up to l = 4 through a top-up procedure to achieve reliable outcomes [15]. Considering the nonpolar nature of the present target, contributions from lower partial waves were sufficient to obtain reliable cross sections.
QEC implemented three scattering models for the calculations: static exchange (SE), static exchange polarization (SEP), and close coupling (CC). The QEC manual recommends the usage of the SEP method for elastic, momentum transfer, rotational excitation, and dissociative electron attachment (DEA) cross sections. The CC method is used for electronic excitation cross sections. The dissociative electron attachment (DEA) is investigated through a semi-quantitative estimate, which uses the resonance information from the R-matrix results. The DEA cross section directly depends on the resonance cross section. This resonance cross section, in turn, requires the Breit–Wigner cross section, which depends on the resonance width and potential. In QEC, the Morse potential is used as the interatomic interaction potential. Further details can be found in [16]. Considering the bigger size of the present molecule, convergence of the cross sections was a concern. In this context, a DEA calculation was performed with an R-matrix sphere of 10 a 0 . Further, SEP and CC calculations were performed with an R-matrix radius of 12 a 0 and 14 a 0 , respectively.
The QEC software also computes the electronic excitation and ionization cross section. Here, we outline the Bef method [17], which is used for the electronic excitation process. The plane wave Born (PWB) approximation is used as the starting point in the Bef scaling. The first-order PWB cross section for inelastic collision is given as
σ P W B = 4 π a 0 2 R T F P W B ( T )
where a 0 is the Bohr radius, R is the Rydberg energy, and T is the incident energy. F P W B ( T ) is the collision strength. Nevertheless, this approach does not account for electron exchange effects, the distortion of plane waves near the target, or the target polarization in the presence of the incident electron. To overcome these shortcomings, BE scaling was performed.
σ B E = T T + B + E σ P W B
where B and E are the binding energy of the excited electron and the excitation energy, respectively. This scaling reduces the cross section in the low-energy region and also improves the peak value when compared to the experiments. In this way, the effective incident energy as seen by the target electron improves the drawbacks of the PWB method. Further, the accuracy of the PWB cross sections mainly depends on the correct wave function description. To address a poor wave function in the calculation, dipole oscillator strengths, which are commonly known as optical oscillator strengths (OOS), can be used. We refer to the OOS values as the f values here. When accurate OOSs are available, the PWB cross sections derived from poor wave function can be improved.
σ f = f a c c u f P W B σ P W B
The two scalings, when combined, give us the Bef scaled cross sections.
σ B e f = f a c c u f P W B σ B E
Kim and Rudd introduced the binary-encounter-Bethe (BEB) method to predict the total ionization cross section for ejecting one electron from each orbital [14]. This model combines the dipole part of the Bethe cross section for high energy with the Mott cross section for low energy. The dipole interaction between the incident and ionized electrons is described by the former, while the latter represents close collisions with small impact parameters. The BEB method proved to be highly successful in accurately determining the total ionization cross section and exhibited good agreement with the experimental results. The formula for the total ionization cross section for an orbital according to BEB is provided below.
σ B E B = S t + u + 1 [ l n t 2 ( 1 1 t 2 ) + 1 1 t l n t t + 1 ]
Here, S = 4 π a 0 2 N ( R / B ) 2 ; t = T B , u = U B .
The variables in the equation are defined as follows: T represents the incident energy, U represents the kinetic energy of the electron on a molecular orbital, and B represents the binding energy of the electron. The occupational number is denoted by N, the Rydberg energy by R, and the Bohr radius by a 0 . These parameters can be determined easily using quantum chemistry tools, such as the GAUSSIAN 09 software (Revision D.01) [18], with density functional theory (DFT) and the ω B97X-D functional. DFT is a reliable and powerful approach for obtaining accurate energetics in molecular systems. Once the cross section for each orbital was obtained using Equation (8), they were summed to calculate the total ionization cross section for the given molecular target.

2.2. Transport Studies

To analyze the swarm transport properties, the Boltzmann equation (BE) was solved. BOLSIG+ can be used to solve the BE of electrons in weakly ionized gas in a uniform electric field [8]. The interactive behavior of electrons in the ionized gas is represented by Boltzmann integro-differential transport
d f d t + v . Δ f e m E . Δ v f = C [ f ]
where f is the electron energy distribution function (EEDF) in six-dimensional phase space. e and m are the elementary charge and mass of the electron. Further, E is the electric field, v is the velocity, and Δ v represents the velocity gradient operator. C is the rate of change of f due to elastic and inelastic collisions. Solving the above equation gave us the EEDF, which was then used to derive the ionization and attachment coefficients. BOLSIG+ provided us the density-reduced coefficients. The Townsend ionization coefficient ( α N ) represents the total number of electrons created per unit length and the Townsend attachment coefficient ( η N ) is defined as the total number of electrons lost per unit length. The critical field is obtained at the point where these two coefficients become equal. The BOLSIG+ also provided us with various other swarm data apart from the Townsend coefficients, such as the mean energy ( ϵ ) and mobility ( μ ). To obtain the drift velocity ( v d ), we used the electron mobility data and applied the following fundamental relation:
v d = μ E
To initiate the BOLSIG+ calculation, input parameters, such as gas temperature, excitation temperature, and plasma density, were provided. The software utilized these parameters along with cross sections for extrapolation at high energy and interpolation within the range. In regions below the threshold energy, the inelastic cross sections were assumed to be zero. For our computation, we utilized a gas temperature and excitation temperature of 300 K, along with a plasma density of 10 19 per m 3 .

2.3. Buffer Gas Mixtures

In this section, we describe the approach used to study the effect of adding buffer gases to pure gas. We analyzed the effect on the dielectric strength and the breakdown voltage. The former was examined using the synergistic effect and the latter using the Paschen curve. When two gases are mixed and if the mixture follows the synergistic phenomena, then the dielectric strength of the gas mixture is higher than the value obtained by the linear interpolation of the two pure gases. We used the following synergistic effect coefficient to present this nonlinear characteristic of the gas mixture [7]:
h = ( E / N ) c r i t , m i x k ( E / N ) c r i t , 1 1
where ( E / N ) c r i t , m i x is the critical field of the gas mixture. ( E / N ) c r i t , 1 is the critical electric field for the pure gas 1, which was PMVE in the present case, with k being the molar fraction of PMVE in the gas mixture. There is no synergistic effect if h = 0 , and the critical field of the gas mixture is simply the sum of the critical field of the two pure gases. For h > 0 , the critical field of the gas mixture is larger than the sum of the weighted critical field of the pure gases. Thus, the ( E / N ) c r i t , m i x increases linearly with change in the gas proportions and shows the synergistic effect. The greater the value of h, the more pronounced the synergistic effect. For h < 0 , the critical field of the gas mixture is lower than the sum of the weighted critical field of the pure gases and is termed a negative synergistic effect.
We now present the method used to obtain the breakdown characteristics of the gas mixtures. The ionization coefficient can be expressed as [9]
α N = A e B E / N
where A and B are constants and do not depend on temperature. However, in most of the practical applications, temperature varies; hence, assuming the ideal gas condition p = N k B T , we can write [10]
α p = A e B E / p
The temperature-dependent coefficients A′ and B′ are related to A and B as
A = A k B T , B = B k B T
where k B is the Boltzmann constant and T is the temperature. The BOLSIG+ data for the Townsend ionization coefficient can be used to obtain A and B using a fitting Equation (12) on the data. Once A and B are determined, A′ and B′ can be easily derived.
Now, to predict the Paschen breakdown curve, the breakdown voltage, as a function of the product of pressure (p) and gap length (d) [10], is given as
V b = B ( p d ) l n ( A ( p d ) l n ( 1 + 1 / γ ) )
Moreover, γ is the second Townsend coefficient and is assumed to be 0.1 here. There was no information on its acceptable value and since it appears in the log term, the influence on the final results is not pronounced with its variation. In the following section, we present our results obtained using the methods presented in this section.

3. Results and Discussion

3.1. Electron Impact Cross Section

The study of scattering is the first step to determine the insulating performance of any ionized plasma. The species are randomly moving and are free to interact with each other. This leads to both elastic and inelastic collisions. The elastic collisions are the dominant mechanism for power deposition in the plasma and, hence, momentum transfer cross sections are very important inputs for simulations. The main mechanism behind this momentum transfer is neutral collisions. The inelastic collisions are important for the generation of charged species, which might form the reactive fragments in the plasma. However, in the present case, the fraction of these charged fragments was very low when compared to the neutral parent molecule. Hence, scattering cross sections for neutral PMVE with electrons were those that governed, and interactions including ionized species could be ignored without any loss in the accuracy of simulation results.
The cross section obtained using the methods described in the previous section is shown in Figure 2. The tabulated data is provided in the Supplementary Materials. The cross sections were computed using different basis sets. Since there were no previous data available for low-energy cross sections for PMVE, we compared our DEA cross section with the intensity curve for the generation of OCF 3 . The present peak obtained using the 6–31G basis set matched excellently with the experimental peak at 2.6 eV (please refer to Figure 4 in reference [19]). Hence, we used the cross section obtained using the 6–31 G basis set for transport studies. Our SEP results give a low-energy resonance at 2.9 eV. This can be attributed to the DEA process studied here. The first peak shifted as the first resonance energy changed with different basis sets. The broader peak at energies above 8 eV was due to the excited PMVE and not due to the ground state target.
The ionization cross section obtained using the BEB method shows the typical curve with a maximum around 100–200 eV. The elastic and momentum transfer cross section decreased monotonically as the contribution from various inelastic channels increased. The peak structure in these cross sections is attributed to the resonances, a signature characteristic of low-energy scattering. The excitation cross sections (electronic and rotational) for a number of excited states are also presented in the figure. A total of four electronic excited states and five rotationally excited states were included in the cross section plot. The thresholds for the first four electronically excited states were 5.245, 8.717, 9.397, and 11.013 eV. Among these, the 3 A 1 state was the dominant channel in the low energy. Further, high-energy Bef excitation cross sections are also shown here. Since the Bef cross section was only determined for the singlet state using QEC, we added the low-energy excited state cross section for the two triplet states and extrapolated it for our transport studies. In the case of rotational excitations, in the very low energy region (≤7 eV), the 0 → 1 transition was dominant, and above this energy range, 0 → 4 had the maximum contribution. The contribution from the 0 → 5 transition was negligible throughout the impact energy range.

3.2. Transport Parameters

The drift velocity of SF 6 and C 3 F 6 O is compared in Figure 3. It was computed as the product of mobility and the applied electric field. A smaller drift velocity directly indicates a better gas insulating behavior. Further, electrons interacted strongly with C 3 F 6 O as compared to SF 6 since the former had larger dipole polarizability. Our quantum chemistry work determined a dipole polarizability of 6.996 Å 2 for C 3 F 6 O and the theoretical value for SF 6 was 4.546 Å 2 . Hence, we found that the drift velocity of C 3 F 6 O was twice as small as that of SF 6 and it certainly functions as an alternative for insulating applications.
The gas density normalized diffusion coefficient (ND) for SF 6 and PMVE is shown in Figure 4. The coefficient slowly increased with increasing reduced electric field. As desired, the ND value for PMVE was smaller than that of SF 6 for the entire investigated electric field range. The smaller value of the diffusion coefficient for PMVE stems from the high attachment cross section when compared to that of SF 6 .
The critical field strength study is discussed in this subsection. Figure 5 illustrates the Townsend coefficients of C 3 F 6 O and SF 6 . For SF 6 we used the cross section from the Siglo database provided on the LXCat website [20]. The BOLSIG+ calculation was performed for the spatial growth case, which corresponds to the steady-state Townsend experiments. The ionization channel opens above the threshold energy, whereas the attachment reaction decreases dramatically as the energy decreases. The critical field is determined at the point where ionization and attachment rates balance each other. For C 3 F 6 O, the value was found to be 475 Td and for SF 6 it was 355 Td. In terms the dielectric strength alone, C 3 F 6 O showed a good insulation performance.

3.3. Buffer Gas Mixtures

As mentioned earlier, pure C 3 F 6 O must be mixed with buffer gases to reduce the liquefaction temperature so that the new gas is suitable for electrical applications. In Figure 6, we plot the critical field values of the C 3 F 6 O and N 2 /CO 2 /O 2 gas mixtures. The dotted lines shown in the graph are values obtained according to the proportion and critical field strength of the two pure gases in the mixture. The curve obtained using Equation (11) was not linear and, hence, the critical field strength was not a function of the gas proportions. This suggests a synergistic effect in the gas mixtures, which represents the interaction of pure gases in the mixture. This was also useful to decide an optimal ratio of the gases in the mixture. If we maintained the PMVE proportion above 55% for the C 3 F 6 O/N 2 , 60% for the C 3 F 6 O/O 2 , and 65% for the C 3 F 6 O/CO 2 mixture, the critical field strength was greater than that of SF 6 .
We further plot the synergistic effect coefficient h, as suggested by [7], in Figure 7. The values obtained for the three mixtures were always greater than 0, which points to the presence of synergism among the gases in the respective mixtures. This again supports the observation of synergism through the critical field plot. The h value was 0 < h < 1 indicating that there were positive synergistic phenomena happening. A positive synergistic effect occurs when the breakdown voltage or the dielectric strength of the mixture is greater than that of the weighted sum of the individual gases.
Having established the presence of synergism in the selected gas mixtures, we studied the breakdown properties of the mixtures. Here, we present the Paschen curve to decide the best-suited buffer gas and optimal gas ratio for the mixture for a better breakdown characteristic. As described in the theory section, the ionization coefficients were first fitted to Equation (12), and A and B were determined. The fitted curve for C 3 F 6 O and SF 6 is shown in Figure 8. We performed a similar fitting for all the mixture proportions considered in this work. The obtained constants were then utilized to obtain the Paschen curve for different buffer gases, which are further discussed here. The Paschen curve is plotted for a limited pressure range as the main objective was to study the effect of adding buffer gas to the mixture.
In Figure 9, we plot the Paschen curve for C 3 F 6 O and CO 2 mixture. With the increase in the proportion of CO 2 in the mixture, the breakdown voltage increased. However, it still lagged behind the values for SF 6 in the higher pd range. For applications requiring pd values less than 0.3 Pa m, the 5% C 3 F 6 O and 95% CO 2 mixture should replace SF 6 . However, above this range, the buffer gas CO 2 does not serve the purpose of increasing the breakdown voltage. We then studied the effect of adding O 2 as a buffer gas, as shown in Figure 10. The observation is similar to that of CO 2 . The C 3 F 6 O and O 2 gas mixture at different gas ratios always had a lower breakdown voltage than SF 6 . Thus, O 2 was not effective as a buffer gas in the present case.
In Figure 11, the Paschen curve for the C 3 F 6 O and N 2 gas mixture is plotted. In contrast to the previous two cases, the mixture of 1% C 3 F 6 O and 99% N 2 produced similar or better breakdown results in the entire investigation range. Any proportion below 10% for C 3 F 6 O performed better than SF 6 in the higher operational range. Thus, we suggest using N 2 (≥90%) as a buffer gas to improve the breakdown characteristic of pure C 3 F 6 O for the higher pressure region and N 2 (≥99%) for lower ranges. This will produce a gas mixture with a greater critical field strength and breakdown voltage, which is suitable for a wide range of plasma applications.

4. Conclusions

This paper reports the first low-energy electron scattering and transport data for per-fluoro-methyl-vinyl-ether (PMVE) with the chemical formula C 3 F 6 O. The scattering cross sections were computed using the QUANTEMOL-EC software and BEB code. The input files for both calculations were prepared using the GAUSSIAN 09 software. In this way, a complete cross section set was obtained for this molecule. Our main aim was to analyze the suitability of this new gas as a replacement for SF 6 in plasma applications. For this, we determined the transport parameters, such as the drift velocity, diffusion coefficient, and critical field strength, for PMVE. These parameters were determined using the BOLSIG+ software for the spatial growth case, which corresponds to steady-state Townsend experimental conditions. The (E/N) c r i t for C 3 F 6 O was 475 Td, whereas for SF 6 , it was 355 Td. Further, the drift velocity of C 3 F 6 O was twice that of SF 6 and the diffusion coefficient was also ∼4 times lower when compared to SF 6 . The comparison of these parameters with those of SF 6 indicates a better performance of PMVE over SF 6 in the plasma fields. We then studied the effect on the insulation performance due to the addition of different buffer gases. These characteristic parameters were further used to study the synergistic effect in the mixtures. The presence of synergistic phenomena is important for a better breakdown quality of the mixture in the considered application. Motivated by this, we derived the Paschen curve for different pure gases and mixtures. The breakdown voltage of PMVE was lower than that of SF 6 . Moreover, the addition of buffer gases increased the voltage, and the best output was obtained when N 2 was used as the buffer gas. A mixture containing ≥99% of N 2 or ≤1% of C 3 F 6 O gave a better breakdown characteristic than that of SF 6 . Any proportion ≥90% of N 2 or ≤10% of C 3 F 6 O is suitable in the higher pressure ranges. The usage of O 2 is not helpful to improve the breakdown feature. CO 2 as a buffer gas exhibited good breakdown properties only when the pd value was very low. Hence, we suggest using N 2 as the buffer gas for PMVE gas.
In conclusion, we encourage the use of C 3 F 6 O or PMVE as a replacement gas in plasma applications. The gas has a 0.004 GWP and, to the best of our knowledge, it is the most eco-friendly gas among the other available or proposed alternative gases, such as CF 4 , CF 3 I, c-C 4 F 8 , C 4 F 7 N, C 4 F 8 O, C 5 F 10 O, C 6 F 12 O, and others (see Table 1 in [4]). Its band gap is higher than other alternative gases, except for c-C 4 F 8 , which demonstrates its better chemical stability. Considering the dielectric strength, it is lesser than the recently introduced C5-, C6-perfluoroketones, and C4-perfluoronitrile. However, its excellent environmental index along with its better insulation performance than SF 6 will give a balanced solution to the considered problem.
The present work demonstrates that the gas has a considerably higher critical dielectric strength as compared to SF 6 . Further, the addition of N 2 as a buffer gas brings the breakdown properties to a similar range to that of pure SF 6 . We look forward to experimental efforts to measure the transport and breakdown parameters reported here.

Supplementary Materials

The following supporting information can be downloaded at: https://www.mdpi.com/article/10.3390/app132312612/s1.

Author Contributions

Conceptualization, M.-Y.S. and K.-D.S.; data curation, N.S.; formal analysis, N.S.; funding acquisition, M.-Y.S. and K.-D.S.; investigation, N.S. and M.-Y.S.; methodology, N.S.; project administration, M.-Y.S.; resources, M.-Y.S., H.C. (Hyonu Chang) and H.-J.J.; software, M.-Y.S., H.C. (Hyonu Chang) and H.C. (Heechol Choi); supervision, M.-Y.S.; validation, H.C., H.C., H.-J.J., Y.-H.O. and K.-D.S.; writing—original draft, N.S.; writing—review and editing, M.-Y.S., H.C. (Hyonu Chang), H.C. (Heechol Choi), H.-J.J., Y.-H.O. and K.-D.S. All authors have read and agreed to the published version of the manuscript.

Funding

This research was supported by R&D Program of “Plasma Big Data ICT Convergence Technology Research Project” [No. EN2342] through the Korea Institute of Fusion Energy (KFE) funded by the Government funds of Republic of Korea and the Korea Electrotechnology Research Institute (KERI) Primary research program through the National Research Council of Science & Technology (NST) funded by the Ministry of Science and ICT (MSIT) [No. 23A01035].

Institutional Review Board Statement

Not applicable.

Informed Consent Statement

Not applicable.

Data Availability Statement

The electron impact cross section data shown in Figure 2 is tabulated in the Supplementary Materials. The transport data will be made available on request.

Conflicts of Interest

The authors declare no conflict of interest.

References

  1. Li, X.; Zhao, H.; Murphy, A.B. SF6-alternative gases for application in gas-insulated switchgear. J. Phys. D Appl. Phys. 2018, 51, 153001. [Google Scholar] [CrossRef]
  2. Pan, B.; Wang, G.; Shi, H.; Shen, J.; Ji, H.K.; Kil, G.S. Green gas for grid as an eco-friendly alternative insulation gas to SF6: A Review. Appl. Sci. 2020, 10, 2526. [Google Scholar] [CrossRef]
  3. Tian, S.; Zhang, X.; Cressault, Y.; Hu, J.; Wang, B.; Xiao, S.; Li, Y.; Kabbaj, N. Research status of replacement gases for SF6 in power industry. AIP Adv. 2020, 10, 050702. [Google Scholar] [CrossRef]
  4. Sinha, N.; Choi, H.; Song, M.Y.; Jang, H.J.; Oh, Y.H.; Song, K.D. Perfluoro-methyl-vinyl-ether as SF6 alternative in insulation applications: A DFT study on the physiochemical properties and decomposition pathways. Comput. Theor. Chem. 2023, 1225, 114159. [Google Scholar] [CrossRef]
  5. Li, Z.; Tao, Z.; Naik, V.; Good, D.A.; Hansen, J.C.; Jeong, G.R.; Francisco, J.S.; Jain, A.K.; Wuebbles, D.J. Global warming potential assessment for CF3OCF=CF2. J. Geophys. Res. Atmos. 2000, 105, 4019–4029. [Google Scholar] [CrossRef]
  6. ChemSpider. Available online: https://www.chemspider.com/ (accessed on 14 May 2022).
  7. Zhong, R.; Su, Z.; Dengming, X.; Hui, W.; Jiang, X.; Zhongmin, Y.; Yunkun, D. Investigation of the performance of CF3I/c-C4F8/N2 and CF3I/c-C4F8/CO2 gas mixtures from electron transport parameters. Plasma Sci. Technol. 2020, 22, 055402. [Google Scholar] [CrossRef]
  8. Hagelaar, G.; Pitchford, L.C. Solving the Boltzmann equation to obtain electron transport coefficients and rate coefficients for fluid models. Plasma Sources Sci. Technol. 2005, 14, 722. [Google Scholar] [CrossRef]
  9. Radmilović-Radjenović, M.; Sabo, M.; Radjenović, B. Transport Characteristics of the Electrification and Lightning of the Gas Mixture Representing the Atmospheres of the Solar System Planets. Atmosphere 2021, 12, 438. [Google Scholar] [CrossRef]
  10. Yang, W.; Meng, X.; Zhou, Q.; Dong, Z. Boltzmann equation studies on electron swarm parameters in Townsend breakdown of copper vapor plasma using independently assessed electron-collision cross sections. AIP Adv. 2019, 9, 035041. [Google Scholar] [CrossRef]
  11. Park, Y.; Choi, Y.R.; Kim, D.C.; Kim, Y.; Song, M.Y.; Kim, Y.W.; Cho, H.; Jang, H.J.; Oh, Y.H.; Song, K.D. Total electron scattering cross section of C3F6O at the intermediate-energy region for developing an alternative insulation gas to SF6. Curr. Appl. Phys. 2022, 41, 111–115. [Google Scholar] [CrossRef]
  12. Cooper, B.; Tudorovskaya, M.; Mohr, S.; O’Hare, A.; Hanicinec, M.; Dzarasova, A.; Gorfinkiel, J.D.; Benda, J.; Mašín, Z.; Al-Refaie, A.F.; et al. Quantemol electron collisions (QEC): An enhanced expert system for performing electron molecule collision calculations using the R-matrix method. Atoms 2019, 7, 97. [Google Scholar] [CrossRef]
  13. Tennyson, J. Electron–molecule collision calculations using the R-matrix method. Phys. Rep. 2010, 491, 29–76. [Google Scholar] [CrossRef]
  14. Kim, Y.K.; Rudd, M.E. Binary-encounter-dipole model for electron-impact ionization. Phys. Rev. A 1994, 50, 3954. [Google Scholar] [CrossRef] [PubMed]
  15. Sanna, N.; Gianturco, F.A. Differential cross sections for electron/positron scattering from polyatomic molecules. Comput. Phys. Commun. 1998, 114, 142–167. [Google Scholar] [CrossRef]
  16. Munro, J.J.; Stephen, H.; Milton, M.F.; Jonathan, T. A dissociative electron attachment cross-section estimator. J. Phys. Conf. Ser. 2012, 388, 012013. [Google Scholar] [CrossRef]
  17. Kim, Y.K. Scaling of plane-wave Born cross sections for electron-impact excitation of neutral atoms. Phys. Rev. A 2001, 64, 032713. [Google Scholar] [CrossRef]
  18. Frisch, M.; Trucks, G.; Schlegel, H.; Scuseria, G.; Robb, M.; Cheeseman, J.; Scalmani, G.; Barone, V.; Mennucci, B.; Petersson, G.; et al. Gaussian 09 (Revision D. 01); Gaussian, Inc.: Wallingford, CT, USA, 2013. [Google Scholar]
  19. Kondo, Y.; Ishikawa, K.; Hayashi, T.; Sekine, M.; Hori, M. Electron impact ionization of perfluoro-methyl-vinyl-ether C3F6O. Plasma Sources Sci. Technol. 2018, 27, 015009. [Google Scholar] [CrossRef]
  20. LXcat. Available online: http://www.lxcat.laplace.univ-tlse.fr (accessed on 6 December 2021).
Figure 1. Molecular structure of PMVE.
Applsci 13 12612 g001
Figure 2. Cross section for different scattering processes for electron—PMVE interaction.
Applsci 13 12612 g002
Figure 3. Drift velocity comparison of SF 6 and PMVE.
Applsci 13 12612 g003
Figure 4. Density normalized diffusion coefficient (ND) comparison of SF 6 and PMVE.
Applsci 13 12612 g004
Figure 5. Critical field determination for C 3 F 6 O and SF 6 : (a) C 3 F 6 O; (b) SF 6 .
Applsci 13 12612 g005
Figure 6. Critical field comparison for PMVE and N 2 /CO 2 /O 2 gas mixtures.
Applsci 13 12612 g006
Figure 7. Synergistic coefficient h for PMVE and N 2 /CO 2 /O 2 gas mixtures.
Applsci 13 12612 g007
Figure 8. Fitting of the ionization coefficient for C 3 F 6 O and SF 6 : (a) C 3 F 6 O; (b) SF 6 .
Applsci 13 12612 g008
Figure 9. Paschen curve for C 3 F 6 O and CO 2 mixture.
Applsci 13 12612 g009
Figure 10. Paschen curve for C 3 F 6 O and O 2 mixture.
Applsci 13 12612 g010
Figure 11. Paschen curve for C 3 F 6 O and N 2 mixture.
Applsci 13 12612 g011
Disclaimer/Publisher’s Note: The statements, opinions and data contained in all publications are solely those of the individual author(s) and contributor(s) and not of MDPI and/or the editor(s). MDPI and/or the editor(s) disclaim responsibility for any injury to people or property resulting from any ideas, methods, instructions or products referred to in the content.

