Article

A Decision Support System That Considers Risk and Site Specificity in the Assessment of Irrigation Water Quality (IrrigWQ)

by
Heinrich M. du Plessis
1,
John G. Annandale
1,* and
Nico Benadé
2
1
Department of Plant and Soil Sciences, University of Pretoria, Private Bag X20, Hatfield 0028, South Africa
2
NB Systems, 33 Dr van der Merwe Road, Pretoria 0182, South Africa
*
Author to whom correspondence should be addressed.
Appl. Sci. 2023, 13(23), 12625; https://doi.org/10.3390/app132312625
Submission received: 19 September 2023 / Revised: 13 November 2023 / Accepted: 16 November 2023 / Published: 23 November 2023
(This article belongs to the Special Issue Water Science Technologies for Optimising Agricultural Production)

Abstract

:

Featured Application

This paper describes a novel electronic Decision Support System that uses established criteria to assess the fitness for use for the irrigation of water containing several non-traditional constituents, based on site-specific considerations.

Abstract

Irrigators are increasingly challenged to maintain or even increase production using less water, sometimes of poorer quality, and often from unconventional sources. This paper describes the main features of a newly developed software-based Decision Support System (DSS), with which the fitness for use (FFU) of water for irrigation (IrrigWQ) can be assessed. The assessment considers site-specific factors, several non-traditional water constituents, and the risk of negative effects. The water balance components of a cropping system and the redistribution of solutes within a soil profile are assessed with a simplified soil water balance and chemistry model. User-friendly, colour-coded output highlights the expected effects of water constituents on soil quality, crop yield and quality, and irrigation infrastructure. Because IrrigWQ uses mainly internationally accepted cause–effect relationships to assess the effect of water quality constituents, it is expected to find universal acceptance and application among users. IrrigWQ also caters for calculating so-called Water Quality Requirements (WQRs). WQRs indicate the threshold levels of water quality constituents for irrigation at specified levels of acceptability or risk. WQRs assist water resource managers in setting site-specific maximum threshold levels of water quality constituents that can be tolerated in a water source before impacting negatively on successful irrigation.

1. Introduction

This study describes a new approach to assess the fitness for use (FFU) of irrigation water. An assessment of the FFU of available water sources forms an integral part of the successful planning and implementation of any irrigation project. Fortunately, the guidelines for assessing the FFU of traditional sources of water for irrigation are well established. The first widely accepted irrigation water classification system was developed by the United States Salinity Laboratory Staff [1]. They correctly identified that the FFU of irrigation water is largely determined by a combination of its sodicity and salinity. Their classification system has subsequently been refined and supplemented with guidance provided by the FAO [2] and learned societies [3]. A recent guide for assessing irrigation water quality [4] continued to make extensive use of the United States Salinity Laboratory Staff classification but found it necessary to increase the concentration of the highest salinity hazard class (C4), from 500 to 3000 mS/m, in order to provide for waters with extremely high salinity. The Queensland (Australia) Department of Environment and Resource Management [5] recently developed a steady-state Excel-based calculator, called SALF2, as a decision support tool to assist in evaluating the impacts of irrigation water quality on plants and soil, with an emphasis on its effect on soil permeability and salinity-affected crop yield. This represents a major improvement over earlier calculating procedures. A further application of FFU guidelines is to satisfy the need identified by managers of water resource quality, who wish to establish water quality levels that would not jeopardise irrigation and other users of a particular water source. By using these levels as targets for managing the quality of water resources, water quality managers try to ensure that water resource quality remains fit for its intended use. Several countries have developed similar water quality guidelines catering for a range of water uses, including irrigation [6,7,8]. These guidelines were primarily developed to establish water quality requirements (WQR) specifying concentrations of water constituents that would not be detrimental to a specific user. In addition to their primary purpose of providing guidance to water resource managers with establishing water quality levels that would be acceptable for irrigation purposes, these guidelines have also found application to assess the FFU of irrigation water. A common feature of the guidelines that were developed is that they are generic and conservative in nature and largely ignore site-specific considerations. An unintended consequence of using such guidelines to assess FFU is that the problems that may arise from irrigation with particular water are emphasised, while the identification of irrigation options that would be successful under appropriate site-specific conditions at an acceptable level of risk of negative effects is largely ignored. This brings to the fore the need for a system to assess the FFU of water for irrigation that is based on realistic assumptions of crop and soil responses to different site-specific conditions. This need is also not addressed by traditional water quality guidelines.
Since irrigation has historically been practiced mainly in arid environments, guidelines to assess the fitness of water for irrigation were almost, without exception, based on the assumption that irrigation was the main, if not the only, source of water for plant use. Water quality guidelines for irrigation, therefore, assume minimal or no dilution of irrigation water constituents by rain and, furthermore, primarily consider the effects of constituents that occur naturally in surface and ground waters. Guidelines, therefore, have largely ignored the variability associated with site-specific conditions that may influence the fitness of water for irrigation. However, the situation facing irrigation has changed. While it is expected of irrigated agriculture to increase production, it is generally faced with declining water quality, while new sources of irrigation water are largely limited to unconventional sources and effluents that are mostly not generated in traditional irrigation areas. While the availability of unconventional water sources presents new opportunities to expand irrigation, they often contain constituents that are uncommon in natural waters and, therefore, present challenges in assessing their FFU when using existing guidelines. However, unconventional water sources often originate in areas that are wetter than traditional irrigation areas. This opens the possibility to use them for supplemental irrigation and benefit from the dilution of problematic constituents. Guidelines to assess the FFU of waters for irrigation, which address current and future challenges facing irrigated agriculture, will, thus, have to consider site-specific conditions like variable weather conditions, a wider range of conventional and unconventional water constituents, a range of crop species and soil textures, as well as irrigation management, which may all influence the assessment. While it may not have been possible to fulfil these needs in the past, the availability of powerful electronic computational tools that facilitate fast execution and linking of simulation models, as well as the storage and further processing of large amounts of data, has now made this feasible. This has, at least to some degree, fundamentally changed the question being asked from “is this water fit for irrigation?” to “are there conditions under which this water may be fit for irrigation?”.
About a decade ago, based on these insights, the South African Department of Water and Sanitation (DWS) identified the need for the development of water quality guidelines that differ in fundamental ways from those developed earlier [9]. Firstly, the envisaged guidelines had to be risk-based, a fundamental change in philosophy from earlier guidelines. Secondly, they had to provide for much greater site specificity, a widely recognised limitation of previous generic guidelines. Thirdly, they had to be available primarily as a software-based Decision Support System (DSS). This study describes the development and main features of the newly established DSS for irrigation water quality assessment (IrrigWQ), which emanated from a project initiated by the South African Water Research Commission through a directed call with published terms of reference and co-funded by the South African Department of Agriculture, Forestry, and Fisheries [10]. Because IrrigWQ mainly uses internationally accepted cause-effect relationships to assess the effect water quality constituents have on soils, crops, and irrigation infrastructure, and considers site-specific characteristics in producing risk-based FFU assessments of irrigation water quality, it is envisaged that IrrigWQ will find far wider application than only with South African users.
The functionality to assess the FFU of irrigation water, which is also used to determine WQRs, will be presented in more detail.

2. Materials and Methods

2.1. Overview

The topic of this paper is of a nature that is different from most papers published in scientific journals. Although its layout tries to follow the traditional format, the presentation of material and methods as well as results may come across as somewhat unconventional. The project on which this paper is based was designed to achieve the general aim of developing a software-based DSS that is able to provide both generic and site-specific, risk-based irrigation water quality guidelines, which is, in essence, a new approach to assessing irrigation water quality. The two main components of the project were, thus, firstly, to identify and describe the technical considerations that determine the water quality that is required for irrigation water use and, secondly, to capture these technical considerations in a DSS. The DSS (hereafter called IrrigWQ) was designed to provide water resource managers and irrigation water users with guidance about the risk of negative effects associated with using water of a specific composition for irrigation under both site-specific and generic conditions. The DSS that was developed provides, as far as possible, for quantitative FFU assessments, as well as for determining WQR for irrigation water use [10].
A basic premise of IrrigWQ is that the FFU of water for irrigation is determined by the extent to which water constituents determine the success of an irrigation development. The three most important components of an irrigation development that can be affected by water composition, were identified as soil quality, crop yield and quality, and the irrigation infrastructure used to convey and distribute water. Problems with any of these three components can jeopardise the success of an irrigation development. The FFU of irrigation water is, thus, deemed to be determined by the impact it has on these three components. For ease of pinpointing the exact problem with a water’s FFU, each of the three components was subdivided into a number of so-called “suitability indicators”, each of which describes a different aspect of the three success-determining components. The more a suitability indicator is negatively affected by a single or combination of irrigation water constituents, the less fit the water is deemed to be for irrigation. As part of a literature review, the current state of knowledge on how water constituents affect each of the suitability indicators was assessed, and approaches were developed to evaluate them. Next, the results of the literature review were used to decide on the determination of the criteria that define the boundaries between FFU categories for each suitability indicator, and these have been made explicit in the IrrigWQ output. More detail is given elsewhere [10] on the selection of suitability indicators and the definitions of FFU categories, and in the interest of brevity, this is not covered in much detail in this paper.
The fact that suitability indicators and the criteria used to define FFU categories are stated explicitly enables IrrigWQ users who may wish to use different indicators or criteria to attach a modified interpretation to its output. Should a user consider some suitability indicators as inappropriate or of less concern, the indicator may be ignored or less importance attached to its output. A user may likewise modify the importance attached to the output of a particular suitability indicator when the criteria used in IrrigWQ are considered inappropriate. However, against the background of the current state of knowledge, the authors consider the criteria used in IrrigWQ to be appropriate.
The primary tool for evaluating FFU or establishing WQRs is a software-based DSS, which operates at two different levels or tiers. These levels of assessment vary in their input requirements, calculating procedures and output.
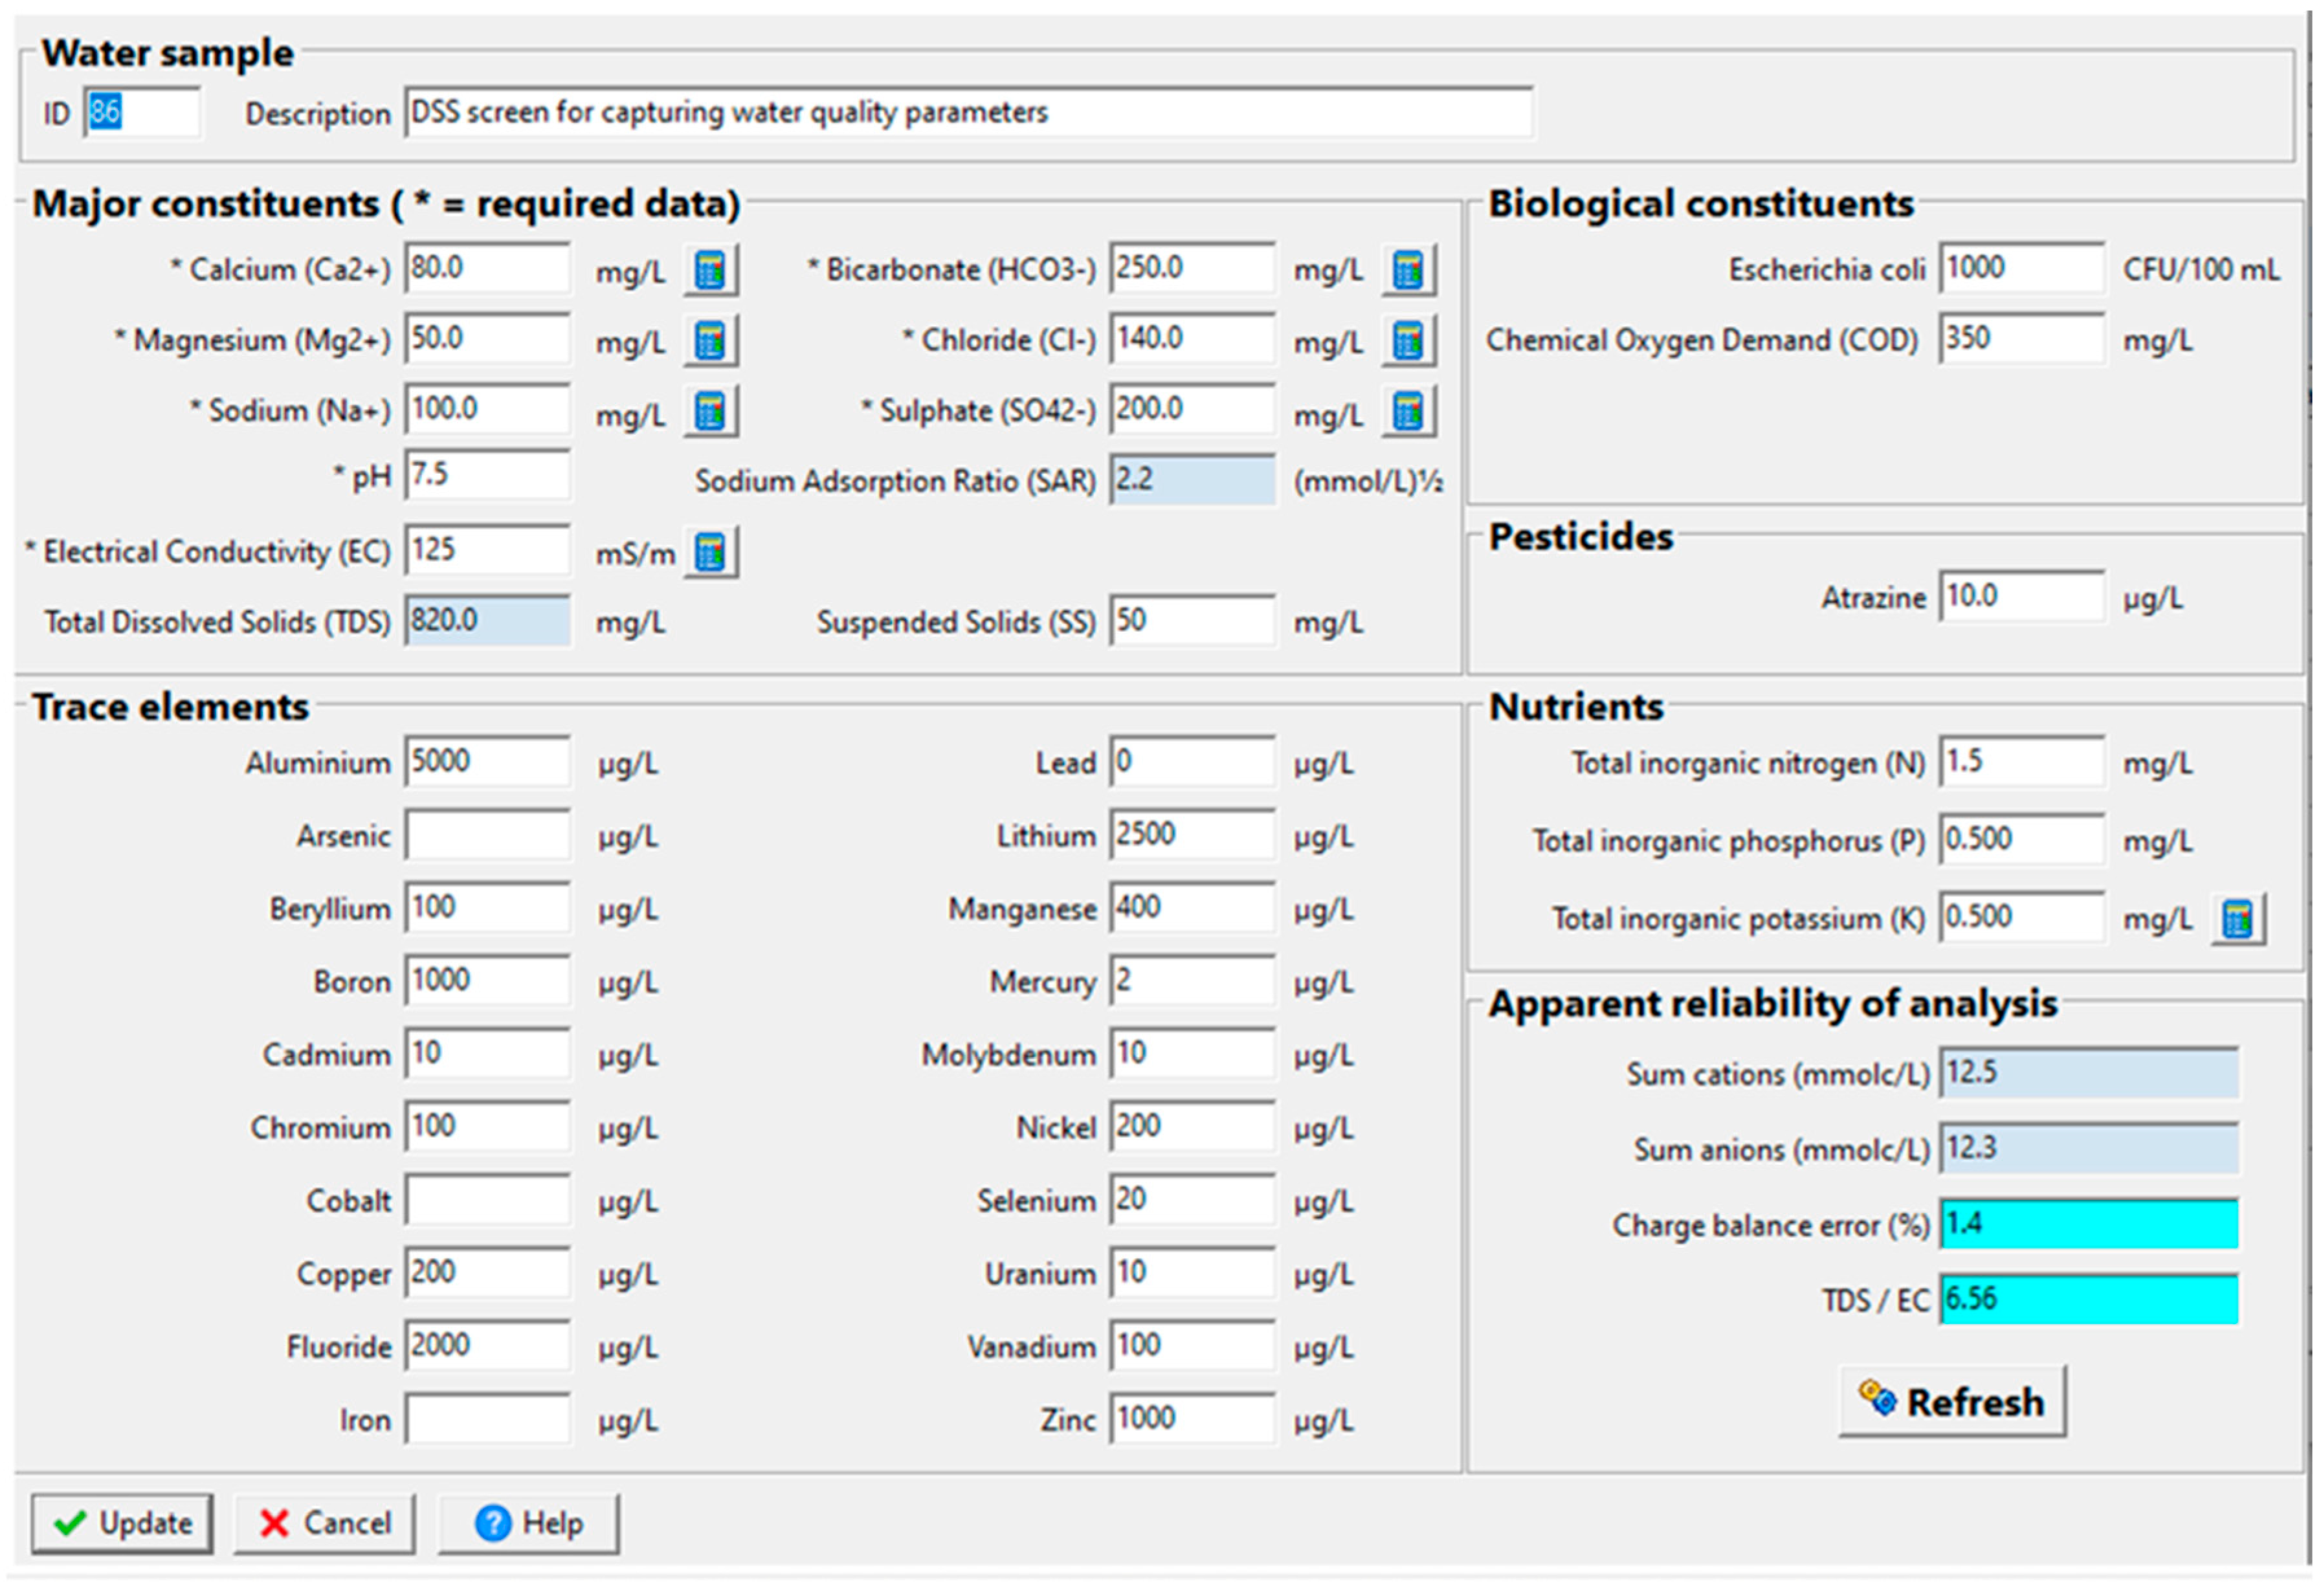
  • Tier 1 resembles the current South African generic guidelines (Department of Water Affairs and Forestry, 1996), with some modifications, and is similar to guidelines developed for other countries. Tier 1 assessments make use of a number of conservative simplifying assumptions, like no rain, a sensitive crop, a low leaching fraction (10%), and a relatively high level of water application and, thus, constituent load, all factors that largely determine the water quality required for irrigation. Consequently, only the composition of irrigation water is required as input to generate FFU assessments, highlighting potential problems that can be expected under these specified conservative assumptions. Should a Tier 1 evaluation indicate potential problems, more rigorous, site-specific Tier 2 evaluations are indicated to determine whether these problems can be overcome when site-specific conditions are considered.
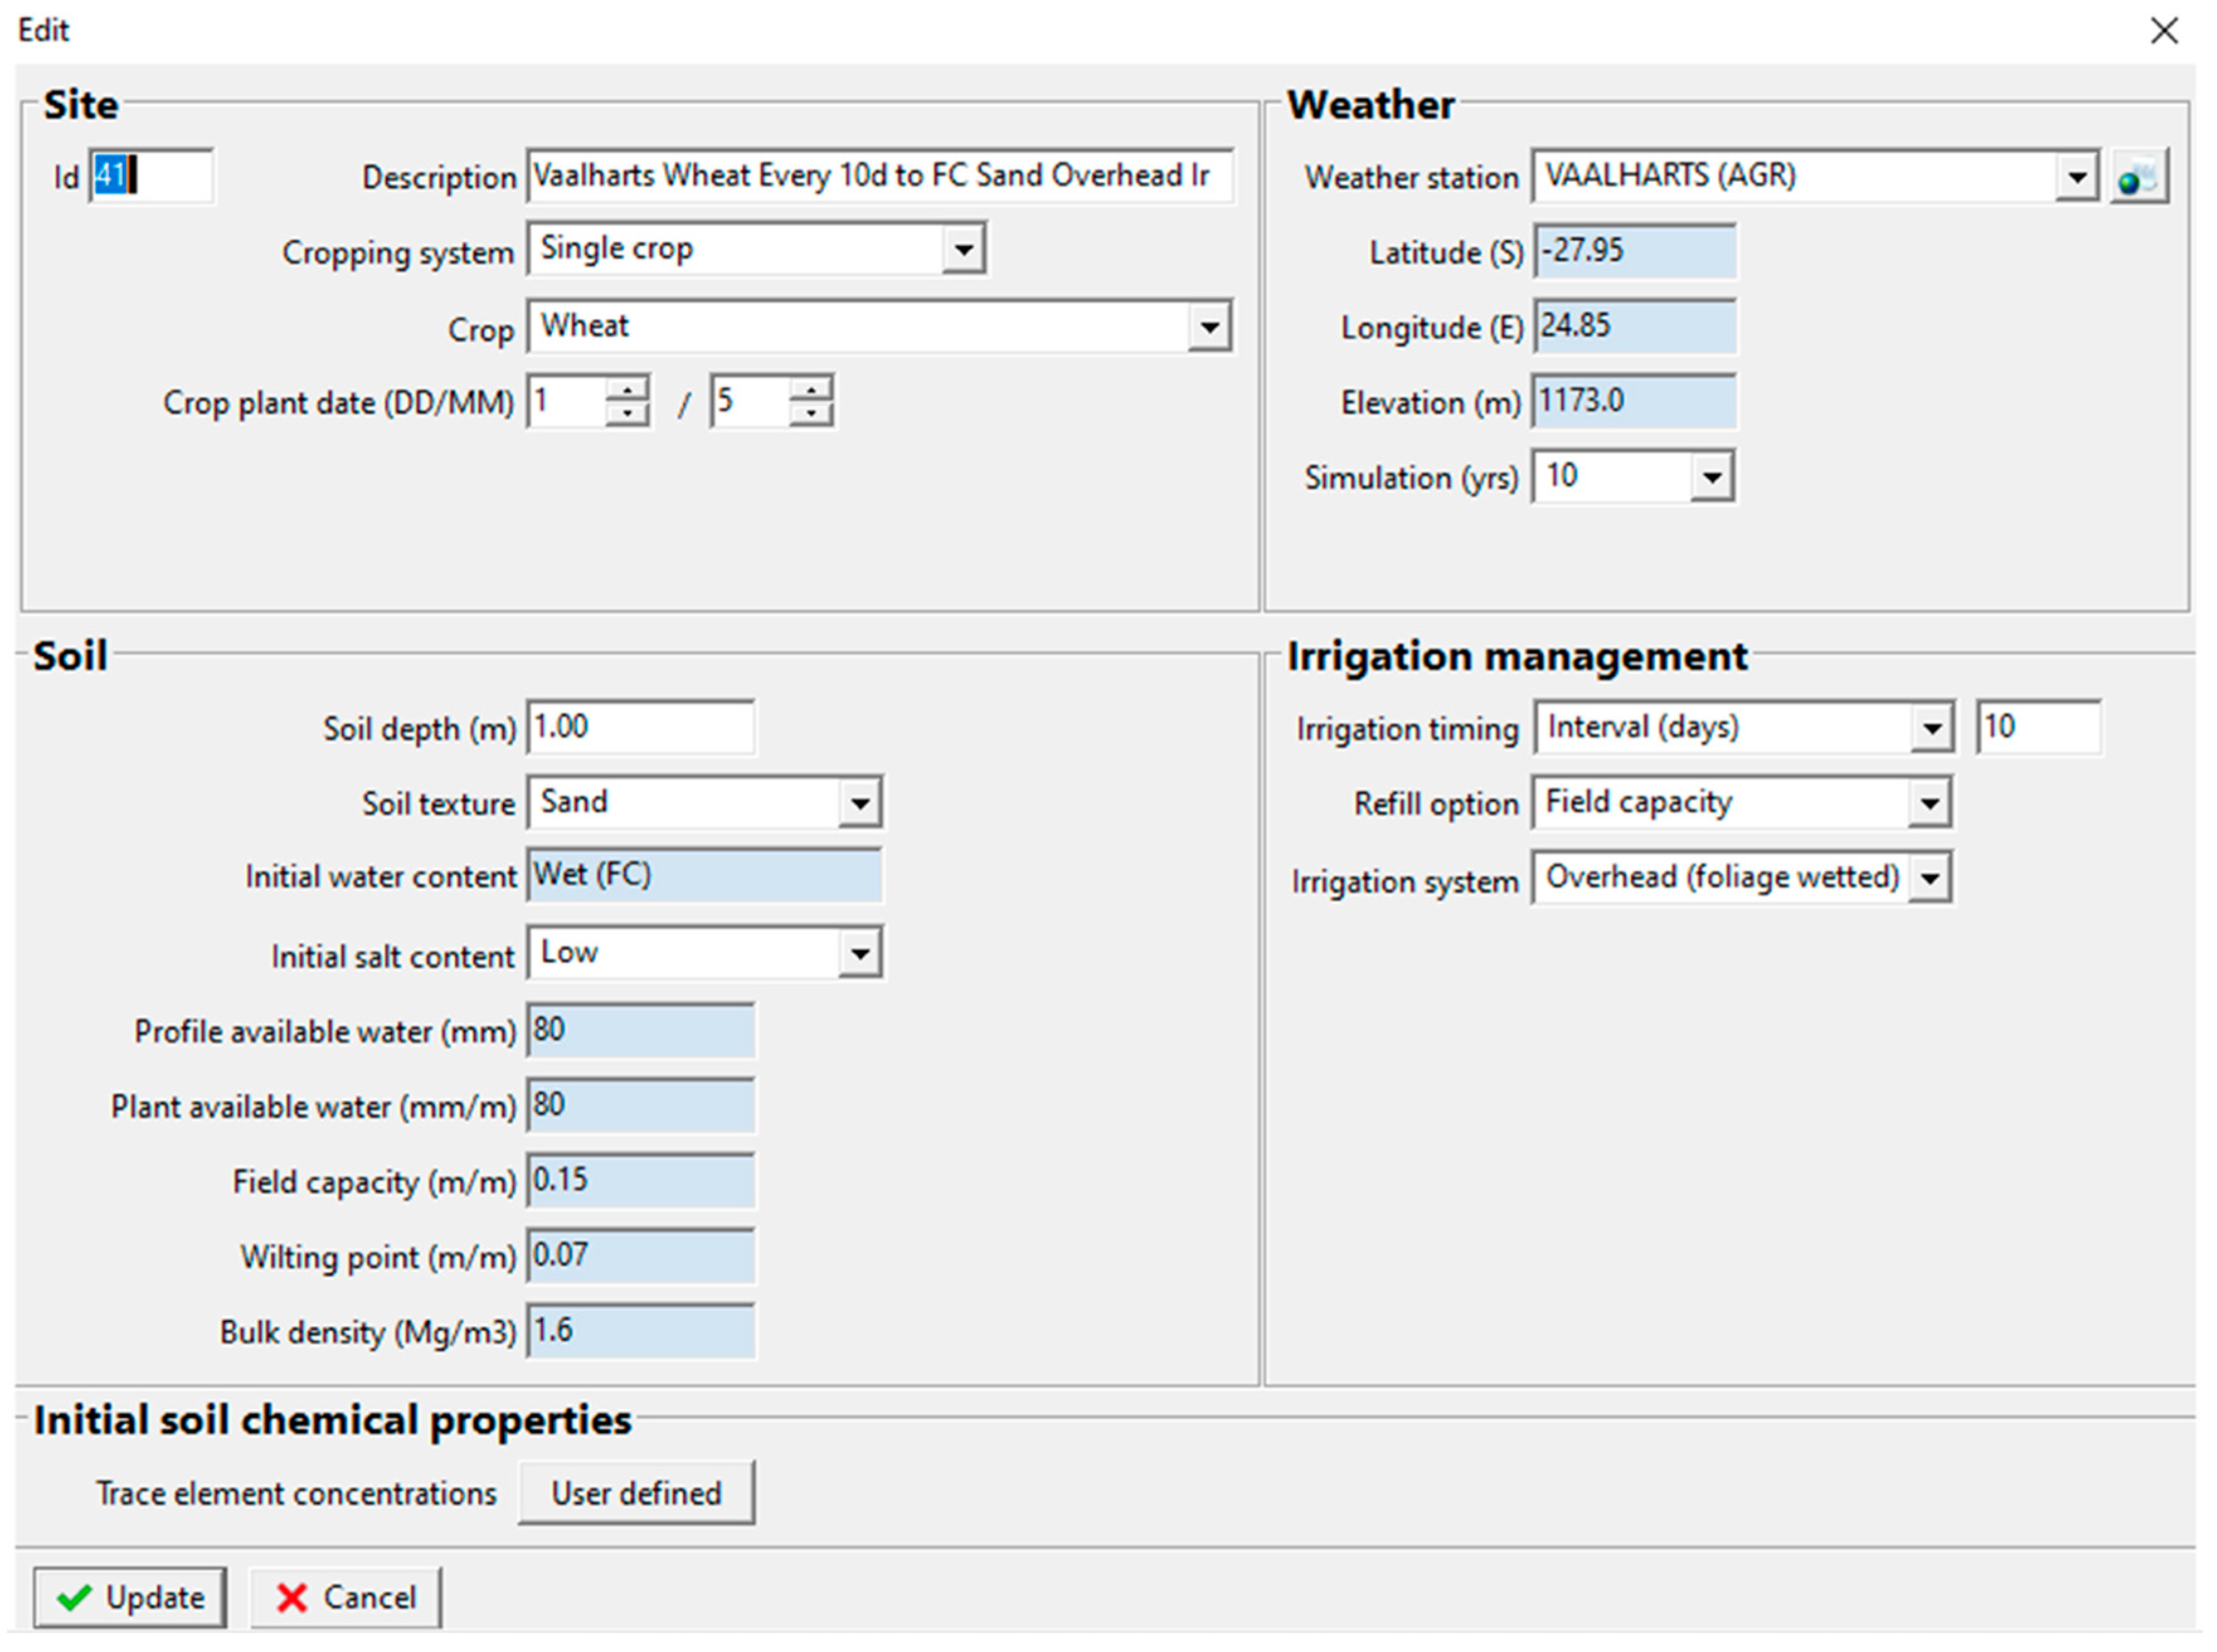
  • Tier 2 considers site-specific conditions when assessing WQRs or FFU. IrrigWQ allows a user to conduct a more in-depth water quality assessment and guideline generation by making use of a relatively sophisticated crop growth–soil water balance and chemical equilibrium model that caters for selectable, default site-specific input parameters to simulate the response of soils, crops, and irrigation infrastructure to irrigation water of a specific composition under user-defined, site-specific conditions. This provides a significantly enhanced assessment of how crop selection, climatic conditions, irrigation management, and soil texture can be expected to determine the effect of specific water composition on soil quality, crop yield and quality, or irrigation infrastructure.
IrrigWQ was developed in the following phases:
  • The compilation of a concise literature review documenting the current understanding of how water quality constituents, soils, crops, climate, irrigation systems, irrigation management, and other factors interact to impact the resultant soil quality, crop yield and quality, and the performance of irrigation infrastructure. The review provided the theoretical basis or technical framework for the development of IrrigWQ [10].
  • The development of a Technology Demonstrator that consisted of the preliminary software system that demonstrated the most important features of Tiers 1 and 2 for six water quality constituents representing different categories of constituents, namely salinity (electrical conductivity or EC) as a major inorganic constituent, Cr and Zn as trace elements, pesticides, microbial contamination, and those constituents affecting the corrosion and scaling of irrigation infrastructure.
  • A demonstration of the Technology Demonstrator to potential user groups, who made several suggestions for improvement.
  • The development of a fully functional draft DSS incorporating all the features and water quality constituents envisaged for the final IrrigWQ.
  • The testing and evaluation of the draft DSS by individual water quality experts to evaluate its user friendliness and acceptability, as well as the confidence that can be placed in its ability to make reliable and realistic evaluations.
  • The release of IrrigWQ for use and evaluation by the wider irrigation community.
  • The continued introduction of enhancements to improve utility and user friendliness.

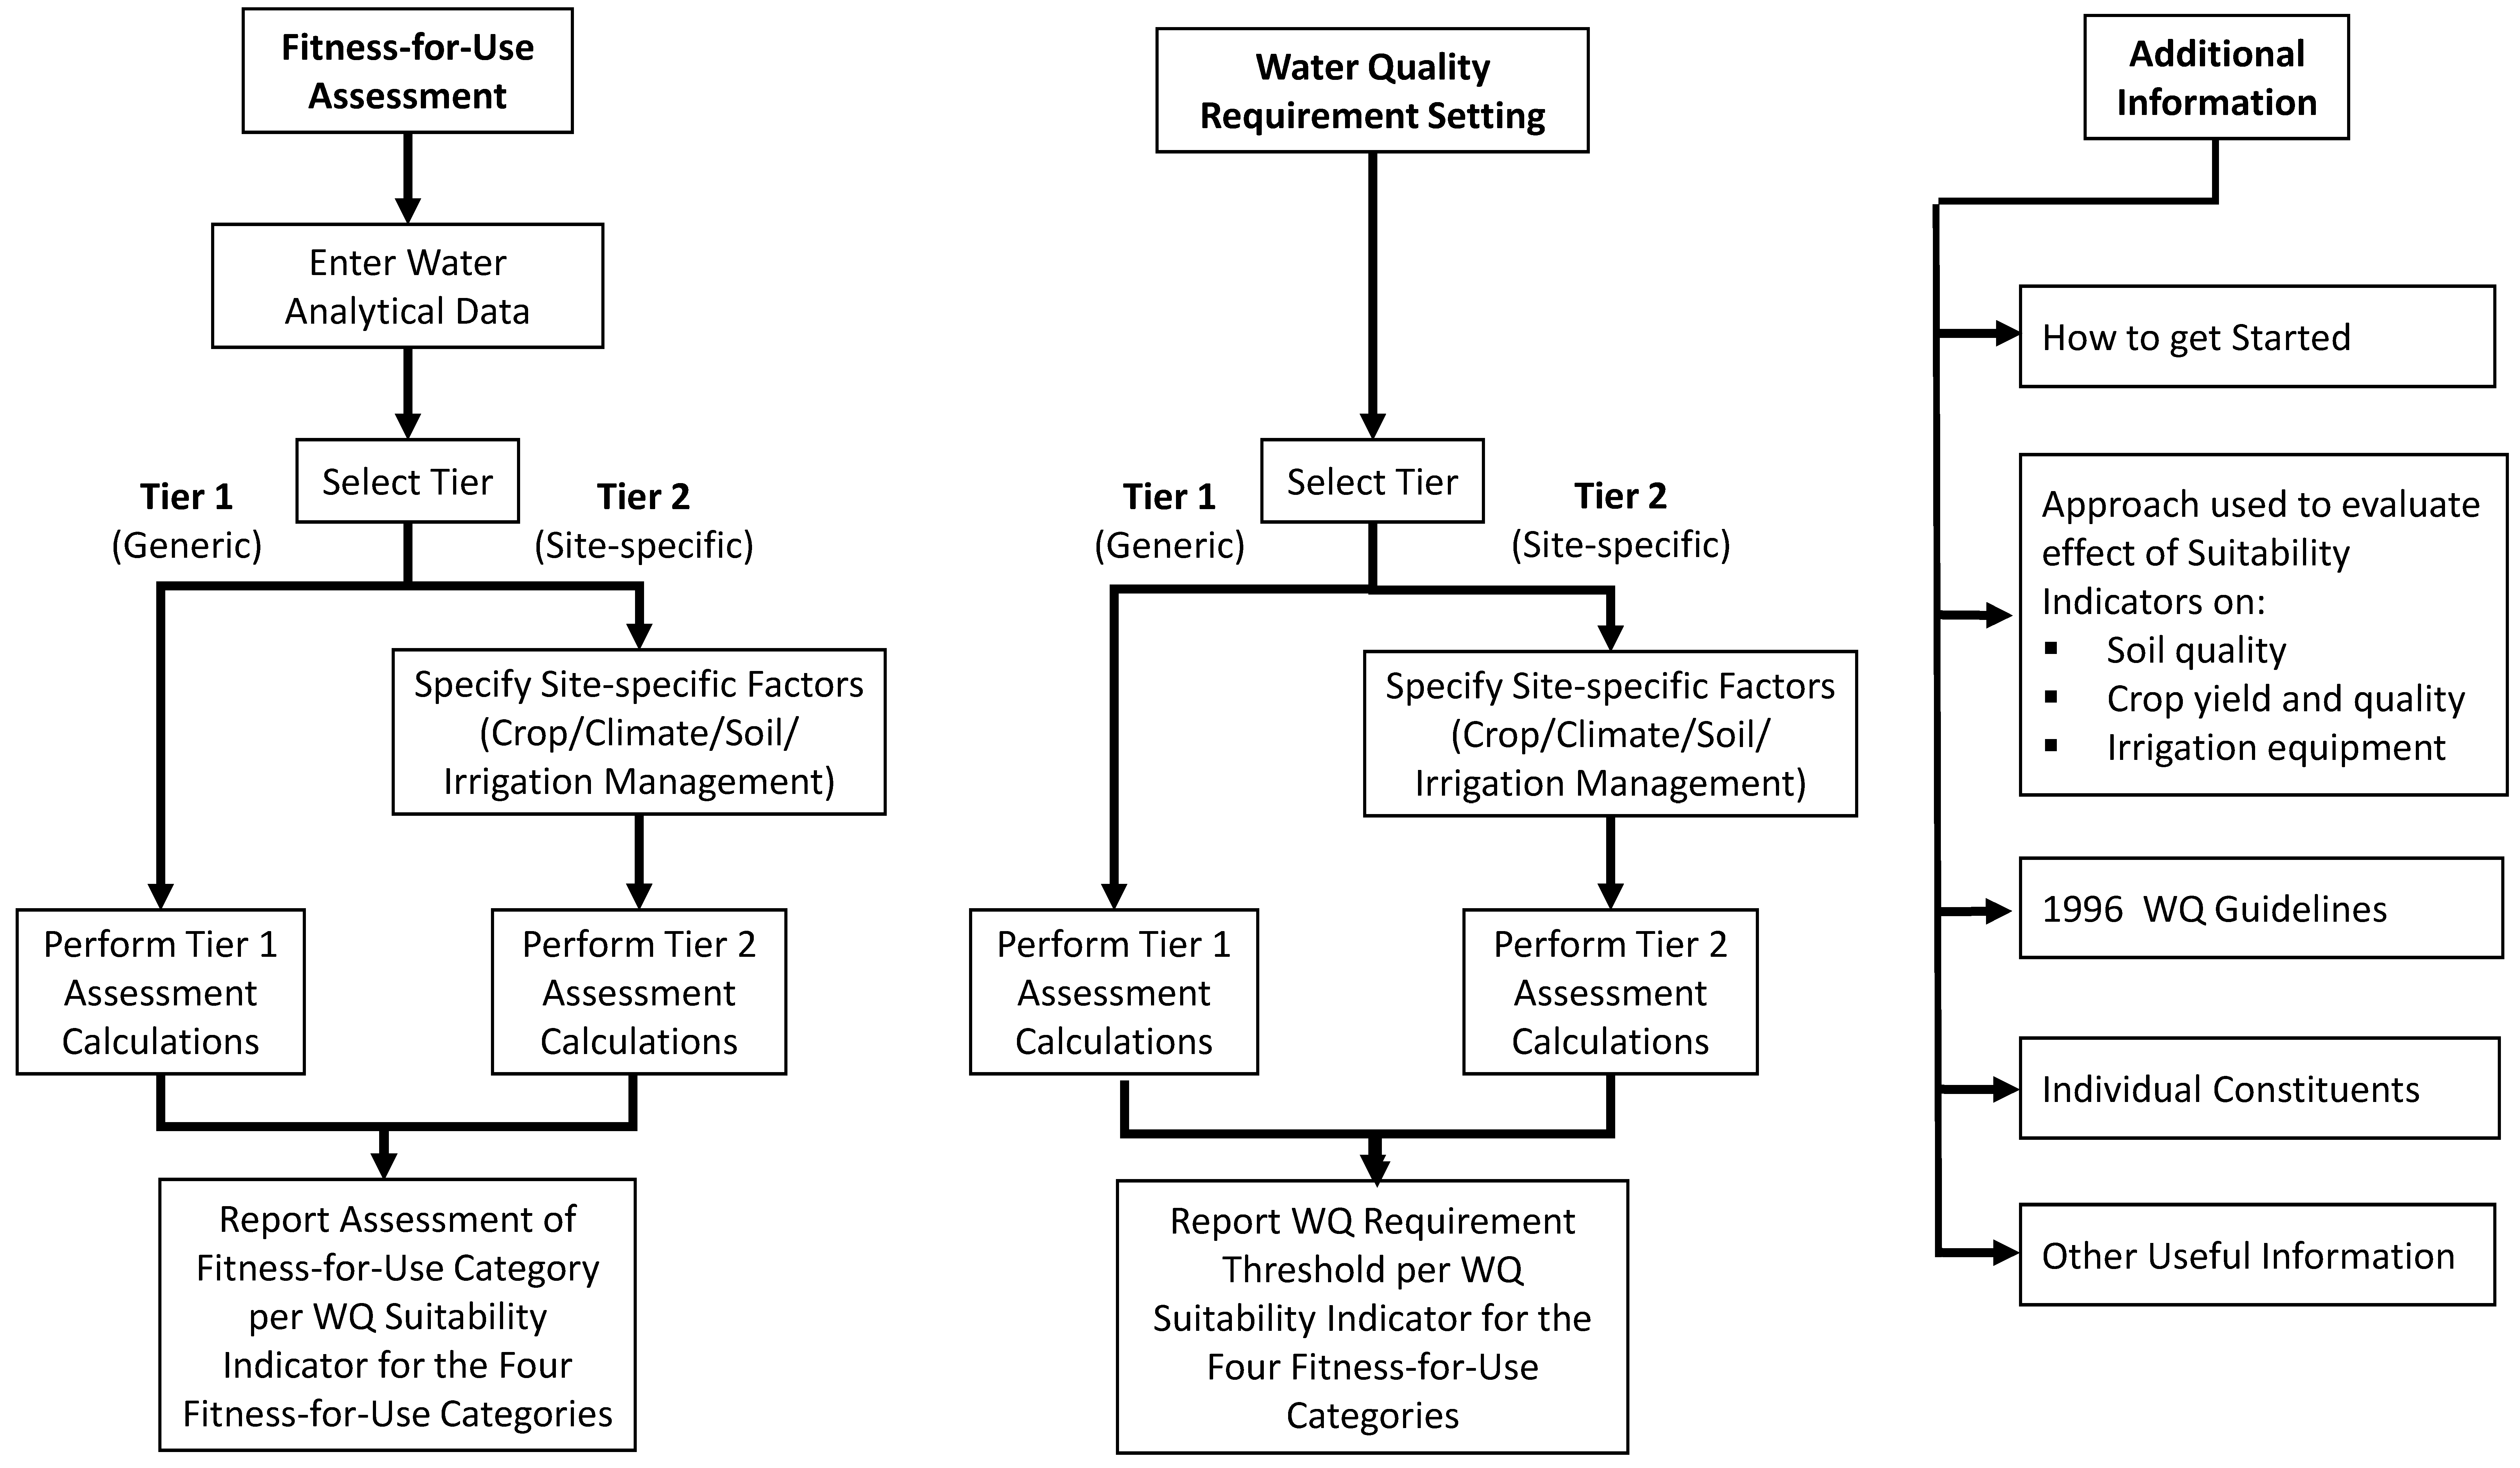
2.2. The Decision Support System (DSS)

Figure 1 depicts the overall structure of IrrigWQ’s DSS. At the highest level, a user must decide whether they want to use IrrigWQ to assist with any of the following:
  • Assessing the FFU of water for irrigation;
  • Setting WQR for a water source to be used for irrigation;
  • Obtaining additional information.
After selecting the appropriate IrrigWQ functionality to access, the user is guided through a decision tree to choose between different options and select the appropriate route to process the user’s need and provide output in a user-friendly format.

2.3. The Development Platform

One of the important design criteria for IrrigWQ was the requirement to use open-source software. Lazarus [11] was selected for this purpose, as it is an open-source Delphi-compatible, cross-platform, integrated development environment (IDE) for rapid application development. Furthermore, it has a variety of components ready for use and a graphical form designer to easily create complex graphical user interfaces. Firebird, which is used as IrrigWQ’s database, is an open-source relational database that furnishes much of the American National Standards Institute’s Structured Query Language (ANSI SQL) as standard features [12]. It runs on Linux, Windows, and a variety of Unix platforms. Firebird also provides excellent concurrency, high performance, and powerful language support for stored procedures and triggers.

2.4. Calculating Procedures

Both FFU and WQRs are assessed based on the effect water constituents have on indicators describing their effect on the suitability of soil quality and crop yield and quality, as well as irrigation infrastructure.
The effect water constituents have on suitability indicators can be either direct (such as when water with a high chloride concentration causes scorching of wetted leaves) or indirect (when the suitability indicator is affected by the net effect of processes taking place within the soil–plant–atmosphere continuum). Direct effects are usually quite easy to predict and evaluate from cause–effect relationships. Indirect effects are more difficult to predict since the cause–effect relationships are more complex.
When irrigation is applied, the soil acts as a temporary store of water from which plant roots extract water as needed in between irrigation applications. The dissolved water constituents are transported into the soil and interact with soil constituents, thereby changing its composition. Since most irrigation water constituents are actively excluded from uptake by plants, they tend to accumulate in soil and further change the soil composition. The net effect of these processes on soil composition has to be estimated to assess the indirect effects of water composition on the selected suitability indicators of soil quality and crop yield. Because of the involved nature of these interactions, they are modelled in IrrigWQ using a simplified dynamic soil water balance model for Tier 2 applications, while a steady-state calculating procedure that relies on simplifying assumptions is used for Tier 1 assessments.
Tier 1 calculations of soil–crop–water interactions assume an idealised four-layered soil profile, from which crops withdraw 40% of their water requirement from the top layer, 30% from the second, 20% from the third, and 10% from the bottom layer [13]. The steady-state (or equilibrium) concentration of soluble constituents in each layer is calculated from the concentration of constituents in the irrigation water, assuming a conservative 10% leaching fraction for the profile as a whole, with immediate percolation and leaching of salts in solution when the profile exceeds field capacity. The same approach is used by others for developing their water quality guidelines [2,6,7,8].
Tier 2 calculations make use of a simplified version of the dynamic, daily time-step, soil water balance (SWB) model, using a cascading or “tipping-bucket” soil water balance approach [14] that is run for a minimum of 10 years, using daily temperature and precipitation data from an appropriate user-selectable weather station to calculate the water requirements and uptake of a user-selected crop or crops. Selectable irrigation management rules specify the timing (irrigation interval in days, amount in mm, or percentage depletion) and amount (refill to field capacity, apply a fixed amount, apply a specified leaching fraction, or leave a specified amount as room for rain) to be refilled. The ability of the SWB model to predict interactions in the crop–soil–atmosphere continuum has been verified extensively, which provides confidence in using it for calculating the parameters that are used to infer the effect selected water constituents to be refilled have on soil quality and crop yield and quality [14]. Reference evapotranspiration (ETo) is calculated in SWB according to the Penman–Monteith grass reference method, as recommended by the FAO [15]. It also simulates transient salt transport and simplified soil chemical interactions [16,17]. Model output is used to calculate the value of variables that determine the magnitude of several soil quality and crop yield indicators. For example, variability in weather conditions gives rise to differences in the seasonal water balance and the seasonal root-profile-weighted soil salinity, from which crop yields are derived using the threshold and slope approach [18]. Subsequently, IrrigWQ calculates and reports the likelihood with which specific yield levels occur over time. All other calculation procedures used in IrrigWQ have been extensively used by international water quality guidelines [10].

2.5. Water Quality Constituents and Their Effect on Soil Quality, Crop Yield and Quality, and Irrigation Infrastructure

IrrigWQ assesses the fitness of given water for irrigation from the concentrations of eight major inorganic indicators of water quality, two biological constituents, three nutrients, twenty trace elements, and, as an indicator of potential pesticide effects, atrazine. By considering constituents that do not naturally occur in irrigation water, the utility of IrrigWQ is expanded to cater also for unconventional water sources. Constituents are evaluated for the effect they have on soil quality, crop yield and quality, and irrigation infrastructure. The minimum data set required to conduct an FFU assessment is the levels of the major inorganic indicators of water quality (sodium, calcium, magnesium, chloride, sulphate, bicarbonate, pH, and EC). While analyses for other constituents are not mandatory, their effect on FFU can only be assessed if analyses are provided. The full suite of water quality parameters considered by IrrigWQ can be seen in Figure 2. In the discussion of the effect of water quality constituents that follows, only the calculating procedure for Tier 2 (being the more dynamic approach) will be presented. The criteria to determine the fitness category are the same for both Tiers 1 and 2.

2.5.1. Effect of Water Quality Constituents on Soil Quality

The effect irrigation water quality constituents have on soil quality is modified by the fact that soil acts as a temporary store of water for plant use and that crops extract almost pure water, leaving most constituents within the soil. The degree to which these constituents accumulate and interact with soil components determines how they affect soil quality. IrrigWQ considers the following suitability indicators to assess the effects irrigation water constituents have on soil quality:
  • Soil profile salinity
Soil salinity serves as a qualitative indicator of the suitability (fitness) of soil to support plant growth and of the range of crops that can be expected to be successfully cultivated under specific conditions. IrrigWQ uses the United States Salinity Laboratory Staff criteria to assess the FFU of soil profile salinity for crop production [1]. The effects on crop production of soil saturation extract levels below 200 mS/m are considered to be negligible, while only tolerant crops yield satisfactorily at levels above 800 mS/m. Soil profile salinity is evaluated on the annual mean value as calculated with the modified SWB model.
ii.
Soil permeability
The maintenance of sufficient permeability is a prerequisite to ensure that it is possible to supply crop water requirements through irrigation and to facilitate salinity control and the reclamation of salt-affected soils. Two processes are at play to determine the permeability of soil. Hydraulic conductivity operates below the surface within the bulk of the soil, unaffected by the mechanical disturbance of surface soil structure, to determine permeability within the root zone. Infiltrability, on the other hand, is a surface phenomenon largely affected by any mechanical disturbance of surface soil structure [19]. Both phenomena are largely affected by soil sodicity and the EC of either the percolating soil water or infiltrating rain and irrigation water. Soils differ too much in their response to different sodicity/EC combinations to develop a universal response curve that separates favourable from unfavourable conditions for use in IrrigWQ. Following a literature review [10], sodicity/EC combinations were defined to qualitatively describe the degree to which both hydraulic conductivity and infiltrability of sensitive soils are affected by these variables. IrrigWQ reports the degree to which hydraulic conductivity is reduced for the soil layer that is most affected and how infiltrability is affected by surface crust formation.
iii.
Oxidisable carbon loading.
Although organic matter is a minor soil constituent, it plays a major role in determining soil physical conditions, soil chemistry, and soil biology. Adding organic material to soil through irrigation would, thus, mostly be considered beneficial. The diversity of the soil microorganism population enables microbes to decompose organic materials from many different sources. Oxygen is consumed during this decomposition process. Should the organic loading become so high that microorganisms consume oxygen at a rate higher than the gaseous exchange capacity of soil, oxygen becomes depleted and anoxic conditions are established. Since plant roots require oxygen for their metabolic functions, most plants display reduced growth, or die, when their roots are exposed to oxygen stress. Anoxic conditions can also give rise to unpleasant odours. From a literature review [10], it appears important to restrict both the short- and longer-term organic load that is applied to soil. While it is important to ensure that long-term application loads remain within the capacity of soil to decompose organic matter, it is even more important to ensure that short-term overload does not occur since short-term anoxic conditions may result in plant death. Chemical oxygen demand (COD) was selected as a measure of the organic load in irrigation water. IrrigWQ reports the COD load on a kg/ha per-month basis. A monthly loading below 400 kg/ha is considered ideal whereas four times this rate is deemed unacceptable.
iv.
Trace element accumulation
Trace elements are mostly strongly sorbed by soil and, when applied through irrigation water, tend to accumulate in the soil profile. While some trace elements are essential plant nutrients at low concentrations, at high concentrations, most become either toxic to crop growth or to humans or animals consuming the produce. The current approach followed by most countries to derive irrigation water quality guidelines for trace elements is to back calculate an acceptable irrigation water concentration from conservative and protective accumulation levels that have been set for soils [2,6,8]. This approach was first used by the US EPA [20] to derive water quality criteria in terms of US legislation to manage water quality in inter- and intra-state streams. This approach was also adopted by IrrigWQ, using the same or similar accumulation levels as used internationally. The mean annual irrigation application calculated using the SWB model is used to calculate the number of years it would take to reach the accumulation level in the top 150 mm of soil. It is deemed unacceptable to reach the accumulation threshold in less than 100 years, while taking longer than 200 years to reach the threshold is deemed to be ideal.

2.5.2. Effect of Water Quality Constituents on Crop Yield and Quality

The effect irrigation water quality constituents have on crop yield and quality are both direct and indirect. The direct contact of irrigation water with a crop mostly affects crop quality, while indirect impacts mostly affect crop yield. Indirect impacts are a consequence of the accumulation and redistribution of irrigation water constituents within the root zone. IrrigWQ considers the following suitability indicators to assess the effect irrigation water constituents have on crop yield and quality:
  • Root zone effects of irrigation water salinity, B, Cl and Na on crop yield
The accumulation of salt, B, Cl, and Na in the root zone of crops has an indirect effect on crop yield, in that when these constituents are absorbed by plant roots, they are translocated to the above-ground parts where they influence several plant physiological processes that affect crop growth and yield. Salinity (salt content) within the root zone inhibits crop growth by reducing the ability of plant roots to absorb water from soil. The osmotic effect exerted by soluble ions reduces the availability of water to crops. In addition to EC, crop growth is also affected by the accumulation of B, Cl, and Na in the root zone. The effects of the latter three constituents are deemed to be of a toxic nature since their effect on yield reduction is more pronounced than would be expected from their contribution to soil osmotic potential alone. A large body of data that links the yield response of different crops to EC levels and the concentrations of B, Cl, and Na in the root zone of soil within which the crop is growing is available. This body of data is available as crop-specific parameters for use in IrrigWQ. The crop tolerance parameters (the threshold concentration of the constituent of concern and the slope of the yield reduction curve) are used to calculate relative crop yield, according to the procedure of Maas and Hoffman [18] from the SWB-model-calculated seasonal root zone salinity, B, Cl, and Na concentrations, as also used by the FAO [2]. Relative crop yields between 90 and 100% are considered to be ideal, while yields of less than 70% are considered unacceptable.
ii.
Scorching of leaves when wetted
Crops susceptible to foliar damage caused by salts directly absorbed through their leaves display greater yield reductions than when only exposed to root zone salinity. However, practically no quantitative data are available to quantify the effect on yield, and only limited qualitative data (and then only for Cl and Na) are available to assess the relative susceptibility of crops to foliar injury [21]. Crop species for which information is available, and their qualitative susceptibility rating, form part of the IrrigWQ database. For the purposes of IrrigWQ, the degree of leaf scorching is evaluated only in qualitative terms.
iii.
Contribution to the NPK uptake of the crop
N, P, and K are essential macro plant nutrients that are normally present in low concentrations in irrigation water. However, their concentrations can be relatively high in effluents and greywater that may be considered for irrigation. The presence of plant nutrients in irrigation water is mostly viewed as beneficial by irrigators since its availability represents a saving in fertiliser costs. High concentrations can, however, have undesirable side effects. High N concentrations may stimulate excessive vegetative growth and cause lodging, delayed crop maturity, and poor quality. High nutrient concentrations may further complicate fertiliser management, the timing of fertiliser applications, and the control of nitrate and phosphate leaching and runoff losses. When present in significant quantities in irrigation water, fertiliser applications need to be reduced proportionally, and it becomes increasingly difficult to manage fertiliser applications optimally. The presence of plant nutrients in irrigation water, thus, presents both advantages and disadvantages. The approach adopted in IrrigWQ for evaluating the effect of plant nutrients on irrigation water is to estimate both the quantity of NPK that will be added through irrigation and the contribution their addition will make to NPK removal by a specific crop (indirectly, the crop nutrient requirement). The situation wherein inadvertent nutrient additions through irrigation are relatively low compared to crop requirements is considered to be “Ideal” because, under these conditions, it is easier to accommodate the additional nutrients as part of normal nutrient management practices, and the additional nutrients may be viewed as only beneficial. However, as inadvertent nutrient additions increase, it becomes more difficult to manage the negative effects associated with higher fertiliser applications. Nutrient additions of less than 10% of crop removal are considered to be ideal, while additions in excess of 50% are considered to be unacceptable.
iv.
Risk of microbial contamination from consuming crops
The main concern about the presence of human pathogens in irrigation water is the risk this poses to food safety (crop quality) when crops destined for human consumption are contaminated during irrigation. This also has implications for compliance with food safety regulations. The deposition of pathogens during irrigation is of particular concern for fruits and vegetables that are consumed raw or with minimal processing. E. coli is used in IrrigWQ as an indicator of microbial pathogens, recognizing that levels of E. coli are much higher than those of microbial pathogens and are, thus, more easily determined. Norovirus is recognized as the most common agent of viral diarrhoea transmitted by irrigation water and by irrigated fresh produce consumed raw and is, thus, used as a proxy to estimate the risk of human infections caused by the microbial contamination of irrigation water. The risk of norovirus infection per person per year is estimated from E. coli counts per 100 mL, using a dose–response look-up table [22], which gives the risk of norovirus infection per person per year when consuming lettuce irrigated with water containing different E coli concentrations. The calculated risk of exposure is, thus, based on total annual E. coli intake. For crops consumed raw other than lettuce, the annual intake is calculated from the volume of irrigation water retained by the crop (in comparison to that retained by lettuce) and how much of the crop is consumed on an annual basis. Whether a crop is wetted by irrigation and the volume of water retained is determined by the irrigation system and anatomy of the crop. IrrigWQ output reports the risk of infection by human pathogens in irrigation water, as the number of excess infections per thousand persons p.a. The threshold value of 3 excess infections per 1000 people p.a. separating the Acceptable and Tolerable fitness-for-use categories represents the geometric mean of the risks 10−3 and 10−2. The geometric mean is used, as the distribution of risk is usually log-normal or similar (rather than normal, in which case the arithmetic mean would best describe the central tendency)
v.
Qualitative crop damage by atrazine
Herbicides are the most widely applied class of pesticides and, in view of the phyto-toxic risk they pose to non-target/sensitive crops, are more likely to be of concern to irrigation farmers than the possibility of irrigation water being the source of unacceptable pesticide residues in or on produce. However, they need to be present in concentrations that are toxicologically relevant to pose a risk of phyto-toxicity. Although this risk also appears to be low based on the available evidence, for the sake of completeness, it was decided to consider herbicides as one of the suitability indicators for inclusion in IrrigWQ. After glyphosate, atrazine is the most widely used herbicide in South Africa [10]. Since atrazine is highly mobile compared to glyphosates, with a significantly longer half-life, atrazine was selected as the herbicide to consider in IrrigWQ. Atrazine is used to control pre- and post-emergence broadleaf and grassy weeds in maize, sugarcane, and sorghum. It exhibits residual activity in soil for several months and may, thus, damage follow-on crops. This is because the recommended application rate for maize and sugarcane is about an order of magnitude higher than for sensitive crops. To circumvent damage to follow-on crops, waiting periods of between 12 and 24 months are prescribed before the next sensitive crop is planted. However, no waiting period is required if maize or sugarcane are the follow-on crops. In view of its faster degradation at higher clay and organic matter contents, higher atrazine dosages are recommended for soils with a higher clay and organic matter content. The recommended application rate of atrazine is, thus, determined by both the target crop and soil texture. Irrigation water containing half the recommended atrazine application rate or less is considered to be ideal, while additions in excess of the recommended atrazine application rate are considered to be unacceptable.

2.5.3. Effect of Water Quality Constituents on Irrigation Infrastructure

Irrigation water is normally supplied untreated. It is, thus, not chemically stabilised to control the potential for the corrosion or encrustation of irrigation equipment or filtered so that it can be used directly for drip irrigation. The corrosion and scaling of irrigation equipment and infrastructure are arguably the primary water quality problems associated with on-farm irrigation infrastructure. Either can necessitate the early replacement of expensive irrigation equipment. Both corrosion and scaling are the result of water having chemical imbalances. A secondary problem associated with water constituents is the clogging of drippers, which can be of chemical, biological, or physical origin.
  • Corrosion or scaling of irrigation equipment
Although minor scaling, which forms a protective layer against corrosion inside pipes, is normally considered beneficial, excessive scaling reduces flow rates and damages water systems, necessitating repair or replacement. The most common cause of scaling is the precipitation of calcium carbonate when saturation is exceeded. Calcium carbonate precipitation increases with increasing temperature, with the result that calcium carbonate frequently precipitates in slow-flowing dripper lines. Although less frequent, gypsum precipitation also occurs in irrigation equipment when water high in calcium and sulphate is used. Gypsum precipitation is a common problem when gypsiferous-neutralised acid mine drainage is used for irrigation. There are several indices with which corrosion and scaling can be predicted. The most commonly used index is the Langelier Saturation Index (LI), which was developed by Wilfred Langelier in 1936. The LI is an approximate measure of the degree of saturation of calcium carbonate in water. It is widely used as an index of the likelihood of corrosion and scaling and is calculated as the difference between the actual measured pH of water (pHa) and the hypothetical saturation pH of the water (pHs), i.e., the pH at which water with a given bicarbonate and calcium ion concentration and temperature would be in equilibrium with solid CaCO3 [8]. A positive LI indicates that water is over-saturated and scaling is likely. However, a negative LI indicates water that is under-saturated with respect to calcium carbonate and potentially corrosive. LI values between −0.5 and 0.5 should not lead to corrosion or encrustation problems. Serious corrosion is likely if LI is in the range of −0.5 to −2, and similarly, scaling will be problematic between values of 0.5 and 2.
ii.
Clogging of drippers
The low flow rates of drip emitters are conducive to clogging problems. While it is relatively easy to spot blocked emitters of surface drip systems, it is very difficult to distinguish one that is partially blocked from one that is not. Both blocked and partially blocked emitters alter the hydraulics of the entire system, result in a decrease in the uniformity of application, and give rise to reduced crop yields. The topic of clogging in drip irrigation systems, the role of water constituents in emitter clogging, and available treatment options are reviewed elsewhere [2,23]. Suspended solids, such as sand, silt, and clay, as well as organic matter, can easily block emitters. The problem with suspended solids can usually be addressed through prior sedimentation and filtration. No problems are expected if suspended solids are below 50 mg/L, while severe impacts can arise if this increases to 100 mg/L or more. The chemical precipitation of substances such as lime, iron, manganese, and phosphates can also cause clogging. The Langelier Index is often used to predict clogging by lime precipitation. As a general rule of thumb, problems can be expected when pH exceeds 8. Iron in the soluble ferrous form can be oxidised into the insoluble ferric Fe3+ form and cause clogging. Iron may also contribute to biologically mediated clogging, as it is often found in iron bacterial slime. The FAO guidelines [2] point out that many cases of clogging are caused by biological growth inside irrigation lines. This could be small quantities of micro-organisms such as algae, slimes, bacteria, fungi, and even snails and larvae. Such problems are common in waters rich in organics and iron or hydrogen sulphide. Excessive plant nutrient levels, as are often found in treated wastewater, can increase biological clogging problems. Chlorination is probably the most effective treatment for these problems and may require filtration after treatment. Nakayama and Bucks [23] compiled a table listing the major factors responsible for the clogging of drippers and a rating of the hazard posed at different concentrations, based on findings on emitter clogging and experience gained in controlling it. This table (with some minor modifications) is used in IrrigWQ to establish criteria for assessing the potential for the clogging of drippers. The classification scheme does not provide for nutrients that are applied through irrigation water. It is recommended that their effect and the effect of constituents not listed be determined experimentally, on a site-specific basis.

2.6. Presentation of Risk Associated with Water Composition

In the case of Tier 1 assessments, the output of IrrigWQ is ranked as belonging to one of four colour-coded FFU categories, reflecting the increasing risk of negative effects that water with a given composition poses to a suitability indicator. For Tier 2 assessments, the percentage of time the risk is calculated to belong to one of the FFU categories is indicated. The criteria that define the boundaries of FFU categories are also indicated. The classification is based on a Department of Water and Sanitation (DWS) system that provides a generic description of four suitability categories, which can be applied to any water use, not just to irrigation (Table 1). A similarly colour-coded summary of the criteria used by IrrigWQ to determine the FFU category of suitability indicators is presented in Table 2

2.7. Generating and Displaying IrrigWQ Output

For Tier 1 assessments of FFU, only the composition of the irrigation water (Figure 2) is required to generate IrrigWQ output. To conduct a Tier 2 FFU assessment, the user must, in addition to the composition of the irrigation water, also specify the site-specific characteristics that need to be considered during the evaluation. Site-specific characteristics are selectable from pre-populated defaults, as indicated in Figure 3.
IrrigWQ currently has a built-in database of more than 50 South African weather stations, each with 50 years of quality checked, daily rainfall and maximum and minimum temperature data. Weather data from many more South African stations can be downloaded from the IrrigWQ website (https://nbsystems.co.za, accessed on 21 November 2023). The weather data were obtained from a database developed by a team from the School of Bioresources Engineering and Environmental Hydrology at the University of KwaZulu-Natal, using the South African Atlas of Climatology and Agro Hydrology [24]. The IrrigWQ database also contains crop yield model parameters for 158 agricultural crops for their yield response to salinity, 60 for their yield response to boron, 54 for their yield response to chloride, and 74 crops for their yield response to sodium [2,18,20]. In addition, four generic crops have been defined representing crops that are sensitive, moderately sensitive, moderately tolerant, or tolerant to crop yield and quality determining factors. Generic crops are used when it is necessary to obtain an indication of the effects of irrigation water constituents on crops for which no quantitative response data are available, but which are known to have the characteristics of a particular sensitivity category.
While a steady-state Tier 1 assessment is executed instantaneously, Tier 2 assessments take longer, depending on the number of years selected for simulation. A minimum of 10 years is required but results more demonstrative of the variability associated with longer-term weather conditions can be obtained by running simulations for up to 45 years (although 50 years of weather data are captured for each weather station in the climate database, the first three years are used for a “warm up” simulation to establish a quasi-equilibrium between the various soil profile variables). The results of an FFU assessment are displayed on electronic output pages that summarise how the different suitability indicators are affected. The output can be printed or stored electronically.
  • The cover output page presents information on the user’s description of the assessment that was conducted and the water analysis. For Tier 2 assessments, it also displays the site-specific characteristics on which the evaluation is based and a summary of the seasonal water balance components, as calculated during the simulation.
  • The second output page presents an overview of the FFU assessment of the four suitability indicators that characterise soil quality.
  • The third output page presents an overview of the FFU assessment of the five suitability indicators that characterise crop yield and quality. If a crop rotation was selected for the Tier 2 assessment, the overview of the five suitability indicators for the second crop is printed on a fourth page.
  • The fourth page (or the fifth page in the case where a two-crop rotation was selected) presents an overview of the FFU assessment of the two suitability indicators that characterise the effect of water constituents on the performance of irrigation infrastructure.
The results for a WQR determination are similarly displayed on four or five pages. Tier 1 WQRs resemble current local and international guidelines. The Tier 2 threshold WQR values of irrigation water suitability indicators are back-calculated by interpolation as follows:
  • Successive FFU assessments are conducted for specified periods of between 10 and 45 years using a number of pre-defined, hard-coded, model waters, having increasing constituent concentrations.
  • The 95th percentile highest or lowest (as the case may be) annual or seasonal value of the suitability indicator is identified for each of the model water concentrations.
  • The threshold WQR concentrations corresponding to the criteria boundaries used for FFU categories are determined by interpolation from the 95th percentile highest or lowest annual or seasonal values of the suitability indicator.

2.8. Statistical Analysis

The description of the need for and characteristics of the electronic DSS that is the focus of this paper does not require statistical analysis. However, a virtual experiment to provide some validation of the IrrigWQ output makes use of some basic statistical tools. Statistical analysis was carried out using the data analysis tools embedded within Microsoft Excel (Version 2310 Build 16.0.16924.20054) 32-bit). Specifically, use was made of the coefficient of determination (R-squared) calculations to determine how well IrrigWQ-calculated crop yields correlated with those published earlier [2]. An R-squared of 1 indicates a perfect correlation, while an R-squared of 0 indicates no correlation. The crop yields reported earlier and those calculated with IrrigWQ for different crops irrigated with waters of different salinities further provided data pairs that could be tested to ascertain whether or not they belong to the same population using the “Paired Samples t-Test”.

3. Results and Discussion

3.1. Validation of IrrigWQ Output

The Tier 1 output is based on the same or similar relationships to those used in established guidelines and, thus, produces similar results [6,7,8]. IrrigWQ uses established criteria for both Tier 1 and Tier 2 assessments to interpret the effect of irrigation water constituents on FFU and for establishing WQRs. However, its treatment of the soil–plant–atmosphere continuum at the Tier 2 level is substantially more mechanistic and dynamic than traditional approaches for the assessment of irrigation water quality. For most conditions, the outcome of Tier 2 assessments can, thus, only be accepted or rejected on the basis that the results make intuitive sense, or not. However, to increase confidence in the output produced by IrrigWQ, a virtual experiment was run to compare the crop yields predicted by IrrigWQ with those of the authoritative FAO water quality guidelines [2].
To establish site-specific conditions for IrrigWQ that would be comparable to the assumptions made by the FAO water quality guidelines, IrrigWQ simulations were conducted with the following settings:
  • Precipitation was artificially set to zero in the weather station database (the Douglas, South Africa, weather station was used. Latitude (S) -29.05. Longitude (E) 23.77);
  • Irrigation management was adjusted to achieve leaching fractions of approximately 15% and 20%, which is in line with the leaching fraction range assumed by the FAO guidelines for their calculations;
  • IrrigWQ was run for a period of 40 years using the irrigation water ECs, which were calculated by the FAO guidelines to produce relative yields of 75%, 90%, and 100% for five crops with widely varying salinity tolerance (namely, barley, wheat, soybeans, maize, and carrots).
While the FAO guidelines [2] report a single crop-specific yield for a specific irrigation water EC using their calculation procedure, IrrigWQ calculates 40 different annual crop yields and leaching fractions (as determined by varying weather conditions) over the 40-year simulation period. Table 3 reports the irrigation water ECs calculated with the FAO guidelines procedure to produce the relative crop yields of 75%, 90%, and 100%. Also reported are IrrigWQ calculated ranges of crop yields, and their means, using the same irrigation water ECs as the FAO guidelines and the extremes (15% and 20%) of the leaching fraction range that apply to the FAO guideline calculations. It is postulated that agreement between yields published by the FAO guidelines as an authoritative publication and those calculated using IrrigWQ for the same irrigation water ECs would create confidence in the ability of IrrigWQ to correctly simulate complex conditions in the soil–climate–atmosphere continuum.
When the relative crop yields calculated with the two approaches are compared, IrrigWQ yields using a leaching fraction approaching 20% appear to be very similar to those of the FAO guidelines, while those for leaching fractions approaching 15% tend to be somewhat lower. In both cases, however, IrrigWQ calculated yields for the different crops irrigated with wide-ranging EC waters are well correlated with those of the FAO guidelines. An R-squared of 0.87 is obtained for the correlation between the reported FAO guidelines yield and IrrigWQ yield calculated for a 15% leaching fraction and an R-squared of 0.96 for IrrigWQ yield calculated for a 20% leaching fraction. Paired t-test calculations indicated that the FAO guidelines and IrrigWQ calculated yields, assuming a 20% leaching fraction, belong to the same population with no statistical differences between their means at a 1% level of significance. However, a similar statistical evaluation for the IrrigWQ calculations using a 15% leaching fraction, indicated that they do not belong to the same population as those of the FAO guidelines and have different (lower) means. It would, thus, appear as if the FAO guidelines leaching range is in practice closer to 20% or that IrrigWQ slightly underpredicted leaching. However, the overall agreement between the yields predicted with the two approaches is sufficient to give confidence that, when IrrigWQ is used to simulate conditions similar to those of the FAO guidelines [2], comparable results will be produced.

3.2. Differences in Output and Use of Tiers 1 and 2 to Assess FFU and Determine WQRs

For both FFU assessments and WQR determinations, IrrigWQ displays a separate output page to report on how soil quality, crop yield and quality, and irrigation infrastructure are affected, as indicated by their respective suitability indicators.
Soil profile salinity, one of the suitability indicators of soil quality, is used here to illustrate the differences between the output of Tiers 1 and 2 for FFU assessments and to illustrate how FFU output differs from that of WQR determinations. For Tier 2 output to be compared with that of Tier 1, the site-specific conditions used for Tier 2 simulations were adapted to reflect those used for Tier 1. The main adaptations involved the removal of the rainfall component from the weather data and employing an irrigation management regime that produced a mean leaching fraction of about 10% over a 40-year simulation period. The same irrigation water composition, having an EC of 100 mS/m, was used for both Tier 1 and 2 assessments of FFU.
IrrigWQ output for the soil profile salinity suitability indicator is presented in Table 4 and Table 5 for Tiers 1 and 2, respectively. The same display format, as produced by IrrigWQ, is used in these tables. IrrigWQ uses a similar format to display results for all individual suitability indicators for both tiers. The label used to identify the reported suitability indicator (i.e., soil profile salinity in this case), the colour-coded FFU categories, and ECe (saturation extract EC) criteria defining the FFU categories are identical for both Tiers 1 and 2. The differences in the way that Tier 1 and 2 results are reported arise from the fact that Tier 1 reports a single steady-state estimate, whereas, for Tier 2, the range and frequency of reported values are calculated from annual or seasonal results over a simulation period of 10 to 45 years.
For Tier 2 assessments, IrrigWQ runs the SWB model for at least 10 years and calculates values for the different suitability indicators for each year, or, in the case of crops, for each growing season. Normal weather variability causes simulated values to differ from year to year. Table 5 reports the variability in simulated profile salinity values over a 40-year period for a case where the site-specific variables mimic those of Tier 1. As would be expected, the results, thus, bear some similarity to those of Tier 1. However, the soil profile salinities predicted for Tier 2 are slightly higher than those predicted for Tier 1. This can be explained by the fact that Tier 2 simulations provide for some lag in drainage above field capacity depending on soil texture, resulting in a lower leaching efficiency compared to Tier 1 simulations, which assume instantaneous drainage. In addition, with Tier 1, an “ideal” volumetric soil saturation percentage of 50% is assumed, whilst for Tier 2, a soil texture-dependent saturation percentage is used. The Tier 2 results indicate that for 60% of the time (24 years of the 40-year simulation), the SWB model calculated a profile salinity of between 0 and 200 mS/m, and for 40% of the time, it predicted a value of between 200 and 400 mS/m (in fact, the values are all clustered around 200 mS/m). Although the Tier 1 and 2 outputs would, in this case, be interpreted to have similar implications, Tier 2 results, and the way they are reported, provide the user with more information about the range (as opposed to a mean value) of profile salinities that can be expected over time. It also provides the user with an indication of the risk or frequency with which higher or lower values can be expected to occur over an extended time period. The main advantage of Tier 2 simulations is, however, that its output is not limited by a predetermined set of assumptions but that the user can select the values of several variables to portray actual site-specific conditions. The above assumptions can, for example, be amended to investigate the effect of a lower leaching fraction. Reducing the leaching fraction to 5%, in this case, produces a predicted profile salinity of 200 to 400 mS/m for 100% of the time.

3.2.1. FFU Evaluations for Tiers 1 and 2

For the Tier 1 FFU evaluation (Table 4), IrrigWQ reports a single calculated profile salinity value. This value is displayed in the results column of the corresponding FFU category (in this case, the Ideal category, coloured blue). Because the calculated profile salinity value is reported (and not only the FFU category), information is also conveyed to the user about how close the predicted profile salinity is to the boundary of the FFU category, thereby providing some indication of how close the predicted value is from falling into the next FFU category.

3.2.2. WQR Determinations for Tiers 1 and 2

The range of irrigation water salinities presented in Table 6 indicates that when irrigating according to Tier 1 assumptions, an irrigation water EC of up to 106 mS/m will produce a soil profile salinity within the ideal FFU category (i.e., having a soil saturation extract salinity of less than 200 mS/m). This implies that if water quality managers wish to provide irrigation water that would not lead to soil profile salinities exceeding 200 mS/m, they should aim to supply irrigators with water not exceeding 106 mS/m. This corresponds with the FFU calculation, wherein irrigation with water having an EC of 100 mS/m was estimated to produce a soil profile salinity of 188 mS/m (Table 4). Conversely, irrigation water salinities exceeding 426 mS/m will produce an unacceptably high soil profile salinity, which exceeds 800 mS/m. Theoretically, it is possible to establish similar soil profile salinities while irrigating with waters of widely different ECs, provided the leaching regime is altered by adopting different irrigation management practices. Similarly, a range of soil profile salinities can be obtained by irrigating differently with the same EC water. While it is possible to specify these conditions for Tier 2 simulations, this is not possible for Tier 1 simulations since Tier 1 model parameters are fixed.
Several interacting variables, including weather variability, form part of the Tier 2 simulations, ensuring a range of potential outcomes for SWB-model simulations. It is, thus, important to specify realistic site-specific conditions when employing Tier 2 assessments. Even when using the same site-specific conditions, the variability in weather conditions from year to year ensures that each year has a unique irrigation water EC that will produce a specific target soil profile salinity. It was deemed undesirable to establish WQRs that accommodate the most extreme irrigation water EC that would still produce a specific target soil profile salinity. To be pragmatic, it was decided to define WQRs in IrrigWQ as those irrigation water EC values that would achieve the desired aim for 95% of the time. The WQR values reported in Table 7, thus, represent threshold irrigation water ECs that will, for 95% of the simulation period, produce the target soil profile salinity, i.e., in this case, for 95% of the time, an irrigation water salinity of 85 mS/m will produce a soil profile salinity of 200 mS/m or less. If we wished to achieve a soil profile salinity not exceeding 200 mS/m for 100% of the time (as is assumed for Tier 1), a threshold irrigation water EC lower than 85 mS/m would be required.
The same site-specific variables used for the Tier 2 FFU calculation were used for the Tier 2 WQR assessment. The soil profile salinities predicted for Tier 2 FFU evaluations are slightly higher than those predicted for Tier 1 (Table 4 and Table 5). Consequently, Tier 2 WQR calculations (Table 7) indicate that a lower irrigation water EC than for Tier 1 (Table 6) is required to establish comparable soil profile salinities.

3.3. Demonstration of Effect of Climate on Expected Crop Yield

Estimated crop yield is one of the suitability indicators used in IrrigWQ to assess the effect water constituents have on crop yield and quality. IrrigWQ estimates how crop yield is affected by irrigation water salinity, chloride, sodium, and boron contents. In line with the approach to provide a conservative FFU assessment for Tier 1, the yield response of a generic crop sensitive to water constituents is derived from mean concentrations in the root zone calculated using the Tier 1 steady-state procedure, assuming a 10% leaching fraction and no rain. Tier 2 estimates of crop yield are calculated with the SWB model, which has been customized to make use of user-selected values of site-specific variables. In line with the approach to establishing irrigation quality guidelines [2], IrrigWQ estimates crop yield from mean root zone salinity, boron, chloride, or sodium contents during the crop growing season.
Catering primarily for irrigation in arid regions, traditional water quality guidelines disregard the effect of climate when establishing criteria quantifying the effect of irrigation water salinity, boron, chloride, and sodium contents on crop yield. However, a qualitative discussion of the role climate plays in modifying the effect of salinity will often form part of explanatory narratives accompanying these guidelines. The Tier 2 assessments of IrrigWQ, on the other hand, incorporate climate as an integral factor that modifies the effect irrigation water constituents have on crop yield. The modifying effect of climate is quite complex since it is described by several variables affecting irrigation management. To illustrate how IrrigWQ succeeds in incorporating the effect of climate and, more specifically, precipitation amount and seasonality on crop yield, simulations were run for four summer rainfall sites with increasing mean annual precipitation and at a winter rainfall site in South Africa.
IrrigWQ simulated a period of 40 years, assuming irrigation of a maize crop, planted in early spring (1 September) on a 1 m deep sandy loam soil and irrigated with 200 mS/m water. The crop reached maturity after 120 days. A fallow period with no irrigation but with a continuation of rainfall, evaporation, and drainage followed each cropping period. The crop was irrigated to field capacity to replenish the accumulated water deficit whenever this exceeded 30% of plant available water and should, thus, not have experienced any water stress. No provision was made for water applications to facilitate leaching. The leaching predicted to occur, therefore, is a consequence of precipitation not utilised for evapotranspiration. A distinction is made in Table 8 between the water balance components during the crop growing season (identified as seasonal components) and annual components, which are calculated as the sums of the components over the crop growth and fallow periods over a year. There is a clear increase in the annual and seasonal precipitation, the amount of drainage, and the leaching fraction, from the driest (Upington) to the wettest (Pretoria) summer rainfall sites. The opposite is the case for irrigation, evaporation, and transpiration. The increase in the yield of maize (see Table 9) that is calculated by IrrigWQ to occur between the driest and wettest sites is, thus, to be expected and readily explained by lower root zone salinities caused by higher leaching fractions and increased dilution of irrigation water by higher precipitation levels. The calculated yields illustrate how IrrigWQ is able to predict and quantify how climate is expected to affect the FFU of particular water and highlight the potential benefit of using water that would be unfit for use in traditional arid irrigation areas for supplemental irrigation in areas with higher rainfall.
Further insight that IrrigWQ output can give the user into processes operating in the soil–plant–atmosphere continuum is highlighted by the obvious differences in yield between the Bloemfontein and Riebeek Wes sites, which receive the same annual precipitation (see Table 8 and Table 9). An obvious difference is that Riebeek Wes receives winter rainfall, while Bloemfontein falls in a summer rainfall area. Note that the seasonal precipitation (i.e., precipitation during the summer, crop growing season) for Riebeek Wes is only 165 mm compared to 485 mm for Bloemfontein. Precipitation during the fallow period would, thus, be 390 mm for Riebeek Wes and 80 mm for Bloemfontein, resulting in much better leaching of the Riebeek Wes soil profile during the fallow period, as also evidenced by the differences in seasonal and annual leaching fractions and the amount of drainage simulated to occur over the 40-year period (Figure 4 and Figure 5).

4. Discussion

IrrigWQ described herein is considered to be a first to integrate the various components in the soil–plant–atmosphere continuum into an electronic tool that can predict the effect of irrigation water constituents on a range of indicators that define their effect on soil quality, crop yield and quality, and irrigation infrastructure. While the Queensland SALF2 decision support tool [5] already presents a major improvement over more traditional approaches, it still relies on steady-state calculations and is currently limited in the range of suitability indicators that are considered. Without access to electronic computational tools, traditional water quality guidelines had to use simpler computational approaches to predict these effects and could not consider the site-specific factors incorporated in IrrigWQ. However, IrrigWQ uses established criteria similar to those used by traditional water quality guidelines to quantify the effect of irrigation water constituents on its FFU. Differences in FFU evaluations between traditional guidelines and IrrigWQ, thus, derive from the more sophisticated, dynamic, and site-specific approach of IrrigWQ. Each effect on FFU is categorised as being either ideal, acceptable, tolerable, or unacceptable and reported on in a user-friendly, colour-coded format. IrrigWQ thereby provides the user with an improved assessment of how a given water will affect a range of suitability indicators, each describing different components of soil quality, crop yield and quality, or irrigation infrastructure. Because of this functionality, IrrigWQ allows us to fundamentally change the question normally asked, “is this water fit for irrigation?” to “are there conditions under which this water is fit for irrigation?”.
IrrigWQ further provides the user with the ability to conduct either a rapid conservative (Tier 1) or more rigorous site-specific (Tier 2) evaluation of the suitability of specific water for irrigation. IrrigWQ also provides for the determination of WQRs, which are required for the management of water resources. Should the Tier 1 FFU assessment (that makes use of several conservative assumptions) not indicate potential problems with any of the suitability indicators, the water is deemed fit for use on all crops under all but the most exceptional circumstancesHowever, should a Tier 1 assessment identify potential problems with one or more of the suitability indicators, a more detailed, site-specific Tier 2 assessment is indicated. Tier 2 assessments allow users to select more appropriate site-specific variables (such as crop species, irrigation system and management, soil texture and weather data) to produce a much more rigorous assessment of soil–crop–water interactions. Running the SWB model over several years, enables some expression of the level of risk of negative effects, by calculating the likelihood of yield and other parameters falling into different suitability categories.
This paper provides some validation of Tier 2 IrrigWQ results. Crop yields that are statistically similar were obtained when the crop yields reported by the FAO guidelines [2] using a widely accepted traditional approach were compared with those calculated for Tier 2 in a virtual experiment using assumptions that approximated those of the FAO guidelines [2].
It is believed that the possibility to assess the suitability of irrigation water at different levels or Tiers is unique to IrrigWQ described herein. The ability to determine WQR is also considered novel in the field of water quality assessment. Soil profile salinity, one of the suitability indicators of soil quality, was used to illustrate the differences between the output of Tiers 1 and 2 for FFU assessments and to illustrate how FFU output differs from that of WQR determinations. For Tier 2 output to be meaningfully compared with that of Tier 1, the site-specific conditions used for Tier 2 simulations were adapted to emulate those of Tier 1. This mainly required the removal of the rainfall component from the weather data and, since Tier 1 operates using a 10% leaching fraction, employing an irrigation management regime that produced a mean leaching fraction of about 10% over a 40-year simulation period. The same irrigation water composition, having an electrical conductivity of 100 mS/m, was used for both Tiers 1 and 2 assessments of FFU.
Estimated crop yield is one of the suitability indicators used in IrrigWQ to assess the effect water constituents have on crop yield and quality. IrrigWQ estimates how crop yield is affected by irrigation water salinity, chloride, sodium, and boron contents. In line with the approach to provide a conservative FFU assessment for Tier 1, the yield response of a generic crop sensitive to water constituents is derived from mean concentrations in the root zone calculated using the Tier 1 steady-state procedure assuming a 10% leaching fraction and no rain. Tier 2 estimates of crop yield are calculated with the SWB model, which has been customized to make use of user-selected default site-specific variables. In line with the approach to establishing irrigation quality guidelines [2], crop yield is estimated from mean root zone salinity, boron, chloride, and sodium contents during the crop growing season.
Catering primarily for irrigation in arid regions, traditional water quality guidelines disregard the effect of climate when establishing criteria for the effect of irrigation water salinity on crop yield [1,2,3]. However, a qualitative discussion of the role climate plays in modifying the effect of salinity may often form part of an explanatory narrative. Nevertheless, the desirable leaching fraction calculated with the FAO procedure for a target crop yield/irrigation water EC combination would be the same, irrespective of climate. Unless somehow modified by the irrigation practitioner, this would, thus, lead to applying too much water, resulting in more deep drainage below the root zone than is actually required in higher rainfall areas. The Tier 2 assessments of IrrigWQ, however, incorporate climate as an integral factor that modifies the effect irrigation water constituents have on crop yield and other suitability indicators. The amount of water applied would be determined by site-specific irrigation management rules, which may, e.g., be aimed at minimising leaching. The contribution of climate in modifying the role that irrigation water salinity plays in determining crop yield was selected to illustrate the usefulness of IrrigWQ to consider and combine contributions of the various components of the soil–plant–atmosphere continuum, when assessing the FFU of irrigation water. Crop yield was calculated at four summer rainfall sites with increasing mean annual precipitation, and at one winter rainfall site, to illustrate how IrrigWQ can predict and explain the effect of climate and, more specifically, the amount and seasonality of precipitation on crop yield. Since the SALF2 decision support tool also considers the diluting effect of precipitation, its use in the last two examples would be expected to lead to generally similar conclusions as for Tier 2 assessments of IrrigWQ.

5. Conclusions

IrrigWQ for the assessment of FFU and the determination of WQR for irrigation water described in this paper is a valuable addition to the existing guidelines available for the evaluation of irrigation water quality. IrrigWQ is distinguished from currently available guidelines by the fact that it provides for much greater site specificity during the evaluation process, considers several other constituents not found in traditional guidelines, provides an indication of the risk associated with an intended use, and is available primarily as a software-based DSS operating at two levels of complexity (https://www.nbsystems.co.za, accessed on 21 November 2023). IrrigWQ uses criteria similar to those of existing guidelines to interpret the severity of the effect irrigation water constituents bring about on soil quality, crop yield and quality, and irrigation infrastructure and, therefore, produces similar assessments when comparable situations are evaluated. Because of this use by IrrigWQ of internationally accepted cause–effect relationships to assess the effect of water quality constituents, it is believed that IrrigWQ will find universal acceptance and application among irrigation users. However, its strengths are best utilised during the evaluation of site-specific situations not considered by traditional guidelines. It is, for example, foreseen that IrrigWQ will play an important role in assessing the feasibility of irrigation developments that form part of a growing trend towards applying supplemental irrigation in areas not requiring full irrigation and of using unconventional sources of water for irrigation.

Author Contributions

Conceptualisation, H.M.d.P., J.G.A. and N.B.; methodology, H.M.d.P., J.G.A. and N.B.; software, N.B.; validation, H.M.d.P. and J.G.A.; formal analysis, H.M.d.P., J.G.A., and N.B.; investigation, H.M.d.P., J.G.A., and N.B.; resources, H.M.d.P., J.G.A. and N.B.; data curation, H.M.d.P., J.G.A. and N.B.; writing—original draft preparation, H.M.d.P.; writing—review and editing, H.M.d.P., J.G.A. and N.B.; visualisation, H.M.d.P., J.G.A. and N.B.; supervision, J.G.A.; project administration, J.G.A.; funding acquisition, J.G.A. All authors have read and agreed to the published version of the manuscript.

Funding

This research was funded by the South African Water Research Commission through a directed call with published terms of reference (Project No. K5/2399//4) and co-funded by the South African Department of Agriculture, Forestry, and Fisheries.

Institutional Review Board Statement

Not applicable.

Informed Consent Statement

Not applicable.

Data Availability Statement

IrrigWQ was developed using the open-source Lazarus Platform (http://www.lazarus-ide.org, accessed on 6 September 2023), with Firebird (https://firebirdsql.org/en/firebird-4-0-1/, accessed on 6 September 2023) used as the database. The algorithms used in the calculation procedures were based on published data, as cited in this paper. There are no measured data linked to this paper—only scenario simulations. The software described in this paper is downloadable free of charge from www.nbsystems.co.za, accessed on 6 September 2023.

Conflicts of Interest

The authors declare no conflict of interest.

References

  1. United States Salinity Laboratory Staff. Diagnosis and Improvement of Saline and Alkali Soils; Agriculture Handbook No. 60; USDA: Washington, DC, USA, 1954. [Google Scholar]
  2. Ayers, R.S.; Westcot, D.W. Water Quality for Agriculture; Food and Agriculture Organization of the United Nations: Rome, Italy, 1985. [Google Scholar]
  3. Agricultural Salinity Assessment and Management; ASCE Manuals and Reports on Engineering Practice No. 71; Tanji, K.K. (Ed.) ASCE: New York, NY, USA, 1990. [Google Scholar]
  4. Zaman, M.; Shahid, S.A.; Heng, L. Irrigation water quality. In Guideline for Salinity Assessment, Mitigation and Adaptation Using Nuclear and Related Techniques; Springer: Cham, Switzerland, 2018; pp. 113–131. [Google Scholar]
  5. SALF2 Salinity Modeling Tool. Version 2.2.2a. 2022. Available online: https://www.publications.qld.gov.au/dataset/salinity-management-handbook/resource/4b2b58ae-1b6d-46f0-a64f-e5d6ff17d308?inner_span=True (accessed on 11 November 2023).
  6. Australian and New Zealand Environment and Conservation Council (ANZECC). Australian and New Zealand Guidelines for Fresh and Marine Water Quality; Australian Water Association: Artarmon, NSW, Australia, 2000. [Google Scholar]
  7. Canadian Council of Resource and Environment Ministers (CCREM). Canadian Water Quality Guidelines; Prepared by the Task Force on Water Quality Guidelines; The Council: Ottawa, Canada, 1987. [Google Scholar]
  8. Department of Water Affairs and Forestry RSA (DWAF). South African Water Quality Guidelines—4: Agricultural Use: Irrigation, 2nd ed.; DWAF: Pretoria, South Africa, 1996. [Google Scholar]
  9. Department of Water Affairs and Forestry RSA (DWAF). Development of SA Risk-Based Water Quality Guidelines: Phase 1: Needs Assessment and Philosophy; Coordinated by Heath, R.C., Ed.; DWAF: Pretoria, South Africa, 2008. [Google Scholar]
  10. du Plessis, M.; Annandale, J.; Benadé, N.; van der Laan, M.; Jooste, S.; du Preez, C.; Barnard, J.; Rodda, N.; Dabrowski, J.; Genthe, B.; et al. Risk Based, Site-Specific, Irrigation Water Quality Guidelines: Volume 2 Technical Support; WRC Report No TT 728/17 Water; Research Commission: Pretoria, South Africa, 2017. [Google Scholar]
  11. Lazarus: The Professional Free Pascal RAD IDE. Version 2.0.10. (Lazarus Team, 1993–2020). Available online: http://www.lazarus-ide.org (accessed on 6 September 2023).
  12. Firebird: Firebird Project (2000–2022). Available online: https://firebirdsql.org/en/firebird-4-0-1/ (accessed on 6 September 2023).
  13. Rhoades, J. Reclamation and management of salt affected soil after drainage. In Proceedings of the 1st Annual Western Provincial Conference Rationalization of Water and Soil Research and Management, Lightbridge, AL, Canada, 29 November–2 December 1982. [Google Scholar]
  14. Annandale, J.; Stirzaker, R.; Singels, A.; Van Der Laan, M.; Laker, M. Irrigation scheduling research: South African experiences and future prospects. Water SA 2011, 2011 37, 751–763. [Google Scholar] [CrossRef]
  15. Smith, M.; Allen, R.G.; Pereira, L.S. Revised FAO methodology for crop water requirements. In Proceedings of the International Conference on Evapotranspiration and Irrigation Scheduling, San Antonio, TX, USA, 3–6 November 1996; pp. 133–140. [Google Scholar]
  16. Annandale, J.; Jovanovic, N.; Benade, N.; Tanner, P. Modelling the long-term effect of irrigation with gypsiferous water on soil and water resources. Agric. Ecosyst. Environ. 1999, 76, 109–119. [Google Scholar] [CrossRef]
  17. Robbins, C.H. Solute transport and reactions in salt-affected soils. In Modelling Plant and Soil Systems; Agronomy Monograph No, 31; Hanks, R.J., Ritchie, J.T., Eds.; ASA-CSSA-SSSSA: Madison, WI, USA, 1991; pp. 365–395. [Google Scholar]
  18. Maas, E.V.; Hoffman, G.J. Crop salt tolerance—Current assessment. J. Irrig. Drain. Div. ASCE 1977, 103, 115–134. [Google Scholar] [CrossRef]
  19. Shainberg, I.; Letey, J. Response of soils to sodic and saline conditions. Hilgardia 1984, 52, 1–57. [Google Scholar] [CrossRef]
  20. US Environmental Protection Agency. US EPA Proposed Criteria for Water Quality; UP EPA: Washington, DC, USA, 1973; Volume 1, 93p. [Google Scholar]
  21. Maas, E.V. Crop Salt Tolerance. In Agricultural Salinity Assessment and Management; Tanji, K.K., Ed.; ASCE: New York, NY, USA, 1990; pp. 262–304. [Google Scholar]
  22. Teunis, P.F.M.; Moe, C.L.; Liu, P.; Miller, S.E.; Lindesmith, L.; Baric, R.S.; Le Pendu, J.; Calderon, R.L. Norwalk Virus: How Infectious is It? J. Med. Virol. 2008, 80, 1468–1476. [Google Scholar] [CrossRef] [PubMed]
  23. Nakayama, F.S.; Bucks, D.A. Water Quality in Drip/trickle Irrigation: A Review. Irrig. Sci. 1991, 12, 187–192. [Google Scholar] [CrossRef]
  24. Schulze, R.E.; Maharaj, M. 50 Years of Daily Hydro-Climatic Data per Quaternary Catchment in South Africa; CD with data; University of KwaZulu-Natal School of Bio-Resource Engineering and Environmental Hydrology: Pietermaritzburg, South Africa, 2006. [Google Scholar]
Figure 1. Simplified schematic representation of IrrigWQ’s structure.
Applsci 13 12625 g001
Figure 2. The IrrigWQ screen for capturing water quality parameters, with shaded fields calculated by IrrigWQ and not entered by the user. Note that calculators assist with the conversion of units for ion concentrations not reported in mg/L and the facility to check for apparent reliability of the water analysis.
Applsci 13 12625 g002
Figure 3. Input screen for selection of site-specific characteristics, with shaded fields populated by IrrigWQ (being derived from the selected weather station and soil texture characteristics).
Applsci 13 12625 g003
Figure 4. IrrigWQ simulated drainage during the maize cropping (red bars) and fallow periods (white bars) over a 40-year period in Bloemfontein.
Applsci 13 12625 g004
Figure 5. IrrigWQ simulated drainage during the maize cropping (red bars) and fallow periods (white bars) over a 40-year period in Riebeek Wes.
Applsci 13 12625 g005
Table 1. A qualitative description reflecting the increasing risk of negative effects and associated colour coding of DWS FFU water categories, as used in IrrigWQ.
Fitness-for-Use CategoryDescription
IdealA water quality that would not normally impair the fitness of the water for its intended use
AcceptableA water quality that would exhibit some impairment to the fitness of the water for its intended use
TolerableA water quality that would exhibit increasingly unacceptable impairment to the fitness of the water for its intended use
UnacceptableA water quality that would exhibit unacceptable impairment to the fitness of the water for its intended use
Table 2. Criteria used by IrrigWQ to determine the FFU category of suitability indicators.
IdealAcceptableTolerableUnacceptable
Suitability IndicatorMeasure of Suitability IndicatorCriteria for Indicators of Soil Quality
Soil profile salinityEC of saturation extract (mSm)0–200200–400400–800>800
Soil permeabilityDegree of reduced permeabilityNoneSlightModerateSevere
Oxidisable carbon loadingCOD load (kg/ha per month)0–400400–10001000–1600>1600
Trace element accumulationNumber of years to reach soil accumulation threshold>200 years150–200 years100–150 years<100 years
Criteria for Indicators of Crop Yield and Quality
Root zone effectsRelative crop yield as affected by EC, B, Cl, and Na90–100%80–90%70–80%<70%
Leaf scorching when wettedDegree of leaf scorching caused by Cl and NaNoneSlightModerateSevere
Nutrient supplyContribution to estimated NPK removal by crop0–10%10–30%30–50%>50%
Microbial contaminationExcess infections per 1000 persons p.a.<11–33–10>10
Qualitative atrazine damageAtrazine load (g/ha)Differentiated levels depending on crop sensitivity and soil texture
Criteria for Indicators of Irrigation Equipment
CorrosionLangelier Index0 to −0.5−0.5 to −1.0−1.0 to −2.0<−2.0
ScalingLangelier Index0 to +0.5+0.5 to +1.0+1.0 to +2.0>+2.0
Clogging of drippersSuspended solids (mg/L)<5050–7575–100>100
Manganese (mg/L)<0.10.1–0.50.5–1.5>1.5
Total iron (mgL)<0.20.2–0.50.5–1.5>1.5
pH<7.07.0–7.57.5–8.0>8.0
E. coli (106 per 100 mL)<1.01.0–2.02.0–5.0>5.0
Table 3. Comparison of IrrigWQ-calculated relative crop yields to those reported by the FAO water quality guidelines [2] under comparable conditions.
Irrigation Water EC mS/mFAO Guidelines [2]IrrigWQ
LF RangeYield %LFYield % 1LFYield % 2
RangeMeanRangeMean
Barley
53015–2010015.494–9795.819.2100100
67015–209015.483–8785.419.290–9391.7
87015–207515.468–7370.919.277–8179.0
Wheat
40015–2010015.293–9694.419.199–10099.9
49015–209015.283–8785.219.190–9391.8
63015–207515.268–7370.619.177–8178.9
Soybean
33015–2010015.682–9086.219.596–10098.9
37015–209015.669–7873.519.585–9188.0
42015–207515.654–6558.819.571–7874.8
Maize
11015–2010015.795–9796.419.698–10099.1
17015–209015.782–8583.719.687–8988.2
25015–207515.767–7068.719.673–7674.8
Carrots
7015–2010015.093–9594.319.997–9897.4
11015–209015.083–8684.319.988–9089.0
19015–207515.062–6765.119.971–7472.5
1 Yield correlated with those of the FAO water quality guidelines [2] with an R-squared of 0.87. 2 Yield correlated with those of the FAO water quality guidelines [2] with an R-squared of 0.96.
Table 4. Tier 1 output displaying how irrigating with 100 mS/m water will affect the soil profile salinity suitability indicator.
Soil Profile SalinityFitness for UseECe Interval (mS/m)Predicted Equilibrium Soil Profile Salinity
(mS/m)
Ideal0–200188
Acceptable200–400
Tolerable400–800
Unacceptable>800
Table 5. Tier 2 output displaying the effect of irrigating with 100 mS/m water on the soil profile salinity suitability indicator, when using assumptions similar to those of Tier 1 to define Tier 2 site-specific conditions.
Soil Profile
Salinity
Fitness for UseECe Interval
(mS/m)
% of Time Soil Profile Salinity Is
Predicted to Fall within a Particular
Fitness-for-Use Category
Ideal0 – 20060
Acceptable200 – 40040
Tolerable400 – 800
Unacceptable>800
Table 6. Tier 1-calculated irrigation water EC range (i.e., WQRs) that would give rise to the soil profile salinity in the corresponding FFU category.
Soil Profile
Salinity
Fitness for UseECe Interval
(mS/m)
EC Range That Will Give Rise to the
Corresponding ECe
(mS/m)
Ideal0–200<106
Acceptable200–400106–213
Tolerable400–800213–426
Unacceptable>800>426
Table 7. Tier 2-calculated EC range of irrigation water (i.e., WQRs) that would give rise to the soil profile salinity in the corresponding FFU category.
Soil Profile
Salinity
Fitness for UseECe Interval
(mS/m)
Irrigation Water EC That Will Give Rise to the Corresponding ECe
for 95% of the Time
(mS/m)
Ideal0–200<85
Acceptable200–40085–179
Tolerable400–800179–376
Unacceptable>800>376
Table 8. Mean water balance components for a maize crop grown at four Summer rainfall sites with increasing mean annual rainfall and a winter rainfall site over a period of 40 years.
Mean Water Balance ComponentsWeather Station
UpingtonVaalhartsBloem-FonteinPretoriaRiebeek Wes
Rainfall seasonSummerSummerSummerSummerWinter
Annual precipitation (mm)163454565700555
Seasonal precipitation (mm)134393485633165
Seasonal irrigation (mm)827558484340567
Seasonal evaporation (mm)347335331301241
Seasonal transpiration599539513468478
Seasonal evapotranspiration (mm)945874844769719
Seasonal drainage (mm)168012920732
Seasonal leaching fraction (%)1.78.413.321.24.3
Annual leaching fraction (%)2.29.514.021.917.0
Lowest seasonal root zone salinity
(mS/m in saturation extract)
275110724791
Highest seasonal root zone salinity
(mS/m in saturation extract)
2557540376189249
Table 9. Percentage of time the relative yield of a maize crop is calculated to fall within four relative yield categories at four summer rainfall sites with increasing mean annual rainfall and a winter rainfall site (Riebeek Wes) over a period of 40 years when irrigated with 200 mS/m water.
Relative Yield (%)% of Time Yield Is Predicted to Fall within a Corresponding Yield Range
UpingtonVaalhartsBloemfonteinPretoriaRiebeek Wes
90–10003278100100
80–902351800
70–80522500
<709210000
Disclaimer/Publisher’s Note: The statements, opinions and data contained in all publications are solely those of the individual author(s) and contributor(s) and not of MDPI and/or the editor(s). MDPI and/or the editor(s) disclaim responsibility for any injury to people or property resulting from any ideas, methods, instructions or products referred to in the content.

