Article

Shear Strength Analysis and Slope Stability Study of Straight Root Herbaceous Root Soil Composite

1
Urban and Rural Construction Institute, Hebei Agricultural University, Baoding 071001, China
2
Hebei Provincial Institute of Building Science Co., Ltd., Shijiazhuang 050200, China
3
Hebei Provincial Construction Engineering Quality Inspection Center Co., Ltd., Shijiazhuang 050200, China
*
Author to whom correspondence should be addressed.
Appl. Sci. 2023, 13(23), 12632; https://doi.org/10.3390/app132312632
Submission received: 9 October 2023 / Revised: 4 November 2023 / Accepted: 22 November 2023 / Published: 23 November 2023

Abstract

:
The instability of bare slopes is a prevalent concern. The root system of herbaceous vegetation enhances the shear strength of shallow slope soil. This study investigated the mechanism of the root-soil system as well as the effects of different influencing factors on the shear strength of the soil and slope stability. In particular, indoor experiments were conducted on rootless undisturbed soil (RUS) and undisturbed soil with a root system (USRS) using a triaxial compression apparatus to analyze the slope stability of composite soil with a Tagetes erecta root system. Significance tests and correlation analysis of the factors affecting shear performance were conducted. The slope reinforcement effect by the plant root system was simulated under 24 working conditions using the MIDAS finite element method. The results revealed the influence of the root content, moisture content, and stress on the shear strength of USRS, as well as the contribution degree and influence of these variables on the slope stability. Both RUS and USRS exhibited strain hardening during shearing. A strong negative (positive) correlation was observed between the internal friction angle (φ) (cohesion (c)) of the USRS and the root content (moisture content). The maximum deviatoric stress during shear failure of the USRS was 1.29 times higher than that of the RUS. Moreover, the root content was positively correlated with the slope safety coefficient and the slope of the line under different working conditions, whereas the slope angle was negatively correlated with the slope safety coefficient. The reinforcement effect by the root system resulted in a 11.2% increase in the safety coefficient and the improved stability of slopes with an angle larger than 1.5%. The findings of this study provide new insights into shallow slope stability in practical slope protection projects.

1. Introduction

China suffers as one of the countries with a higher incidence of landslides across the globe and the most severe soil erosion. The vigorous development of the national economy has led to the emergence of a large number of artificial slopes in areas of resource development and large-scale infrastructure construction. This has consequently resulted in serious soil erosion and desertification, exacerbating the degradation of the ecosystem [1,2,3]. With the increase in the construction scale, a landslide is no longer a local issue but rather a global problem affecting the overall goal of China’s ecological environment construction [4,5]. Thus, achieving the sustainable development strategy goal of balancing economic construction and environmental protection is urgently required [6]. Civil engineering measures have often been used for slope protection by preventing slope instability and damage. However, such measures can cause permanent damage to the ecology, as the original natural vegetation on the slope never recovers [7]. Many areas are currently struggling with low soil moisture content and a decline or degradation in desiccation-induced vegetation. Planting vegetation is the preferred approach to reconcile water resource conflicts, address ecological concerns, and prevent soil erosion [8]. Vegetation plays a significant role compared with other engineering methods due to benefits such as improving the eco-environment, reducing water loss and soil erosion, conserving water sources, and consolidating slopes. It is an effective measure for economic and environmentally friendly prevention and control. Employing vegetation to improve the stability of slopes is the future direction for slope protection [9,10].
In recent years, research on the mechanism of vegetation-based slope protection has yielded fruitful results, both domestically and internationally. Scholars have conducted numerous studies on the mechanical properties and mechanisms of root–soil fixation using both indoor and outdoor experiments as well as numerical simulations. These experiments mainly involve direct shear, in situ shear, triaxial compression, and unconfined compressive strength tests. Prior research confirms that root–soil interactions can enhance soil shear strength [11,12]. Therefore, an in-depth exploration of herbaceous plant root–soil interactions in mountainous zones is warranted to establish a scientific foundation for enhancing slope stability and preventing soil erosion [13,14,15]. Herbaceous vegetation eco-slope protection technology presents an economically and environmentally viable method for soil reinforcement and aligns with sustainability principles. This approach supports soil consolidation and mitigates shallow landslides. Table 1 summarizes the quantitative evaluation methods for various plant roots’ effects on soil reinforcement proposed by existing literature [16,17,18,19,20].
Several studies on slope stability [21,22,23] have employed Mohr–Coulomb strength theory to show that the extra cohesion provided by plant root systems gauges soil reinforcement effectiveness. Zhang et al. investigated the impacts of the plant root system on the soil internal friction angle and cohesion via triaxial compression tests [24,25]. A similar study by Nie et al. on root soil strength adopted a direct shear apparatus [26,27,28]. Lian et al. conducted indoor triaxial shear tests on undisturbed loess under different moisture contents and remolded loess with roots. The authors explored the impact of different root distribution modes on the shear strength performance of remolded loess [29]. Zhou et al. performed shear tests on herbaceous root–soil composites in loess areas to investigate the relationship between the shear displacement and strength of soil–root composites at different depths and soil moisture contents, revealing the mechanical friction effect between roots and soil [30]. Ma et al. conducted compression and triaxial compression tests on cohesionless roots and soil system-reinforced composite soil under wet–dry cycling conditions and explored the impact of the root system and wet–dry cycling number on the shear strength indexes of soil-reinforced composites [31]. Xu et al. investigated the shear characteristics of the native soil–root composite of the dominant species belonging to the family Iridaceae (genus Iris) in the source area of the Lanniqing landslide in Zhaotong, China, using direct shear tests. The results were compared with those of indoor reshaping composite tests using the same moisture content [32].
The shear test results of the root soil composite provide a basis for the analysis of slope stability. Scholars like Zhou et al. employed numerical simulation methods to explore erosion resistance and soil reinforcement effects of root–soil composites, considering shear strength and vegetation growth periods [33]. Chen used finite element software to simulate the influence of the root system on slope stability under different conditions such as root spacing, growth cycle, and lateral root angle [34]. Zhang et al. determined shear strength indicators through indoor direct shear tests of root soil composites, which were consistent with the results of finite element simulation direct shear tests. The infinite slope theory model has been used to analyze the slope stability when different distribution forms of roots act on sliding surfaces [35].
Slope instability occurs when shear stress in the slope surpasses the soil shear strength. Slope instability and failure often lead to crack formation, expansion, and aggregation. Field tests for slope instability can be challenging, and numerical simulations offer an effective alternative [36]. The key factors affecting plant slope stability include the shear and tensile properties of root–soil composites and root distribution patterns. In addition to triaxial shear tests, indoor direct shear tests are also commonly used to determine the shear strength of soil–root composites. However, discrepancies between artificially determined shear failure planes and the actual weakest shear planes may occur.
Therefore, this study employs a triaxial apparatus for shear strength tests of undisturbed soil and determines the corresponding influencing factors. The impact of different root contents and depths on plant root reinforcement is considered. More specifically, consolidated undrained tests were conducted using a triaxial compression apparatus on intact powdery clay samples with and without the Tagetes erecta root systems at different sampling depths. We performed significance testing, correlation analysis, and finite element simulations to assess the effectiveness of slope protection under different working conditions. The results revealed the stress–strain relationship, the contribution of different factors, and the influence of the variables on the slope stability of Tagetes erecta root-reinforced soil for different soil moisture contents and root contents. The study comprehensively evaluated the efficacy of Tagetes erecta root system reinforcement on powdery clay slopes, providing a scientific basis for studying and applying the erosion resistance of plant root systems and soil reinforcement effects.

2. Methods and Materials
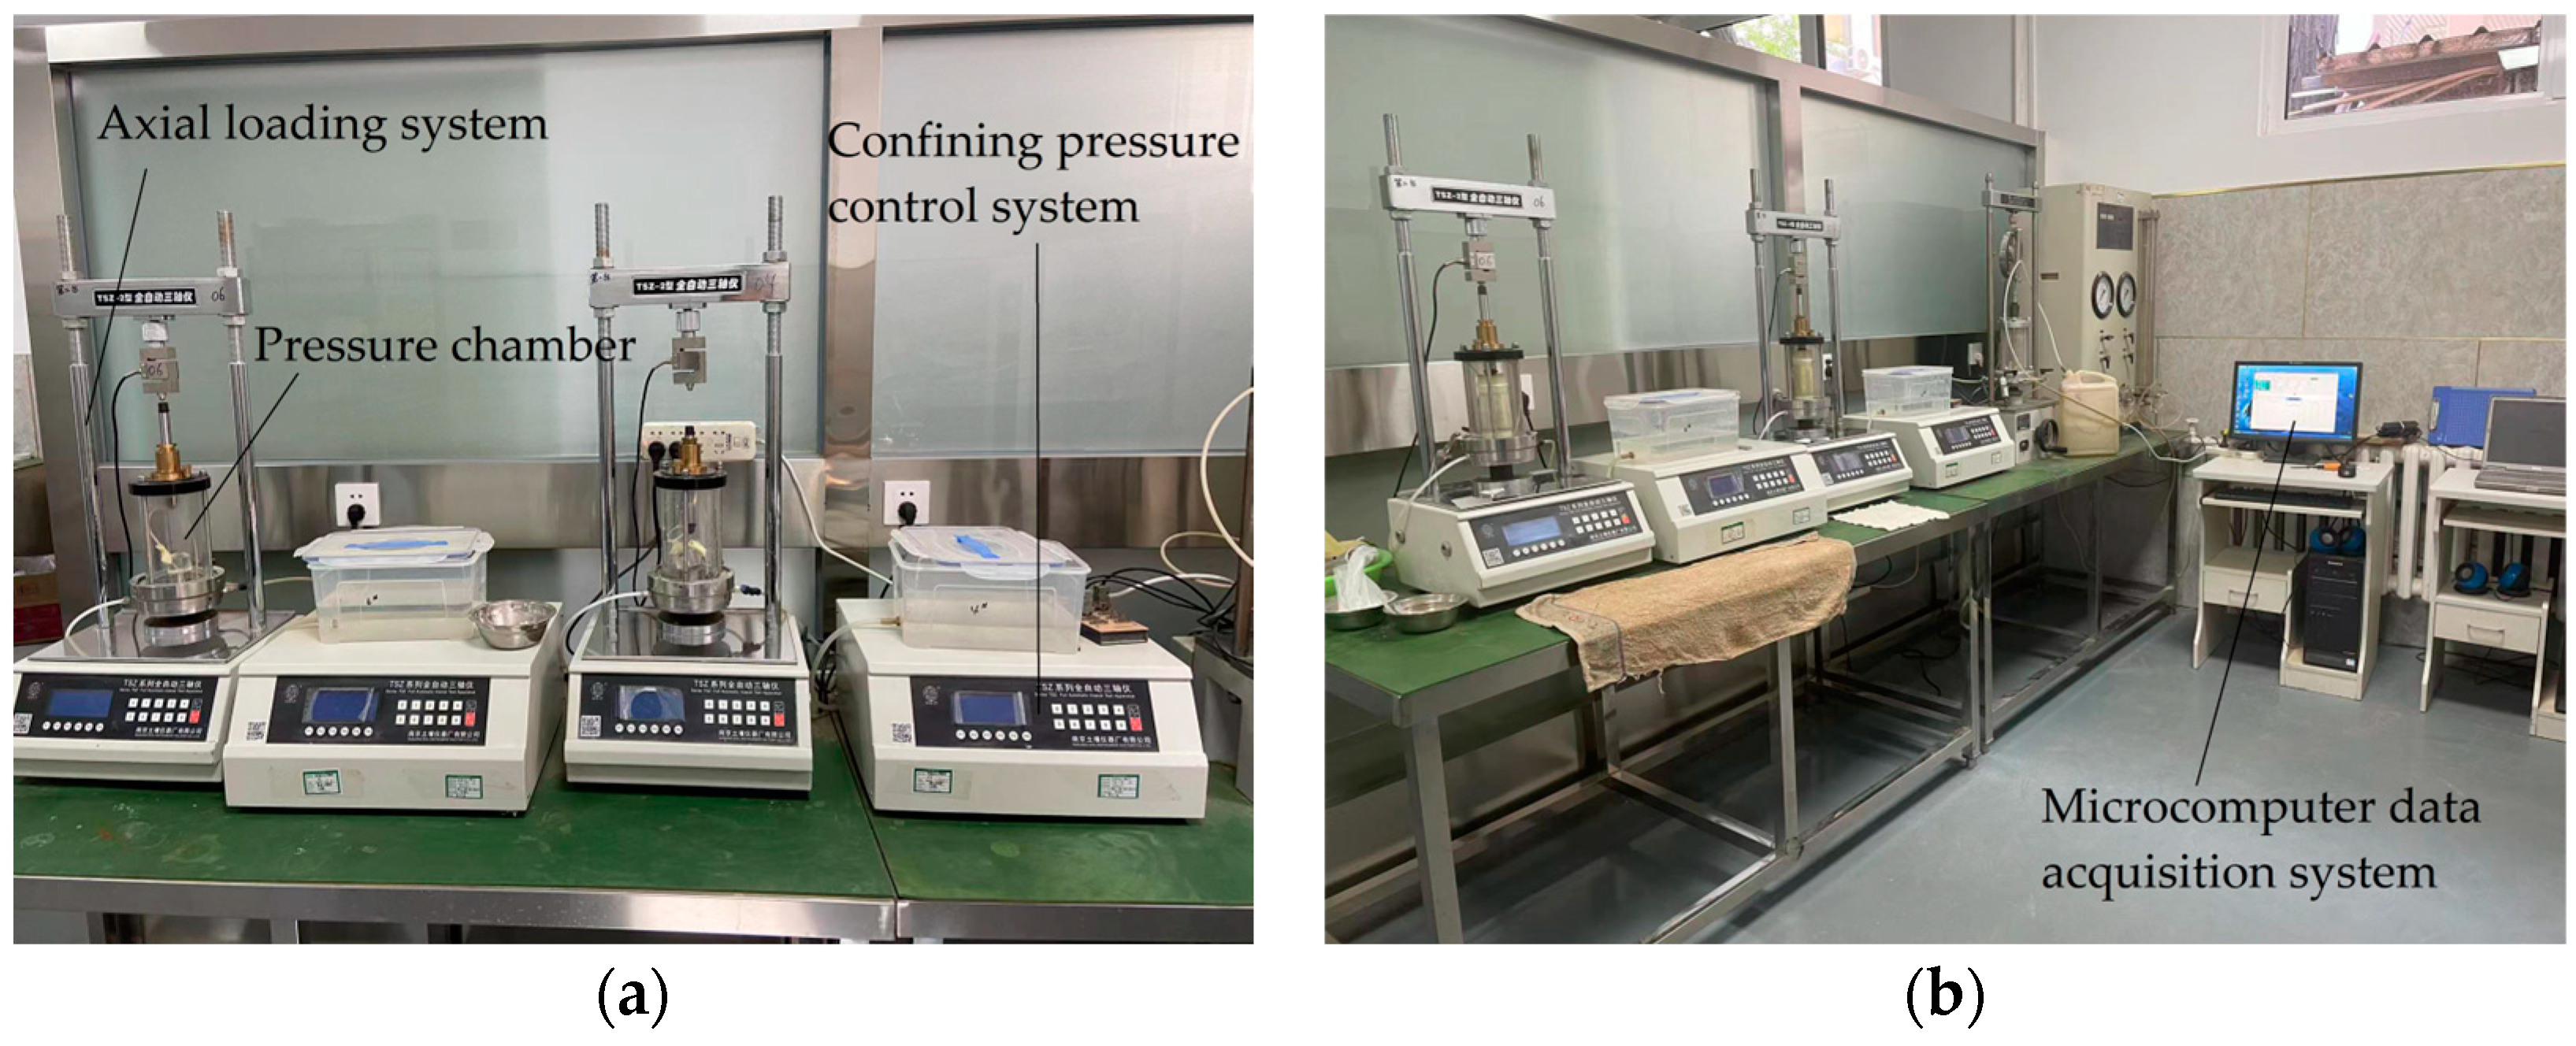
2.1. Test Equipment

The TSZ–2 triaxial shear apparatus (Nanjing Soil Instrument Factory Ltd., Nanjing, China) was used as the test equipment for this experiment. This instrument comprises a mainframe system and a backpressure system, with specimen diameters of 39.1 mm and 61.8 mm, a maximum axial load capacity of 30 kN, and a maximum shear rate of 2.4 mm/min. Vertical strain is controlled through a stepper motor with a continuous speed adjustment, ensuring the precise generation of strain and displacement. Backpressure is regulated using a precision hydraulic circuit system of precision digital pistons, facilitating the accurate application of confining pressure and measurements of volumetric changes and drainage. Figure 1 depicts the instrumental setup.

2.2. Experimental Site

The experimental site, situated in Xingtai, Hebei Province, China, was selected from the K35 + 373 section of the S75 Taihang Mountain Expressway in Xingtai (114°18′ E, 37°45′ N), Hebei Province, China. Located in a low mountainous region, the site’s ground elevation is 244.06–258.66 m, with significant undulations across the site. As it is located on a slope, surface runoff quickly accumulates in the lower areas of the site during rainfall. Rainwater primarily flows and drains towards the low-lying areas along the bedrock surface and weathered fractures, with limited infiltration into soil layers. This prevents groundwater storage, resulting in relatively simple hydrogeological conditions and a scant groundwater presence. In order to facilitate ecological restoration on the slopes, a group of mixed herbaceous plants was selected, including Medicago sativa, Bermuda grass, Kummerowia striata, Wild mugwort, and Tagetes erecta. Among them, Tagetes erecta is characterized by dense foliage, well-developed roots, and patchy growth and can effectively combat rainfall-induced soil erosion. This plant has displayed notable success in soil and water restoration in northern regions. Figure 2 presents the experimental site and samples of Tagetes erecta.

2.3. Sample Preparation

Undisturbed soil samples were collected from a uniformly vegetated and gently sloping area within the experimental site. A slope surface range (1 m length × 1 m width) was used as the borrow area. The soil around the burrow area was excavated to a depth of 0.8 m and cut into cubes with a side length of 20 cm using a wire saw and soil cutter. The extracted soil sample was wrapped and sealed with cling film to ensure that the original structure remained intact and to prevent moisture content loss and subsequently sent to the geotechnical laboratory for testing. Rootless soil was collected in an area approximately 1 m away from plants with roots. If no plants were found in the soil sampling area, the method above was used to collect soil samples to ensure the integrity of the soil structure.
The undisturbed soil with a root system (USRS) samples were prepared following the Standard Methods for Geotechnical Testing and Specifications for Highway Geotechnical Testing guidelines. For harder soil samples, a soil cutter or wire saw was used to cut soil columns slightly larger than the specified size. The upper and lower ends were flattened, and the columns were placed on a soil cutting frame according to the required hierarchical direction of the sample. Following this, a thin layer of oil was applied to the inner wall of the soil cutter blade edge, and the blade was aligned with the top surface of the soil sample. Pressure was then exerted on the soil cutter while cutting until it reached a height approximately 2 cm higher than the required sample height. The soil cutter was subsequently dismantled, the soil sample was removed, and both ends were flattened according to the required height. In particular, the two ends of the sample were flat and parallel to each other, with straight and uniform sides. If holes were formed on the sample surface during the cutting process due to encountering gravel, they were filled with the remaining soil after cutting. Finally, the soil blocks were trimmed with a cutting knife to form standardized samples with an 80 mm height and a 39.1 mm diameter, respectively. Figure 3 depicts the sample preparation and plant samples.

2.4. Experimental Design

Tagetes erecta, an herbaceous plant with a shallow root system, was selected to determine the shear strength indexes of undisturbed soil with a root system (USRS) and rootless undisturbed soil (RUS). USRS samples were acquired at distinct depths (20, 40, and 60 cm) while preserving their natural structure and moisture content (16.7%, 23% and 28.6%, respectively). Each depth yielded 20 soil samples. Undrained triaxial shear tests were performed under three levels of confining pressure (50, 100, and 200 kPa) using the consolidated undrained method. The testing of the sample adopted the suction saturation method. The saturator containing the sample was placed in an anhydrous extraction cylinder for suction. When the vacuum approached 1 local atmospheric pressure, suction was maintained for at least 0.5 h, and water was slowly injected to maintain a stable vacuum. Pumping was stopped when the saturator was completely submerged and the vacuum was subsequently released from the cylinder. The sample was left standing underwater for over 10 h and then taken out and weighed.
The water surface of the measuring tube was placed at the center height of the sample, the measuring tube valve was opened, and the sensor was read. When applying confining pressure, the body transformer sensor or body transformer pipe and pore pressure valves were closed, and the surrounding pressure valves were opened. The confining pressure was applied at 50, 100, and 200 kPa. The pore water pressure valve was then opened in order to measure the pore water pressure. Following this, the drain valve was opened to allow for drainage process measurements, whereby the drainage and pore pressure gauge readings were recorded until the pore water pressure dissipated by more than 95%. After consolidation was completed, the drain valve was closed, and the drainpipe and pore water pressure readings were recorded. The cutting rate of the sample was 0.08 mm/min. After completion, the motor was turned off, the lifting platform was lowered, and the air vent was opened. The water in the pressure chamber was drained, and the pressure chamber cover and rubber film outside the sample were removed to weigh the sample and measure the moisture content.
The selected Tagetes erecta variant had relatively long primary roots, with lengths within 10–20 cm, while the lateral roots were shorter, generally 8–10 cm. The mass percentage method was used to determine the root content of each sample, namely the ratio of root mass to soil mass. Table 2 reports the clayey silt sample parameters. The non-uniformity coefficient of the soil was 2.88, and the curvature coefficient was 1.58, indicating that the soil particles were relatively uniform. The maximum dry density was 1.58 g/cm3, the specific gravity of the soil particles was 2.72, the optimal moisture content was 16.7%, the plastic limit was 18.8%, and the liquid limit was 44.8%. Four representative samples were used per group in the experiment. Each root content type retained three similar root content data for subsequent correlation analysis. Upon completing all tests, the triaxial shear results of the undisturbed root-containing soil were compared and analyzed under equivalent confining pressures and root content conditions. For the shear test, the axial force (constant axial strain rate) was gradually increased, and the confining pressure was maintained to shear the specimen until it failed (failure typically occurs within 20% of the axial strain). If the strain–stress curve exhibited a peak, the failure deviation stress ( σ 1 σ 3 ) f was denoted as the deviation stress corresponding to the peak. However, if the testing curve exhibited continuous hardening without a peak, the deviatoric stress corresponding to 15% of the axial strain value was denoted as ( σ 1 σ 3 ) f .

2.5. Shear Strength Expression of the Soil–Root Composite

The soil shear strength is not constant; rather, it increases with normal stress σ on the shear moving surface. Coulomb summarized the failure phenomena and the influencing factors of soil and proposed the shear strength calculation formula as
τ f = c + σ tan   φ
where τ f is the shear stress on the shear sliding plane (kPa), σ   tan   φ is the frictional strength (kPa), φ is the internal friction angle (°), and c is the cohesion (kPa).
Based on reinforced soil principles, scholars have analyzed the stressed state of the herbaceous plant soil–root composite by treating the plant root distribution in the soil as a three-dimensional distribution of reinforcing fibers. The reinforcement process provides additional cohesion c to the soil. Furthermore, the wrapping effect of the root system restricts the lateral deformation of the soil, thereby effectively improving the bearing capacity of the slope soil [16,17,30]. Here, the soil shear strength of the soil is expressed as
τ f = c + σ tan   φ + Δ c
Δ c = T N A cos   ψ + T N A sin   ψ tan   φ
ψ = arctan 1 k   or   ψ = arctan 1 k + cot i
where c is the additional cohesion (kPa), T N is the tensile stress on roots (N), A is the contact area between a single root and the surrounding soil (m2), ψ is the angle between the shearing direction and the root (°), i is the original angle (°) between the shearing plane and the root (°), and k is the shear deformation ratio.
In contrast, other scholars believe that the cohesion of the soil–root composite is collectively borne by the internal particles of the soil and the constraints between the root and the soil. The shear strength index of the soil–root composite is defined as the combination of the comprehensive c and the comprehensive φ . The total cohesion is the sum of the cohesion due to roots and the soil’s own cohesion [24,33,37]:
c = c s + c r
where c is the comprehensive cohesion (kPa), c r is the cohesion due to roots (kPa), and c s is the soil cohesion (kPa).

2.6. Data Processing and Visualization

Correlation analysis was performed using the rcorr function with Spearman’s rank correlation coefficient in the Hmisc package of R version 4.2.3 (https://www.r-project.org/, accessed on 1 September 2023). If the cohesion results failed to pass the normality test, the difference between groups was determined by a non-parametric Wilcox test in the R agricolae package, where a p value < 0.05 was considered to be statistically significant. Multiple linear regression models were implemented in the R base package. The models were validated by the exclusion of multicollinearity in models with a low variation inflation factor. The correlation analysis results were visualized, and significance tests were performed using the corrplot and ggpubr R packages, respectively.
We used the MIDAS GTS NX 2022 R1 (x64) geotechnical and tunnel finite element analysis software to simulate slope stability under different parameter conditions. Based on the Mohr–Coulomb constitutive model, the soil behavior was simulated, and a solid geometric model was established. In particular, the material properties were defined, the unit grids were automatically divided, and the boundary conditions were set. The working conditions were then analyzed, slope stability analysis was performed, and the effect cloud map was visualized.

3. Results

3.1. Stress–Strain Relationship of USRS

Figure 4 presents the stress–strain curves of RUS and USRS with different depths, moisture content, and root content.
Figure 4 reveals intriguing parallels in the stress–strain relationships across the three groups, namely, both USRS and RUS exhibit strain-hardening characteristics. Furthermore, the axial strain is observed to nonlinearly increase with the differential principal stresses (deviator stress). As the axial strain remains constant, the deviator stress increases with the confining pressure. A decreasing confining pressure results in a flatter stress–strain curve, while the curve steepens with an increasing confining pressure. Interestingly, USRS demonstrates a smaller increase in deviator stress compared to the rootless soil samples as the axial strain increases.

3.2. Strength Characteristics of USRS

Figure 5 depicts the sheer strength tangents determined based on the stress–strain relationship in Figure 4 and Mohr–Coulomb strength theory. Table 3 reports the USRS shear strength indexes and deviator stress at failure under varying moisture contents.
The shear strength tangents of the root-contained undisturbed soil are very close for the three moisture content levels at the root content stands of 0.20% and 0.31%, 0.15% and 0.18%, and 0.07% and 0.09%, respectively (Figure 5). Therefore, under the same stress conditions, the shear strength of root-containing undisturbed soil increases with the root content. However, when the root content surpasses the thresholds of 0.31%, 0.18%, and 0.09%, respectively, the shear strength of the soil–root composite stabilizes.
Table 3 reveals that the shear strength index of RUS decreases gradually with the increasing moisture content. The shear strength index of the root-composite soil is closely related to the moisture and root contents, with the cohesion and its additional increment increasing initially and subsequently decreasing with increasing root content under the same moisture content. However, the internal friction angle gradually decreases with increasing moisture content and gradually increases with increasing root content. Under the same moisture and root contents, the shear resistance of the soil–root composite increases with the confining pressure. Moreover, under the same moisture content, the shear strength of the soil–root composite gradually increases with the root content. The enhanced soil moisture content reduces the shear strength of the soil–root composite.

3.3. Significance and Correlation Analysis of Shear Resistance Indicators and Influencing Factors

3.3.1. Significance Analysis of Shear Resistance Indicators and Influencing Factors

Figure 6 depicts the influence of different root contents on the shear strength indexes of undisturbed soil for different moisture contents.
Figure 6a shows that the cohesion of undisturbed soil is maximized for the root content of 0.2%, followed by 0.31% and 0.12%. The correlation between the cohesion of RUS and undisturbed soil is highly significant for the root contents of 0.2% and 0.31% and not significant for the root content of 0.12%. The correlation between the cohesion of undisturbed soil with the root contents of 0.12% and 0.2% is highly significant and very significant for the root contents of 0.12% and 0.31%, respectively. In addition, the correlation between the cohesion of undisturbed soil with the root contents of 0.2% and 0.31% is insignificant. At the same moisture content, the median value increases with the root content and decreases slightly when the root content reaches 0.31%. The same trend in cohesion is observed at other levels. The cohesive force exhibits a slow downward trend with an increase in the moisture content and root burial depth.
The internal friction angle of undisturbed soil is maximized at the root content of 0.09%, followed by 0.07% and 0.06% (Figure 6f). The RUS exhibits the lowest internal friction angle. The correlation between the internal friction angle of RUS and undisturbed soil is highly significant for the root contents of 0.07% and 0.09% and significant for the root content of 0.06%. The correlation between the internal friction angle of USRS at the root contents of 0.06% and 0.09% is significant, while that for root contents of 0.06%, 0.07%, and 0.09% is insignificant. At the same moisture content, the median value increases with the root content, indicating a continuous increase in the internal friction angle. Moreover, as the moisture content and root burial depth increase, the internal friction angle exhibits a significant downward trend. This trend is significantly different from the cohesion trend.
The results indicate that further analysis beyond significance testing is required to determine the factors influencing the shear strength index.

3.3.2. Correlation Analysis between Shear Resistance Indicators and Influencing Factors

Figure 7 presents the correlation analysis results between the shear indicators and influencing factors. The moisture content exhibits a strong positive correlation with the root burial depth (p = 0), and the moisture content and root burial depth show a strong negative correlation with the internal friction angle (p = 0). A weak negative correlation (p > 0.1) is observed between the moisture content and root burial depth, and a significant negative correlation (p < 0.001) is determined for moisture content and root burial depth with root content. The root content exhibits a strong positive correlation with the cohesion and internal friction angle (p ≤ 0.00001), while the cohesion is weakly positively correlated with the internal friction angle (0.01 < p < 0.05).
The three key parameters affecting the shear strength of USRS are root content, moisture content, and root burial depth. A high moisture content promotes a deeper root system, and the root content decreases with an increase in soil depth. The reinforcement performance of the soil is reduced as the depth increases. Moreover, the rate of decrease in the internal friction angle is enhanced with a declining cohesion. A positive correlation is observed between the root content and the shear strength indicators for shallow soil with a high root content. This type of soil has high slope stability. Due to the strong positive correlation between the moisture content and the root burial depth, as well as the same correlation trend with other influencing factors, we selected one of the parameters for the subsequent analysis.

3.3.3. Multiple Linear Regression Analysis Results

Linear models I and II were established with the root content and moisture content as independent variables and the cohesion or internal friction angle of undisturbed soil as the dependent variables. Table 4 reports the results. The equations for linear models I and II are y1 = 2349.511 · x1 + 11.038 · x2 + 3.474 and y2 = 657.5393 · x1 − 70.9555 · x2 + 40.8992, respectively, where x1 denotes root content and x2 denotes moisture content. The p-values indicate that the root content significantly affects the cohesion of undisturbed soil, whereas the influence of moisture content is relatively small. The influence of the moisture content on the internal friction angle of undisturbed soil is significant, while that of the root content is relatively weak.

3.3.4. Three-Dimensional Correlation between Shear Strength Parameters with Root Content and Moisture Content

Figure 8 presents the three-dimensional relationship between USRS with different root and moisture contents, while Table 5 reports the surface-fitting results of the correlation data in Figure 8. The internal friction angle and cohesion were evaluated using the equation Y = Z + A·r + B·w + C·r2 + D·w2 + E·r·w, where r is root content, w is moisture content, and Y is the internal friction angle or cohesion. The goodness-of-fit results for the relationship between the shear strength index and root content and moisture content were R2 > 0.83 and R2 > 0.99, respectively. This indicates a high level of reliability in the fitting results. The root content played a major role in cohesion, while moisture content exerted a great influence on the internal friction angle.
Figure 9 presents the relationship of the failure deviation stress of USRS with root content and moisture content under different confining pressure conditions. Table 6 reports the surface-fitting results of the correlation data in Figure 9. The failure deviation stress was evaluated using equation Y = Z + A·r + B·w + C·r2 + D·w2 + E·r·w, where r is root content, w is moisture content, and Y is the failure deviation stress.
The goodness-of-fit for the relationship between root content, moisture content, and failure deviation stress was R2 > 0.96, indicating a high level of reliability in the fitting results. The fitting degree approached 1 as the confining pressure increased, revealing that the effects of the increased root content and reduced moisture content on the deviation stress were essentially mutually offset.

3.4. Slope Stability of Plant Roots

3.4.1. Slope Conditions and Geometric Model

The strength reduction finite element method is commonly used to solve nonlinear problems in slope engineering, and the shear strength index is derived to obtain the safety coefficient of the slope. We performed the numerical analysis of slope stability using 24 models with different working conditions for silty clay slopes under several root contents, root depths, and slopes. Table 7 reports the simulation conditions, and Figure 10 depicts the finite element model used to calculate the slope in the experimental area. The model has 8248 units and 418,947 nodes. We applied horizontal displacement constraints to the left and right boundaries of the model and horizontal and vertical constraints to the bottom boundary. The parameter values of the slope soil were measured in the laboratory, with a moisture content of 16.9%, an elastic modulus of 25.23 MPa, a cohesive force of 5.2 kPa, an internal friction angle of 20.3°, a density of 1.85 g/cm3, and a Poisson’s ratio of 0.3. Moreover, the slope angles were 40°, 45°, and 50°.

3.4.2. Results for Different Working Conditions

Figure 11 presents the equivalent plastic strain cloud diagram of slope instability under the representative working conditions, while Table 8 reports the maximum horizontal displacement (MHD), maximum vertical displacement (MVD), and maximum plastic strain during instability. The plastic zone occurs at the foot of the slope when the bare slope is unstable, and the maximum equivalent plastic strain (MEPS) is 0.781 when the slope is unstable at a 50° angle. Under the same working conditions, the MEPS increases with the slope. The MEPS is 44.7%, 49%, and 57.9% lower for the vegetated slope compared to bare slopes for the three slope angles, respectively. Although the root system reduces the equivalent plastic strain of the slope, the slope angle affects the plastic strain. Unlike the bare slope, the slope has no continuous plastic zone on the sliding surface. As the depth of the root system increases, the range of the plastic deformation zone becomes narrower, and the zone develops in the depth direction. These results indicate that herbaceous plant roots can prevent the deformation of shallow soil on slopes, reducing the risk of shallow landslides.
Table 8 reveals that the plant roots affect the displacement of the potential sliding surfaces in the x and z directions. The MHD and MVD of the 40° slope are 13.9% and 14.8% lower, respectively, for the vegetated slope compared to the bare slopes. Those of the 45° and 50° slopes are 13.1%, 12.9%, 12.6%, and 14.3% lower, respectively. This is attributed to the increase in the tensile strength and the surrounding soil induced by the root system, resulting in a higher compressive strength. Different root contents, root burial depths, and slope angles result in different stiffness values of the shallow slope while limiting the horizontal and vertical displacements. The friction between the soil and roots converts the shear stress into tensile stress and prevents the lateral deformation of the soil. Therefore, the horizontal displacement of the slope is significantly lower than the vertical displacement for the USRS.
The slopes of the three different slope angles exhibit similar trends in the relationship between the plant root parameters and safety coefficients (Figure 12). More specifically, the root content and root burial depth are positively correlated with the slope safety coefficient, whereas the slope angle is negatively correlated with the slope safety coefficient. The specific characteristics are as follows: (1) The safety coefficient is higher for vegetated slopes than for bare slopes. (2) Under a constant slope angle, the safety coefficient increases with an increase of plants in the root burial depth. (3) Under a constant slope angle and root depth, the safety coefficient increases with the root content. (4) For the same root content or root burial depth, an increase in the slope angle induces a decrease in the safety coefficient. (5) At different slope angles, the safety coefficient is 8.3%, 11.2%, and 3.2% higher, respectively, for the vegetated slope compared to bare slopes at different slope angles. Figure 13 presents the linear fits of the safety coefficients for different slope angles under the same operating conditions. The root content and root burial depth are positively correlated with the line slope. When the slope safety coefficient reaches the critical value of 1.0, the slope angle of the fitted curve is 0.8° larger for condition VIII than for condition I, indicating a 1.5% increase in the slope angle of bare soil.
The reinforcement effect by the root system results in a 3.2–11.2% increase in the safety coefficient and improved stability of slopes with an angle exceeding 1.5%. Therefore, using roots for slope reinforcement prevents the sliding surface from moving within the buried depth range of the root system and improves slope stability.

4. Discussion

4.1. Root–Soil Synergy Mechanism

By investigating the changes in the USRS root system following shear deformation, we observed distinct friction marks on the primary root surfaces. Moreover, minor fractures were observed in the lateral roots. This implies that under shear forces, the roots and soil collaboratively endure the load. Due to the distinct material properties of roots and soil, evident interlocking arises during initial deformation. As the shear force progressively increases, the roots gradually slide or tend to slide in the soil, relying on frictional resistance to counteract the movement. The primary roots experience tensile deformation, with the frictional resistance transferring the force to the surrounding soil mass along the direction of the main roots. Furthermore, the frictional resistance distribution along the lateral roots can inhibit the lateral deformation. Consequently, plant roots effectively suppress the emergence and expansion of tensile cracks in the soil, thereby enhancing soil strength. In practical slope engineering, embedding a specific volume of roots beneath potential sliding surfaces notably mitigates shallow landslide risks.

4.2. Influence of Test Methods on the USRS Shear Strength Parameters

Earlier studies typically employed indoor direct shear tests to assess the reinforcement impact of USRS due to challenges in preparing soil samples [38,39,40]. These tests aimed to determine the cohesion, internal friction angle, and shear strength of the soil–root composite. However, indoor and outdoor direct shear tests are associated with several limitations in the testing process. In particular, the shear failure surface is artificially fixed and can only be sheared along the horizontal interface between the upper and lower boxes, which is not necessarily the weakest shear plane of the soil sample. In addition, non-uniform shear strain and shear stress distributions can arise inside the specimen. Lastly, the shear surface of the soil sample gradually shrinks during the shearing process, yet shear strength computations are grounded in the original cross-sectional area of the soil sample. Thus, to enhance the testing validity, this study adopted triaxial tests to determine the shear strength parameters for USRS and RUS. This method, more practical in nature, ensures that the shear failure surface is the weakest plane. Consequently, the results gain enhanced credibility, thus providing a scientific basis for evaluating the shallow stability of real-world ecological slope-protection projects.
Investigating the impact of root content on soil–root composite material strength often involves employing remolded soil tests [41,42]. However, the evaluation of the influence of the root content on shear strength indicators through indoor shear tests of remolded soil–root composites presents challenges [43]. This arises from the multifaceted nature of shear strength in soil–root composites, influenced not only by plant species and the natural environment but also by numerous factors encompassing soil type, particle shape and gradation, void ratio, interparticle binding material, density, and moisture content. In particular, remolded soil samples fail to capture the original growth morphology and natural distribution of plant roots within the soil. Moreover, they do not fully represent the synergetic characteristics of the soil–root interface during the shearing process. Therefore, investigating shear strength attributes in soil–root composites via remolded soil samples, including determining the optimal root content [44,45,46], can only provide a theoretical basis for vegetation selection in ecological slope protection projects. It is almost impossible and unrealistic to determine the optimal root content for USRS.

4.3. Comparison of Shear Strength between USRS and RUS

The statistics of the experimental data reported in Table 3 reveal that at a moisture content of 16.7%, the root content ranges from 0.12% to 0.31%. In the confining pressure range of 50 to 200 kPa, USRS exhibits a deviation in the stress amplification compared to RUS during failure ranges from 4.2% to 14.6%. At the moisture content of 23.4%, the root content varies between 0.11% and 0.18%. In the same confining pressure range, the deviation stress amplification of USRS ranges from 18.3% to 28.8% compared to RUS during failure. Furthermore, with the moisture content of 28.6%, the root content ranges between 0.06% and 0.09%. Within the confining pressures ranges of 50 to 200 kPa, the deviation stress amplification of USRS relative to RUS during failure ranges from 13.7% to 26.6%. Notably, the maximum deviation stress at the shear failure for USRS can be up to 1.29 times higher than that of the RUS. This clearly demonstrates a marked improvement in soil shear strength due to the presence of plant roots.

4.4. Factors Affecting Slope Stability

Numerous factors affect slope stability, including internal factors, such as the rock and soil properties and geological conditions, and external factors, such as hydrogeological conditions, weathering, earthquakes, and human factors. The stability of shallow slopes can be enhanced by planting vegetation, amongst other methods. Slopes with plant roots on their surfaces are more stable than those with root systems at the foot or top of the slope [47]. The reinforcement effect of plant roots improves slope stability and reduces the range of influence of the sliding surface. Factors affecting slope stability include the root content, root burial depth, and slope angle.
Jia et al. employed numerical analysis to reveal that the safety coefficient of slopes was substantially influenced by the plant spacing. The stability of slopes with a plant spacing of 5 m was consistent with that of bare slopes [47]. Temgoua et al. observed tree spacing to improve slope stability [34,48]. Although these studies confirm that an increase in the cohesive force provided by plant roots reduces slope instability, high-density herbaceous plants are often planted on roadbed slopes. As the root content of the surface soil increases, the frictional force at the root–soil interface transfers the shear stress of the shallow soil to the deep soil, improving the soil strength of shallow slopes.
Temgoua et al. found that the root depth and the resulting increase in the cohesive force enhance slope stability [35,48], which is consistent with our results. The root content of plants increased cohesion, and a deeper root burial depth increased the slope safety coefficient. Temgoua’s model considers 2.1 m as the critical depth of the main root. In contrast, our calculation model focused on shallow slopes planted with herbaceous plants, with a maximum root depth of 0.6 m. Most sliding surfaces are located 1 m or more below the surface [49]. The root system only reinforces the soil when the root burial depth reaches the soil layer below the sliding surface.
Our model parameters were observed to influence slope stability. Poisson’s ratio had a negligible effect on the safety coefficient, while the elastic modulus only influenced slope deformation and displacement [34,50]. The slope angle significantly affected the safety coefficient of the slope, namely, the safety coefficient decreased as the slope angle increased. These results indicate that the root content and root burial depth affected slope stability, which is consistent with previous research. For example, Jia et al. found that the slope safety coefficients for different root structures decreased with an increase in the slope, while Tafti et al. observed that plant roots increased the safety coefficient [47,51].

5. Conclusions

This study investigated the shear performance of root soil composites of herbaceous plants represented by Tagetes erecta and the soil stabilization and slope protection effects of their roots. Based on the results, the following key conclusions were determined:
(1) Both RUS and USRS exhibited strain-hardening characteristics during the stress–strain shearing process. The maximum deviator stress during the failure of USRS reached up to 1.29 times that of RUS. Under identical moisture content conditions, the soil–root composite shear performance increased with the confining pressure and root content. Moreover, the shear strength of the soil–root composite decreased with increasing moisture content.
(2) The shear strength index of the soil–root composite was closely correlated with the moisture content and root content. At a constant moisture content, the cohesion and its added increment rose until they peaked and subsequently declined after an initial increase as the root content increases. Simultaneously, the internal friction angle gradually decreased with increasing moisture content and steadily increased with the root content.
(3) The multiple linear regression analysis results of the shear resistance indicators and the influencing factors were consistent with the results of the significance and correlation analyses. The root content significantly influenced the cohesion of undisturbed soil with the following characteristics: root content (+) > root burial depth (−) > moisture content (−). The influence of the moisture content on the internal friction angle of undisturbed soil was significant, with the following characteristics: moisture content (−) > root burial depth (−) > root content (+).
(4) The equivalent plastic strain and maximum displacement in the x and z directions were negatively correlated with the root content. The maximum equivalent plastic strain was 57.9% lower for the vegetated slope than for the bare slope at the slope angle of 50°. The reduction ratio of the maximum displacement was similar in the x and z directions under different working conditions.
(5) The root content and root depth were positively correlated with the safety coefficient and the safety coefficient slope under the same working conditions, while the slope angle was negatively correlated with the safety coefficient. The bare slope exhibited the lowest safety coefficient. The reinforcement effect by the plant root system resulted in a 3.2–11.2% increase in the safety coefficient and improved the stability of slopes with an angle exceeding 1.5%.
The results of this study serve as a valuable reference in the selection of plant species for ecological slope protection in the Taihang Mountains region. They also provide strong support for ecological slope design, shallow landslide prevention, and soil erosion control. In addition, although herbaceous plant roots can improve the shear resistance of shallow slopes, the reinforcement range is limited. Future research will focus on developing a comprehensive slope-protection mechanism that combines vegetation planting with other slope-protection approaches.

Author Contributions

Conceptualization, B.W.; methodology, B.W.; software, B.W.; validation, S.W.; resources, S.W.; data curation, B.W.; writing—original draft preparation, B.W.; writing—review and editing, B.W. and S.W.; visualization, B.W.; project administration, S.W.; funding acquisition, S.W. All authors have read and agreed to the published version of the manuscript.

Funding

This research was funded by the Hebei Province Construction Science and Technology Research Guidance Plan Project, China, grant number 2016-236.

Institutional Review Board Statement

Not applicable.

Informed Consent Statement

Not applicable.

Data Availability Statement

The analyzed datasets are available from the corresponding author on reasonable request. The data are not publicly available due to the reason below. The project sponsor believes that the research is progressiveness in the field of ecological environment, and the data should not be publicly available.

Acknowledgments

The authors would like to sincerely thank Soil Mechanics Laboratory, China Ordnance Industry North Survey, Design and Research Institute Co., Ltd. for providing test equipment to ensure subsequent data collection.

Conflicts of Interest

Author Bingyu Wang was employed by the company Hebei Provincial Institute of Building Science Co., Ltd. and Hebei Provincial Construction Engineering Quality Inspection Center Co., Ltd. The remaining authors declare that the research was conducted in the absence of any commercial or financial relationships that could be construed as a potential conflict of interest.

References

  1. Li, P.H.; Tariq, A.; Li, Q.T.; Ghaffar, B.; Farhan, M.; Jamil, A.; Soufan, W.; El Sabagh, A.; Freeshah, M. Soil erosion assessment by RUSLE model using remote sensing and GIS in an arid zone. Int. J. Digit. Earth 2023, 16, 3105–3124. [Google Scholar] [CrossRef]
  2. Guo, Z.Q.; Yan, Z.J.; Paerhati, M.; He, R.; Yang, H.; Wang, R.; Ci, H. Assessment of soil erosion and its driving factors in the Huaihe region using the InVEST-SDR model. Geocarto Int. 2023, 38, 2213208. [Google Scholar] [CrossRef]
  3. Liu, X.Y.; Zhang, X.W.; Gao, H.D.; Wang, G.; Zhang, S.X. How climate-induced wetting–drying cycles contribute to gully erosion: A case study from southern China. Catena 2023, 232, 107444. [Google Scholar] [CrossRef]
  4. Guo, Y.N.; Gong, C.G.; Yang, J.; Zhu, G.Q. Research progress on influence of herbaceous vegetation on slope stability. Acta Agrestia Sin. 2022, 30, 841–849. [Google Scholar] [CrossRef]
  5. Cheng, X.Y.; Yang, R.M.; Han, Y. Construction method for ecological protection of stone side slopes using composite vegetation concrete. Sci. Rep. 2023, 13, 16871. [Google Scholar] [CrossRef] [PubMed]
  6. Wu, X.P.; Yi, C.; Cui, W.W.; Zhang, Z.; Yan, C.; Xie, X.C. Analysis of human disturbance features in natural reserves and empirical research on their restoration: A case study of the Huangchulin nature reserve in Fujian Province. Sustainability 2023, 15, 2017. [Google Scholar] [CrossRef]
  7. Shen, Y.F.; Li, Q.; Pei, X.J.; Wei, R.J.; Yang, B.M.; Lei, N.F.; Zhang, X.C.; Yin, D.Q.; Wang, S.J.; Tao, Q.Z. Ecological restoration of engineering slopes in China—A review. Sustainability 2023, 15, 5354. [Google Scholar] [CrossRef]
  8. Liu, H.Y.; Liu, L.; Zhang, K.L.; Geng, R. Effect of combining biogeotextile and vegetation cover on the protection of steep slope of highway in northern China: A runoff plot experiment. Int. J. Sediment Res. 2023, 38, 387–395. [Google Scholar] [CrossRef]
  9. Chen, T.T.; Wang, Q.; Wang, Y.X.; Peng, L. Differentiation characteristics of karst vegetation resilience and its response to climate and ecological restoration projects. Land Degrad. Dev. 2023, 34, 5055–5070. [Google Scholar] [CrossRef]
  10. Sun, D.Y.; Li, J.Z.; Gong, Y.B. Effects of planting density of poaceae species on slope community characteristics and artificial soil nutrients in high-altitude areas. Sustainability 2023, 15, 8321. [Google Scholar] [CrossRef]
  11. Gan, F.L.; Wei, J.; Li, S.S. Root–soil friction mechanism of typical grasses on purple soil bunds in the Three Gorges Reservoir Area, China. J. Soil Sci. Plant Nutr. 2023, 23, 3381–3392. [Google Scholar] [CrossRef]
  12. Saadati, N.; Mosaddeghi, M.R.; Sabzalian, M.R.; Jafari, M. Soil mechanical reinforcement by the fibrous roots of selected rangeland plants using a large soil-root shear apparatus. Soil Tillage Res. 2023, 234, 105852. [Google Scholar] [CrossRef]
  13. Du, P.; Zhou, D.Q.; Liu, X.L.; Feng, Y.J. Deformation characteristics test and mechanism of arbor taproot soil complex in rainforests. Sci. Rep. 2023, 13, 5732. [Google Scholar] [CrossRef] [PubMed]
  14. Chen, Z.F.; Li, H.; Jiang, N.S.; Liu, C.K. Effects of freeze-thaw time and moisture content on shear strength of loess reinforced with Sophora japonica roots. Bull. Soil Water Conserv. 2023, 43, 43–49. [Google Scholar] [CrossRef]
  15. Burak, E.; Dodd, I.C.; Quinton, J.N. Do root hairs of barley and maize roots reinforce soil under shear stress? Geoderma 2021, 383, 114740. [Google Scholar] [CrossRef]
  16. Wei, Y.; Liu, Y.B.; Liu, X.H.; Chen, Y.; Yan, Z.H.; Du, Y.H. Study on shear strength of root-soil composite of Dolichos lablab and Medicago sativa in purple soil region. Acta Prataculturae Sin. 2023, 32, 82–90. [Google Scholar] [CrossRef]
  17. Bi, Y.L.; Luo, R.; Wang, S.M. Effect of inoculation on the mechanical properties of alfalfa root system and the shear strength of mycorrhizal composite soil. J. China Coil Soc. 2022, 47, 2182–2192. [Google Scholar] [CrossRef]
  18. Shen, Z.Y.; Li, G.Y.; Liu, C.Y.; Yu, D.M.; Hu, X.S.; Li, X.L. Mechanical properties of four plant roots and shear strength of root-soil complex in the source region of the Yellow River. Soil Water Conserv. China 2021, 7, 49–52. [Google Scholar] [CrossRef]
  19. Tan, X.Q.; Huang, Y.W.; Xiong, D.W.; Lv, K.; Chen, F.Q. The effect of Elymus nutans sowing density on soil reinforcement and slope stabilization properties of vegetation–concrete structures. Sci. Rep. 2020, 10, 20462. [Google Scholar] [CrossRef]
  20. Maffra, C.; Sousa, R.; Sutili, F.; Pinheiro, R. The effect of roots on the shear strength of texturally distinct soils. Floresta Ambiente 2019, 26, e20171018. [Google Scholar] [CrossRef]
  21. Lozada, C.; Mendoza, C.; Amortegui, J.V. Physical and numerical modeling of clayey slopes reinforced with roots. Int. J. Civ. Eng. 2022, 20, 1115–1128. [Google Scholar] [CrossRef]
  22. Masi, E.B.; Segoni, S.; Tofani, V. Root reinforcement in slope stability models: A review. Geosciences 2021, 11, 212. [Google Scholar] [CrossRef]
  23. Hubble, T.C.T.; Docker, B.B.; Rutherfurd, I.D. The role of riparian trees in maintaining riverbank stability: A review of Australian experience and practice. Ecol. Eng. 2010, 36, 292–304. [Google Scholar] [CrossRef]
  24. Zhang, C.B.; Chen, L.H.; Liu, Y.P.; Ji, X.D.; Liu, X.P. Triaxial compression test of soil–root composites to evaluate influence of roots on soil shear strength. Ecol. Eng. 2010, 36, 19–26. [Google Scholar] [CrossRef]
  25. Wei, J.; Shi, B.L.; Li, J.L.; Li, S.S.; He, X.B. Shear strength of purple soil bunds under different soil water contents and dry densities: A case study in the Three Gorges Reservoir Area, China. Catena 2018, 166, 124–133. [Google Scholar] [CrossRef]
  26. Nie, Y.; Chen, X.H.; Fu, Z.Y.; Zhou, C.; Hu, F.H.; Yi, Y.C.; Tao, X. Experimental research on strength and deformation of root fiber stabilized soil of ecology slope. J. Railw. Eng. Soc. 2011, 154, 6–9. [Google Scholar] [CrossRef]
  27. Xu, T.; Liu, C.Y.; Hu, X.S.; Xu, Z.W.; Shen, Z.Y.; Yu, D.M. Mechanical effects of vegetation protection on slope under loading conditions in loess areas of Xining Basin. Trans. Chin. Soc. Agric. Eng. 2021, 37, 142–151. [Google Scholar]
  28. Dou, H.H.; Zhang, Y.H.; Tian, Z.R.; Mu, H.Z. Effects of different plant root patameters on soil anti shear strength. Water Resour. Plan. Des. 2023, 7, 74–95. [Google Scholar] [CrossRef]
  29. Lian, B.Q.; Peng, J.B.; Zhan, H.B.; Wang, X.G. Mechanical response of root-reinforced loess with various water contents. Soil Tillage Res. 2019, 193, 85–94. [Google Scholar] [CrossRef]
  30. Zhou, X.; Wei, Y.; Li, D.R.; Jiang, J.; Zhang, C.B. Strengthening effects of alfalfa roots on soil shear resistance in loess region. Sci. Soil Water Conserv. 2019, 17, 53–59. [Google Scholar] [CrossRef]
  31. Ma, Q.; Wu, N.Z.; Xiao, H.L.; Li, Z.; Li, W.T. Effect of Bermuda grass root on mechanical properties of soil under dry–wet cycles. Bull. Eng. Geol. Environ. 2021, 80, 7083–7097. [Google Scholar] [CrossRef]
  32. Xu, Z.H.; Zhang, Y.; Tao, Z.P.; Cha, L.L.; Chen, Y.Y. Mechanical characterictics of undisturbed roots-soil composites from the source area of Lanniqiang landslide, Zhaotong. J. Soil Water Conserv. 2022, 36, 128–134. [Google Scholar] [CrossRef]
  33. Zhou, X.L.; Fu, D.S.; Wan, J.; Xiao, H.L.; He, X.Y.; Li, Z.X.; Deng, Q.X. The shear strength of root–soil composites in different growth periods and their effects on slope stability. Appl. Sci. 2023, 13, 11116. [Google Scholar] [CrossRef]
  34. Chen, Y.H. Influence of different root systems on slope stability. Jilin Water Resour. 2023, 494, 47–52. [Google Scholar] [CrossRef]
  35. Zhang, X.R.; Ma, Y.X.; Zhang, W.Y. Study on effect of vegetation root ditribution morphology on slope stability in cold and arid environment based on FLAC3D. Sci. Technol. Eng. 2023, 23, 3831–3838. [Google Scholar] [CrossRef]
  36. Cohen, D.; Lehmann, P.; Or, D. Fiber bundle model for multiscale modeling of hydromechanical triggering of shallow landslides. Water Resour. Res. 2009, 45, W10436. [Google Scholar] [CrossRef]
  37. Abernethy, B.; Rutherfurd, I.D. The distribution and strength of riparian tree roots in relation to riverbank reinforcement. Hydrol. Process. 2001, 15, 63–79. [Google Scholar] [CrossRef]
  38. Ge, R.L.; Zhang, C.F.; Meng, Z.J.; Si, Q.; Wu, Y.D. The shear property comparison of three roots-soil composites. J. Soil Water Conserv. 2014, 28, 85–90. [Google Scholar] [CrossRef]
  39. Li, Y.Z.; Fu, J.T.; Yu, D.M.; Hu, X.S.; Zhu, H.L.; Li, G.Y.; Hu, X.T. Mechanical effects of halophytes roots and optimal root content for slope protection in cold and arid environment. Chin. J. Rock Mech. Eng. 2015, 34, 1370–1383. [Google Scholar] [CrossRef]
  40. Chen, J.; Huang, J.D.; Chen, Z.W.; Chen, Q.T.; Fan, J.P.; Wu, G.W.; Ma, X.S.; Chen, J.Y. Research of plant protection on granite residual soil slope in north area of Guangzhou. J. Zhongkai Univ. Agric. Eng. 2016, 29, 18–22. [Google Scholar] [CrossRef]
  41. Dołżyk-Szypcio, K. Direct shear test for coarse granular soil. Int. J. Civ. Eng. 2019, 17, 1871–1878. [Google Scholar] [CrossRef]
  42. Wang, Y.Z.; Liu, X.F.; Zhang, Z.K.; Ma, D.G.; Cui, Y.Q. Experimental research on influence of root content on strength of undisturbed and remolded grassroots-reinforced soil. Chin. J. Geotech. Eng. 2015, 37, 1405–1410. [Google Scholar]
  43. Zhu, H.B.; Zhao, H.R.; Bai, L.Z.; Ma, S.A.; Zhang, X.; Li, H. Mechanical characteristics of rice root–soil complex in rice–wheat rotation area. Agriculture 2022, 12, 1045. [Google Scholar] [CrossRef]
  44. Chen, C.F.; Liu, H.X.; Li, Y.P. Study on grassroots-reinforced soil by laboratory triaxial test. Rock Soil Mech. 2007, 28, 2041–2045. [Google Scholar] [CrossRef]
  45. Chen, J.; Lie, X.W.; Huang, J.D.; Li, Y.; Lv, J.G.; Qiu, J.H. Experimental research on reinforcement mechanism of herbs root system on granite residual soil slope. J. Soil Water Conserv. 2018, 32, 104–108. [Google Scholar] [CrossRef]
  46. Hu, Q.Z.; Zhou, Z.; Xiao, B.L.; Xiao, H.L. Experimental Research on Relationship Between Root Weight and Shearing Strength in Soil. Soil Eng. Found. 2010, 24, 85–87. [Google Scholar] [CrossRef]
  47. Jia, X.C.; Zhang, W.; Wang, X.H.; Jin, Y.H.; Cong, P.T. Numerical analysis of an explicit smoothed particle finite element method on shallow vegetated slope stability with different root architectures. Sustainability 2022, 14, 11272. [Google Scholar] [CrossRef]
  48. Temgoua, A.G.T.; Kokutse, N.K.; Kavazović, Z. Influence of forest stands and root morphologies on hillslope stability. Ecol. Eng. 2016, 95, 622–634. [Google Scholar] [CrossRef]
  49. Arnone, E.; Caracciolo, D.; Noto, L.V.; Preti, F.; Bras, R.L. Modeling the hydrological and mechanical effect of roots on shallow landslides. Water Resour. Res. 2016, 52, 8590–8612. [Google Scholar] [CrossRef]
  50. Zheng, Y.R.; Chen, Z.Y.; Wang, G.X.; Ling, T.Q. Engineering Treatment of Slope & Landslide, 2nd ed.; People’s Communications Publishing House: Beijing, China, 2010; 204p. [Google Scholar]
  51. Emadi-Tafti, M.; Ataie-Ashtiani, B.; Hosseini, S.M. Integrated impacts of vegetation and soil type on slope stability: A case study of Kheyrud Forest, Iran. Ecol. Model. 2021, 446, 1094998. [Google Scholar] [CrossRef]
Figure 1. Instrumental setup: (a) TSZ–2 fully automatic triaxial shear apparatus; (b) microcomputer data acquisition and processing system.
Applsci 13 12632 g001
Figure 2. Experimental site and Tagetes erecta sample.
Applsci 13 12632 g002
Figure 3. Sample preparation and plant samples: (a) Preparation of soil samples containing roots (USRS); (b) Tagetes erecta sample.
Applsci 13 12632 g003
Figure 4. Stress–strain curves of rootless undisturbed soil (RUS) and undisturbed soil with root system (USRS): (a) RUS (I); (b) 0.12% (I); (c) 0.20% (I); (d) 0.31% (I); (e) RUS (II); (f) 0.11% (II); (g) 0.15% (II); (h) 0.18% (II); (i) RUS (III); (j) 0.06% (III); (k) 0.07% (III); (l) 0.09% (III). Note: I represents the root content at a depth of 0–20 cm; II represents the root content at a depth of 20–40 cm; and III represents the root content at a depth of 40–60 cm.
Applsci 13 12632 g004aApplsci 13 12632 g004b
Figure 5. Shear strength envelope: (a) I; (b) II; (c) III. Note: I refers to a depth of 0–20 cm, II refers to a depth of 20–40 cm, and III refers to a depth of 40–60 cm.
Applsci 13 12632 g005
Figure 6. Summary of the cohesive force and internal friction angle data of undisturbed soil for different moisture and root contents: (a) cohesive force of undisturbed soil for different root contents (0%, 0.12%, 0.20%, and 0.31%) at condition I; (b) cohesive force of undisturbed soil for different root contents (0%, 0.11%, 0.15%, and 0.18%) at condition II; (c) cohesive force of undisturbed soil for different root contents (0%, 0.06%, 0.07%, and 0.09%) at condition III; (d) internal friction angle of undisturbed soil for different root contents (0%, 0.12%, 0.20%, and 0.31%) at condition I; (e) internal friction angle of undisturbed soil for different root contents (0%, 0.11%, 0.15%, and 0.18%) at condition II; (f) internal friction angle of undisturbed soil for different root contents (0%, 0.06%, 0.07%, and 0.09%) at condition III. Note: condition I refers to a depth of 0–20 cm; condition II refers to a depth of 20–40 cm; and condition III refers to a depth of 40–60 cm. * represents statistical significance at p < 0.05; ** represents statistical significance at p < 0.01, *** represents statistical significance at p < 0.001, **** represents statistical significance at p < 0.0001, ns represents no significant difference.
Applsci 13 12632 g006aApplsci 13 12632 g006b
Figure 7. Correlation analysis results between the shear strength index and the root content, moisture content, and root burial depth. Note: blue represents a positive correlation; red represents a negative correlation; darker color represents higher correlation; circle size represents the absolute value of the correlation; and the number represents the p-value.
Applsci 13 12632 g007
Figure 8. Relationship of shear strength index with root content and moisture content: (a) cohesion; (b) internal friction angle.
Applsci 13 12632 g008
Figure 9. Relationship of failure deviation stress with root content and moisture content: (a) σ3: 50 kPa; (b) σ3: 100 kPa; (c) σ3: 200 kPa.
Applsci 13 12632 g009
Figure 10. Finite element model of the slope with a slope angle of 45°.
Applsci 13 12632 g010
Figure 11. Equivalent plastic strain cloud diagram of slope instability under representative working conditions: (a) condition I; (b) condition IV; (c) condition VI; (d) condition VIII; (e) condition I *; (f) condition IV *; (g) condition VI *; (h) condition VIII *; (i) condition I **; (j) condition IV **; (k) condition VI **; (l) condition VIII **.
Applsci 13 12632 g011
Figure 12. Slope safety coefficients under different working conditions: (a) β = 40°; (b) β = 45°; (c) β = 50°.
Applsci 13 12632 g012
Figure 13. Slope safety coefficients for eight working conditions and different slope angles. Note: I–VIII represent different working conditions under a constant slope angle.
Applsci 13 12632 g013
Table 1. Summary of research on the characteristics of plant root–soil complexes.
ReferenceTest EquipmentObserved Root–Soil Synergistic Effects
Gan F et al.
(2023) [11]
Direct shear equipment Under the action of 5% and 10% moisture content, Eleusine indica can significantly improve the shear strength of soil, and the root–soil interface exhibits the highest-friction characteristics.
Saadati N et al. (2023) [12]Direct shear equipmentThe shear strength of the root–soil composite is four times that of rootless soil.
Du P et al.
(2023) [13]
Direct shear equipmentThe cohesion of the root–soil composite with a root content of 0.71% increased by 50% compared to rootless soil, and the ductility increased by 37.5% compared to rootless soil.
Chen et al.
(2023) [14]
Triaxial shear equipment The shear strength of the root–soil composite can reach up to 1.18 times that of rootless soil, and the influence of roots on the internal friction angle of the soil is more significant than that of cohesion.
Wei et al.
(2023) [16]
Direct shear equipmentThe shear strength of the root–soil composite of Dolicho LablabL. and Medicago sativa increased by 14.06–63.81% and 1.18–26.65% compared to rootless soil, respectively. The cohesion trend is Dolicho LablabL. (31.64 kPa) > Medicago sativa (26.35 kPa) > rootless soil (10.92 kPa), and there is no significant difference in the internal friction angle.
Bi et al.
(2022) [17]
Triaxial shear equipmentThe cohesive force of Medicago sativa root–soil composite can reach up to twice that of rootless soil.
Shen et al.
(2021) [18]
Direct shear equipmentThe shear strength trend of the four studied herbaceous plants is Stipa purpurea Griseb (39.34 MPa) > Kobresia myosuroides (25.98 MPa) > Leontopodium nanum (25.31 MPa) > Ajania tenuifolia (12.72 MPa).
Burak E et al.
(2021) [15]
Direct shear equipmentThe maximum soil fixation effect of corn roots can reach six times that of barley roots.
Tan X Q et al.
(2020) [19]
Direct shear equipmentThe shear strength of the root–soil composite can reach up to 1.36 times that of rootless soil with an increase in plant root content.
Maffra C et al.
(2019) [20]
Direct shear equipmentWhen the root system acts on sandy soil, it increases the cohesion by 234%. When the root system acts on the clay, it increases the cohesion and internal friction angle by 32% and 14.4%, respectively.
Table 2. Sample group parameters for roots and soil.
Root Content/%Depth/cmMoisture Content/%Dry Density/
(g/cm3)
Average Root Diameter/mmMain Root System Length/cm
00–2016.71.58//
0.122.7 11.4
0.202.1 13.2
0.312.414.6
020–4023.41.42//
0.111.13.6
0.150.84.3
0.180.73.9
040–6028.61.33//
0.060.30.9
0.070.40.7
0.090.30.8
Table 3. Parameters related to shear strength of undisturbed soil with a root system (USRS).
Undisturbed Soil Sample Depth/cmMoisture Content/%Root Content /%Internal Friction Angle/(°)Cohesion/kPaAdditional Cohesion of Root-System/kPaFailure Deviation Stress/kPa
σ3 = 50σ3 = 100σ3 = 200
0–2016.7029.26.1 0121.1221.1421.1
0.1229.87.81.7127.0227.0427.0
0.2030.211.25.1138.8238.8438.8
0.3130.910.9 4.8137.8237.8437.8
20–4023.4024.15.8086.9155.9293.9
0.1124.77.61.895.5167.3310.9
0.1525.410.85.0109.3184.4334.6
0.1826.110.44.6111.9190.5347.6
40–6028.6020.35.2068.1121.2227.4
0.0620.87.11.975.6130.7240.8
0.0721.210.13.086.1142.8256.1
0.0921.49.82.786.2143.6258.5
Table 4. Results of linear regression analysis.
Linear ModelShear Strength
Index
Influence FactorEstimateStandard Errort-Valuep-Value
I c intercept3.4741.3432.5860.0130 *
root content2349.511276.7468.4906.75 × 10−11 ***
moisture content11.0385.0662.1790.0346 *
II φ intercept40.89920.3427119.3432 × 10−16 ***
root content657.539370.60599.3134.61 × 10−12 ***
moisture content–70.95551.2926–54.8942 × 10⁻¹⁶ ***
Note: Significance level: *** p < 0.001; 0.01; * 0.01 < p < 0.05. Linear model I: residual standard error, 1.512 for 45 degrees of freedom; multiple R-squared, 0.6285; adjusted R-squared, 0.612; F-statistic, 38.07 for 2 and 45 degrees of freedom; p-value, 2.106 × 10⁻¹⁰. Linear model II: residual standard error, 0.3858 for 45 degrees of freedom; multiple R-squared, 0.9903; adjusted R-squared, 0.9898; F-statistic, 2286 for 2 and 45 degrees of freedom; p-value, < 2.2 × 10⁻¹⁶. The root content is not a percentage.
Table 5. Fitting equation and analysis of the USRS shear strength indicators.
YY = Z + A·r + B·w + C·r2 + D·w2 + E·r·wR2
ZABCDE
c 17.584−5.135−1.066−27.1820.0231.8020.836
φ 43.901−11.233−0.9449.3450.0040.8310.998
Table 6. Fitting equation and analysis of the USRS failure strength.
σ3
/kPa
Y
/kPa
Y = Z + A·r + B·w + C·r2 + D·w2 + E·r·wR2
ZABCDE
50 ( σ 1 σ 3 ) f 277.442−105.327−12.213−65.5070.17111.1010.968
100493.908−216.918−20.883−38.0400.27217.3670.986
200926.933−439.798−38.22916.7600.47629.8800.992
Table 7. Simulation conditions.
ConditionRoot Burial Depth/cmRoot Content/%
II *I **00
IIII *II **0–200.12
IIIIII *III **0–200.20
IVIV *IV **0–200.31
VV *V **0–20, 20–400.12, 0.11
VIVI *VI **0–20, 20–400.31, 0.18
VIIVII *VII **0–20, 20–40, 40–600.12, 0.11, 0.06
VIIIVIII *VIII **0–20, 20–40, 40–600.31, 0.18, 0.09
Note: * refers to a slope angle of 40°, ** refers to a slope angle of 50°; the normal slope is 45°.
Table 8. Maximum horizontal and vertical displacements (MHD and MVD) for different working conditions and maximum equivalent plastic strain (MEPS) during instability.
ConditionsMEPS During InstabilityDecreasing Proportion/%MHD/mMHD Reduction Ratio/%MVD/mMVD Reduction Ratio/%
I0.6367190.0323750.114286
II0.6353910.20.0314372.90.1131431.0
III0.55342613.10.0309024.60.1103153.5
IV0.54722114.10.0304695.90.1076675.8
V0.54365714.60.0297388.10.1057297.5
VI0.42860032.70.0294119.20.10266310.2
VII0.37541841.00.02876411.20.10153411.2
VIII0.32494649.00.02813113.10.09950312.9
I *0.6010050.0231680.111812
II *0.5499518.50.0227042.00.1102471.4
III *0.5441289.50.0220464.80.1071604.2
IV *0.51016015.10.0216496.60.1058745.3
V *0.49187818.20.0211738.60.1028038.1
VI *0.46153723.20.02053711.40.10013110.4
VII *0.45752823.90.02018812.90.09772712.6
VIII *0.33244744.70.01994613.90.09528414.8
I **0.7814740.0198700.119784
II **0.66214915.30.0193142.80.1163102.9
III **0.65189016.60.0191013.90.1136355.1
IV **0.64043018.00.0187965.40.1106817.6
V **0.54434230.30.0184767.00.1090209.0
VI **0.53578831.40.0180339.20.10575011.7
VII **0.47599739.10.01769011.00.10416413.0
VIII **0.32923557.90.01737212.60.10260114.3
Note: * slope angle of 40°, ** slope angle of 50°; the normal slope is 45°.
Disclaimer/Publisher’s Note: The statements, opinions and data contained in all publications are solely those of the individual author(s) and contributor(s) and not of MDPI and/or the editor(s). MDPI and/or the editor(s) disclaim responsibility for any injury to people or property resulting from any ideas, methods, instructions or products referred to in the content.

