


Numerical Study on Hydrodynamic Performance of a New Semi-Submersible Aquaculture Platform
 ,
,
Abstract
:1. Introduction
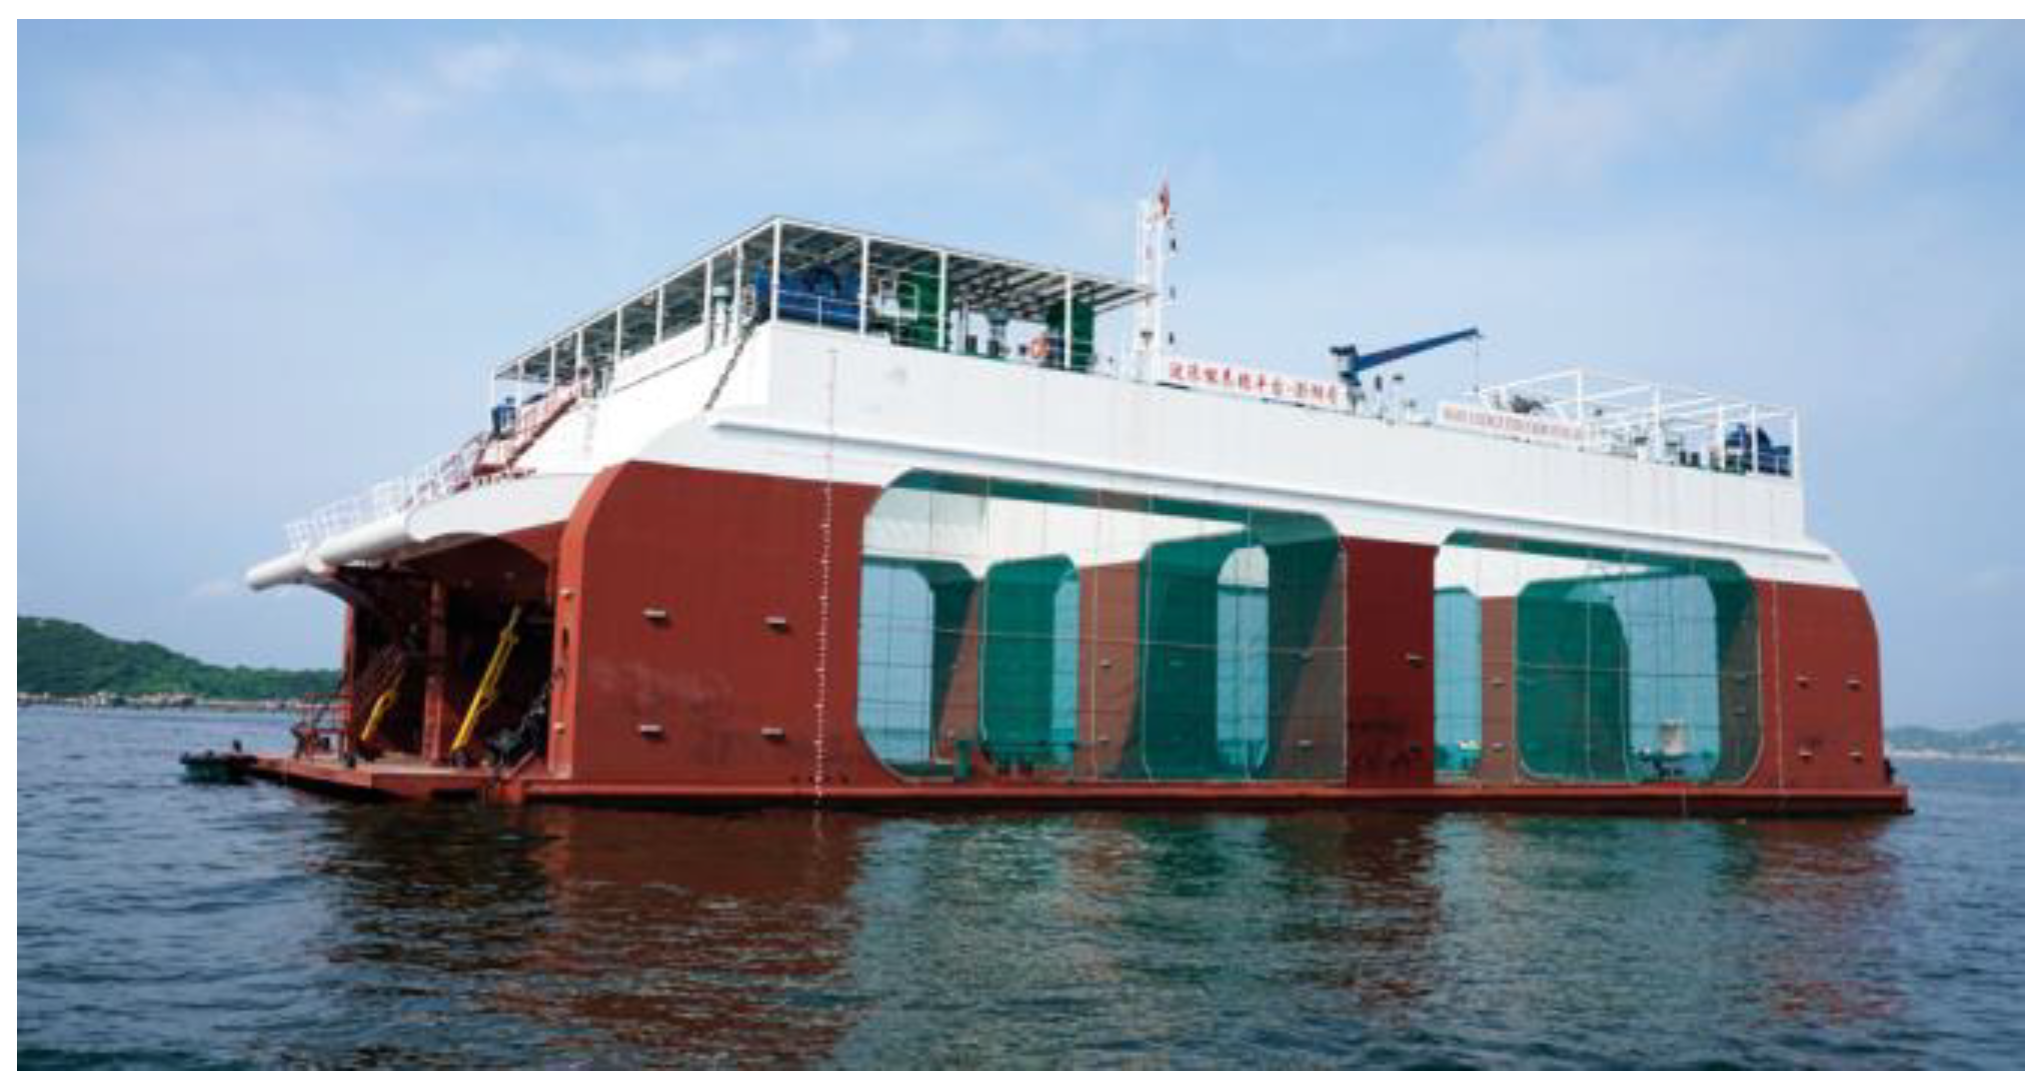
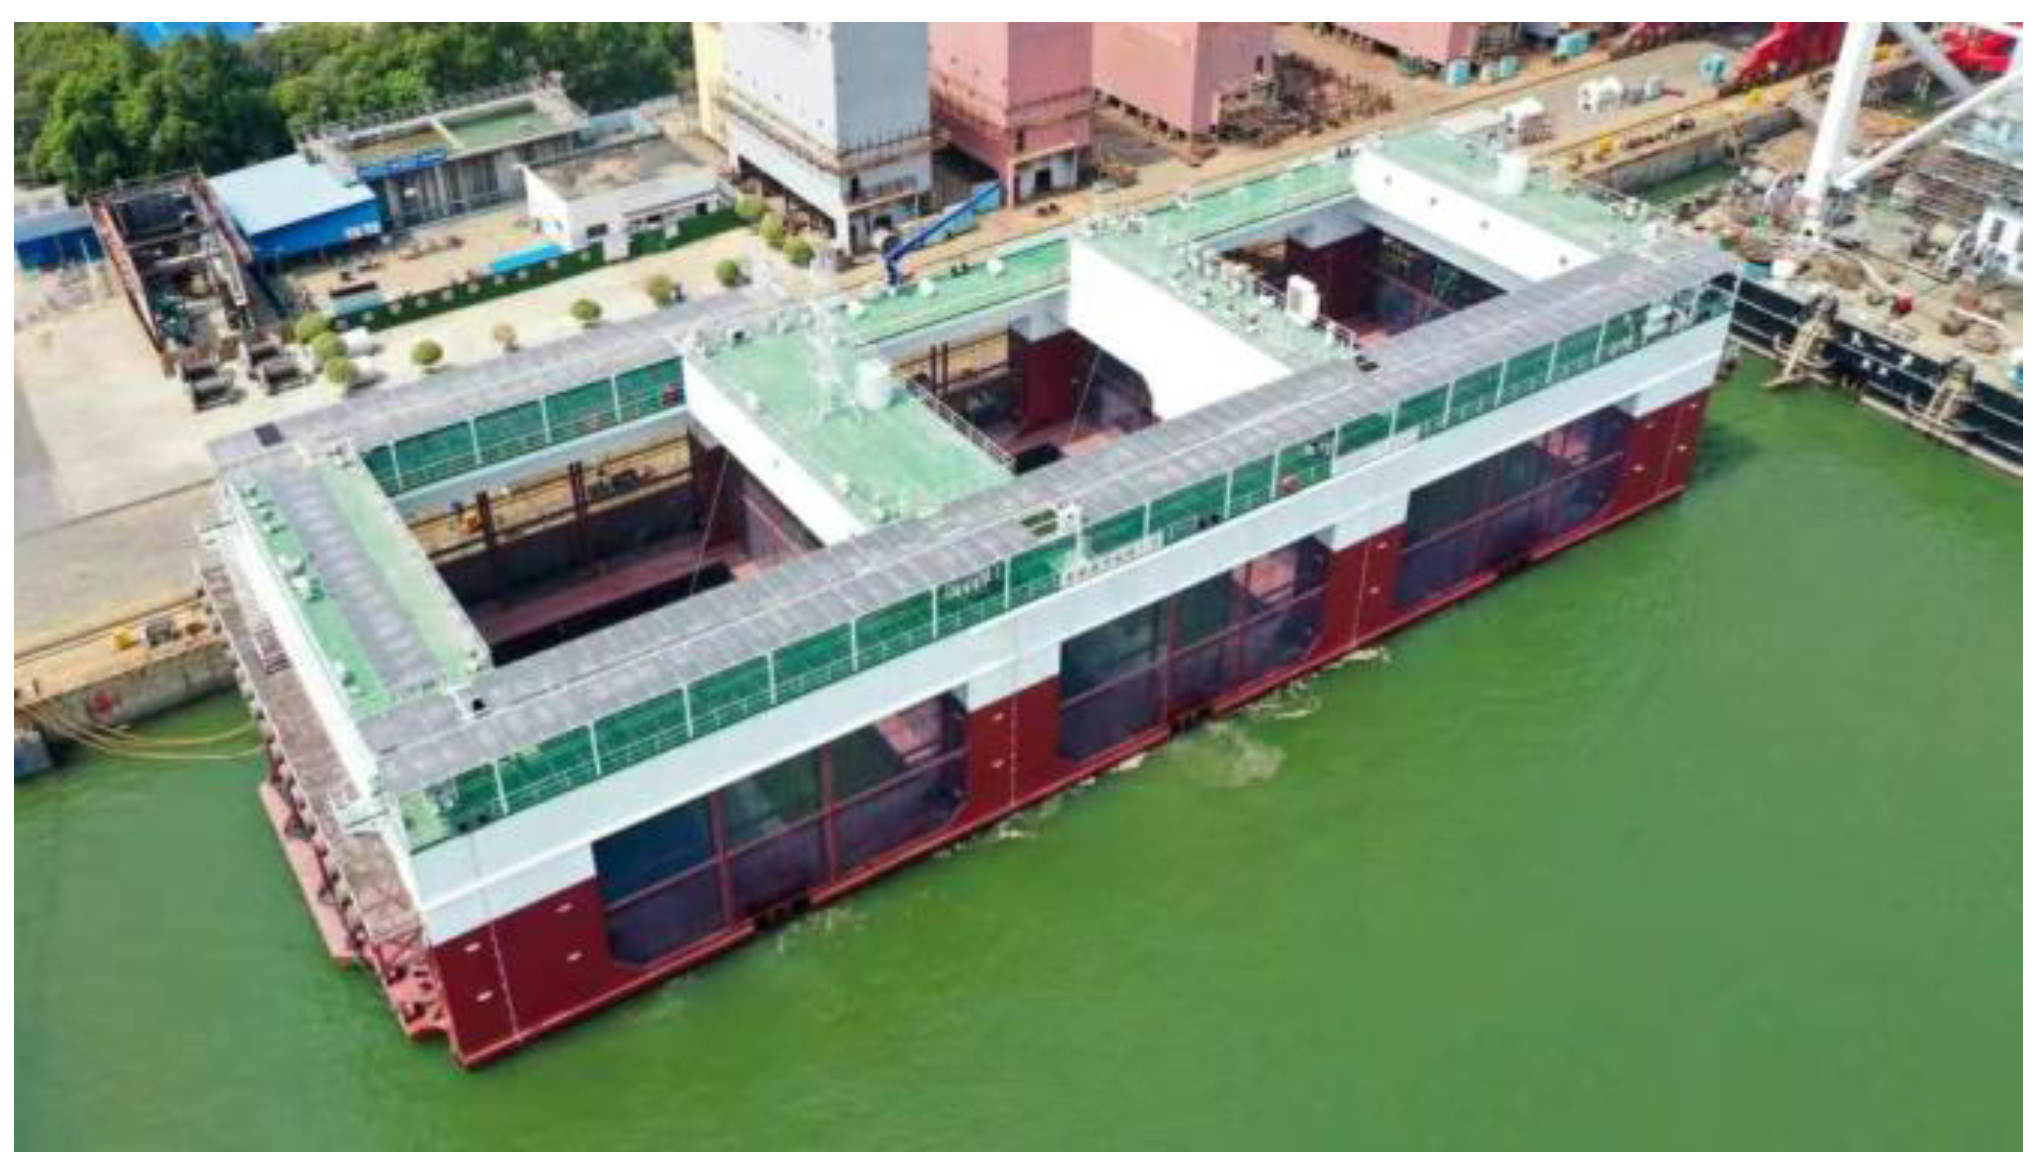
2. Description of the Platform
2.1. Main Parameters of the Platform
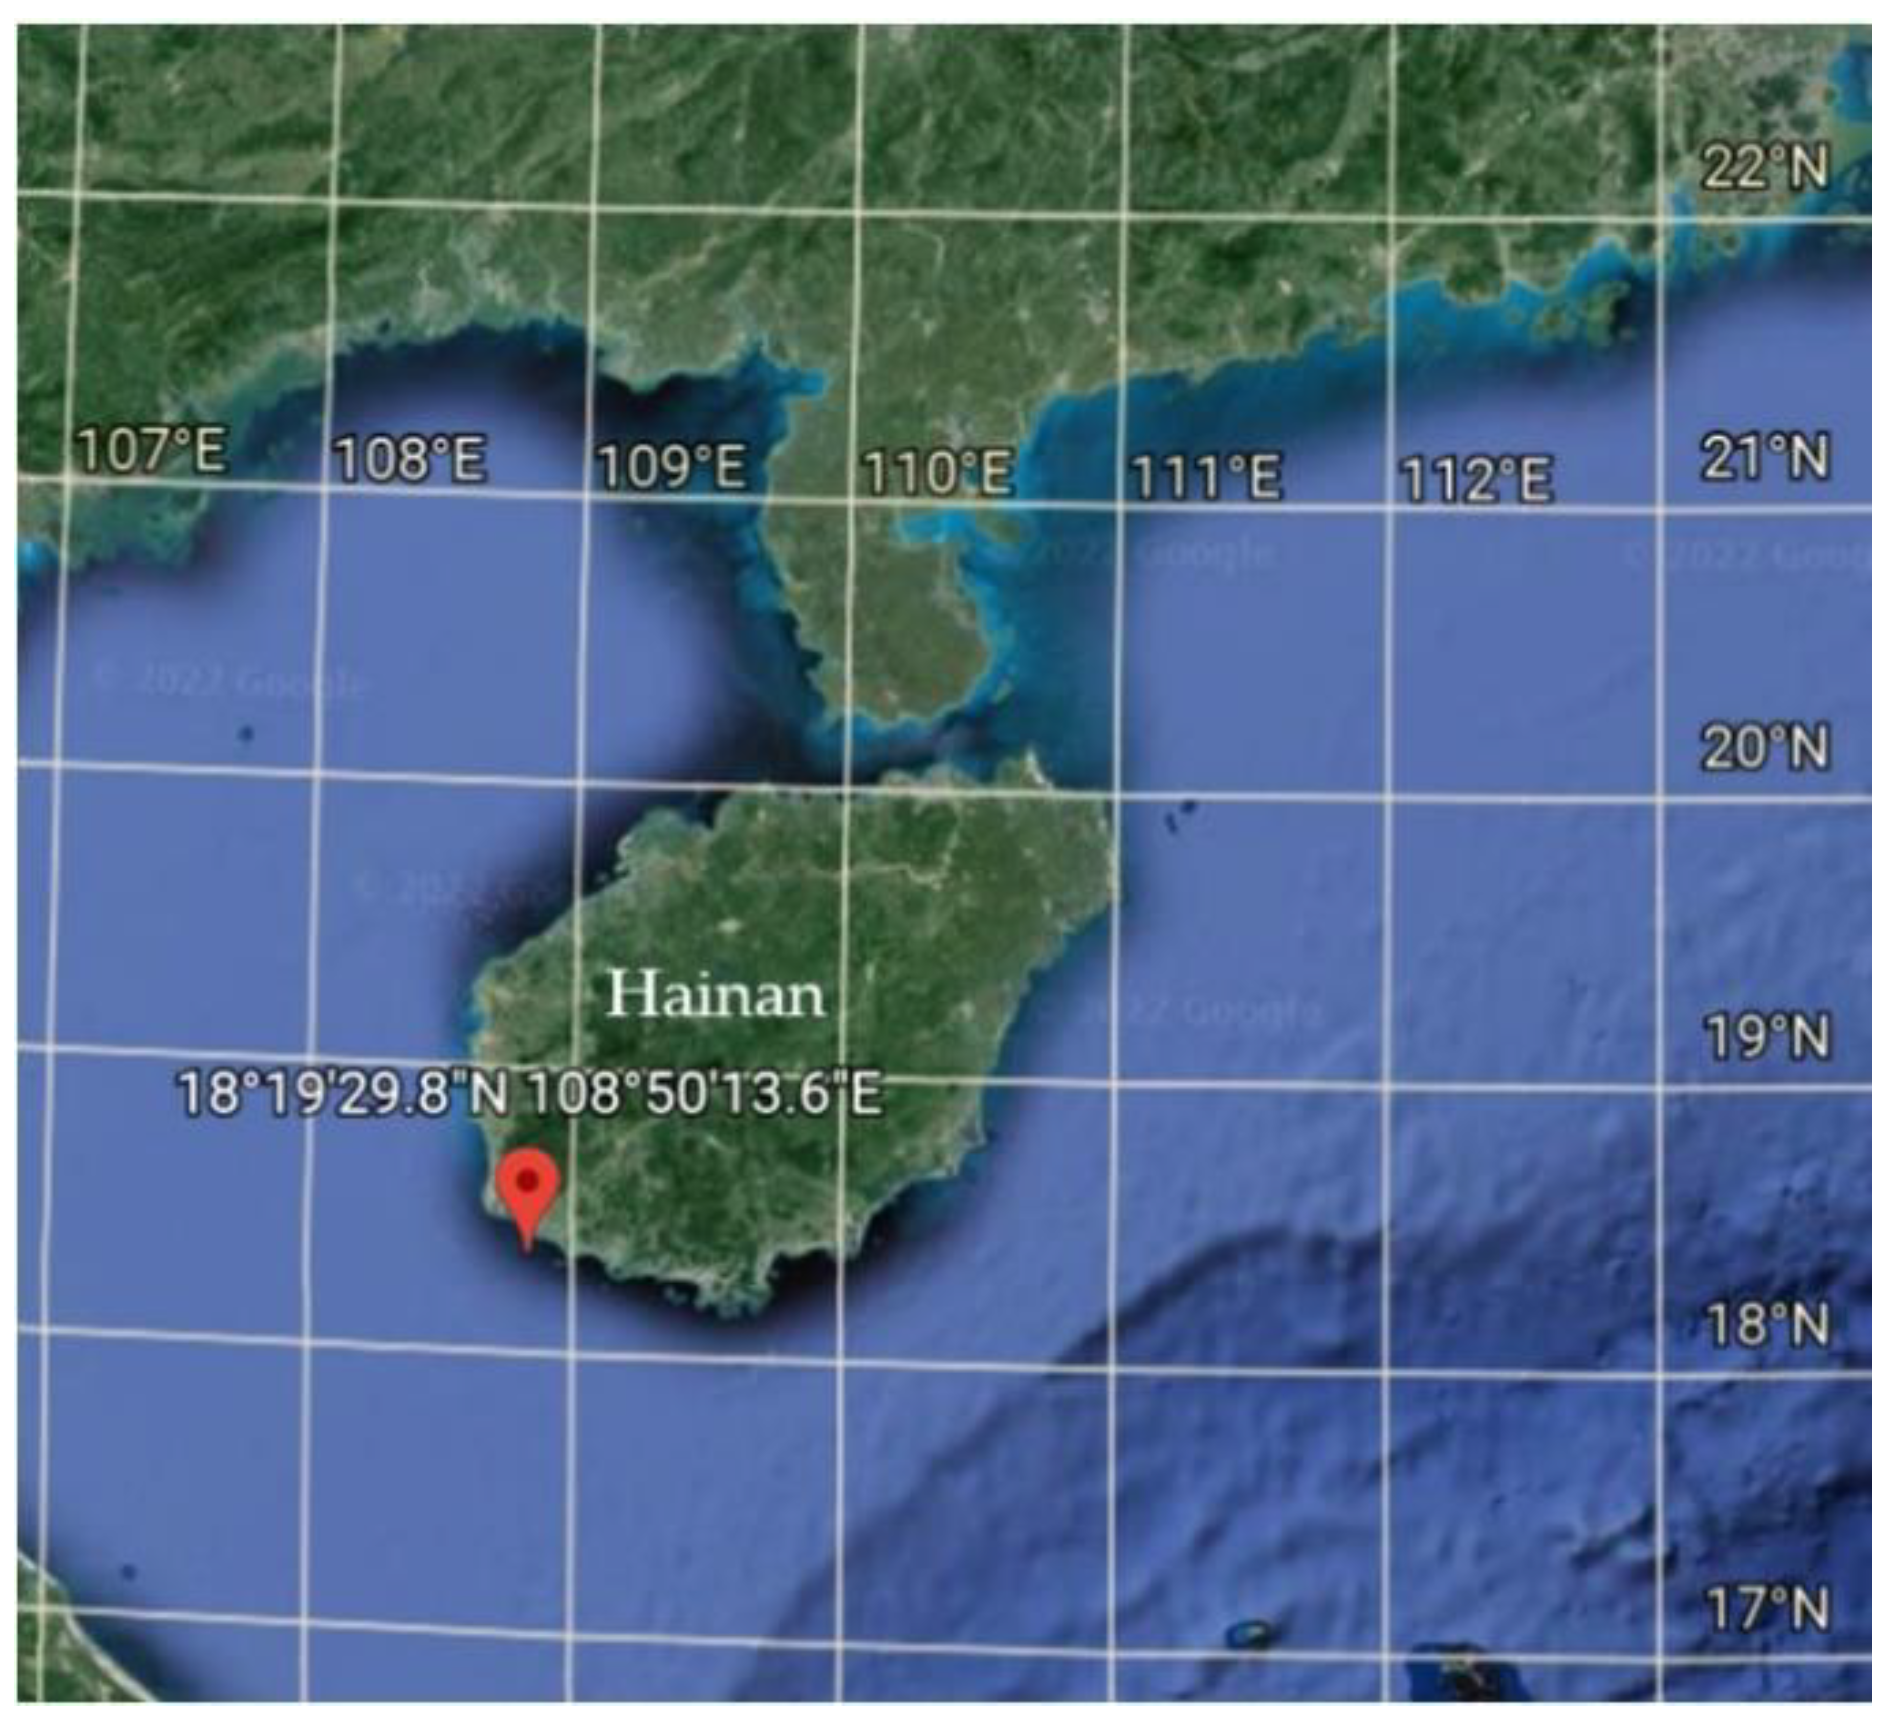
2.2. Environment Parameters
3. Numerical Model
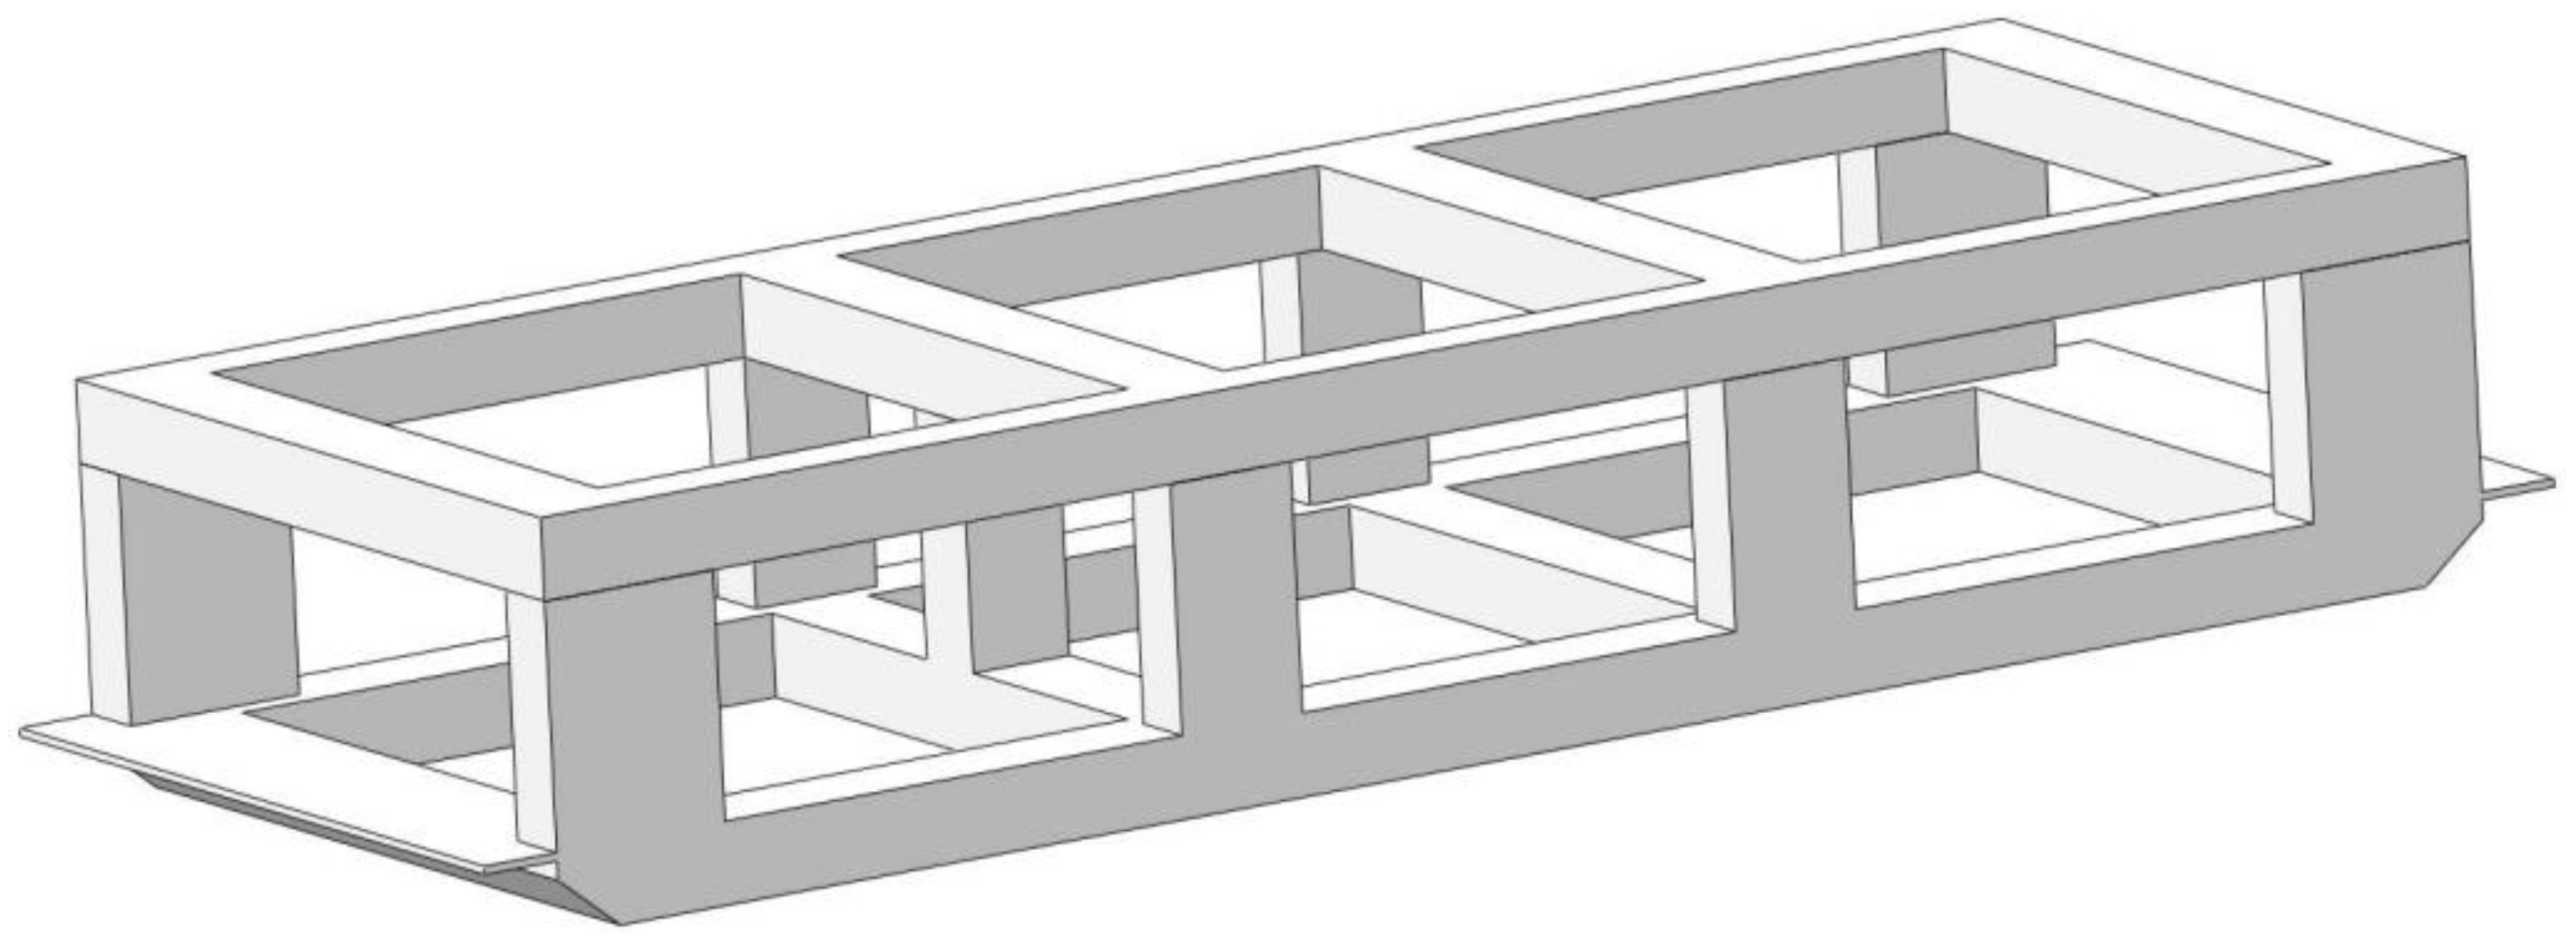
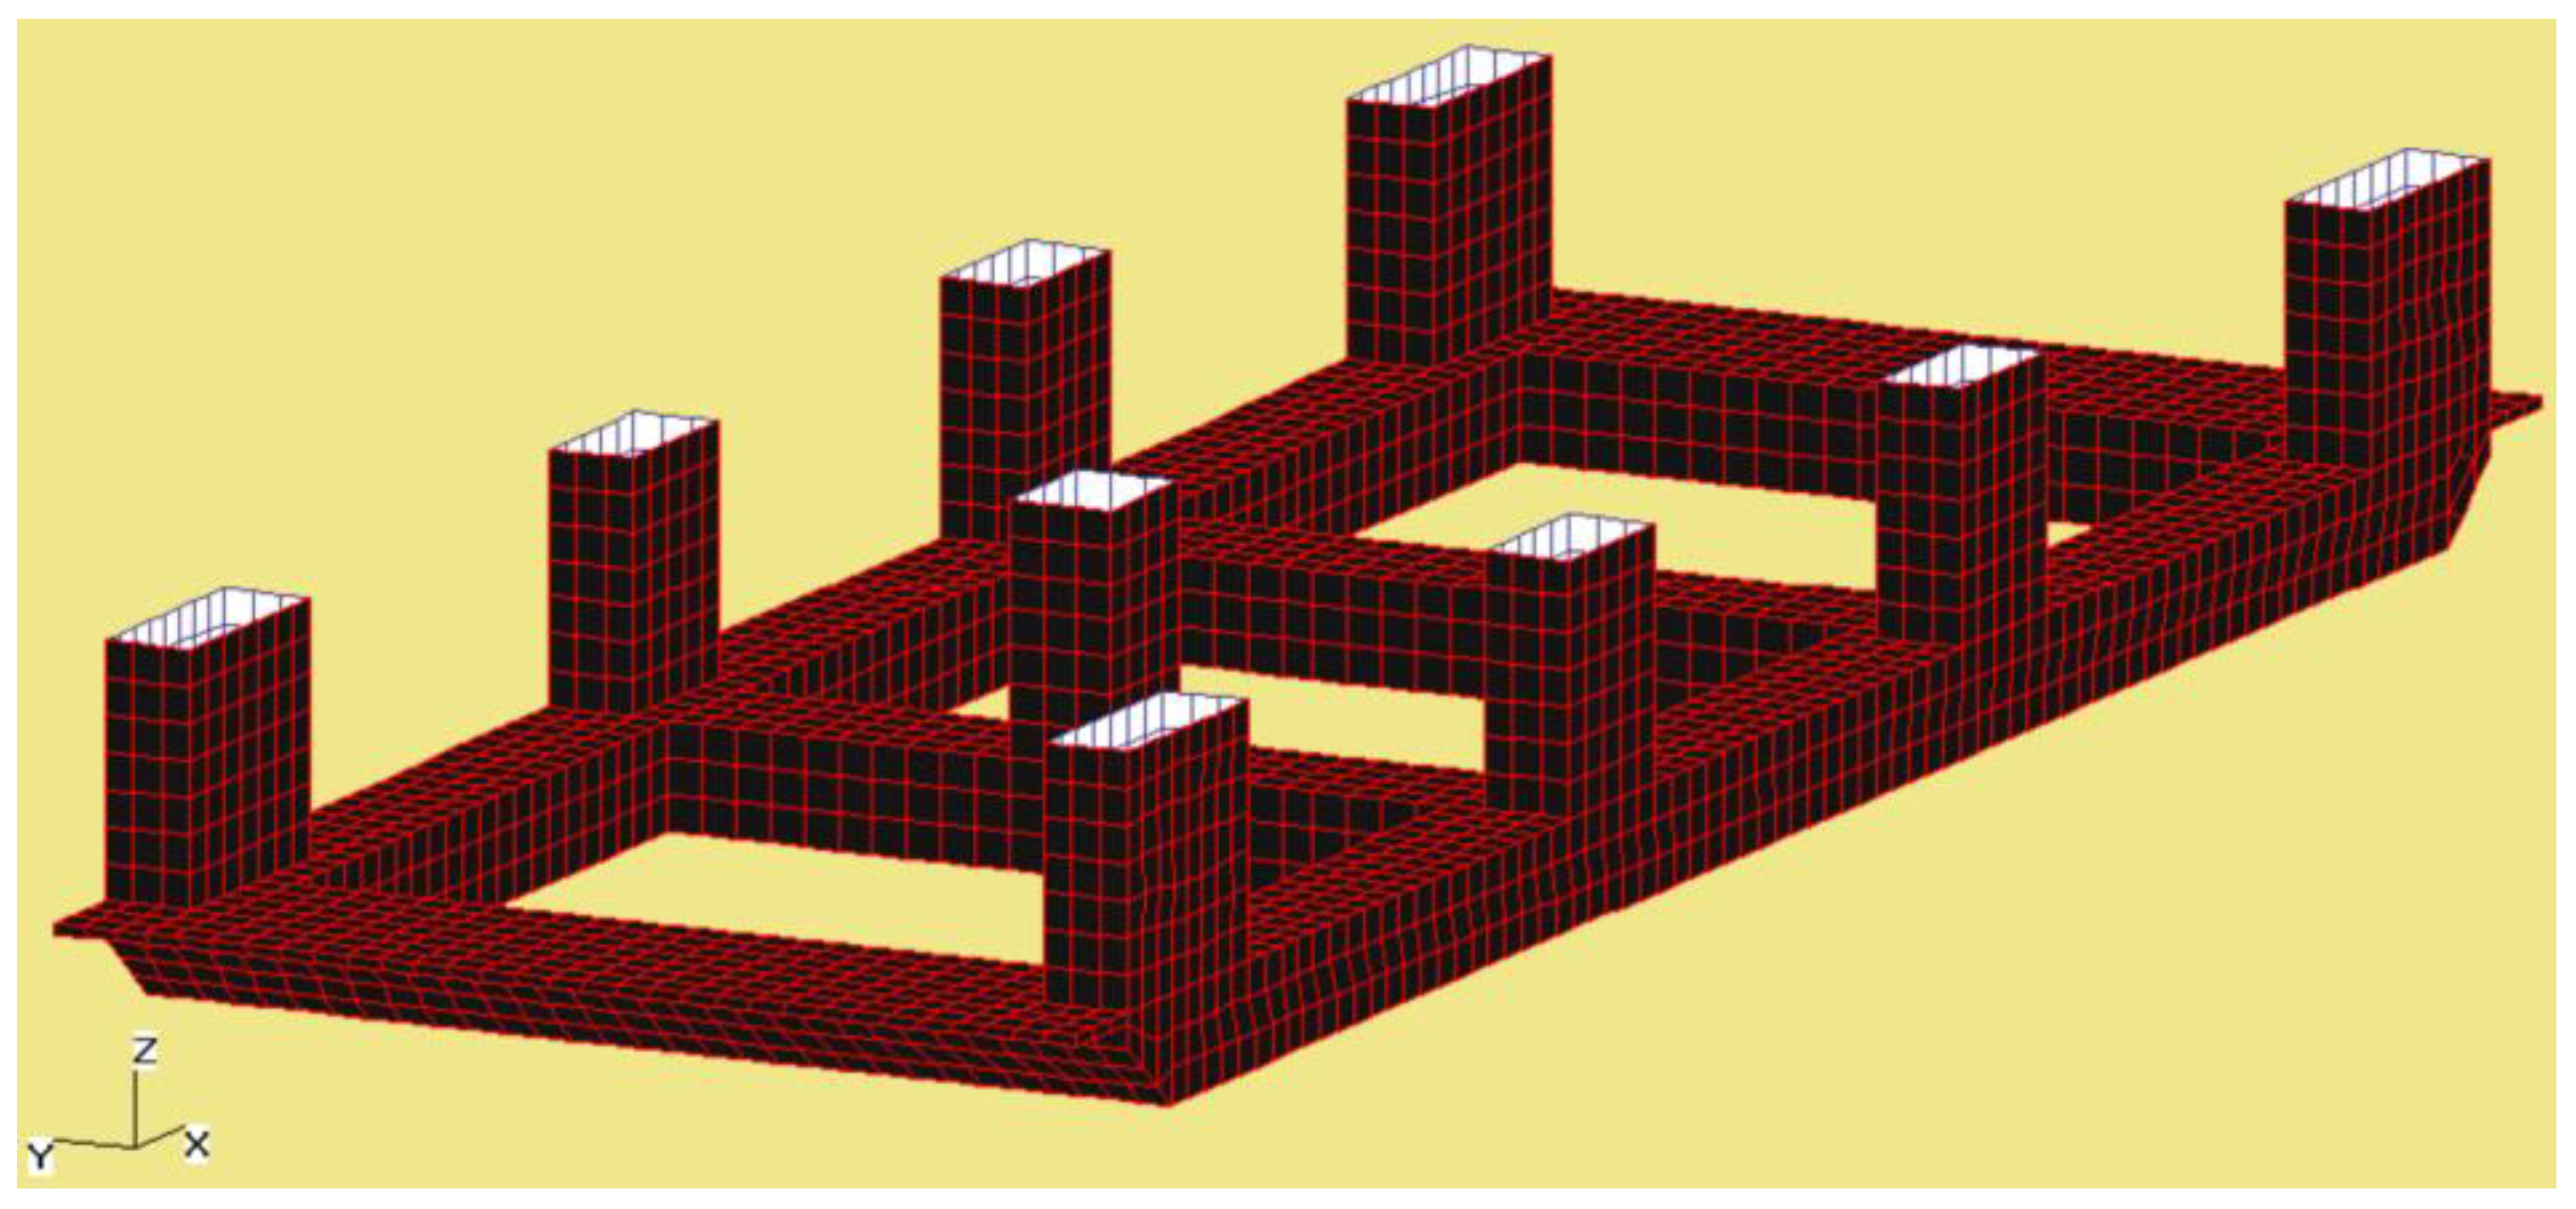
3.1. Main Structure
3.1.1. Potential Flow Model
3.1.2. Wind Force
3.1.3. Current Force
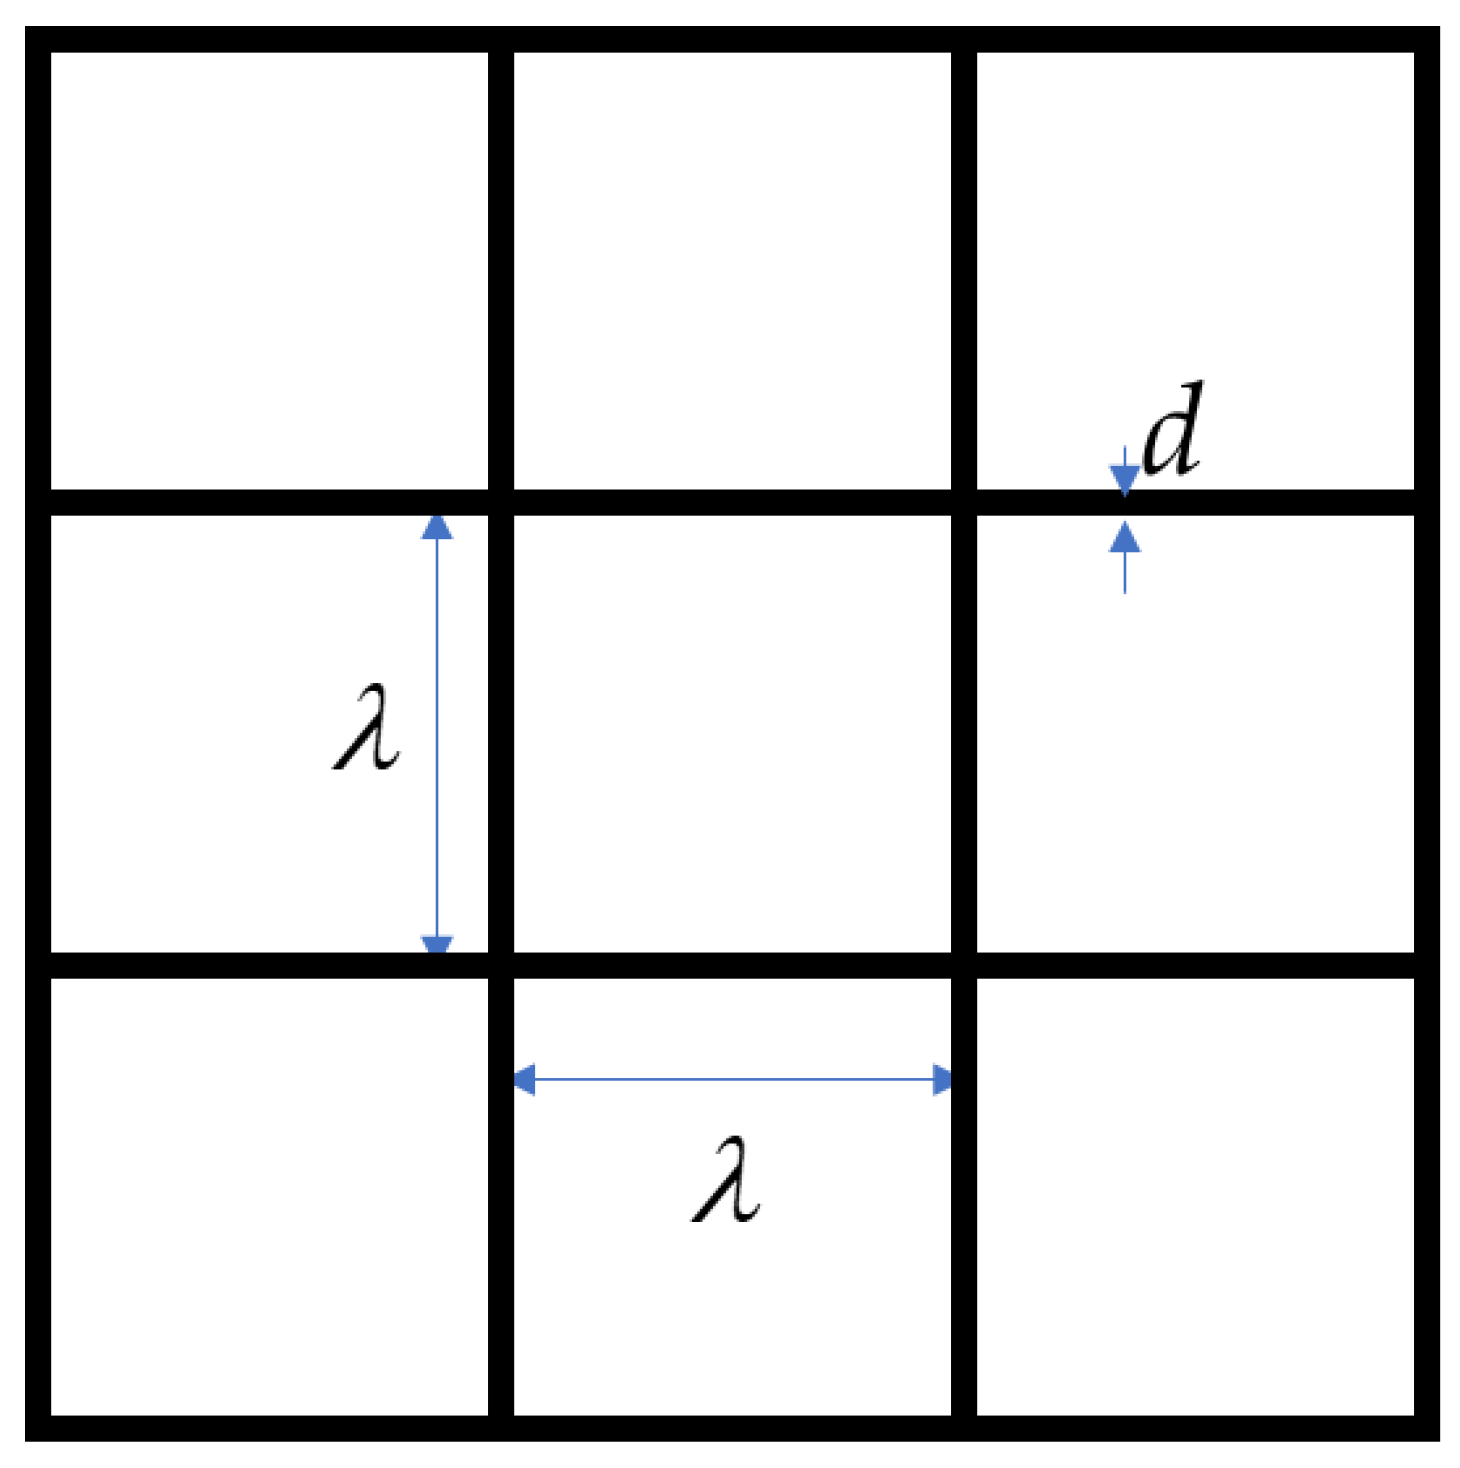
3.2. Net System
3.2.1. Hydrodynamic Coefficients
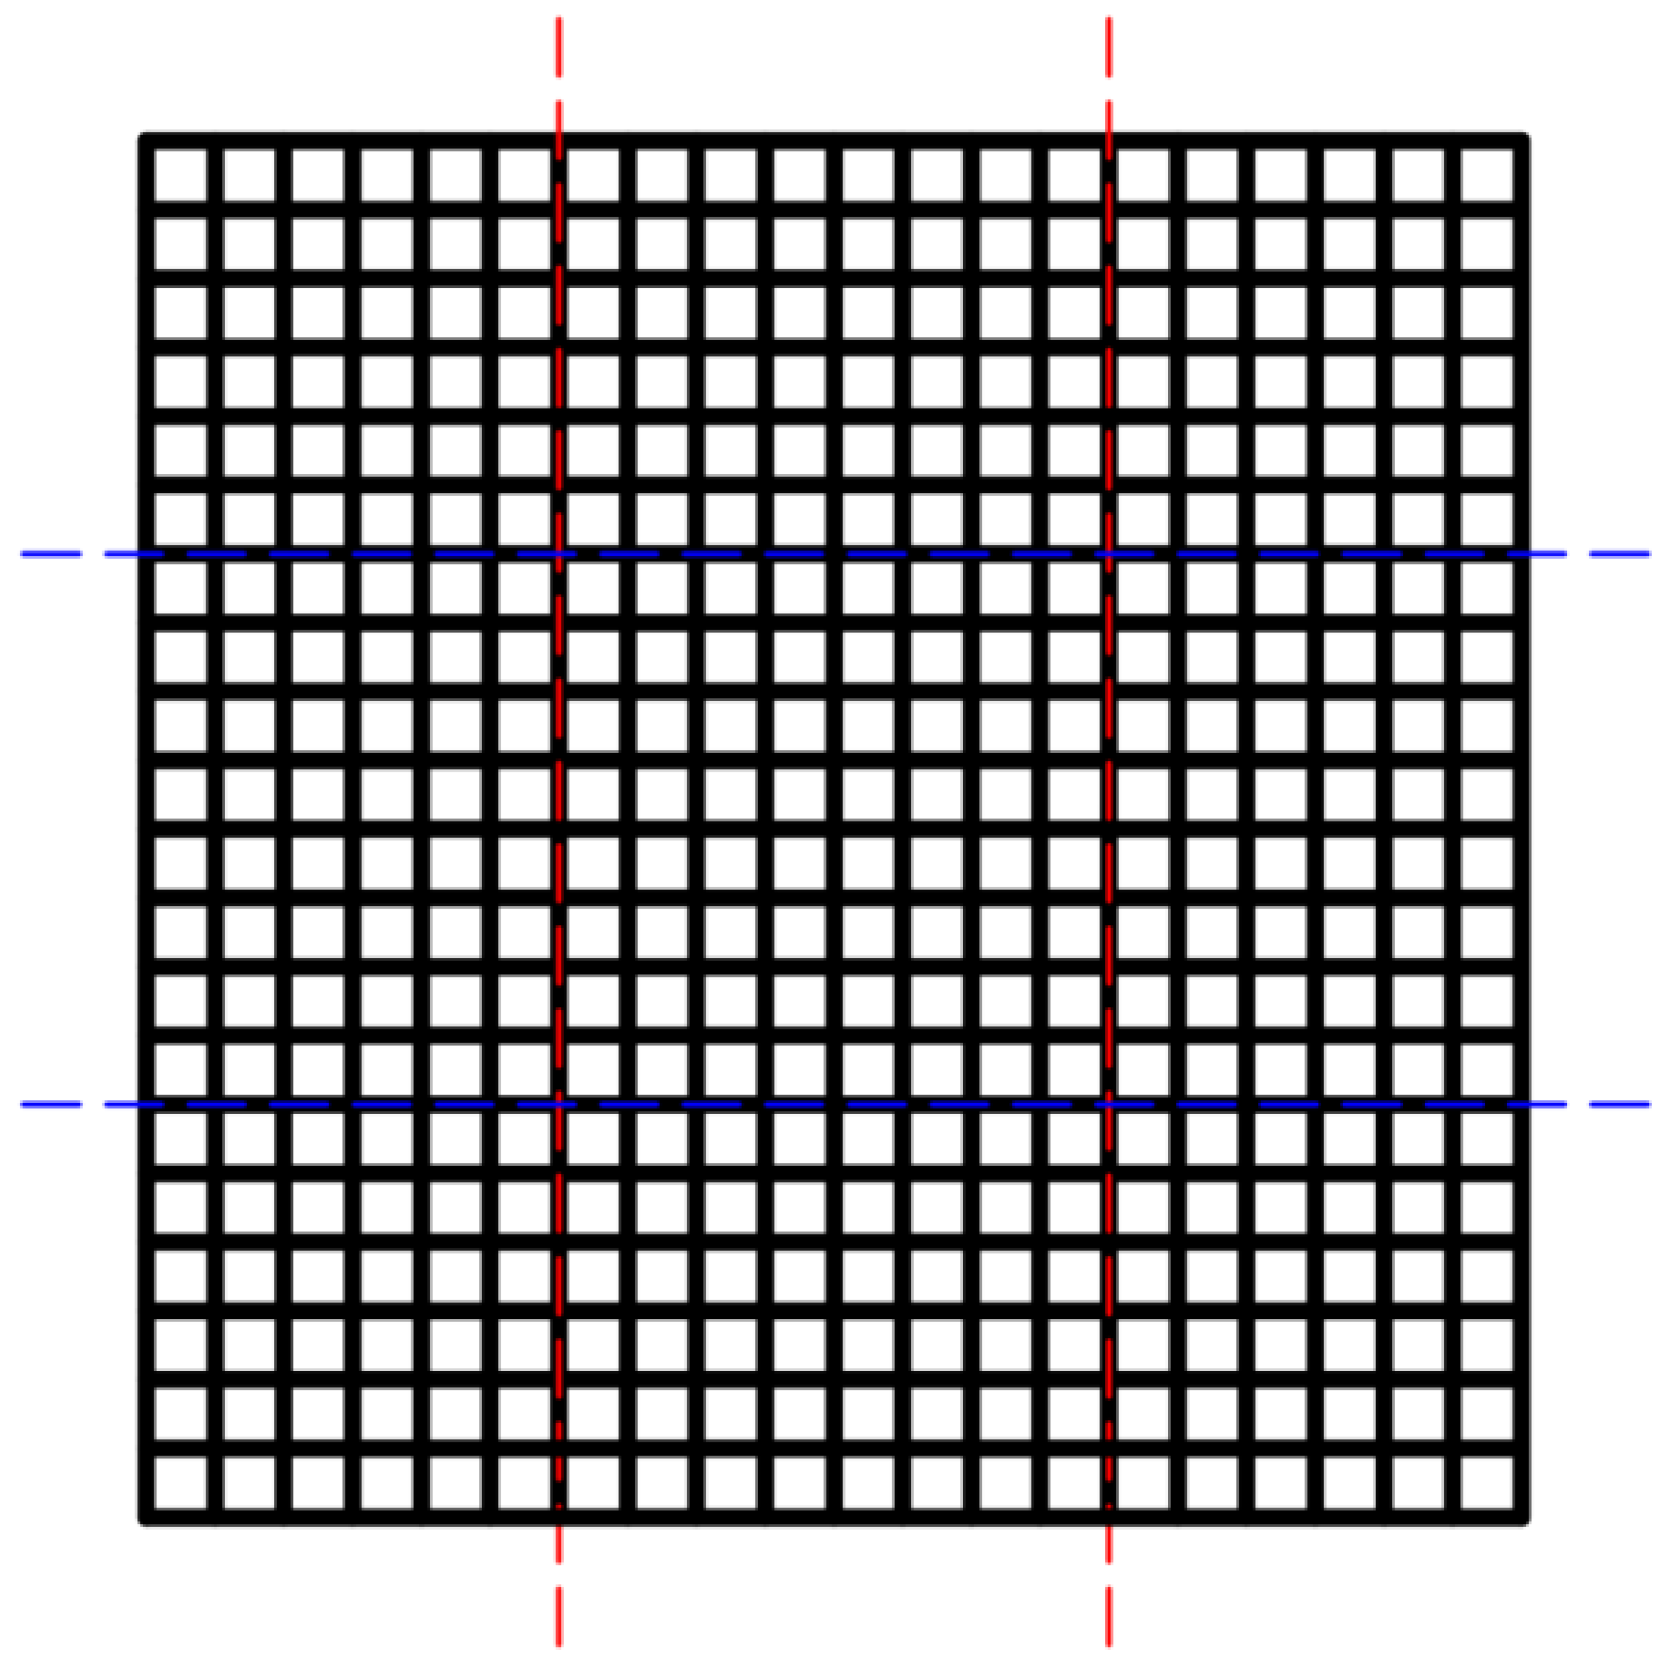
3.2.2. Equivalent Simulation
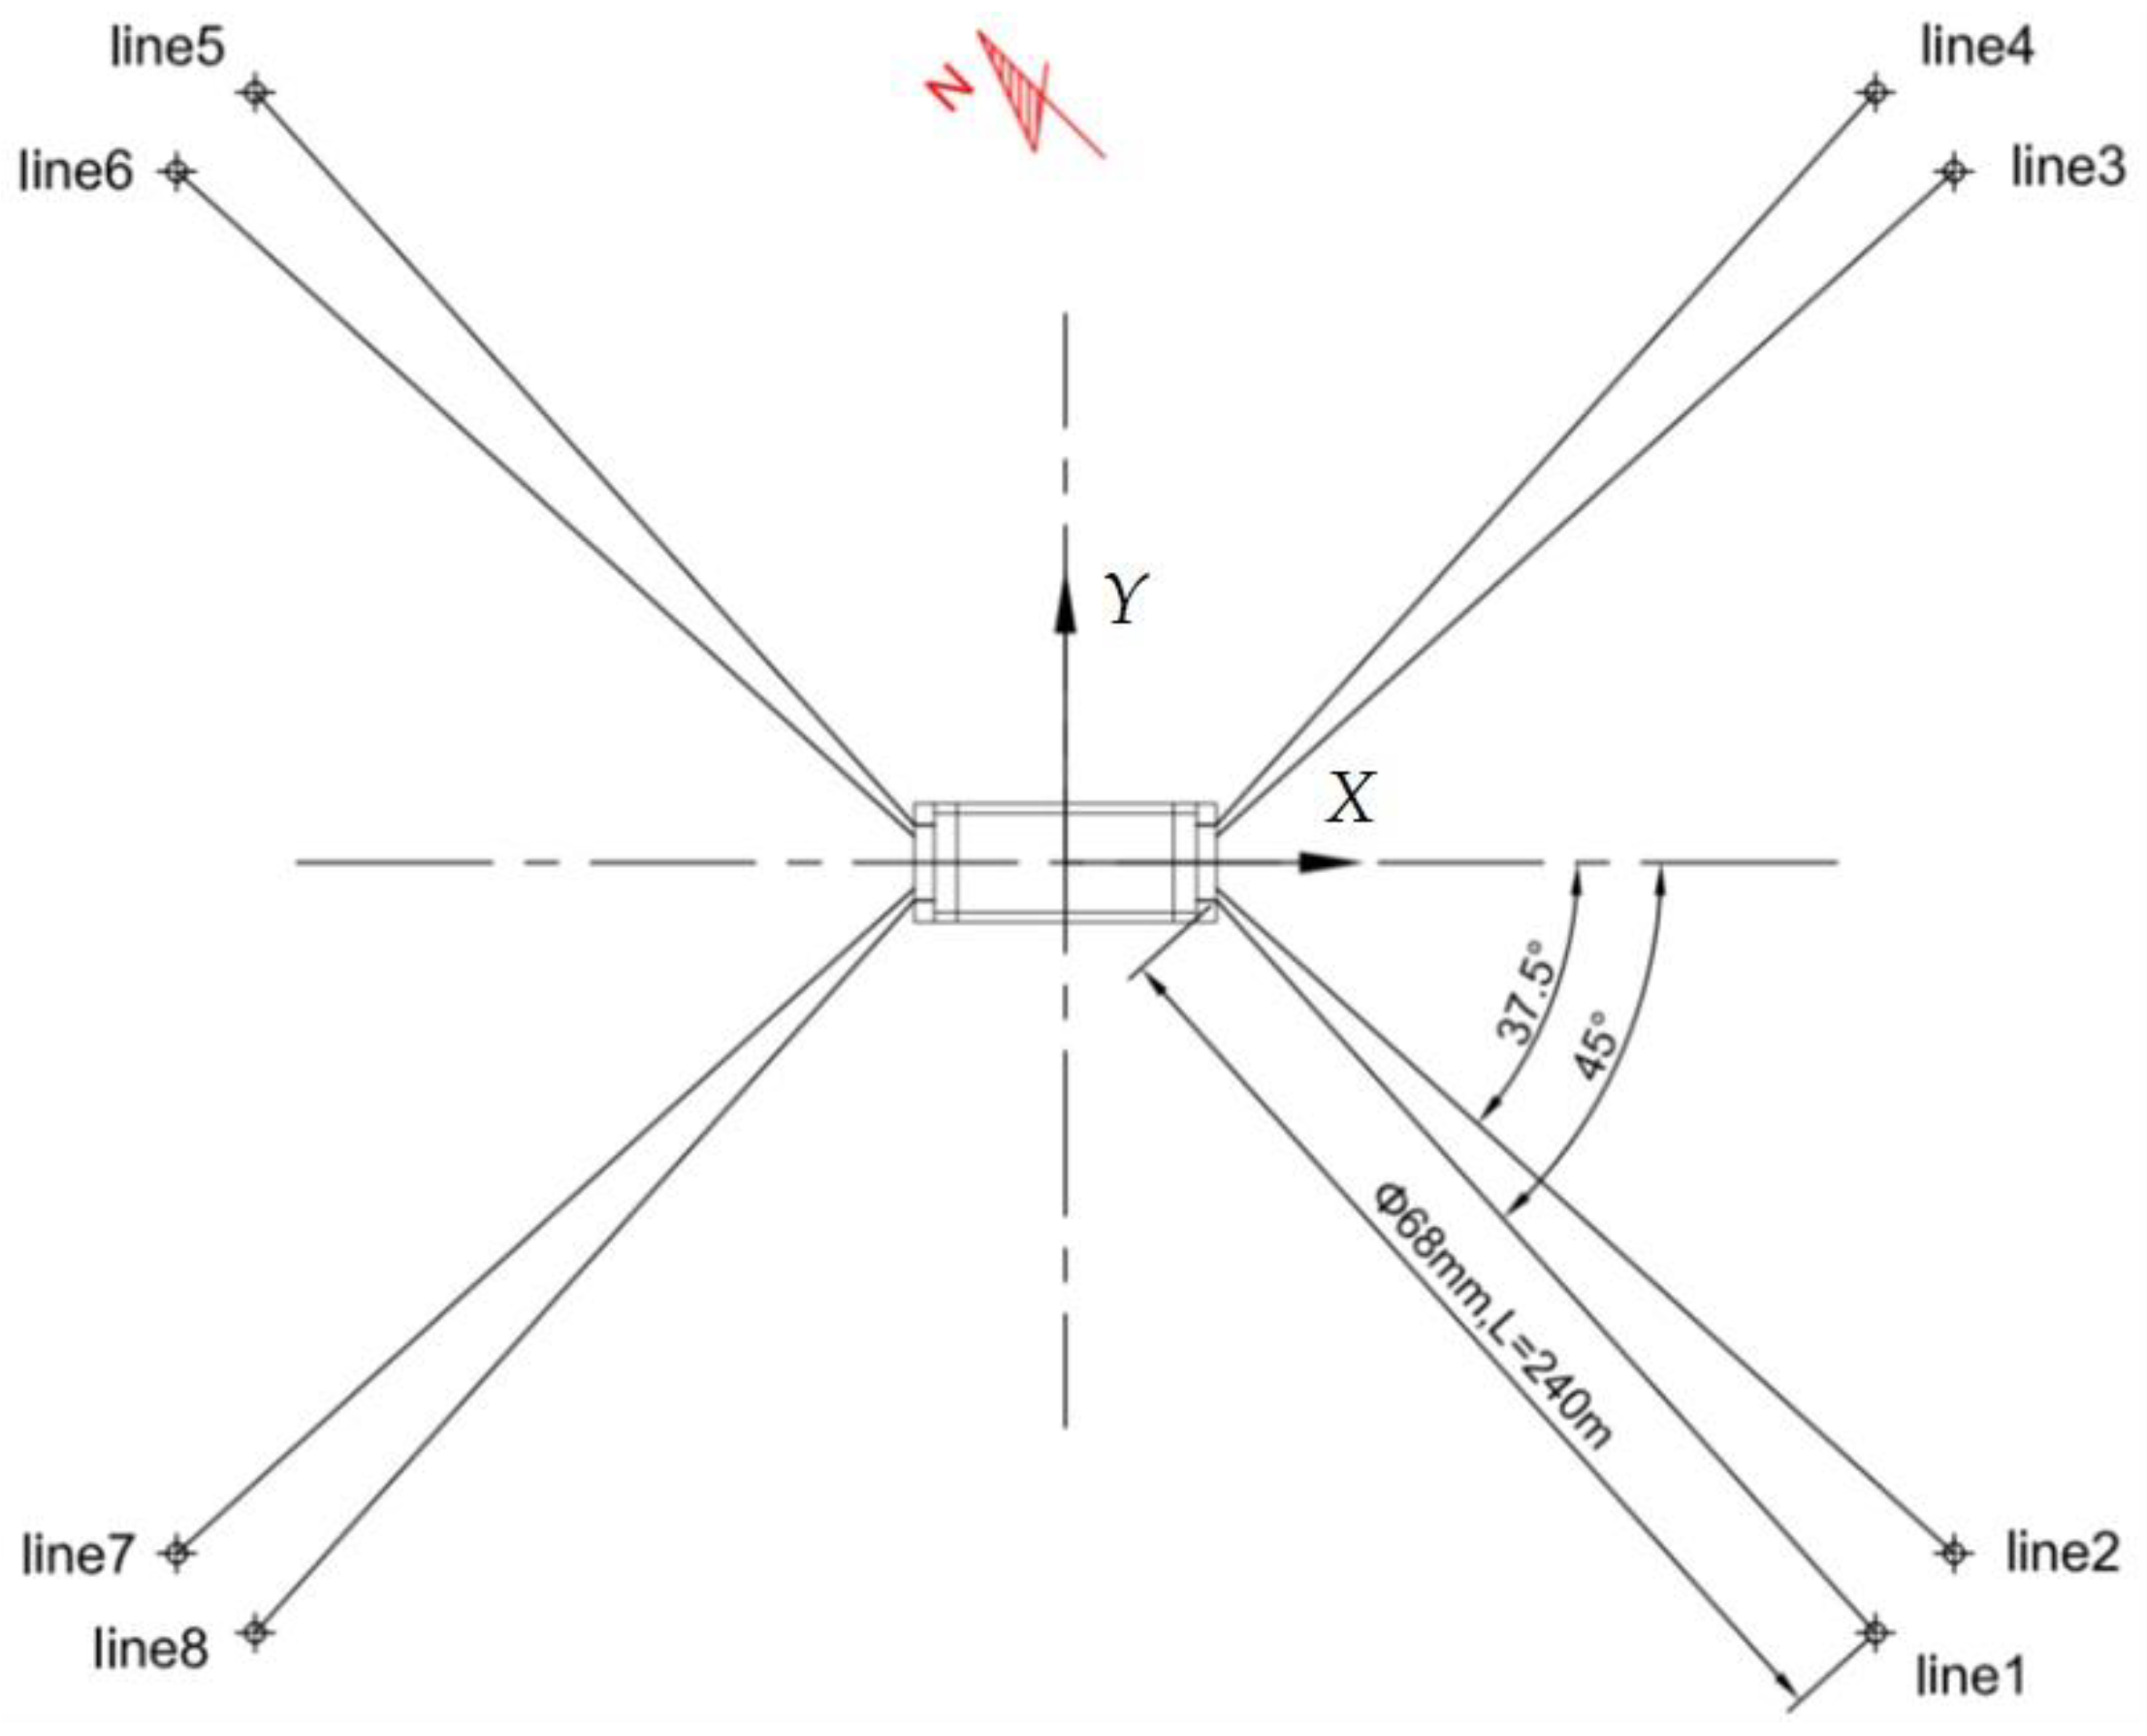
3.3. Mooring System
3.3.1. Composition of the Mooring System
3.3.2. Loading Cases for Mooring Analysis
4. Results and Discussion
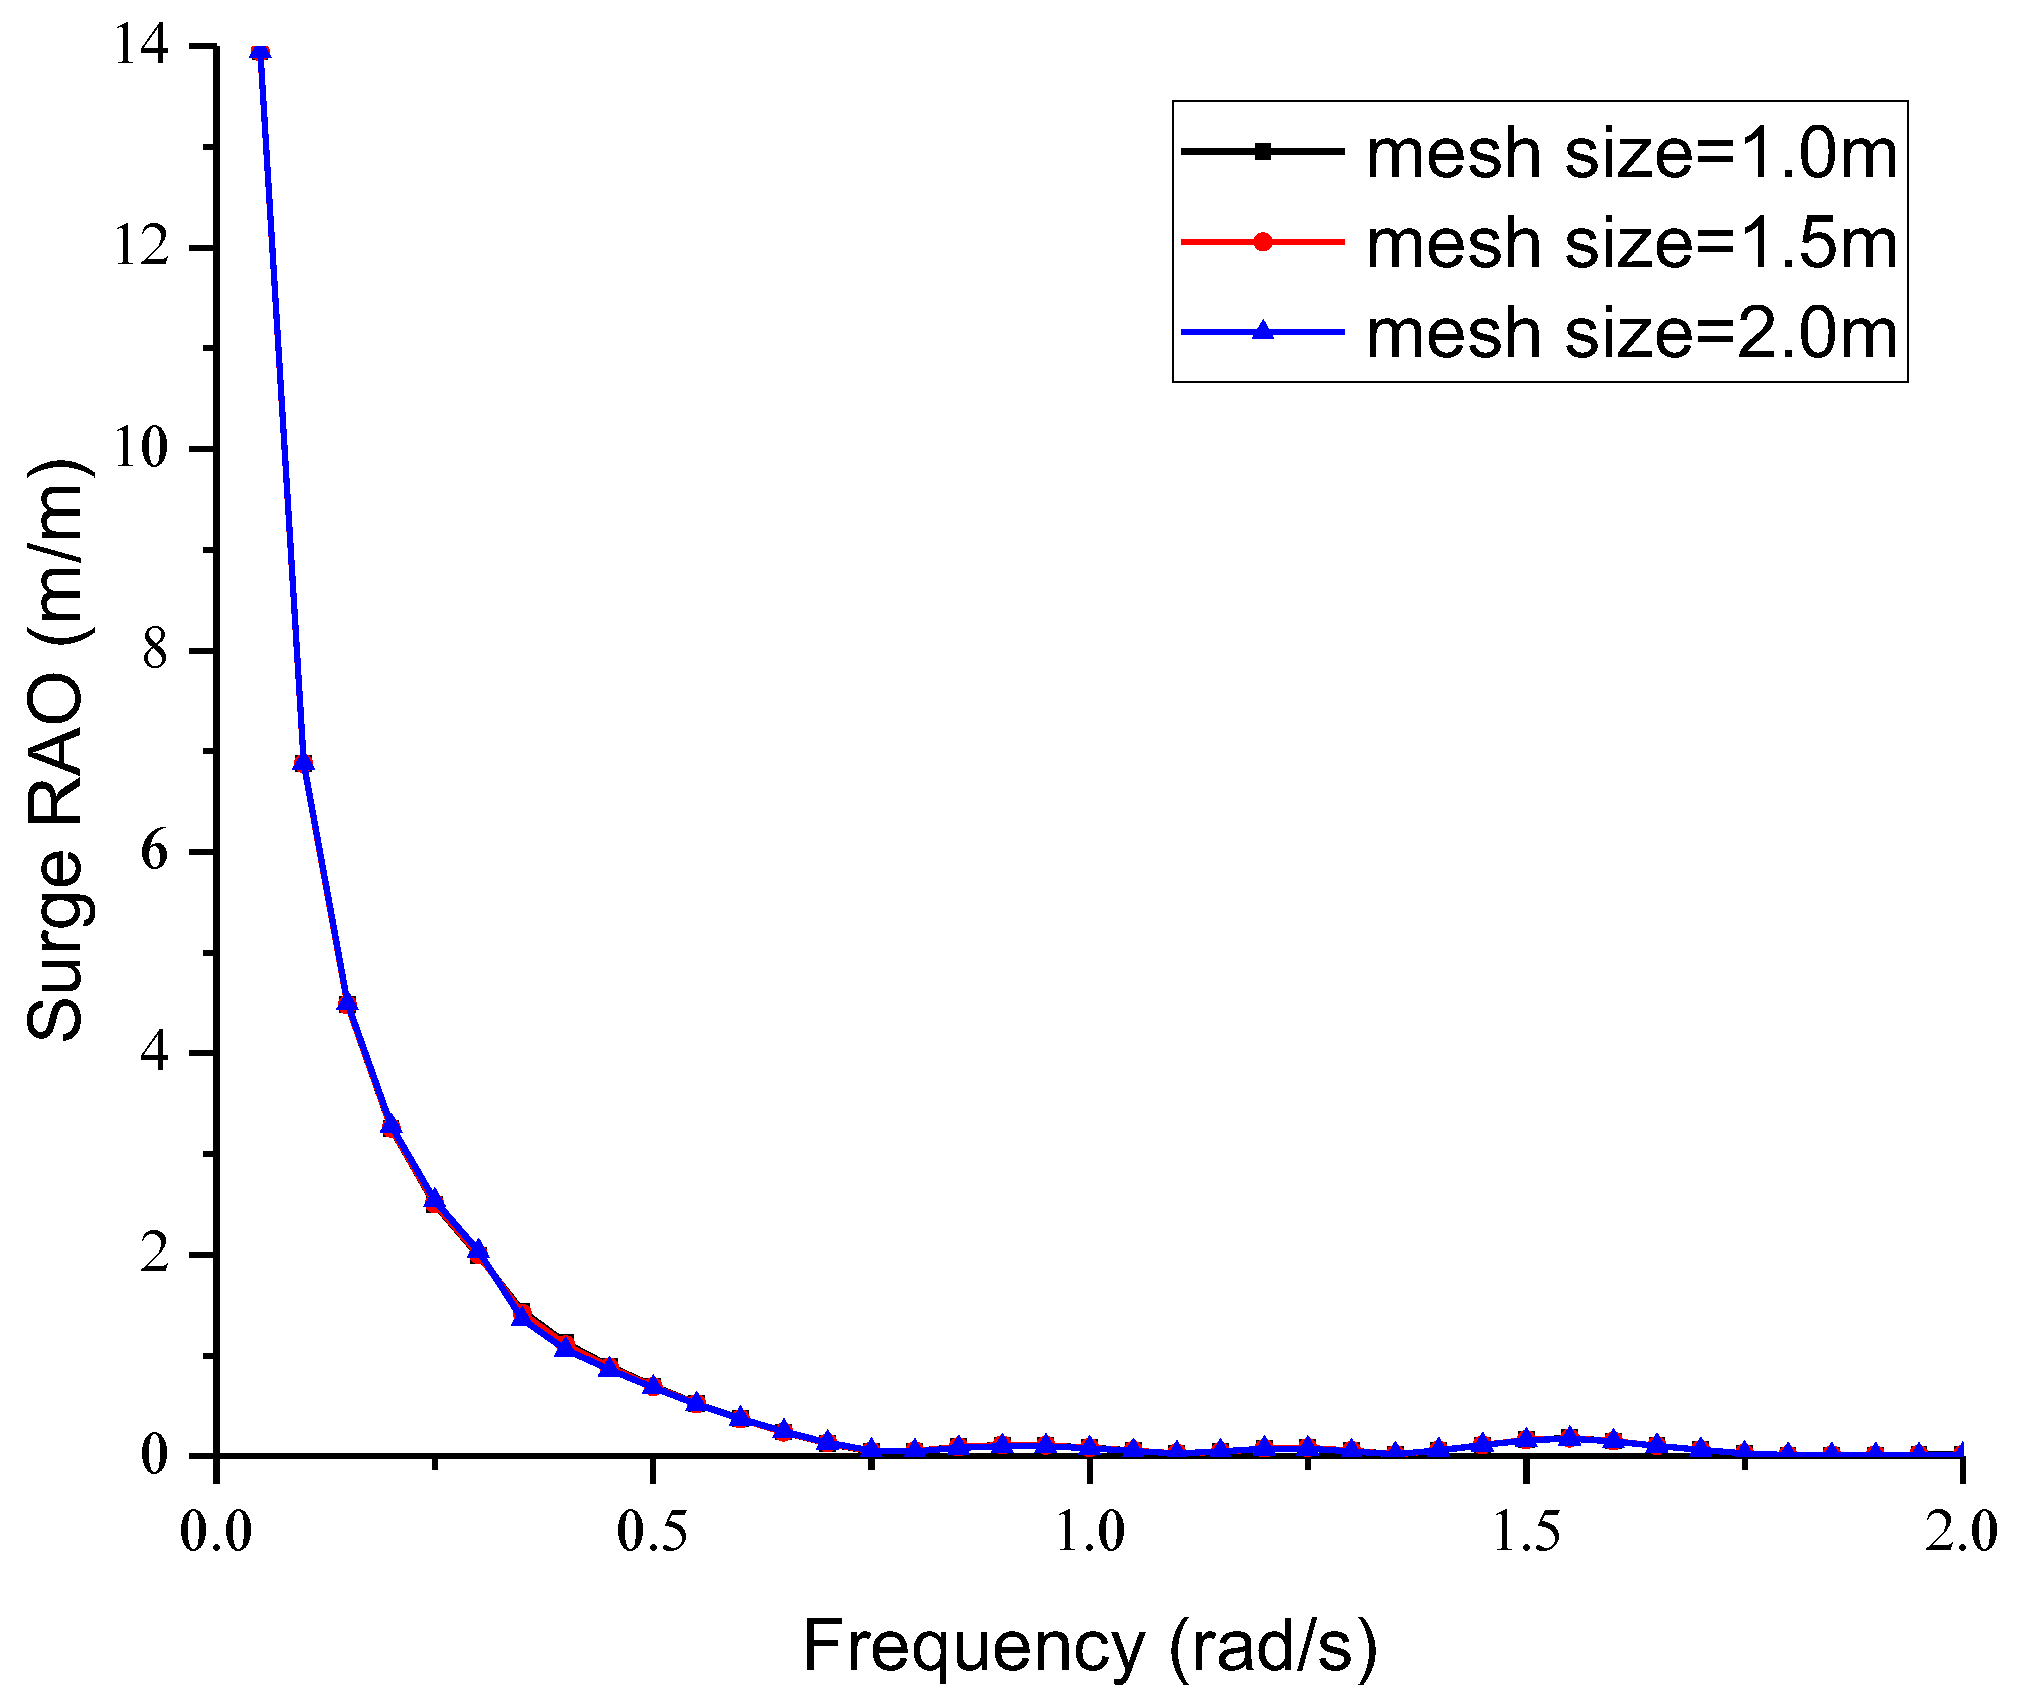
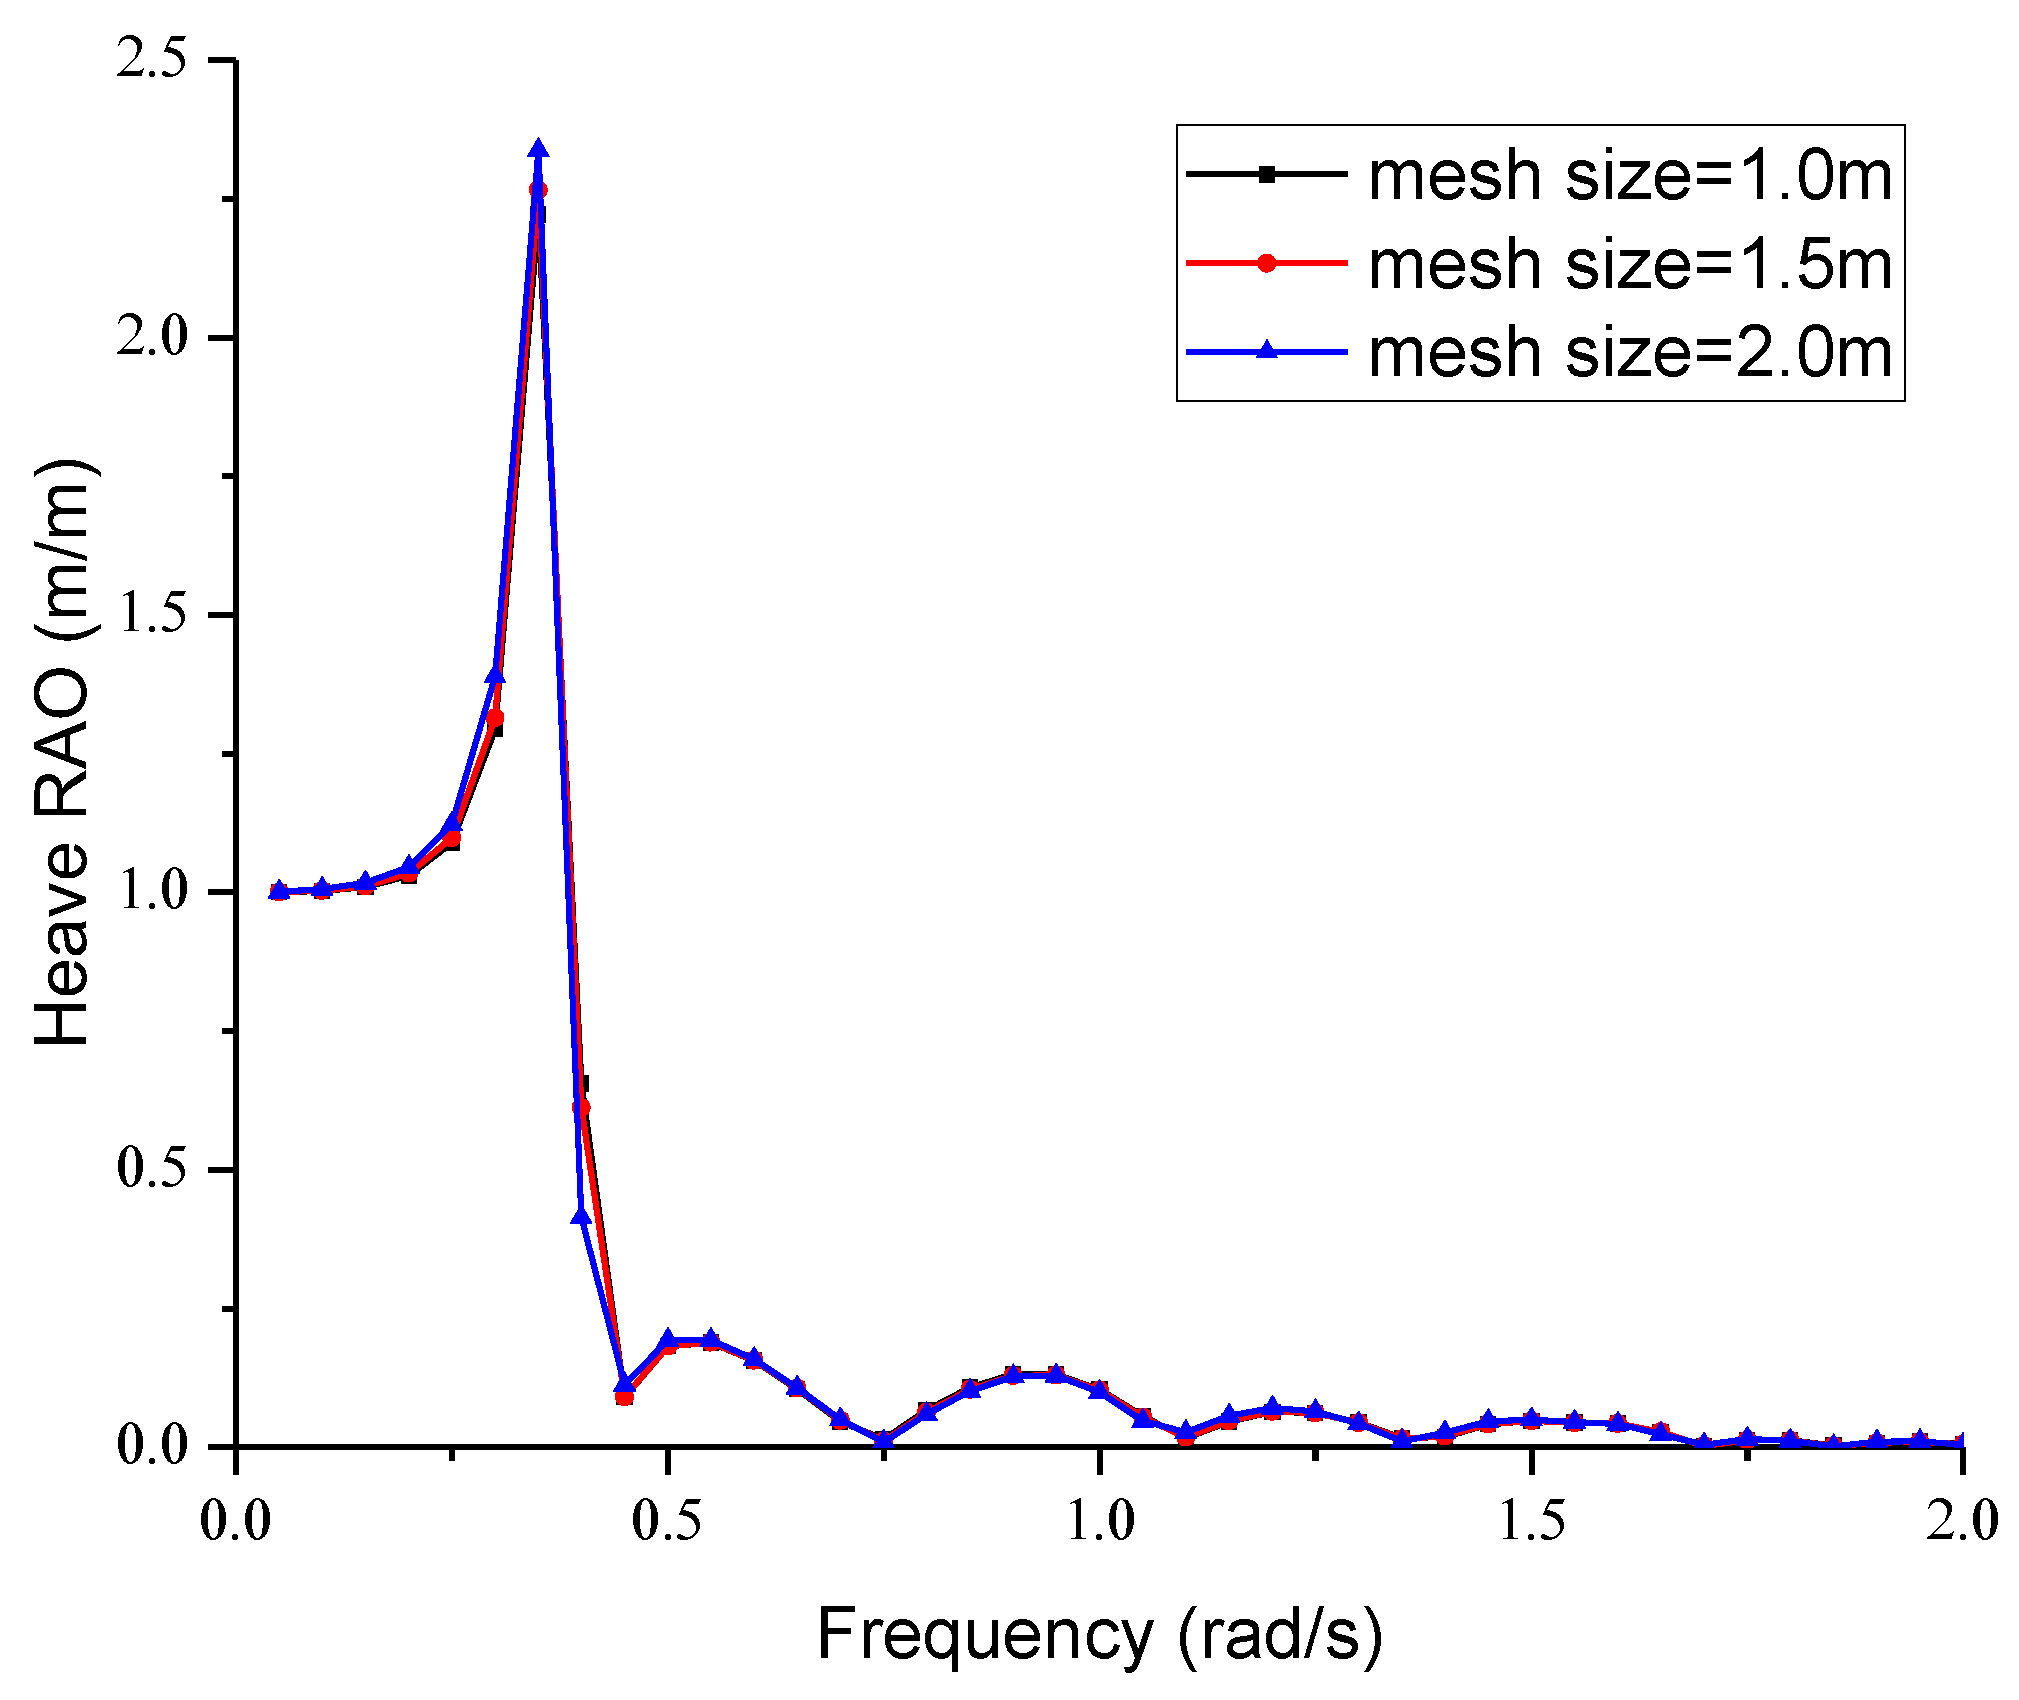
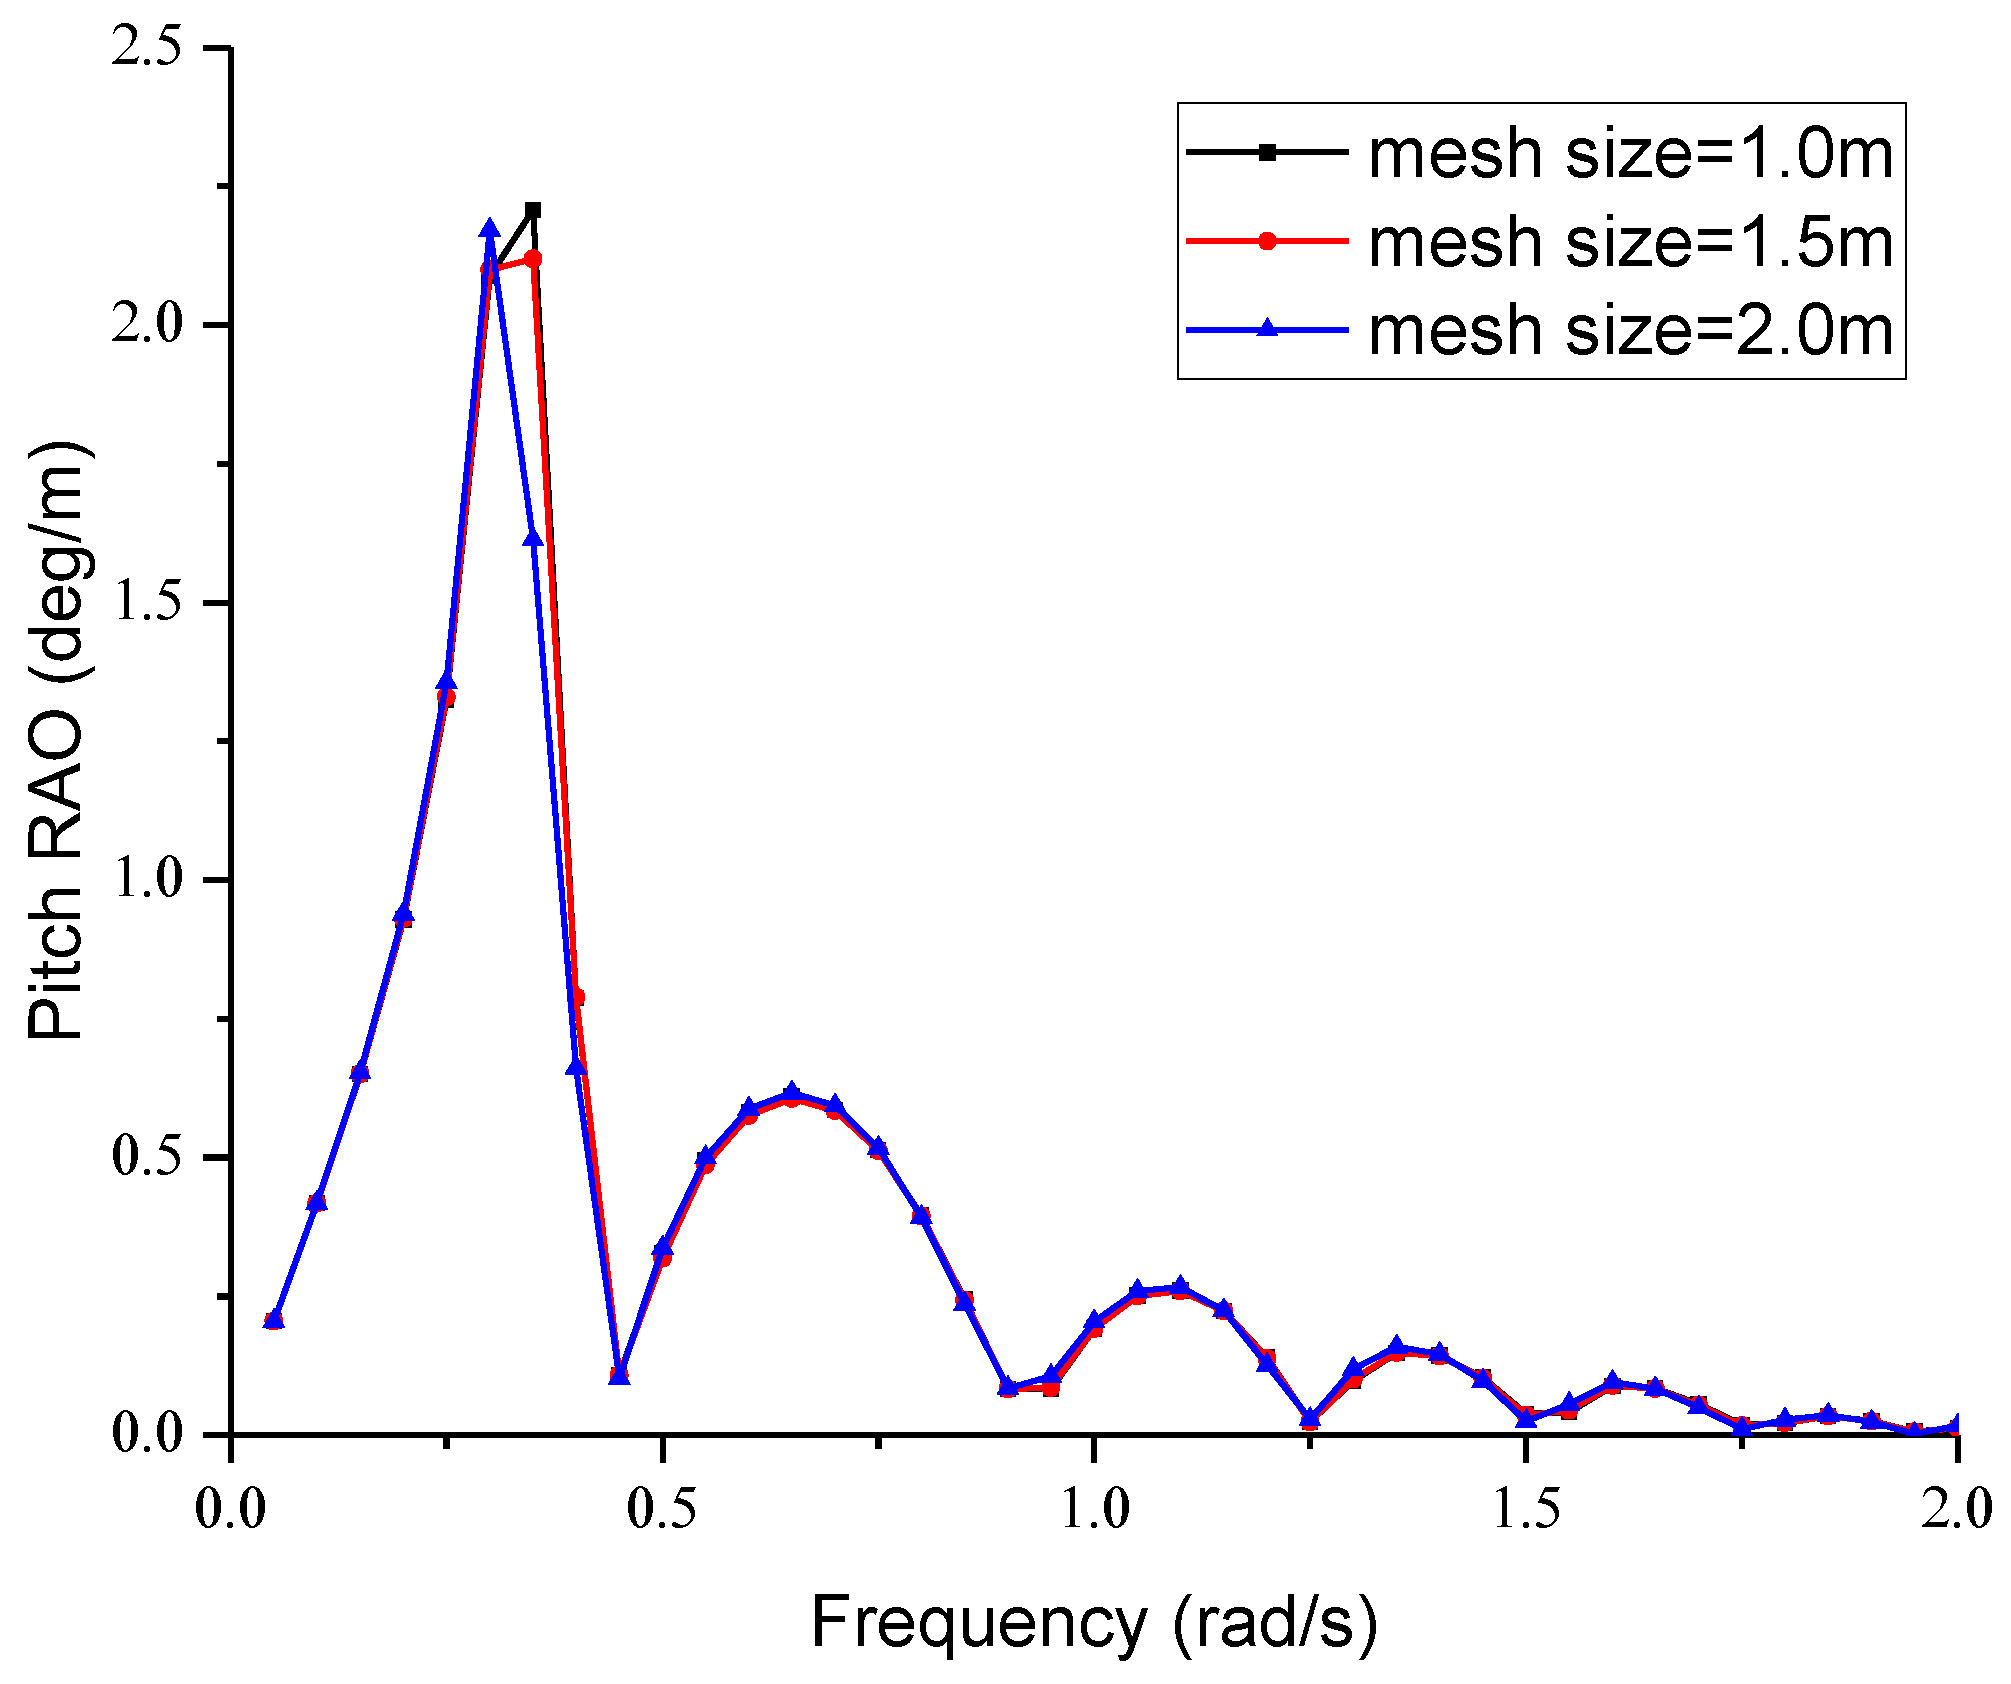
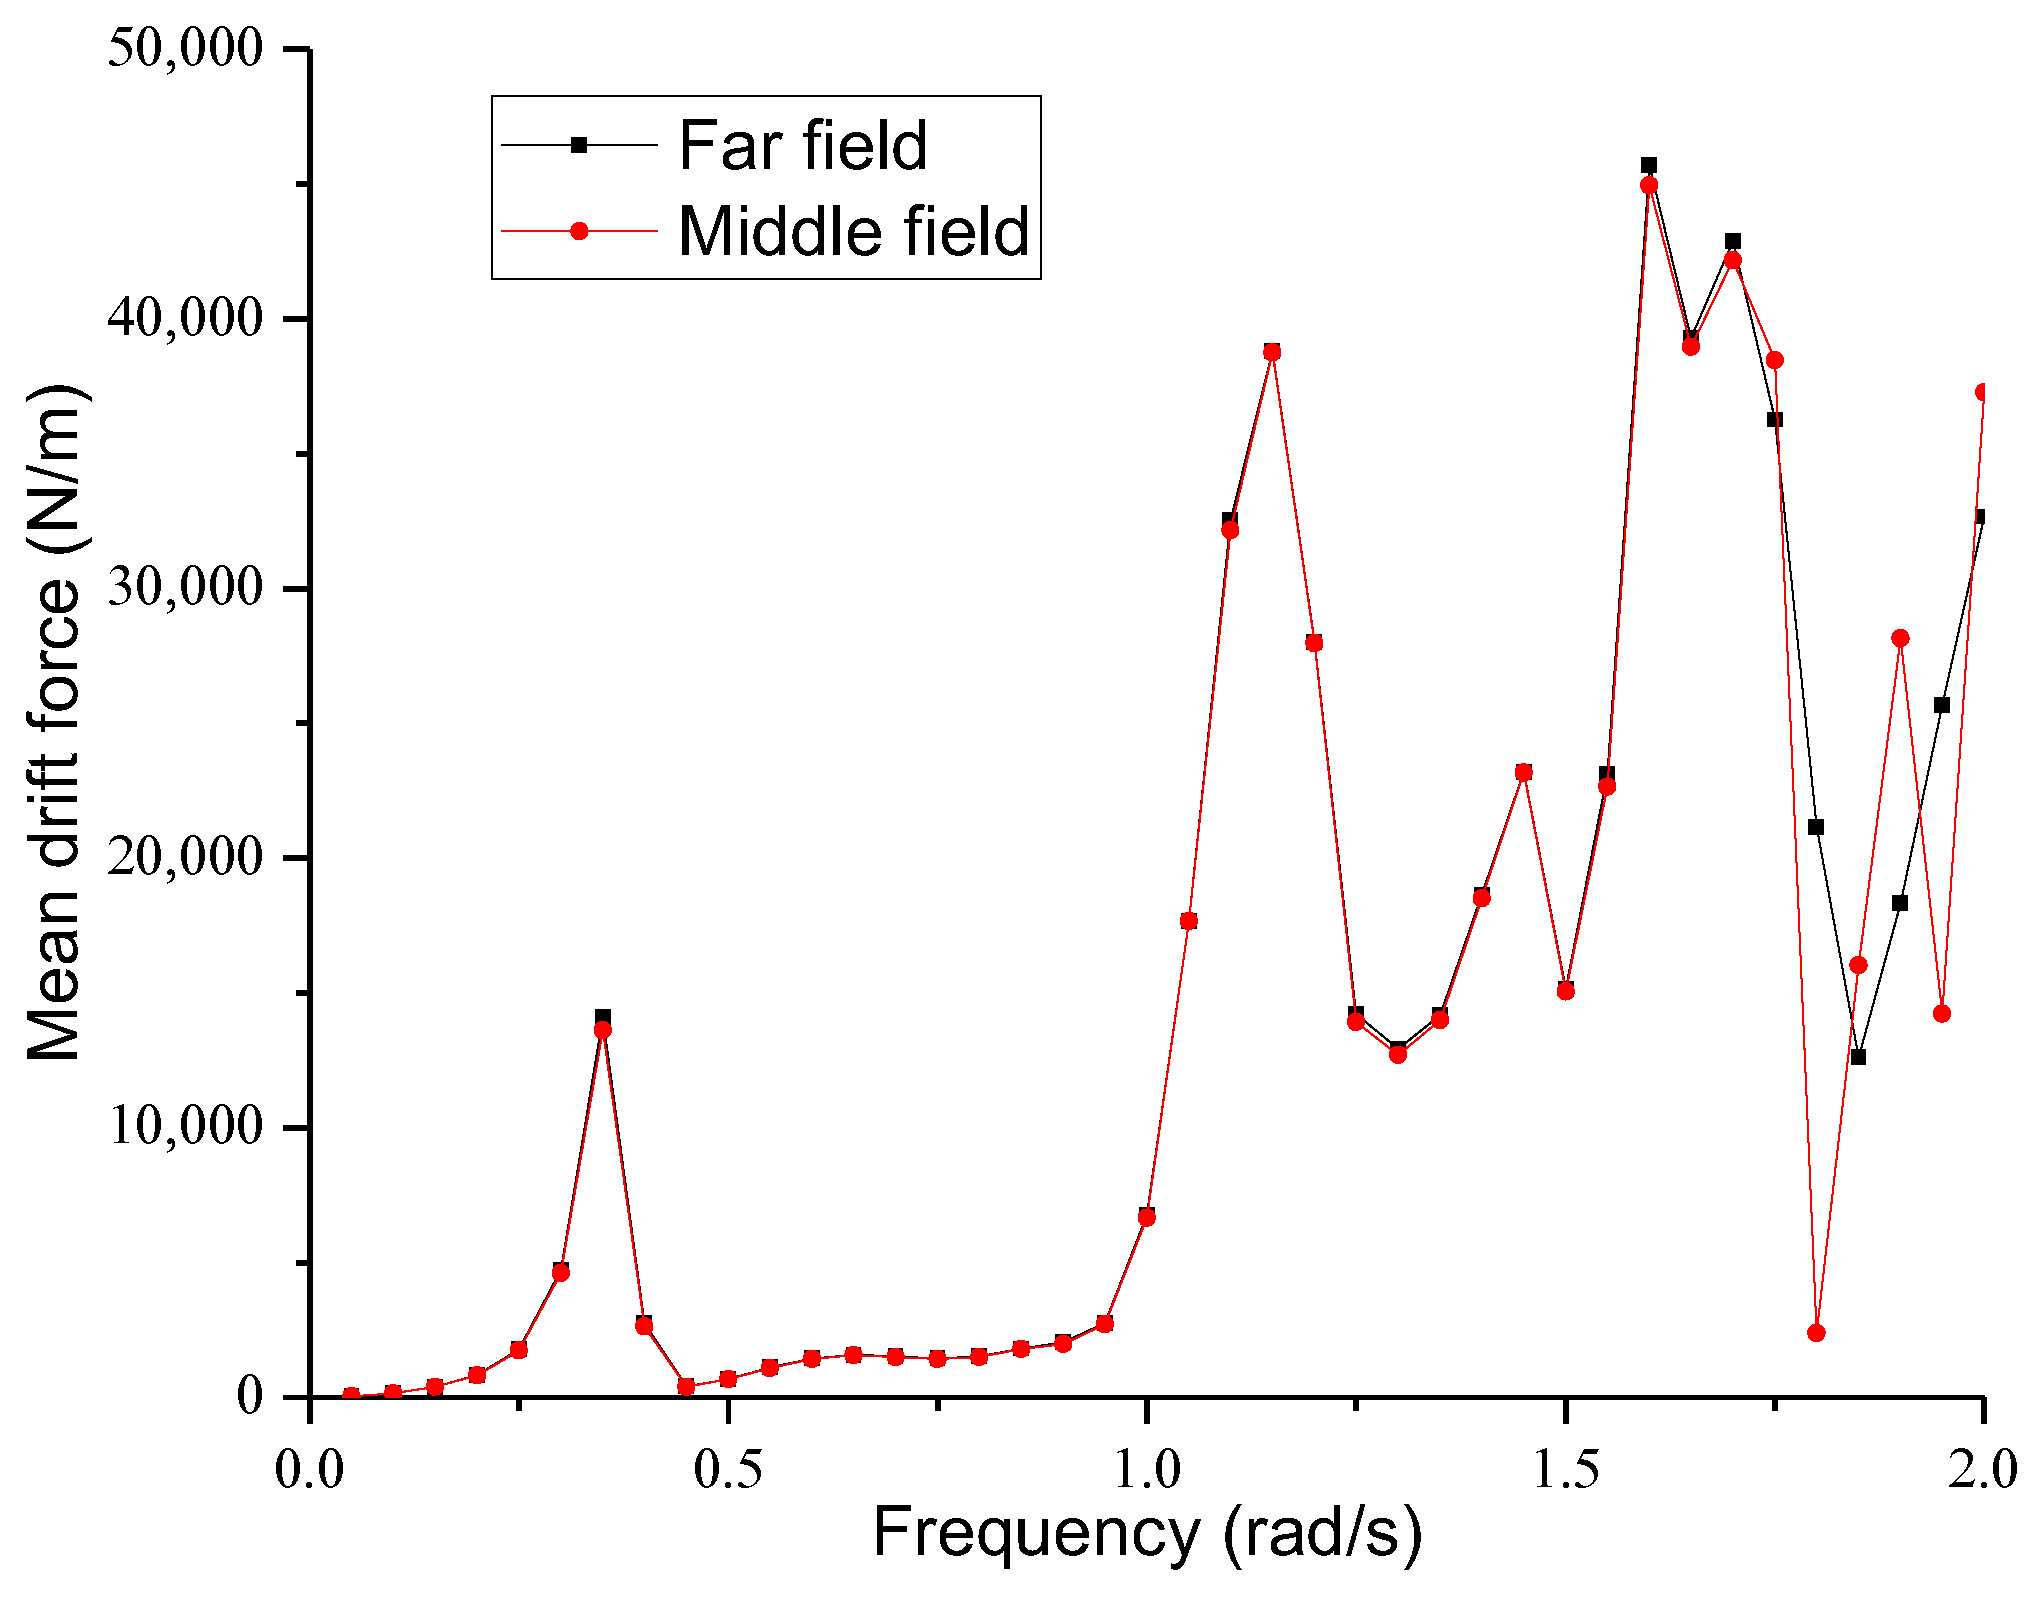
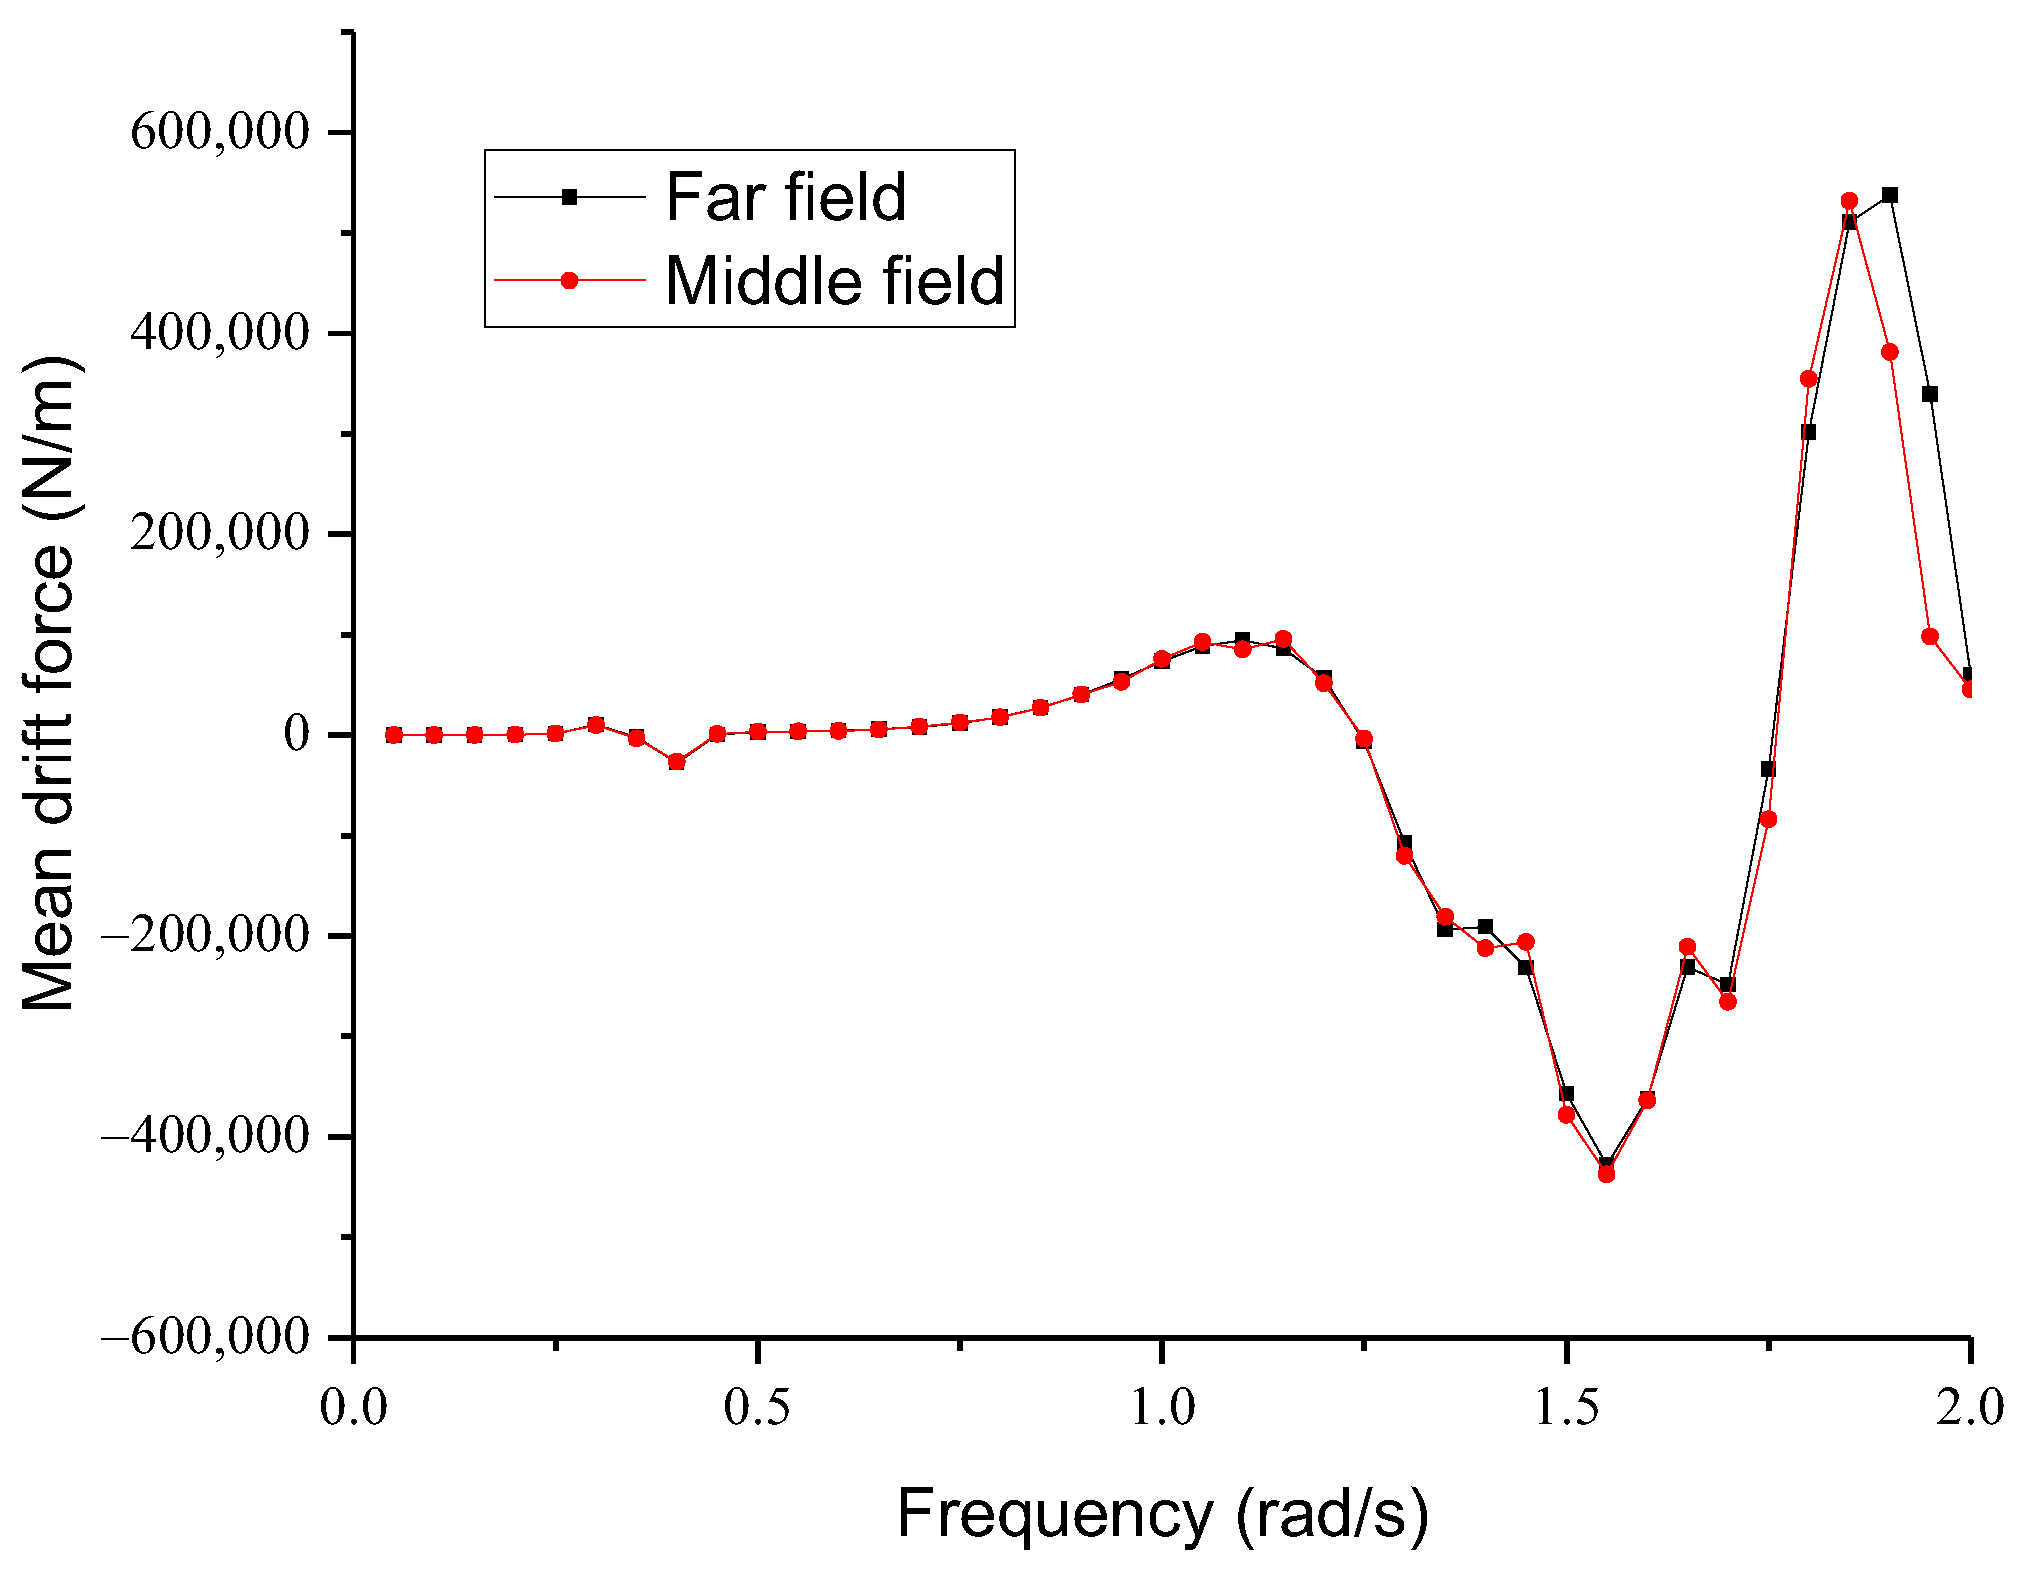
4.1. Verification of Numerical Results
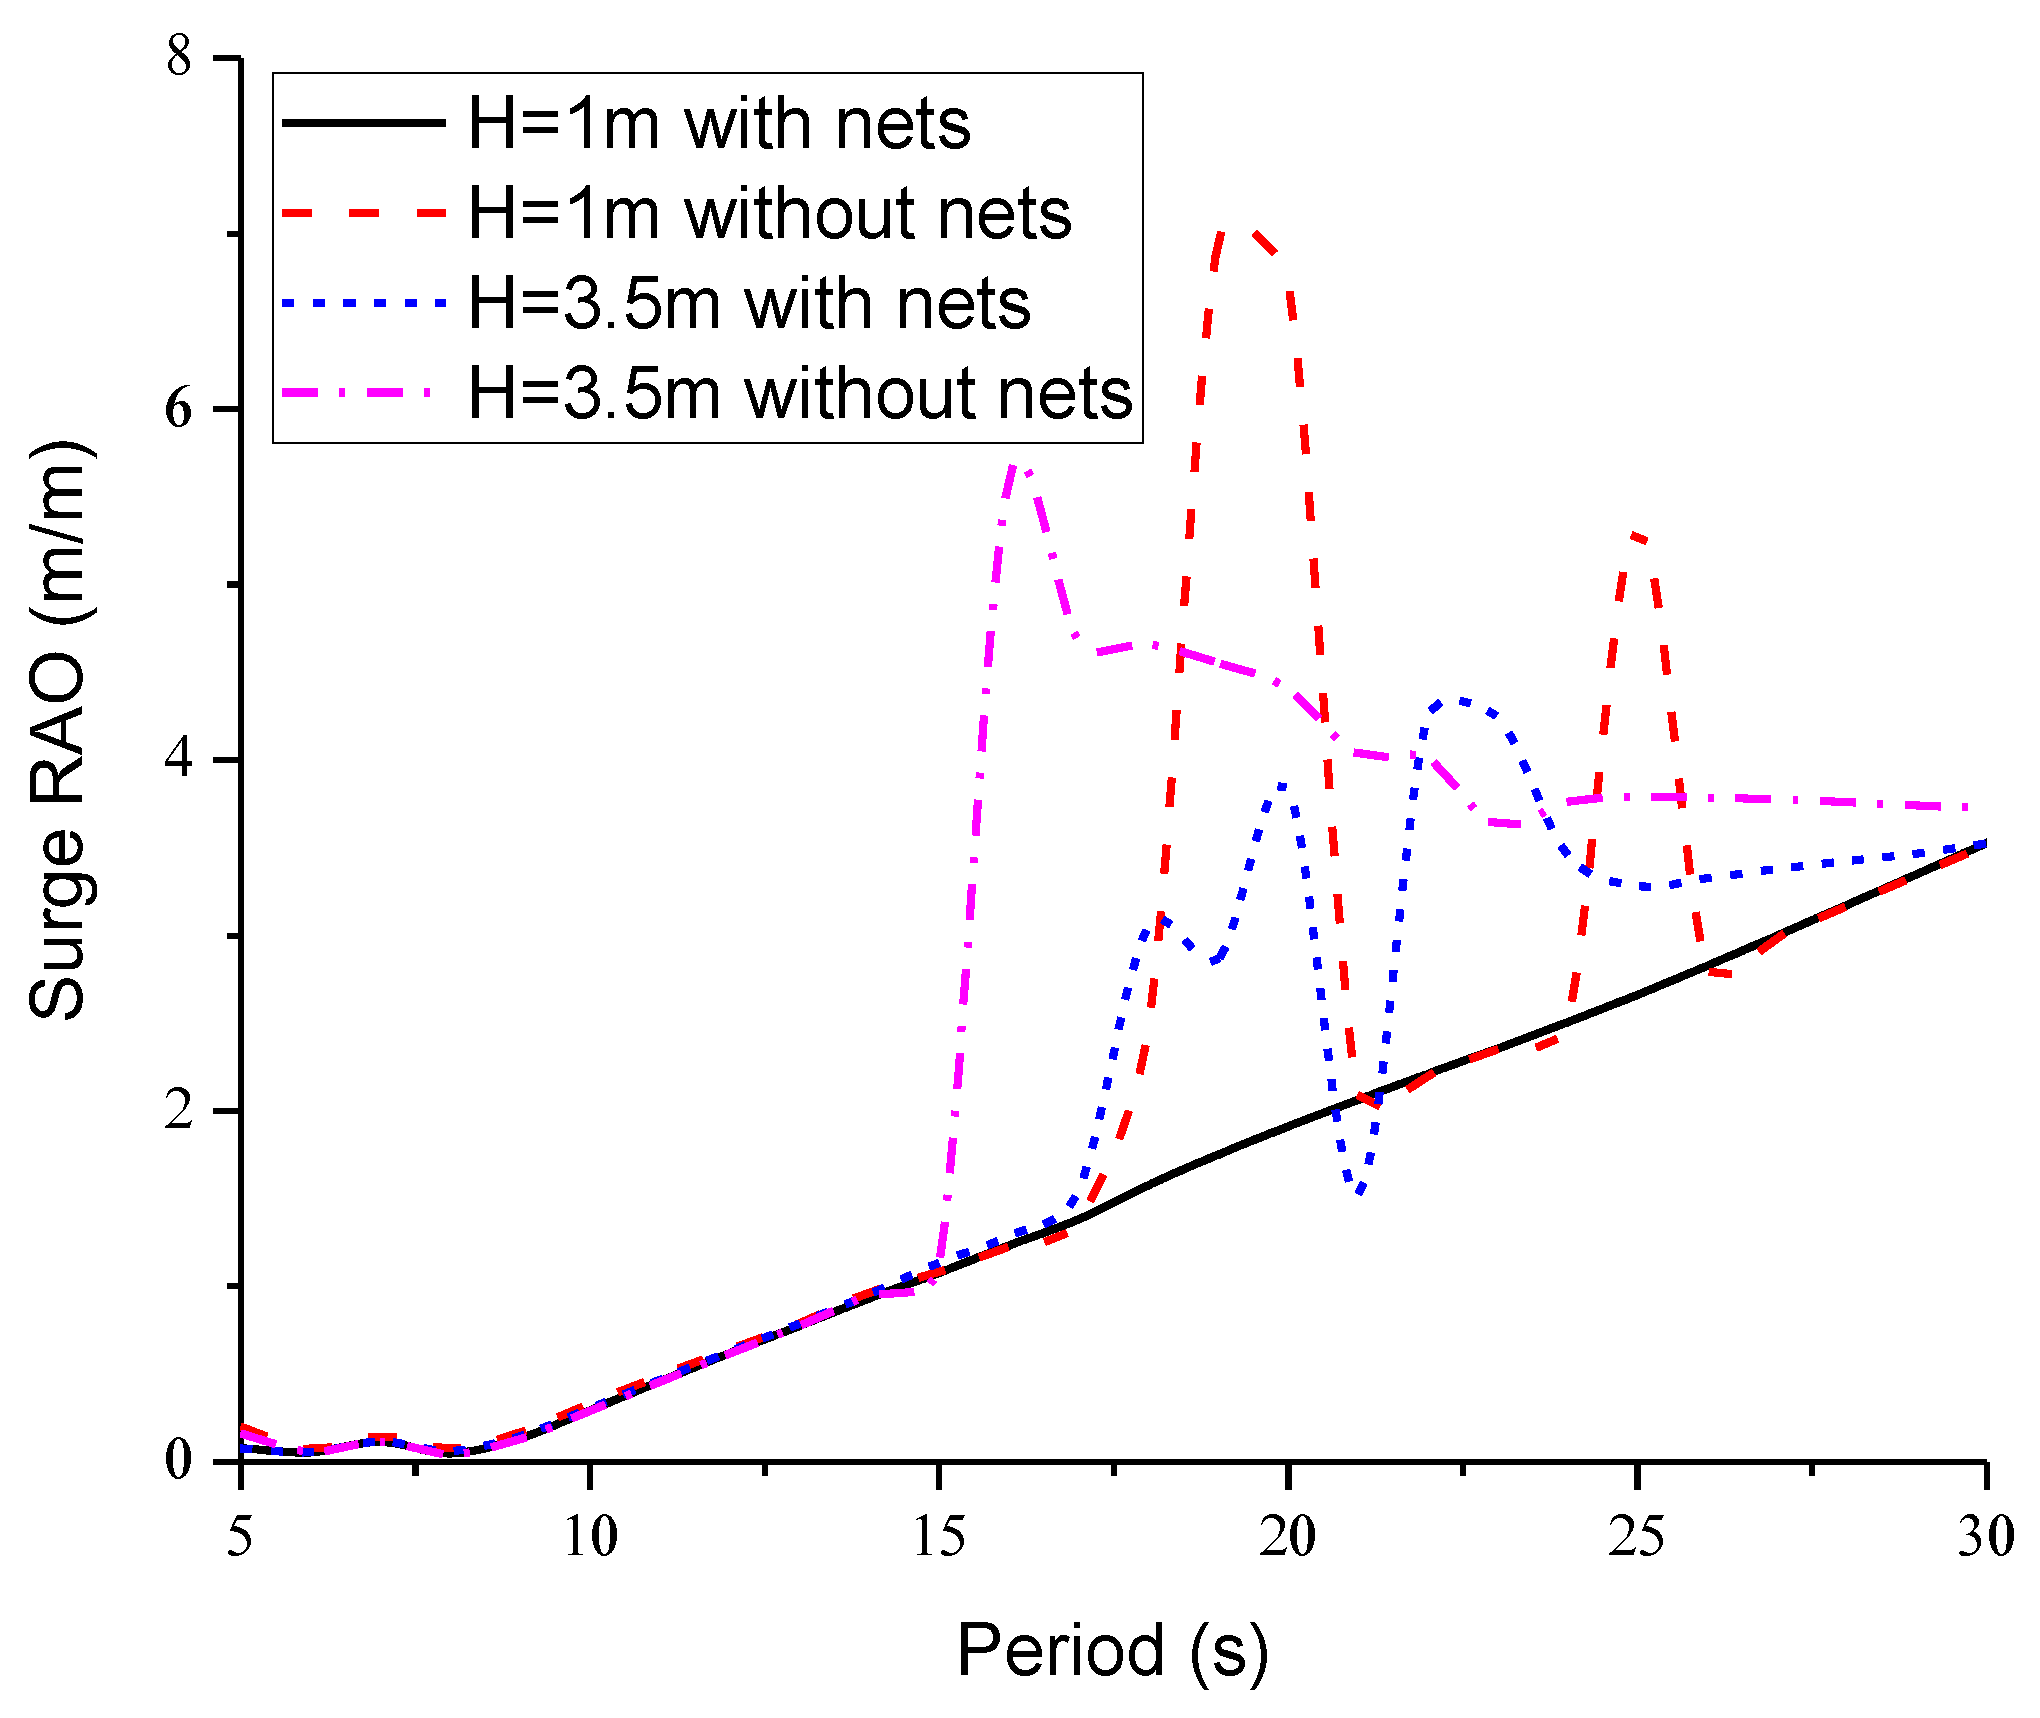
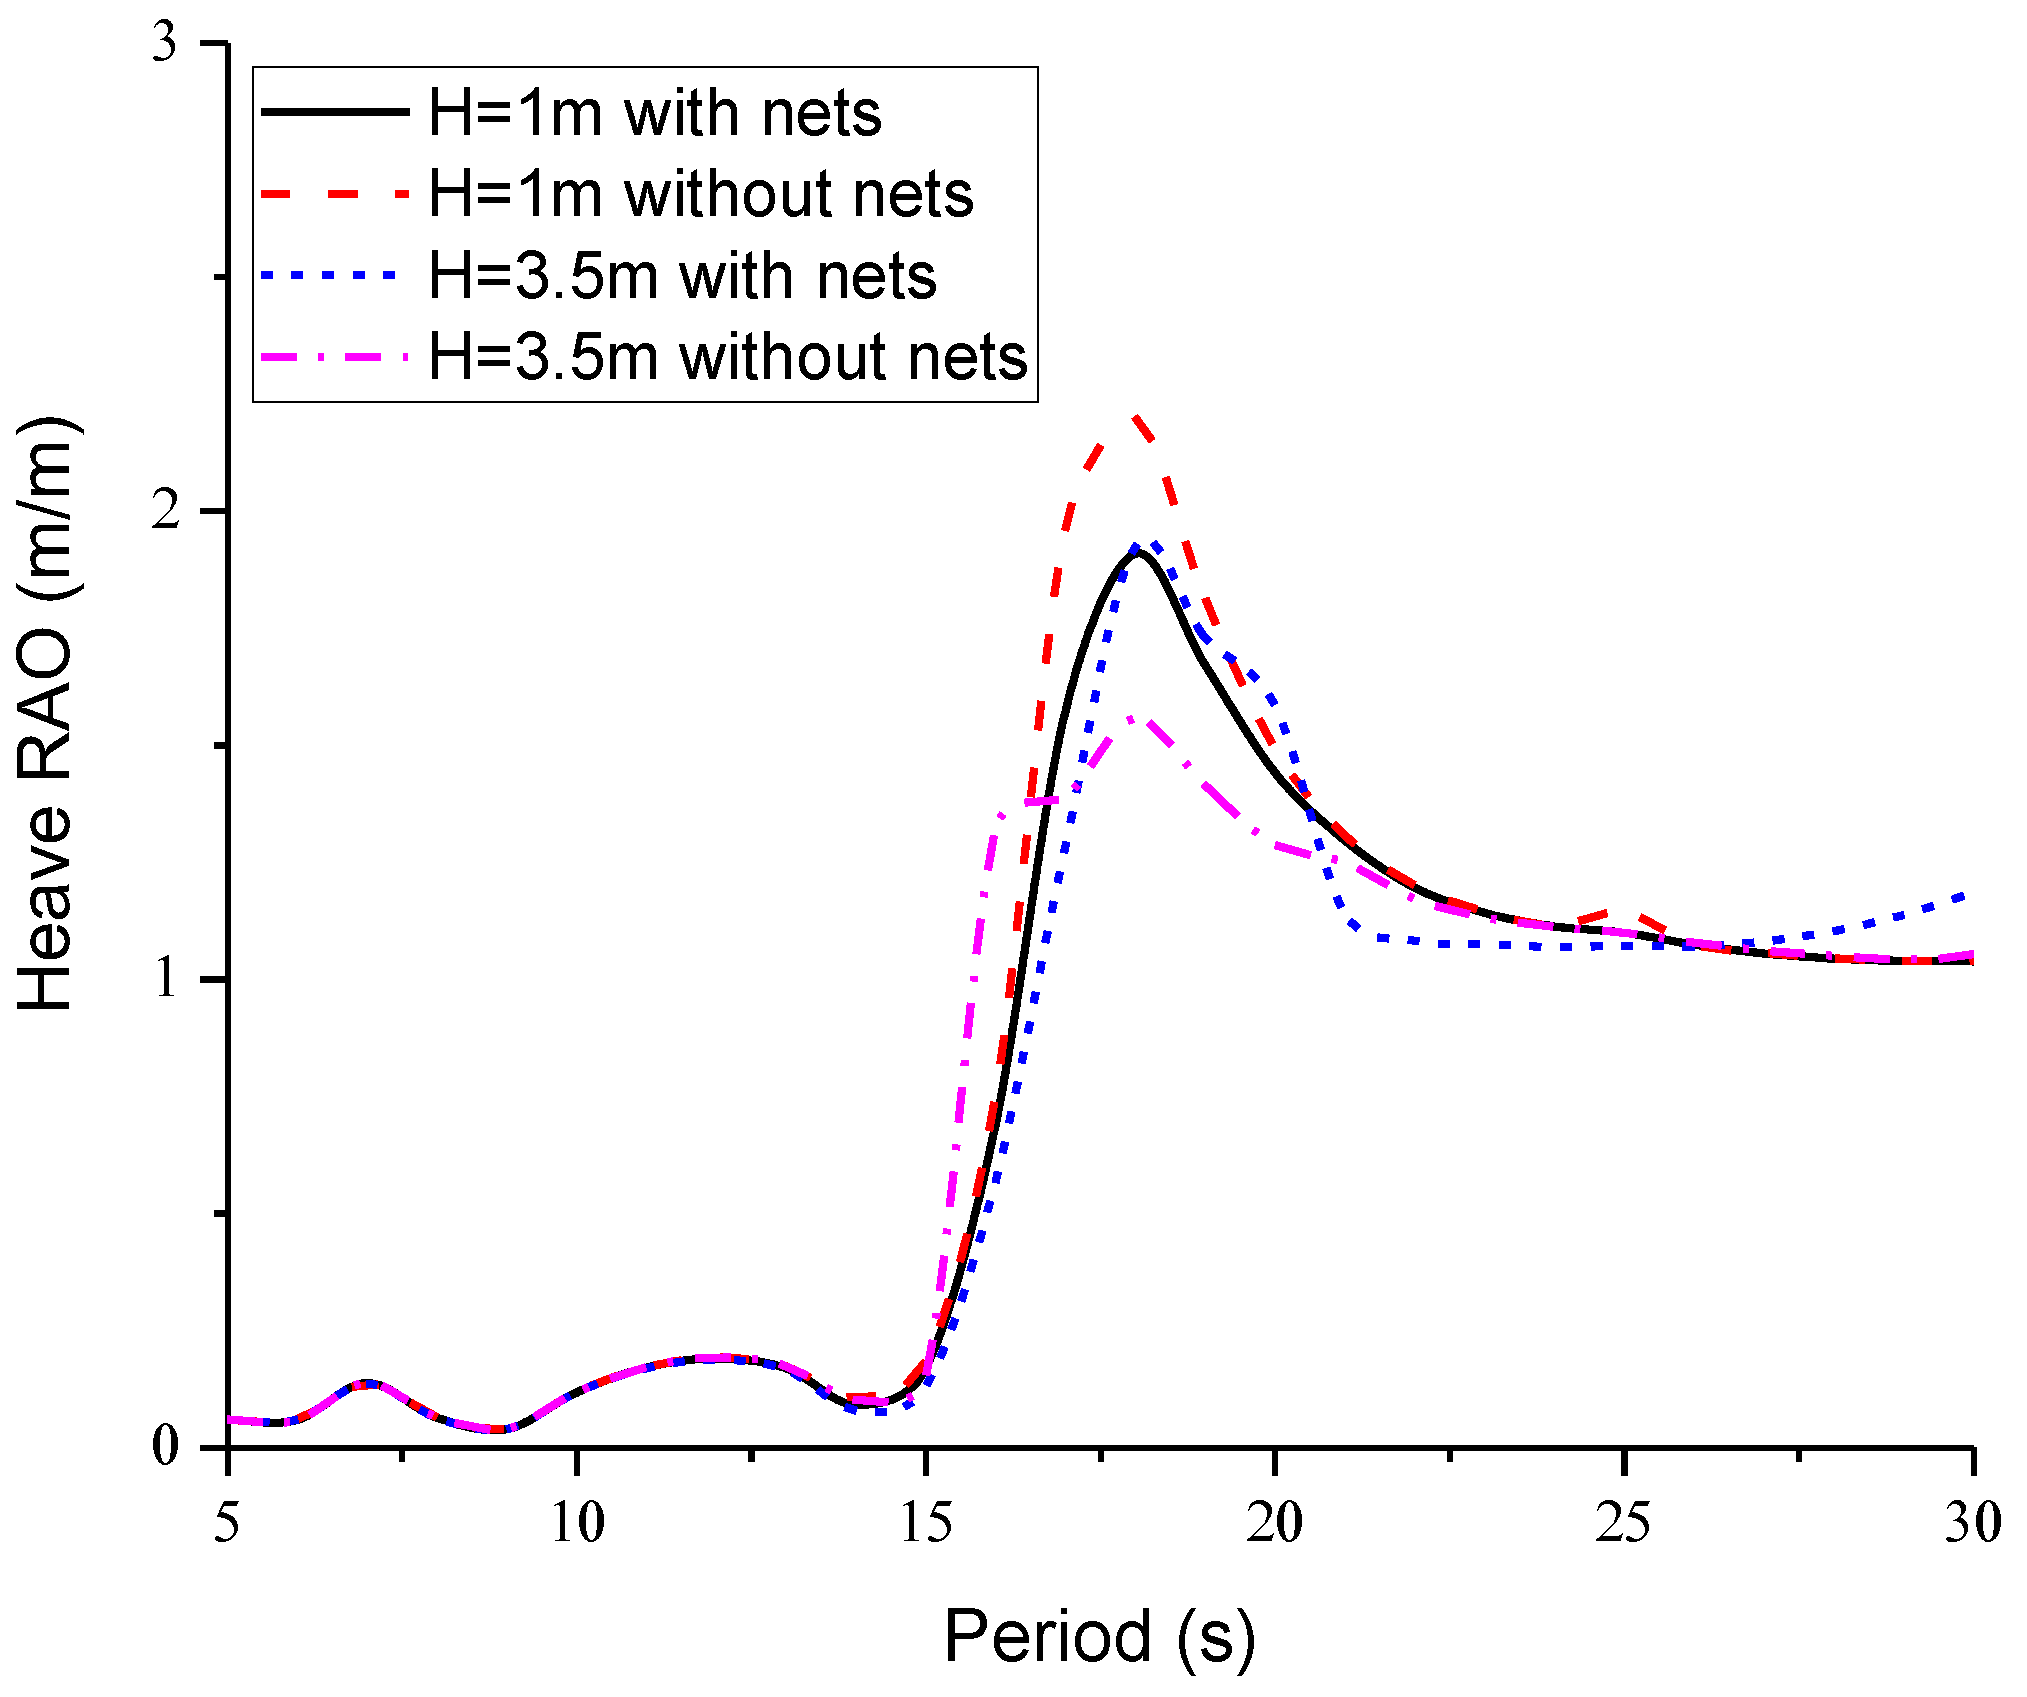
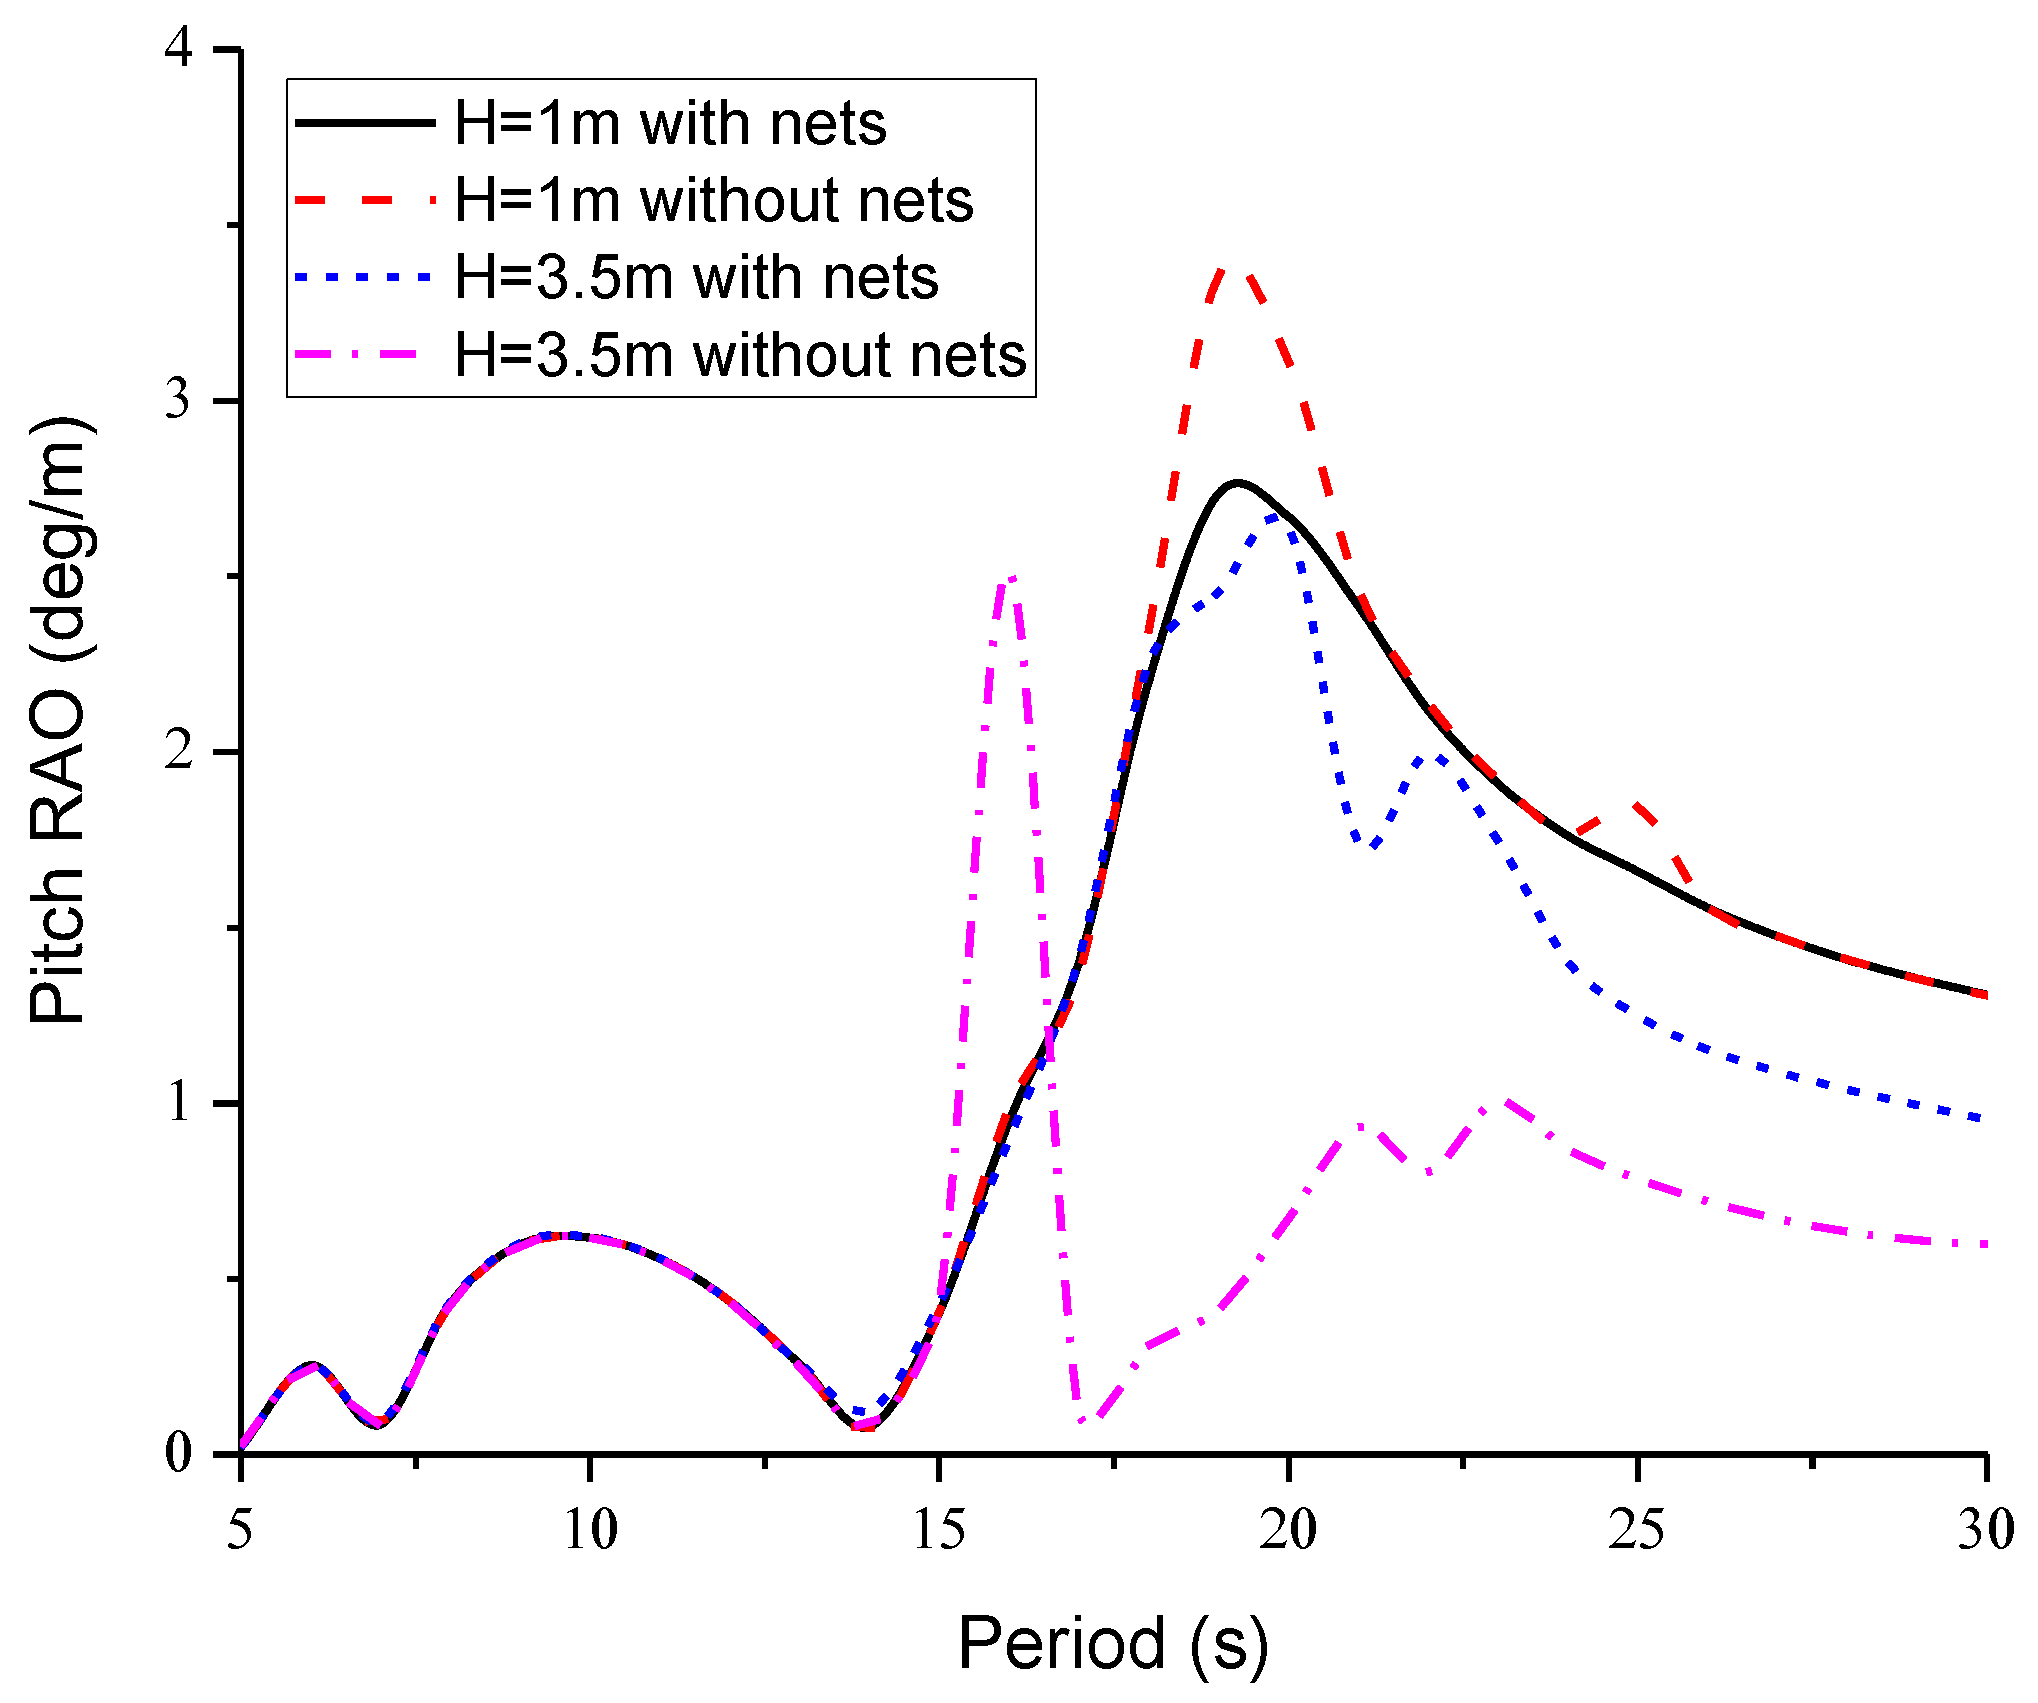
4.2. Hydrodynamic Performance in Regular Waves
4.3. Dynamic Response in Waves, Winds, and Currents
4.3.1. Mooring Line Tension
4.3.2. Six-Degree-of-Freedom Motion
5. Conclusions
Author Contributions
Funding
Institutional Review Board Statement
Informed Consent Statement
Data Availability Statement
Conflicts of Interest
References
- Grigorakis, K.; Rigos, G. Aquaculture effects on environmental and public welfare—The case of Mediterranean mariculture. Chemosphere 2011, 85, 899–919. [Google Scholar] [CrossRef]
- Ferreira, J.; Saurel, C.; e Silva, J.L.; Nunes, J.; Vazquez, F. Modelling of interactions between inshore and offshore aquaculture. Aquaculture 2014, 426–427, 154–164. [Google Scholar] [CrossRef]
- Fredriksson, D.W.; Swift, M.; Irish, J.D.; Tsukrov, I.; Celikkol, B. Fish cage and mooring system dynamics using physical and numerical models with field measurements. Aquac. Eng. 2003, 27, 117–146. [Google Scholar] [CrossRef]
- Lader, P.; Enerhaug, B. Experimental Investigation of Forces and Geometry of a Net Cage in Uniform Flow. IEEE J. Ocean. Eng. 2005, 30, 79–84. [Google Scholar] [CrossRef]
- Zhao, Y.-P.; Li, Y.-C.; Dong, G.-H.; Gui, F.-K.; Teng, B. A numerical study on dynamic properties of the gravity cage in combined wave-current flow. Ocean Eng. 2007, 34, 2350–2363. [Google Scholar] [CrossRef]
- Huang, C.-C.; Tang, H.-J.; Liu, J.-Y. Effects of waves and currents on gravity-type cages in the open sea. Aquac. Eng. 2008, 38, 105–116. [Google Scholar] [CrossRef]
- Dong, G.-H.; Xu, T.-J.; Zhao, Y.-P.; Li, Y.-C.; Gui, F.-K. Numerical simulation of hydrodynamic behavior of gravity cage in irregular waves. Aquac. Eng. 2010, 42, 90–101. [Google Scholar] [CrossRef]
- Li, L.; Fu, S.; Xu, Y.; Wang, J.; Yang, J. Dynamic responses of floating fish cage in waves and current. Ocean Eng. 2013, 72, 297–303. [Google Scholar] [CrossRef]
- Li, L.; Fu, S.; Xu, Y. Nonlinear hydroelastic analysis of an aquaculture fish cage in irregular waves. Mar. Struct. 2013, 34, 56–73. [Google Scholar] [CrossRef]
- Shainee, M.; DeCew, J.; Leira, B.J.; Ellingsen, H.; Fredheim, A. Numerical simulation of a self-submersible SPM cage system in regular waves with following currents. Aquac. Eng. 2013, 54, 29–37. [Google Scholar] [CrossRef]
- Shainee, M.; Leira, B.J.; Ellingsen, H.; Fredheim, A. Investigation of a self-submersible SPM cage system in random waves. Aquac. Eng. 2014, 58, 35–44. [Google Scholar] [CrossRef]
- Cifuentes, C.; Kim, M. Hydrodynamic response of a cage system under waves and currents using a Morison-force model. Ocean Eng. 2017, 141, 283–294. [Google Scholar] [CrossRef]
- Shen, Y.; Greco, M.; Faltinsen, O.M.; Nygaard, I. Numerical and experimental investigations on mooring loads of a marine fish farm in waves and current. J. Fluids Struct. 2018, 79, 115–136. [Google Scholar] [CrossRef]
- Liu, Z.; Wang, S.; Soares, C.G. Numerical Study on the Mooring Force in an Offshore Fish Cage Array. J. Mar. Sci. Eng. 2022, 10, 331. [Google Scholar] [CrossRef]
- Liu, H.-F.; Bi, C.-W.; Xu, Z.; Zhao, Y.-P. Numerical study on the flow environment for a novel design of net cage with a shielding device. Ocean Eng. 2022, 243, 110345. [Google Scholar] [CrossRef]
- SalMar. Offshore Fish Farming—A New Era in Fish Farming Is on Its Way. Available online: https://www.salmar.no/en/offshore-fish-farming-a-new-era/ (accessed on 10 July 2022).
- Dou, R. Numerical Modeling and Analysis of a Semi-Submersible Fish-Cage. Master’s Thesis, Norwegian University of Science and Technology, Trondheim, Norway, June 2018. [Google Scholar]
- Jin, J.; Su, B.; Dou, R.; Luan, C.; Li, L.; Nygaard, I.; Fonseca, N.; Gao, Z. Numerical modelling of hydrodynamic responses of Ocean Farm 1 in waves and current and validation against model test measurements. Mar. Struct. 2021, 78, 103017. [Google Scholar] [CrossRef]
- Yu, Z.; Amdahl, J.; Kristiansen, D.; Bore, P.T. Numerical analysis of local and global responses of an offshore fish farm subjected to ship impacts. Ocean Eng. 2019, 194, 106653. [Google Scholar] [CrossRef]
- Zhao, Y.; Guan, C.; Bi, C.; Liu, H.; Cui, Y. Experimental Investigations on Hydrodynamic Responses of a Semi-Submersible Offshore Fish Farm in Waves. J. Mar. Sci. Eng. 2019, 7, 238. [Google Scholar] [CrossRef]
- Liu, H.-F.; Bi, C.-W.; Xu, Z.; Zhao, Y.-P. Hydrodynamic assessment of a semi-submersible aquaculture platform in uniform fluid environment. Ocean Eng. 2021, 237, 109656. [Google Scholar] [CrossRef]
- Nordlaks. About the Havfarm Projects. Available online: https://www.nordlaks.no/utvikling/om-havfarm-prosjektet (accessed on 10 July 2022).
- Li, L.; Jiang, Z.; Ong, M.C. A Preliminary Study of a Vessel-Shaped Offshore Fish Farm Concept. In Proceedings of the 36th International Conference on Ocean, Offshore and Arctic Engineering, Trondheim, Norway, 25–30 June 2017. [Google Scholar]
- Li, L.; Jiang, Z.; Høiland, A.V.; Ong, M.C. Numerical Analysis of a Vessel-Shaped Offshore Fish Farm. J. Offshore Mech. Arct. Eng. Trans. ASME 2018, 140, 041201. [Google Scholar] [CrossRef]
- Li, L.; Jiang, Z.; Wang, J.; Ong, M.C. Numerical Study on the Heading Misalignment and Current Velocity Reduction of a Vessel-Shaped Offshore Fish Farm. J. Offshore Mech. Arct. Eng. Trans. ASME 2019, 141, 051602. [Google Scholar] [CrossRef]
- Li, L.; Jiang, Z.; Ong, M.C.; Hu, W. Design optimization of mooring system: An application to a vessel-shaped offshore fish farm. Eng. Struct. 2019, 197, 109363. [Google Scholar] [CrossRef]
- Ma, C.; Zhao, Y.-P.; Bi, C.-W. Numerical study on hydrodynamic responses of a single-point moored vessel-shaped floating aquaculture platform in waves. Aquac. Eng. 2022, 96, 102216. [Google Scholar] [CrossRef]
- Ma, C.; Bi, C.-W.; Xu, Z.; Zhao, Y.-P. Dynamic behaviors of a hinged multi-body floating aquaculture platform under regular waves. Ocean Eng. 2022, 243, 110278. [Google Scholar] [CrossRef]
- China Daily. Offshore Submersible Salmon Farm Ready for Launch. Available online: https://www.chinadaily.com.cn/a/201805/04/WS5aebddd4a3105cdcf651c013.html (accessed on 10 July 2022).
- Wang, G.; Martin, T.; Huang, L.; Bihs, H. A Numerical Study of the Hydrodynamics of an Offshore Fish Farm Using REEF3D. J. Offshore Mech. Arct. Eng. Trans. ASME 2022, 144, 021301. [Google Scholar] [CrossRef]
- Wang, G.; Martin, T.; Huang, L.; Bihs, H. Numerical investigation of the hydrodynamics of a submersible steel-frame offshore fish farm in regular waves using CFD. Ocean Eng. 2022, 256, 111528. [Google Scholar] [CrossRef]
- Miao, Y.-J.; Ding, J.; Tian, C.; Chen, X.-J.; Fan, Y.-L. Experimental and numerical study of a semi-submersible offshore fish farm under waves. Ocean Eng. 2021, 225, 108794. [Google Scholar] [CrossRef]
- Huang, X.-H.; Liu, H.-Y.; Hu, Y.; Yuan, T.-P.; Tao, Q.-Y.; Wang, S.-M.; Liu, Z.-X. Hydrodynamic performance of a semi-submersible offshore fish farm with a single point mooring system in pure waves and current. Aquac. Eng. 2020, 90, 102075. [Google Scholar] [CrossRef]
- Chu, Y.I.; Wang, C.M. Hydrodynamic Response Analysis of Combined Spar Wind Turbine and Fish Cage for Offshore Fish Farms. Int. J. Struct. Stab. Dyn. 2020, 20, 2050104. [Google Scholar] [CrossRef]
- ANSYS. Aqwa Theroy Manual; ANSYS, Inc.: Canonsburg, PA, USA, 2017. [Google Scholar]
- ANSYS. Design Modeler User Guide; ANSYS, Inc.: Canonsburg, PA, USA, 2012. [Google Scholar]
- IEA-OES. Annual Report: An Overview of Ocean Energy Activities in 2020; IEA-OES: Paris, France, 2021. [Google Scholar]
- Yue, W.; Wang, W.; Sheng, S.; Ye, Y.; Hong, T. Analysis of the wave load and dynamic response of a new semi-submersible wave-energy-powered aquaculture platform. Ocean Eng. 2022, 248, 110346. [Google Scholar] [CrossRef]
- China Daily. New Marine Platform to Transform Fishing and Tourism. Available online: http://www.chinadaily.com.cn/a/202204/07/WS624e58cda310fd2b29e55928.html (accessed on 10 July 2022).
- FZNEWS.COM.CN. The First Deep-Sea Agriculture and Fishing Tourism Platform in Fujian—“Mintou No.1” Sea Resort Hotel Holds a Soft Opening. Available online: https://21cmcc.org.cn/English/news/newsreleases/202307/t20230721_1839.htm (accessed on 15 August 2023).
- Chen, X.B. Hydrodynamics in offshore and naval applications-Part I. In Proceedings of the 6th International Conference on Hydrodynamics, Perth, Australia, 24–26 November 2004. [Google Scholar]
- China Classification Society. Rules for Classification of Mobile Offshore Units; China Classification Society: Beijing, China, 2020. [Google Scholar]
- China Classification Society. Guidelines for Inspection of Marine fishery and Aquaculture Facilities; China Classification Society: Beijing, China, 2019. (In Chinese) [Google Scholar]
- Zhang, D.P.; Bai, Y.; Soares, C.G. Dynamic analysis of an array of semi-rigid “sea station” fish cages subjected to waves. Aquac. Eng. 2021, 94, 102172. [Google Scholar] [CrossRef]
- Liu, H.; Chen, M.; Han, Z.; Zhou, H.; Li, L. Feasibility Study of a Novel Open Ocean Aquaculture Ship Integrating with a Wind Turbine and an Internal Turret Mooring System. J. Mar. Sci. Eng. 2022, 10, 1729. [Google Scholar] [CrossRef]
- Orcina, Ltd. OrcaFlex User Manual: OrcaFlex Version 10.3c; Orcina, Ltd.: Ulverston, UK, 2018. [Google Scholar]
- Bureau Veritas. HydroStar for Experts User Manual, Version V7.3; Bureau Veritas: Paris, France, 2018. [Google Scholar]
- Lei, Y.; Zhao, S.X.; Zheng, X.Y.; Li, W. Effects of Fish Nets on the Nonlinear Dynamic Performance of a Floating Offshore Wind Turbine Integrated with a Steel Fish Farming Cage. Int. J. Struct. Stab. Dyn. 2020, 20, 2050042. [Google Scholar] [CrossRef]


| Parameters | Unit | Value |
|---|---|---|
| Total length | m | 86 |
| Length of main structure | m | 80 |
| Width | m | 30 |
| Depth (Main deck) | m | 3 |
| Depth (Top deck) | m | 18 |
| Operation/Survival draft | m | 10 |
| Unit | Operation/Survival Condition | |
|---|---|---|
| Weight | kg | 3,702,300 |
| Center of gravity in x direction | m | −0.279 |
| Center of gravity in y direction | m | 0 |
| Center of gravity in z direction | m | −5.842 |
| Radius of gyration about the x axis | m | 13.65 |
| Radius of gyration about y axis | m | 28.95 |
| Radius of gyration about z axis | m | 31.04 |
| Operation Condition | Survival Condition | |
|---|---|---|
| Significant wave height Hs (m) | 1 | 3.5 |
| Peak wave period Tp (s) | 4.3 | 6.5 |
| Wave spectrum factor γ | 1 | 1 |
| 1-h wind speed (m/s) | 25.8 | 25.8 |
| Current speed (m/s) | 0.5 | 0.88 |
| Parameters | Unit | Value |
|---|---|---|
| Diameter | mm | 5 |
| Density | t/m | 6.5 × 10⁻⁶ |
| Spacing | mm | 50 |
| Equivalent Number | Equivalent Diameter (m) | Equivalent Drag Coefficient | Equivalent Inertia Coefficient | |
|---|---|---|---|---|
| Vertical direction | 95 | 0.049 | 14.864 | 1 |
| Horizontal direction | 60 | 0.039 | 11.813 | 1 |
| Line No. | Diameter (mm) | Length (m) | Grade | MBL * (kN) | Axial Stiffness (kN) |
|---|---|---|---|---|---|
| 1~8 | 68 | 245 | R3S studlink | 4440 | 467.024 × 10³ |
| Line No. | Coordinate of Fairleads | Coordinate of Anchors | ||||
|---|---|---|---|---|---|---|
| x (m) | y (m) | z (m) | X (m) | Y (m) | Z (m) | |
| 1 | 43 | −11.5 | −7 | 212.706 | −181.206 | −20 |
| 2 | 43 | −7.8 | −7 | 233.405 | −153.903 | −20 |
| 3 | 43 | 7.8 | −7 | 233.405 | 153.903 | −20 |
| 4 | 43 | 11.5 | −7 | 212.706 | 181.206 | −20 |
| 5 | −43 | 11.5 | −7 | −212.706 | 181.206 | −20 |
| 6 | −43 | 7.8 | −7 | −233.405 | 153.903 | −20 |
| 7 | −43 | −7.8 | −7 | −233.405 | −153.903 | −20 |
| 8 | −43 | −11.5 | −7 | −212.706 | −181.206 | −20 |
| Loading Case | Hs (m) | Tp (s) | Gamma | Wind Speed (m/s) | Current Speed (m/s) | Wave Direction (°) | Wind Direction (°) | Current Direction (°) | Line Condition |
|---|---|---|---|---|---|---|---|---|---|
| LC1 | 3.5 | 6.5 | 1 | 25.8 | 0.88 | 180 | 180 | 180 | Intact |
| LC2 | 3.5 | 6.5 | 1 | 25.8 | 0.88 | 157.5 | 157.5 | 157.5 | Intact |
| LC3 | 3.5 | 6.5 | 1 | 25.8 | 0.88 | 135 | 135 | 135 | Intact |
| LC4 | 3.5 | 6.5 | 1 | 25.8 | 0.88 | 112.5 | 112.5 | 112.5 | Intact |
| LC5 | 3.5 | 6.5 | 1 | 25.8 | 0.88 | 90 | 90 | 90 | Intact |
| LC6 | 3.5 | 6.5 | 1 | 25.8 | 0.88 | 180 | 180 | 180 | Line 2 damaged |
| LC7 | 3.5 | 6.5 | 1 | 25.8 | 0.88 | 157.5 | 157.5 | 157.5 | Line 2 damaged |
| LC8 | 3.5 | 6.5 | 1 | 25.8 | 0.88 | 135 | 135 | 135 | Line 1 damaged |
| LC9 | 3.5 | 6.5 | 1 | 25.8 | 0.88 | 112.5 | 112.5 | 112.5 | Line 1 damaged |
| LC10 | 3.5 | 6.5 | 1 | 25.8 | 0.88 | 90 | 90 | 90 | Line 1 damaged |
| Extreme Response | LC1 | LC2 | LC3 | LC4 | LC5 | LC6 | LC7 | LC8 | LC9 | LC10 | |
|---|---|---|---|---|---|---|---|---|---|---|---|
| Line 1 | Mean (kN) | 205 | 330 | 425 | 572 | 652 | 546 | 772 | --- | --- | --- |
| Max (kN) | 523 | 895 | 948 | 1729 | 2460 | 1381 | 1817 | --- | --- | --- | |
| SF * | 8.49 | 4.96 | 4.68 | 2.57 | 1.81 | 3.21 | 2.44 | --- | --- | --- | |
| Line 2 | Mean (kN) | 364 | 465 | 507 | 415 | 285 | --- | --- | 927 | 991 | 937 |
| Max (kN) | 1057 | 1270 | 1071 | 1184 | 1262 | --- | --- | 1940 | 2773 | 3337 | |
| SF | 4.20 | 3.50 | 4.14 | 3.75 | 3.52 | --- | --- | 2.29 | 1.60 | 1.33 | |
| Line 3 | Mean (kN) | 364 | 234 | 107 | 22 | 13 | 409 | 276 | 87 | 18 | 12 |
| Max (kN) | 1056 | 710 | 614 | 57 | 29 | 1168 | 825 | 503 | 35 | 24 | |
| SF | 4.20 | 6.25 | 7.23 | 77.88 | 152.57 | 3.80 | 5.38 | 8.82 | 126.59 | 181.55 | |
| Line 4 | Mean (kN) | 205 | 125 | 66 | 19 | 12 | 206 | 132 | 54 | 16 | 12 |
| Max (kN) | 522 | 286 | 249 | 42 | 20 | 524 | 308 | 203 | 29 | 20 | |
| SF | 8.51 | 15.51 | 17.83 | 106.98 | 217.99 | 8.48 | 14.43 | 21.84 | 151.41 | 227.64 | |
| Line 5 | Mean (kN) | 14 | 11 | 11 | 11 | 12 | 13 | 11 | 11 | 11 | 12 |
| Max (kN) | 27 | 18 | 16 | 21 | 22 | 26 | 16 | 15 | 19 | 19 | |
| SF | 166.69 | 244.06 | 279.21 | 211.80 | 204.21 | 168.34 | 269.49 | 295.50 | 230.29 | 238.47 | |
| Line 6 | Mean (kN) | 13 | 11 | 11 | 11 | 13 | 12 | 11 | 11 | 11 | 13 |
| Max (kN) | 27 | 19 | 16 | 18 | 24 | 21 | 17 | 15 | 15 | 27 | |
| SF | 164.95 | 234.22 | 272.20 | 249.89 | 181.25 | 215.07 | 256.17 | 288.61 | 295.06 | 166.86 | |
| Line 7 | Mean (kN) | 13 | 52 | 98 | 164 | 285 | 12 | 48 | 97 | 176 | 301 |
| Max (kN) | 27 | 86 | 201 | 571 | 1244 | 24 | 77 | 212 | 596 | 1132 | |
| SF | 165.64 | 51.59 | 22.09 | 7.77 | 3.57 | 182.07 | 57.80 | 20.91 | 7.44 | 3.92 | |
| Line 8 | Mean (kN) | 14 | 90 | 285 | 531 | 652 | 13 | 84 | 305 | 575 | 691 |
| Max (kN) | 26 | 195 | 837 | 1761 | 2443 | 27 | 174 | 950 | 1869 | 2349 | |
| SF | 167.61 | 22.82 | 5.30 | 2.52 | 1.82 | 166.20 | 25.48 | 4.67 | 2.38 | 1.89 | |
| Loading Case | Parameter | Mean | Std. Dev. * | Max | Min |
|---|---|---|---|---|---|
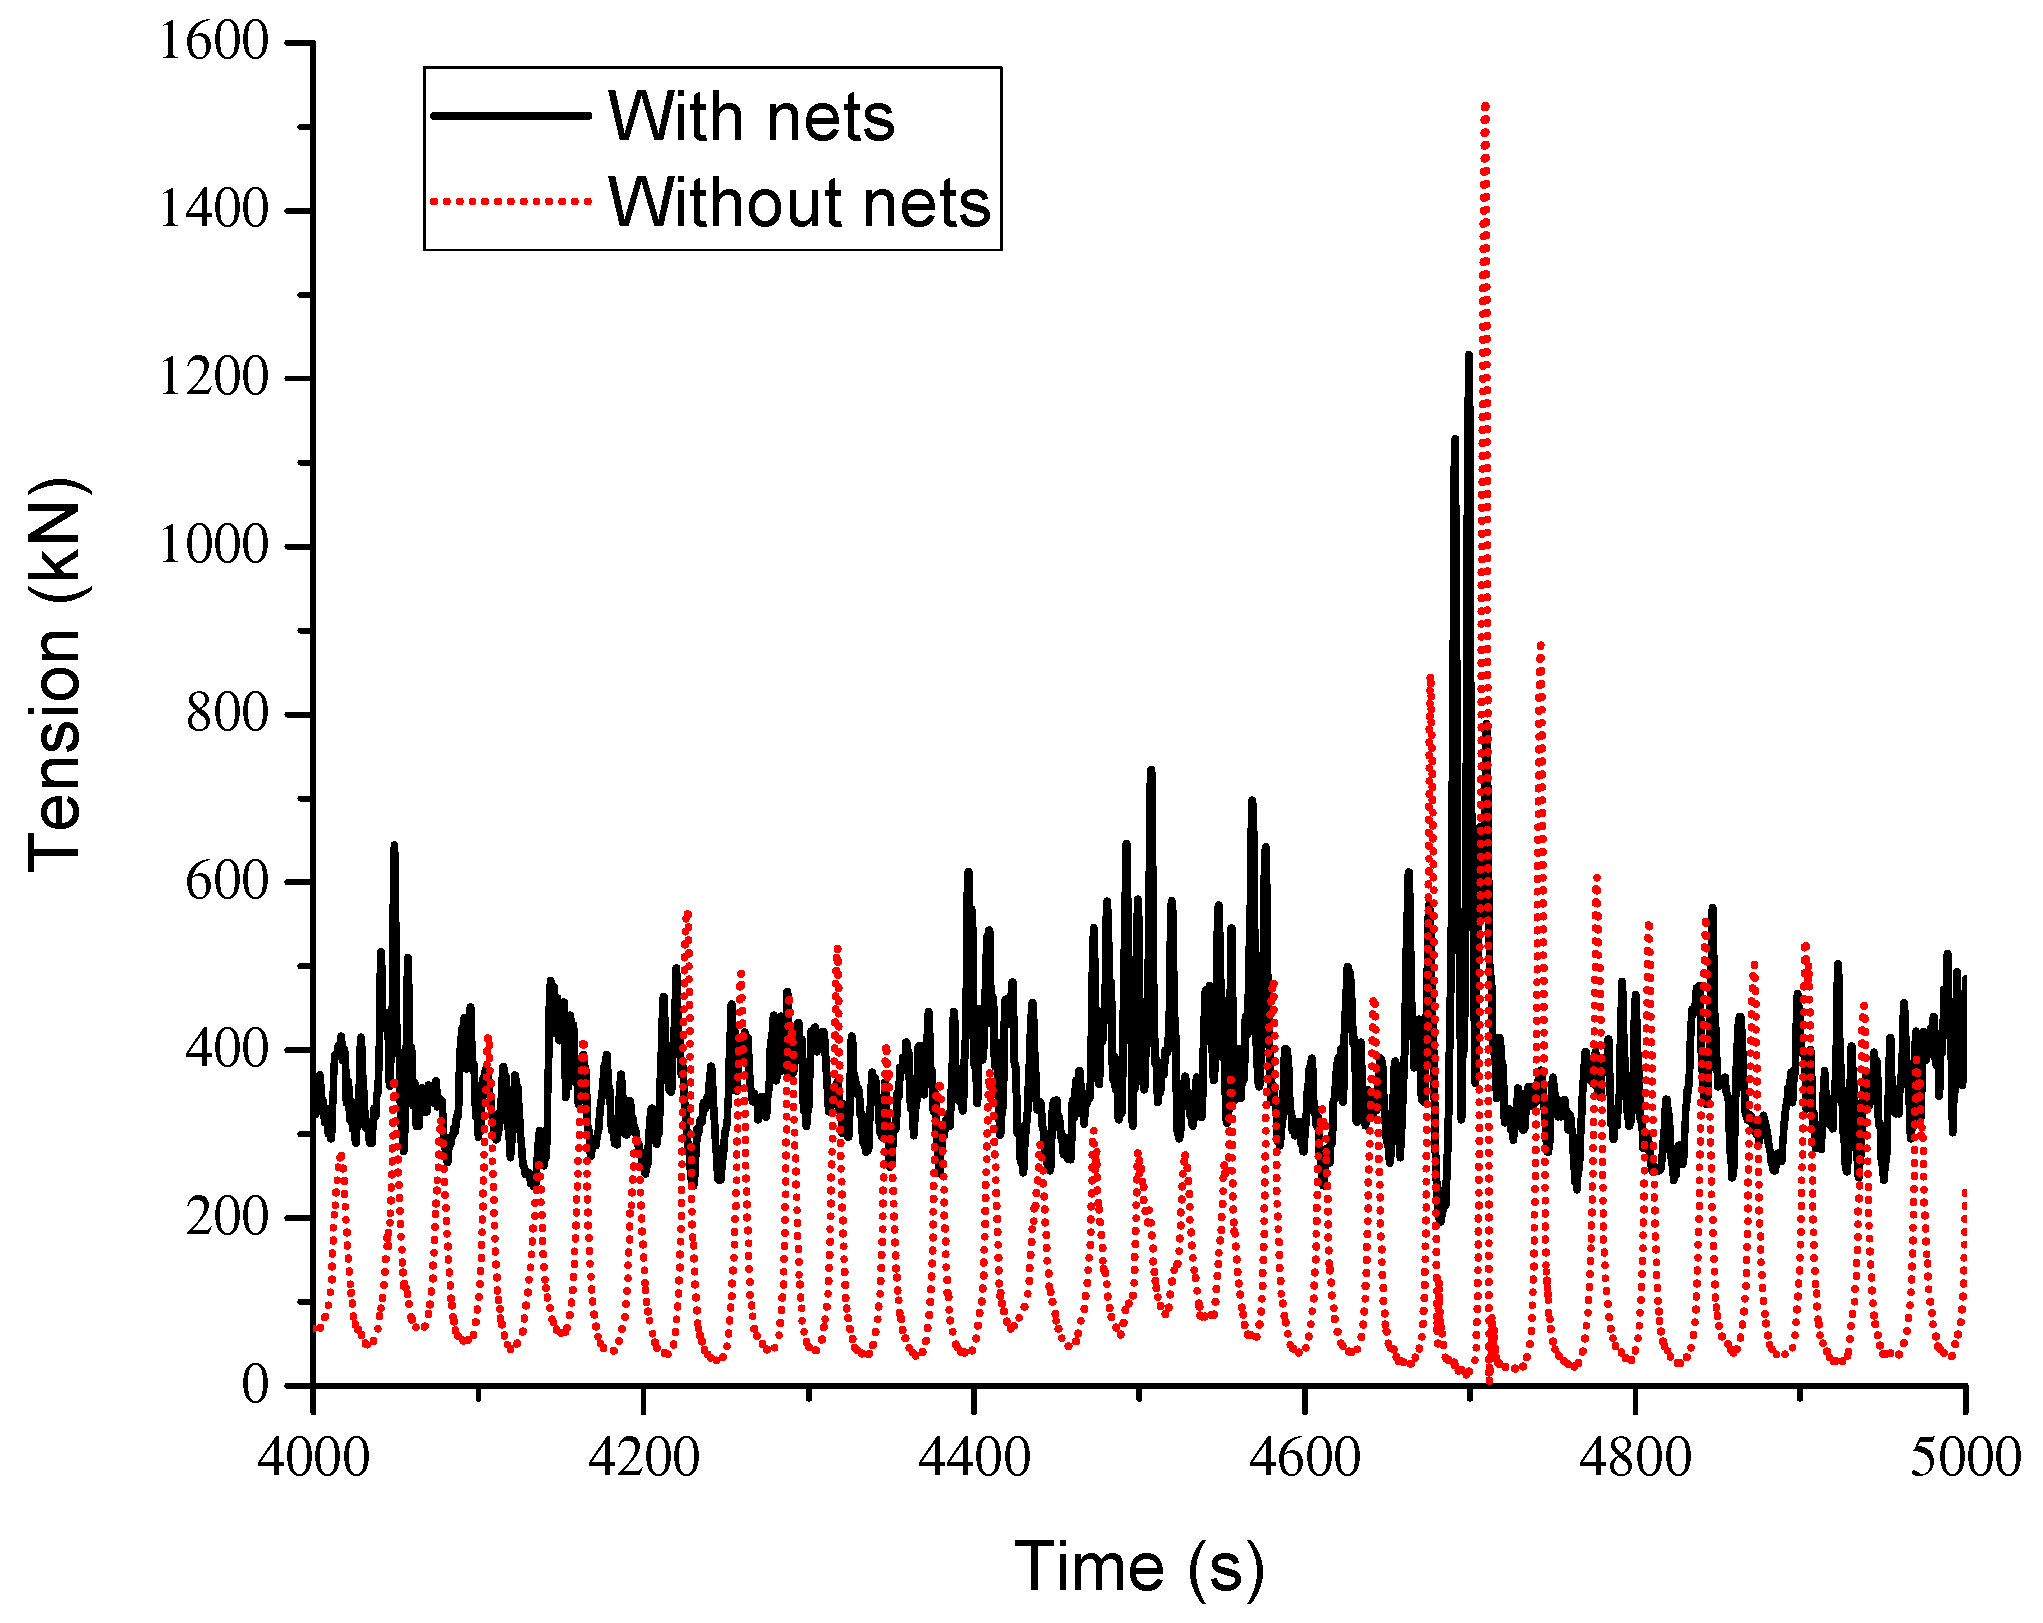
| LC1 | Tension of line 2 with nets (kN) | 365 | 77 | 1229 | 195 |
| LC1 | Tension of line 2 without nets (kN) | 136 | 125 | 1532 | 4 |
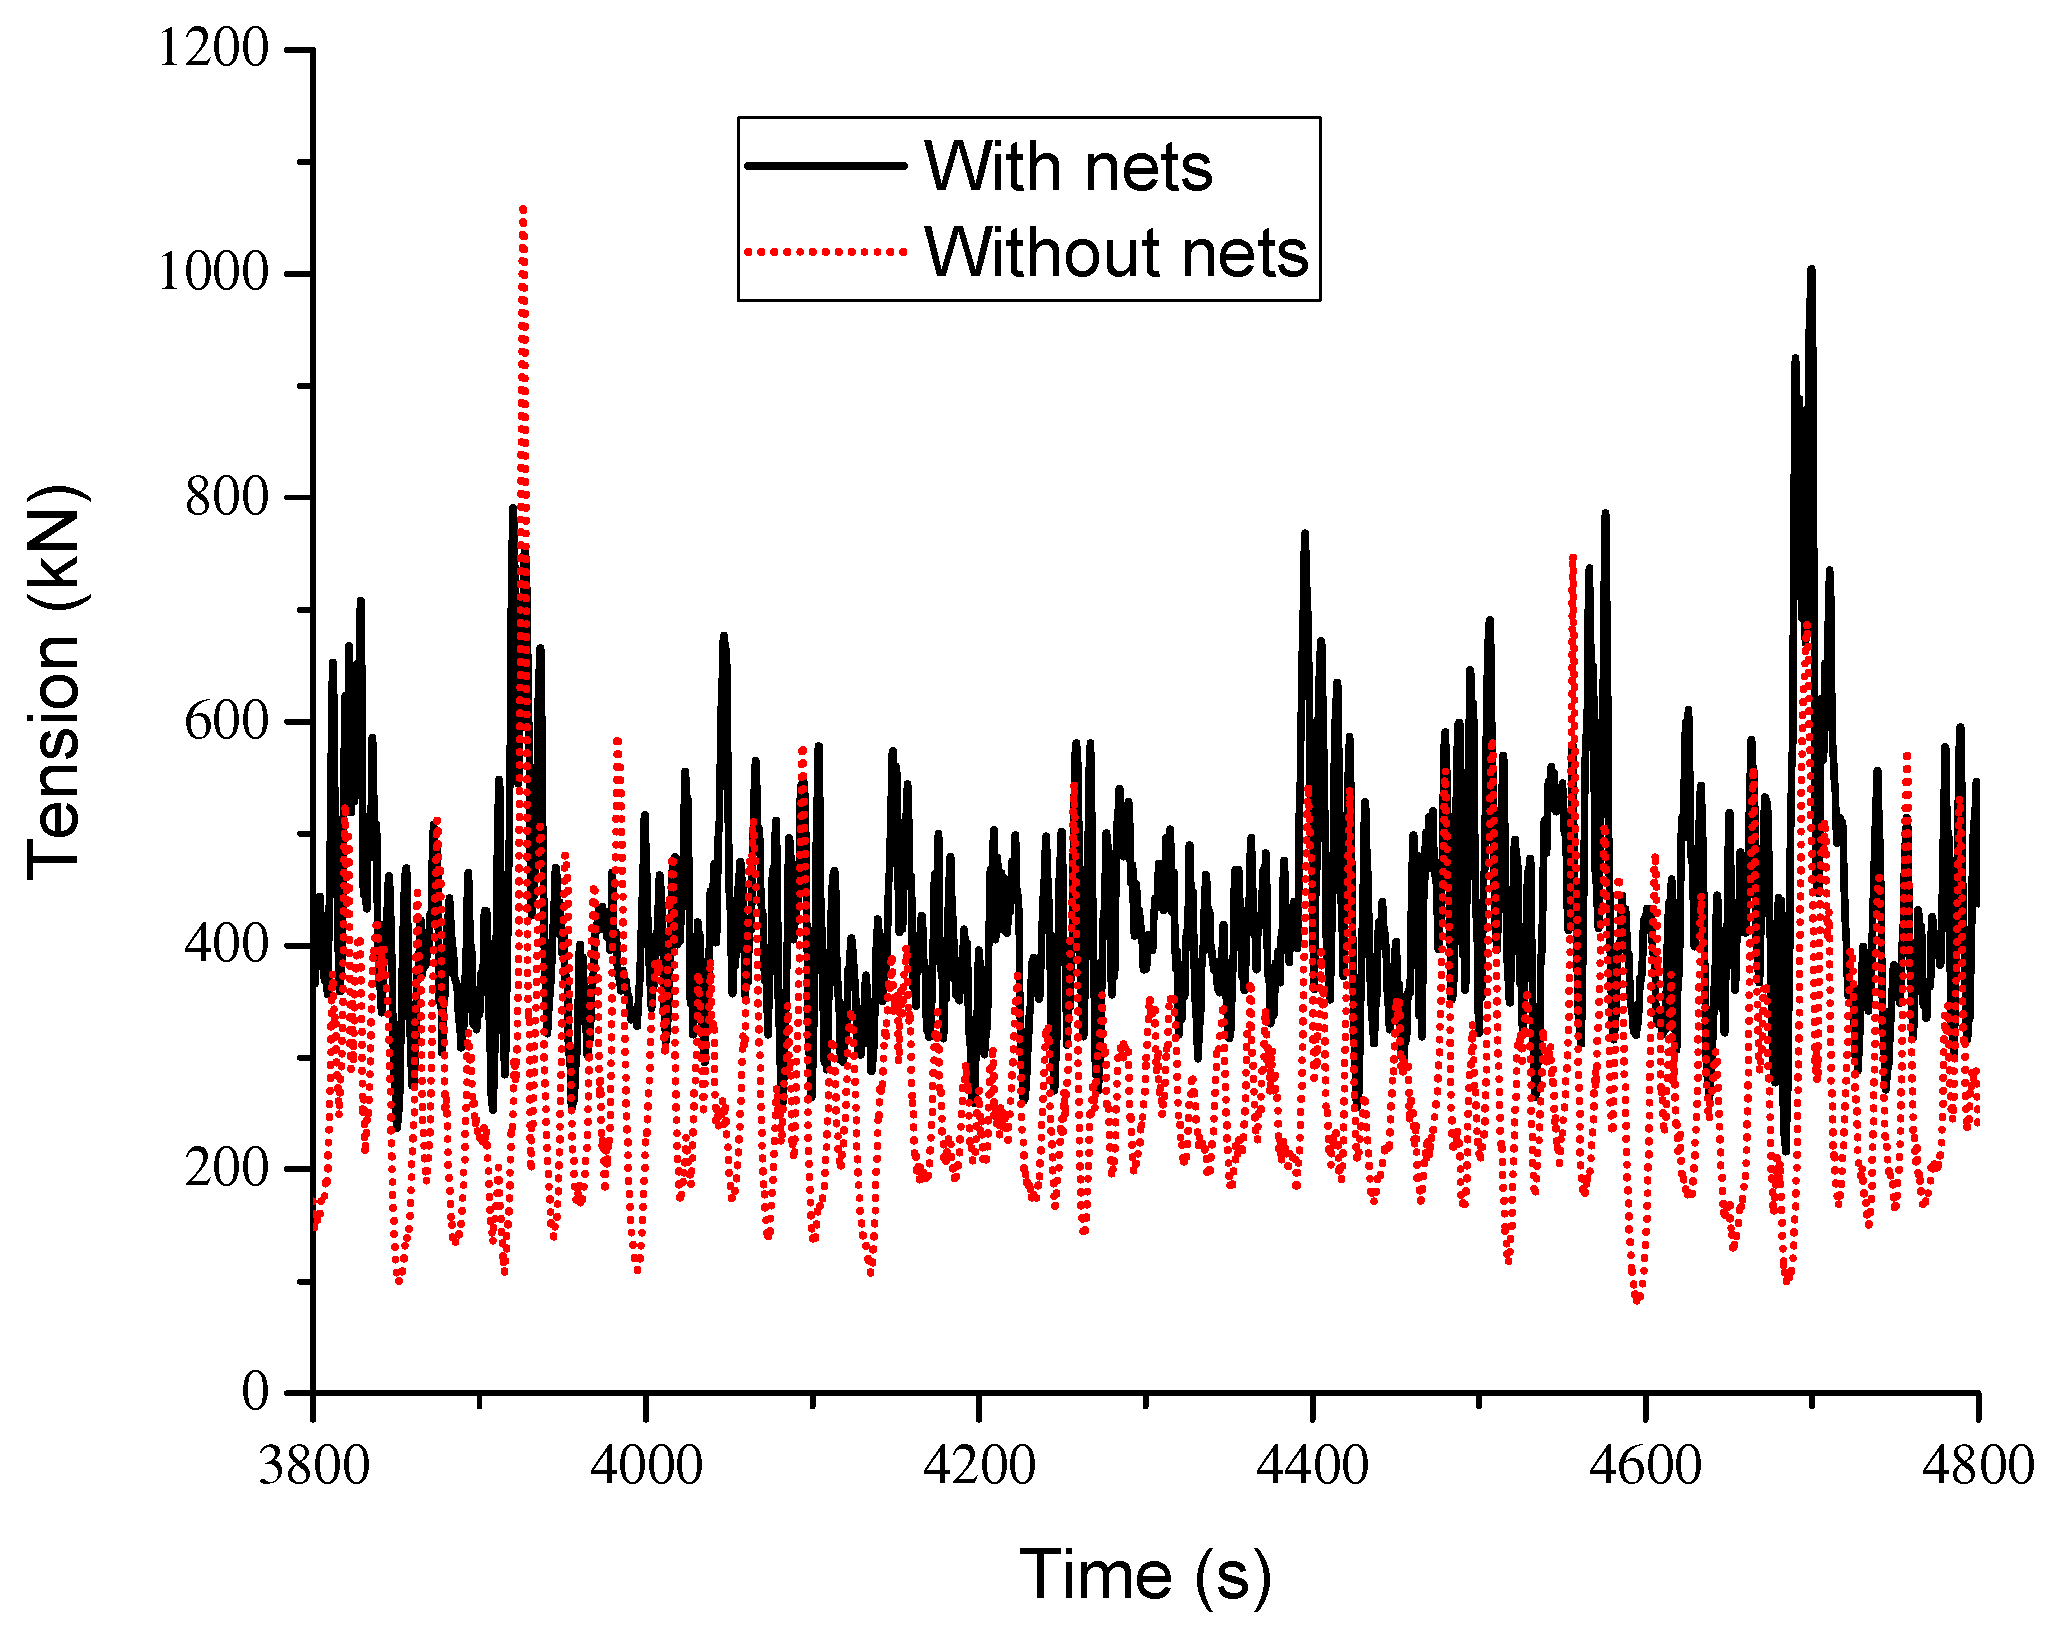
| LC3 | Tension of line 1 with nets (kN) | 425 | 89 | 1004 | 204 |
| LC3 | Tension of line 1 without nets (kN) | 267 | 98 | 1063 | 73 |
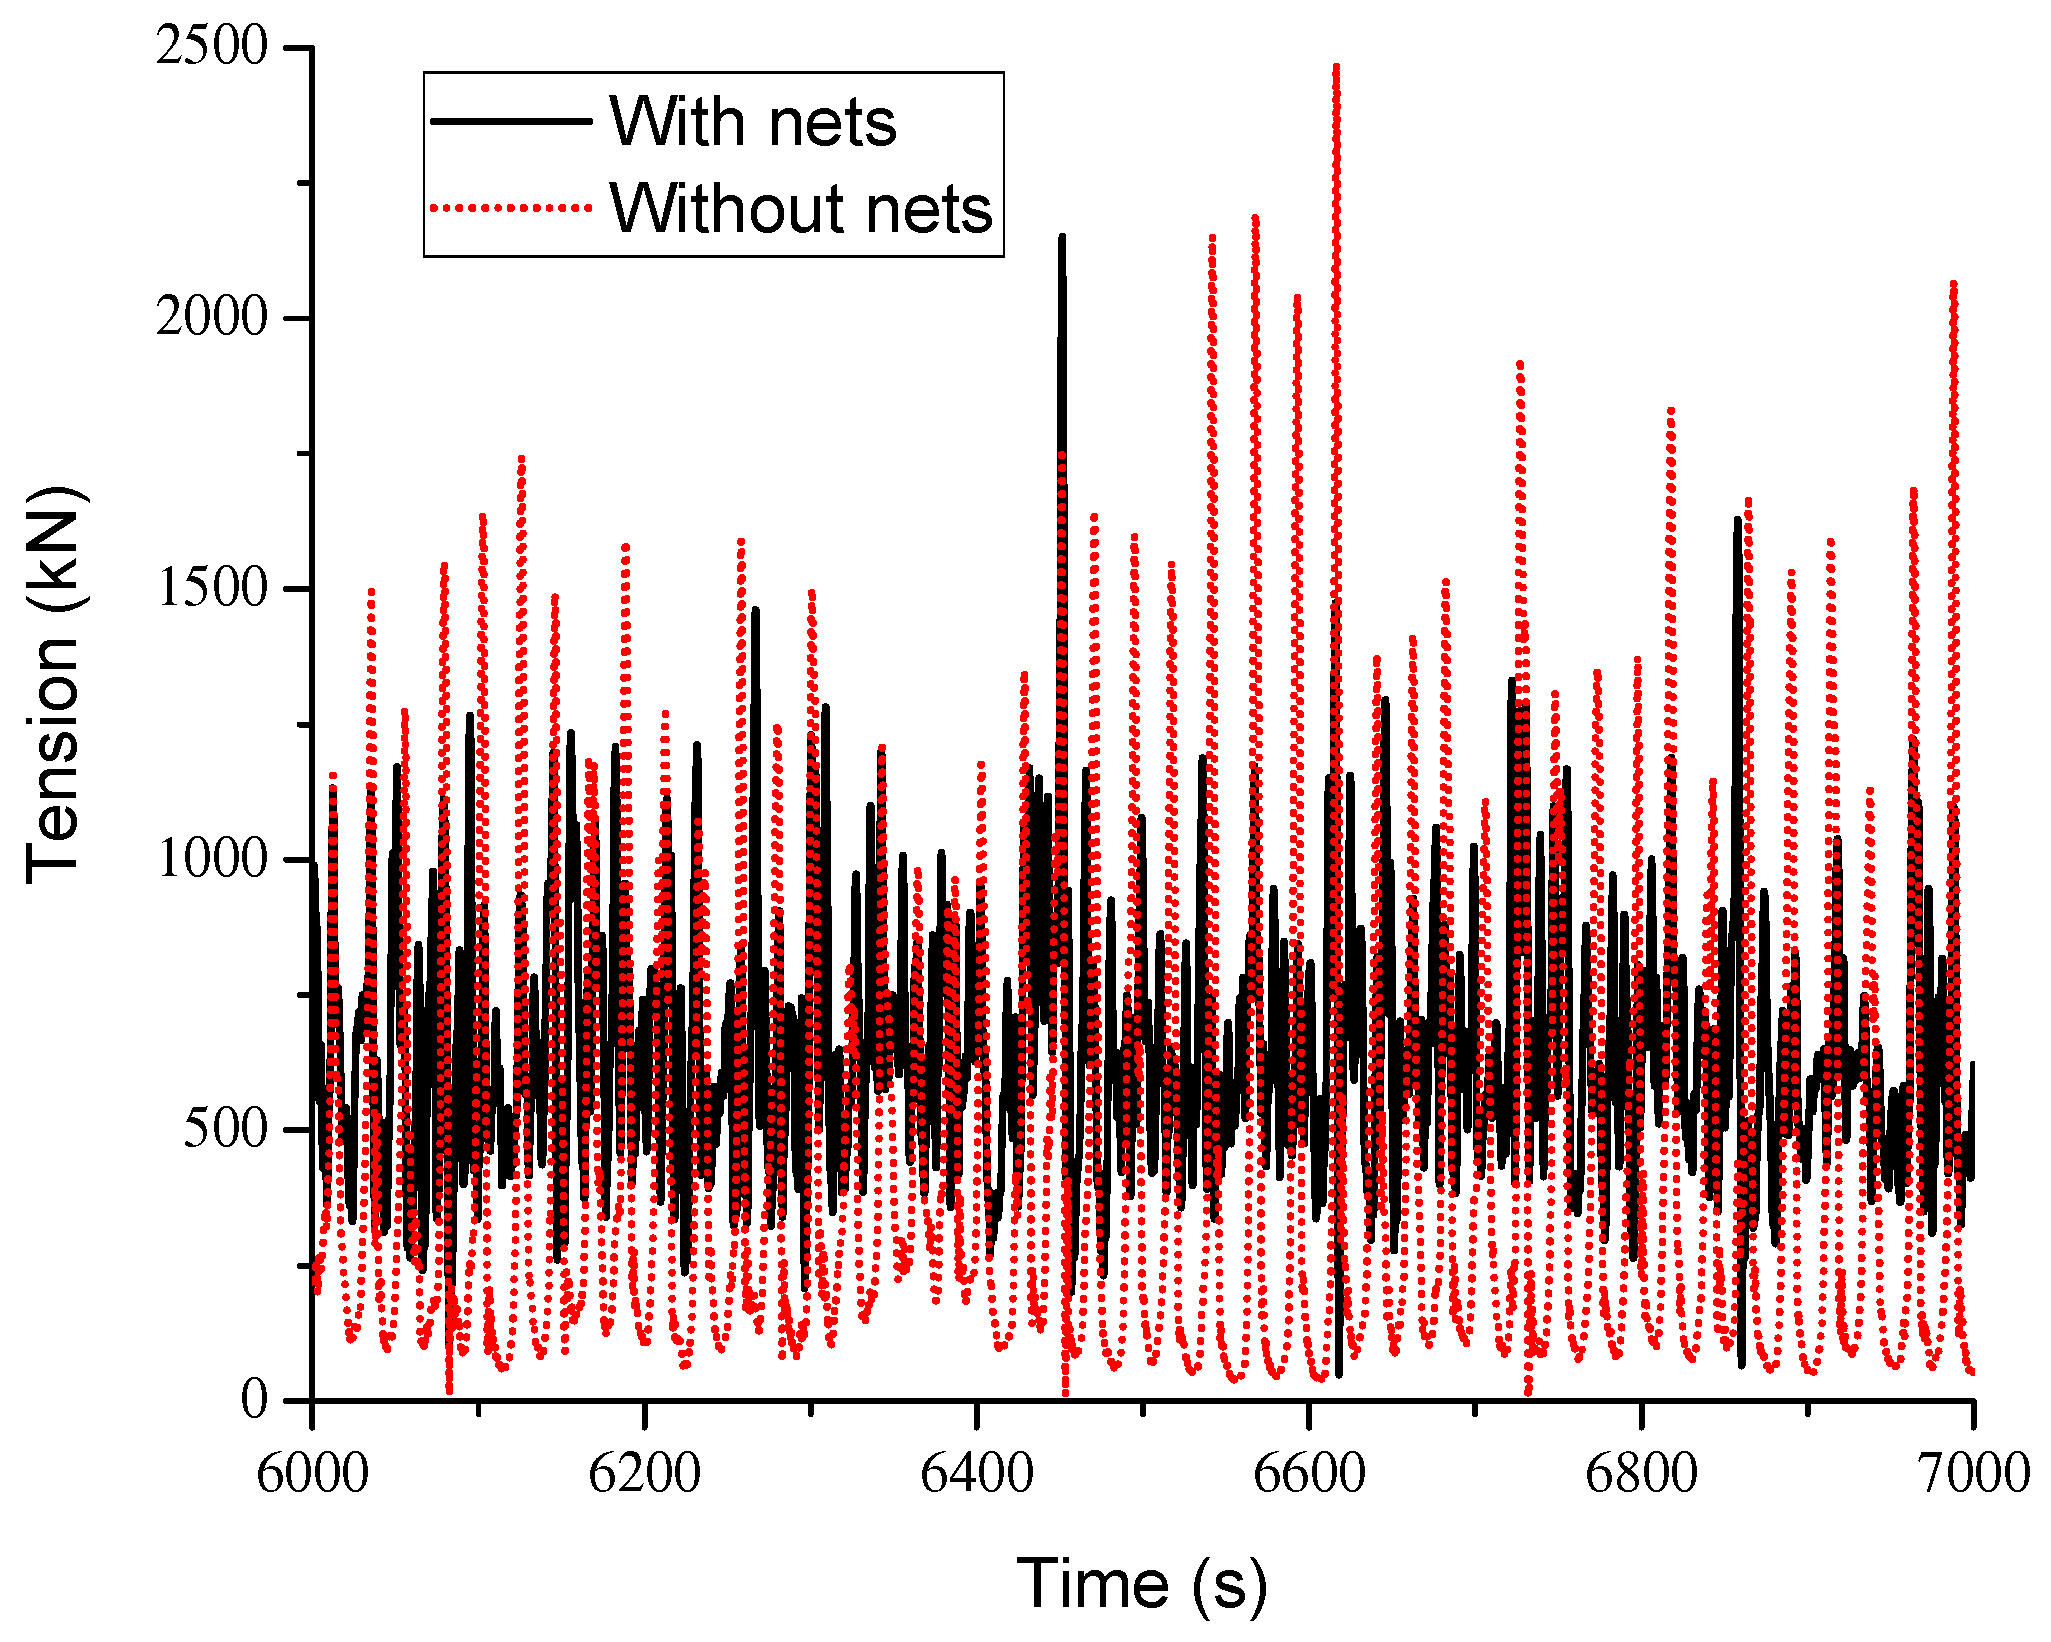
| LC5 | Tension of line 1 with nets (kN) | 652 | 244 | 2151 | 3 |
| LC5 | Tension of line 1 without nets (kN) | 420 | 321 | 2471 | 2 |
| LC1 | LC2 | LC3 | LC4 | LC5 | LC6 | LC7 | LC8 | LC9 | LC10 | ||
|---|---|---|---|---|---|---|---|---|---|---|---|
| Surge | Mean (m) | −5.20 | −4.77 | −4.26 | −2.34 | 0.00 | −5.69 | −5.23 | −4.37 | −2.07 | 0.15 |
| Std. Dev. | 0.18 | 0.16 | 0.23 | 0.29 | 0.02 | 0.18 | 0.17 | 0.25 | 0.27 | 0.06 | |
| Max (m) | −4.61 | −4.22 | −3.41 | −1.45 | 0.12 | −5.09 | −4.68 | −3.46 | −1.24 | 0.47 | |
| Min (m) | −6.24 | −5.69 | −5.26 | −3.68 | −0.10 | −6.74 | −6.19 | −5.41 | −3.32 | −0.19 | |
| Sway | Mean (m) | 0.00 | 4.18 | 5.13 | 5.98 | 6.33 | 0.32 | 4.53 | 5.56 | 6.68 | 7.07 |
| Std. Dev. | 0.00 | 0.16 | 0.16 | 0.27 | 0.38 | 0.01 | 0.16 | 0.21 | 0.31 | 0.39 | |
| Max (m) | 0.00 | 4.82 | 5.82 | 7.19 | 8.22 | 0.37 | 5.17 | 6.51 | 8.15 | 9.13 | |
| Min (m) | −0.01 | 3.61 | 4.56 | 4.90 | 4.79 | 0.29 | 3.94 | 4.88 | 5.54 | 5.59 | |
| Heave | Mean (m) | −6.03 | −6.06 | −6.09 | −6.10 | −6.12 | −6.00 | −6.02 | −6.04 | −6.06 | −6.08 |
| Std. Dev. | 0.09 | 0.09 | 0.09 | 0.15 | 0.25 | 0.09 | 0.09 | 0.09 | 0.16 | 0.24 | |
| Max (m) | −5.56 | −5.60 | −5.63 | −5.43 | −4.95 | −5.52 | −5.55 | −5.57 | −5.33 | −4.91 | |
| Min (m) | −6.44 | −6.47 | −6.48 | −6.77 | −7.15 | −6.41 | −6.42 | −6.43 | −6.77 | −7.10 | |
| Roll | Mean (°) | 0.00 | −0.05 | −0.32 | −0.62 | −0.73 | −0.08 | −0.16 | −0.54 | −0.87 | −0.96 |
| Std. Dev. | 0.00 | 0.11 | 0.27 | 0.58 | 0.96 | 0.01 | 0.12 | 0.29 | 0.61 | 0.95 | |
| Max (°) | 0.02 | 0.42 | 0.81 | 1.65 | 2.63 | −0.03 | 0.31 | 0.61 | 1.45 | 2.29 | |
| Min (°) | −0.01 | −0.55 | −1.57 | −3.51 | −6.33 | −0.14 | −0.70 | −1.85 | −4.09 | −6.56 | |
| Pitch | Mean (°) | 0.41 | 0.30 | 0.17 | 0.05 | 0.02 | 0.32 | 0.20 | 0.00 | −0.11 | −0.12 |
| Std. Dev. | 0.30 | 0.30 | 0.32 | 0.37 | 0.05 | 0.30 | 0.31 | 0.33 | 0.36 | 0.08 | |
| Max (°) | 1.98 | 1.87 | 1.80 | 1.74 | 0.20 | 1.88 | 1.78 | 1.59 | 1.45 | 0.18 | |
| Min (°) | −0.73 | −0.84 | −1.20 | −1.67 | −0.16 | −0.84 | −0.98 | −1.39 | −1.84 | −0.43 | |
| Yaw | Mean (°) | 0.00 | −6.62 | −7.01 | −3.98 | 0.00 | 0.39 | −6.49 | −6.65 | −2.57 | 1.48 |
| Std. Dev. | 0.00 | 0.32 | 0.50 | 0.59 | 0.05 | 0.02 | 0.31 | 0.54 | 0.58 | 0.11 | |
| Max (°) | 0.02 | −5.49 | −5.05 | −2.08 | 0.22 | 0.51 | −5.31 | −4.60 | −0.69 | 2.02 | |
| Min (°) | 0.00 | −7.74 | −9.04 | −6.69 | −0.19 | 0.29 | −7.61 | −8.74 | −5.36 | 1.04 |
| Parameter | Mean | Std. Dev. | Max | Min |
|---|---|---|---|---|
| Surge with nets (m) | −4.25 | 0.23 | −3.48 | −5.32 |
| Surge without nets (m) | −2.90 | 0.73 | 0.01 | −4.87 |
| Sway with nets (m) | 5.13 | 0.16 | 5.99 | 4.53 |
| Sway without nets (m) | 4.84 | 0.50 | 6.13 | 2.88 |
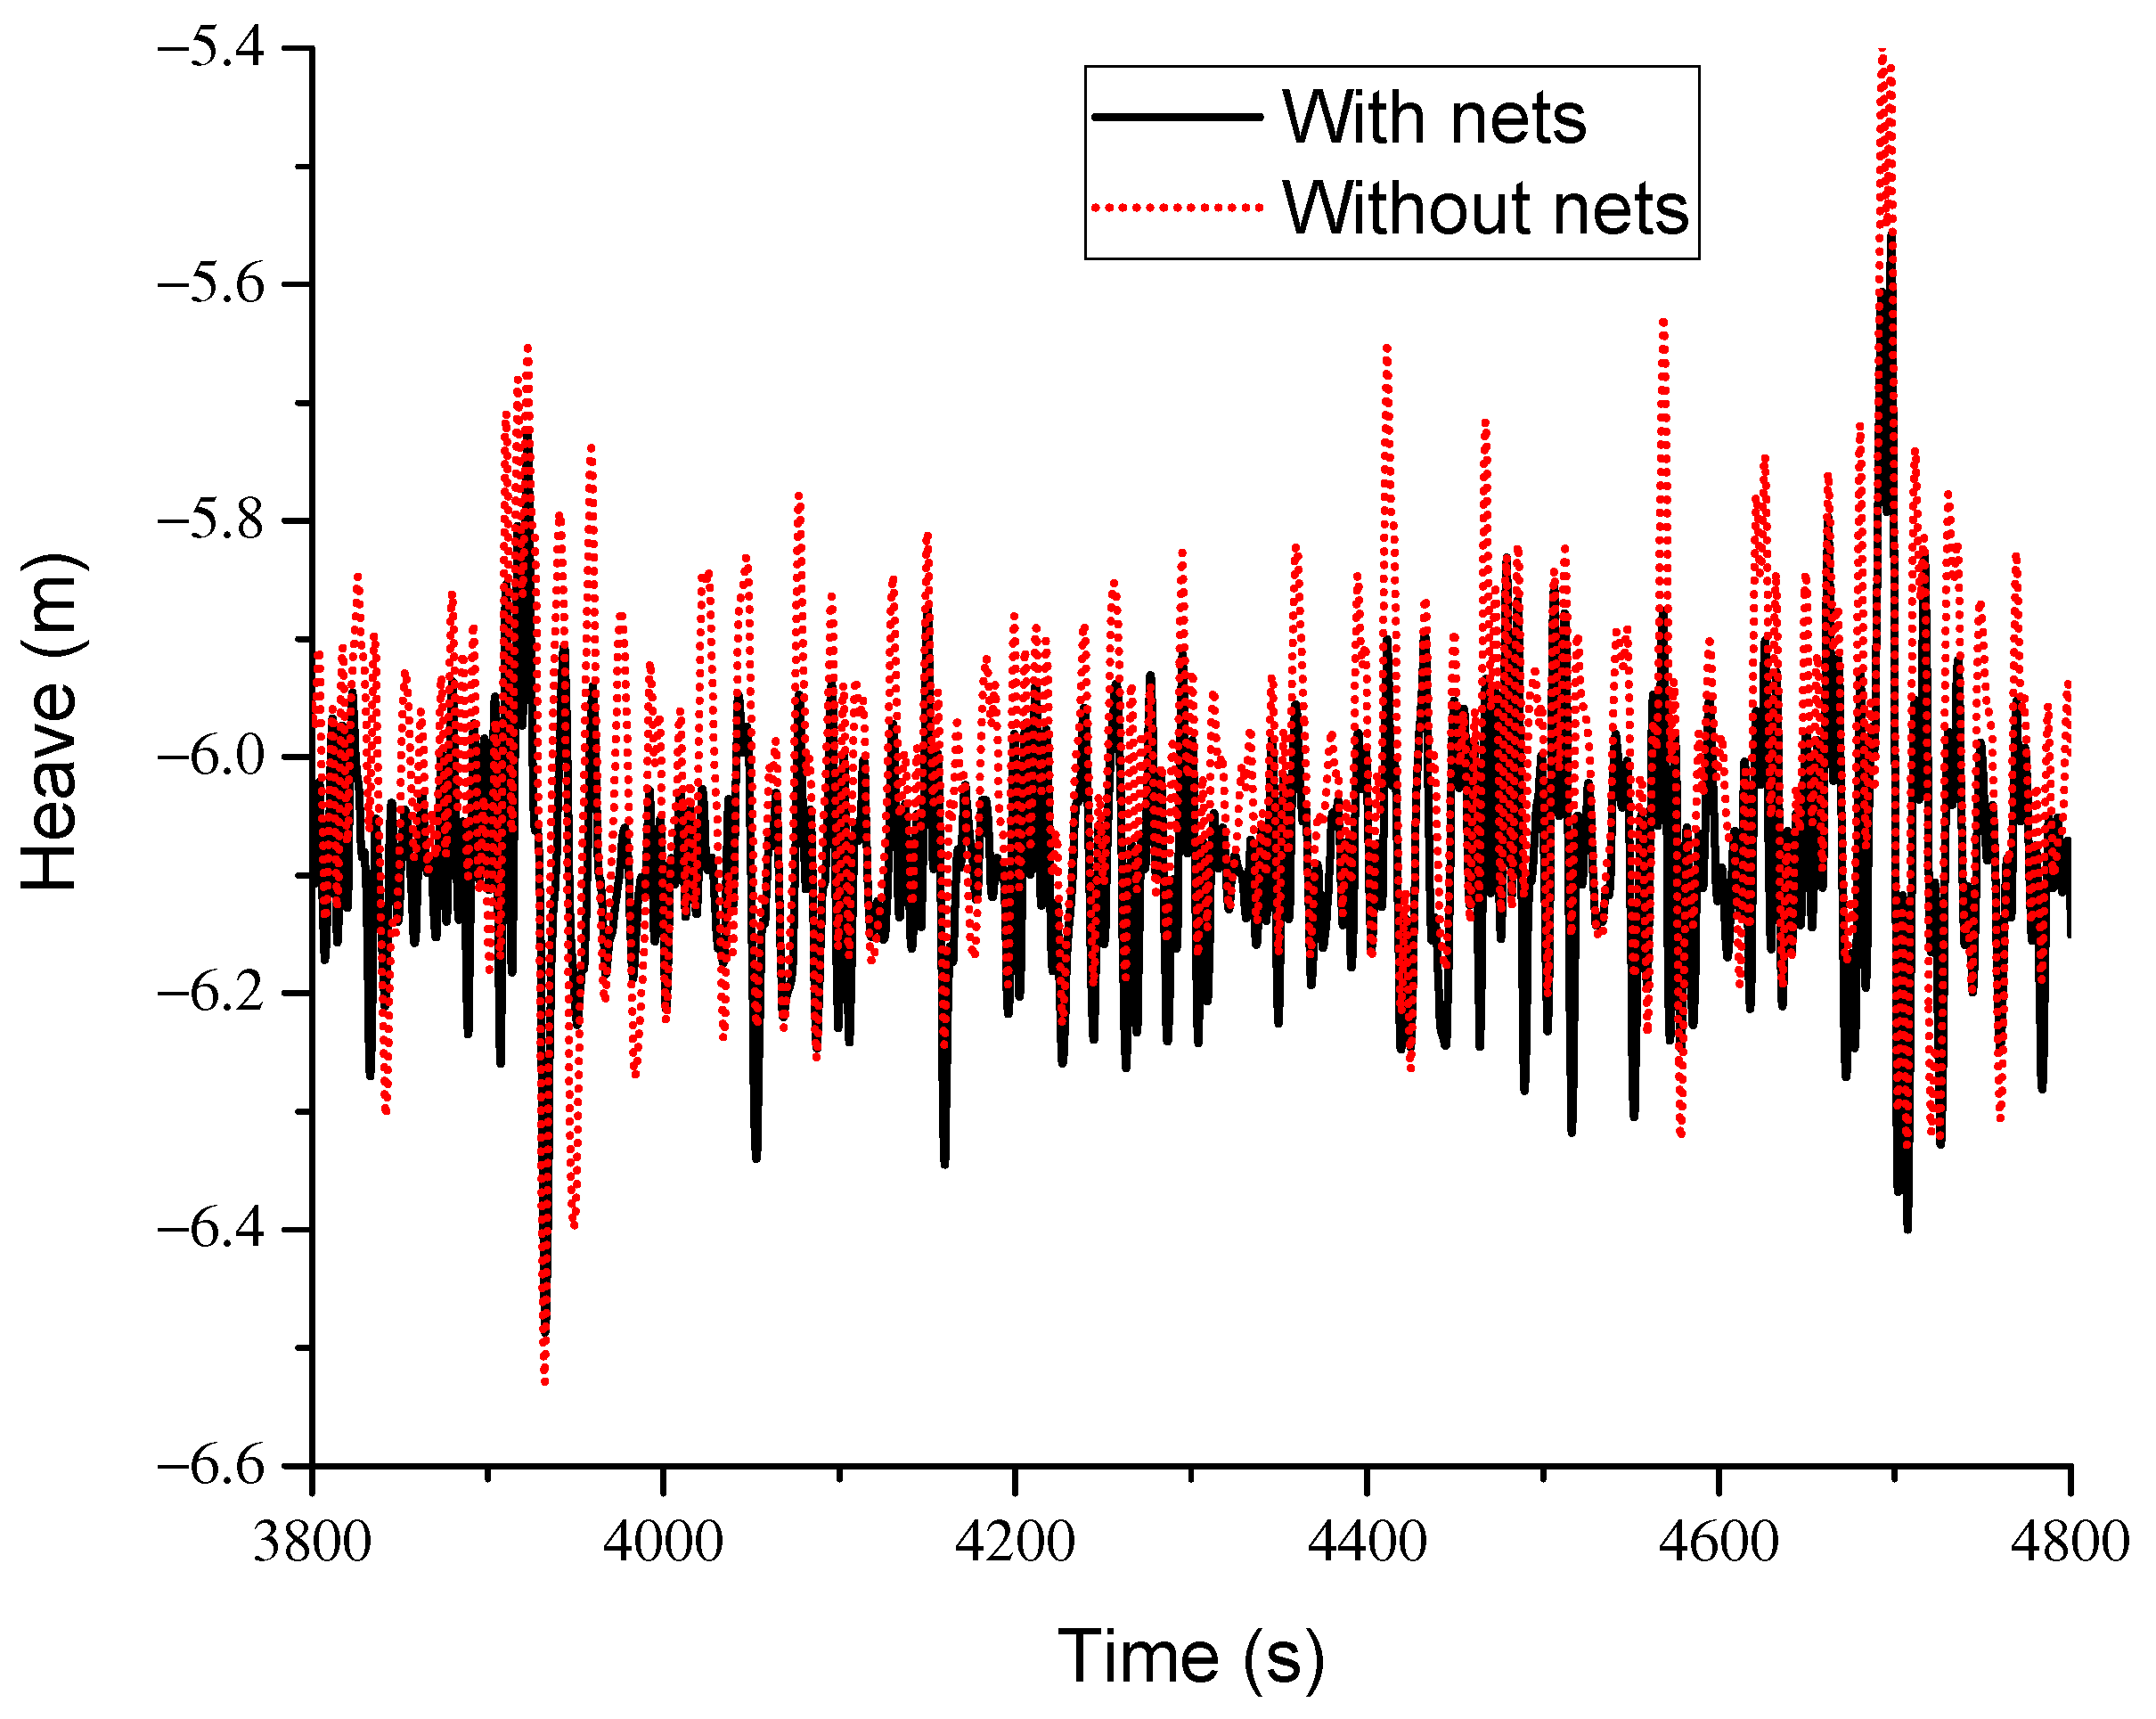
| Heave with nets (m) | −6.09 | 0.09 | −5.56 | −6.49 |
| Heave without nets (m) | −6.02 | 0.12 | −5.40 | −6.53 |
| Roll with nets (°) | −0.32 | 0.28 | 0.78 | −1.87 |
| Roll without nets (°) | −0.11 | 0.33 | 1.35 | −1.67 |
| Pitch with nets (°) | 0.17 | 0.32 | 1.62 | −1.32 |
| Pitch without nets (°) | 0.11 | 0.38 | 2.08 | −1.63 |
| Yaw with nets (°) | −7.00 | 0.50 | −4.68 | −9.17 |
| Yaw without nets (°) | −4.62 | 1.49 | 1.45 | −8.65 |
Disclaimer/Publisher’s Note: The statements, opinions and data contained in all publications are solely those of the individual author(s) and contributor(s) and not of MDPI and/or the editor(s). MDPI and/or the editor(s) disclaim responsibility for any injury to people or property resulting from any ideas, methods, instructions or products referred to in the content. |
© 2023 by the authors. Licensee MDPI, Basel, Switzerland. This article is an open access article distributed under the terms and conditions of the Creative Commons Attribution (CC BY) license (https://creativecommons.org/licenses/by/4.0/).
Share and Cite
Ding, W.-W.; Jiang, J.-Q.; Yue, W.-Z.; Li, Y.-Z.; Wang, W.-S.; Sheng, S.-W.; Chen, M. Numerical Study on Hydrodynamic Performance of a New Semi-Submersible Aquaculture Platform. Appl. Sci. 2023, 13, 12652. https://doi.org/10.3390/app132312652
Ding W-W, Jiang J-Q, Yue W-Z, Li Y-Z, Wang W-S, Sheng S-W, Chen M. Numerical Study on Hydrodynamic Performance of a New Semi-Submersible Aquaculture Platform. Applied Sciences. 2023; 13(23):12652. https://doi.org/10.3390/app132312652
Chicago/Turabian StyleDing, Wei-Wei, Jia-Qiang Jiang, Wan-Zhen Yue, Yan-Zhen Li, Wen-Sheng Wang, Song-Wei Sheng, and Min Chen. 2023. "Numerical Study on Hydrodynamic Performance of a New Semi-Submersible Aquaculture Platform" Applied Sciences 13, no. 23: 12652. https://doi.org/10.3390/app132312652
APA StyleDing, W.-W., Jiang, J.-Q., Yue, W.-Z., Li, Y.-Z., Wang, W.-S., Sheng, S.-W., & Chen, M. (2023). Numerical Study on Hydrodynamic Performance of a New Semi-Submersible Aquaculture Platform. Applied Sciences, 13(23), 12652. https://doi.org/10.3390/app132312652