Article

Numerical Study on Hydrodynamic Performance of a New Semi-Submersible Aquaculture Platform

1
Guangzhou Institute of Energy Conversion, Chinese Academy of Sciences, Guangzhou 510640, China
2
Innovation Academy of South China Sea Ecology and Environmental Engineering, Chinese Academy of Sciences, Guangzhou 510301, China
3
Southern Marine Science and Engineering Guangdong Laboratory (Guangzhou), Guangzhou 511458, China
4
Key Laboratory of Renewable Energy, Chinese Academy of Sciences, Guangzhou 510640, China
*
Author to whom correspondence should be addressed.
Appl. Sci. 2023, 13(23), 12652; https://doi.org/10.3390/app132312652
Submission received: 28 September 2022 / Revised: 25 October 2023 / Accepted: 8 November 2023 / Published: 24 November 2023

Abstract

:
To address the limitations of traditional aquaculture cages, such as poor performance in offshore environments, challenges in energy supply, and the inability to integrate modern farming facilities, a new semi-submersible aquaculture platform has been developed and put into operation. The hydrodynamic performance of the platform is analyzed using a fully coupled numerical model. The numerical model incorporates the main structure of the platform, the net system, and the mooring system, and is based on the linear potential flow theory and the Morison equation. The natural period of the platform is found to be far away from the common wave period. The mooring system for the platform in a specific sea area is proven to be safe. The net system significantly affects the hydrodynamic performance and alleviates the dynamic response of the platform. This study provides valuable insights for researchers and engineers in the design and optimization of this type of semi-submersible aquaculture platform in the future.

1. Introduction

As the global population and economy continue to grow, human demand for aquaculture products increases rapidly, and natural fishery resources decline drastically. Aquaculture farms play an increasingly important role in avoiding overfishing of aquatic products. However, aquaculture farms in inshore and harbor areas are facing limited development and receiving increased criticism due to the lack of production sites and the adverse impact on local ecosystems [1]. In contrast, moving aquaculture farms to the offshore seas is a popular and inevitable trend due to the broader development space, better water quality, and stronger environmental purification capacity in more exposed sea regions [2]. Nevertheless, aquaculture facilities in open seas will endure much more severe environmental conditions. The hydrodynamic performance of aquaculture facilities is a crucial factor that affects their stability, safety, and economy. Evaluating the hydrodynamic performance of these structures has important theoretical and practical significance for their design, optimization, and management. Therefore, the design and development of aquaculture facilities with excellent hydrodynamic performance can significantly support the advancement of offshore aquaculture technology.
Surface floating gravity-type cages have been widely used in fish farming in the past decades due to their large breeding capacity and simple daily maintenance compared with other types of cages. Researchers have widely investigated the hydrodynamic characteristics of this kind of cage and its components, such as the floating collar, the net system, and the mooring system, through numerical simulations and physical models. Fredriksson et al. [3] studied the dynamic characteristics of a central spar fish cage deployed in the Gulf of Marine using physical and numerical models. Lader and Enerhaug [4] investigated the dependency between the forces and the geometry of a flexible circular net cage with different sizes of bottom weights in a flume tank by measuring the global forces and net deformation. Zhao et al. [5] developed a numerical model to analyze the motion response and the mooring forces of a gravity cage in a combined wave-current flow and found that the numerical results agreed well with the experimental data. Huang et al. [6] utilized a previously validated numerical model to examine the effects of waves and currents on the tension of mooring lines and volume reduction of two types of gravity net cages: a double-cage system and a single-cage system. Dong et al. [7] proposed a numerical model based on statistical approaches and Fourier transforms to analyze the motion response and mooring line tension of gravity cages in irregular waves. Li et al. [8] studied the floater motion and the net volume reduction of a gravity net cage in waves and currents using the finite element method and the buoyancy distribution method. Li et al. [9] investigated the nonlinear hydroelastic response of a deep-water gravity fish cage in irregular waves using the finite element method and the modal superposition method. Shainee et al. [10] proposed a self-submersible single-point-mooring cage concept and investigated its submergence characteristics in regular waves with following currents using the numerical model Aqua-FE. Shainee et al. [11] further investigated its submergence characteristics in random waves. Cifuentes and Kim [12] studied the hydrodynamic response of a cage system with a flexible surface collar, net, ballast, and mooring lines in regular/irregular waves and currents using a Morison-force model and validated it with experimental data. Shen et al. [13] investigated the mooring loads of a realistic aquaculture fish farm system with a floating collar, a flexible net cage, and a sinker tube using a reliable numerical tool and validated it with experimental data. Liu et al. [14] numerically studied the mooring forces of a fish cage array with six gravity cages in currents and waves using the finite element method. Liu et al. [15] introduced a new net cage with a shielding device and analyzed its hydrodynamic characteristics using a numerical method based on computational fluid dynamics.
The gravity cages with floating collars and flexible nets mentioned above suffer from large cage deformation at offshore sites with high sea states. It is urgent to develop aquaculture facilities in typical offshore environments to overcome this. Various innovative concepts of aquaculture facilities have been developed recently by combining technologies from the offshore industry with fish farming. Correspondingly, researchers have conducted a series of numerical and physical experimental studies to evaluate and enhance the hydrodynamic performance of these structures.
Ocean Farming AS, a subsidiary of the SalMar Group, developed the world’s first offshore fish farm, Ocean Farm 1, which is dodecagonal in shape. It has a height of 68 m, a diameter of 110 m, and a volume of 250,000 m3 [16]. Dou [17] conducted hydrodynamic analysis of Ocean Farm 1 in both frequency and time domains using the HydroD V4.10 and SIMA V4.1 software packages, respectively. Jin et al. [18] modeled Ocean Farm 1 using SIMO/RIFLEX/SIMA V4.1 software packages and investigated its motion responses under different combined conditions of irregular waves and currents. Yu et al. [19] assessed the structural strength of Ocean Farm 1 under supply vessel collisions using the nonlinear finite element program USFOS. Zhao et al. [20] presented a semi-submersible offshore fish farm similar to Ocean Farm 1 and conducted a series of physical model experiments to investigate its motion response and mooring line tension. Liu et al. [21] analyzed the hydrodynamic characteristics of an aquaculture platform similar to Ocean Farm 1 in uniform currents using the porous media combined with a rigid wall based on the SST k-omega turbulence model.
NSK Ship Design for a Norwegian fishing company designed a novel vessel-shaped fish farm, Havfarm 1, which consists of a vessel-shaped floater, five flexible cages under the floater, and a single point mooring system, with a total length of 385 m [22]. Li et al. [23,24] analyzed the global responses of Havfarm 1 and the tensions in the mooring lines under various wave and current conditions using the coupled SIMO-RIFLEX V4.1 computer program. Li et al. [25] proposed an integrated method to predict the misalignment angle between the heading of the vessel-shaped offshore fish farm and the incoming currents under combined waves and currents, to facilitate the design of the dynamic positioning system used for the fish farm. Li et al. [26] proposed an optimization methodology for mooring system design and designed the mooring system of the vessel-shaped offshore fish farm accordingly. Ma et al. [27] presented a single-point moored vessel-shaped floating aquaculture platform with two different steel floating frames, nets, and weight system pipes and analyzed its motion, mooring force, and net reaction force in regular waves using the boundary element method and the lumped mass method. Ma et al. [28] depicted a hinged multi-body floating aquaculture platform with square floating frames, nets, and weight system pipes and examined the effects of the hinge joint rotational stiffness on its dynamic responses under different wave steepnesses using the boundary element method and the lumped mass method.
Ocean University of China and Hubei Ocean Engineering Equipment Research Institute co-designed China’s first fully submersible deep-sea fish farm, ShenLan 1. The farm features a rigid frame with eight vertical columns, two cylindrical liquid-gas tanks, and ultra-high-strength polyethylene square nets. The full-scale diameter and height are 60.44 m and 34.45 m, respectively [29]. Wang et al. [30,31] used the open-source CFD toolbox REEF3D to analyze the effects of the wave parameters and structural variations on the response motions and mooring forces of ShenLan 1. Miao et al. [32] presented a semi-submersible offshore fish farm similar to ShenLan 1 with a pontoon, main frame system, net system, and upper building and developed a hybrid method that combined the direct time domain and indirect time domain to analyze the motion responses of the cage. Physical model tests in the wave basin verified the numerical model.
South China Sea Fisheries Research Institute and Zhuhai Desai Marine Fishery Technology Co., Ltd. (Zhuhai, China) co-designed a semi-submersible fish farm named Dehai Farm 1. It consists of the truss-work system and ballast tanks with dimensions of 91.3 m in length, 27.6 m in width, and 10.3 m in height. Huang et al. [33] investigated the mooring forces and motion response of Dehai Farm 1 in waves and currents through a series of physical model tests. Chu and Wang [34] presented a novel offshore fish farm consisting of a deep draught floating spar and an octagonal net steel cage (named COSPAR) and performed the hydrodynamic response analysis of free-floating COSPAR and the coupled analysis involving COSPAR and mooring lines using the software Design Modeler R2012 and Aqwa R2017 owned by Ansys, Inc. (Canonsburg, PA, USA) [35,36].
Guangzhou Institute of Energy Conversion (GIEC) of the Chinese Academy of Sciences designed a semi-submersible aquaculture platform by combining Sharp Eagle WEC technology and offshore aqua-culture. This innovative design led to the successful deployment of the world’s first semi-submersible wave energy aquaculture platform named “Penghu” (Figure 1) in Zhuhai, China, in 2019 [37]. The invention belongs to the team of the authors of this paper. By utilizing this platform, the challenges encountered by traditional aquaculture cages in offshore environments, including poor performance, limited energy supply, and inability to accommodate modern farming equipment, can be effectively addressed.
GIEC continues to develop a series of semi-submersible aquaculture platforms to further promote industrial applications. Systematic numerical or experimental analyses are essential for the design of these offshore structures to assess their performance in complicated environmental conditions. However, open publications on the detailed hydrodynamic and structural analysis of these concepts are rare, to the authors’ knowledge.
In this paper, we aim to fill the gap in the understanding of the hydrodynamic performance of a semi-submersible aquaculture platform, which is newly designed by GIEC and put into operation. While Yue et al. [38] developed a numerical model to analyze the structural response of this type of platform, their model did not consider the mooring system and nets and only evaluated the platform under pure wave action. In contrast, our study proposes a comprehensive numerical model that takes into account the semi-submersible main structure, net system, and mooring system and further analyzes the mooring line tension and motion response of the platform under wave, wind, and current conditions.
The rest of this paper is organized as follows: Section 2 provides a description of the new aquaculture platform. Section 3 presents a coupled numerical model of the platform under the combined action of waves, winds, and currents. Section 4 validates the numerical results and analyzes the hydrodynamic performance of the platform in regular waves and the dynamic responses of the platform with and without nets in waves, winds, and currents. Section 5 summarizes the main conclusions and the prospects for future study.

2. Description of the Platform

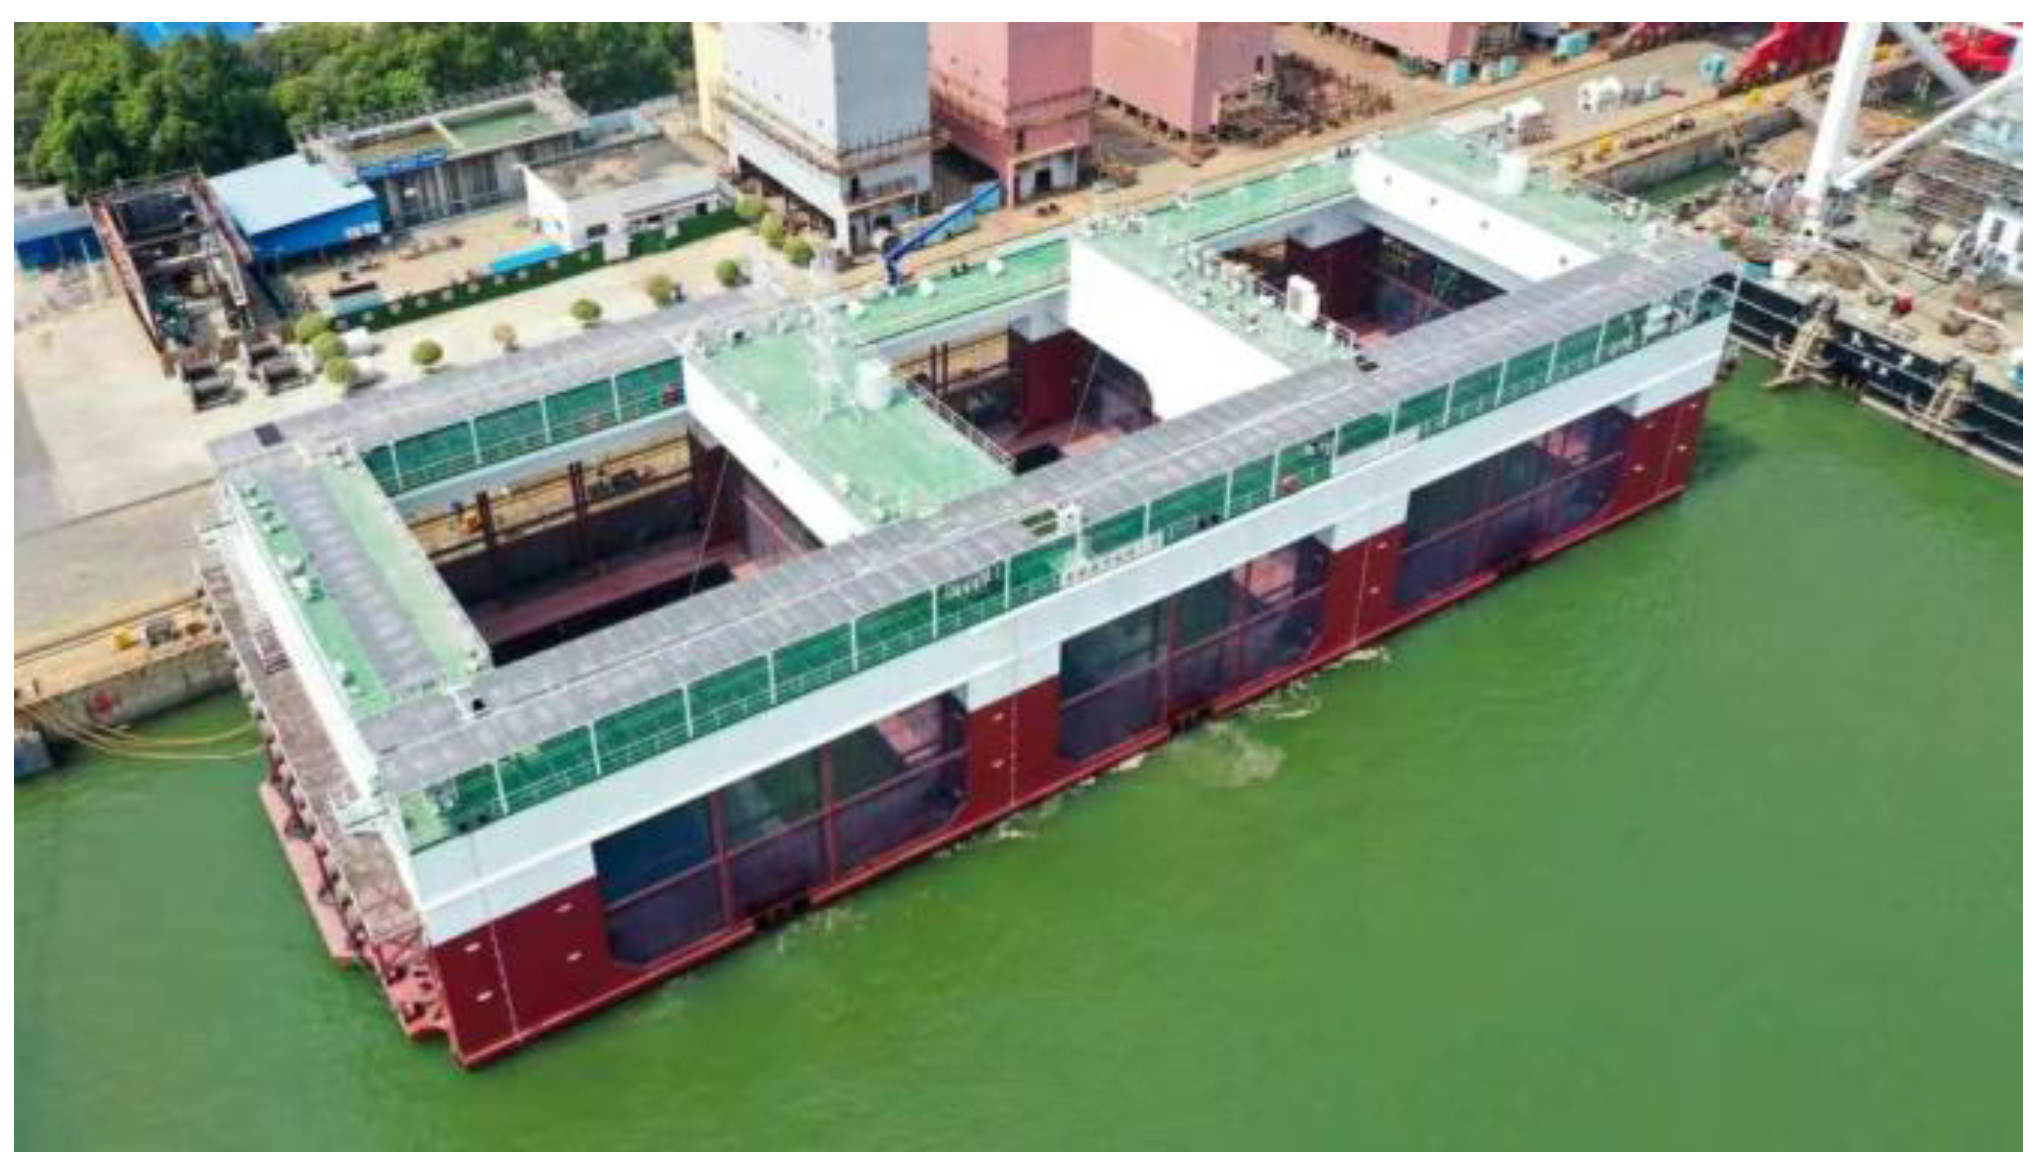
Figure 2 displays the newly designed semi-submersible aquaculture platform, named Pu Sheng 1, created by GIEC and constructed by Guangzhou Shipyard International Co., Ltd. (Guangzhou, China) for Hainan Pusheng Marine Science and Technology Development Co., Ltd. (Ledong, China) This platform has earned a classification certificate from the China Classification Society (CCS), making it the first marine breeding equipment in South China to do so.
The platform is equipped with seawater desalination and sewage treatment plants, storage space, restaurants, and other facilities. These additions transform it into a modern marine industrial integration center that encompasses green intelligent equipment, aquaculture, fishing, sightseeing, and tourism. An intelligent fishery breeding system can be integrated into the platform to enable modern fishery production functions, including automatic feeding, fish swarm monitoring, and water quality monitoring. Furthermore, the platform is equipped with photovoltaic power generation equipment, utilizing clean energy and ensuring its green and environmentally friendly operation. With a generation and storage capacity of 100 kilowatts, the platform achieves energy self-sufficiency [39]. Shape-Eagle wave energy converters are not installed on Pu Sheng 1 due to economic considerations. A more modern and luxurious agriculture and fishing tourism platform named Mintou No.1 with Shape-Eagle wave energy converters had a soft opening in 2023 [40].

2.1. Main Parameters of the Platform

The platform has a total length of 86 m, a width of 30 m, and a height of 18 m. It consists of a steel semi-submersible main structure and soft nets that form a breeding water volume of approximately 30,000 cubic meters. Both the operational and survival drafts are 10 m. Table 1 lists the detailed parameters of the platform.
In the hydrodynamic analysis of the platform, a three-dimensional Cartesian coordinate system is adopted, with its origin located on the mean water surface and intersecting with the middle longitudinal and transverse sections. The x-axis points forward to the bow of the platform, the y-axis points forward to the port side of the platform, and the z-axis points upward vertically. The mass properties of the platform are presented in Table 2.
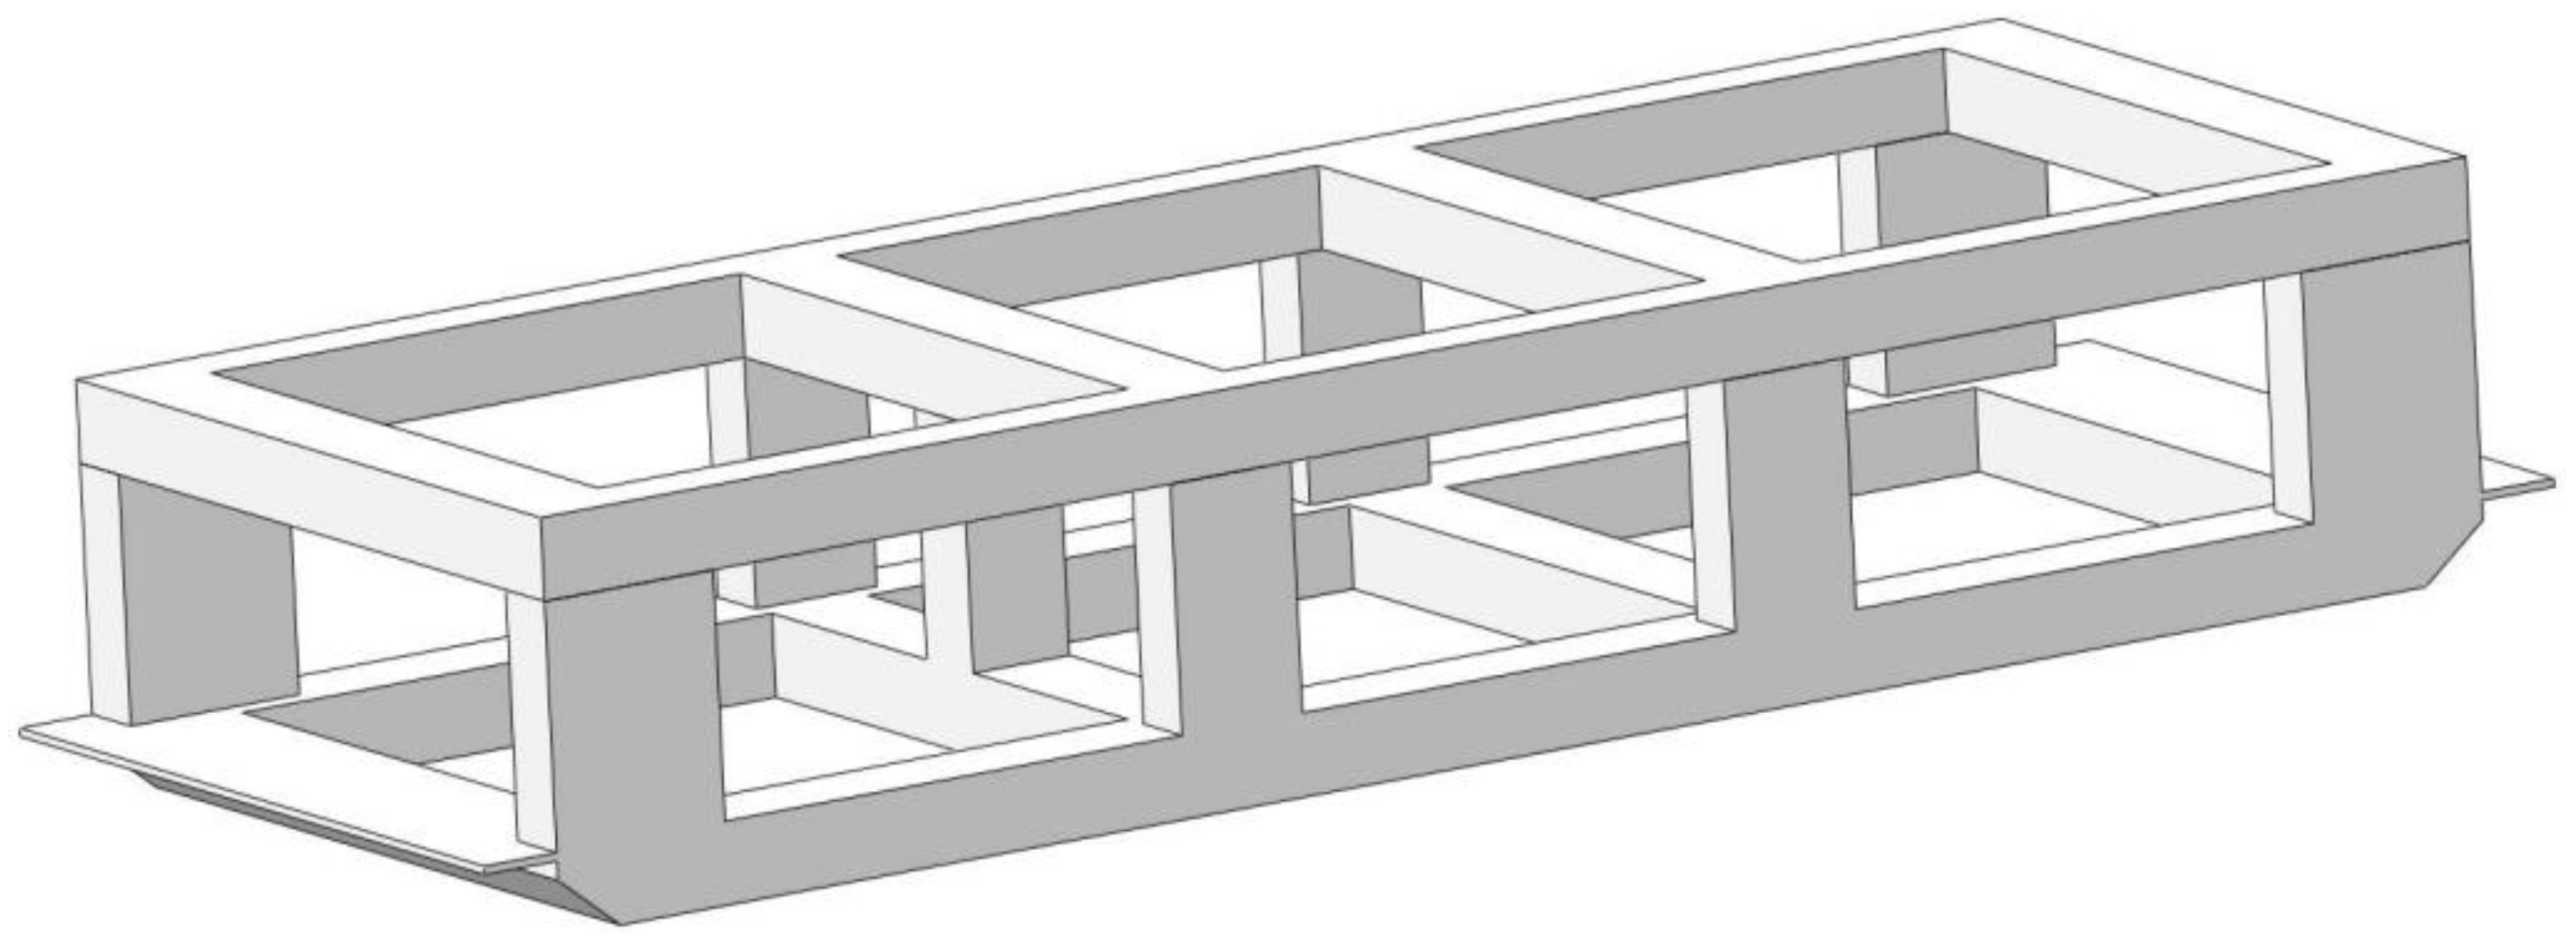
The hydrodynamic model of the platform is depicted in Figure 3. Only the structure below the waterline is considered in the hydrodynamic calculation.

2.2. Environment Parameters

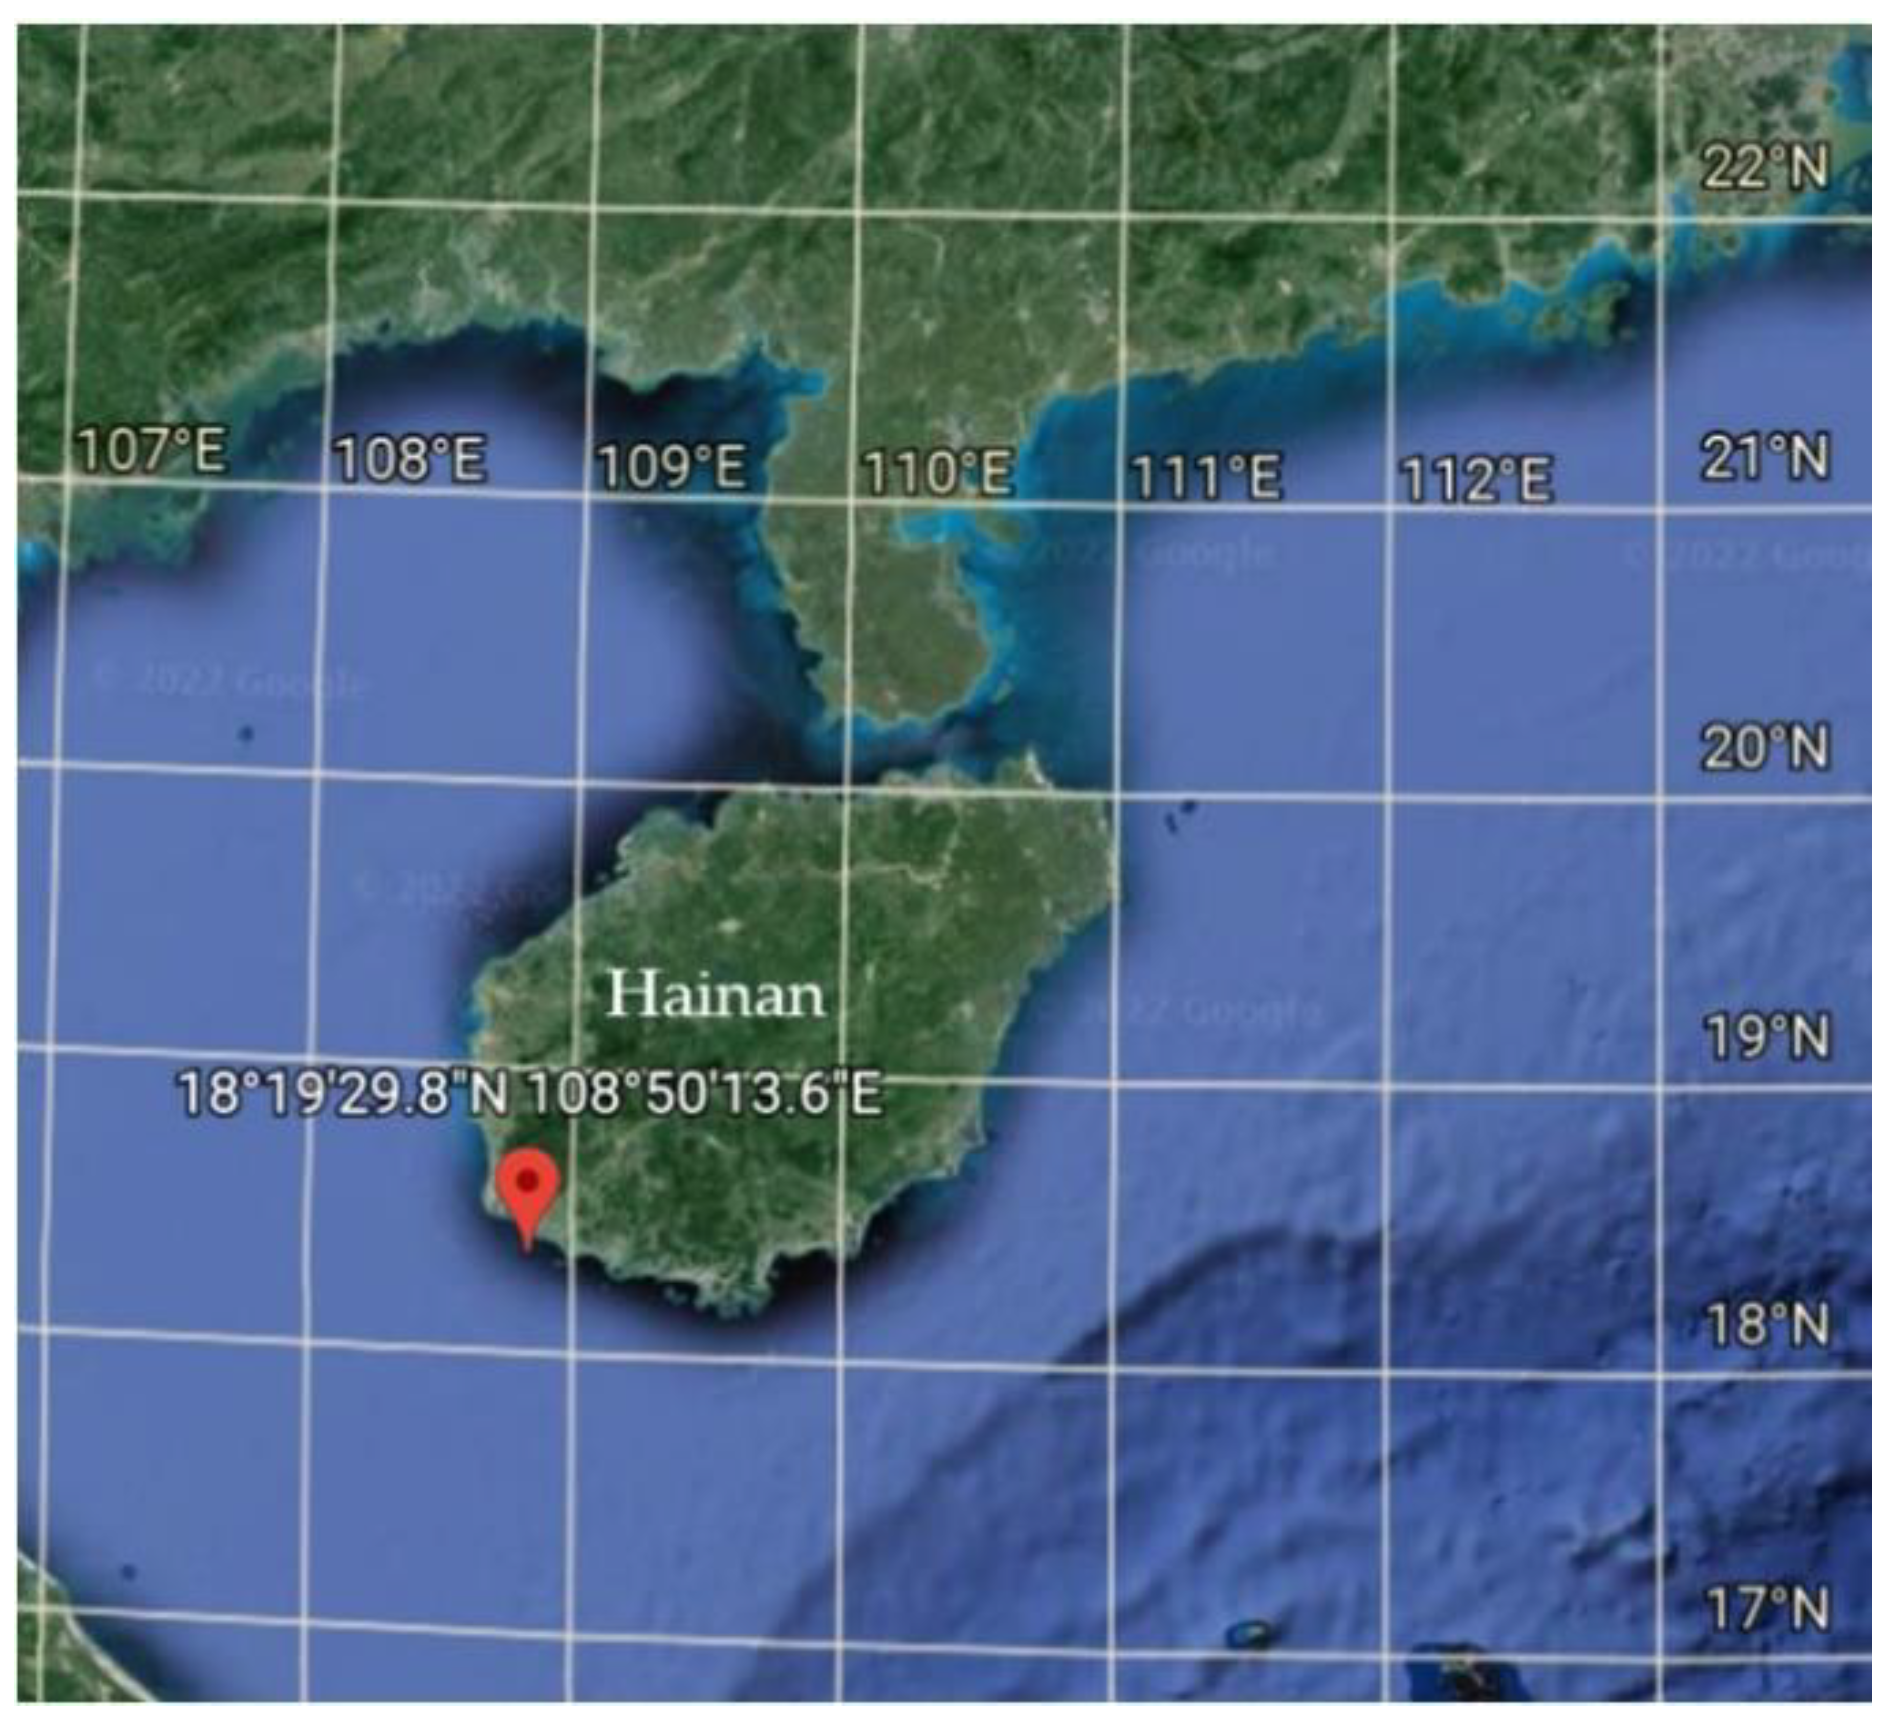
The platform has been in operation at the Longqi Bay National Intelligent Marine Ranch, located in Ledong County in southwestern Hainan since 24 March 2022 (see Figure 4).
As shown in Figure 5, the longitude and latitude coordinates of the platform’s location are 18°19′29.839″ N and 108°50′13.633″ E, respectively.
Table 3 presents the environmental conditions with a return period of 20 years at the project site. The site has a mean water depth of 20 m. The wave is expressed by the JONSWAP spectrum. The wind speed is referenced at 10 m above the mean sea level, and the variation of the current velocity with water depth is neglected. The wind is expressed by the NPD spectrum, and the current is assumed to be constant.

3. Numerical Model

The motion equation for the time domain coupling analysis of the platform is expressed as follows:
[ M + μ ] x ¨ ( t ) + 0 t h ( t τ ) x ˙ ( τ ) d τ + B x ˙ ( t ) + C x ( t ) = F W a v e ( t ) + F M o o r i n g ( t ) + F C u r r e n t ( t ) + F W i n d ( t ) + F N e t ( t )
where x ¨ , x ˙ , and x represent the acceleration, velocity, and displacement of the platform, respectively; t is the time; M is the mass matrix; μ is the infinite-frequency added-mass matrix; h ( t τ ) is the wave-radiation-retardation kernel matrix; B is the additional damping matrix; C is the hydrostatic stiffness matrix; F W a v e is the total wave excitation force on the platform; F M o o r i n g is the mooring system force on the platform; F C u r r e n t is the current force on the platform; F W i n d is the wind force on the platform; and F N e t is the net system force on the platform.

3.1. Main Structure

3.1.1. Potential Flow Model

For the main structure of the platform, the linear wave theory is adopted. The fluid is assumed to be inviscid and the motion is irrotational. The flow field’s total velocity potential φ consists of the incident wave velocity potential φ i , the diffraction potential φ d , and the radiation potential φ r .
φ = φ i + φ d + φ r
The governing equations and boundary conditions are given as follows [21,28]:
Laplace equation:
2 φ = 0
Linearized free surface condition:
φ n ω 2 g φ = 0
Structure surface condition:
φ n = n j
Sea bed condition:
φ 0
Infinity condition:
lim R R ( φ R i k φ ) = 0
where n is the unit normal vector; ω is the wave frequency; g is the gravitational acceleration; and k is the wave number.
The boundary element method is used to calculate wave loads on the main structure. Based on the linearized Bernoulli equation, the distribution of hydrodynamic pressure p is calculated by:
p = ρ φ t
where ρ is the density of water with ρ = 1025 kg / m 3 .
The forces and moments of the six-degree-of-freedom can be calculated by integrating the wave pressure acting on the outer surface of the structure:
f i = S ρ φ t n i d S
The first-order equation of motion for the structure in the frequency domain can be established as follows:
( m i j + μ i j ) x ¨ j + ( λ i j + b i j ) x ˙ j + c i j x j = f i f k + f i d , i , j = 1 , 2 , , 6
where m i j is the generalized mass matrix; c i j is the generalized hydrostatic restoring stiffness; μ i j is the frequency-dependent added mass; λ i j is the frequency-dependent radiation damping; b i j is the additional damping; f i f k is the Froude-Krylov force; and f i d is the diffraction force.
This study considers only the linear additional damping resulting from the fluid viscosity. Due to the lack of relevant model test data for the platform, the additional linear damping in heave, roll, and pitch directions are assumed to be 5%, 8%, and 8% of the critical damping, respectively.
The added mass matrix, radiation damping matrix, and the first-order wave force are obtained using the three-dimensional Green function method, which is based on the wave diffraction and radiation theory. The motion response characteristics can be quantified by normalizing the response amplitude to the input amplitude. This normalization process yields the response amplitude operator (RAO). The RAOs for the motion of the structure are determined by solving the frequency domain motion Equation (10).
In addition to the first-order wave force f i f k + f i d , the structure is also subjected to the second-order wave force, which includes the mean wave drift force, difference-frequency wave force, and sum-frequency wave force. In this study, the second-order wave force is calculated by the middle-field method proposed by Chen [41].
The hydrodynamic coefficients, including the added mass, the radiation damping, the first-order wave force, and the second-order wave force, are then converted into the motion Equation (1) to conduct the time domain analysis, which integrates the main structure, mooring system, and net system.

3.1.2. Wind Force

In accordance with the rules of CCS [42], the wind force F W i n d acting on the platform should be calculated using the following formula:
F W i n d = C h C s S P
where P represents the wind pressure with P = 0.613 × 10 3 U 2 kPa and U represents the wind speed; S denotes the orthographic projection area of the wind-exposed component on the platform, which is 630 m2 along the x-axis direction (longitudinal) and 271.5 m2 along the y-axis direction (transverse) in this study; C h stands for the height coefficient and is 1 in this study, while C s represents the shape coefficient and is also 1 in this study.

3.1.3. Current Force

In accordance with the rules of CCS [42], the current force F C u r r e n t acting on the platform should be calculated using the following formula:
F C u r r e n t = 1 2 C D ρ V 2 A
where C D is the drag coefficient with C D = 1.5 in this study; V denotes the current velocity; and A stands for the projected area of the component on the plane perpendicular to the current velocity, which is 609 m2 along the x-axis direction (longitudinal) and 219 m2 along the y-axis direction (transverse) in this study.

3.2. Net System

Empirical formulas are usually employed for the rapid prediction of hydrodynamic forces on the nets to calculate the loads. The Morison equation is used to compute the hydrodynamic loads on each unit, and the loads on the nets are obtained by summing up the calculated forces on all units. The equation used for this calculation is presented below:
F N e t = ρ C M V u ˙ + 1 2 ρ C D A u u
where C M is the inertia coefficient; V is the volume of water displacement; C D represents the drag coefficient; u is the flow velocity; u ˙ is the flow acceleration; and A represents the cross-sectional area of the structure perpendicular to the flow direction.

3.2.1. Hydrodynamic Coefficients

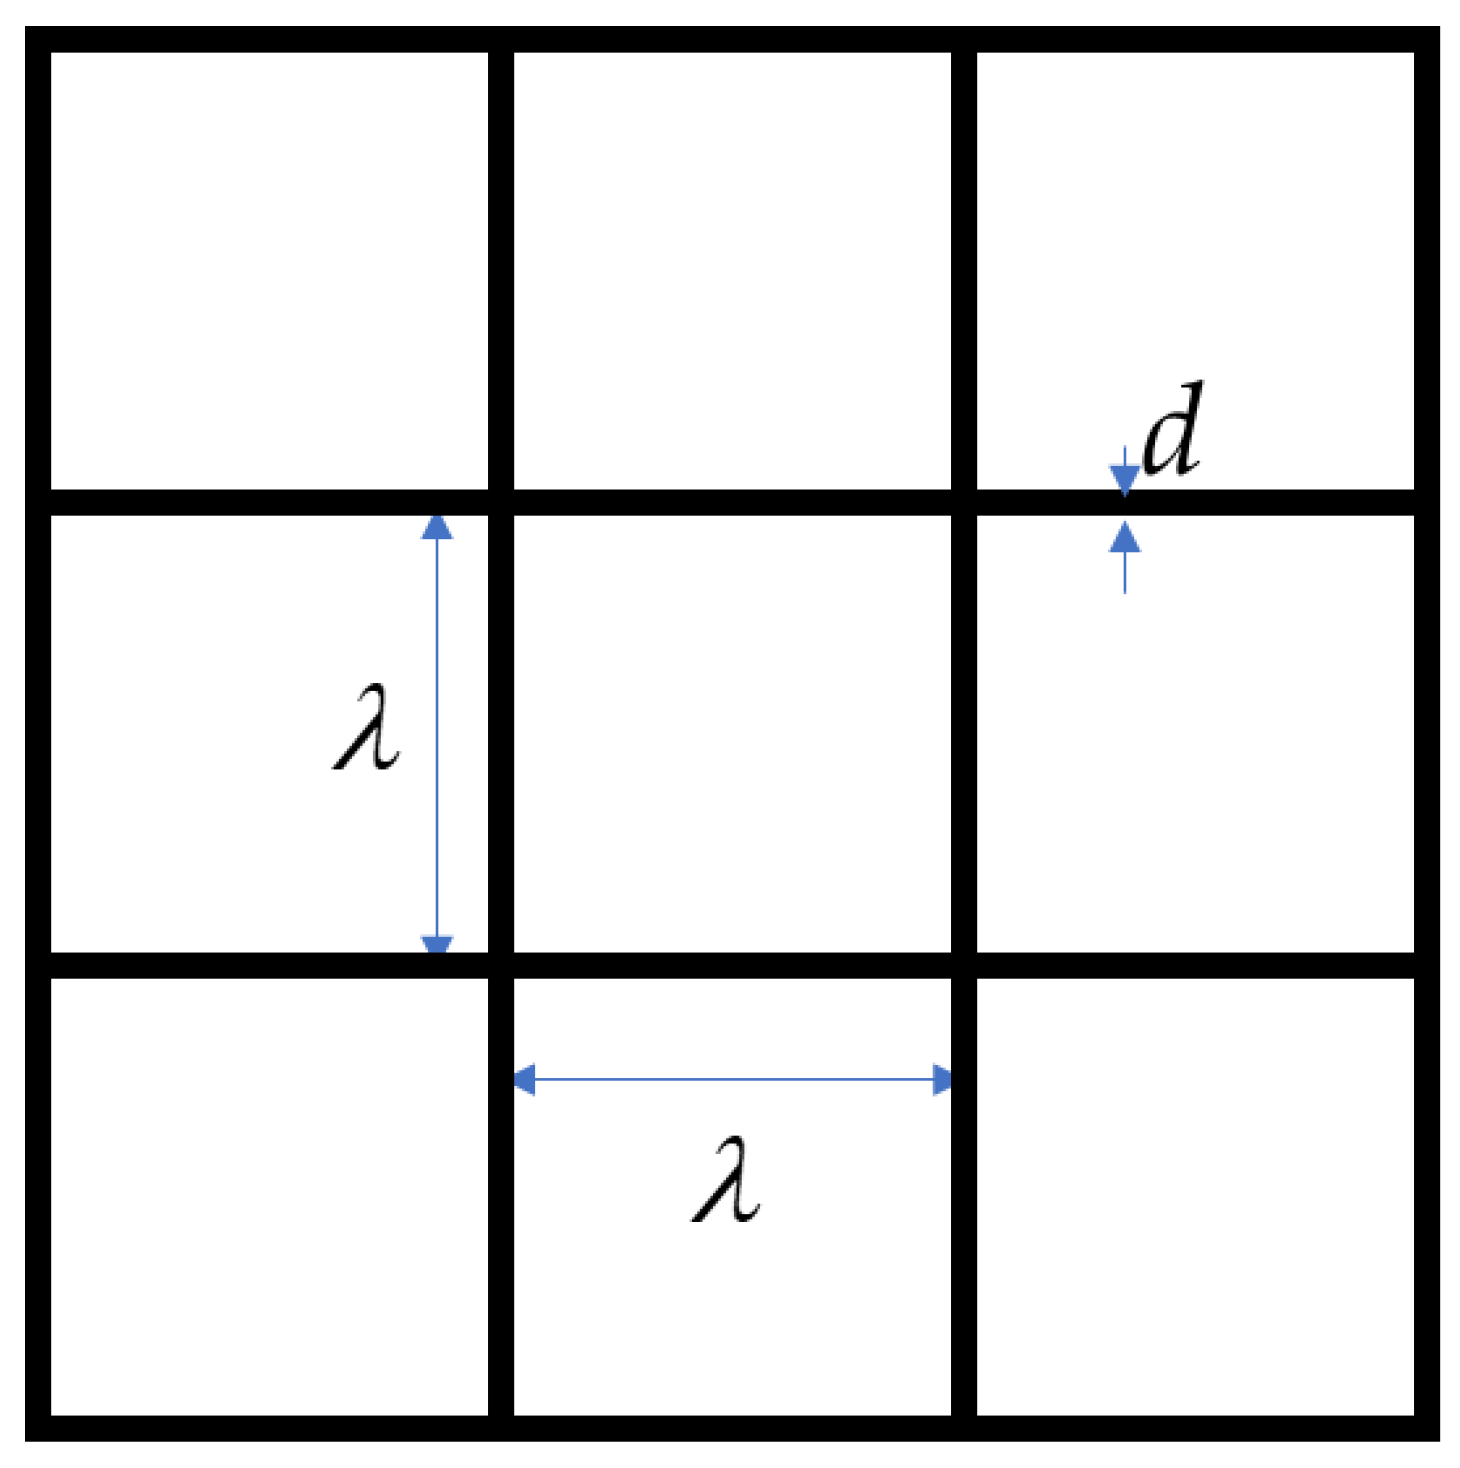
The nets of the project are made of nylon cables. As shown in Table 4 and Figure 6, the diameter of a single nylon cable is 5 mm, and the density is 6.5 × 10⁻⁶ t/m. The length of the nylon cable is the same as the distance between the two ends of the opening area of the platform. The spacing between two adjacent nylon cables is 50 mm.
The forces on the nets are calculated using the Morison Equation (13). According to the guideline issued by the CCS [43], the drag coefficient in the Morison equation can be estimated using the following formula:
C d = 0.04 + ( 0.04 + S n 1.24 S n 2 + 13.7 S n 3 ) cos α
where α = 90 α , α represents the angle of attack that is the angle between the net and the flow direction on the horizontal plane, and when the flow direction is perpendicular to the nets, the angle of attack is 0; S n represents the solidity ratio of nets, which is the ratio of the project area of the nets to the whole contour area (Figure 6).
In this study, the solidity ratio of nets is Sn = 0.22, and the corresponding drag coefficient of the whole net is C d = 0.305 . The inertia coefficient is C m = 1 . 0 . According to the principle of force equivalence, the drag coefficient of the single net line is C d = 1 . 525 , and the inertia coefficient of the single net line is C m = 1 . 0 .

3.2.2. Equivalent Simulation

As shown in Figure 7, the entire nets are divided into multiple subparts in the vertical direction, and the cables within each subpart are assumed to form a new single cable. For instance, the cables within the dashed box are replaced by a new cable positioned in the middle of the dashed box. The equivalent substitution follows two principles: (1) The weight of the new cable equals the total weight of the original cables; (2) The hydrodynamic force of the new cable equals the total hydrodynamic forces of the original cables. The same approach is used for equivalent substitution in the horizontal direction [44].
Based on the Morison equation, the equivalent diameter D, equivalent drag coefficient C D , and equivalent inertia coefficient C M of the new cable are calculated as follows [44,45]:
D = d n
C D = C d n
C M = C m
where d represents the diameter of a single cable; and n is the number of cables used to form the equivalent cable.
In this study, 95 cables in the vertical direction are consolidated into 1 equivalent cable, and 60 cables in the horizontal direction are consolidated into 1 equivalent cable. The relevant equivalent coefficients of nets based on Equations (15)–(17) are presented in Table 5.

3.3. Mooring System

The mooring lines are simulated using the finite element model and the lumped-mass method. Each line is divided into several line segments with a node at each end. The segments only model the axial and torsional behaviors of the line. Other properties (mass, weight, buoyancy, etc.) are lumped at the nodes [46]. The hydrodynamic loads on the mooring lines are calculated using Morison’s equation.

3.3.1. Composition of the Mooring System

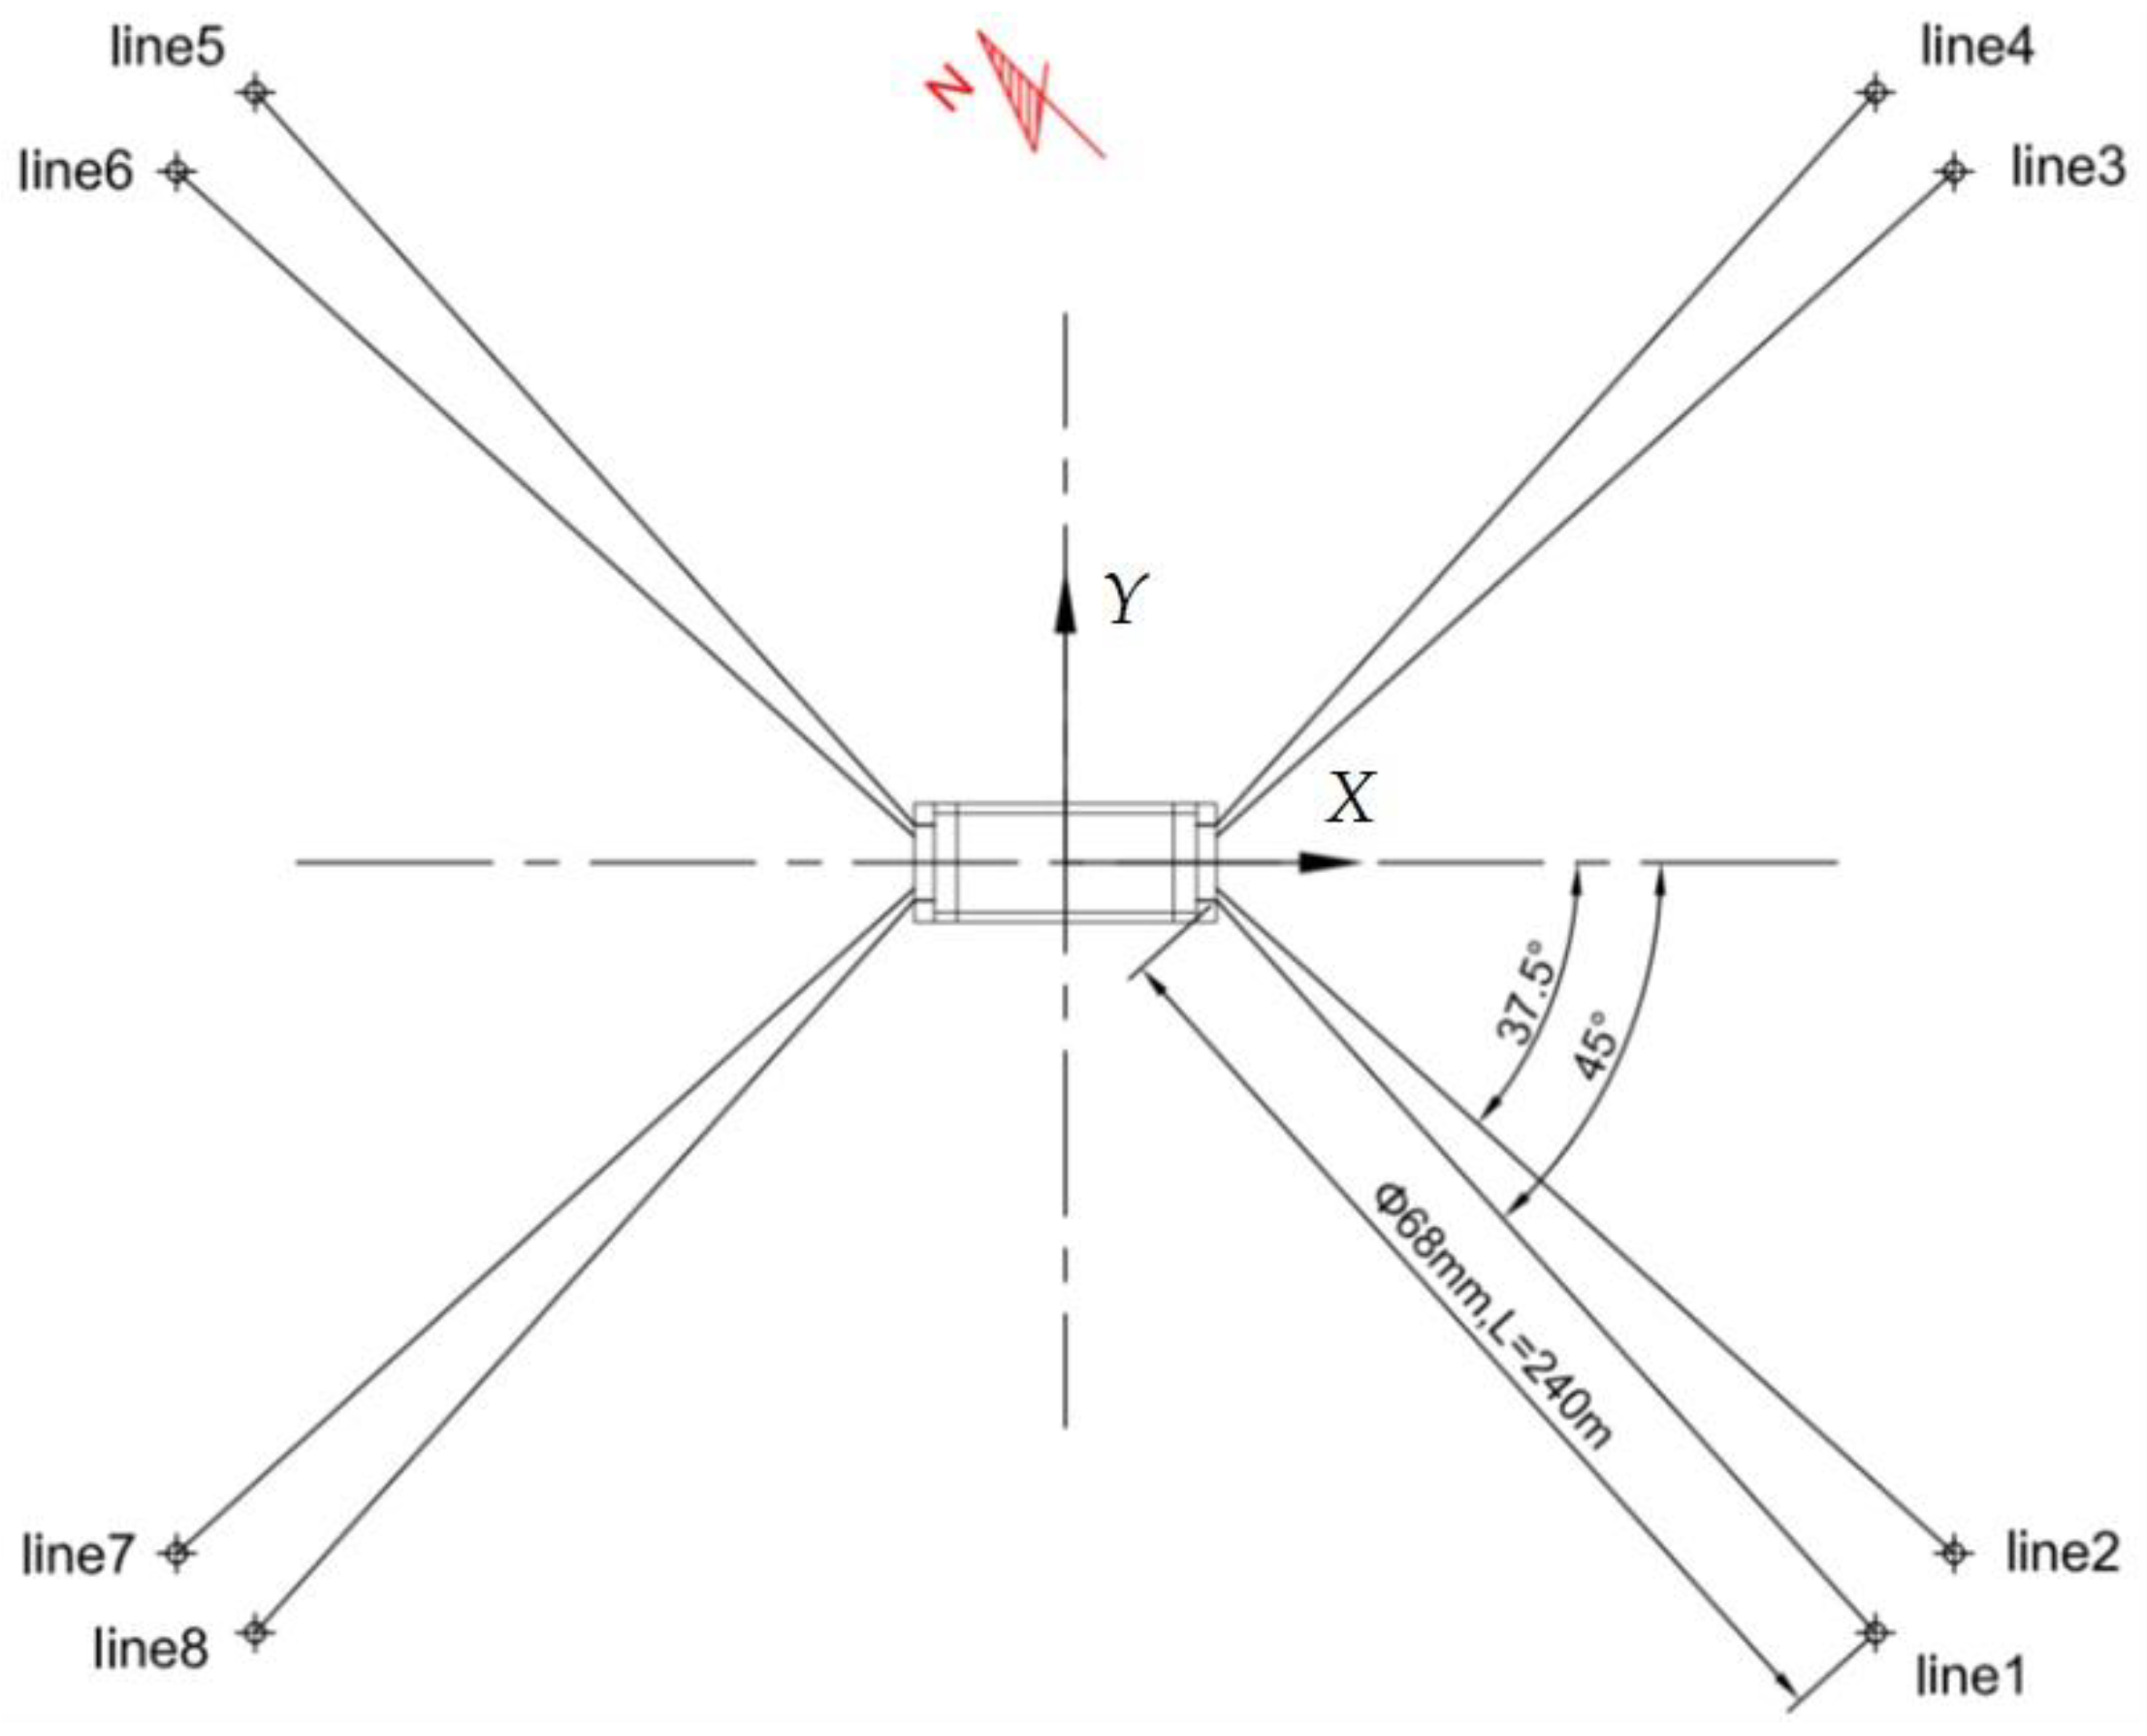
Previous studies [23,24,25] have predominantly focused on single-point mooring systems in the context of vessel-shaped fish farms. While the single-point mooring system provides good environment direction-following capability, it requires a large sea area due to extensive platform movements. In order to reduce the range of motion, this paper adopts a multi-point mooring system for the presented semi-submersible platform. As Figure 8 shows, the system arranges eight mooring lines symmetrically into four groups, with two lines in each group. At the project site, the angle between the geographical north direction, and the position direction of the X-axis is 135°. Line 1 makes an angle of 45° with the positive X-axis direction, while line 2 makes an angle of 37.5°. The horizontal distance between the fairlead and the anchor measures 240 m.
Eight identical mooring lines are utilized. The normal drag, axial force, normal inertia, and axial inertia coefficients of each line are 2.6, 1.4, 1.0, and 0.5, respectively. Other detailed parameters are presented in Table 6.
Each mooring line connects one end to the fairlead on the platform and the other end to the anchor on the seabed. The coordinates of fairleads and anchors are provided in Table 7. The fairlead coordinates are based on the local Cartesian coordinate system, as described in Section 2.1. The anchor coordinates are based on the global Cartesian coordinate system, with the origin located at the mean water level. The X-axis points forward to the bow of the platform, the Y-axis points toward the port of the platform, and the Z-axis points vertically upward.

3.3.2. Loading Cases for Mooring Analysis

In the mooring analysis, the wave direction is defined as follows: 0° represents the forward propagation of the wave along the x-axis of the platform’s coordinate system, 90° represents the forward propagation of the wave along the y-axis of the platform’s coordinate system, and other wave directions follow the same principle. The direction definition for winds and currents is identical to that of waves, as depicted in Figure 9.
Based on the environmental parameters in Section 2.2 and the symmetric arrangement of the platform and mooring system, Table 8 presents the loading cases for survival conditions, following the CCS rules [42]. As the environmental conditions are more severe for survival conditions than for operation conditions, this study only considers loading cases for survival conditions.

4. Results and Discussion

4.1. Verification of Numerical Results

Hydrodynamic coefficients, including the added mass, damping coefficient, the first-order wave force, and the second-order wave force, are obtained using the software package HydroStar v8.00 [47]. This software is based on the three-dimensional Green function potential flow theory in a finite water depth.
The project site has a water depth of only 20 m, which classifies it as a shallow-water area. Therefore, the effects of the second-order differential frequency forces become important. It is necessary to calculate the full quadratic transfer function (QTF).
In this study, the wave frequency ranges from 0.05 rad/s to 2.0 rad/s, with an interval of 0.05 rad/s, resulting in a total of 40 wave frequencies. The wave frequency range covers the most common wave frequencies observed in our study area, and the interval ensures a sufficient resolution for the analysis. The wave direction ranges from 0° to 345°, with an interval of 15°, giving a total of 24 wave directions. The wave direction range represents the full circle of possible wave directions, and the interval is consistent with the wind direction data we collected from the meteorological station. Basically, the same selection of the range and interval of the wave frequency and wave direction for the common frequency domain analysis can be found in [38].
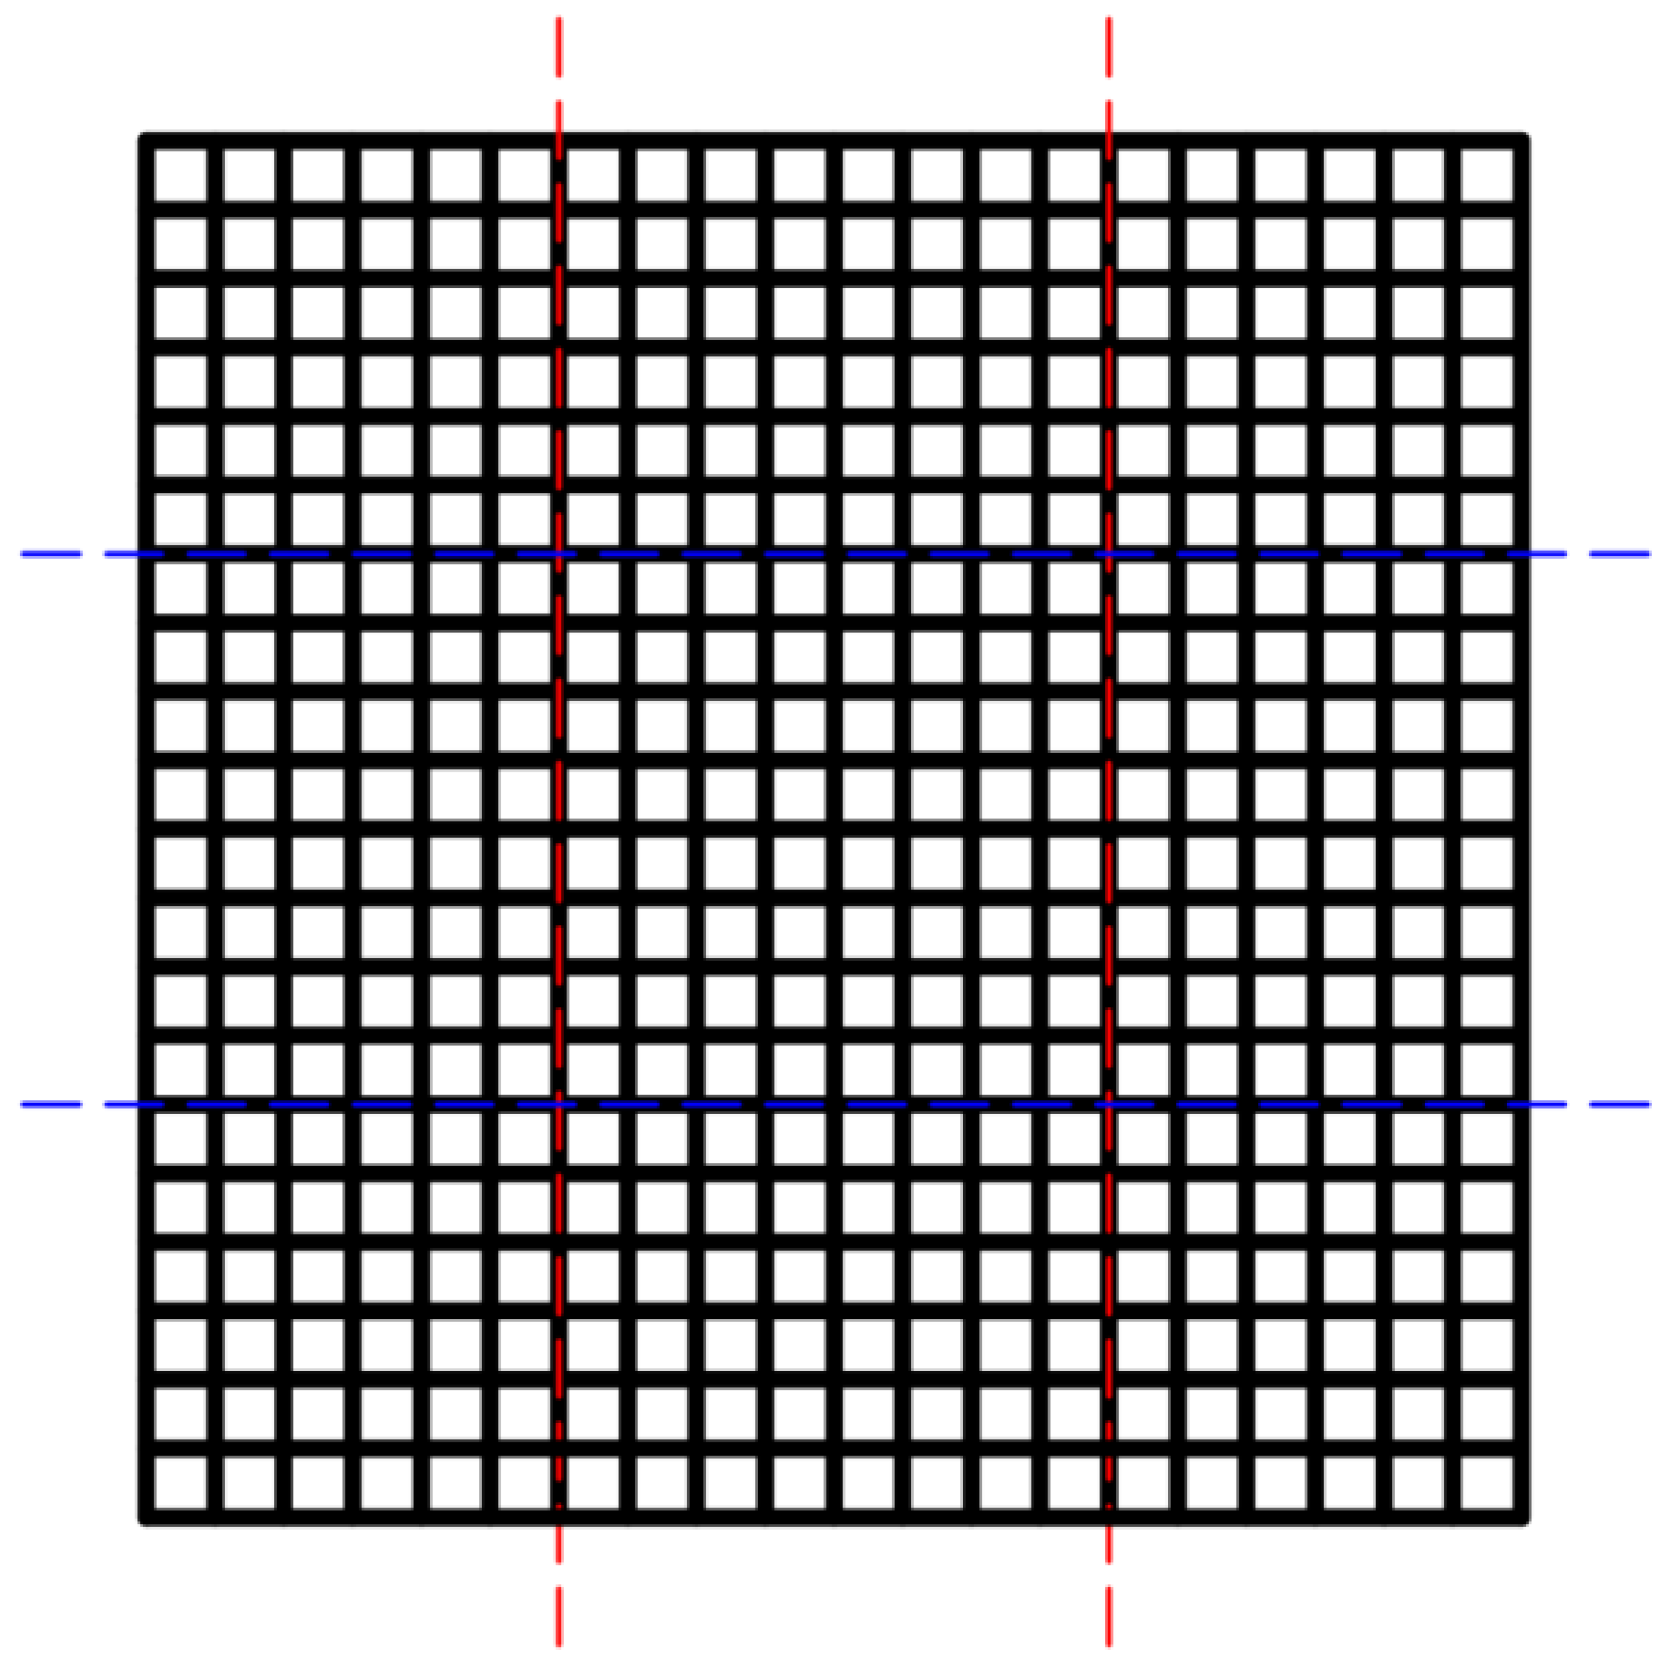
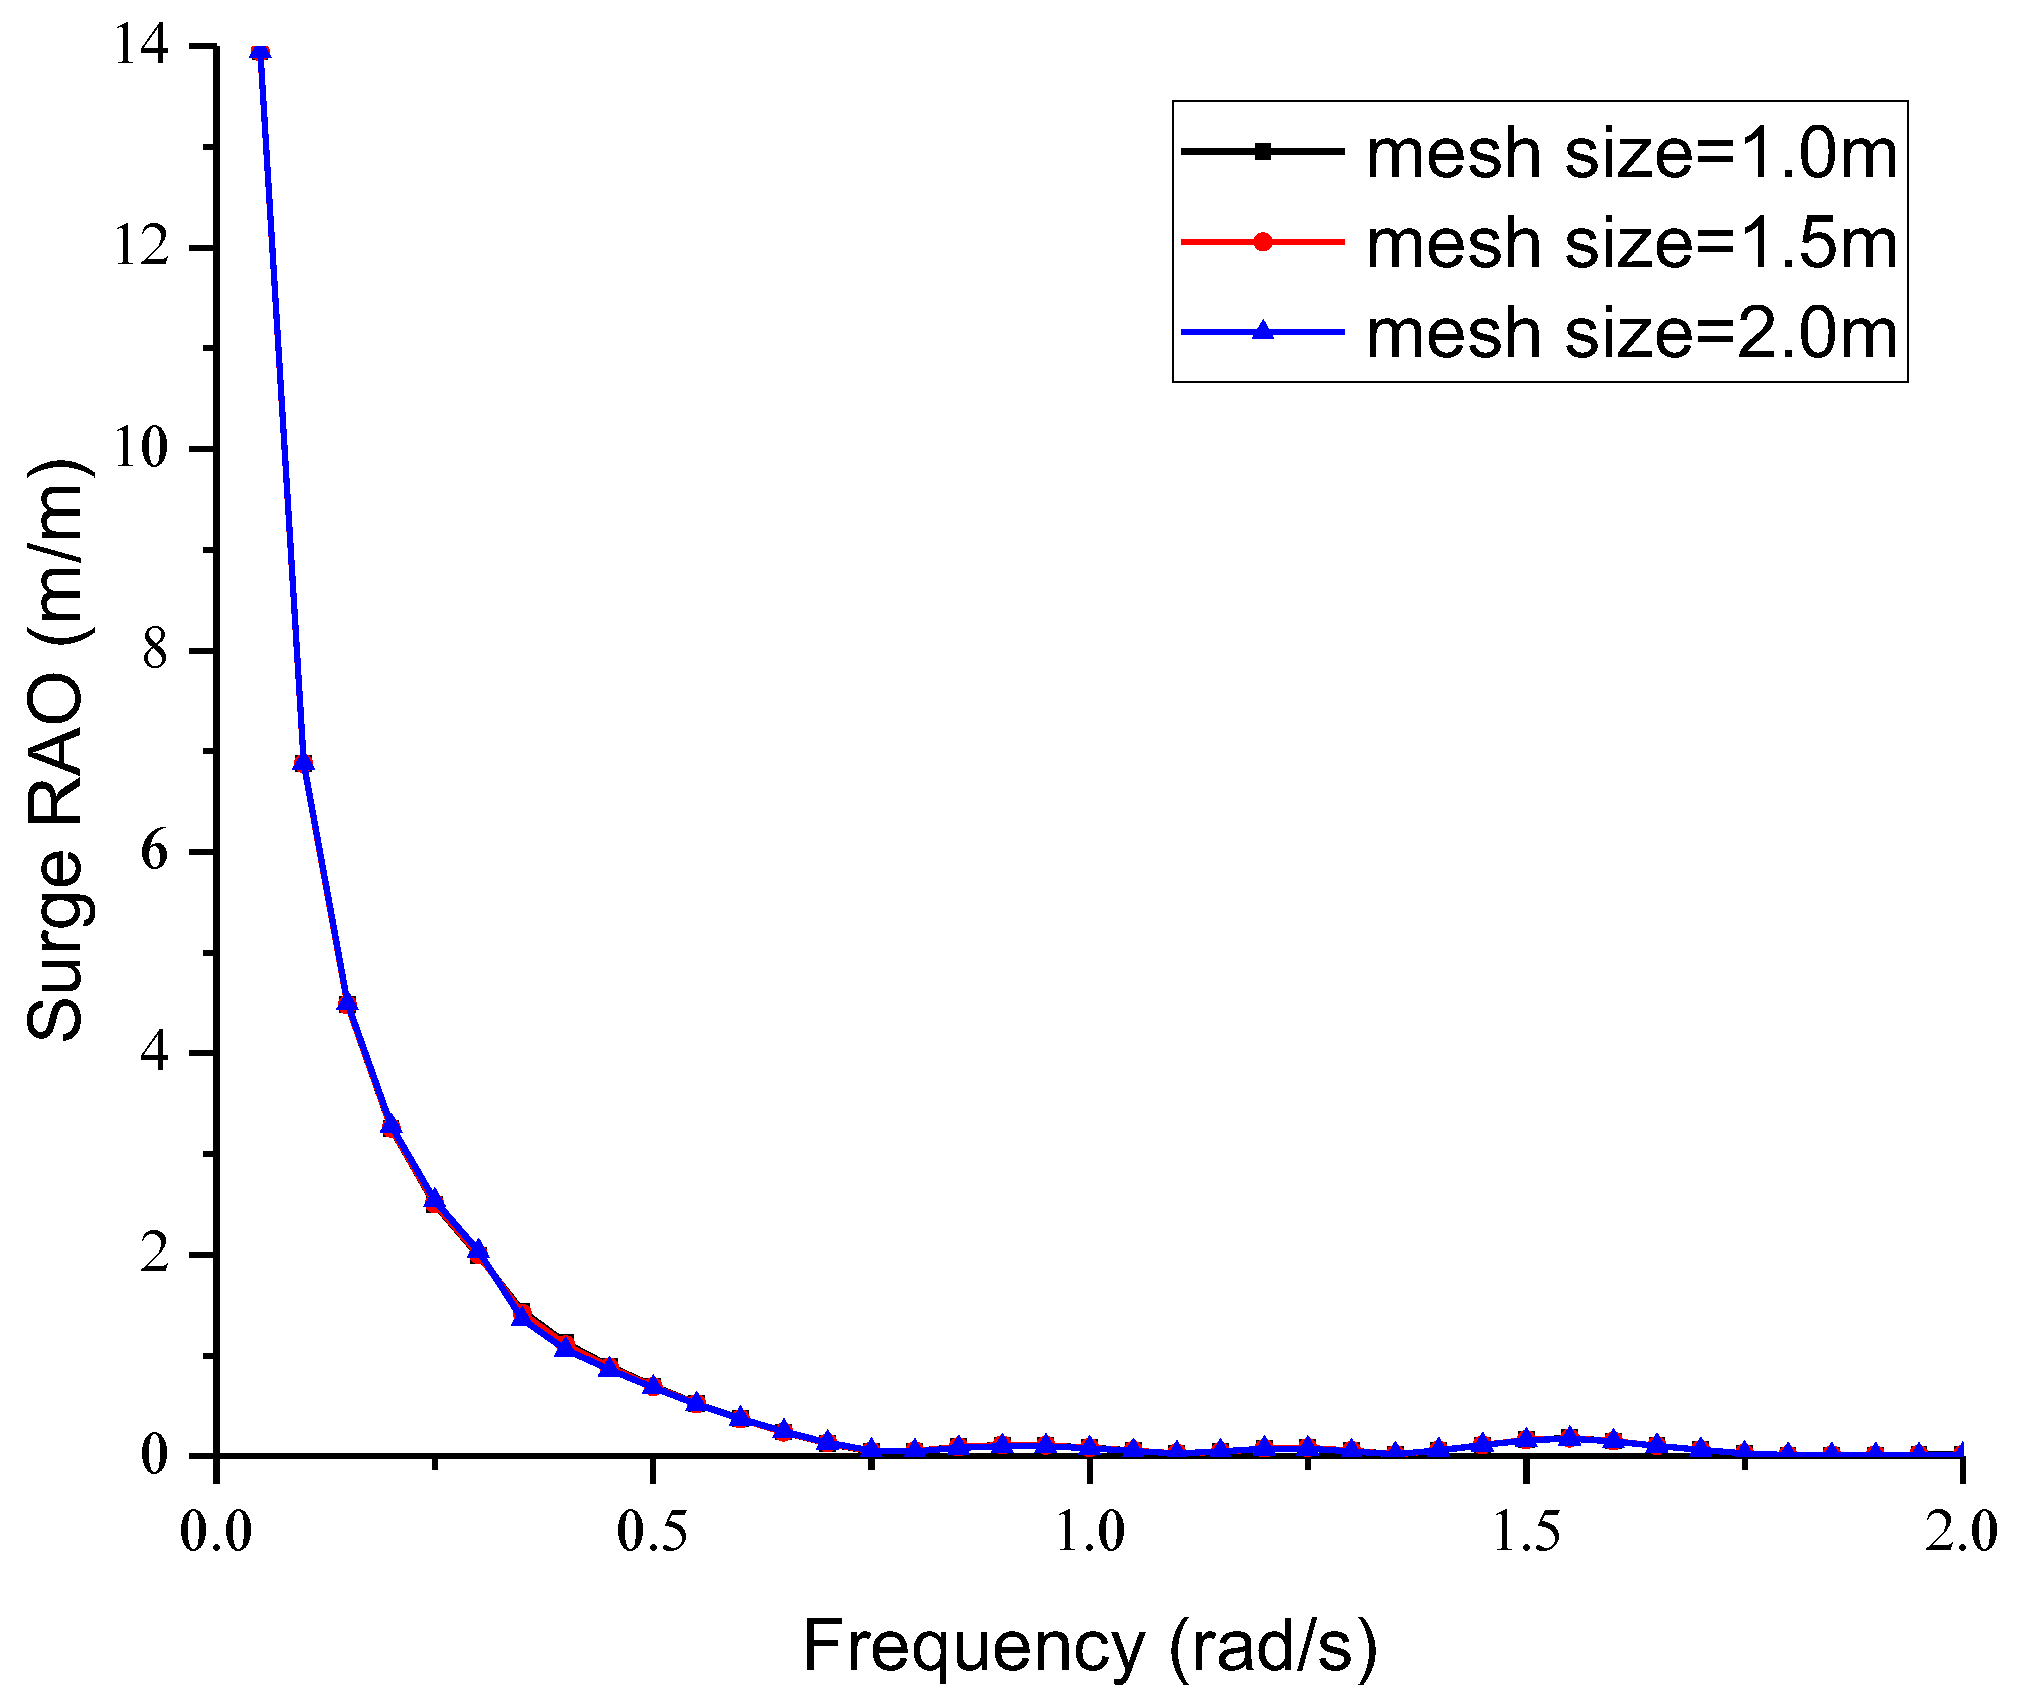
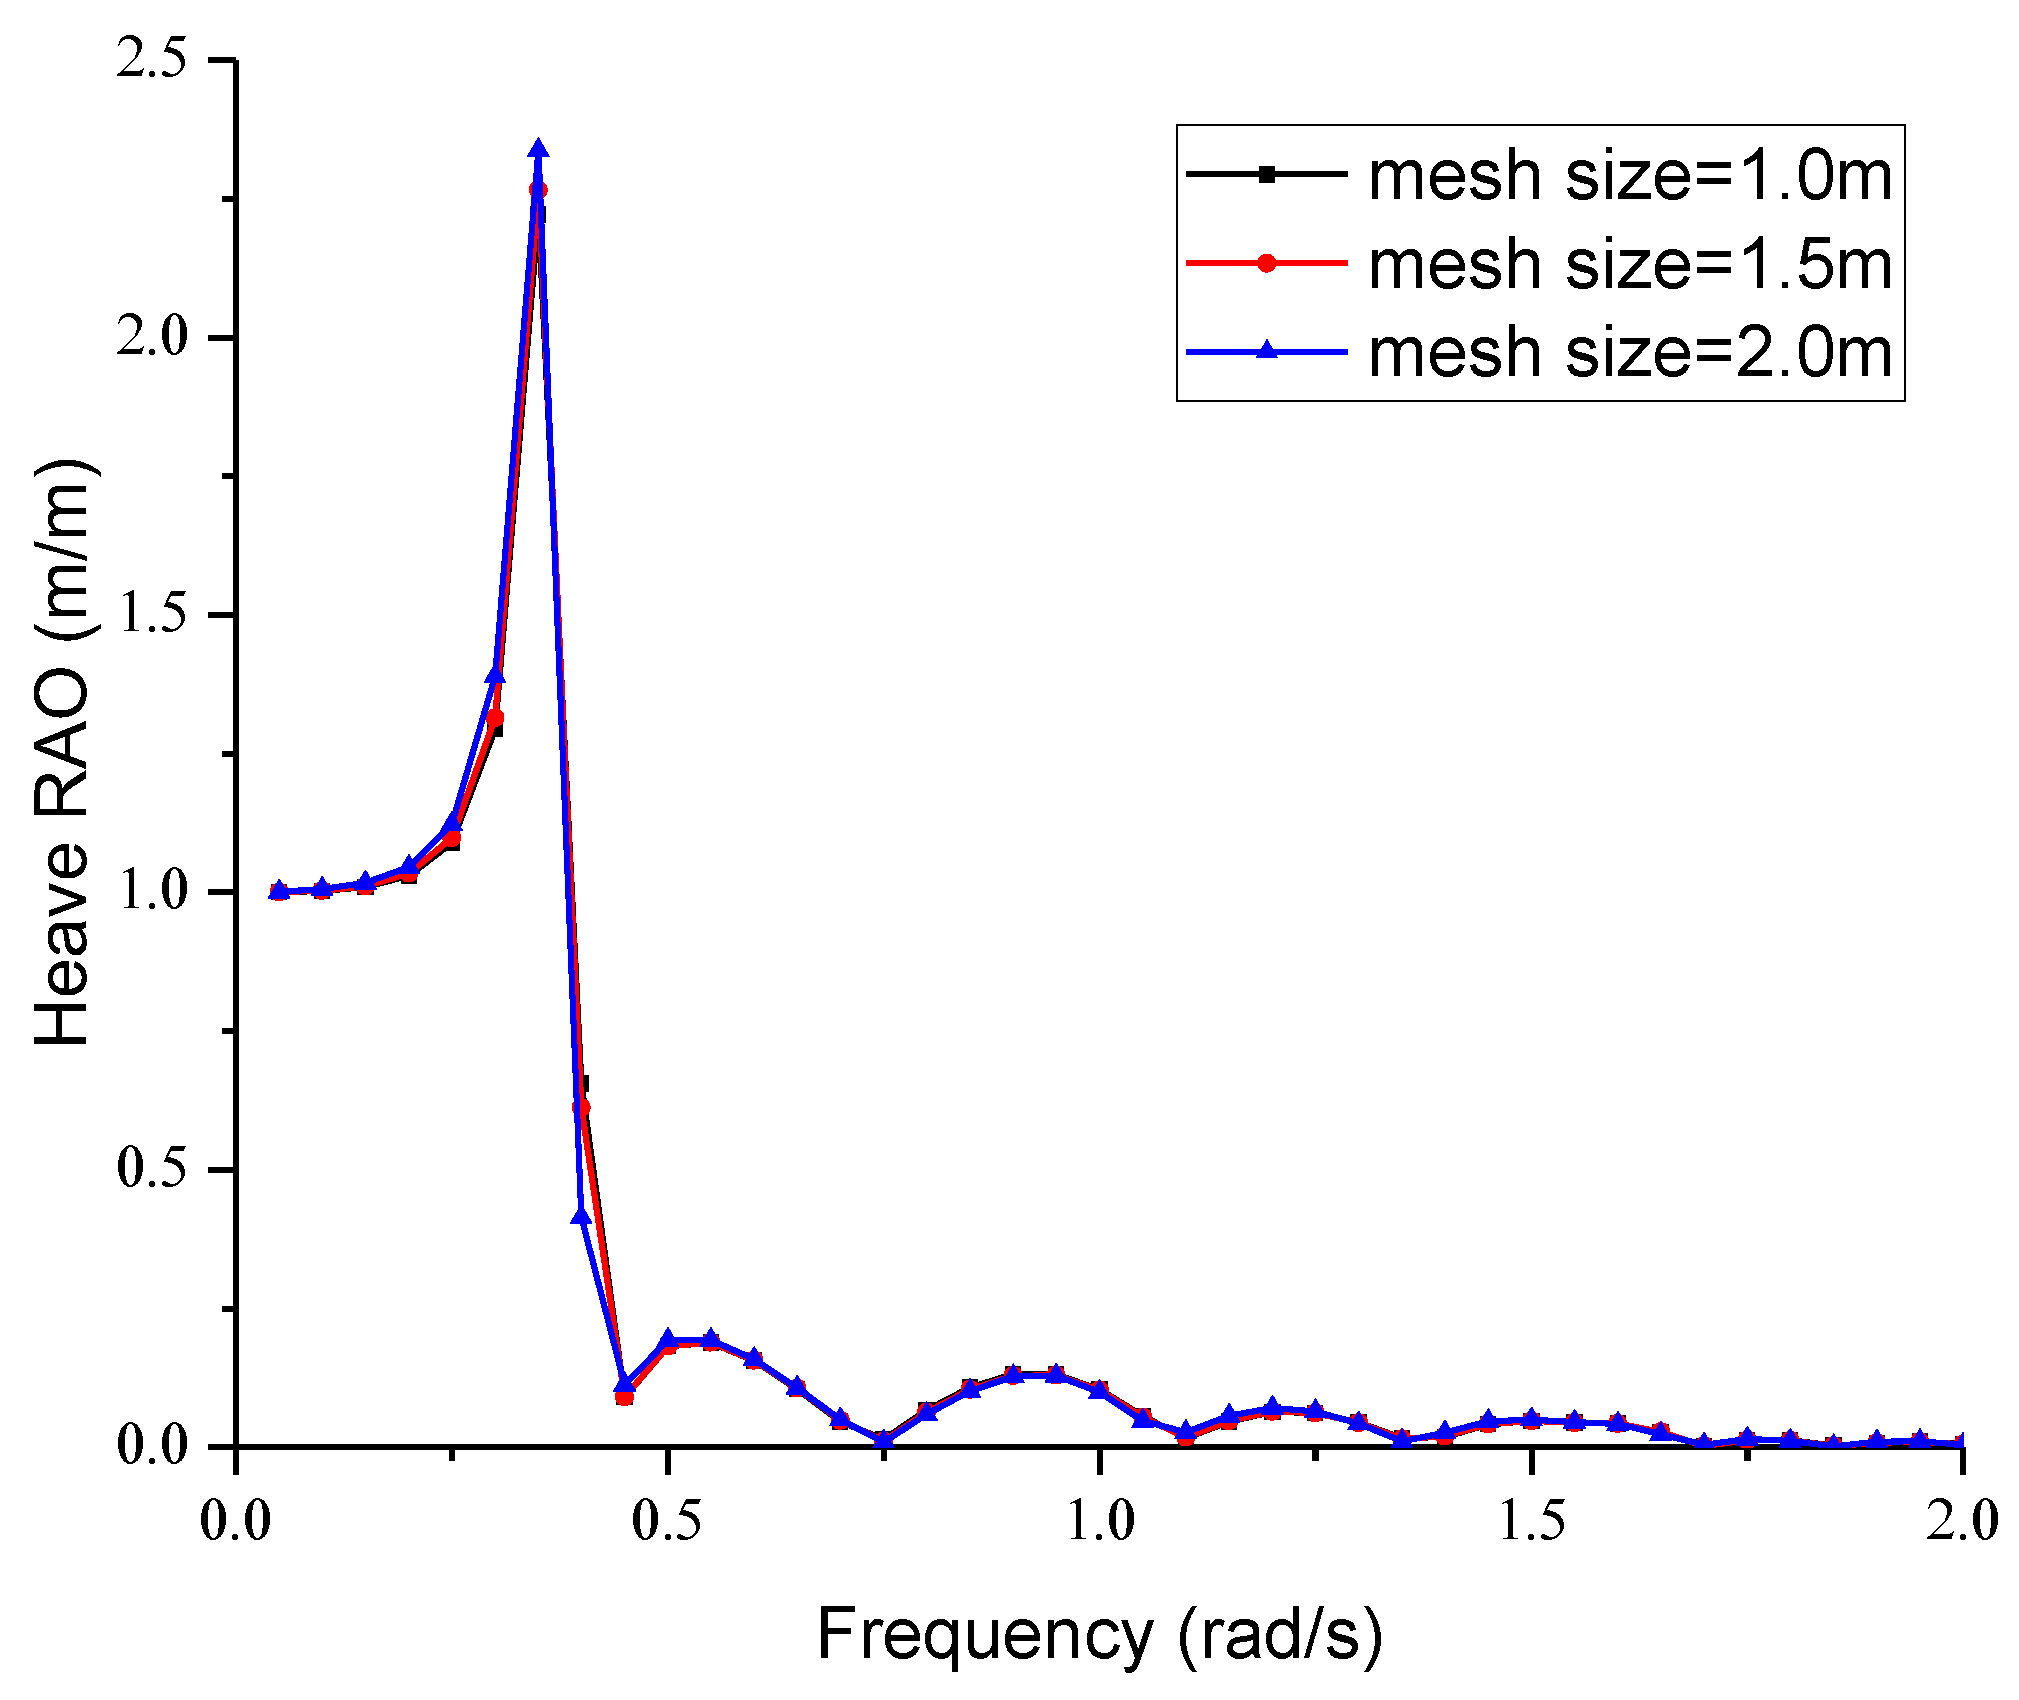
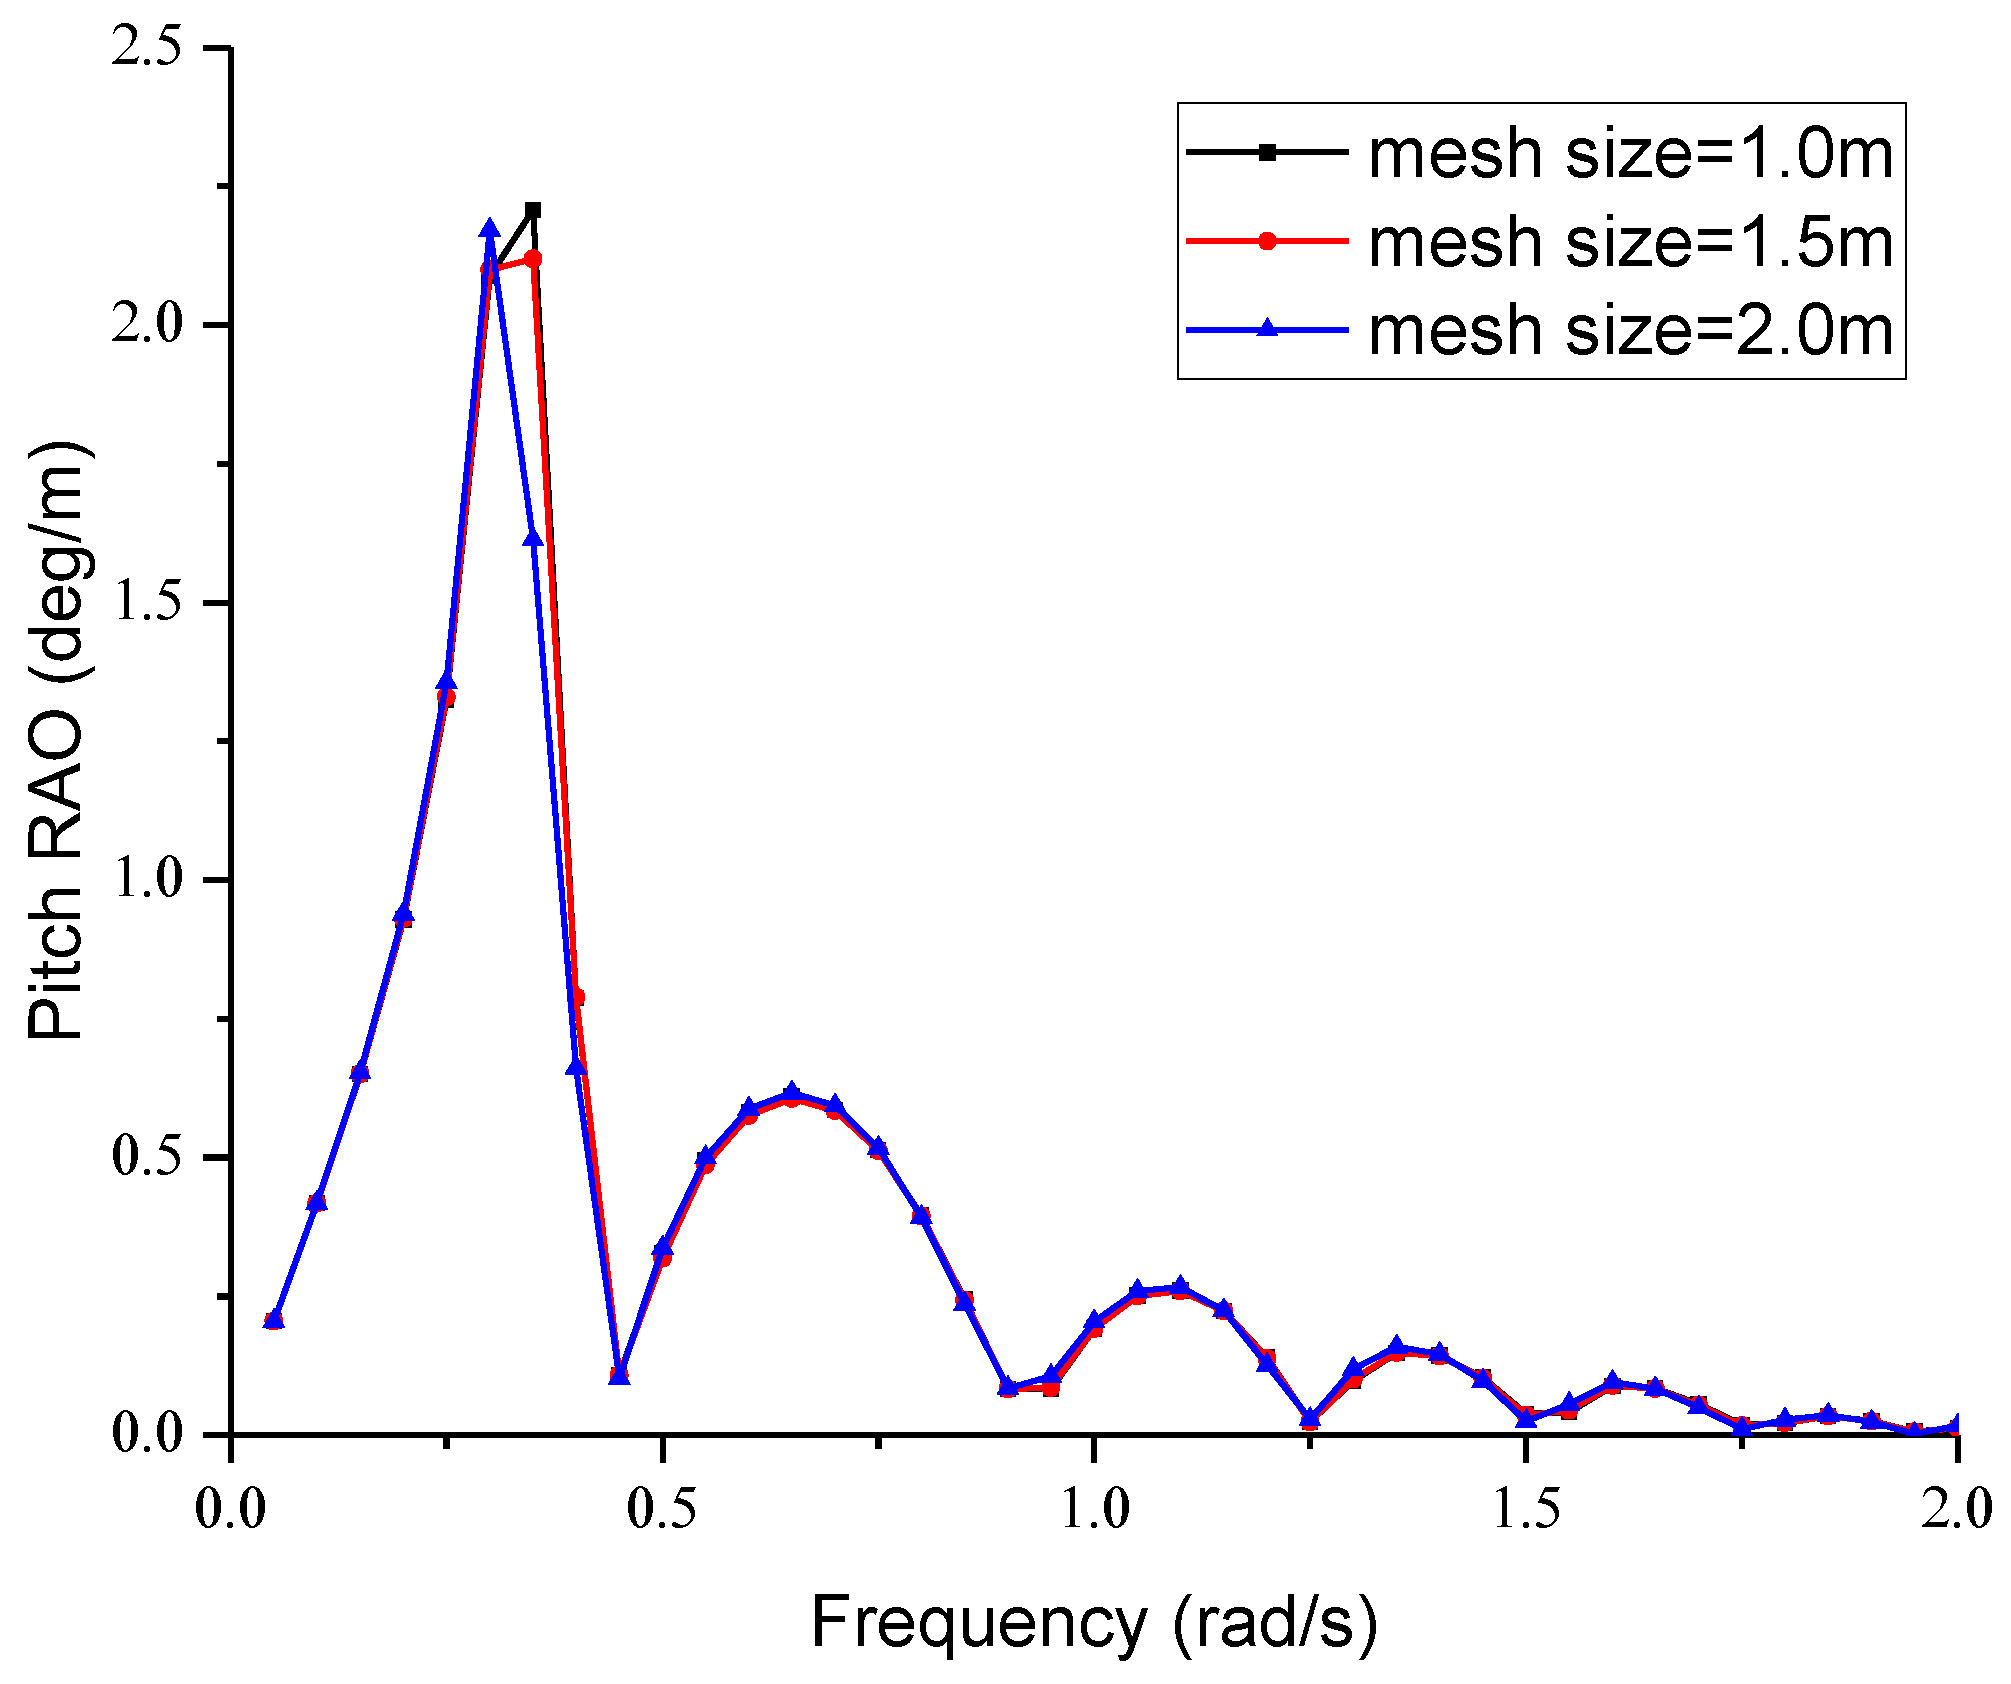
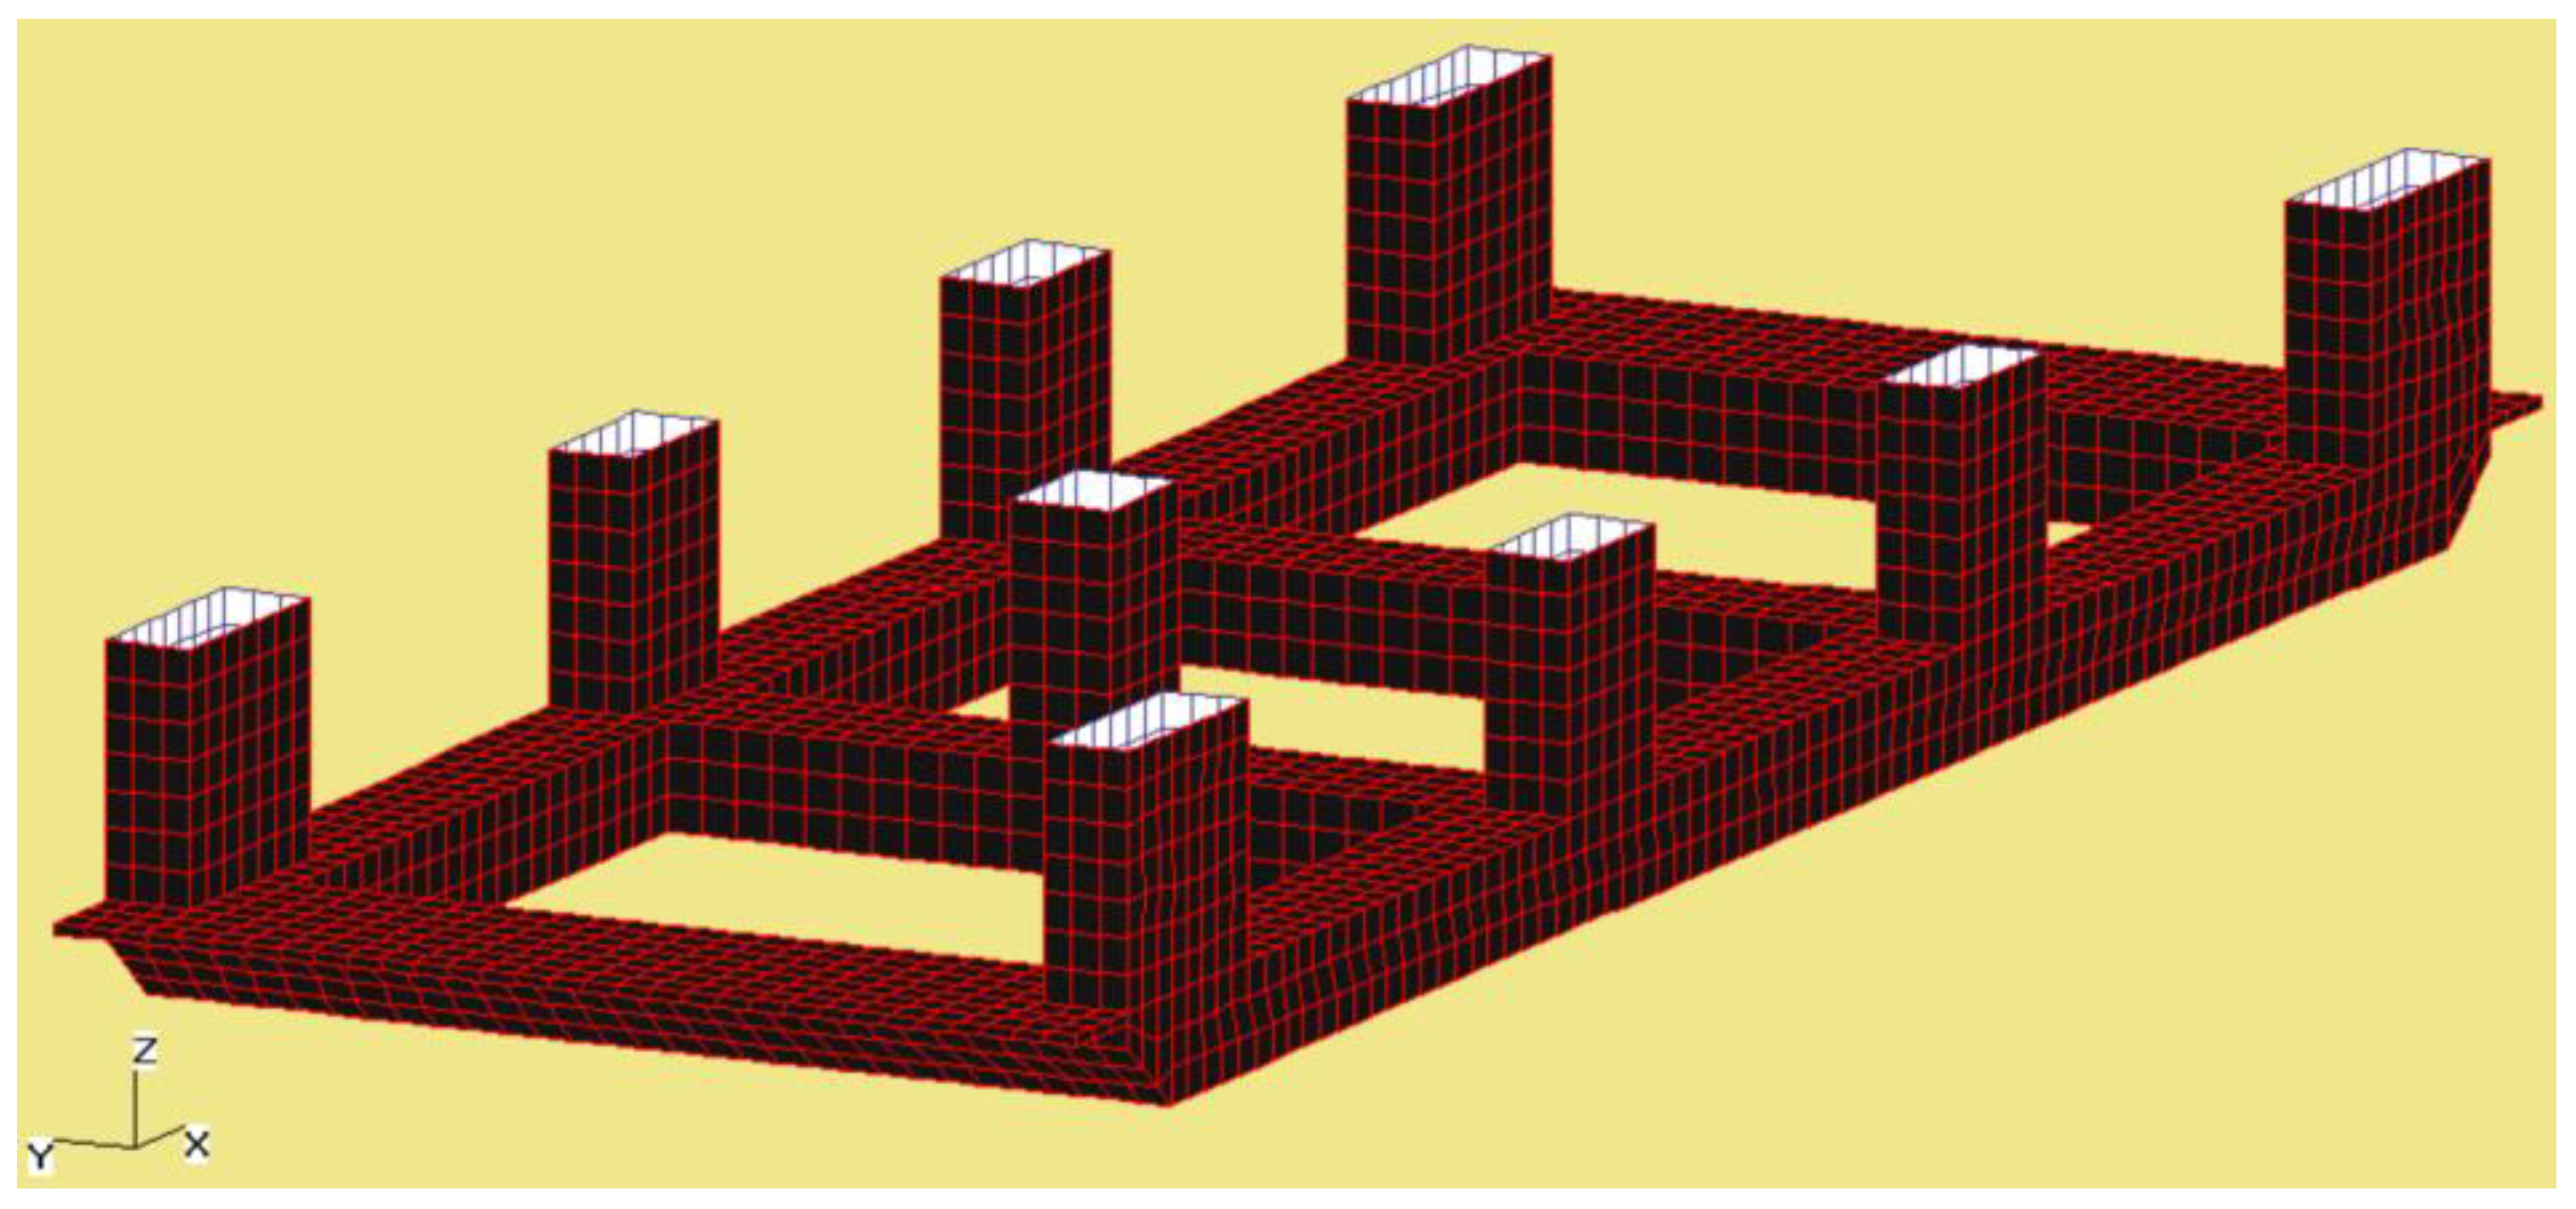
The mesh convergence analysis is conducted to examine the effects of mesh size on the numerical results of hydrodynamic coefficients. Three different mesh sizes of 1.0 m, 1.5 m, and 2.0 m are selected for the analysis, with respective total mesh numbers of 4846, 2221, and 1022, respectively. A quadrilateral mesh is utilized, and the mesh size is decreased in areas with complex surface shapes. Figure 10, Figure 11 and Figure 12 present the RAO results of surge, heave, and pitch under three different sizes. Based on these results, a mesh size of 1.0 m is adopted to balance the accuracy and efficiency of the numerical results in this study. The mesh model of the platform is illustrated in Figure 13.
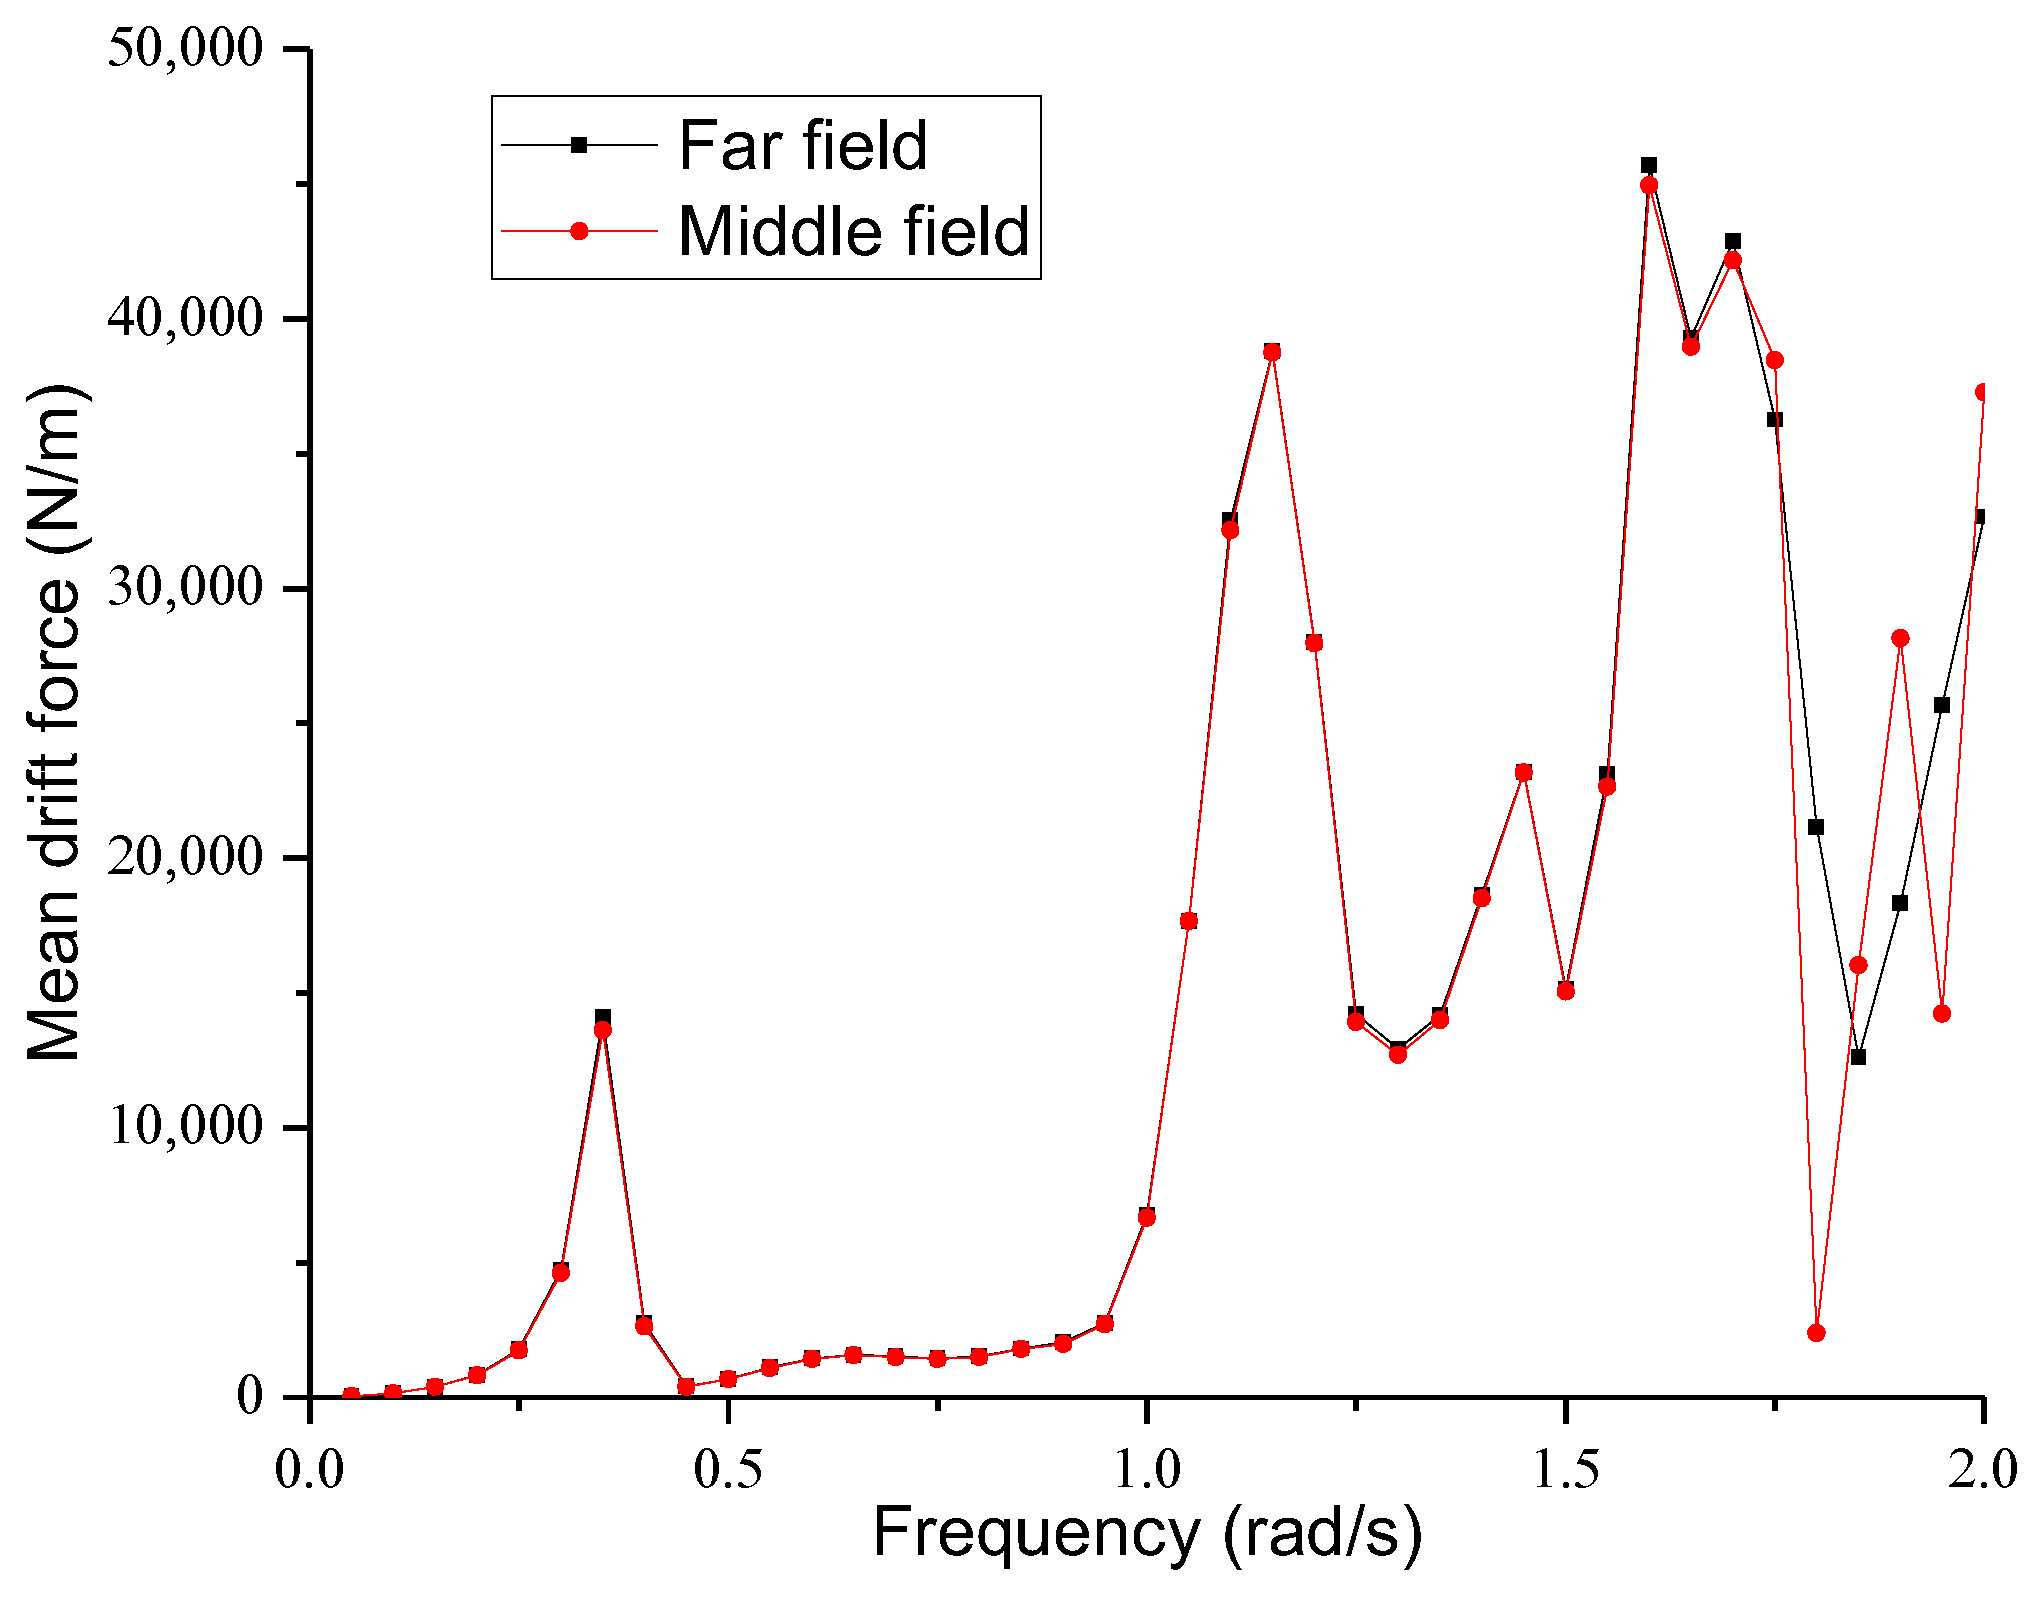
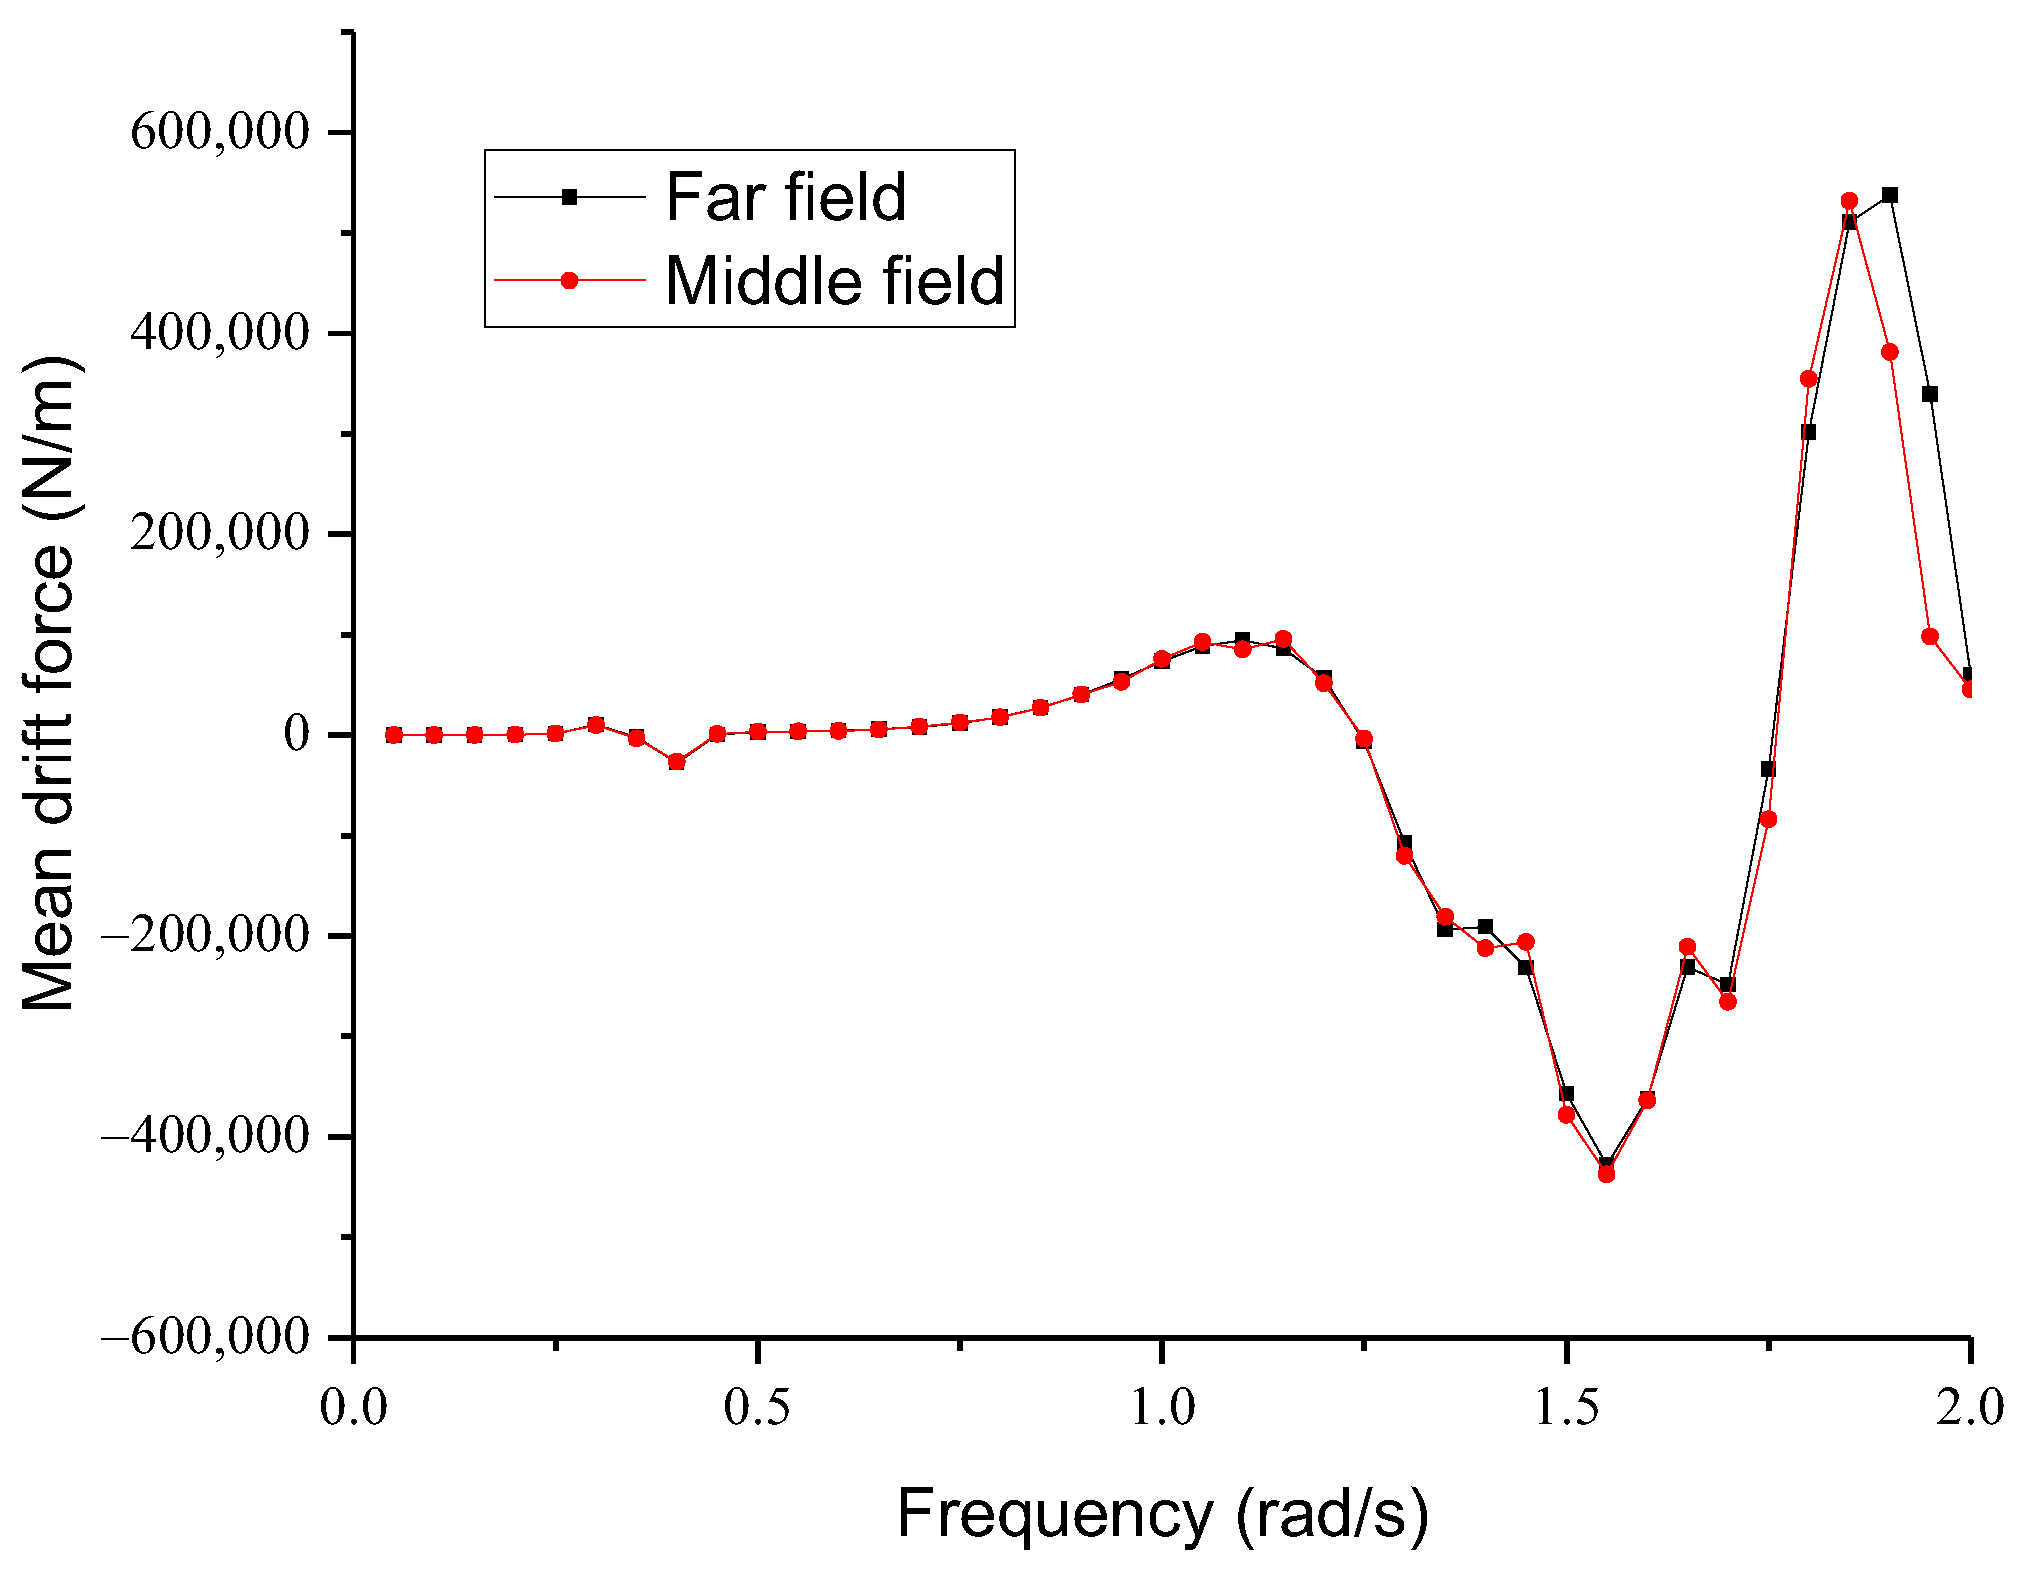
The middle-field method, proposed by Chen [41], has been implemented in the software HydroStar v8.00 [47]. The mean drift forces are calculated using both the far-field method and the middle-field method. Figure 14, Figure 15 and Figure 16 compare the mean drift forces of surge, sway, and yaw under different wave incident angles obtained using these two methods. The results indicate that the mean drift forces calculated using the middle-field method agree with those obtained using the far-field method, demonstrating that the middle-field method is a reliable approach to calculating the full quadratic transfer functions in the analysis. The maximum value of the mean drift force in the sway direction is significantly larger than that in the surge direction. This can be attributed to the larger area subjected to forces in the sway direction compared with the surge area. The peak values of the mean drift force in the sway direction occur at approximately 1.6 rad/s (corresponding to a wave period of 3.93 s), 1.15 rad/s (corresponding to a wave period of 5.46 s), and 0.35 rad/s (corresponding to a wave period of 17.95 s, with a value of 14,085 N/m). In addition, the peak value of the mean drift force in the sway direction is achieved at a wave frequency of approximately 1.75 rad/s (corresponding to a wave period of 3.59 s) and 0.35 rad/s (corresponding to a wave period of 17.95 s, with a value of 18,436 N/m). Furthermore, the peak value of the mean drift force in the yaw direction occurs at a wave frequency of around 1.55 rad/s (corresponding to a wave period of 4.05 s) and 1.85 rad/s (corresponding to a wave period of 3.39 s).
For the platform without nets in a free-floating state, natural periods of heave, roll, and pitch motions are calculated using the software HydroStar. The calculated natural periods are as follows: 16.908 s for heave, 16.801 s for roll, and 18.208 s for pitch. Notably, these periods are far from the wave periods typically existing in the East and South China seas. This indicates that the designed platform is capable of effectively mitigating structural resonance caused by waves.

4.2. Hydrodynamic Performance in Regular Waves

This study employs the software OrcaFlex 11.0a to conduct a coupled analysis of the platform’s dynamic responses. OrcaFlex is a software for dynamic analysis of marine systems, which can simulate various types of structures. A fully nonlinear numerical model is constructed in OrcaFlex.
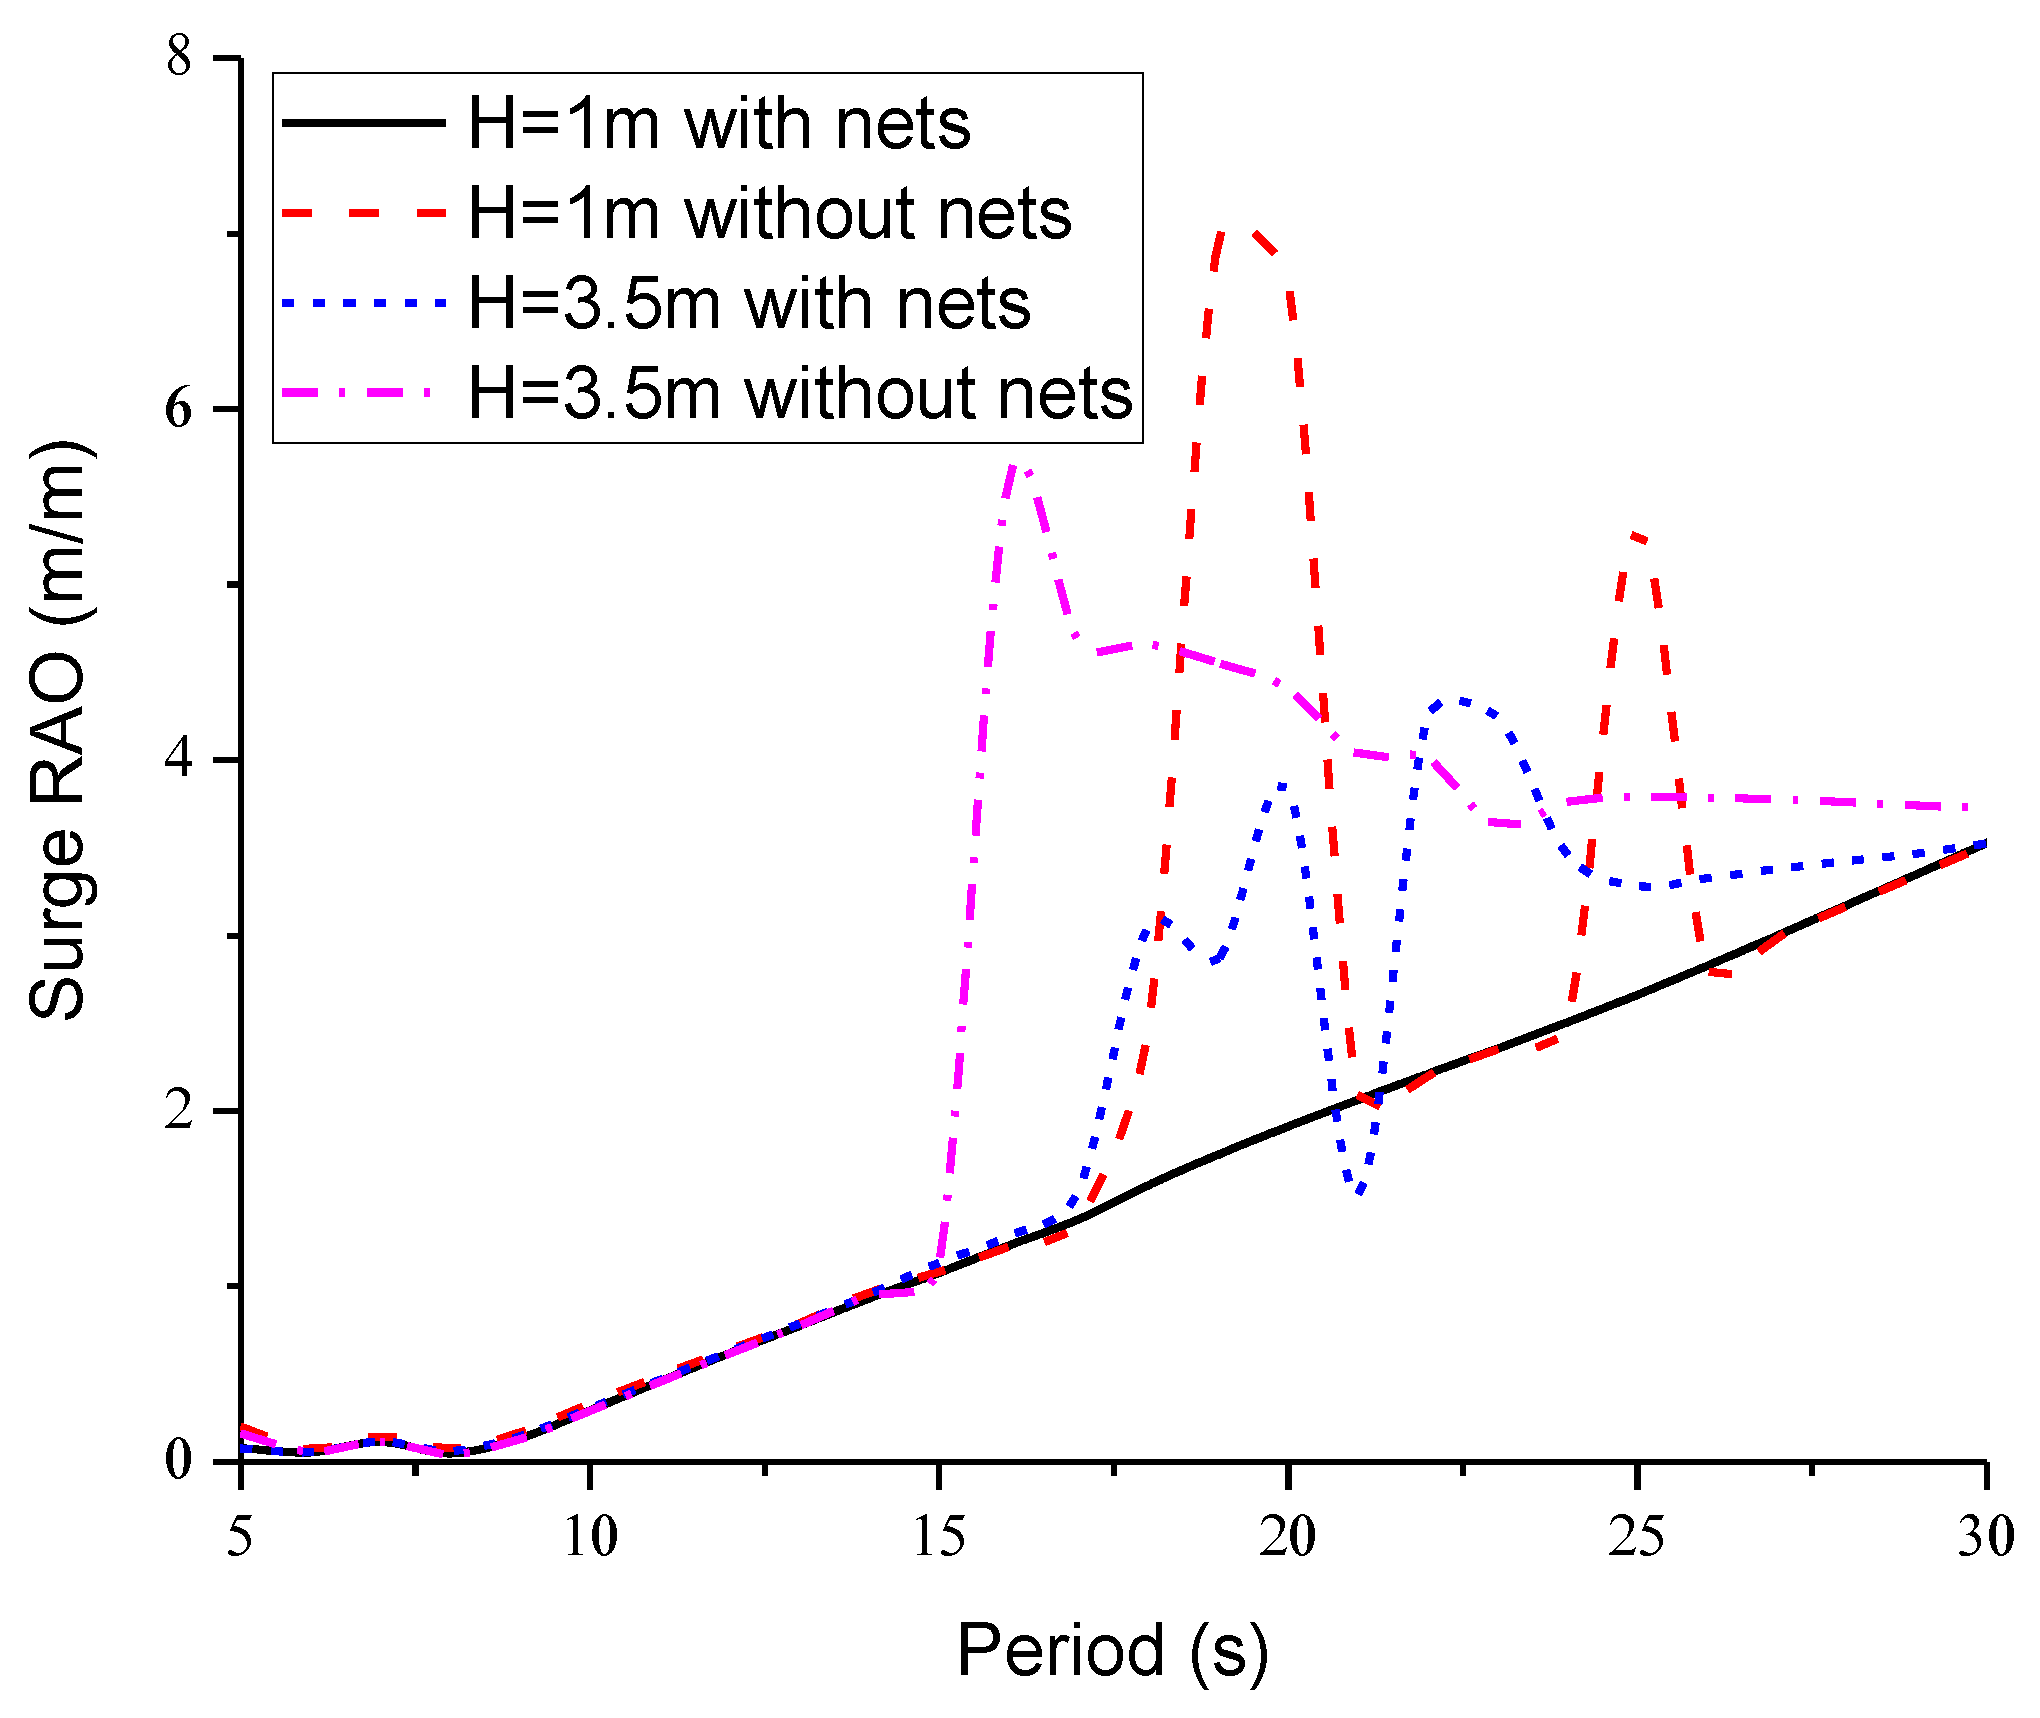
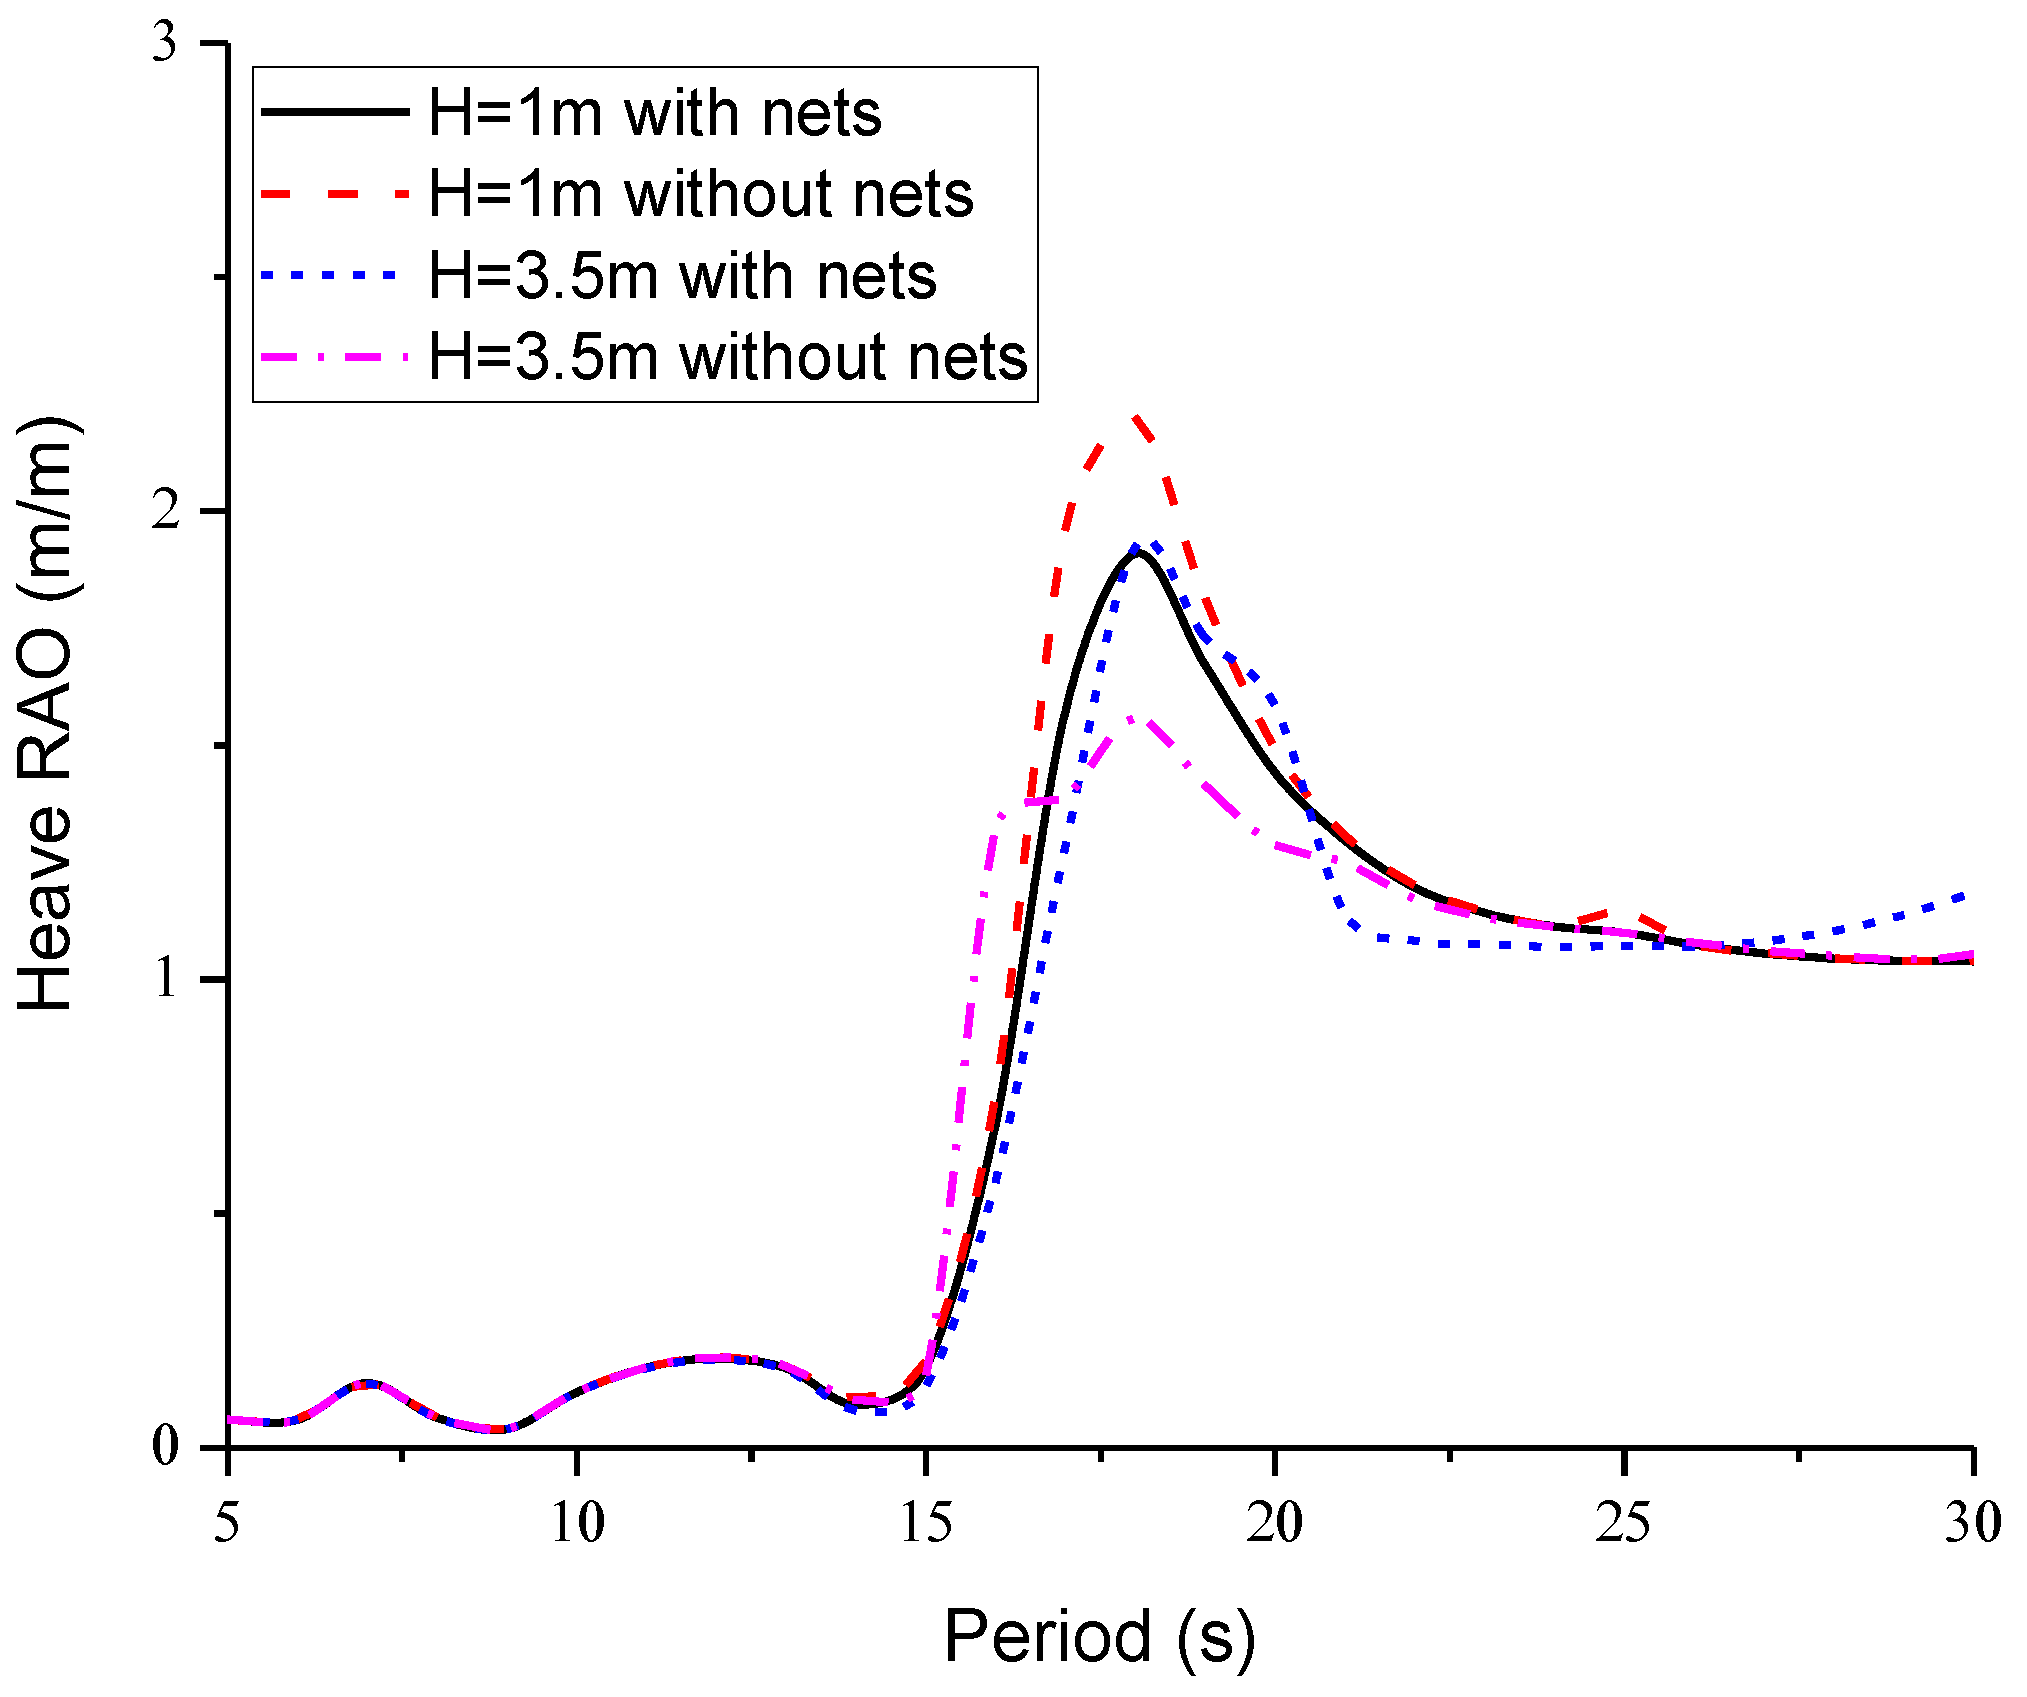
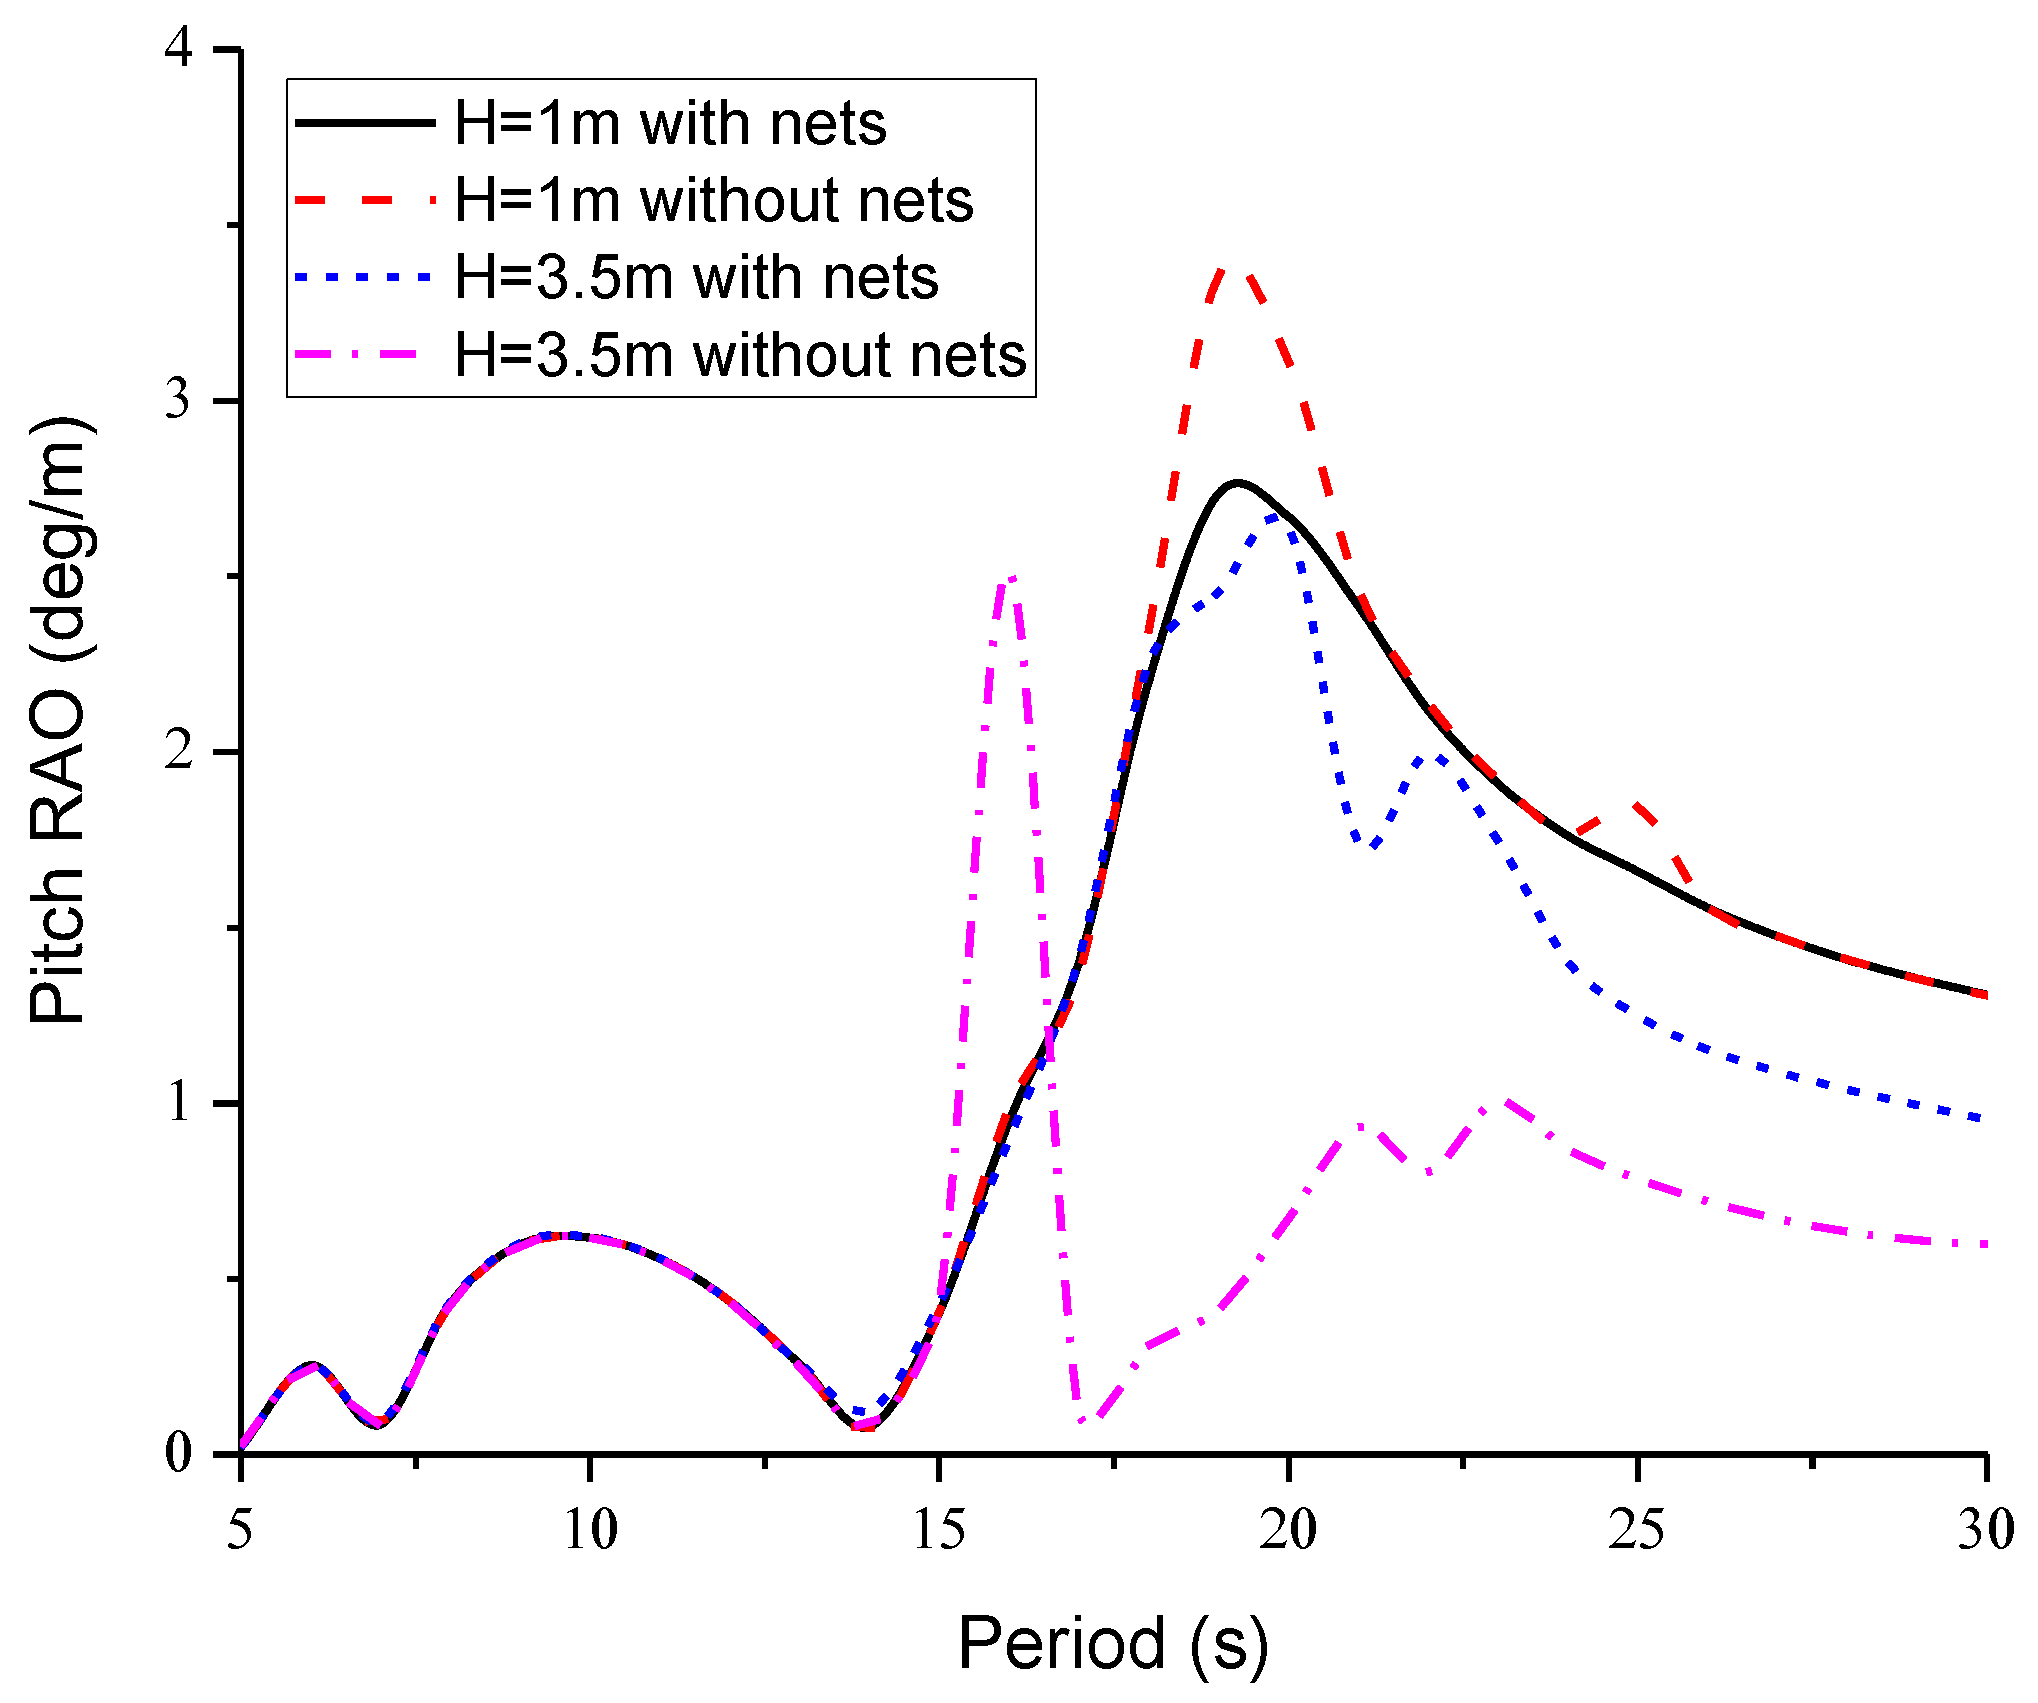
Figure 17, Figure 18 and Figure 19 illustrate the surge, heave, and pitch RAOs of the moored platform with and without nets in regular waves with a heading angle of 180°. The wave heights considered are 1 m and 3.5 m, with the periods ranging from 5 s to 30 s. It is evident that the surge, heave, and pitch RAOs of the platform are quite small within the wave period of 5–15 s, where the majority of energy is concentrated, regardless of the presence of nets. The corresponding surge RAOs are less than 1 m, the heave RAOs are significantly smaller than 1 m, and the pitch RAOs are less than 1°. These results demonstrate the excellent hydrodynamic performance of the new platform. For wave periods larger than 15 s, under the conditions of H = 1 m, the impact of nets on the surge, heave, and pitch RAOs is minimal for most periods. However, the presence of nets reduces the RAOs near the natural period of heave and pitch, which may be attributed to the increased damping effect induced by the nets. Similar effects of nets on the peak RAOs of heave and pitch can be found in Figure 9 of [48]. For wave periods larger than 15 s, under the conditions of H = 3.5 m, the effects of nets on the RAOs are complex. The existence of nets reduces the values of surge and heave RAOs for most periods, but the opposite results are observed for the roll RAOs. Additionally, incident waves with larger wave height correspond to smaller surge, heave, and pitch RAOs of the platform for wave periods larger than 15 s.

4.3. Dynamic Response in Waves, Winds, and Currents

For each loading case, five random waves with different seed numbers are generated, and the simulation duration is set to three hours. The calculations for determining the response of the platform’s motion and the line tension were conducted using a time step of 0.01 s. In the analysis, the results of the first 1000 s are truncated for reliability purposes. The tension of mooring lines and the motions of six-degree-of-freedom of the platform are calculated in accordance with the rules [42].
The safety factor is defined as the ratio of the minimum breaking load on the mooring line to the maximum tension of the mooring line. For the dynamic analysis method, the safety factor of the mooring line is 1.67 for intact survival conditions and 1.25 for damaged survival conditions. The permissible mean and maximum offsets are generally specified based on the water depth of operating areas, environmental conditions, clearance requirements, and limitations of the system [42].

4.3.1. Mooring Line Tension

Table 9 presents the statistics of the mooring line tension (the average value of the results obtained from five different seed numbers) under various loading cases for survival conditions. The statistics of mooring line tension for operation conditions are omitted to reduce the length of this paper. For intact survival conditions, the maximum tension occurs in Line 1, which is 2460 kN when the wave, wind, and current approach simultaneously from 90° (LC5). For damaged survival conditions, the maximum tension occurs in Line 2, which is 3337 kN. It also occurs when the wave, wind, and current come from 90° simultaneously (LC10). The minimum safety factor of all mooring lines for all intact survival conditions is 1.81 in LC5, which exceeds the CCS requirement of 1.67. Similarly, the minimum safety factor of all mooring lines for all damaged survival conditions is 1.33 in LC10, exceeding the CCS requirement of 1.25. For all the loading cases, the safety factors of the mooring lines meet the design rule requirements. Consequently, the mooring system designed for this semi-submersible aquaculture platform can be deemed reliable. For both the intact survival conditions and the damaged survival conditions, the most critical loading case occurs when the wave, wind, and current have an incident angle of 90°. The reason is that the platform has a larger lateral area. When the incident wave, wind, and current are transverse, the platform is subject to greater forces. When one of the two mooring lines in the same group is damaged, the tension of the remaining mooring line increases significantly. For example, when comparing the conditions LC5 and LC10, the maximum line tension of Line 2 increases from 1262 kN to 3337 kN, representing a significant increase of 164%. Additionally, the average line tension of Line 2 increases from 285 kN to 937 kN, which corresponds to a substantial increase of 228%.
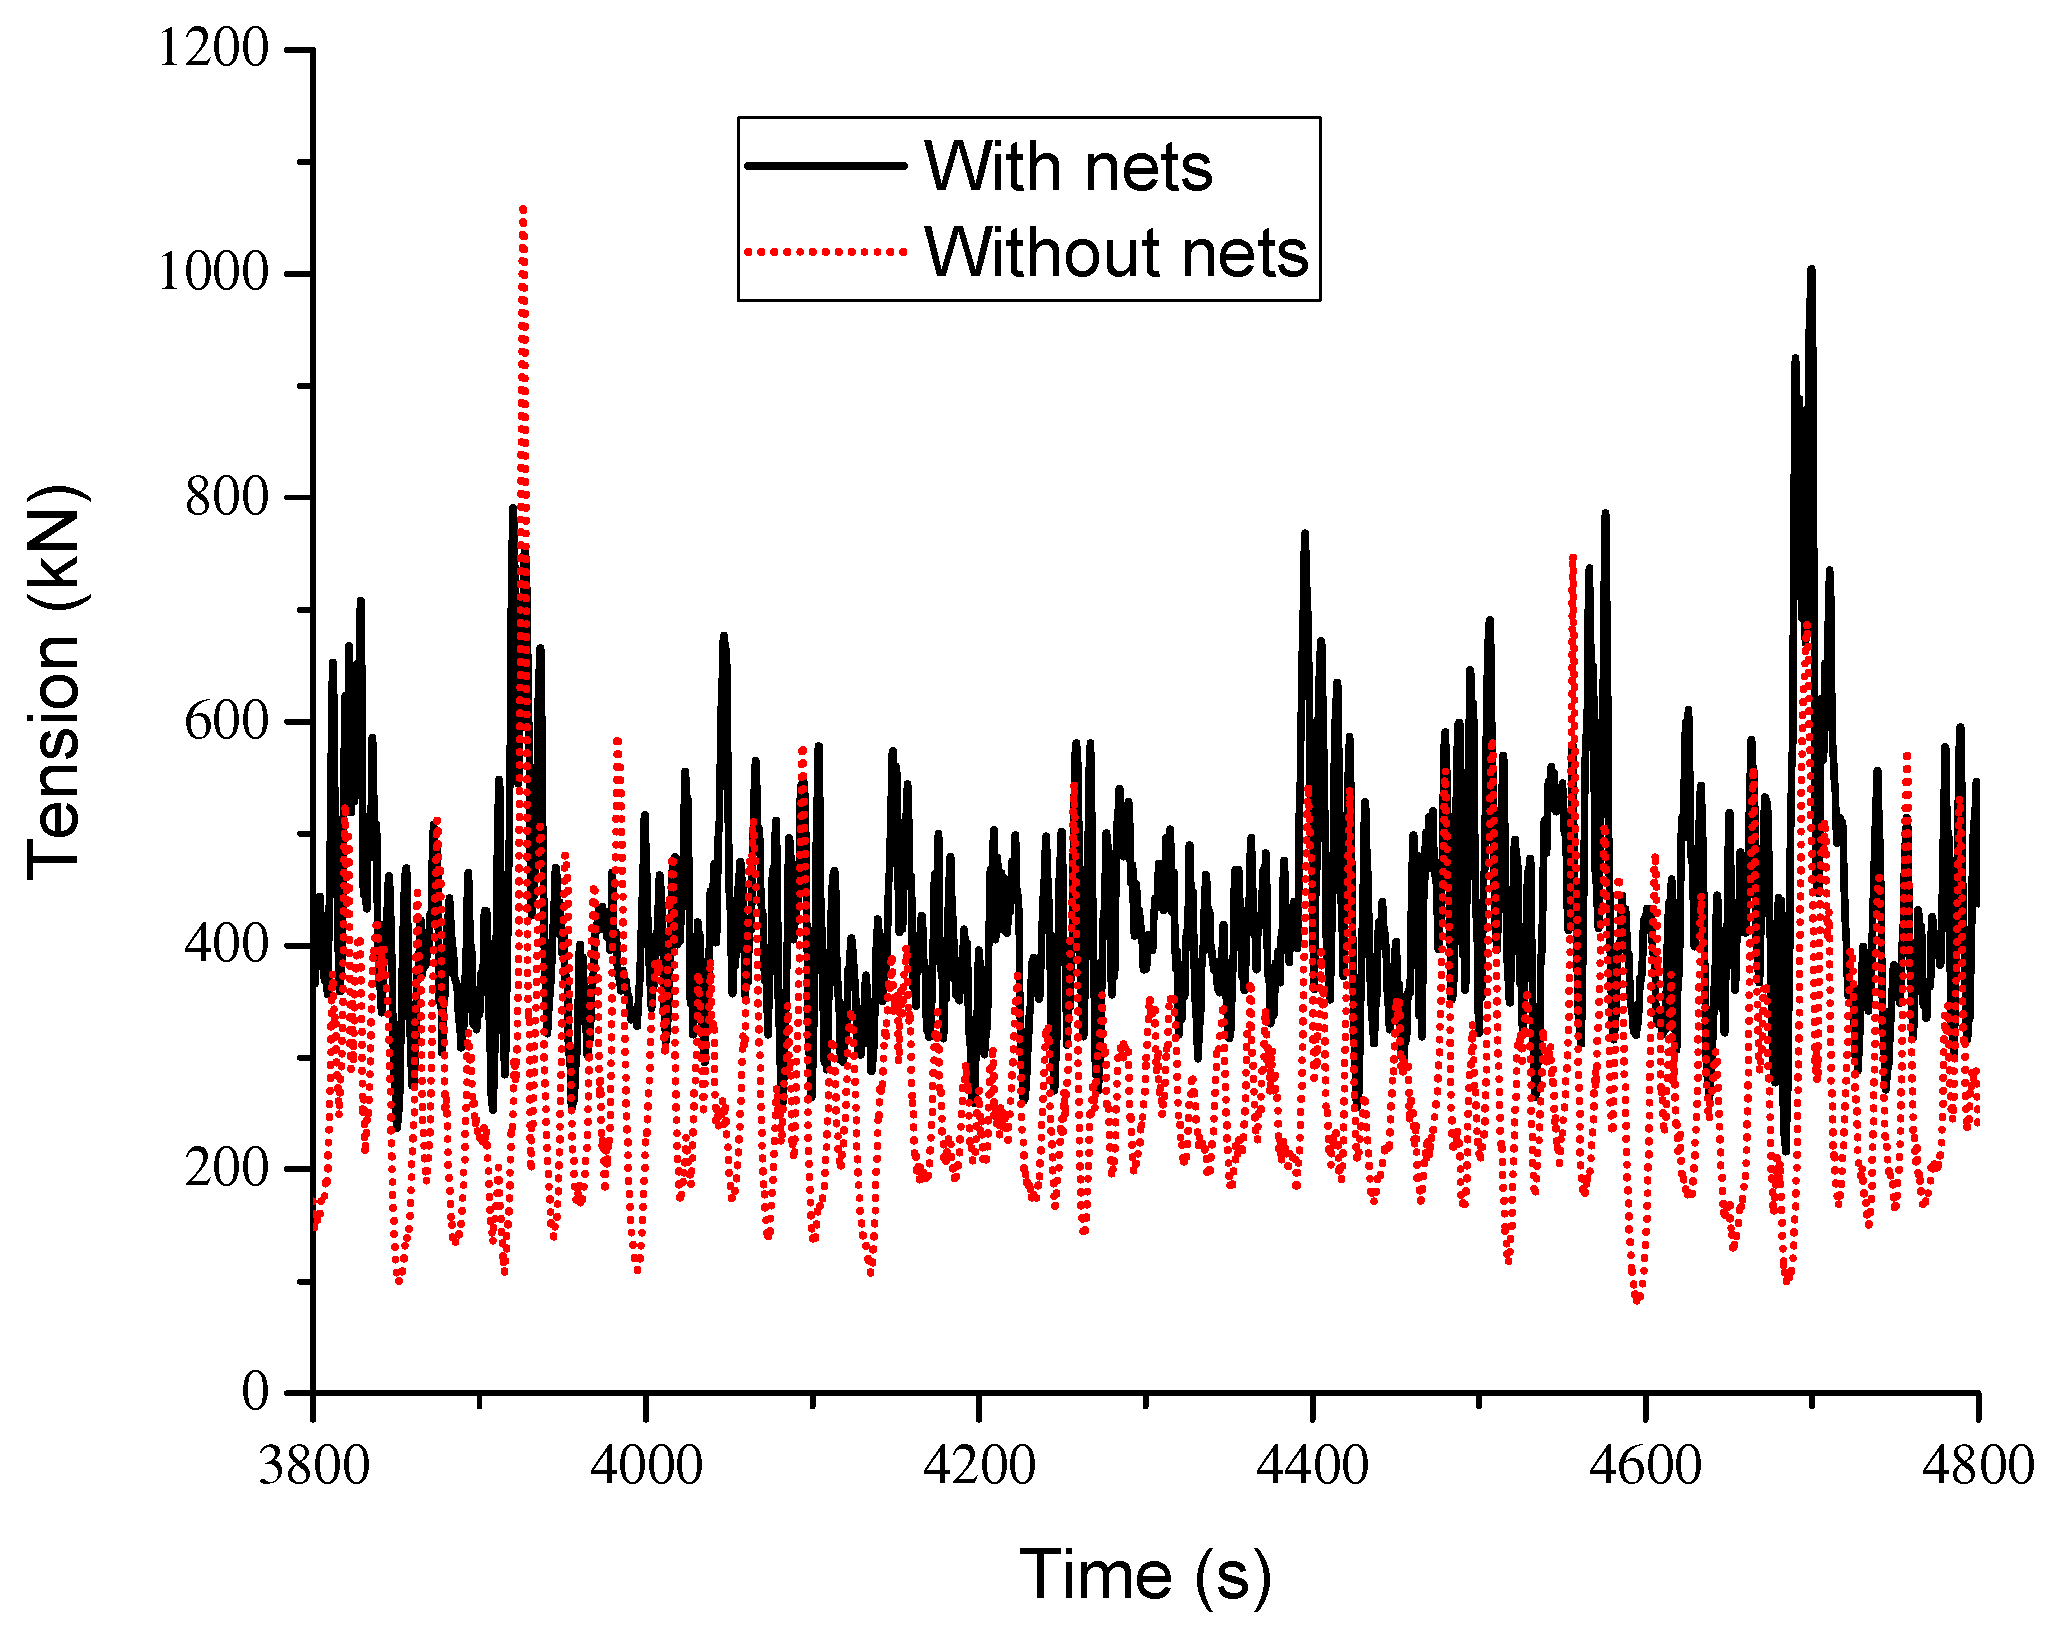
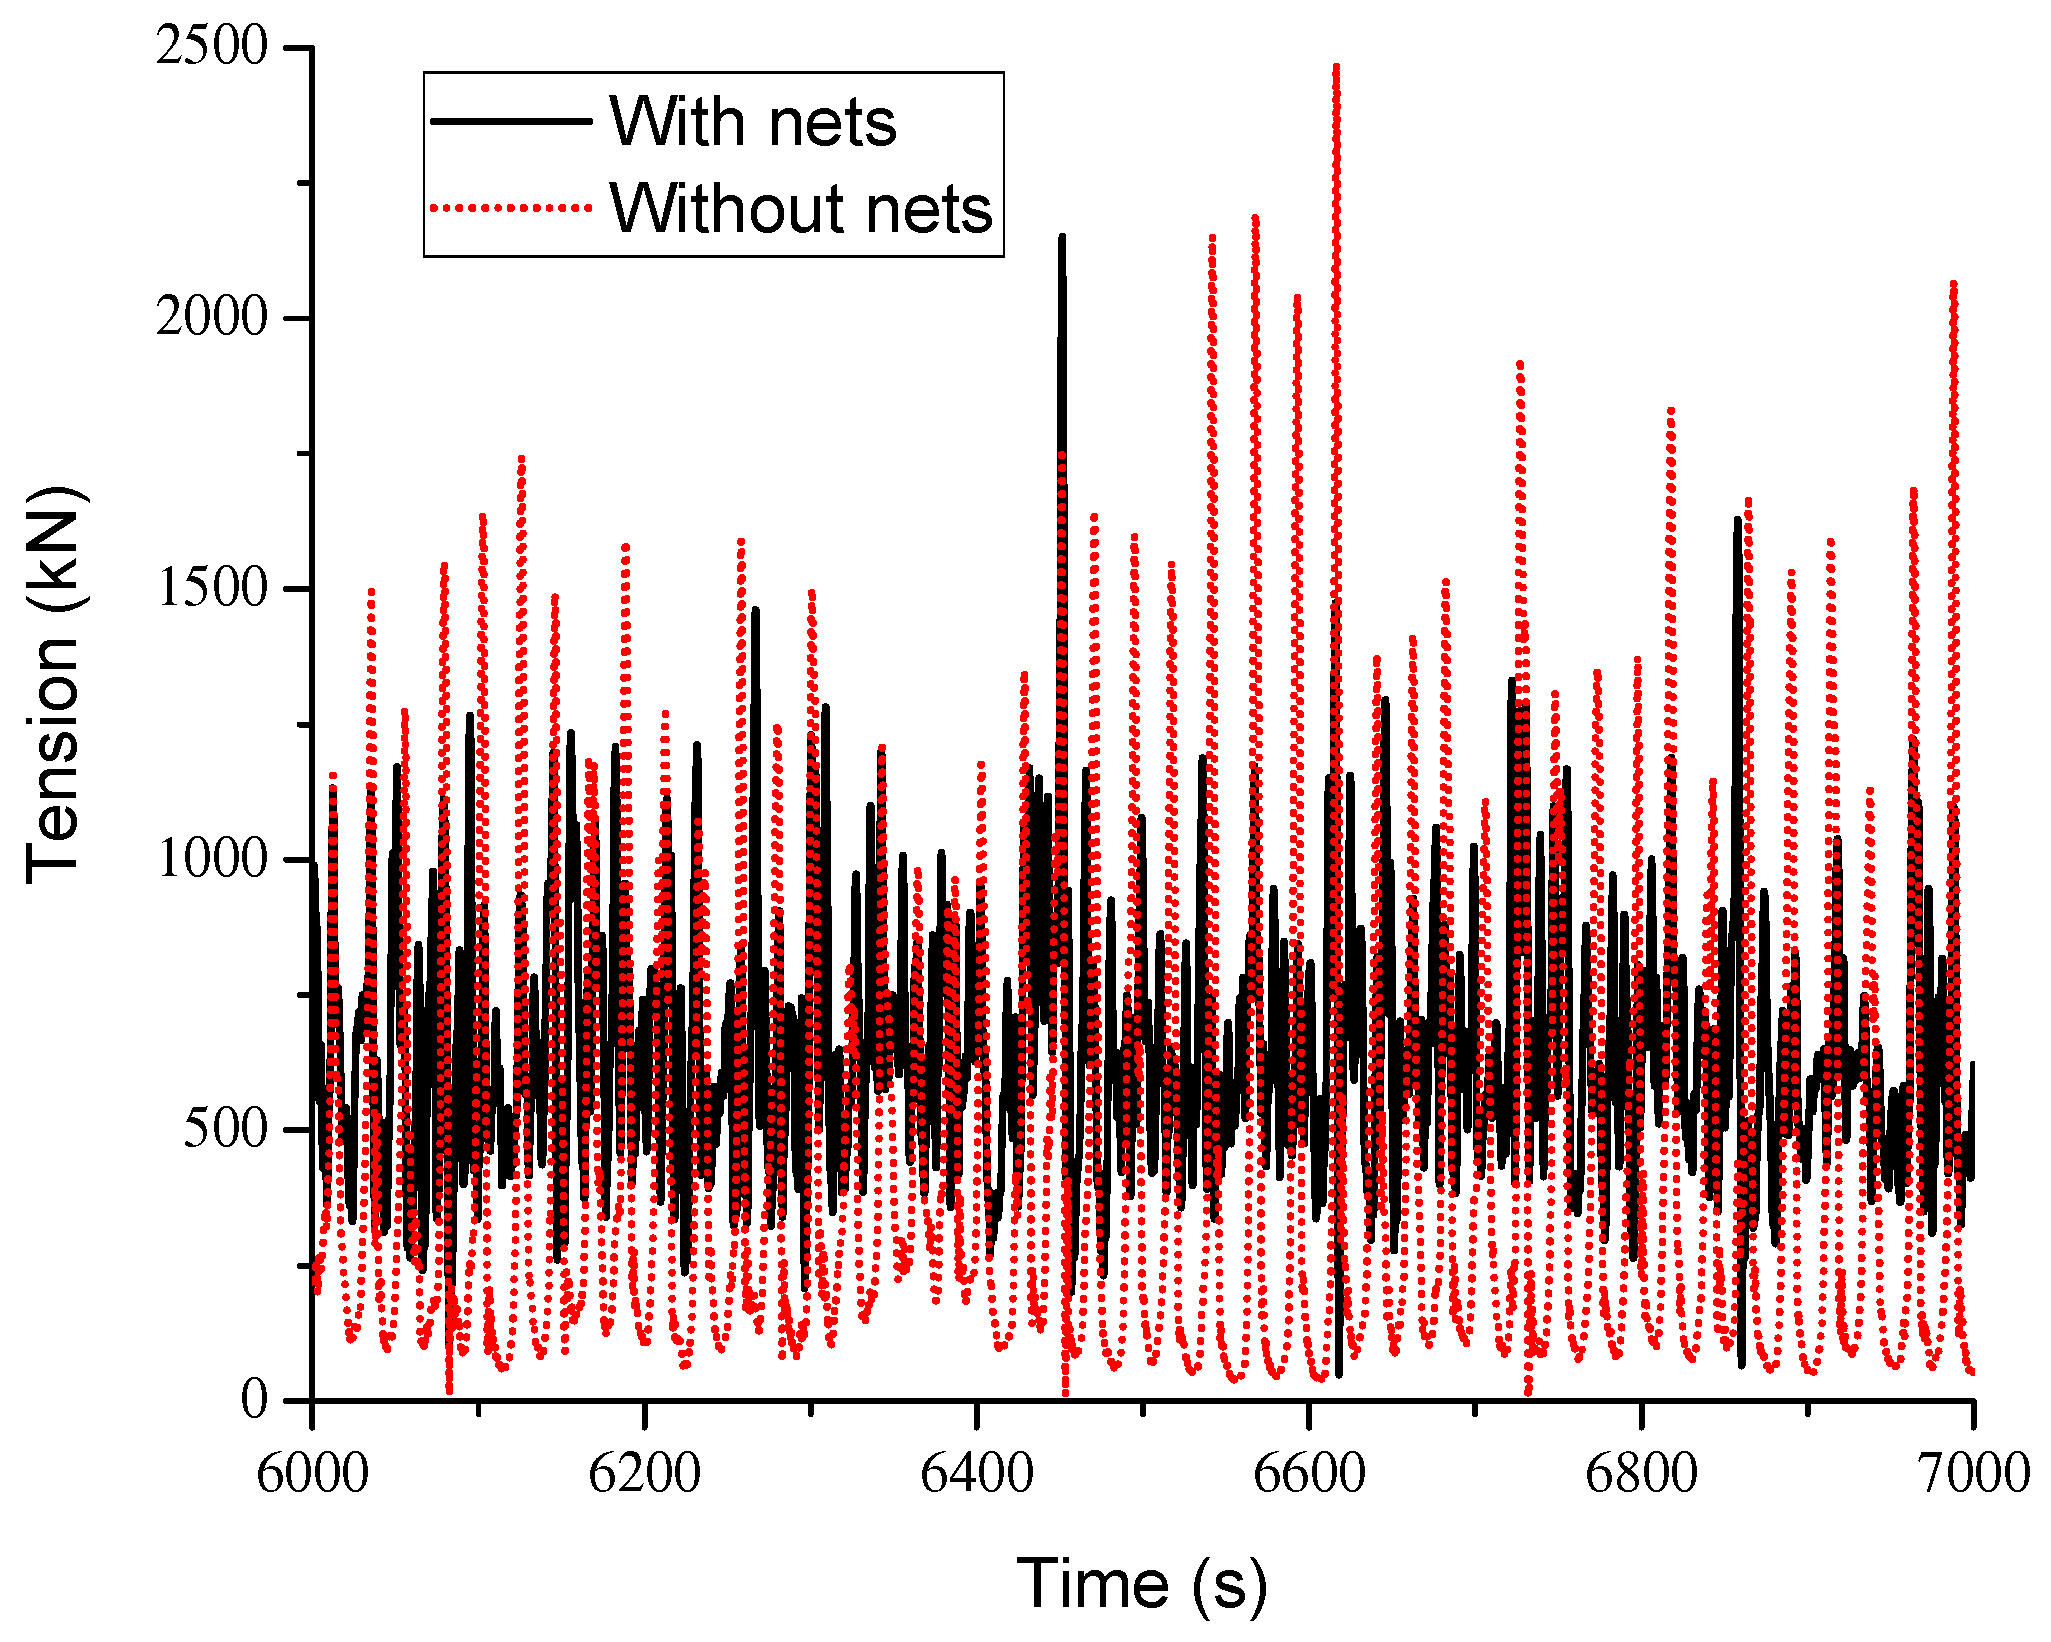
Three typical loading cases (LC1, LC3, and LC5), were considered to analyze the net effects on the mooring line tension. Table 10 presents the statistics of the tension of the weakest mooring line under these conditions. It is evident that for all these loading cases, there are significant differences among the maximum, minimum and mean mooring line tensions, which is also verified by the standard deviation. For instance, the minimum and mean tensions of Line 1 for LC5 without nets are 2 kN and 420 kN, respectively. However, the maximum tension of Line 1 is 2471 kN, representing an increase of 488% compared with the mean tension. Moreover, it can be observed that the average and minimum mooring line tensions with nets are larger than those without nets, while the maximum mooring line tension with nets is smaller than that without nets. This suggests that the presence of nets enhances the safety of the entire mooring system, as it is determined by the maximum value of the mooring line. Li et al. [24] also investigated the net effects on the mooring line tension and found that the presence of nets can alleviate the maximum mooring line tension in pure wave conditions. However, when the current coming from the same direction as the wave is included, the different solidity ratio of nets can either increase or decrease the maximum mooring line tension compared with the case without nets. This implies that, for the platform in this study, changes in the solidity ratio of nets and current may also increase the maximum mooring line tension, contrary to the results shown in Table 10.
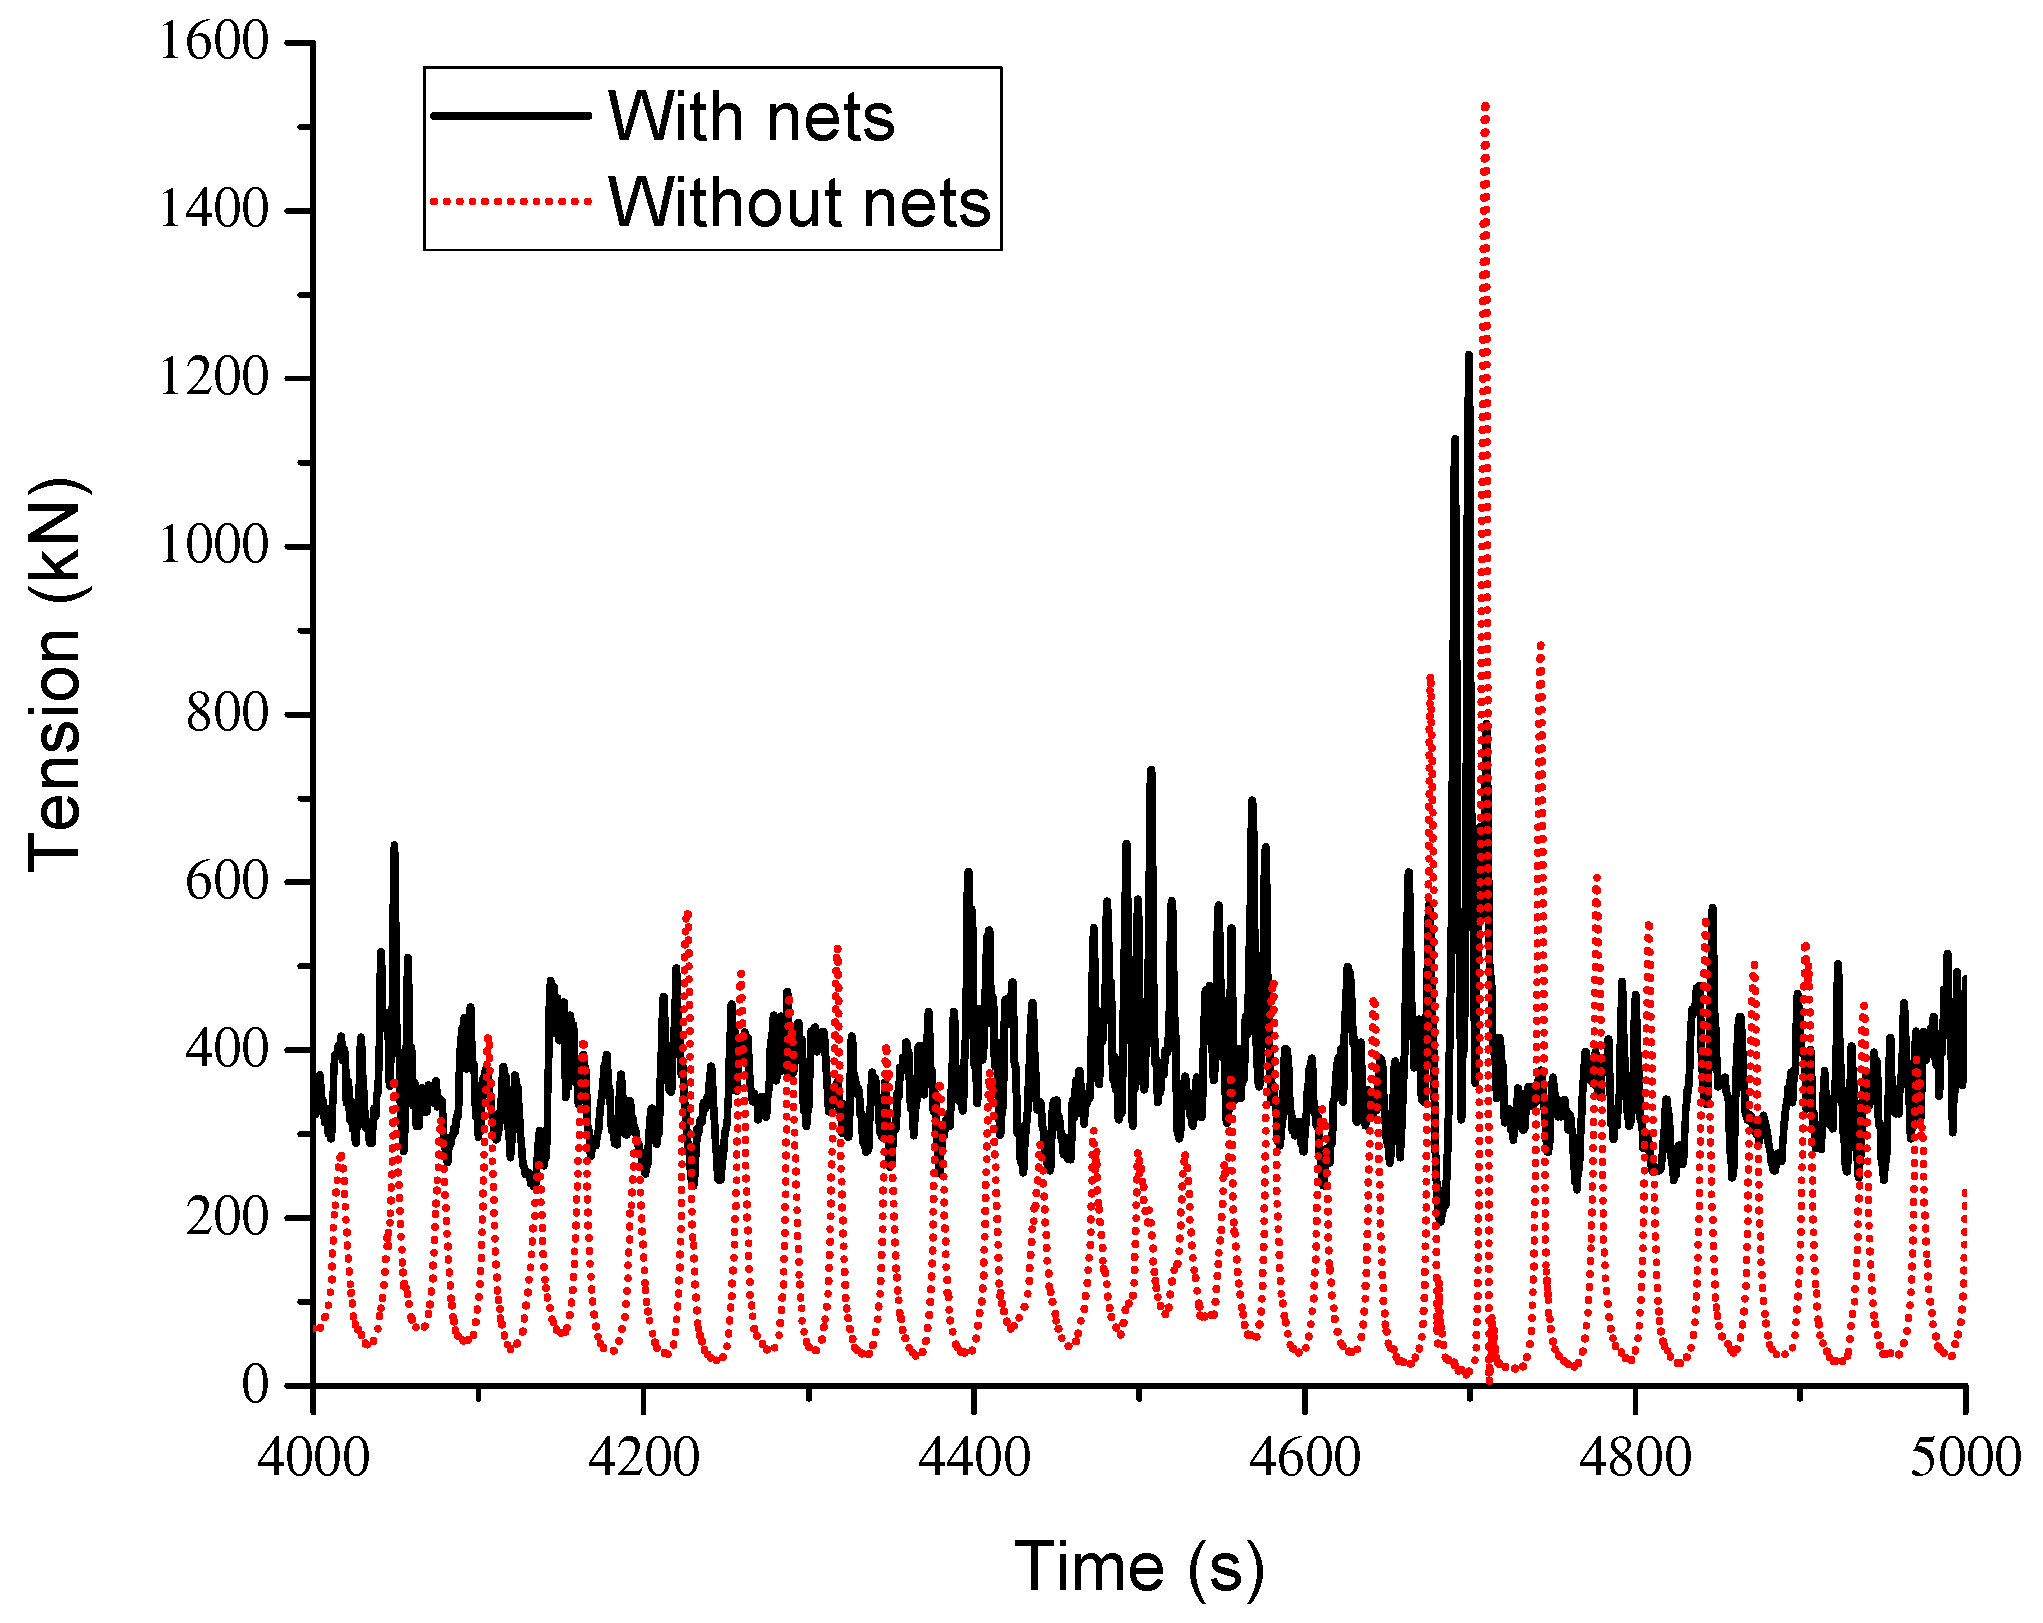
Figure 20, Figure 21 and Figure 22 illustrate the segments of time histories of the mooring line tension where the maximum line tension occurs. Under the conditions LC1 and LC3, the mooring line tension with nets is generally larger than that without nets. However, the maximum mooring line tension exists in the case with nets, which is consistent with the results in Table 10. Under the conditions LC5, both the maximum mooring line tension and the variation range of mooring line tension with nets are larger than those without nets.

4.3.2. Six-Degree-of-Freedom Motion

Table 11 presents the statistics of the motion of six-degree-of-freedom at the center of gravity (the average value of the results obtained from five different seed numbers) under various loading cases for survival conditions. The statistics of motion for operation conditions are omitted to reduce the length of this paper. It is observed that the motion of six-degree-of-freedom is acceptable for the platform operated in the specific sea area.
The minimum amplitude of surge motion is observed at the condition LC5, as the loads at a heading angle of 90° have little impact on surge motion. However, the maximum amplitude of surge motion is observed at the condition LC4, rather than LC1. This is likely due to the asymmetry in the longitudinal direction. Similar results for the amplitude of surge motion can be found for damaged survival conditions. The amplitude of sway motion increases gradually with the incident angle gradually varying from 180° (LC1) to 90° (LC5), for both intact and damaged survival conditions. The sway motion is minimally impacted by the condition of the mooring lines. Under the conditions LC1, LC2, and LC3, the amplitude of heave motion is almost the same, measuring 0.88 m for LC1, 0.87 m for LC2, and 0.85 m for LC3. Under the condition LC4, the amplitude of heave motion increases to 1.34 m, a 58% increase compared with the condition LC3. The maximum amplitude of heave motion, reaching 2.22 m, is observed at the condition LC5. This indicates that the loads of 90° heading angle have the largest effects on the motion of heave, which is consistent with the variation of the mooring line tension of Line 1. The differences in heave motion between intact and damaged survival conditions are not significant. It is found that the amplitude of roll motion increases as the incident angle gradually changes from 180° (LC1) to 90° (LC5), with the largest amplitude of 8.96° occurring at the condition LC5. When one of the mooring lines is damaged, the change in roll motion is not noticeable compared with the intact survival condition. Similar to the variation observed in surge motion amplitude, the maximum amplitude of pitch motion is observed at the condition LC4, rather than the condition LC1. The maximum value of pitch motion is 3.41°. Under the conditions LC1 and LC5, the motion of the yaw is quite small. However, the amplitude of yaw motion increases obviously under the condition LC3 for both the intact survival and damaged survival conditions.
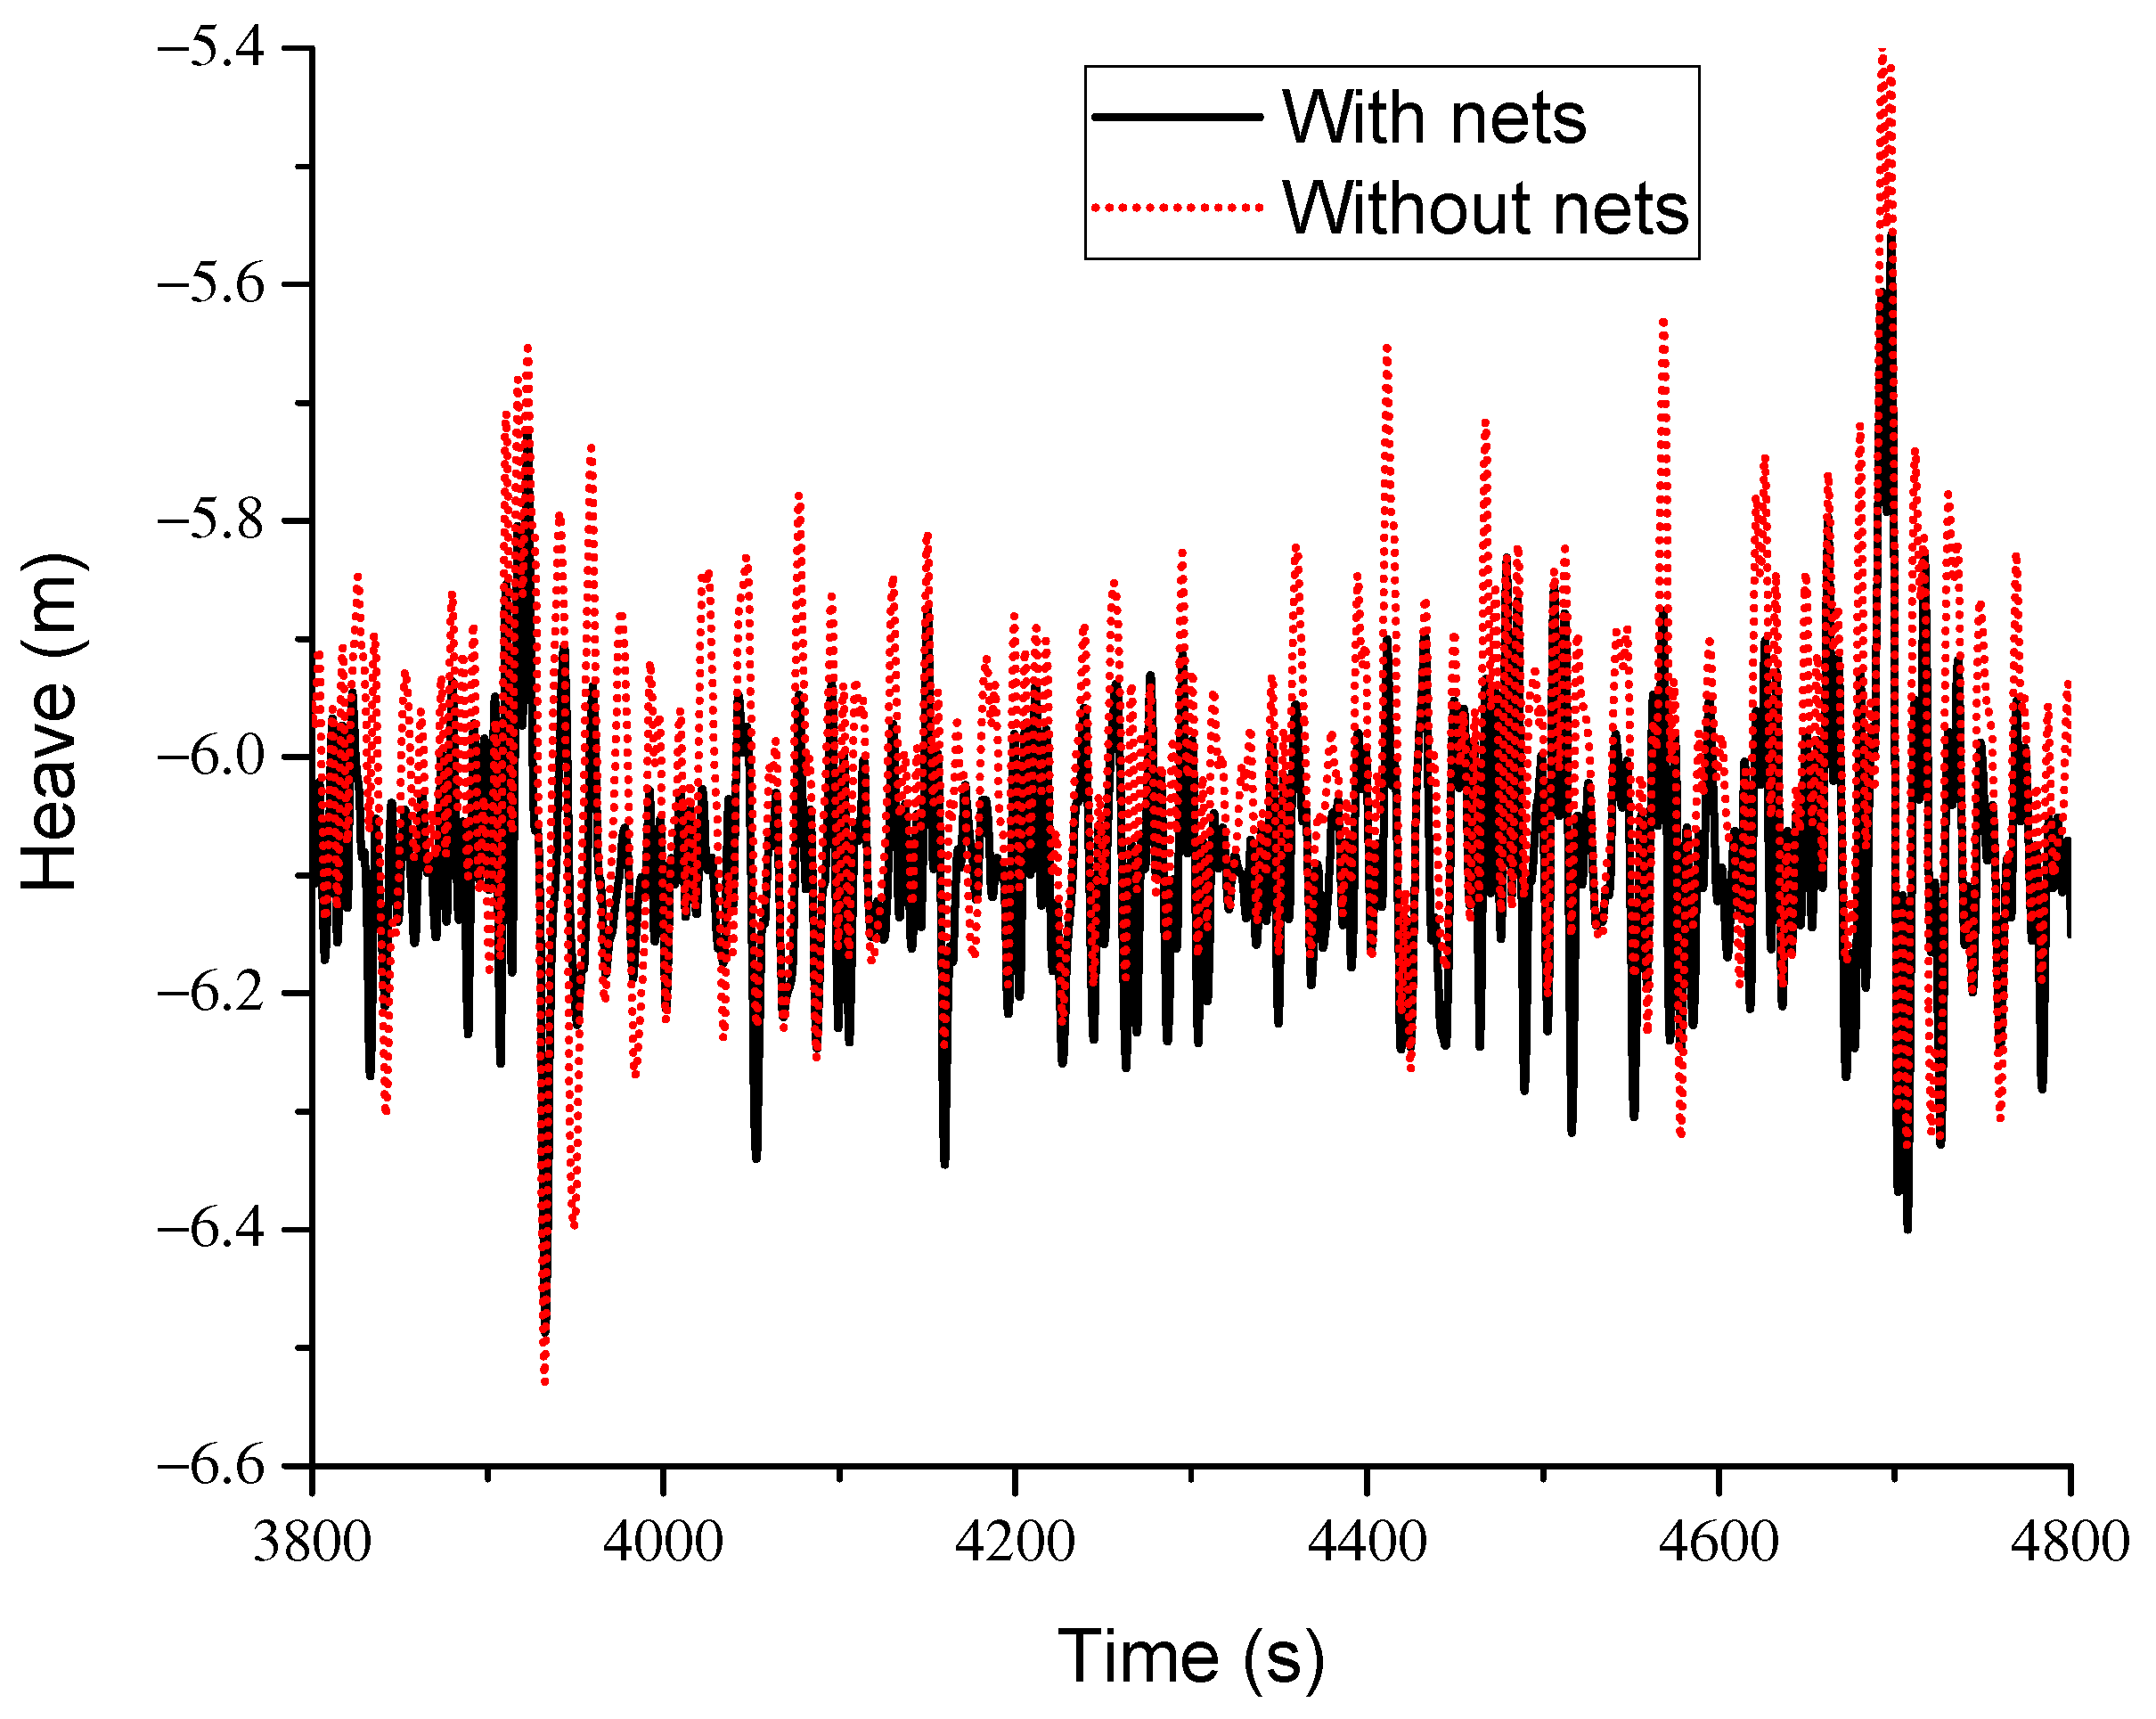
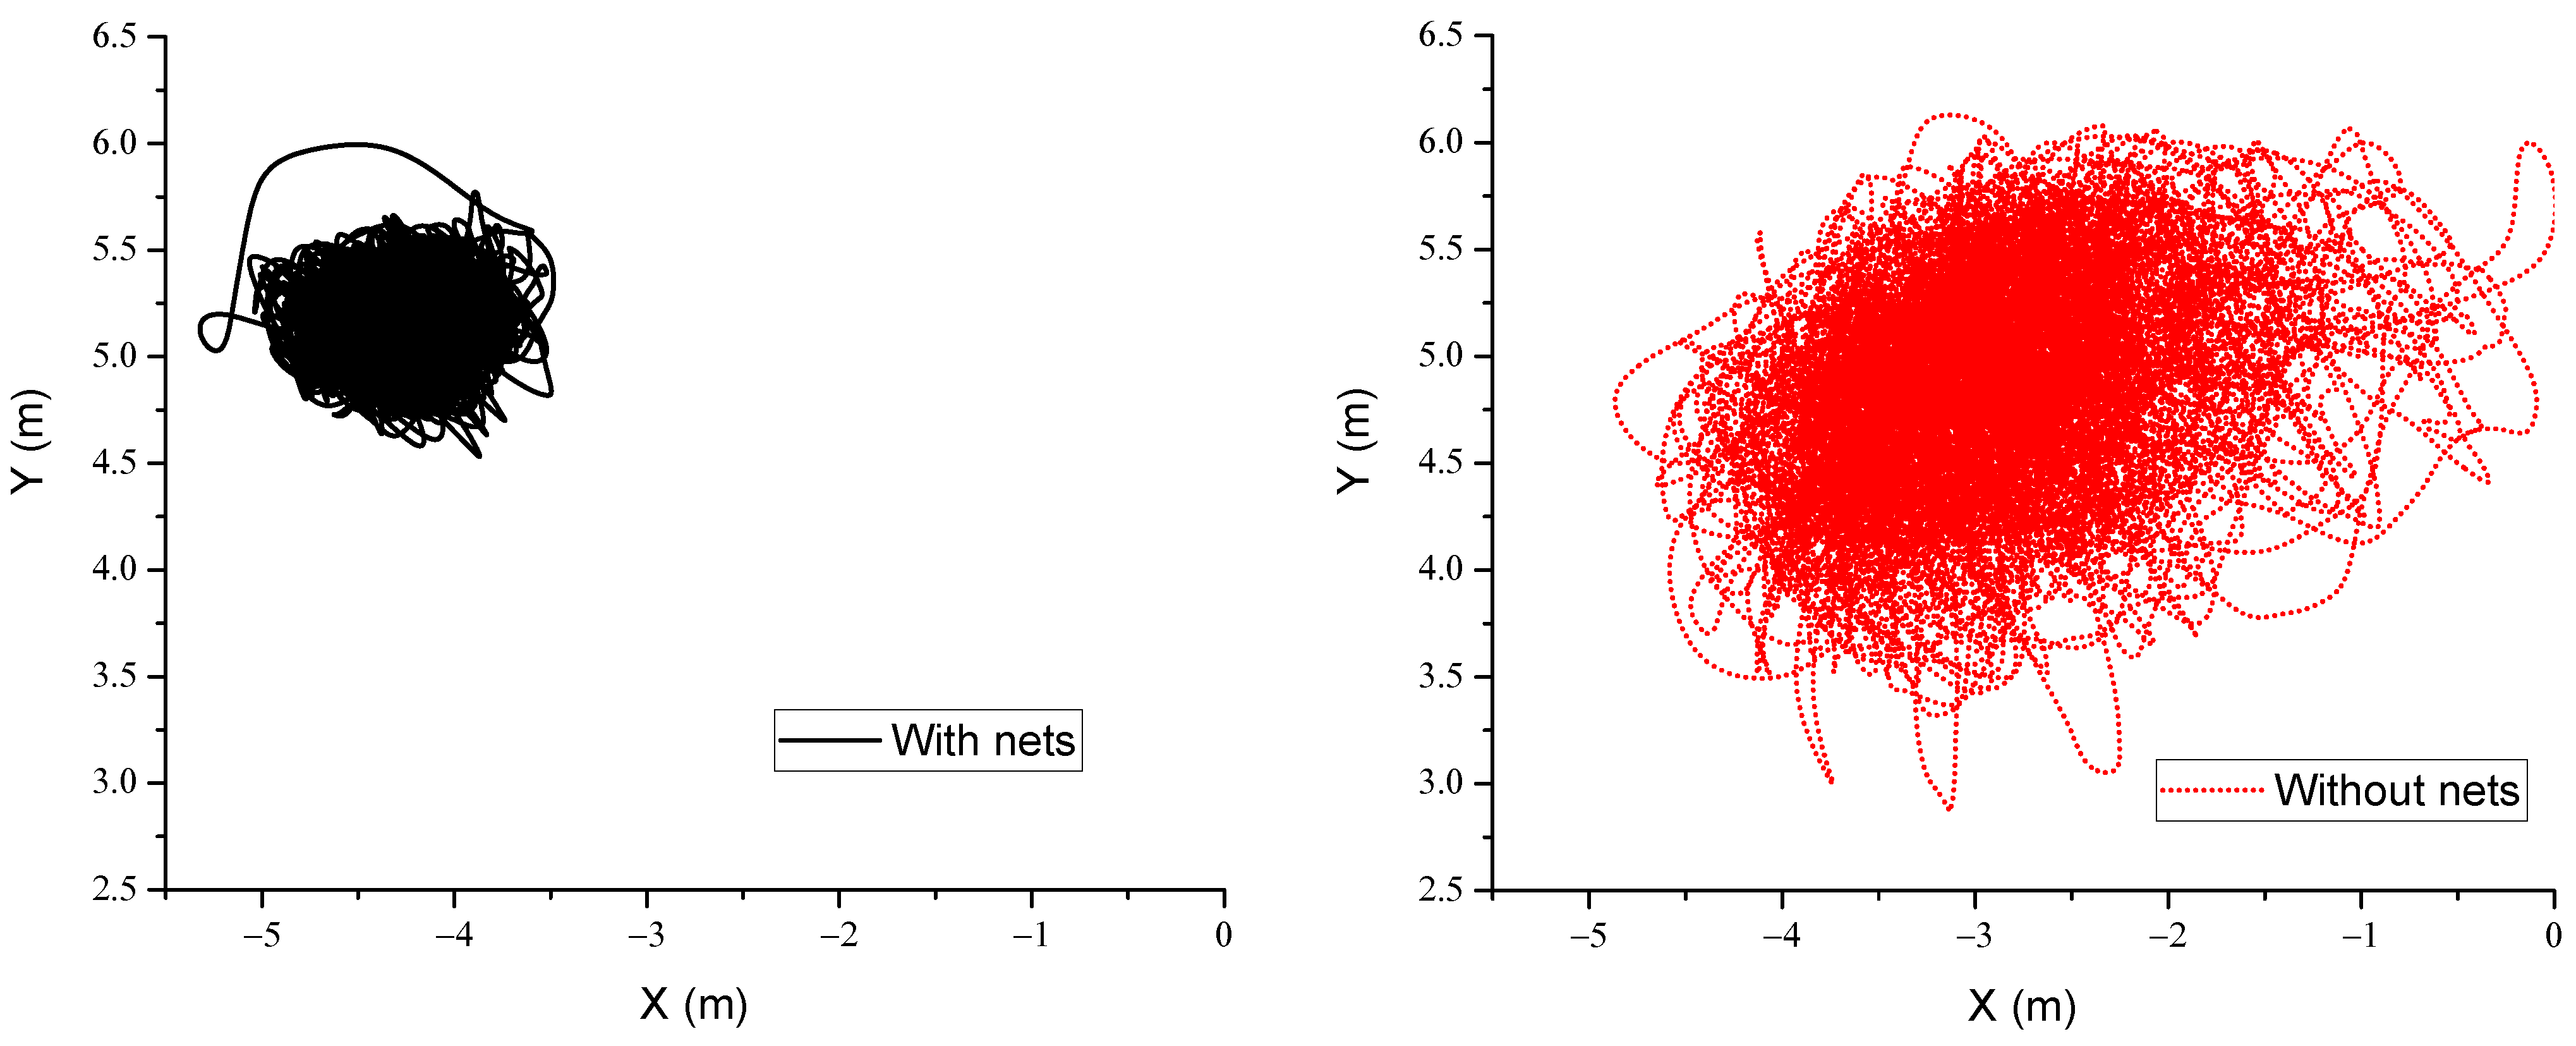
The typical loading case of LC3 is further considered to analyze the effects of nets on the six-degree-of-freedom motion of the platform. Table 12 presents the statistics of the motion of six-degree-of-freedom under the condition LC3. It is found that the range of roll motion without nets increases significantly compared with the case with nets. The amplitude varies from 4.55° to 6.59°, with an increase of 45%. Compared with the case with nets, the range of pitch motion without nets increases slightly, and the amplitude changes from 5.45° to 5.83°, with an increase of 7%. Compared with the case with nets, the range of yaw motion without nets also increases slightly by 7%. The range of heave motion without nets significantly increased from 1.66 m to 2.27 m compared with the case with nets, with an increase of 36%. Lei et al. [48] investigated the effects of nets on the motion of a floating offshore wind turbine with a steel fish farming cage (FOWT-SFFC) and found that the presence of nets can also alleviate the motion of FOWT-SFFC under certain conditions.
Figure 23 shows the partial results of the whole-time histories of the heave of the platform under the condition LC3. Figure 24 shows the planar motion of the platform in the whole-time histories under the condition LC3. From Figure 23, it is observed that the variation range of heave motion with nets is apparently smaller than that without nets. From Figure 24, it is observed that the range of the whole plane motion becomes larger significantly without nets, and both the amplitude ranges of the sway and the surge obviously increase, compared with those with nets. These findings imply that the presence of nets alleviates the motion response of the platform.

5. Conclusions

In this paper, a numerical study of the hydrodynamic performance of a newly designed semi-submersible aquaculture platform, developed by GIEC and put into operation, is conducted. The present study proposes a numerical model that considers the semi-submersible main structure, the net system, and the mooring system to accurately capture the dynamic response of the platform under wave, wind, and current conditions. The wave force is calculated based on the linear potential theory and the boundary element method. The wind force and current force are calculated according to the rules of CCS. The net system is modeled based on the Morison equation and the equivalent simulation. The mooring system is modeled based on the lumped-mass method and the finite element method. Hydrodynamic coefficients and wave forces are calculated by the software HydroStar. The fully coupled motion equation is solved by the software OrcaFlex.
The main findings of this study are summarized as follows: Firstly, the reliability of the middle-field method to calculate the second wave force is confirmed through comparing the results of the far-field method and the middle-field method for the mean drift wave force. Secondly, the analysis of the hydrodynamic performance of the platform in regular waves reveals that the natural period of the platform is far away from the common wave period in the specific sea area where the project is located. Thirdly, when subjected to a combination of waves, winds, and currents, the maximum tension of the mooring line is found to be 2460 kN with a safety factor of 1.81 for intact survival conditions and 3337 kN with a safety factor of 1.33 for damaged survival conditions. These parameters meet the requirements guided by CCS, indicating the reliability of the designed mooring system. Furthermore, the motion of six-degree-of-freedom is deemed acceptable for the platform’s operation in the specific sea area. Lastly, the net system is found to have noticeable effects on the hydrodynamic performance of the platform. Unter certain conditions, the maximum mooring line tension with nets is smaller than that without nets. The range of roll motion without nets is increased by 45% compared with the case with nets, and the range of heave motion without nets is increased by 36% compared with the case with nets. Therefore, it is recommended that the net system should be carefully considered during the design stage to ensure the platform’s ability to maintain safety in severe environments.
This study provides valuable insights for researchers and engineers to design and optimize this kind of semi-submersible aquaculture platform in the future. However, it is important to acknowledge several limitations of this study and identify future research directions. Firstly, the linearized potential flow models utilized in this study do not incorporate the nonlinearity caused by breaking waves. To accurately capture these nonlinear effects, advanced numerical methods such as computational fluid dynamics (CFD) simulations should be employed in future studies. Secondly, this study does not consider the installation of Sharp Eagle wave energy converters on the platform. Investigating the effects of these converters on the hydrodynamic performance of the platform should be a priority for future research. Lastly, the mooring system modeled in this study is relatively simple. Future investigations should focus on exploring more complex mooring systems to better understand their impact on the platform’s performance. By acknowledging these limitations and suggesting future research directions, this study lays the foundation for continued exploration and advancement for this kind of platform.

Author Contributions

Conceptualization, W.-W.D., Y.-Z.L. and S.-W.S.; methodology, W.-W.D., J.-Q.J. and Y.-Z.L.; software, W.-W.D. and Y.-Z.L.; validation, W.-W.D. and W.-Z.Y.; formal analysis, W.-W.D., J.-Q.J. and W.-S.W.; investigation, W.-W.D. and M.C.; resources, W.-W.D.; data curation, W.-W.D. and M.C.; writing—original draft preparation, W.-W.D., W.-Z.Y. and M.C.; writing—review and editing, W.-W.D., J.-Q.J., W.-Z.Y., Y.-Z.L., W.-S.W., S.-W.S. and M.C.; visualization, W.-W.D.; supervision, S.-W.S.; project administration, S.-W.S.; funding acquisition, W.-W.D. and S.-W.S. All authors have read and agreed to the published version of the manuscript.

Funding

This research was supported by the National Key R&D Program of China, grant number 2019YFB1504403; Research and Development Projects in Key Areas of Guangdong Province, grant number 2021B0202070002; Innovation Academy of South China Sea Ecology and Environmental Engineering, grant number ISEE2021ZD04; the Key Special Project for Introduced Talents Team of Southern Marine Science and Engineering Guangdong Laboratory (Guangzhou), grant number GML2019ZD0107 and the Key Laboratory of Renewable Energy, Chinese Academy of Sciences, grant number E129060101.

Institutional Review Board Statement

Not applicable.

Informed Consent Statement

Not applicable.

Data Availability Statement

The data used to support the findings of this study are available from the corresponding author upon request. The data are not publicly available due to privacy.

Conflicts of Interest

The authors declare no conflict of interest.

References

  1. Grigorakis, K.; Rigos, G. Aquaculture effects on environmental and public welfare—The case of Mediterranean mariculture. Chemosphere 2011, 85, 899–919. [Google Scholar] [CrossRef]
  2. Ferreira, J.; Saurel, C.; e Silva, J.L.; Nunes, J.; Vazquez, F. Modelling of interactions between inshore and offshore aquaculture. Aquaculture 2014, 426–427, 154–164. [Google Scholar] [CrossRef]
  3. Fredriksson, D.W.; Swift, M.; Irish, J.D.; Tsukrov, I.; Celikkol, B. Fish cage and mooring system dynamics using physical and numerical models with field measurements. Aquac. Eng. 2003, 27, 117–146. [Google Scholar] [CrossRef]
  4. Lader, P.; Enerhaug, B. Experimental Investigation of Forces and Geometry of a Net Cage in Uniform Flow. IEEE J. Ocean. Eng. 2005, 30, 79–84. [Google Scholar] [CrossRef]
  5. Zhao, Y.-P.; Li, Y.-C.; Dong, G.-H.; Gui, F.-K.; Teng, B. A numerical study on dynamic properties of the gravity cage in combined wave-current flow. Ocean Eng. 2007, 34, 2350–2363. [Google Scholar] [CrossRef]
  6. Huang, C.-C.; Tang, H.-J.; Liu, J.-Y. Effects of waves and currents on gravity-type cages in the open sea. Aquac. Eng. 2008, 38, 105–116. [Google Scholar] [CrossRef]
  7. Dong, G.-H.; Xu, T.-J.; Zhao, Y.-P.; Li, Y.-C.; Gui, F.-K. Numerical simulation of hydrodynamic behavior of gravity cage in irregular waves. Aquac. Eng. 2010, 42, 90–101. [Google Scholar] [CrossRef]
  8. Li, L.; Fu, S.; Xu, Y.; Wang, J.; Yang, J. Dynamic responses of floating fish cage in waves and current. Ocean Eng. 2013, 72, 297–303. [Google Scholar] [CrossRef]
  9. Li, L.; Fu, S.; Xu, Y. Nonlinear hydroelastic analysis of an aquaculture fish cage in irregular waves. Mar. Struct. 2013, 34, 56–73. [Google Scholar] [CrossRef]
  10. Shainee, M.; DeCew, J.; Leira, B.J.; Ellingsen, H.; Fredheim, A. Numerical simulation of a self-submersible SPM cage system in regular waves with following currents. Aquac. Eng. 2013, 54, 29–37. [Google Scholar] [CrossRef]
  11. Shainee, M.; Leira, B.J.; Ellingsen, H.; Fredheim, A. Investigation of a self-submersible SPM cage system in random waves. Aquac. Eng. 2014, 58, 35–44. [Google Scholar] [CrossRef]
  12. Cifuentes, C.; Kim, M. Hydrodynamic response of a cage system under waves and currents using a Morison-force model. Ocean Eng. 2017, 141, 283–294. [Google Scholar] [CrossRef]
  13. Shen, Y.; Greco, M.; Faltinsen, O.M.; Nygaard, I. Numerical and experimental investigations on mooring loads of a marine fish farm in waves and current. J. Fluids Struct. 2018, 79, 115–136. [Google Scholar] [CrossRef]
  14. Liu, Z.; Wang, S.; Soares, C.G. Numerical Study on the Mooring Force in an Offshore Fish Cage Array. J. Mar. Sci. Eng. 2022, 10, 331. [Google Scholar] [CrossRef]
  15. Liu, H.-F.; Bi, C.-W.; Xu, Z.; Zhao, Y.-P. Numerical study on the flow environment for a novel design of net cage with a shielding device. Ocean Eng. 2022, 243, 110345. [Google Scholar] [CrossRef]
  16. SalMar. Offshore Fish Farming—A New Era in Fish Farming Is on Its Way. Available online: https://www.salmar.no/en/offshore-fish-farming-a-new-era/ (accessed on 10 July 2022).
  17. Dou, R. Numerical Modeling and Analysis of a Semi-Submersible Fish-Cage. Master’s Thesis, Norwegian University of Science and Technology, Trondheim, Norway, June 2018. [Google Scholar]
  18. Jin, J.; Su, B.; Dou, R.; Luan, C.; Li, L.; Nygaard, I.; Fonseca, N.; Gao, Z. Numerical modelling of hydrodynamic responses of Ocean Farm 1 in waves and current and validation against model test measurements. Mar. Struct. 2021, 78, 103017. [Google Scholar] [CrossRef]
  19. Yu, Z.; Amdahl, J.; Kristiansen, D.; Bore, P.T. Numerical analysis of local and global responses of an offshore fish farm subjected to ship impacts. Ocean Eng. 2019, 194, 106653. [Google Scholar] [CrossRef]
  20. Zhao, Y.; Guan, C.; Bi, C.; Liu, H.; Cui, Y. Experimental Investigations on Hydrodynamic Responses of a Semi-Submersible Offshore Fish Farm in Waves. J. Mar. Sci. Eng. 2019, 7, 238. [Google Scholar] [CrossRef]
  21. Liu, H.-F.; Bi, C.-W.; Xu, Z.; Zhao, Y.-P. Hydrodynamic assessment of a semi-submersible aquaculture platform in uniform fluid environment. Ocean Eng. 2021, 237, 109656. [Google Scholar] [CrossRef]
  22. Nordlaks. About the Havfarm Projects. Available online: https://www.nordlaks.no/utvikling/om-havfarm-prosjektet (accessed on 10 July 2022).
  23. Li, L.; Jiang, Z.; Ong, M.C. A Preliminary Study of a Vessel-Shaped Offshore Fish Farm Concept. In Proceedings of the 36th International Conference on Ocean, Offshore and Arctic Engineering, Trondheim, Norway, 25–30 June 2017. [Google Scholar]
  24. Li, L.; Jiang, Z.; Høiland, A.V.; Ong, M.C. Numerical Analysis of a Vessel-Shaped Offshore Fish Farm. J. Offshore Mech. Arct. Eng. Trans. ASME 2018, 140, 041201. [Google Scholar] [CrossRef]
  25. Li, L.; Jiang, Z.; Wang, J.; Ong, M.C. Numerical Study on the Heading Misalignment and Current Velocity Reduction of a Vessel-Shaped Offshore Fish Farm. J. Offshore Mech. Arct. Eng. Trans. ASME 2019, 141, 051602. [Google Scholar] [CrossRef]
  26. Li, L.; Jiang, Z.; Ong, M.C.; Hu, W. Design optimization of mooring system: An application to a vessel-shaped offshore fish farm. Eng. Struct. 2019, 197, 109363. [Google Scholar] [CrossRef]
  27. Ma, C.; Zhao, Y.-P.; Bi, C.-W. Numerical study on hydrodynamic responses of a single-point moored vessel-shaped floating aquaculture platform in waves. Aquac. Eng. 2022, 96, 102216. [Google Scholar] [CrossRef]
  28. Ma, C.; Bi, C.-W.; Xu, Z.; Zhao, Y.-P. Dynamic behaviors of a hinged multi-body floating aquaculture platform under regular waves. Ocean Eng. 2022, 243, 110278. [Google Scholar] [CrossRef]
  29. China Daily. Offshore Submersible Salmon Farm Ready for Launch. Available online: https://www.chinadaily.com.cn/a/201805/04/WS5aebddd4a3105cdcf651c013.html (accessed on 10 July 2022).
  30. Wang, G.; Martin, T.; Huang, L.; Bihs, H. A Numerical Study of the Hydrodynamics of an Offshore Fish Farm Using REEF3D. J. Offshore Mech. Arct. Eng. Trans. ASME 2022, 144, 021301. [Google Scholar] [CrossRef]
  31. Wang, G.; Martin, T.; Huang, L.; Bihs, H. Numerical investigation of the hydrodynamics of a submersible steel-frame offshore fish farm in regular waves using CFD. Ocean Eng. 2022, 256, 111528. [Google Scholar] [CrossRef]
  32. Miao, Y.-J.; Ding, J.; Tian, C.; Chen, X.-J.; Fan, Y.-L. Experimental and numerical study of a semi-submersible offshore fish farm under waves. Ocean Eng. 2021, 225, 108794. [Google Scholar] [CrossRef]
  33. Huang, X.-H.; Liu, H.-Y.; Hu, Y.; Yuan, T.-P.; Tao, Q.-Y.; Wang, S.-M.; Liu, Z.-X. Hydrodynamic performance of a semi-submersible offshore fish farm with a single point mooring system in pure waves and current. Aquac. Eng. 2020, 90, 102075. [Google Scholar] [CrossRef]
  34. Chu, Y.I.; Wang, C.M. Hydrodynamic Response Analysis of Combined Spar Wind Turbine and Fish Cage for Offshore Fish Farms. Int. J. Struct. Stab. Dyn. 2020, 20, 2050104. [Google Scholar] [CrossRef]
  35. ANSYS. Aqwa Theroy Manual; ANSYS, Inc.: Canonsburg, PA, USA, 2017. [Google Scholar]
  36. ANSYS. Design Modeler User Guide; ANSYS, Inc.: Canonsburg, PA, USA, 2012. [Google Scholar]
  37. IEA-OES. Annual Report: An Overview of Ocean Energy Activities in 2020; IEA-OES: Paris, France, 2021. [Google Scholar]
  38. Yue, W.; Wang, W.; Sheng, S.; Ye, Y.; Hong, T. Analysis of the wave load and dynamic response of a new semi-submersible wave-energy-powered aquaculture platform. Ocean Eng. 2022, 248, 110346. [Google Scholar] [CrossRef]
  39. China Daily. New Marine Platform to Transform Fishing and Tourism. Available online: http://www.chinadaily.com.cn/a/202204/07/WS624e58cda310fd2b29e55928.html (accessed on 10 July 2022).
  40. FZNEWS.COM.CN. The First Deep-Sea Agriculture and Fishing Tourism Platform in Fujian—“Mintou No.1” Sea Resort Hotel Holds a Soft Opening. Available online: https://21cmcc.org.cn/English/news/newsreleases/202307/t20230721_1839.htm (accessed on 15 August 2023).
  41. Chen, X.B. Hydrodynamics in offshore and naval applications-Part I. In Proceedings of the 6th International Conference on Hydrodynamics, Perth, Australia, 24–26 November 2004. [Google Scholar]
  42. China Classification Society. Rules for Classification of Mobile Offshore Units; China Classification Society: Beijing, China, 2020. [Google Scholar]
  43. China Classification Society. Guidelines for Inspection of Marine fishery and Aquaculture Facilities; China Classification Society: Beijing, China, 2019. (In Chinese) [Google Scholar]
  44. Zhang, D.P.; Bai, Y.; Soares, C.G. Dynamic analysis of an array of semi-rigid “sea station” fish cages subjected to waves. Aquac. Eng. 2021, 94, 102172. [Google Scholar] [CrossRef]
  45. Liu, H.; Chen, M.; Han, Z.; Zhou, H.; Li, L. Feasibility Study of a Novel Open Ocean Aquaculture Ship Integrating with a Wind Turbine and an Internal Turret Mooring System. J. Mar. Sci. Eng. 2022, 10, 1729. [Google Scholar] [CrossRef]
  46. Orcina, Ltd. OrcaFlex User Manual: OrcaFlex Version 10.3c; Orcina, Ltd.: Ulverston, UK, 2018. [Google Scholar]
  47. Bureau Veritas. HydroStar for Experts User Manual, Version V7.3; Bureau Veritas: Paris, France, 2018. [Google Scholar]
  48. Lei, Y.; Zhao, S.X.; Zheng, X.Y.; Li, W. Effects of Fish Nets on the Nonlinear Dynamic Performance of a Floating Offshore Wind Turbine Integrated with a Steel Fish Farming Cage. Int. J. Struct. Stab. Dyn. 2020, 20, 2050042. [Google Scholar] [CrossRef]
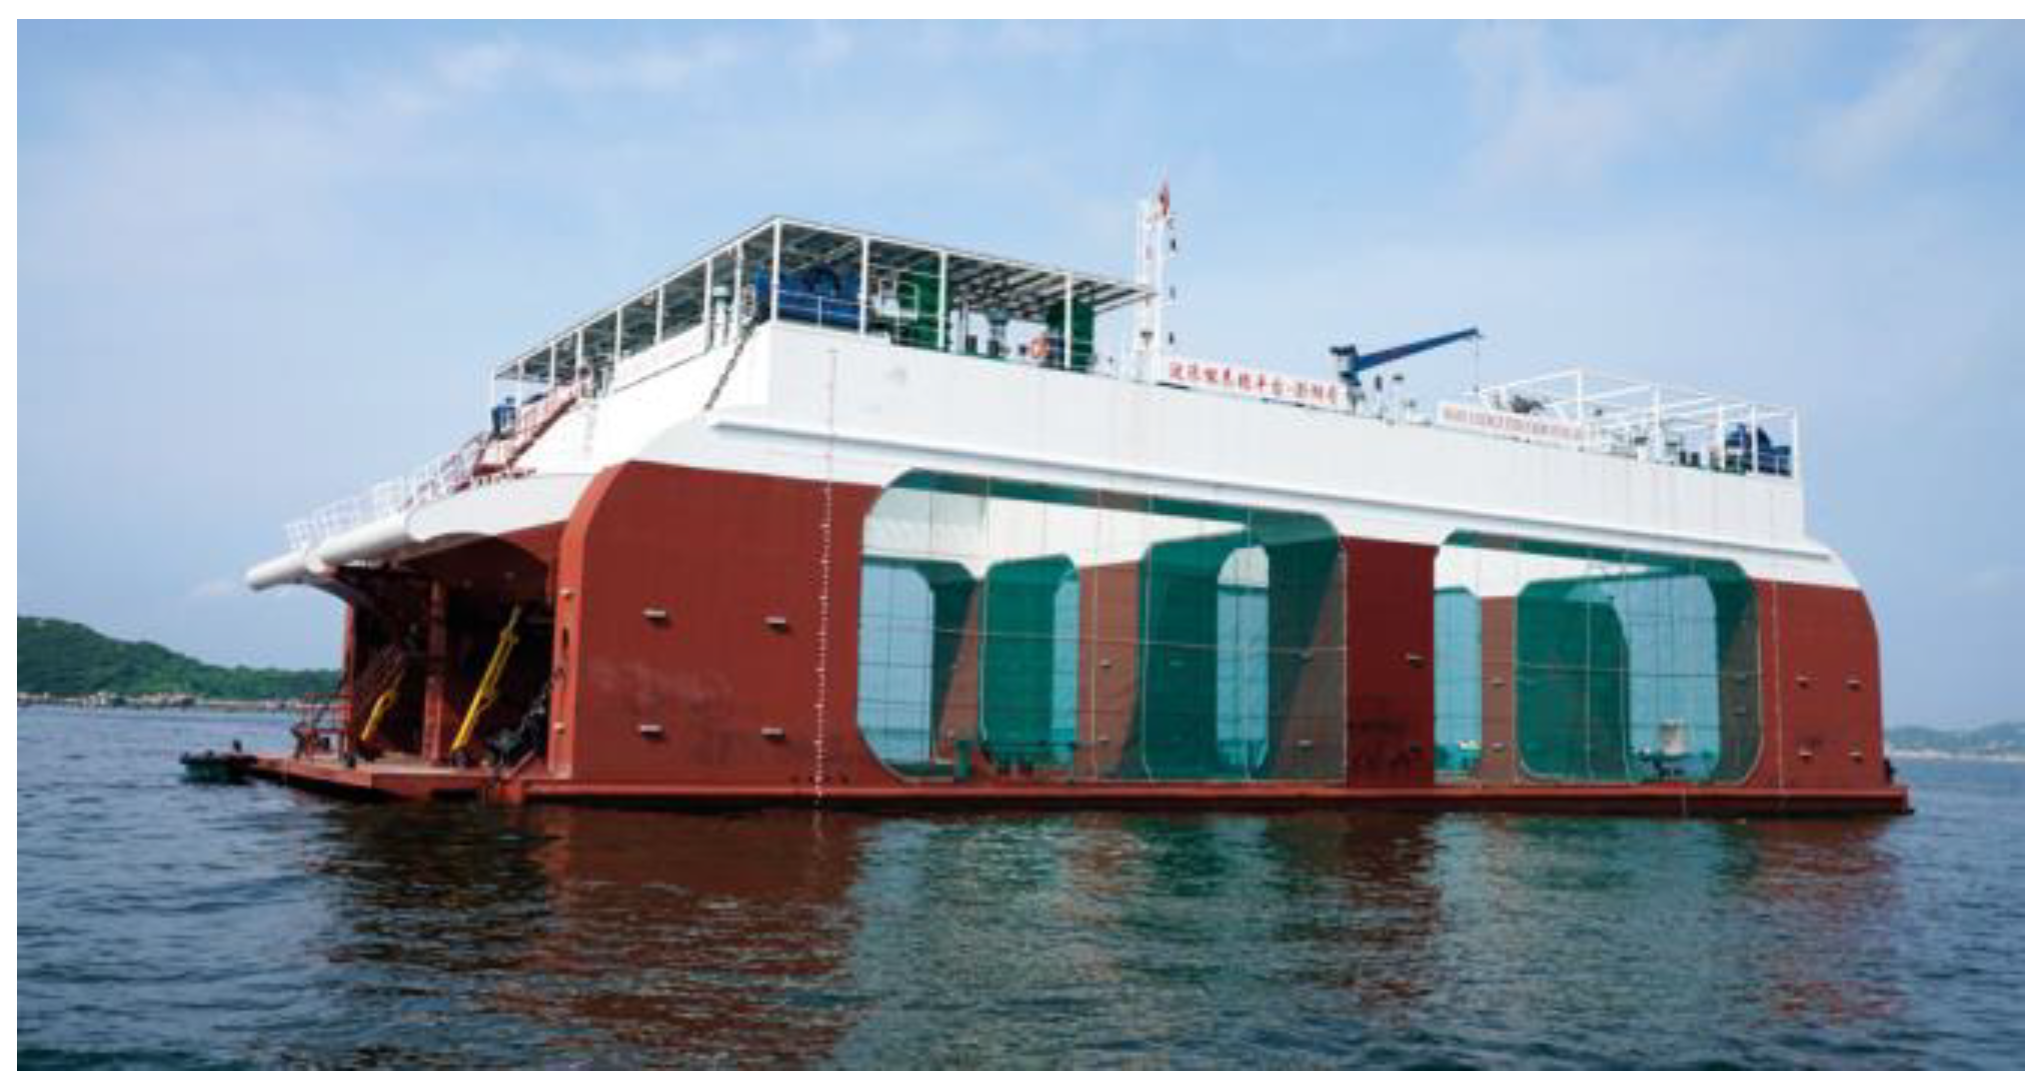
Figure 1. An overview of the semi-submersible aquaculture platform “Penghu” [37].
Applsci 13 12652 g001
Figure 2. An overview of the semi-submersible aquaculture platform “Pu Sheng 1” [39].
Applsci 13 12652 g002
Figure 3. The hydrodynamic model.
Applsci 13 12652 g003
Figure 4. Pu Sheng 1 in the operation condition.
Applsci 13 12652 g004
Figure 5. The location of the project site.
Applsci 13 12652 g005
Figure 6. Division of flow field region.
Applsci 13 12652 g006
Figure 7. The schematic diagram of net equivalent substitution.
Applsci 13 12652 g007
Figure 8. The mooring system layout.
Applsci 13 12652 g008
Figure 9. Definition of the directions of waves, winds, and currents.
Applsci 13 12652 g009
Figure 10. RAO results of surge for different mesh sizes at the 180° heading angle.
Applsci 13 12652 g010
Figure 11. RAO results of heave for different mesh sizes at the 180° heading angle.
Applsci 13 12652 g011
Figure 12. RAO results of pitch for different mesh sizes at the 180° heading angle.
Applsci 13 12652 g012
Figure 13. The mesh model.
Applsci 13 12652 g013
Figure 14. The mean drift force of surge at the 0° heading angle.
Applsci 13 12652 g014
Figure 15. The mean drift force of sway at the 90° heading angle.
Applsci 13 12652 g015
Figure 16. The mean drift force of yaw at the 90° heading angle.
Applsci 13 12652 g016
Figure 17. Surge RAOs for the moored platform with/without nets.
Applsci 13 12652 g017
Figure 18. Heave RAOs for the moored platform with/without nets.
Applsci 13 12652 g018
Figure 19. Pitch RAOs for the moored platform with/without nets.
Applsci 13 12652 g019
Figure 20. Time series history of the mooring line tension under the condition LC1.
Applsci 13 12652 g020
Figure 21. Time series history of the mooring line tension under the condition LC3.
Applsci 13 12652 g021
Figure 22. Time series history of the mooring line tension under the condition LC5.
Applsci 13 12652 g022
Figure 23. Time history result of the motion of the heave of the platform under the condition LC3.
Applsci 13 12652 g023
Figure 24. Time history result of the motion of the plane under the condition LC3.
Applsci 13 12652 g024
Table 1. Detailed parameters of the platform.
ParametersUnitValue
Total lengthm86
Length of main structurem80
Widthm30
Depth (Main deck)m3
Depth (Top deck)m18
Operation/Survival draftm10
Table 2. Mass properties.
UnitOperation/Survival Condition
Weightkg3,702,300
Center of gravity in x directionm−0.279
Center of gravity in y directionm0
Center of gravity in z directionm−5.842
Radius of gyration about the x axism13.65
Radius of gyration about y axism28.95
Radius of gyration about z axism31.04
Table 3. Environment conditions.
Operation ConditionSurvival Condition
Significant wave height Hs (m)13.5
Peak wave period Tp (s)4.36.5
Wave spectrum factor γ11
1-h wind speed (m/s)25.825.8
Current speed (m/s)0.50.88
Table 4. Detailed parameters of the nets.
ParametersUnitValue
Diametermm5
Densityt/m6.5 × 10−6
Spacingmm50
Table 5. Equivalent coefficients of nets.
Equivalent
Number
Equivalent
Diameter (m)
Equivalent
Drag Coefficient
Equivalent
Inertia Coefficient
Vertical direction950.04914.8641
Horizontal direction600.03911.8131
Table 6. Detailed parameters of mooring lines.
Line No.Diameter (mm)Length (m)GradeMBL * (kN)Axial Stiffness (kN)
1~868245R3S studlink4440467.024 × 103
* MBL: Minimum breaking load.
Table 7. Coordinates of fairleads and anchors.
Line No.Coordinate of FairleadsCoordinate of Anchors
x (m)y (m)z (m)X (m)Y (m)Z (m)
143−11.5−7212.706−181.206−20
243−7.8−7233.405−153.903−20
3437.8−7233.405153.903−20
44311.5−7212.706181.206−20
5−4311.5−7−212.706181.206−20
6−437.8−7−233.405153.903−20
7−43−7.8−7−233.405−153.903−20
8−43−11.5−7−212.706−181.206−20
Table 8. Loading cases of survival conditions.
Loading CaseHs (m)Tp (s)GammaWind Speed (m/s)Current Speed (m/s)Wave
Direction
(°)
Wind
Direction (°)
Current
Direction (°)
Line
Condition
LC13.56.5125.80.88180180180Intact
LC23.56.5125.80.88157.5157.5157.5Intact
LC33.56.5125.80.88135135135Intact
LC43.56.5125.80.88112.5112.5112.5Intact
LC53.56.5125.80.88909090Intact
LC63.56.5125.80.88180180180Line 2 damaged
LC73.56.5125.80.88157.5157.5157.5Line 2 damaged
LC83.56.5125.80.88135135135Line 1 damaged
LC93.56.5125.80.88112.5112.5112.5Line 1 damaged
LC103.56.5125.80.88909090Line 1 damaged
Table 9. The mooring line tension under survival conditions.
Extreme ResponseLC1LC2LC3LC4LC5LC6LC7LC8LC9LC10
Line 1Mean (kN)205330425572652546772---------
Max (kN)5238959481729246013811817---------
SF *8.494.964.682.571.813.212.44---------
Line 2Mean (kN)364465507415285------927991937
Max (kN)10571270107111841262------194027733337
SF4.203.504.143.753.52------2.291.601.33
Line 3Mean (kN)3642341072213409276871812
Max (kN)1056710614572911688255033524
SF4.206.257.2377.88152.573.805.388.82126.59181.55
Line 4Mean (kN)205125661912206132541612
Max (kN)52228624942205243082032920
SF8.5115.5117.83106.98217.998.4814.4321.84151.41227.64
Line 5Mean (kN)14111111121311111112
Max (kN)27181621222616151919
SF166.69244.06279.21211.80204.21168.34269.49295.50230.29238.47
Line 6Mean (kN)13111111131211111113
Max (kN)27191618242117151527
SF164.95234.22272.20249.89181.25215.07256.17288.61295.06166.86
Line 7Mean (kN)135298164285124897176301
Max (kN)2786201571124424772125961132
SF165.6451.5922.097.773.57182.0757.8020.917.443.92
Line 8Mean (kN)14902855316521384305575691
Max (kN)26195837176124432717495018692349
SF167.6122.825.302.521.82166.2025.484.672.381.89
* SF represents the safe factor.
Table 10. Statistics of mooring line tension under typical conditions.
Loading CaseParameterMeanStd. Dev. *MaxMin
LC1Tension of line 2 with nets (kN)365771229195
LC1Tension of line 2 without nets (kN)13612515324
LC3Tension of line 1 with nets (kN)425891004204
LC3Tension of line 1 without nets (kN)26798106373
LC5Tension of line 1 with nets (kN)65224421513
LC5Tension of line 1 without nets (kN)42032124712
* Std. Dev. represents the Standard Deviation of the mean value of the parameter.
Table 11. The six-degree-of-freedom motion under various conditions.
LC1LC2LC3LC4LC5LC6LC7LC8LC9LC10
SurgeMean (m)−5.20−4.77−4.26−2.340.00−5.69−5.23−4.37−2.070.15
Std. Dev.0.180.160.230.290.020.180.170.250.270.06
Max (m)−4.61−4.22−3.41−1.450.12−5.09−4.68−3.46−1.240.47
Min (m)−6.24−5.69−5.26−3.68−0.10−6.74−6.19−5.41−3.32−0.19
SwayMean (m)0.004.185.135.986.330.324.535.566.687.07
Std. Dev.0.000.160.160.270.380.010.160.210.310.39
Max (m)0.004.825.827.198.220.375.176.518.159.13
Min (m)−0.013.614.564.904.790.293.944.885.545.59
HeaveMean (m)−6.03−6.06−6.09−6.10−6.12−6.00−6.02−6.04−6.06−6.08
Std. Dev.0.090.090.090.150.250.090.090.090.160.24
Max (m)−5.56−5.60−5.63−5.43−4.95−5.52−5.55−5.57−5.33−4.91
Min (m)−6.44−6.47−6.48−6.77−7.15−6.41−6.42−6.43−6.77−7.10
RollMean (°)0.00−0.05−0.32−0.62−0.73−0.08−0.16−0.54−0.87−0.96
Std. Dev.0.000.110.270.580.960.010.120.290.610.95
Max (°)0.020.420.811.652.63−0.030.310.611.452.29
Min (°)−0.01−0.55−1.57−3.51−6.33−0.14−0.70−1.85−4.09−6.56
PitchMean (°)0.410.300.170.050.020.320.200.00−0.11−0.12
Std. Dev.0.300.300.320.370.050.300.310.330.360.08
Max (°)1.981.871.801.740.201.881.781.591.450.18
Min (°)−0.73−0.84−1.20−1.67−0.16−0.84−0.98−1.39−1.84−0.43
YawMean (°)0.00−6.62−7.01−3.980.000.39−6.49−6.65−2.571.48
Std. Dev.0.000.320.500.590.050.020.310.540.580.11
Max (°)0.02−5.49−5.05−2.080.220.51−5.31−4.60−0.692.02
Min (°)0.00−7.74−9.04−6.69−0.190.29−7.61−8.74−5.361.04
Table 12. Statistics of the six-degree-of-freedom motion under the condition LC3.
ParameterMeanStd. Dev.MaxMin
Surge with nets (m)−4.250.23−3.48−5.32
Surge without nets (m)−2.900.730.01−4.87
Sway with nets (m)5.130.165.994.53
Sway without nets (m)4.840.506.132.88
Heave with nets (m)−6.090.09−5.56−6.49
Heave without nets (m)−6.020.12−5.40−6.53
Roll with nets (°)−0.320.280.78−1.87
Roll without nets (°)−0.110.331.35−1.67
Pitch with nets (°)0.170.321.62−1.32
Pitch without nets (°)0.110.382.08−1.63
Yaw with nets (°)−7.000.50−4.68−9.17
Yaw without nets (°)−4.621.491.45−8.65
Disclaimer/Publisher’s Note: The statements, opinions and data contained in all publications are solely those of the individual author(s) and contributor(s) and not of MDPI and/or the editor(s). MDPI and/or the editor(s) disclaim responsibility for any injury to people or property resulting from any ideas, methods, instructions or products referred to in the content.