Article

Differentiation Study of the Damage Characteristics of Rock Cultural Heritage Sites Due to the Sulfate Weathering Process

1
Faculty of Architecture and Civil Engineering, Huaiyin Institute of Technology, Huai’an 223001, China
2
Institute for the Conservation of Cultural Heritage, School of Cultural Heritage and Information Management, Shanghai University, Shanghai 200444, China
3
Key Laboratory of Silicate Cultural Relics Conservation (Shanghai University), Ministry of Education, Shanghai 200444, China
*
Author to whom correspondence should be addressed.
Appl. Sci. 2023, 13(23), 12831; https://doi.org/10.3390/app132312831
Submission received: 27 October 2023 / Revised: 22 November 2023 / Accepted: 28 November 2023 / Published: 29 November 2023

Abstract

:
Salt crystallization represents one of the primary forms of weathering encountered in rock cultural heritage sites, with sulfate weathering having particularly notable destructive effects. This study focuses on sandstone and limestone, using them as test materials to conduct simulation experiments on sulfate weathering under specific environmental conditions. The experimental process involved documenting the surface morphology of the rock samples and analyzing changes in indicators such as wave velocity, hardness, composition, and pore size distribution. The degree of damage to the two types of rock was evaluated using the entropy weight–TOPSIS method, and the sensitivity of different weathering indicators in assessing the weathering of the two rocks was also discussed. The results revealed that sandstone exhibited obvious surface damage under sulfate erosion, with dissolution holes and pits surrounding the rock samples, while limestone primarily suffered damage at its edges. There were notable differences in the rate of attenuation observed in the macro and micro indicators between the two rock types. The wave velocity of both types of rocks exhibits linear attenuation while the intensity undergoes exponential change. It is worth noting that sandstone hardness demonstrates a pattern of “fast–rapid–slow–stable” decline characteristics, whereas limestone follows an exponential trend with an initial fast decline followed by a slower decline. Additionally, sandstone exhibited significantly greater damage and weathering thickness compared to limestone, owing to the involvement of complex and diverse physical and chemical reactions. The pore damage factor and macro-level indicators of the rock samples could be fitted using exponential and linear functions, respectively, although the fitting curves differed distinctly. The sensitivity indicators reflecting the weathering state of sandstone and limestone under sulfate erosion varied, with mass loss applicable to sandstone and porosity to limestone. Overall, with our research findings, we aim to provide a theoretical foundation for the anti-salination and precision protection of rock cultural heritage sites.

1. Introduction

China possesses a wealth of rock cultural heritage sites that hold notable historical, political, and cultural value, with a large number of heritage sites spread widely throughout the country [1]. According to the State Council’s announcement in December 2021, the most recent count of China’s rock cultural heritage sites returned a total of 24,422, with sandstone and limestone heritage sites making up over 80% of this total [2]. Among these heritage sites, grotto temples represent a category that is not only the most complete and content-rich but also the most fragile, occupying a prominent position in the field of rock cultural heritage sites in China [3]. Immovable cultural heritage sites, being exposed to the elements, undergo long-term influences from natural forces and human activities, with sulfate weathering being the most common and notable form of deterioration [4,5]. While rocks naturally contain small amounts of sulfates, the majority of sulfate comes from direct adsorption of SOx gases by the rock mass; these gases form salt solutions when they encounter water [6,7].
Scholars have conducted extensive research on the mechanisms of salt weathering, the migration of crystalline substances, and their destructive effects, yielding valuable results. In their study on the damage mechanisms of limestone caused by sulfates, Ruiz et al. [8] discovered that salt migration primarily occurs within the larger pores in the top 3 mm of the rock surface. Li et al. [9] conducted field surveys and monitored the Longyou Grottoes and confirmed that soluble salts, particularly sulfates, are one of the main factors leading to the weathering of these grottoes. They found a close correlation between the mineral composition, the primary structure of the rocks, and the rate of deterioration. Martinez et al. [10] identified a relationship between rock pore characteristics and the destructive effects of salt crystallization, demonstrating a proportional relationship. Theoulakis et al. [11] investigated the development of crystals in various salt solutions within porous and non-porous media and concluded that crystal growth only occurs in larger pores. They also identified functional relationships between rock mechanical and structural parameters, including strength, elastic modulus, pore quantity, and distribution.
Scholars commonly assess the degree of rock weathering using single or multiple indicators. Wilhelm et al. [12] evaluated the weathering of tombstones based on changes in the magnitude of their hardness, observing an initial rapid decline followed by a slower decaying trend. Riontino et al. [13] measured the strength difference before and after salt damage to assess rock damage and proposed a decay function to simulate the process of strength deterioration in salt-weathered sandstone. Angeli et al. [14] considered indicators such as mass, wave velocity, and microstructure to assess rock weathering. Yan et al. [15] suggested that salt crystallization disrupts rock particle bonding and established logarithmic models for pore growth and exponential models for strength attenuation based on experimental results. Zhang et al. [16] utilized AHP, F-AHP, and AHP-TOPSIS methods to analyze the intrinsic correlations between weathering indicators of rock heritage sites and determine their structural safety and stability. Yao et al. [17] employed a grey correlation analysis to explore the effects of different types of rock-weakening diseases on the preservation status of individual buildings, calculating the degree of disease for each and providing a quantitative classification using a weighted approach.
However, research on salt weathering damage processes and mechanisms is more common for sandstone heritage sites than for limestone heritage sites, which remain relatively understudied. Rock heritage sites exposed to the natural environment inevitably face the universal issue of sulfate weathering, which is influenced by factors such as climate, topography, and lithology [18,19]. Analyzing and comparing the variations in damage characteristics between different rock types under the same salt-weathering environment will help to grow the body of research on sandstone and limestone heritage sites, providing theoretical and scientific support for the robust and preventative protection of rock cultural heritage sites. Consequently, this study focuses on analyzing and comparing the lithological similarities and differences between sandstone and limestone as research objects. Experimental methods based on climate monitoring data are subsequently designed to simulate sulfate weathering. In analyzing the characteristic changes in macro-and micro-indicators of the rock samples, this study aims to differentiate their damage characteristics.

2. Experimental Design

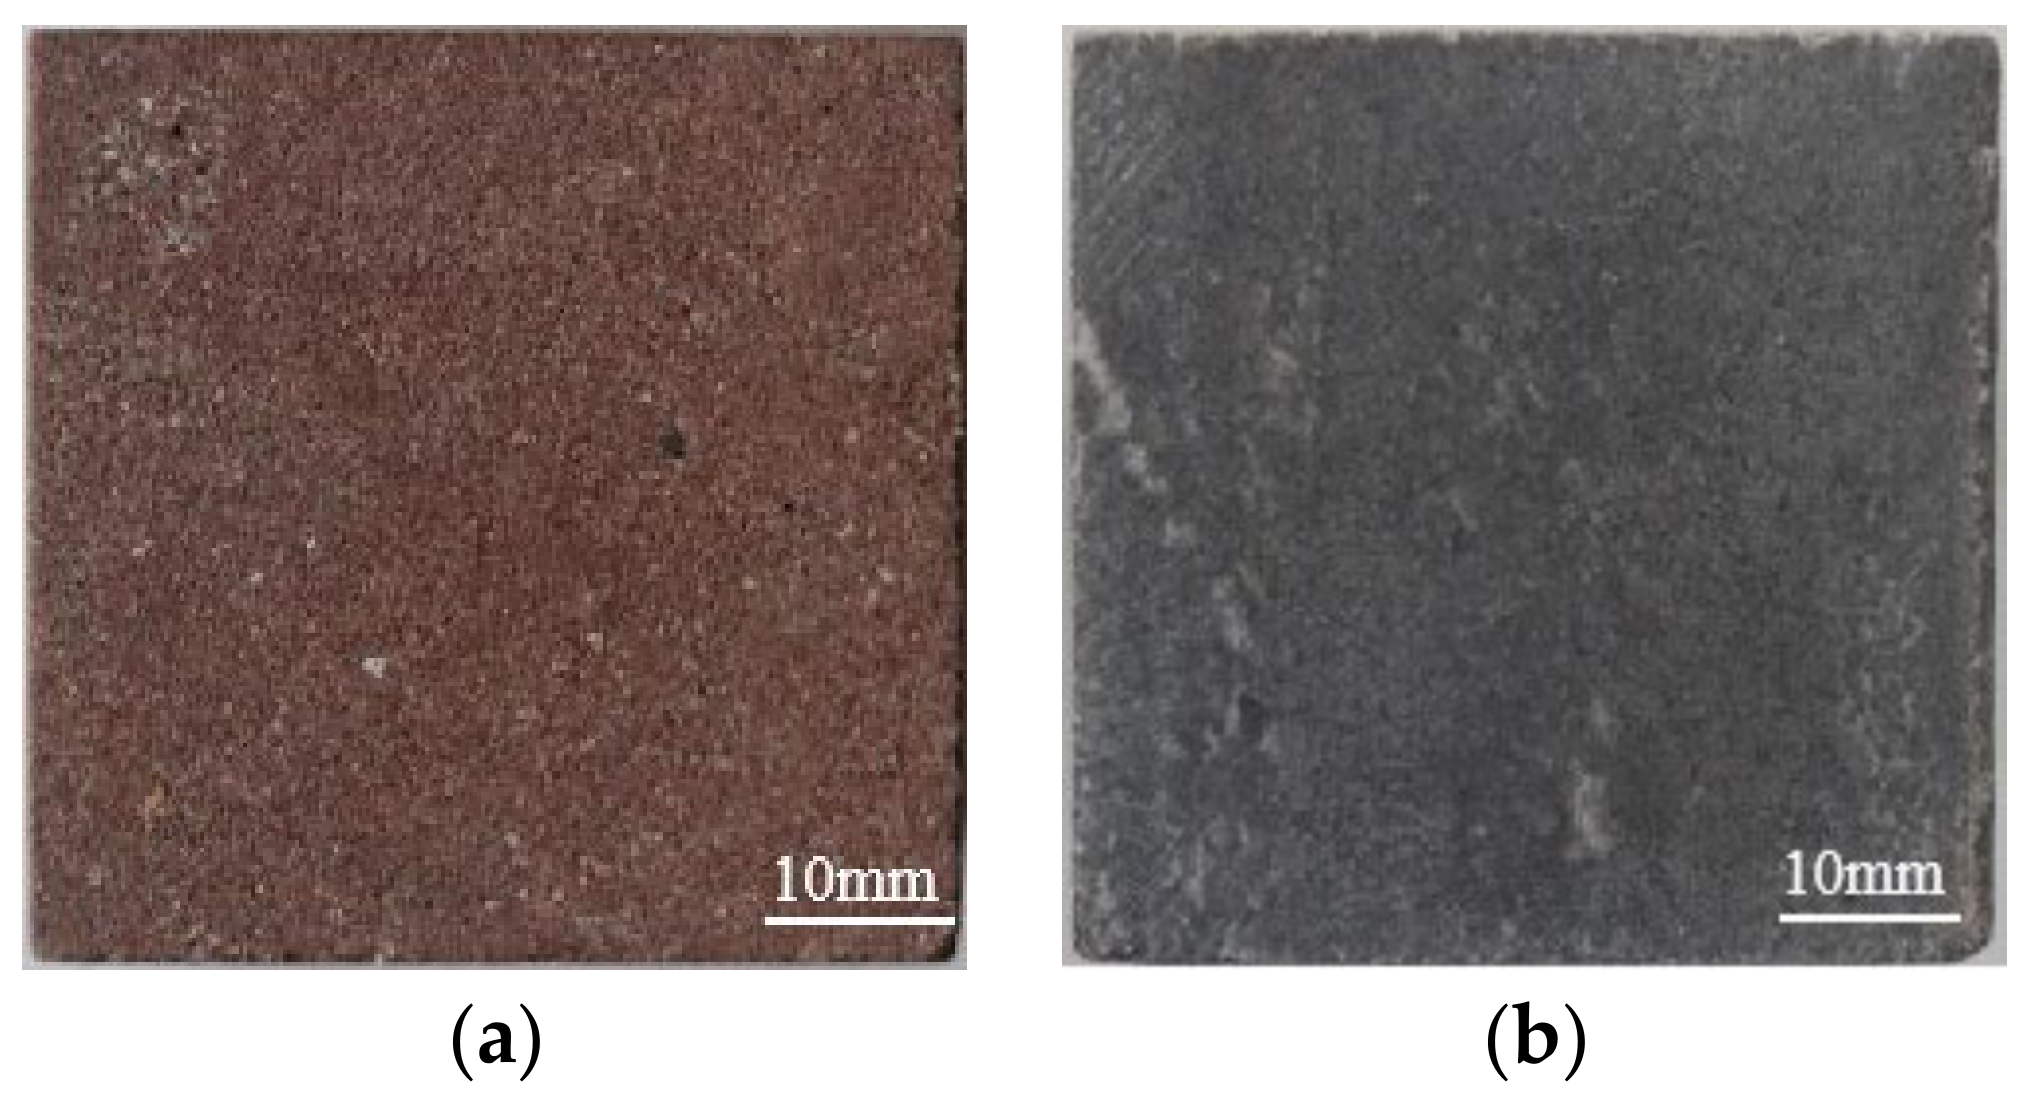
2.1. Preparation of Test Samples and Determination of Physical Properties

The sandstone samples used in this study were collected from the vicinity of the Leshan Giant Buddha, which is situated in the same stratigraphic formation as the associated Buddha niche rock. This rock formation is characterized by distinct layering and is devoid of any noticeable fractures or folds. This rock formation primarily consists of thick, distinct layers of blocky red sandstone from the Jurassic–Cretaceous Jiaguan Formation K 2 j 3 [20]. The limestone chosen for the restoration of the Mingzu Mausoleum statues in Huai’an originates from Sishui County, Jining City, Shandong Province. The Paleozoic Cambrian limestone found in this area is a result of the wing of the anticlinal tectonic stress field. This geological process led to the formation of a low mountain and hilly terrain, primarily characterized by various geological structures. Through a comparative analysis of the physical properties, microstructure, and mineral composition of the rocks, it has been determined that the lithology of the two limestone samples from different regions is essentially identical. First, the proposed cutting position was demarcated on the rock surface, and then a laser cutting machine was used to cut the rock sample into 50 square cubes according to the marked line. The specimens were thoroughly washed with deionized water to remove any surface debris, ensuring the exclusion of samples displaying noticeable visual discrepancies. Figure 1 illustrates the surface morphology of the sandstone and limestone samples. Both types of rocks exhibit smooth and compact surface textures, along with a relatively uniform particle size distribution.
DZT 0276-2015, the comprehensive standard of the geological and mining industries in the People’s Republic of China, consists of 31 elements [21]. This standard encompasses various testing methods, including hardness testing, uniaxial compression testing, acoustic testing, and more. Following the guidelines outlined in this standard, the rocks were subjected to various tests to determine their physical properties. The dry mass, free water absorption, and vacuum saturation of the samples were measured using a precision balance (Hengshun: JA5003, Yuyao, China, with a resolution of 0.001 g). The method of calculating natural water absorption is shown in Formula (1):
ω = M w e t M d r y M d r y × 100 % ;
where ω represents the natural water absorption rate (%) of the rock sample, and Mdry and Mwet represent the drying quality and natural saturation quality of the rock sample, respectively, g.
The calculation method of porosity is shown in Equation (2):
φ = M s a t M d r y M s a t M w × 100 % ;
where φ represents porosity, which refers to the ratio of total pore volume to the total sample volume, %; Msat represents the mass after saturating the sample via a boiling water saturation method and wiping away the surface water of the sample, g; and Mw is the immersion mass measured after the saturated sample is immersed in water, g.
By analyzing the collected data, important hydraulic properties such as the water absorption rate and porosity were calculated. These properties provide valuable insight into the behavior and characteristics of rocks. To assess the macroscopic properties of the rocks, non-metal ultrasonic testing equipment (Koncrete: NM-4B, Beijing, China), a Leeb hardness tester (Botech: BH200C, Guangzhou, China) and an electro-hydraulic universal testing machine (Kexin: CSS-WAW 1000DL, Changchun, China, with a loading rate of 0.255 MPa/s) were utilized. Ultrasonic testing equipment was used to measure the wave velocity, providing information about the rocks’ internal structures. The Leeb hardness tester allowed for the assessment of surface hardness, while the electro-hydraulic universal testing machine enabled the determination of the uniaxial compressive strength. The average values of these physical parameters for the two types of rocks are summarized in Table 1. These hardness values accurately reflect changes in the microstructure of the rock surface, such as changes in pore structure and mineral composition; ultrasonic wave velocity is closely related to the physical and mechanical parameters and microstructure of rock. Uniaxial compressive strength is a crucial parameter for measuring the macroscopic mechanical properties of rock.
X-ray diffraction analysis was performed to determine the composition and relative contents of the rocks alongside the aforementioned tests. The main constituents of limestone are calcite and dolomite, with calcite comprising approximately 58% to 75% and dolomite making up 15% to 30% of the composition. There are also small amounts of quartz and clay minerals present. Table 2 provides the composition and relative content of the fresh sandstone samples, including quartz, feldspar, and calcite. Quartz has the highest relative content, accounting for approximately 50% of the total composition. Feldspar minerals (albite, microcline) contribute around 25% to 35% of the composition. The content of clay minerals is relatively low.

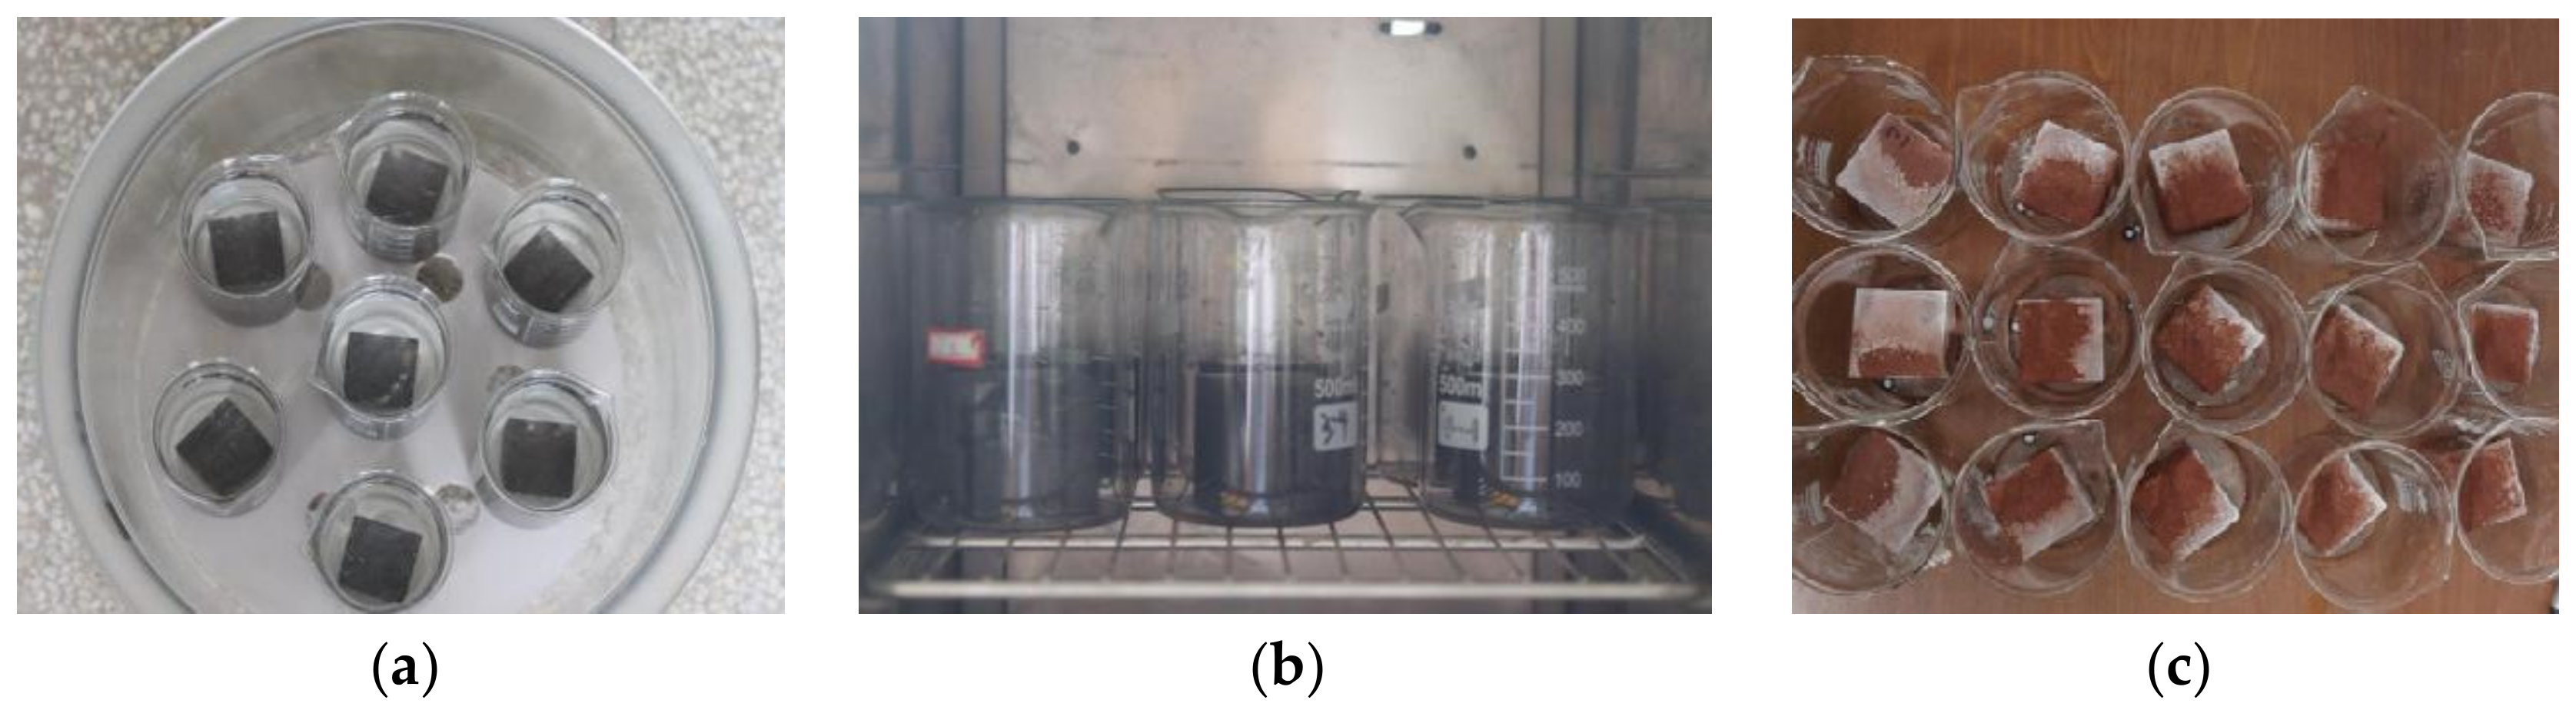
2.2. Experimental Methods

To replicate the real weathering conditions experienced by stone artifacts, the experimental setup was designed to mimic the climatic conditions of their respective locations. The summer climates of Leshan and Huai’an share similar characteristics, with average temperatures ranging from 30 to 35 °C and relative humidity ranging from 40% to 70%. These conditions served as the basis for conducting accelerated salt weathering simulation tests. The simulation tests for sulfate weathering primarily involved a “soaking–resting” cycle. The specific steps were as follows. (1) The test samples were immersed in a saturated sodium sulfate solution for 24 h, after which they were removed, and the surface suspension was wiped off using a damp cloth. (2) The rock samples were then placed in a rapid temperature and humidity test chamber (Huanrui: RHPS-408BT, Dongguan, China) for 48 h, with the temperature and humidity set at 35 °C and 45%, respectively, to simulate the cyclic effects of salt weathering. This process was repeated continuously. Each cycle of sulfate weathering lasted for 72 h. Figure 2 illustrates some of the operational procedures.
The samples were divided into six groups, each containing five pieces, meaning a total of thirty pieces of sandstone and thirty pieces of limestone.
The number of cycles was set to 0, 5, 10, 15, 20 and 25, and the whole testing process lasted about 90 days. In other words, the sample that underwent the first cycle of salt weathering was subjected to a total of 25 cycles. The samples that were not subjected to any weathering tests are considered fresh rock samples. A set of sandstone and limestone samples were subjected to testing at intervals of five cycles. At the conclusion of the test, the weathering indices of the two rocks were determined separately, along with an analysis of their mineral composition and pore size distribution. Finally, a uniaxial compression test was conducted.

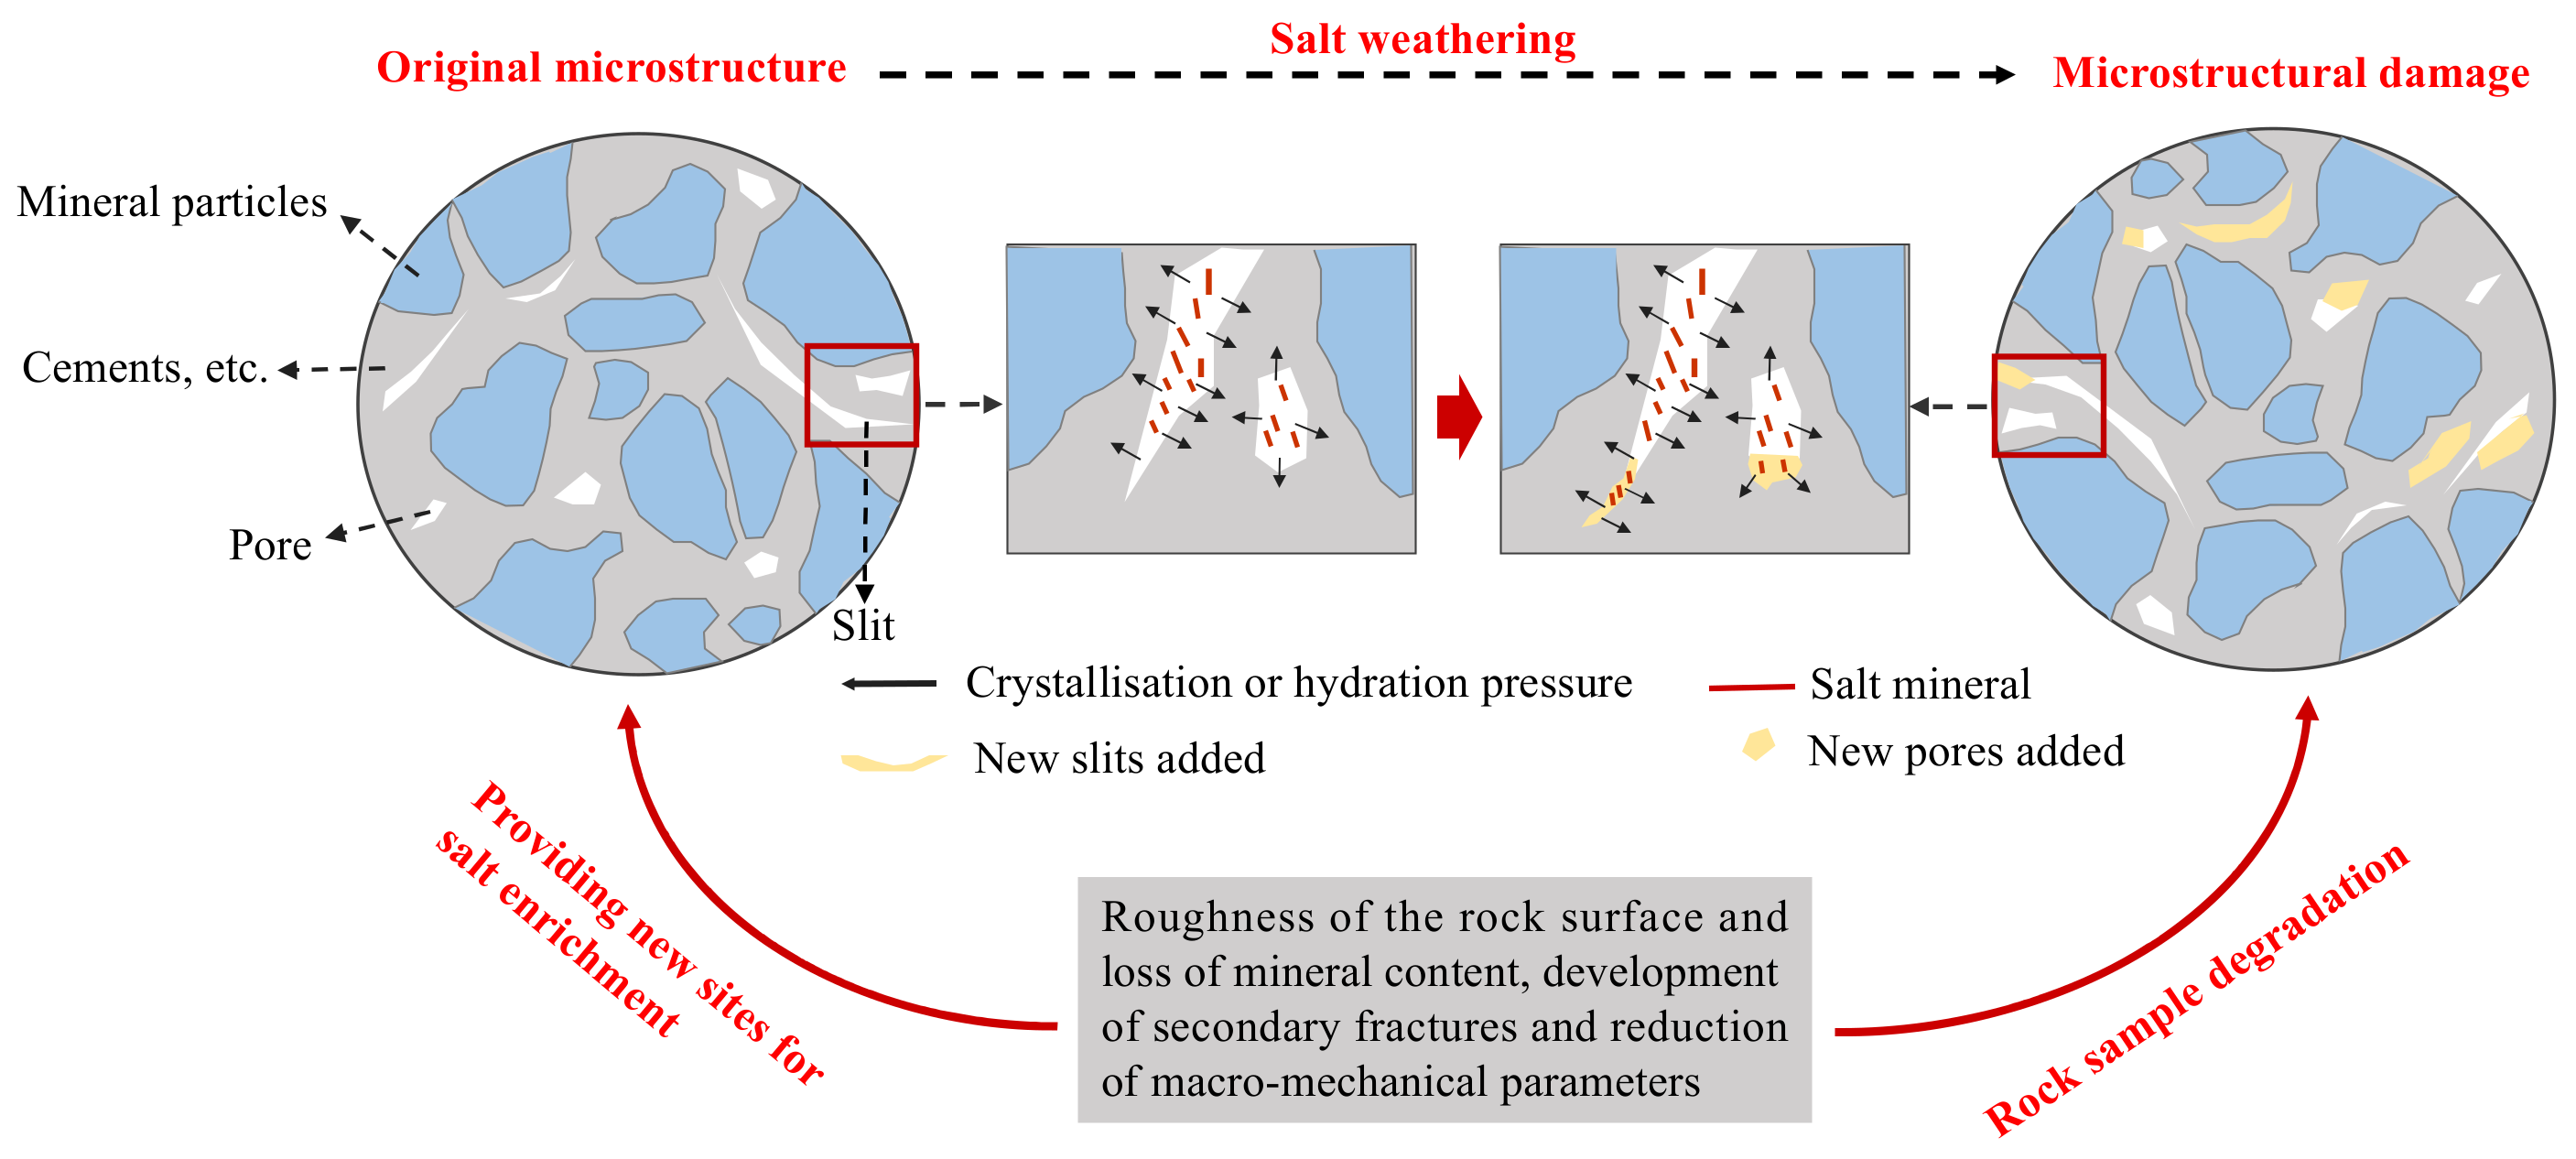
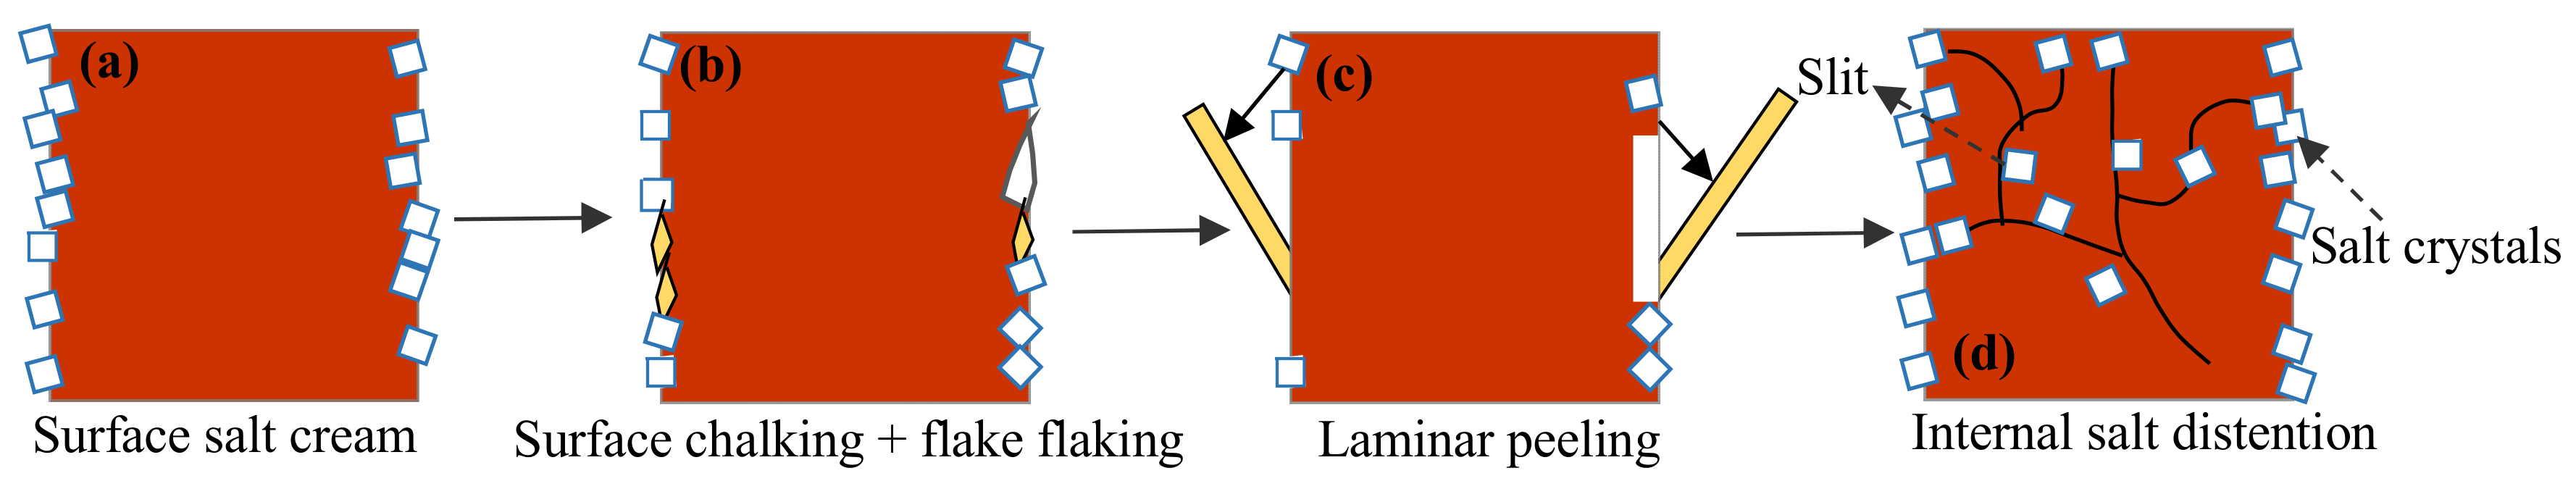
2.3. Mechanisms of Sulfate Weathering Damage

The mechanisms of sulfate weathering damage suggest that test samples immersed in salt solutions continuously absorb moisture until saturation is reached. Under high-temperature and low-humidity conditions, anhydrous mirabilite forms in the pores and fractures. The accumulation of mirabilite in the cracks leads to compressive damage to the crack walls. When the mirabilite exceeds the critical tensile strength of the pore walls, instantaneous damage affects the pore structure. During periodic immersion and exposure to a given environment, mirabilite continuously precipitates, dissolves, regenerates, and migrates to the interior of the rock. The evolution process is illustrated in Figure 3 [22]. Furthermore, the hydrophilic minerals present in sandstone (such as calcite, albite, and microcline) and limestone (calcite) undergo complex physicochemical reactions, resulting in the detachment and loss of surface particles in the rock samples. The physical and chemical effects of sulfate weathering cause the widening of existing surface pores, as well as the formation of new pores and microcracks. The accumulated microscopic damage eventually leads to macroscopically visible instantaneous fractures, resulting in a reduction in rock mass, decreased wave velocity, and weakened strength [23].

3. Experimental Results

3.1. Macroscopic Weathering Indicators

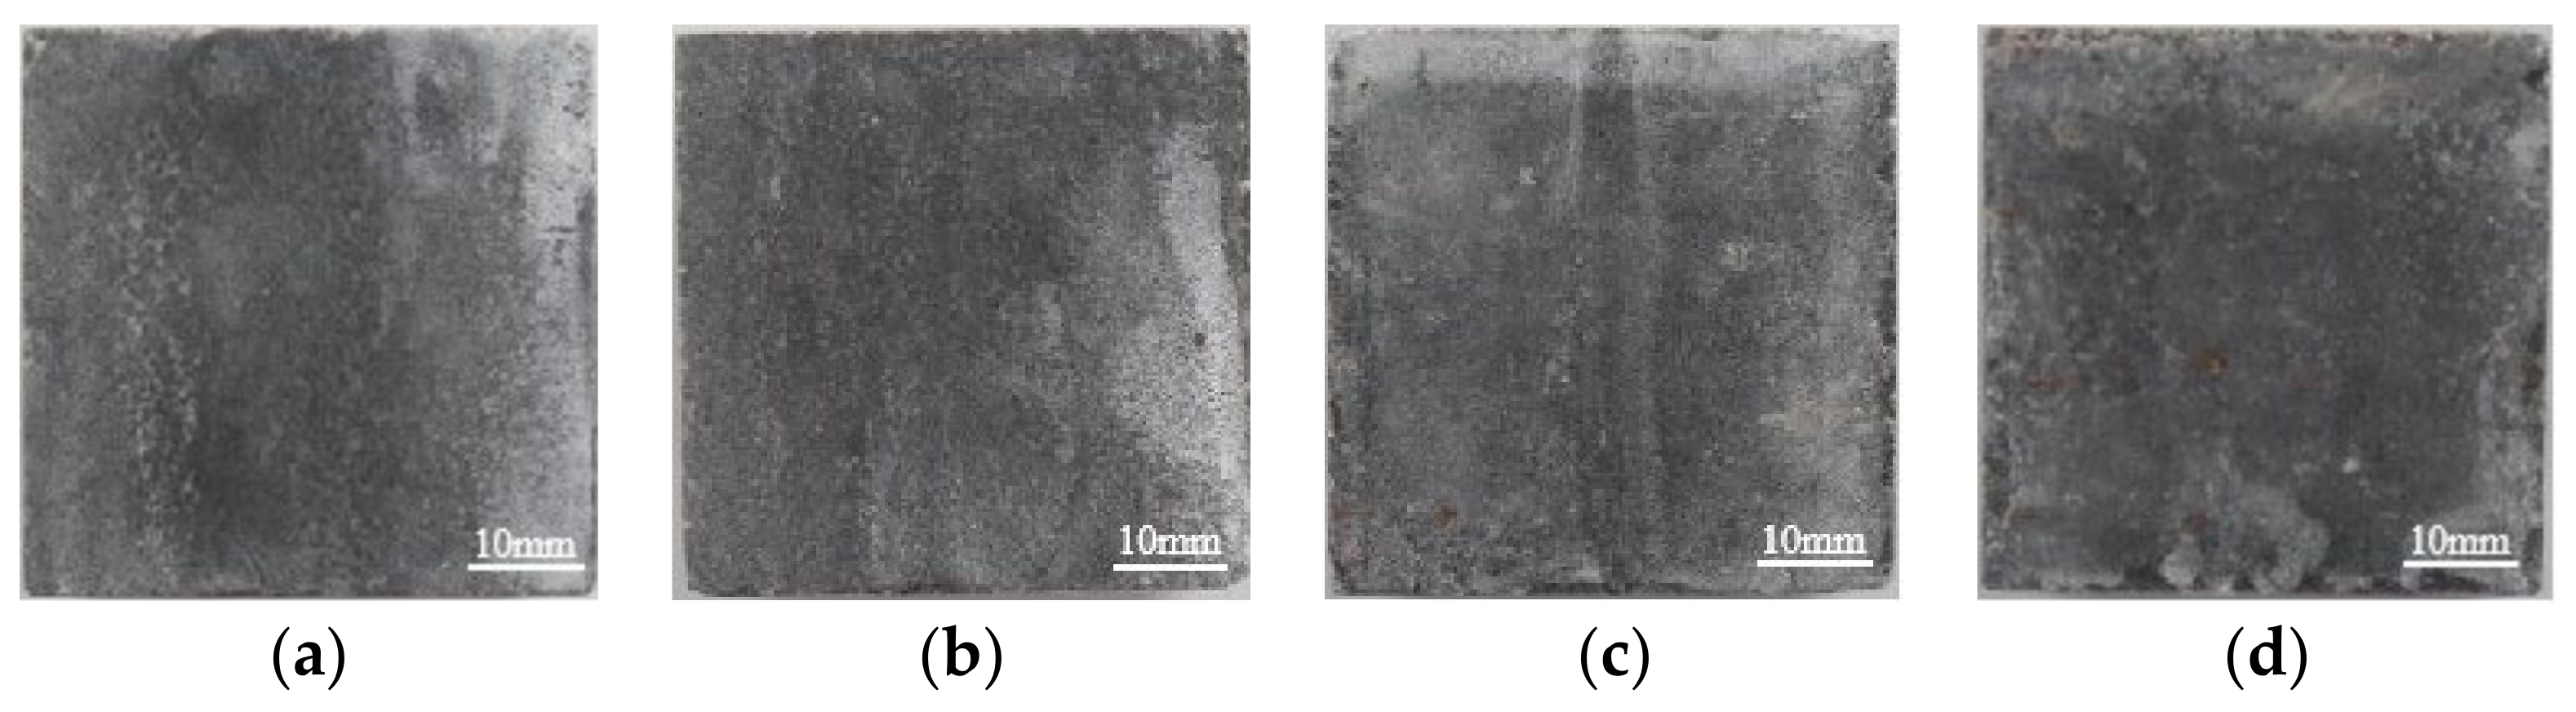
3.1.1. Apparent Morphology
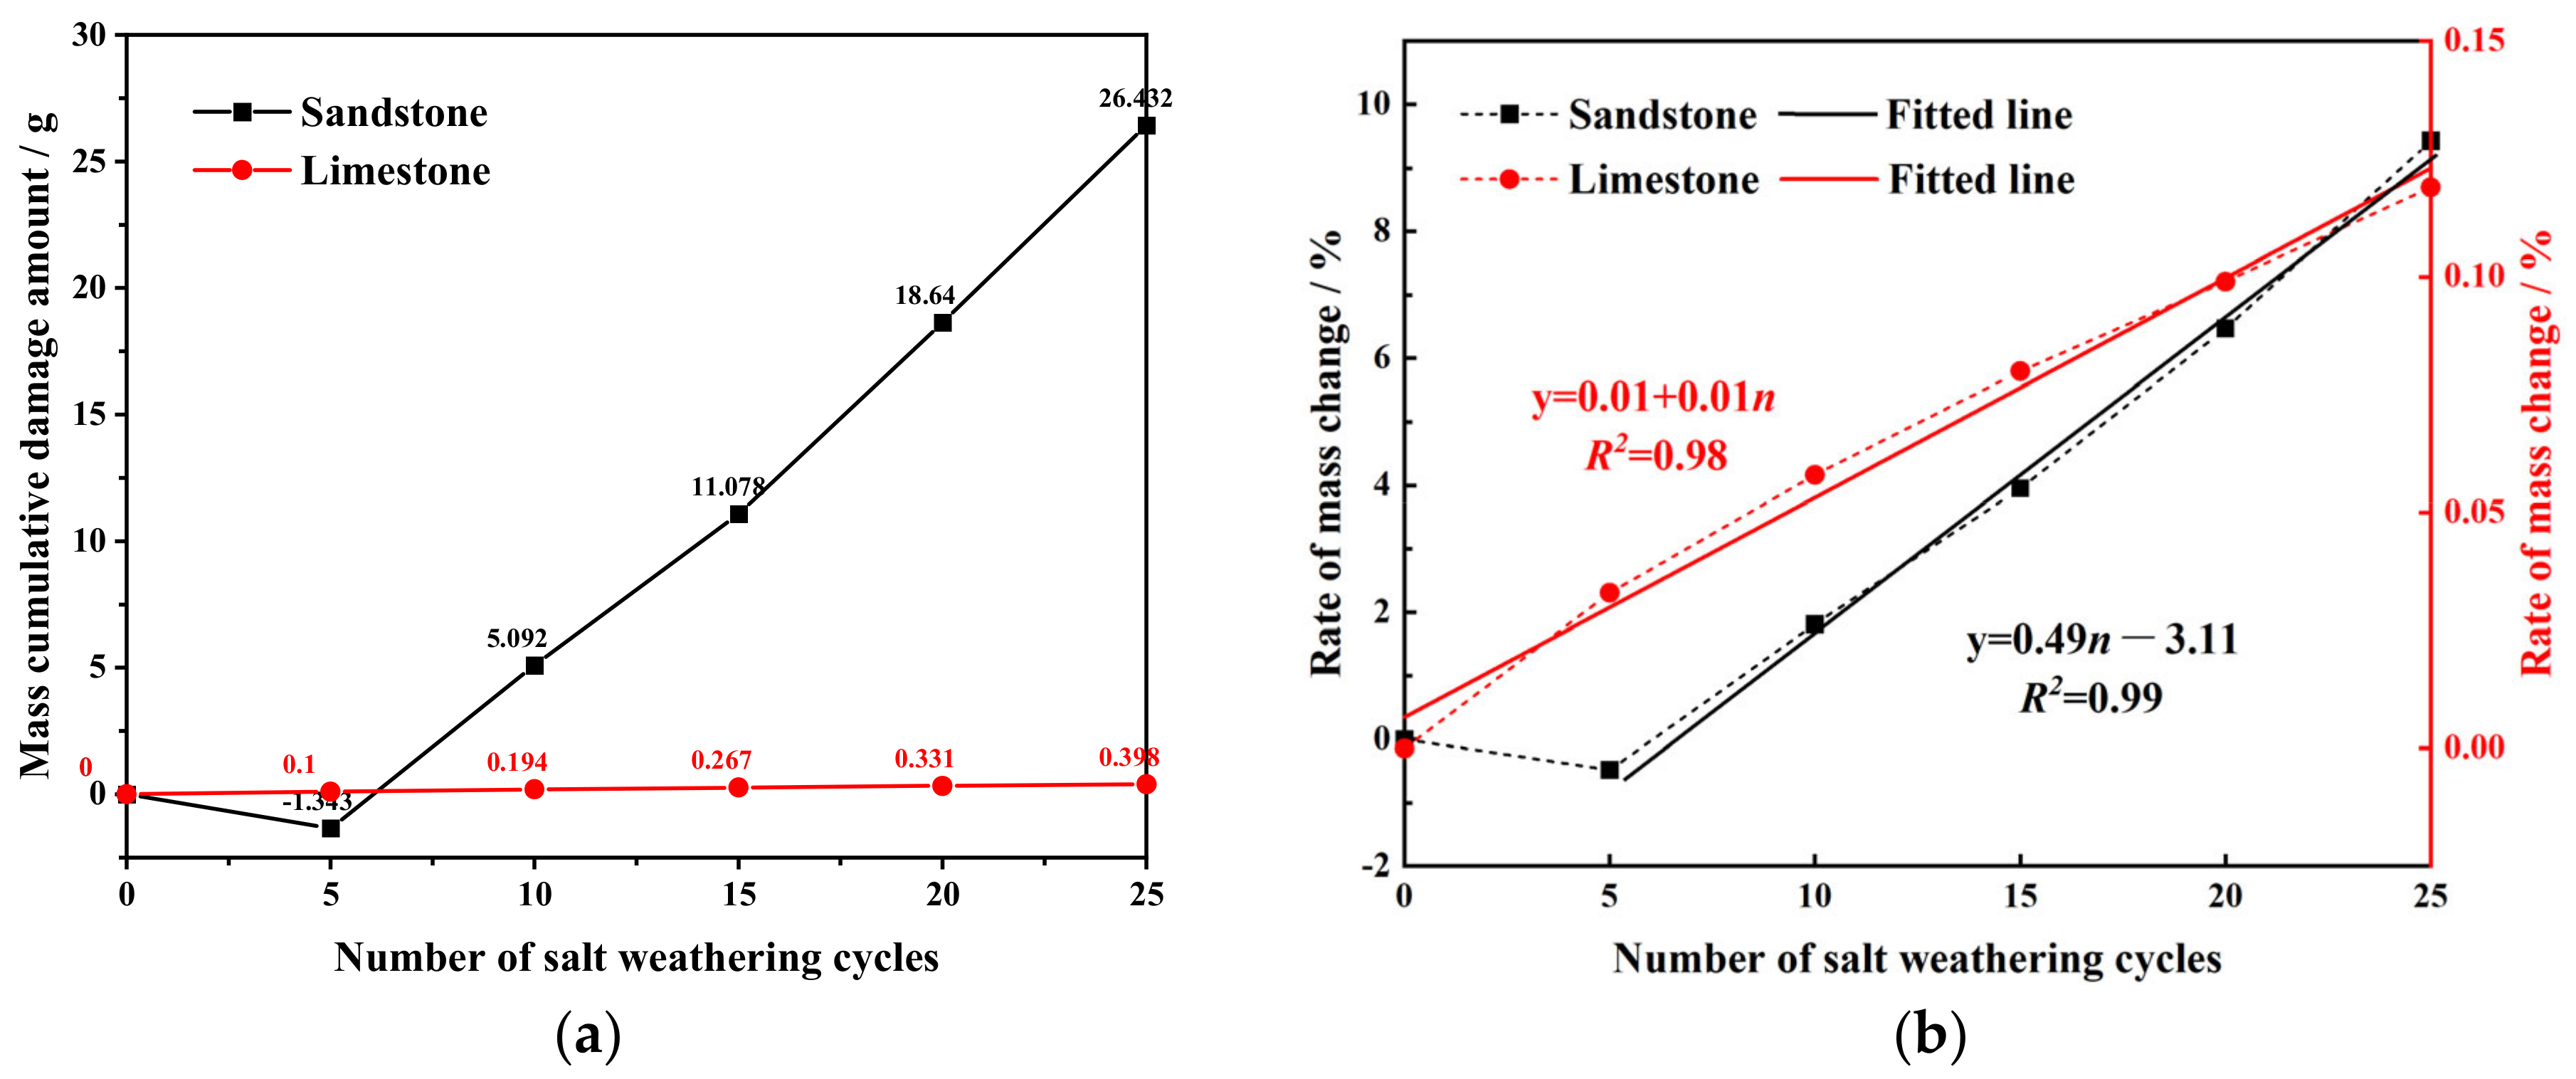
The pores on the rock surface become filled with sulfate solution, which subsequently leads to the formation of crystals due to fluctuations in temperature and humidity. This process initiates a complex sequence of physical and chemical reactions, ultimately resulting in discernible changes in the rock’s overall appearance. With each successive cycle, the degree of rock weathering gradually intensifies, accompanied by a deepening of surface damage. This phenomenon closely mirrors the actual weathering process experienced by rock relics. The apparent morphology of the sandstone samples at different cycling times is shown in Figure 4. It can be observed that the damage range of the surface layer of the sandstone samples gradually expands, and the thickness of the weathering layer continues to deepen. During cycles 1 to 10, the upper region of the sandstone exhibits characteristics such as edge defects, dissolution holes, and dissolution pits, while other areas remain smooth. During cycles 11 to 15, the corners change from “right angles” to “rounded corners”, and the number of pore fractures continues to increase. The surface roughness is distinctly enhanced the microstructure becomes loose, and the weathering thickness reaches up to 3 mm. At this stage, the damage range is still concentrated in the upper–middle region. During cycles 21 to 25, the surface layer of the rock sample completely peels off, and visible dissolution holes and pits are scattered around, indicating a high degree of softening. At the commencement of the experiment, the rock samples were 50 mm square cubes. Following 25 cycles of salt weathering, the length, width, and height of the rock samples were reduced to approximately 14 mm, 10.5 mm, and 9 mm, respectively. Consequently, the total volume of the rock samples witnessed a reduction of approximately 10%.
The deterioration of the apparent morphology of limestone is depicted in Figure 5. It is noteworthy that the edges of the limestone samples, resembling the key carving areas of rock statues, exhibit a subtle gravel-like texture and varying degrees of structural damage when compared to other regions. These differences can be attributed to factors such as cutting, akin to the base or corners of cave statues. Two primary characteristics of the damage can be observed, as follows. The first is the accumulation of white material, wherein white material accumulates in the surface layer of the limestone sample, and as the number of cycles increases, the amount of white material also increases. Consequently, the range of damage expands. The second is edge damage and particle detachment, wherein the edges of the limestone exhibit slight damage and particle detachment while the remaining areas remain smooth. In general, the deterioration of the apparent morphology of limestone is minimal, with the damage primarily concentrated at the edges of the sample. This indicates an evolutionary trend of expansion from the periphery towards the center.
Based on the aforementioned analysis, it can be inferred that sandstone is more susceptible to surface damage under sulfate erosion than limestone. Both types of rocks exhibit a consistent deterioration pattern, characterized by a top-to-bottom and outer-to-inner progression (refer to Figure 6). Despite sharing common trends in damage under similar weathering conditions, the apparent morphological characteristics of weathering distinctly differ between the two rock types. During the initial stage of salt weathering, the test samples undergo continuous salt absorption until they reach a saturation point. Subsequent changes in environmental conditions lead to the formation of Na2SO4·nH2O crystals, resulting in the appearance of salt frost, powder-like substances, and flocculent detachment on the surface of the rock samples. As the thickness of the weathering layer increases, the damage range gradually extends from the surface toward the interior [24]. Within the experimental scope, the sandstone samples displayed layered peeling, cracking, and other forms of damage.

3.1.2. Mass Loss

Figure 7 illustrates the cumulative mass loss and loss rate curve of sandstone and limestone. The mass change rate was calculated using Equation (1). The results reveal the following facts.
  • In the initial stage of the experiment, the mass of sandstone increased due to two main factors. Firstly, the fresh sandstone had a relatively large initial porosity, allowing the crystallites formed by salt weathering to accumulate in the surface pores and fractures of the rock. This resulted in only minor damage within five cycles. Secondly, the crystallites generated during the cycling process block the throats of the pores and fractures, creating liquid-filled voids. This led to an increase in the water content inside the rock sample [25,26].
  • On the other hand, limestone has a high initial density and small pores. As a result, even a small amount of salt crystallization can cause a reduction in mass.
  • In the later stage of salt weathering, after 25 cycles within the experiment, the destructive effects of salt weathering gradually intensified, resulting in a continuous decrease in the mass of the rock samples as the number of cycles increased.
Figure 7. The cumulative damage in two kinds of rock mass and its representation in change rate curves. (a) Cumulative mass loss curve; (b) variation curves of mass loss in the two types of rocks.
Applsci 13 12831 g007
Firstly, the characteristics of the quality change of sandstone are analyzed. It should be noted that the experimental data of fresh sandstone are not included because the quality change of sandstone during 0–5 cycles is greatly affected by other factors. It can be seen that the loss rate of sandstone mass in the cycle presents a linear upward trend, and the loss rate is as high as 9.5% when the cycle reaches 25 times, and the cumulative mass loss is about 29.45 g. The change rate of limestone mass generally shows a linear increase. After the experiment, the final mass loss rate was only 0.26%, with a cumulative mass loss of approximately 1.2 g. This is 1/40th of the mass loss rate observed in sandstone.
R s = M o M n M o × 100 %
where Rs represents the mass loss over the exposure time, Mo represents the initial dry weight of the rock sample in grams, and Mn represents the dry weight of the rock sample in grams after n cycles of salt weathering.

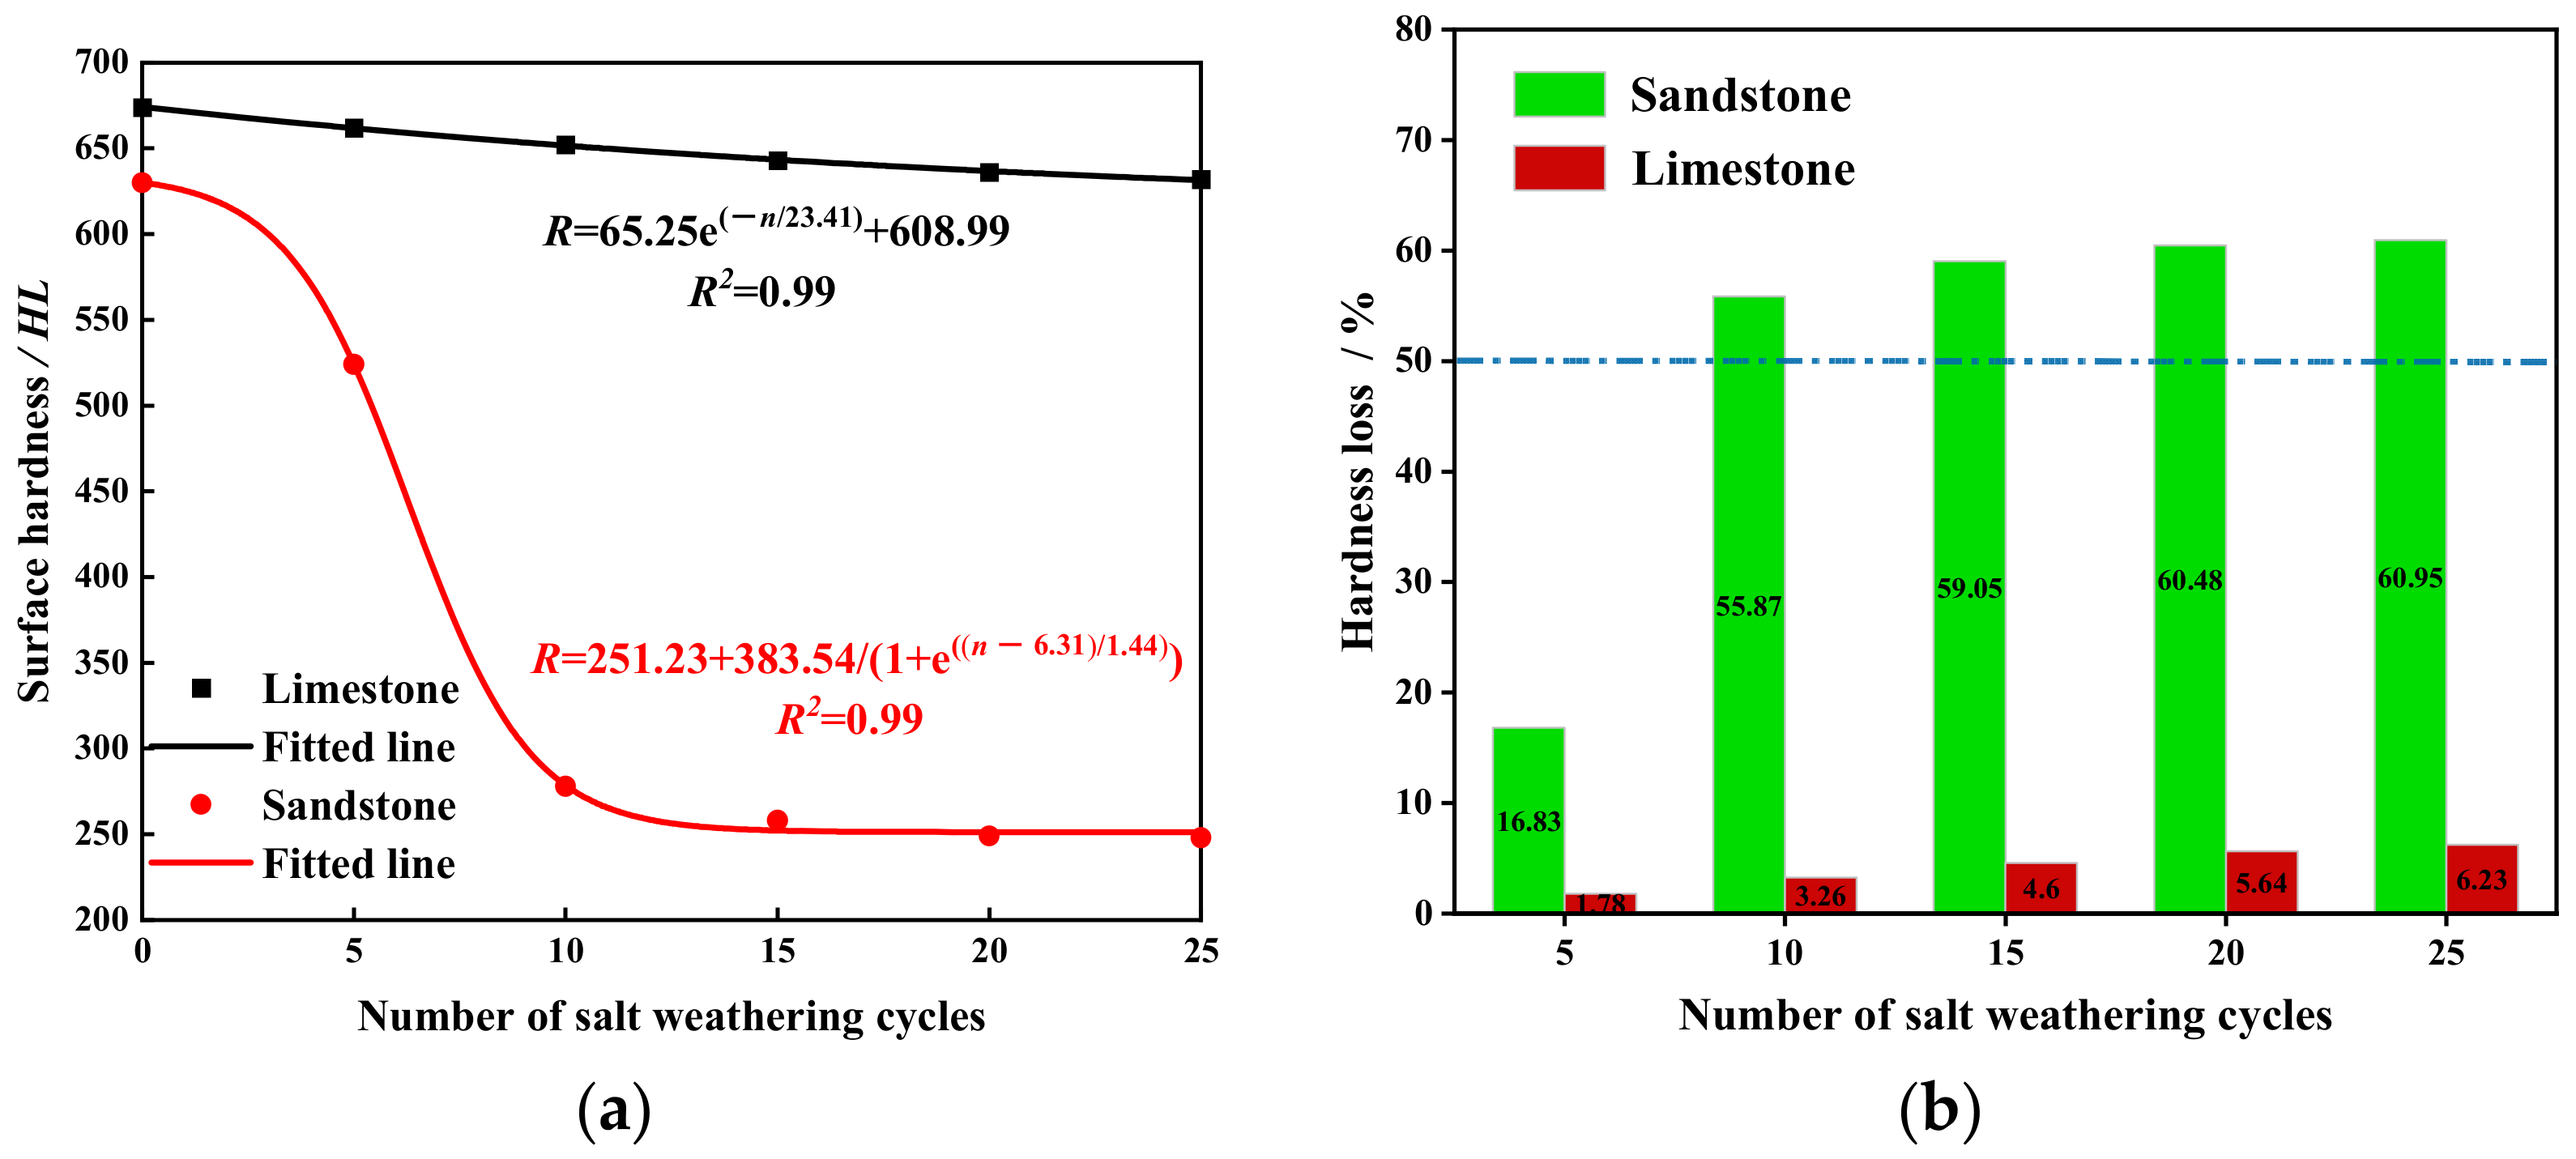
3.1.3. Surface Hardness

Figure 8 illustrates the variation curves of surface hardness and loss rate for the two types of rocks. It is evident that as the number of cycles increases, the surface hardness values of both rock types consistently decrease, albeit with notable disparities in the magnitude of change and decay rate [27]. The hardness value of limestone demonstrates an exponential decline (this function has the highest fitting coefficient), starting at 674 HL and decreasing to 632 HL, resulting in a cumulative decrease of 42 HL. The decay of the sandstone hardness value is very special and can be divided into several stages according to the number of salt weathering cycles.
During cycles 1 to 5, the hardness of the rock samples decreased by 110 HL, going from 630 HL to 520 HL. This decrease represents approximately 1/6 of the hardness value of fresh sandstone. Consequently, the surface microstructure of the sandstone was severely damaged, resulting in significant softening.
Between cycles 6 and 10, the hardness value of the sandstone decreases from 524 HL to 278 HL, and the surface layer of the sandstone sample begins to peel off.
From cycles 11 to 25, the surface structure of the sandstone sample undergoes complete damage. Through comprehensive testing of the sample from various regions and angles, the hardness value stabilizes at around 250 HL [28].
Throughout the entirety of the experimental process, the hardness value of the sandstone sample experienced a cumulative decrease of 380 HL. The decay rate followed a pattern of change during the “fast–rapid–slow–stable” cycles, which is in accordance with the inherent characteristics of the Boltzmann distribution function:
R = a + b a 1 + e n c / d
where R represents the surface hardness value, n represents the number of cycles, and a, b, c, and d are constants.

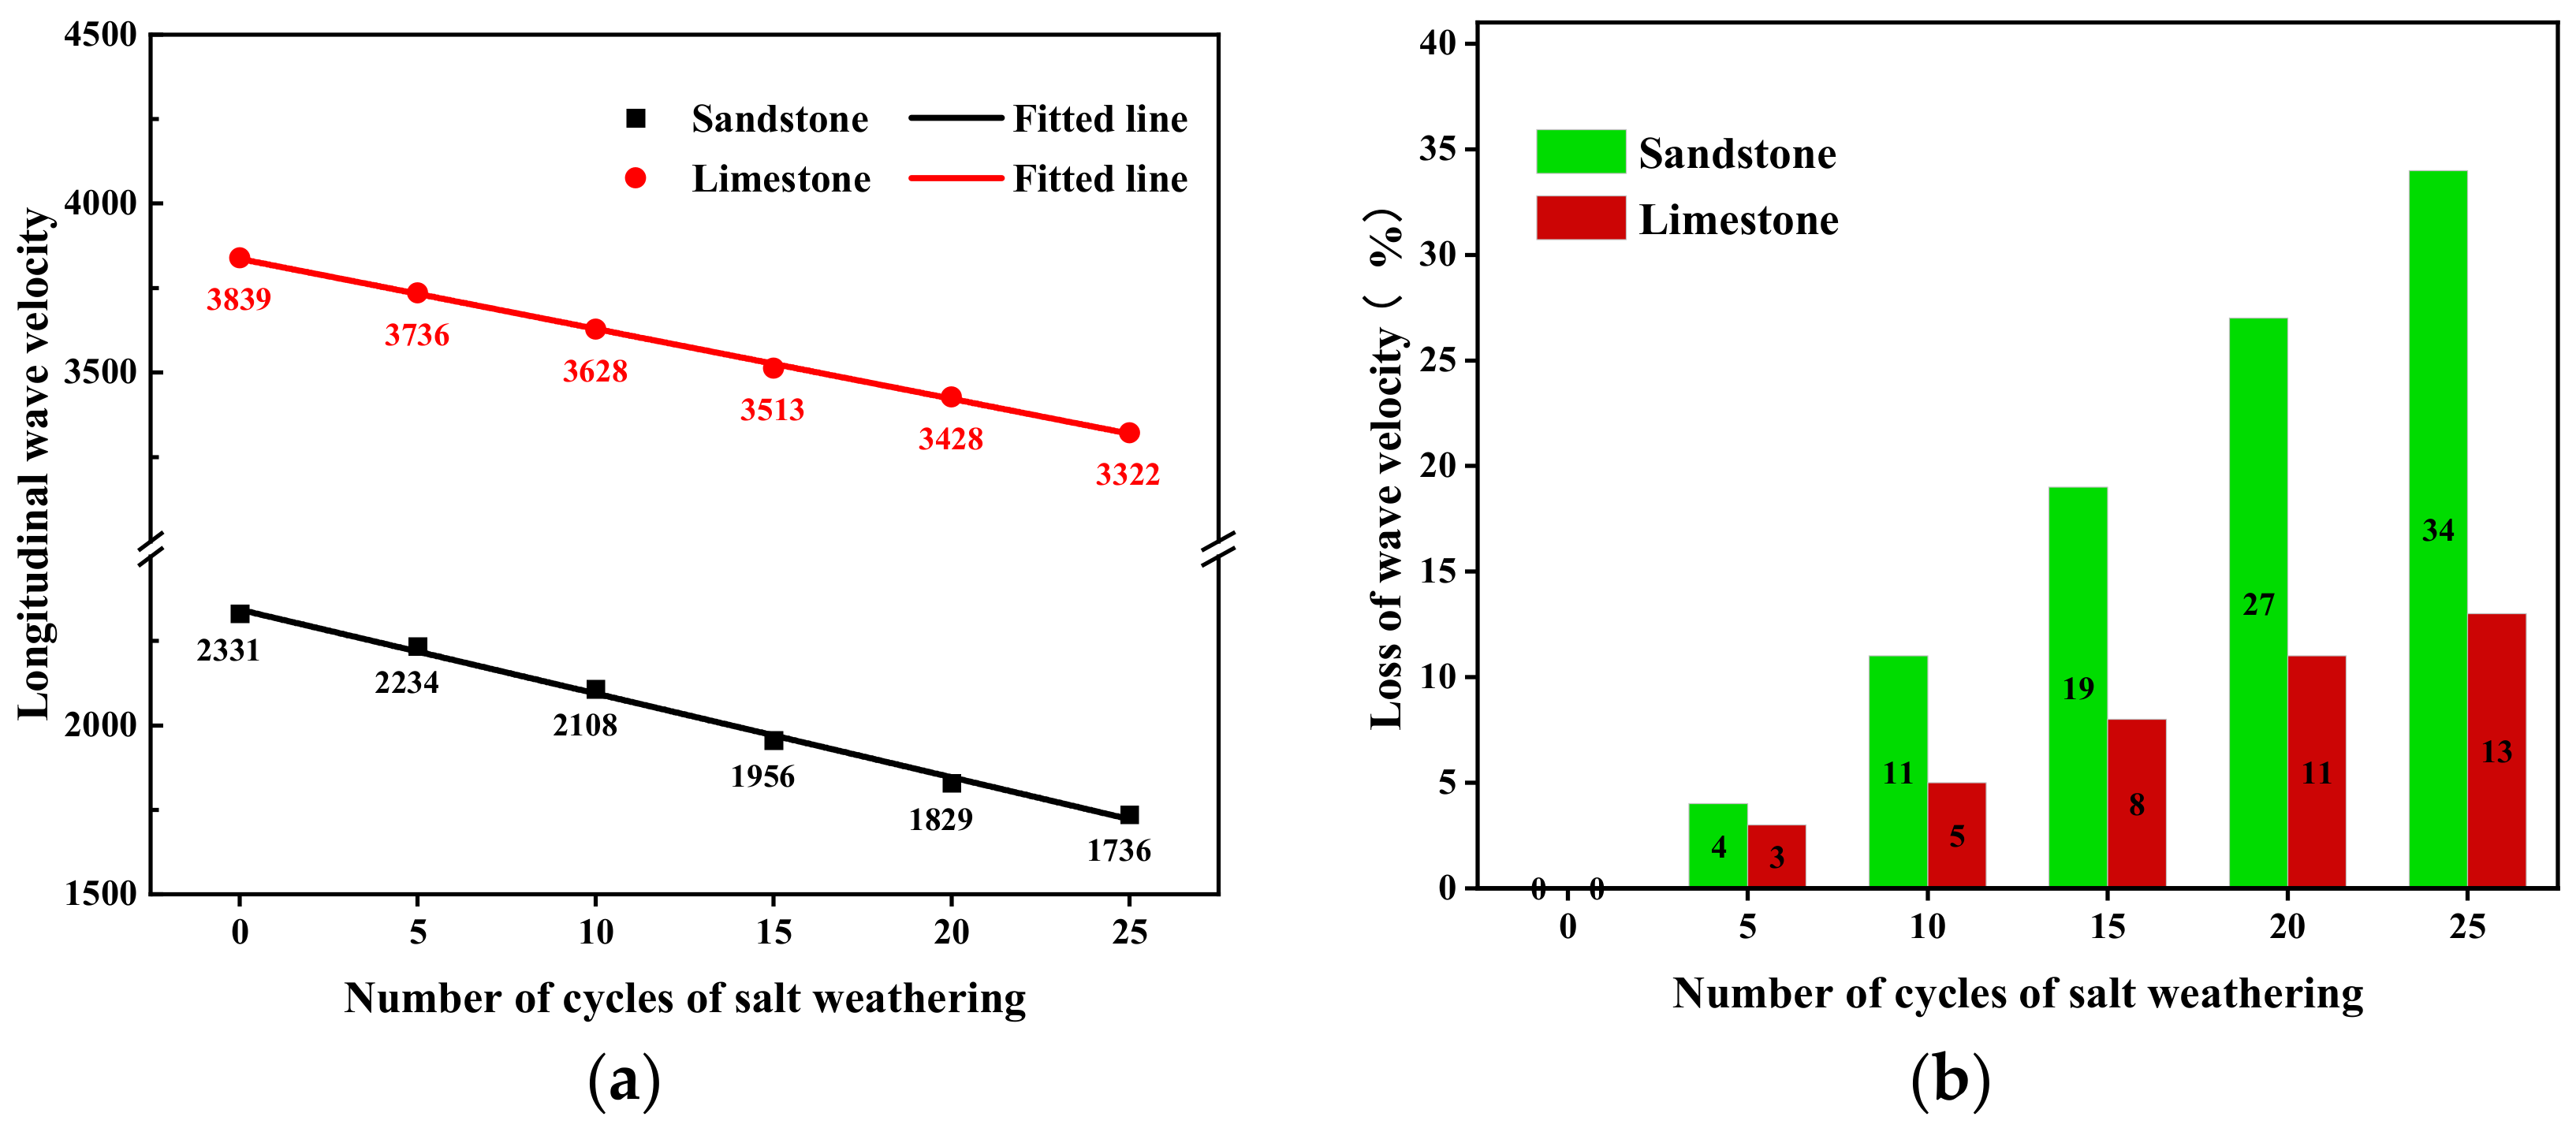
3.1.4. P-Wave Velocity

P-wave velocity is an important indicator of fracture development in rock, which, as a measure, is characterized by convenient operation and high sensitivity. During the test, both ends of the probe should be held tightly to ensure that the probe is tightly fitted to the rock and the test error is therefore reduced. Figure 9 presents the variation curves of P-wave velocity and its loss for limestone and sandstone. The curves demonstrate that the initial P-wave velocities of fresh limestone and sandstone are similar, at 3800 m/s and 2330 m/s, respectively, with limestone exhibiting a higher initial P-wave velocity than sandstone by 1500 m/s. As the number of cycles increases, both rock types experience a linear decrease in P-wave velocity. The P-wave velocity of sandstone decreases from 2331 m/s to 1736 m/s, resulting in a total decrease of 700 m/s. Conversely, the P-wave velocity of limestone changes from 3839 m/s to 3322 m/s, representing a cumulative decrease of 500 m/s; the sandstone’s wave velocity is 200 m/s less than that of the limestone. Due to the substantial disparity in the initial P-wave velocities of the two rock samples, the loss of P-wave velocity in sandstone is markedly greater than that in limestone. By the 25th cycle, the loss of P-wave velocity in the sandstone sample reached 34%, while in the limestone sample, it was only 13%, indicating a 20% difference between the two.

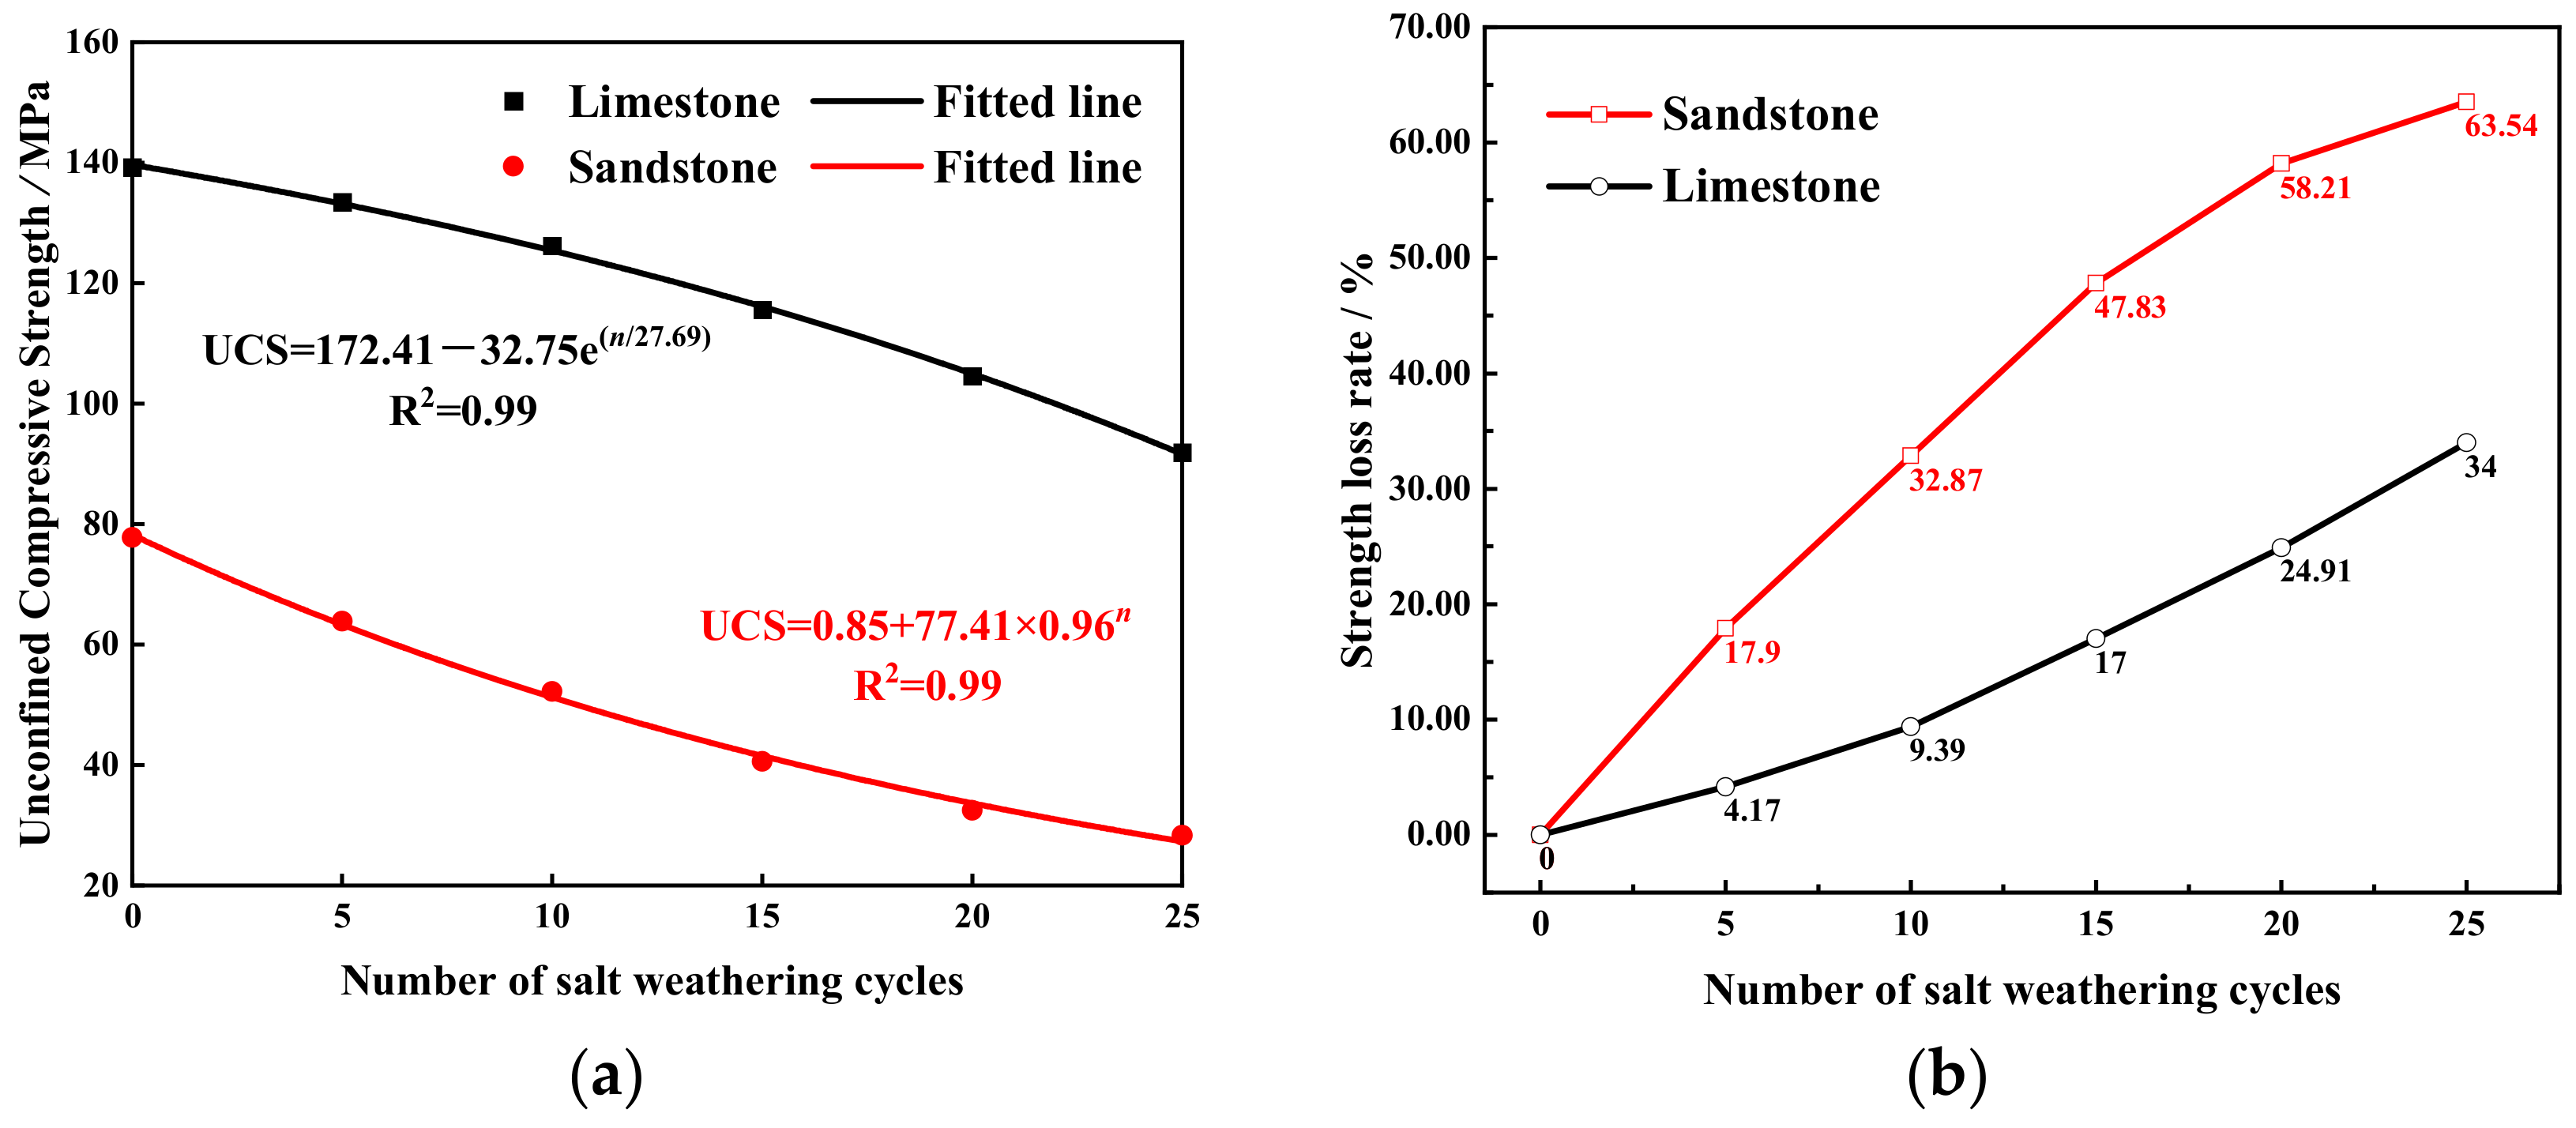
3.1.5. Uniaxial Compressive Strength

(1)
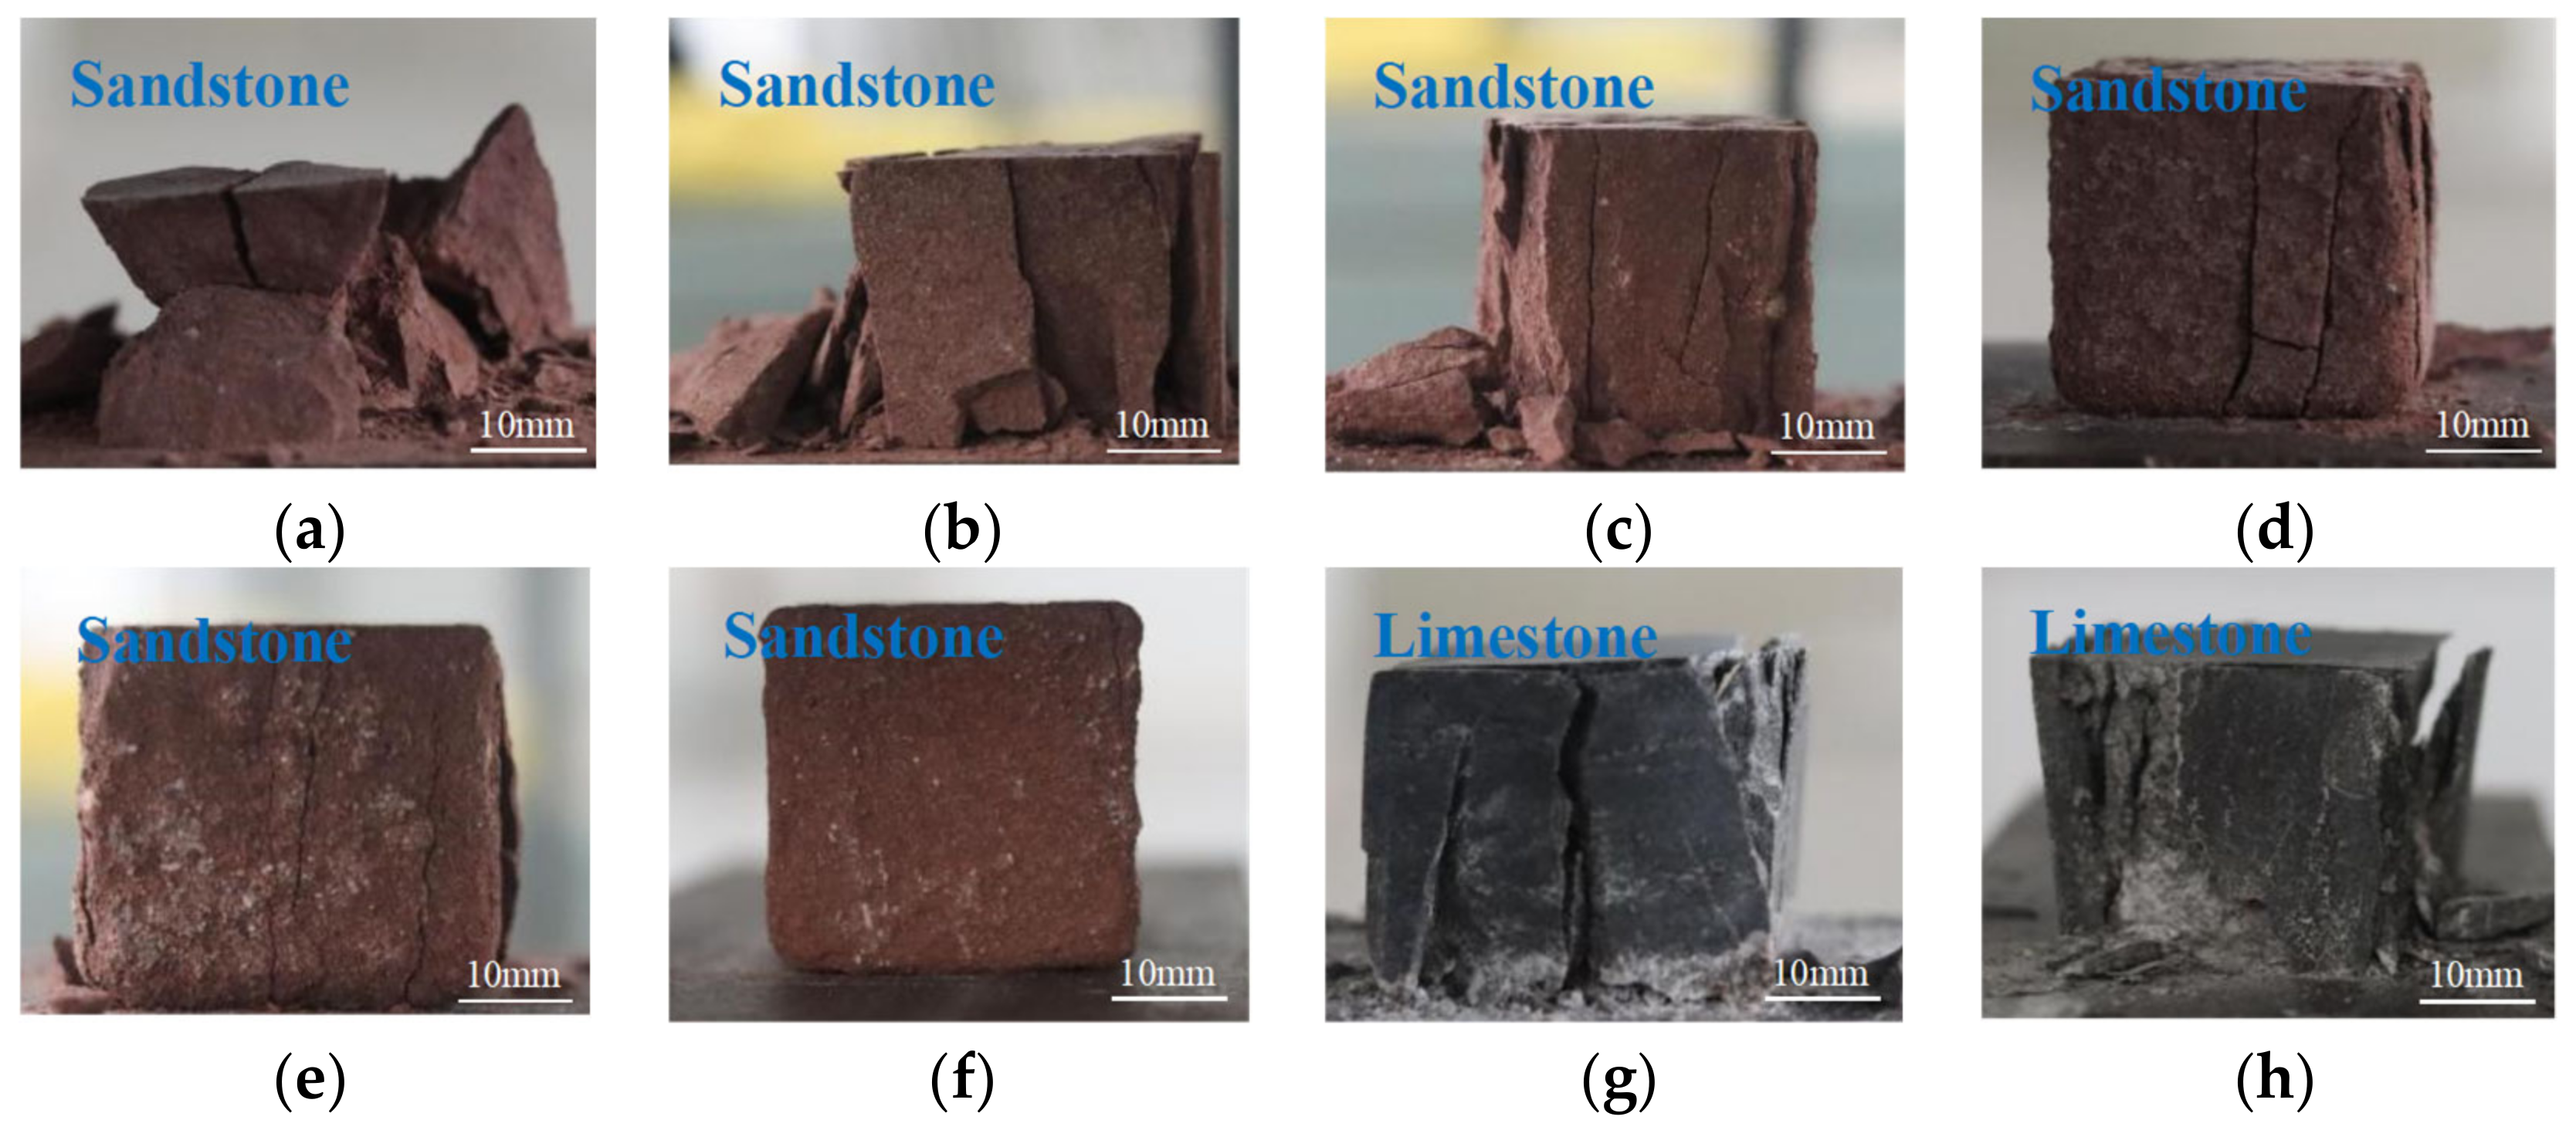
Characteristics of Uniaxial Compression Failure
The characteristics of uniaxial compression failure for the two types of rocks undergoing sulfate erosion are depicted in Figure 10. Let us first analyze the failure characteristics of sandstone.
  • For the rock samples subjected to cycles 1 to 15, the predominant failure modes are brittle and tensile failure. The axial force compresses the fractures within the rock sample and expands its volume, resulting in a relatively intact middle portion, while the remaining parts fracture into multiple small pieces. The overall integrity of the rock sample is poor.
  • At cycles 15 and 20, the bonding between particles weakens, leading to the emergence of multiple vertical cracks that penetrate the rock sample.
  • By cycle 25, the surface layer of the rock has completely softened, and a large number of cracks appear within the rock sample. Applying minimal pressure causes vertical cracks to form at the sides, resulting in sample failure. Despite this, the rock sample still maintains a relatively intact overall appearance, reflecting the softening and plasticity of sandstone after prolonged salt weathering.
Figure 10. Uniaxial compression failure characteristics of sandstone and limestone under sulfate erosion. (a) 0 cycles; (b) 5 cycles; (c) 10 cycles; (d) 15 cycles; (e) 20 cycles; (f) 25 cycles; (g) 0 cycles; (h) 25 cycles.
Applsci 13 12831 g010
In general, the initial state of the limestone samples is good, the particles are tightly arranged, and the damage caused by sulfate weathering is slight. The differences in the characteristics of uniaxial compression failure after different numbers of cycles are similar. As shown in Figure 10g,h, in the examples of failure after 25 days, the weathered limestone notably and primarily fails through axial splitting, displaying brittle damage characteristics. Multiple vertical cracks penetrate the rock sample at the sides, indicating a high degree of fragmentation and poor integrity.
(2)
Uniaxial Compressive Strength
Figure 11 presents the variation curves of unconfined compressive strength (UCS) and its loss in samples of sandstone and limestone subjected to sulfate erosion. The curves clearly illustrate that as the number of cycles increases, the strength values of both rock types consistently decrease. However, there are notable disparities in the rate of degradation between the two. Specifically, the strength values of sandstone demonstrate an initial rapid decline, followed by a slower decrease. This trend can be accurately described and modeled using an exponential function:
UCS = a b × c n
where UCS represents the uniaxial compressive strength, n represents the number of cycles, and a, b, and c are constants.
The strength values of limestone exhibit a trend of slow degradation followed by rapid decline, and also follow an exponential function trend:
UCS = a e n / b + c
In this equation, UCS represents the uniaxial compressive strength, n represents the number of cycles, and a, b, and c are constants.
Based on the magnitude of the strength variation, the sandstone sample experienced a decrease in strength from 77.81 MPa to 28.37 MPa after 25 cycles, while the limestone sample underwent a change from 139.26 MPa to 92.91 MPa. Both rock types exhibit a decrease of approximately 50 MPa. After 10 cycles, the surface structure of the sandstone sample was markedly different, having been damaged and softened, while the salt absorption remained stable. The integrity of the rock gradually improved, and the strength gradually decreased until it reached the limit value of the test sample. Due to the favorable initial condition of the limestone, the strength of the fresh limestone reaches an impressive 140 MPa. Moreover, the impact of salt crystallization on the limestone during the cycle is relatively limited, resulting in only minor damage. However, there is still significant potential for further decline in limestone strength. As the damage accumulates, the rate of deterioration of the limestone gradually increases [11].

3.2. Microscopic Weathering Indicators

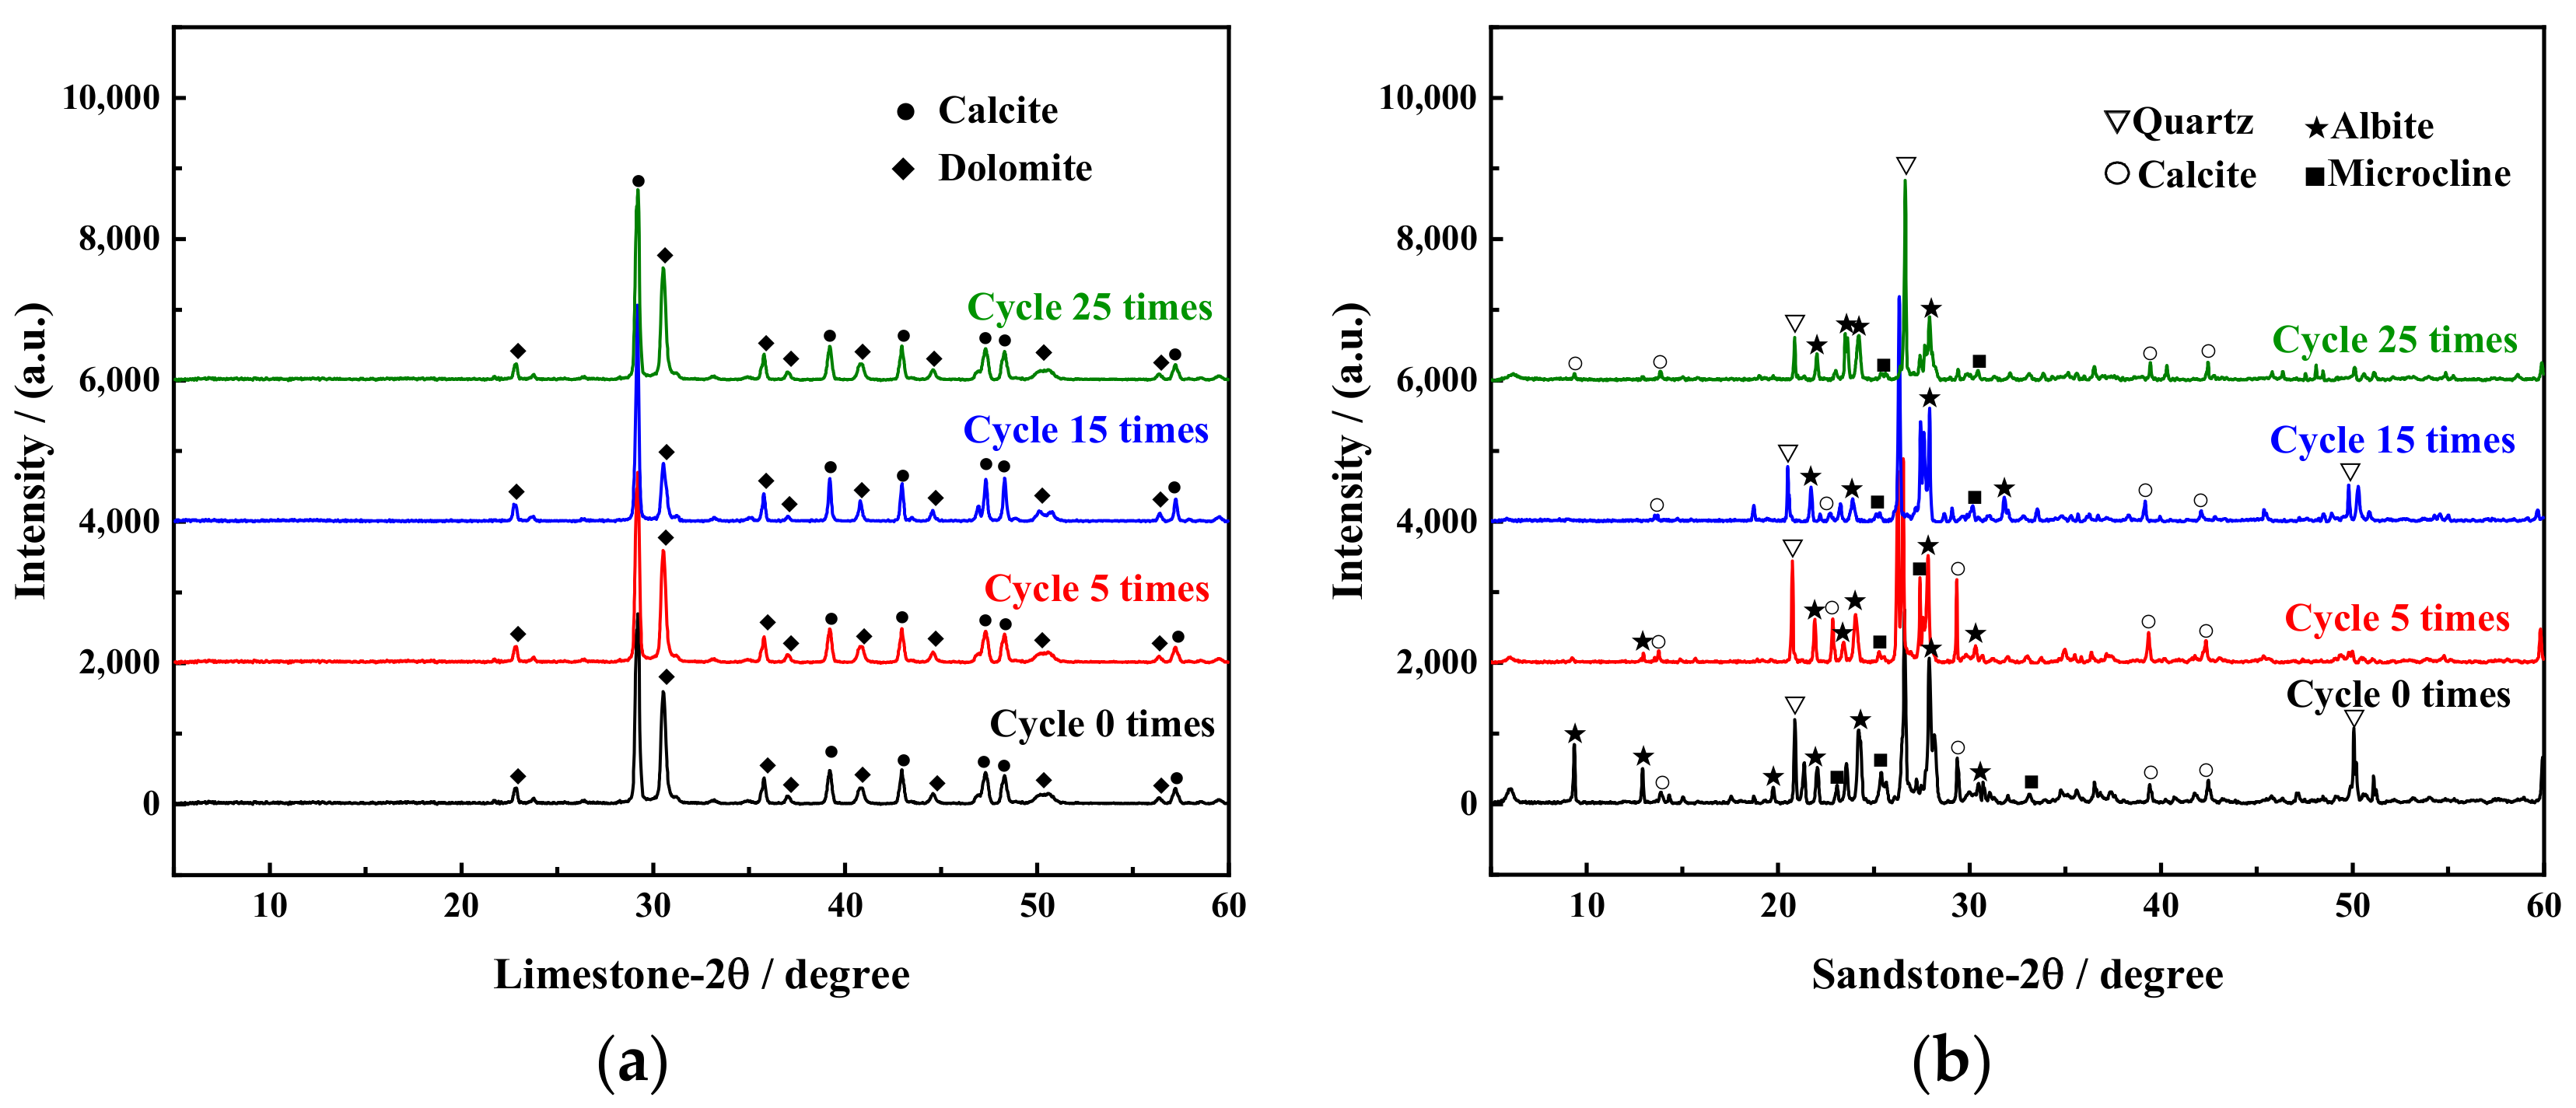
3.2.1. Variation of Composition Change Law

Figure 12 illustrates variation curves depicting the relative content of different components in two types of rocks obtained from X-ray diffraction analysis. To quantitatively analyze the changes in the composition content of rock samples after different numbers of cycle, a table (Table 3) was created to present the composition content of sandstone samples after 0, 5, 15, and 25 cycles. As shown in Figure 11a, as the number of cycles increased, the calcite content in the limestone samples consistently decreased while the dolomite content gradually increased. Notably, the peak value of dolomite continued to rise towards the conclusion of the experiment. This phenomenon can be attributed to the higher lattice energy and crystal stability of dolomite compared to calcite. Additionally, dolomite exhibits stronger ionic bonds and better resistance to weathering. Consequently, under similar environmental conditions, dolomite is less susceptible to disintegration [29]. Figure 11b primarily showcases variations in the composition and contents of sandstone samples. The curve in the figure indicates that the quartz content is the highest and continues to increase as the number of cycles increases. Following quartz, feldspar minerals exhibit the second-highest content. By the 25th cycle, the distribution range of feldspar minerals was markedly different and narrower, with only a few small peaks remaining. Notably, the variation in calcite content is the smallest when compared to other substances [30]. This indicates that the test methods and ranges of different precision instruments should be clarified when measuring the micro-weathering indexes of rocks, and errors caused by experimental tests should not be ignored.
To quantitatively analyze the changes in the composition content of sandstone rock samples at different cycle times, a table (Table 3) was produced from the performed X-ray analysis to present the composition of sandstone samples after 0, 5, 15, and 25 cycles. The total content of feldspar minerals and calcite decreased from 40–48% to 24–35%. This decrease can be attributed to the hydrolysis and hydration of these substances, with the intensity of the reaction increasing with longer immersion times. Additionally, the rock samples naturally contain clay minerals, and some minerals undergo illitization or kaolinitization, resulting in a 5–10% increase in clay mineral content. In comparison to other components, the quartz content continues to increase and represents over two-thirds of the total content by cycle 25. Based on the aforementioned analysis, it is evident that the limestone samples primarily consist of dolomite and calcite, and alterations to these two substances primarily occur during the salt weathering process. Specifically, after 25 cycles of salt weathering, the relative content of dolomite in the limestone samples increased from 25–35% to 55–65%, whereas the relative content of calcite decreased from 58–70% to 32–45%.

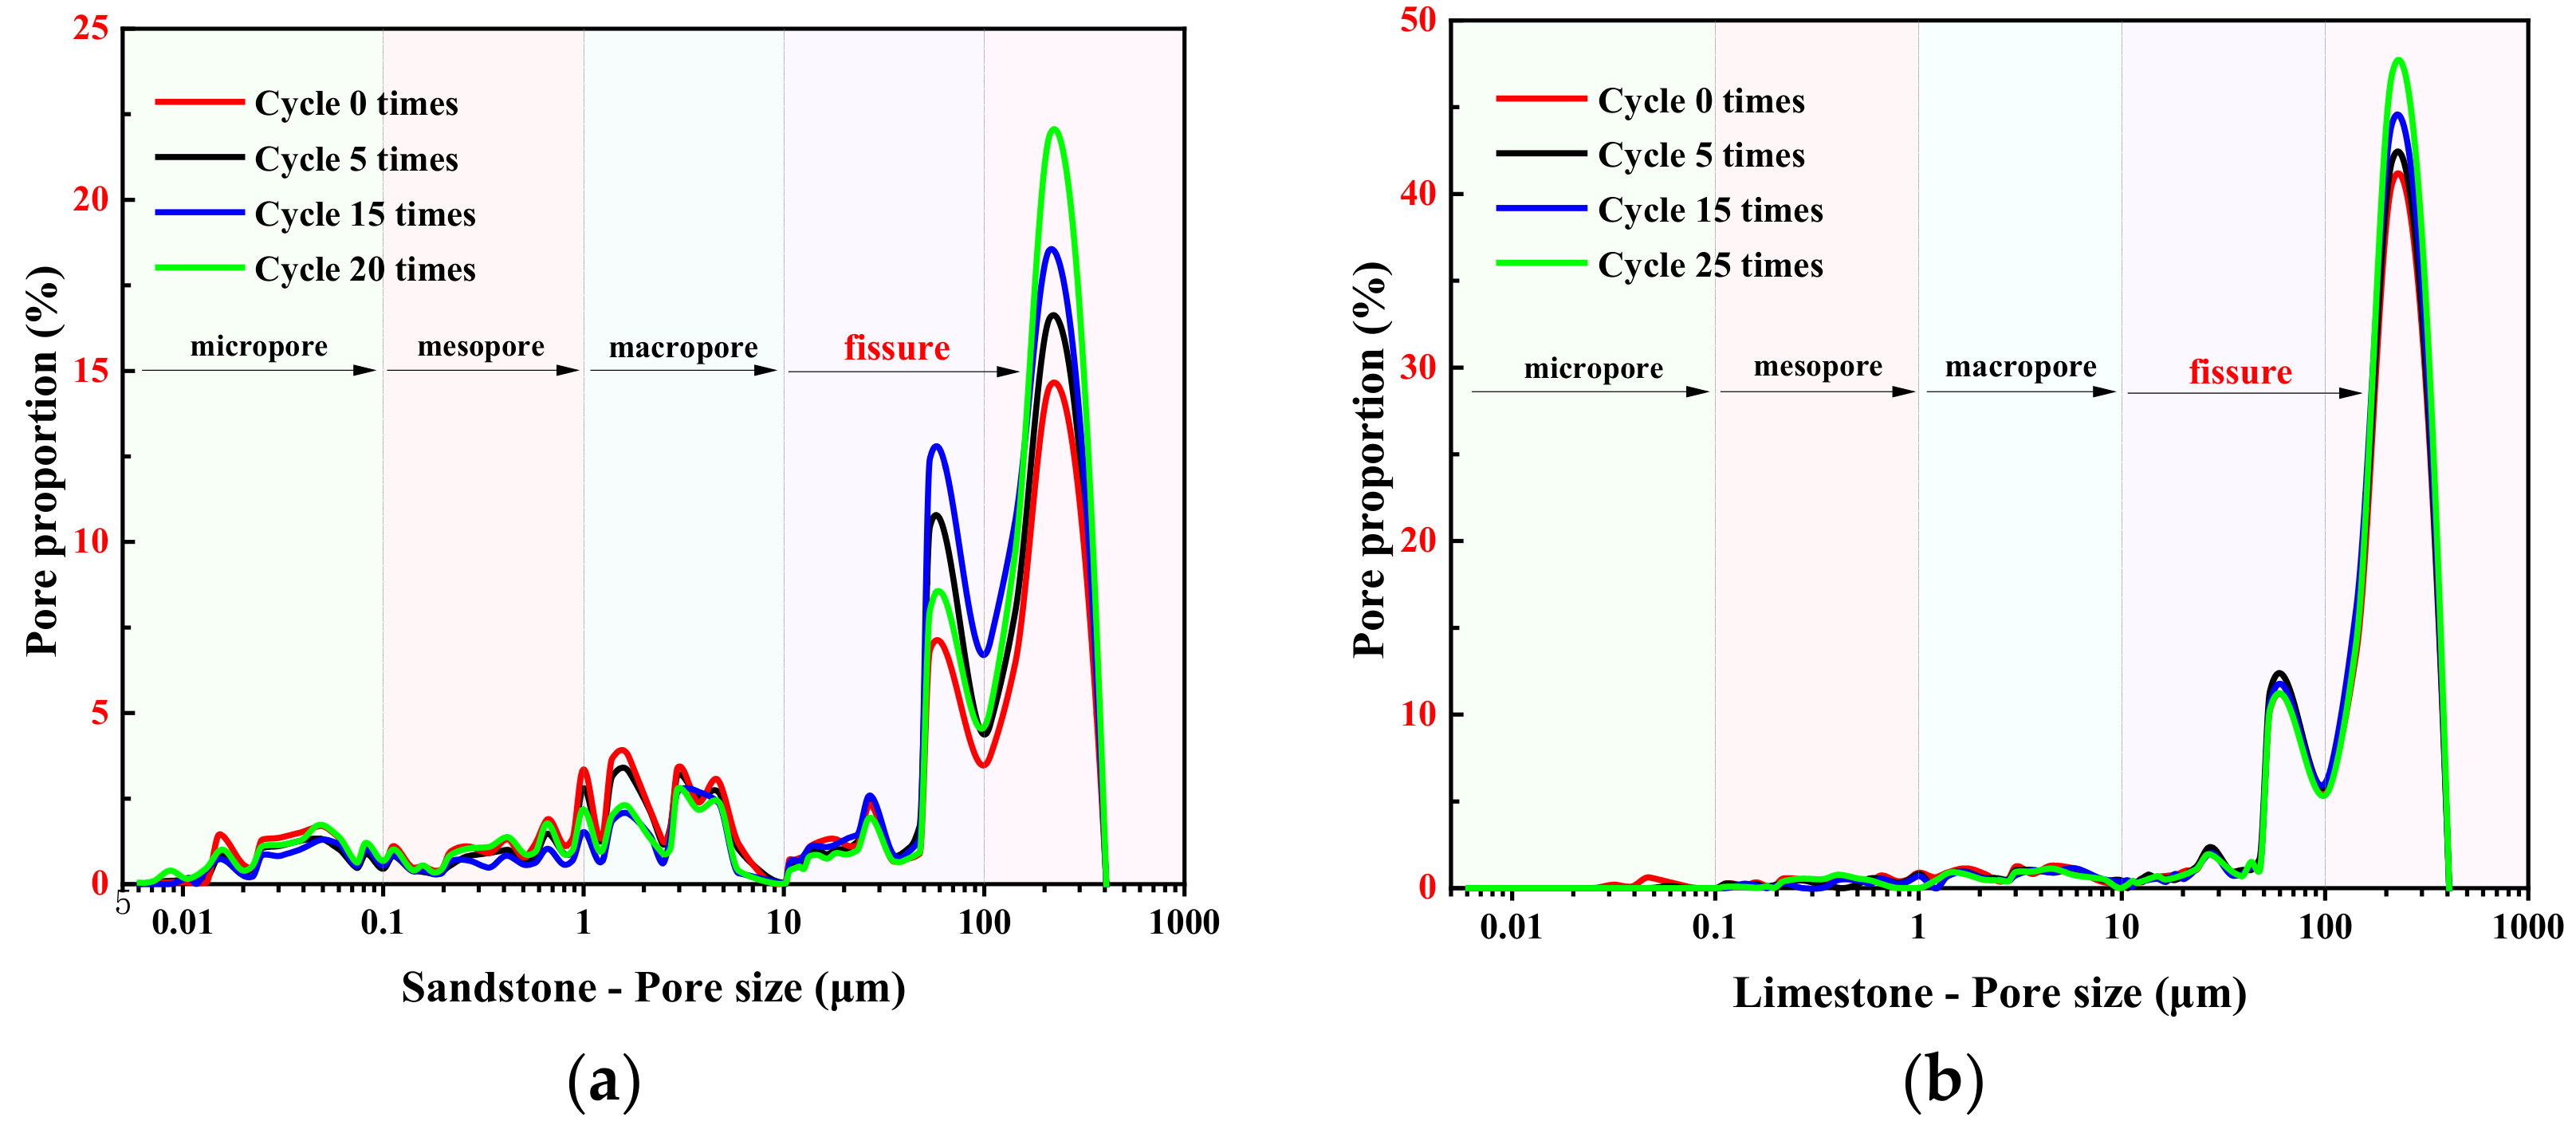
3.2.2. Pore Size Distribution Characteristics

The pore size distribution curves of limestone and sandstone are presented in Figure 13. Pores are classified into micropores (≤0.1 μm), mesopores (0.1–1 μm), macropores (1–10 μm), and fractures (≥10 μm) based on their size. Pore size plays a crucial role in determining the adsorption capacity (for salt solutions) of the initial rock sample, and the magnitude of its variation reflects the degree of rock deterioration [31]. The curves in Figure 13 reveal that Leshan sandstone exhibits a broad pore size distribution with distinct gradient levels, where pores larger than 1 μm account for over 90% of the total pores. In limestone, the pore sizes primarily range from 10 μm to 1000 μm, with peak values at approximately 85 μm and 121 μm, respectively. However, when considering experimental results and mercury intrusion porosimetry data, the porosity of sandstone is approximately 15% higher than that of limestone. This deviation may be attributed to the limitations of mercury intrusion porosimetry itself, as it faces challenges in measuring super-large pores (those larger than 300 μm). With an increase in cycle times, the number of pores larger than 1 μm in sandstone increases; this is particularly true of the proportion of pores larger than 10 μm, which grows from 40% to approximately 60%. The peak pore size remains at 115 μm. In comparison, the variation in pores smaller than 100 μm in limestone is minimal, while the content of pores larger than 100 μm increases by about 15%. Based on the displayed data alone, the growth rate of pores larger than 100 μm in sandstone is approximately 20% higher than that in limestone.

4. Discussion and Analysis

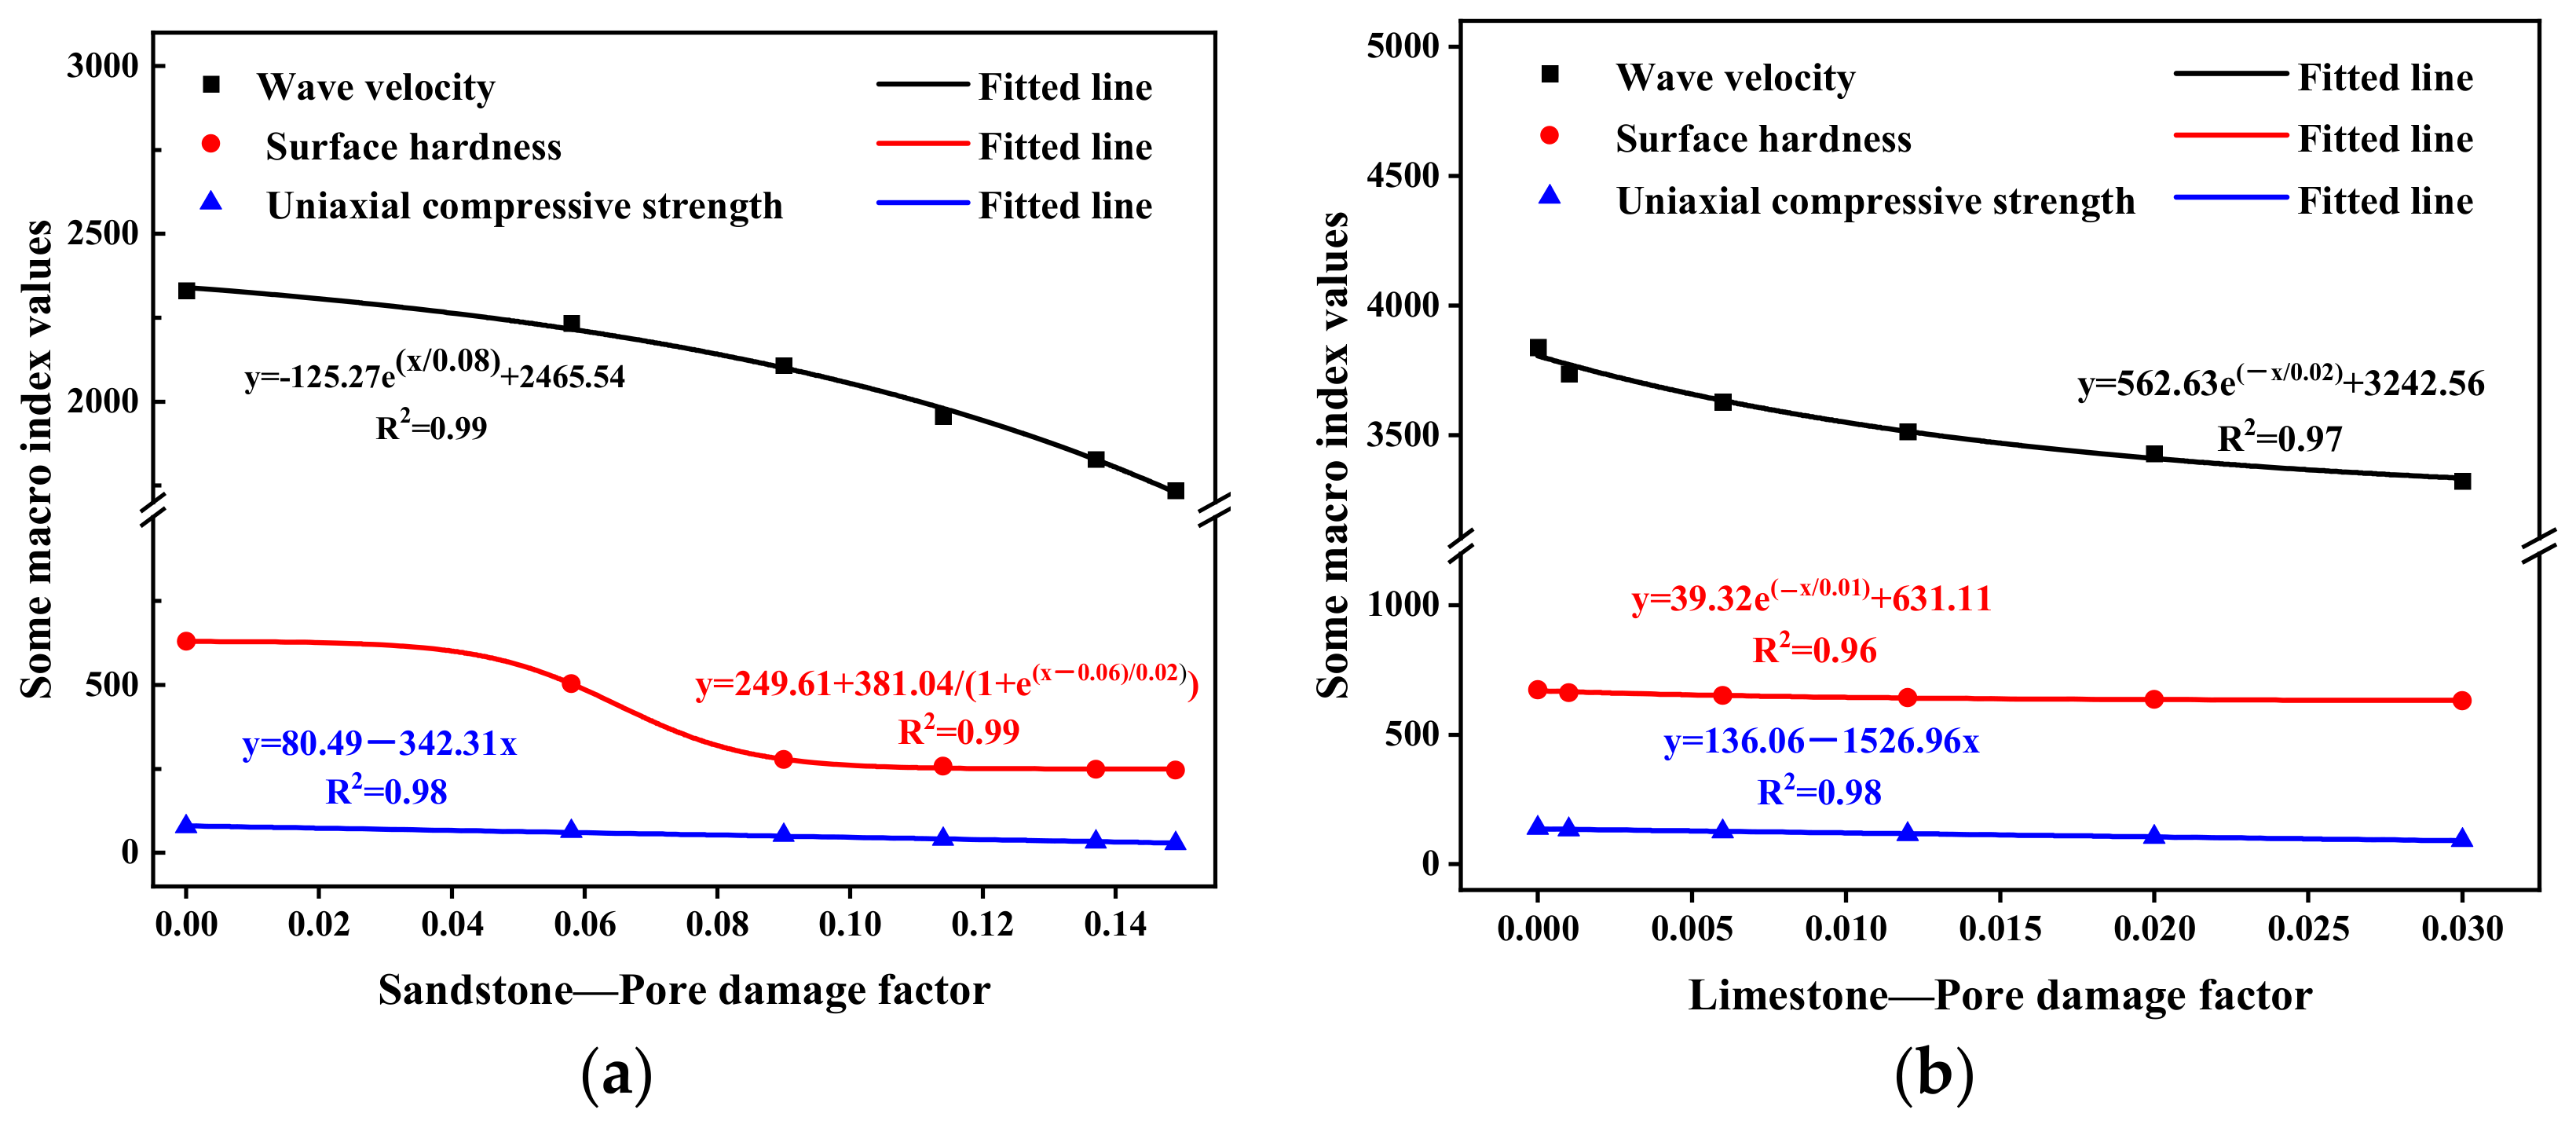
4.1. Exploration of the Correlation between Pore Characteristics and Macroscopic Indicators

Based on the above analysis, assessment of the negative impacts of sulfate erosion heavily relies on variations in pore structure, a term encompassing pore quantity, pore size, distribution, and connectivity. Furthermore, this variation is inherently connected to macroscopic indicators [32,33]. In this study, the pore damage factor (Equation (5)) was introduced as an independent variable, while macroscopic indicators such as surface hardness (reflecting the microstructure of the rock surface), wave velocity (reflecting the cracks in the rock), and strength parameters (representing the macroscopic manifestation of rock internal and external fissure) are treated as dependent variables. The relationship between pore damage and the extent of changes in macroscopic indicators is investigated based on the aforementioned curves [34].
D φ = φ n φ o 1 φ o
In the equation, Dφ represents the pore damage variable of the rock sample after n cycles, φo represents the initial porosity of the fresh rock sample, and φn represents the porosity of the rock sample after n cycles.
Figure 14 shows relationship curves between the pore damage factor and macroscopic indicators for sandstone and limestone; moreover, the horizontal coordinates of each point in the figure correspond to the pore damage factors of rock samples after 0 to 25 cycles (from left to right). When comparing the horizontal coordinates of each point in Figure 14a,b, one can observe that with same cycle times and after the same number of cycles, the pore damage factor of sandstone is approximately 2–4 times higher than that of limestone, indicating a more remarkable change in the pore structure of sandstone. Changes in the macro index values of wave velocity, surface hardness, and compressive strength, alongside the pore damage factor, can be fitted with exponential, exponential, and linear functions, respectively. However, the magnitude and rate of change differ distinctly between the two rock types. In sandstone, the wave velocity exhibits a slow-to-fast change trend, with an increasing pore damage factor; meanwhile, limestone shows an opposite trend, with a larger magnitude of change. Notably, when the pore damage factor ranges from 0.06 to 0.08, the outer layer of the sandstone sample experiences severe microstructural damage, resulting in a notable decrease in hardness. Furthermore, there is a strong linear correlation between the pore damage factors and strength parameters for both rock types, with fitting coefficients exceeding 0.98. These findings suggest that non-destructive testing methods, such as infrared and ultrasonic techniques, can be employed during the investigation of rock cultural heritage sites. The impact of infrared photography is contingent upon the interaction mode of the object with light. Objects that possess a high degree of infrared absorption appear darker in the image, while those with lower absorption exhibit brighter colors. These methods can help characterize the pore structure of heritage sites, determine the weathering conditions of different parts of the heritage sites, and predict the structural safety and stability of key areas in stone caves [35].

4.2. Analysis of the Differential Sensitivity of Macroscopic Indicators to Sulfate Erosion in Sandstone and Limestone

Due to the variations in initial lithology, including primary structure, pore characteristics, and material composition, the physical property indicators of sandstone and limestone exhibit different degrees of deterioration under sulfate erosion. However, the accuracy and sensitivity of different weathering indicators in assessing the extent of rock damage differ. In this study, the entropy weight–TOPSIS method (approaching the ideal solution) was utilized for visual analysis based on physical property indicators. The fundamental principle of the TOPSIS method is to identify the optimal and worst solutions within a finite scheme derived from the normalized original matrix. By calculating the relative proximity degree based on the distance between each target and the optimal and worst solutions, a comprehensive evaluation result can be obtained. This approach allows for the assessment of the research objects’ advantages and disadvantages. Firstly, five indicators, including mass change rate, dry density, and porosity, are normalized. Secondly, the data for each indicator are multiplied by the corresponding weight to assign weights to different weathering indicators. Finally, the distance between the evaluation object and the optimal scheme and the worst scheme is calculated, respectively, and the relative proximity between the evaluation object and the optimal scheme is obtained [36,37].
x i j * = x m a x x i j ;   i = 1 ,   2 ,   m ;   1 j n
z i j = x i j x i j 2   ;   j   i s   l i s t e d   a s   p o s i t i v e   i n d i c a t o r s ,   i = 1 ,   2 ,   m ;   1 j n x i j * x i j * 2   ;   j   i s   l i s t e d   a s   n e g a t i v e   i n d i c a t o r s ,   i = 1 ,   2 ,   m ;   1 j n
Z i j * = w 1 z 11 w 2 z 12 w n z 1 n w 1 z 21 w 2 z 22 w n z 2 n w 1 z m 1 w 2 z m 2 w n z m n
z + = z 1 + , z 2 + , , z n + = m a x ( w j z i j ) | i = 1,2 , , m
z = z 1 , z 2 , , z n = m i n ( w j z i j ) | i = 1 , 2 , , m
D i + = j = 1 n ( z j + z i j ) 2 ;   i = 1 ,   2 ,   m
D i = j = 1 n ( z j z i j ) 2 ;   i = 1 ,   2 ,   m
C i = D i D i + D i + ;   ( i = 1 ,   2 ,   m )
V i = C i 1 m C i ;   ( i = 1 ,   2 ,   m )
where x i j * represents the value of the negative indicator after positive normalization, x m a x is the maximum value of the column indicator, and z i j represents the normalized value after standardization. Equation (8) is the positive normalization function; Equation (9) represents the normalization function; Equation (10) is the weighted matrix; Equations (10) and (11) indicate the function for seeking the optimal solution; Equations (12) and (13) can be used to calculate the Euclidean distance of each evaluation object from the optimal solution and the worst solution; and Equations (14) and (15) indicate the function for indicator re-normalization. Under normal circumstances, C i can be used as the final evaluation score, but in order to reflect the vulnerability more directly, this paper adopts Equation (16) to normalize the relative proximity degree, and takes the processed V i as the final vulnerability evaluation score of the evaluation object, which then makes the maximum vulnerability 1 and the minimum vulnerability 0, so the quantization result is more intuitive.
Upon analyzing the comparison of weight factors for different weathering indicators in Figure 15a regarding the two types of rock, it can be concluded that the weight factor for the mass change rate is the highest, reaching approximately 0.25, under sulfate action. This indicates that particle detachment and mineral loss are the most notable deterioration characteristics of sandstone cultural heritage sites affected by sulfate erosion. The weight factors for other indicators in sandstone show minimal variation, primarily ranging from 0.13 to 0.17. The impact of infrared photography is contingent upon the interaction mode of the object with light. Objects that possess a high degree of infrared absorption appear darker in the image, while those with lower absorption exhibit brighter colors. This suggests that the variation in pore structure is a key indicator for assessing the deterioration of limestone cultural heritage sites and provides a more accurate reflection of limestone degradation. Using the weight factors of different indicators, macroscopic indicators are normalized using Equations (15) and (16). An overall assessment of the extent of damage in rock samples at different cycle numbers is conducted, and the results are presented on a curve (refer to Figure 15b). The curve demonstrates that the comprehensive degrees of damage to sandstone and limestone follow a similar variation trend, albeit with slight differences. Specifically, the damage degree of sandstone exhibits a rapid increase during the initial stage of salt weathering, whereas the damage degree of limestone increases at a relatively slower pace. This trend aligns with the changes observed in strength indicators for both rock types, further confirming the reliability of the entropy weight–TOPSIS method in evaluating the weathering status of rock cultural heritage sites.

5. Conclusions

This study investigates the effects of sulfate weathering on sandstone and limestone under specific climatic conditions. Simulated experiments were conducted to observe the apparent morphological characteristics of the rock samples and analyze the changes in macroscopic and microscopic indicators, including wave velocity, uniaxial compressive strength, mineral content, and pore size distribution. The relationship between pore characteristics and macroscopic indicators was analyzed, and the entropy weight–TOPSIS method was employed to assess the differential sensitivity of various weathering indicators in the two rock samples under sulfate erosion. The study aimed to comprehensively explore the weathering conditions of the rock samples based on multiple macroscopic indicators. The main findings are as follows.
(1)
Under sulfate erosion, the sandstone samples exhibited notable surface damage, including particle detachment, edge dulling, and increased crack and fissure width. The deterioration process occurred from top to bottom and from outer to inner layers. In contrast, the limestone sample showed only salt efflorescence on the surface, with minor damage to the edges and less noticeable changes in other areas. Some common characteristics of damage to rock cultural heritage sites under the influence of sulfate surface weathering include salt efflorescence, powder-like and flocculent detachment, and cracking.
(2)
The macroscopic indicators of both rock types, such as mass, wave velocity, and compressive strength, decreased to varying degrees, with sandstone deteriorating at a much faster rate than limestone. The number of cycles affecting both rock samples could be fitted with linear or exponential functions for wave velocity and compressive strength, but notable differences existed in their trends of change. The combined effects of the rock lithology and sulfate damage mechanism led to a gradual decrease in the calcite content and an increase in the dolomite content in the limestone sample. Additionally, the number of pores larger than 100 μm distinctly increased. In the sandstone sample, there was an obvious decrease in the content of calcite and feldspar minerals, a decrease in the number of pores smaller than 10 μm, and a significant increase in the number of pores larger than 14 μm.
(3)
Sulfate weathering induced physical and chemical reactions that accumulated microstructural damage in the surface layer of the rock samples, resulting in visible instantaneous macroscopic damage and a series of changes in macroscopic indicators, such as reduced mass, decreased wave velocity, and weakened strength. The pore damage factor of sandstone was approximately 2–4 times higher than that of limestone. The pore damage factors of both rock types could be fitted with exponential (y = ae(x/b) + c), exponential (y = a + b/(1 + e(xc)/d), and linear (y = ax + b) functions for wave velocity, surface hardness, and compressive strength, respectively (where a, b, c and d are constants). However, there were notable differences in the magnitude and rate of change.
(4)
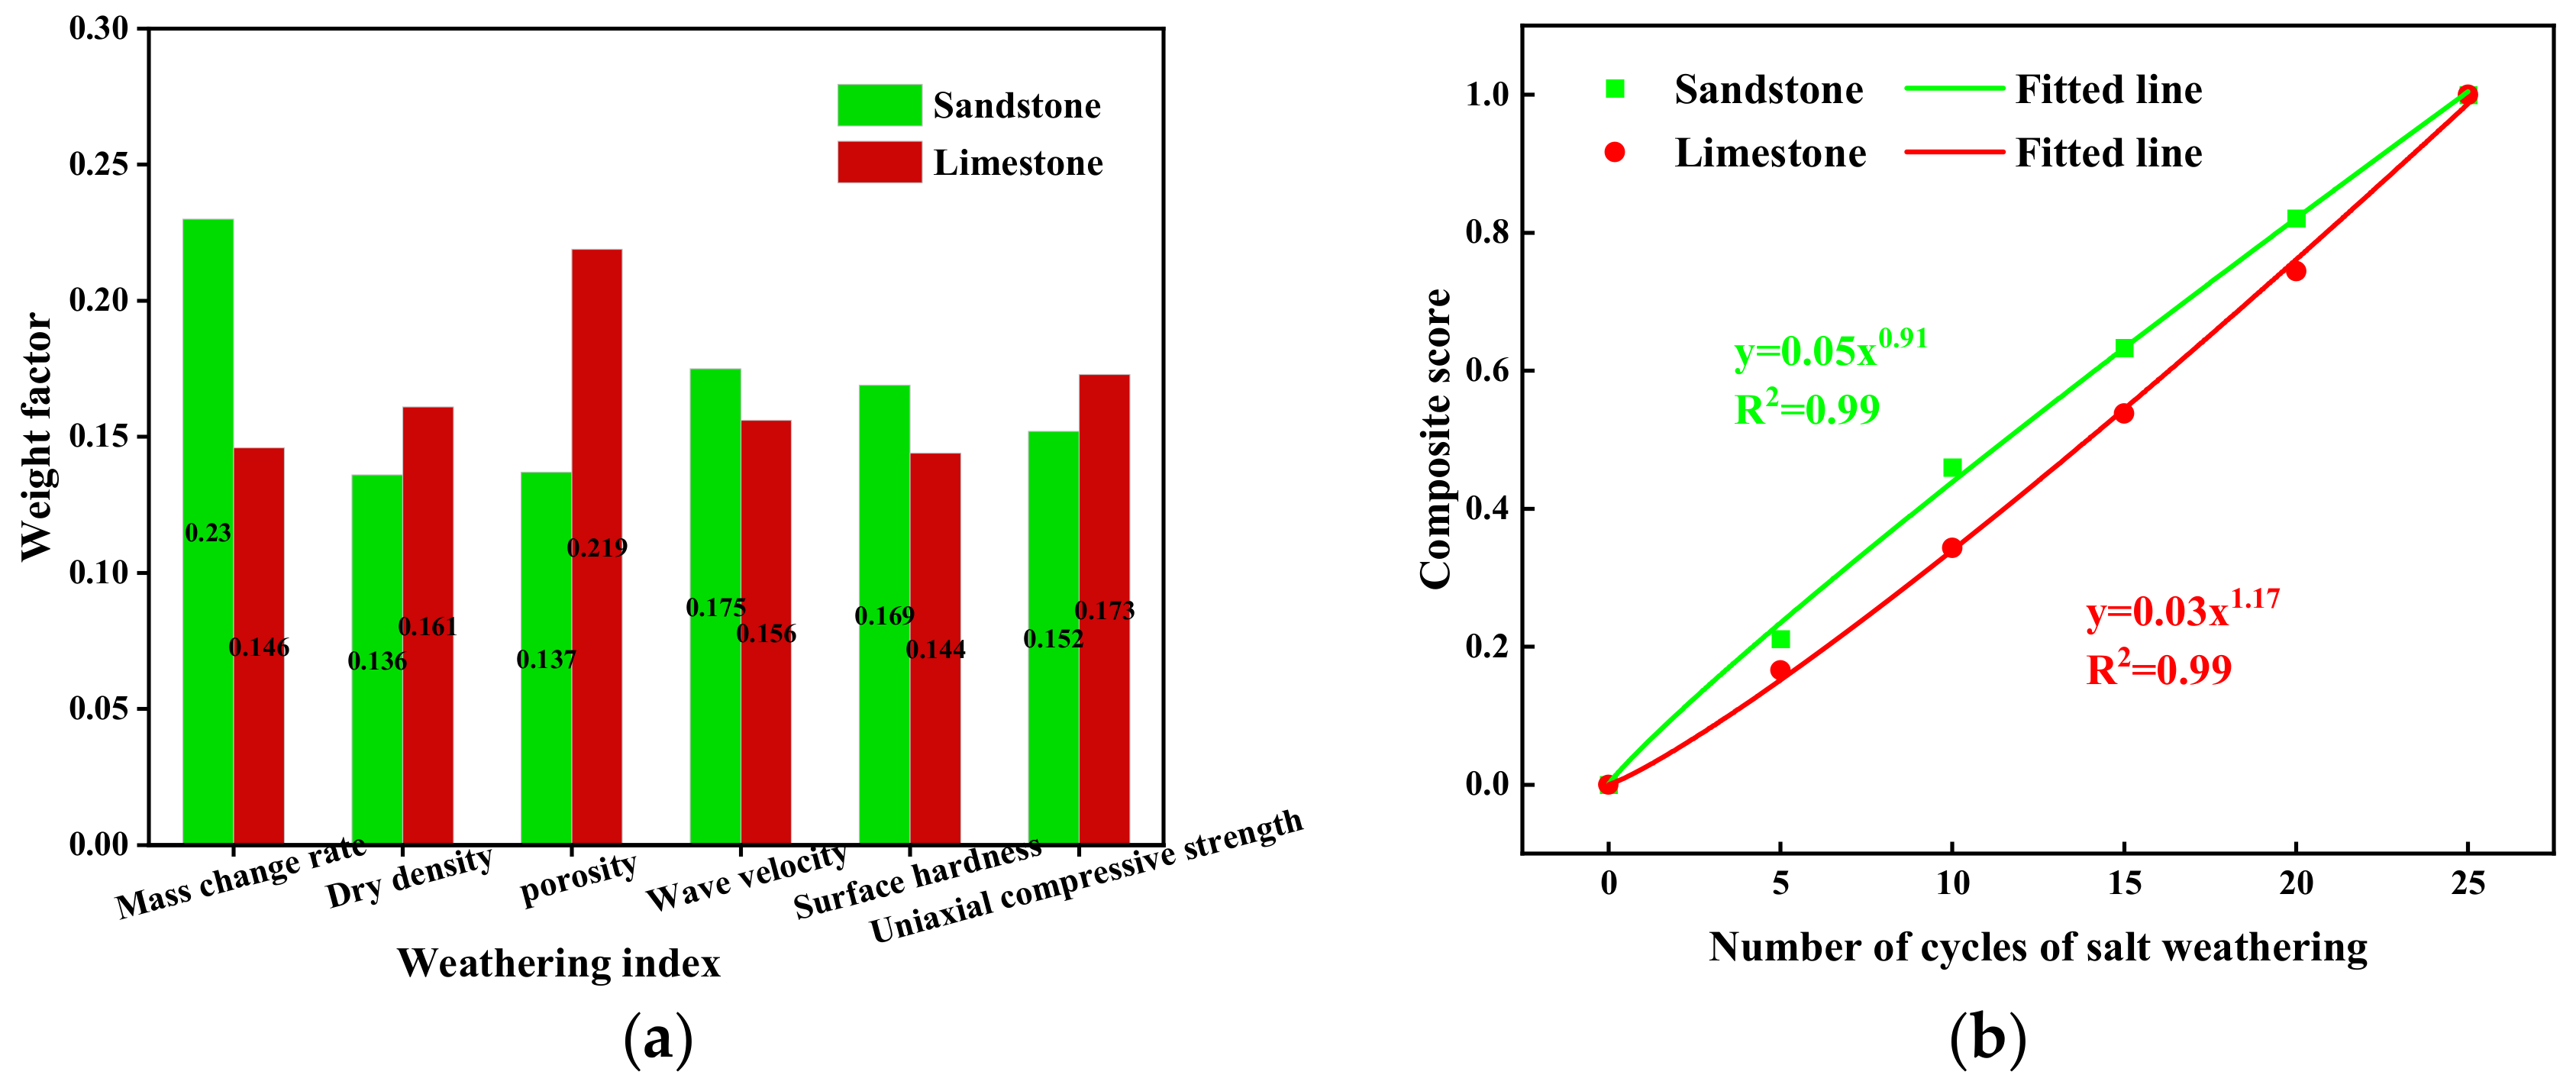
The entropy weight–TOPSIS method was used to comprehensively evaluate the rock damage state by normalizing multiple indicators, assigning weights to different weathering indicators, and calculating the relative proximity to the distance between the best and worst solutions for each indicator. The weight factor for mass loss was the highest in the sandstone sample, while the porosity of the limestone sample reflected a sensitivity to sulfate erosion. Overall, the sandstone exhibited a fast–slow change trend in its overall damage level, while limestone exhibited a slow–fast decay trend.

Author Contributions

Conceptualization, N.P. and J.H. (Jizhong Huang); methodology, Y.Z. (Ye Zhu) and J.H. (Jie Hong); software, Y.Z. (Ye Zhu); validation, Y.Z. (Yue Zhang).; formal analysis, J.H. (Jie Hong), Y.Z. (Ye Zhu); investigation, J.H. (Jie Hong); writing—original draft preparation, N.P. and J.H. (Jie Hong); writing—review and editing, Y.Z. (Ye Zhu) and J.H. (Jizhong Huang); funding acquisition, J.H. (Jizhong Huang) and N.P. All authors have read and agreed to the published version of the manuscript.

Funding

This research was funded by the National Key Research and Development Program of China (No. 2019YFC1520500), and the National Natural Science Foundation of China (No. 51808246, 52078373).

Institutional Review Board Statement

Not applicable.

Informed Consent Statement

Not applicable.

Data Availability Statement

The authors confirm that the data supporting the findings of this study are available within the article.

Conflicts of Interest

The authors declare no conflict of interest.

References

  1. Liu, J.C.; Xiao, L.Z.; Xie, Z.B. Protection of stone cultural relics in China: Analysis of NSFC-funded projects. Sci. Conserv. Archaeol. 2019, 31, 112–119. [Google Scholar]
  2. Yi, Y.; Chen, Y. An Analysis of the Statistics on Major Historical and Cultural Sites Protected at the National Level. Southeast Cult. 2021, 4, 6–15. [Google Scholar]
  3. Wang, J.H.; Chen, J.Q. Current Status and Future Development of Cave Temples Protection in China. Southeast Cult. 2018, 1, 6–14 + 127–128. [Google Scholar]
  4. Steiger, M.; Asmussen, S. Crystallization of sodium sulfate phases in porous materials: The phase diagram Na2SO4·H2O and the generation of stress. Geochim. Cosmochim. Acta 2008, 72, 4291–4306. [Google Scholar] [CrossRef]
  5. Oguchi, C.T.; Yu, S. A review of theoretical salt weathering studies for stone heritage. Prog. Earth Planet. Sci. 2021, 8, 32–55. [Google Scholar] [CrossRef]
  6. Holynska, B.; Gilewicz-Wolter, J.; Ostachowicz, B.; Bielewski, M.; Streli, C.; Wobrauschek, P. Study of the deterioration of sandstone due to acid rain and humid SO2 gas. X-Ray Spectrom. 2010, 33, 342–348. [Google Scholar] [CrossRef]
  7. Behlen, A.; Steiger, M.; Dannecker, W. Deposition of sulfur dioxide to building stones: The influence of the ambient concentration on the deposition velocity. Environ. Geol. 2008, 56, 595–603. [Google Scholar] [CrossRef]
  8. Ruiz-Agudo, E.; Mees, F.; Jacobs, P.; Rodriguez-Navarro, C. The role of saline solution properties on porous limestone salt weathering by magnesium and sodium sulfates. Environ. Geol. 2007, 52, 269–281. [Google Scholar] [CrossRef]
  9. Li, L.; Wang, S.J.; Tanimoto, C. Study of weathering characteristics of sandstone at longyou grottoes. Chin. J. Rock Mech. Eng. 2008, 6, 1217–1222. [Google Scholar]
  10. Martinez, M.; Benavente, D.; Garcia, M. Spatial attenuation: The most sensitive ultrasonic parameter for detecting petrographic features and decay processes in carbonate rocks. Eng. Geol. 2011, 119, 84–95. [Google Scholar] [CrossRef]
  11. Theoulakis, P.; Moropoulou, A. Microstructural and mechanical parameters determining the susceptibility of porous building stones to salt decay. Constr. Build. Mater. 1997, 11, 65–71. [Google Scholar] [CrossRef]
  12. Wilhelm, K.; Viles, H.; Burke, O.; Mayaud, J. Surface hardness as a proxy for weathering behaviour of limestone heritage: A case study on dated headstones on the Isle of Portland, UK. Environ. Earth Sci. 2016, 75, 931–947. [Google Scholar] [CrossRef]
  13. Riontino, C.; Sabbioni, C.; Ghedini, N.; Zappiaa, G.; Gobbi, G.; Favoni, O. Evaluation of atmospheric deposition on historic buildings by combined thermal analysis and combustion techniques. Thermochim. Acta 1998, 321, 215–222. [Google Scholar] [CrossRef]
  14. Angeli, M.; Bigas, J.-P.; Benavente, D.; Menéndez, B.; Hébert, R.; David, C. Salt crystallization in pores: Quantification and estimation of damage. Environ. Geol. 2007, 52, 205–213. [Google Scholar] [CrossRef]
  15. Yan, S.J.; Fang, Y.; Liu, J.H.; Tan, S.E. Deterioration experiment with soluble salt on sandstone of Yungang grottoes and its model creation. Rock Soil Mech. 2013, 34, 3410–3416. [Google Scholar]
  16. Zhang, L.; Wang, Y.; Zhang, J.; Zhang, S.; Guo, Q. Rockfall hazard assessment of the slope of Mogao Grottoes, China based on AHP, F-AHP and AHP-TOPSIS. Environ. Earth Sci. 2022, 81, 377. [Google Scholar] [CrossRef]
  17. Yao, X.; Sun, M.L. The Quantitative Evaluation of Deterioration Degrees of Earthen Sites Based on Gray Correlation Analysis. Dunhuang Res. 2016, 128–134. [Google Scholar]
  18. Lan, H.X.; Lv, H.T.; Bao, H.; Li, L.; Chne, W.; Guo, J.; Liu, S. Advances in Degradation and Instability Mechanism of Grotto Temple Rock Mass. Earth Sci. 2023, 48, 1603–1633. [Google Scholar]
  19. Guo, F.; Jiang, G.H. Investigation into rock moisture and salinity regimes: Implications of sandstone weathering in Yungang Grottoes, China. Carbonates Evaporites 2015, 30, 1–11. [Google Scholar] [CrossRef]
  20. Lu, H.; Fu, W.L.; Chai, J.; Liu, S.; Sun, Z. Analysis of Sandstone in Leshan Giant Buhhda Based on Hand-Held X-ray Fluorescence Spectrometer. Spectrosc. Spectr. Anal. 2022, 42, 2506–2512. [Google Scholar]
  21. Ministry of Land and Resources, People’s Republic of China. GZ/T 0276.1-2015; Test Rules for Rock Physical Properties. Standards Press of China: Beijing, China, 2015.
  22. Wang, Y.; Viles, H.; Desarnaud, J.; Yang, S.; Guo, Q. Laboratory simulation of salt weathering under moderate ageing conditions: Implications for the deterioration of sandstone heritage in temperate climates. Earth Surf. Process. Landf. 2021, 46, 1055–1066. [Google Scholar] [CrossRef]
  23. Andrea, H.; Robert, I.M. Raman spectra of mirabilite, Na2SO4·10H2O and the rediscovered metastable heptahydrate, Na2SO4·7H2O. J. Raman Spectrosc. 2010, 41, 1014–1020. [Google Scholar]
  24. Sun, M.L.; Liang, C.X.; Shen, Y.X.; Shang, X.J.; Cao, Z.J. Characteristics of salt damage to sandstone grottoes in Northwest China and contributing factors. J. Earth Environ. 2022, 13, 543–556. [Google Scholar]
  25. Sun, D.; Zhou, Q.; Sun, W. Effect of Sulfate Crystallization on Sandstone in the Yungang Grottoes. Res. Sq. 2021, 1, 1–24. [Google Scholar]
  26. Wang, F.R.; Jiao, D.; Liu, P.; Sun, B.; Wang, J.J.; Yang, H.R. Experimental study on the effect of sulfate on glutenite weathering in Maijishan grottoes. Rock Soil Mech. 2020, 41, 2199–2206. [Google Scholar]
  27. Lee, J.S.; Yoon, H.K. Characterization of rock weathering using elastic waves: A Laboratory-scale experimental study. J. Appl. Geophys. 2017, 140, 24–33. [Google Scholar] [CrossRef]
  28. Zhang, J.; Huang, J.; Liu, J.; Jiang, S.; Li, L.; Shao, M. Surface weathering characteristics and degree of Niche of Sakyamuni Entering Nirvana at Dazu Rock Carvings, China. Bull. Eng. Geol. Environ. 2018, 78, 3891–3899. [Google Scholar] [CrossRef]
  29. Ma, T.; Ding, W.X.; Wang, H.Y.; Chen, G.X.; Chen, H.J.; Yan, Y.Y. Dissolution characteristics and mechanical properties of limestone with different mineral composition contents eroded by acid chemical solution. Chin. J. Geotech. Eng. 2021, 43, 1550–1557. [Google Scholar]
  30. Chen, W.-C.; Li, L.; Shao, M.-S.; Liang, X.-Z.; Lekan Olatayo, A. Experimental study on carbonate dissolution and erosion effect under attack of simulated sulphuric acid rain. Chin. J. Geotech. Eng. 2017, 39, 2058–2067. [Google Scholar]
  31. Ge, X.-B.; Li, J.-J.; Lu, S.-F.; Chen, F.-W.; Yang, D.-X.; Wang, Q. Fractal characteristics of tight sandstone reservoir using mercury intrusion capillary pressure—A case of tight sandstone reservoir in Jizhong Depression. Lithol. Reserv. 2017, 29, 106–112. [Google Scholar]
  32. Hebib, R.; Belhai, D.; Alloul, B. Estimation of uniaxial compressive strength of North Algeria sedimentary rocks using density, porosity, and Schmidt hardness. Arab. J. Geosci. 2017, 10, 383–396. [Google Scholar] [CrossRef]
  33. Katz, O.; Reches, Z.; Roegiers, J.C. Evaluation of mechanical rock properties using a Schmidt Hammer. Int. J. Rock Mech. Min. Sci. 2000, 37, 723–728. [Google Scholar] [CrossRef]
  34. Ding, W.X.; Feng, X.T. Study on chemical damage effect and quantitative analysis method of meso-structure of limestone. Chin. J. Rock Mech. Eng. 2005, 24, 1283. [Google Scholar]
  35. Wang, N.; Zhao, X.; Wang, L.; Zou, Z. Novel System for Rapid Investigation and Damage Detection in Cultural Heritage Conservation Based on Deep Learning. J. Infrastruct. Syst. 2019, 25, 04019020. [Google Scholar] [CrossRef]
  36. Yang, J.C.; Zhao, C. Survey on K-Means Clustering Algorithm. Comput. Eng. Appl. 2019, 55, 7–14+63. [Google Scholar]
  37. Jordan, M.I.; Mitchell, T.M. Machine learning: Trends, perspectives, and prospects. Science 2015, 349, 255–260. [Google Scholar] [CrossRef]
Figure 1. Macroscopic characteristics of sandstone and limestone. (a) Macroscopic characteristics of sandstone samples; (b) macroscopic characteristics of limestone samples.
Applsci 13 12831 g001
Figure 2. Operational steps of the cyclic experiment. (a) Soaking in saturated sodium sulfate solution; (b) salt crystallization under constant temperature and humidity conditions; (c) salt efflorescence on the surface of sandstone.
Applsci 13 12831 g002
Figure 3. Microstructural damage mechanism of rock cultural heritage sites undergoing sulfate erosion.
Applsci 13 12831 g003
Figure 4. Apparent morphological characteristics of the sandstone samples. (a) After 10 cycles; (b) after 15 cycles; (c) after 20 cycles; (d) after 25 cycles.
Applsci 13 12831 g004
Figure 5. Apparent morphological characteristics of limestone samples. (a) After 10 cycles; (b) after 15 cycles; (c) after 20 cycles; (d) after 25 cycles.
Applsci 13 12831 g005
Figure 6. Typical damage morphology of rock artifacts under sulfate erosion.
Applsci 13 12831 g006
Figure 8. Variation curves of surface hardness and hardness loss for sandstone and limestone. (a) variation curves of surface hardness for the two types of rocks; (b) comparison chart of hardness loss for the two types of rocks.
Applsci 13 12831 g008
Figure 9. Variation curves of P-wave velocity and its loss for sandstone and limestone. (a) Variation curves of P-wave velocity for the two rock samples; (b) variation curves of P-wave velocity loss for the two rock samples.
Applsci 13 12831 g009
Figure 11. Sandstone and limestone uniaxial compressive strength and loss variation curves. (a) Two types of rock uniaxial compressive strength variation curves; (b) two types of rock strength loss variation curves.
Applsci 13 12831 g011
Figure 12. Variation curves of relative content of components in limestone and sandstone under sulfate weathering. (a) Variation curve of relative content of components in limestone; (b) variation curve of relative content of components in sandstone.
Applsci 13 12831 g012
Figure 13. Pore size distribution curves of limestone and sandstone under sulfate erosion. (a) Sandstone pore size distribution characteristics; (b) limestone pore size distribution characteristics.
Applsci 13 12831 g013
Figure 14. Relationship curves between the pore damage factor and macroscopic indicators of sandstone and limestone. (a) Relationship curves between the pore damage factor and macroscopic weathering indicators of sandstone; (b) relationship curves between the pore damage factor and macroscopic weathering indicators of limestone.
Applsci 13 12831 g014
Figure 15. Comparison of the differential sensitivity of weathering indicators in sandstone and limestone based on the entropy weight–TOPSIS method. (a) Comparison of weight factors for different weathering indicators in two types of rocks; (b) curve showing the variation in damage level of rock samples after different numbers of cycles.
Applsci 13 12831 g015
Table 1. Basic physical parameters of fresh sandstone and limestone.
Rock TypeDry Density
rd/g·cm−3
Water Absorption
ω/%
Total Porosity
φ/%
Leeb Hardness
R/HL
Wave Velocity
ʋ/s·m−1
Uniaxial Compressive Strength
UCS/MPa
Sandstone 2.25 0.12 + 0.21 2.68 0.24 + 0.17 7.59 0.36 + 0.27 632 25 + 16 2400 200 + 350 77.85 5.85 + 7.96
Limestone 2.69 0.11 + 0.16 0.17 0.03 + 0.08 0.68 0.21 + 0.18 685 15 + 10 3400 250 + 300 140.25 10.25 + 6.45
Table 2. Relative contents of fresh sandstone.
Mineral CompositionQuartzAlbiteMicroclineCalciteClay Minerals
Relative content (%)46–5518–257–1213–193–7
Table 3. Composition content of sandstone samples after different numbers of cycles.
Cycle NumberQuartz (%)Albite (%)Microcline (%)Calcite (%)Clay Minerals (%)
046–5518–258–1215–225–7
552–6016–237–1215–206–9
1558–6812–186–1012–167–14
2565–757–143–97–1010–19
Disclaimer/Publisher’s Note: The statements, opinions and data contained in all publications are solely those of the individual author(s) and contributor(s) and not of MDPI and/or the editor(s). MDPI and/or the editor(s) disclaim responsibility for any injury to people or property resulting from any ideas, methods, instructions or products referred to in the content.

