Article

Numerical Simulation of Seepage Surface and Analysis of Phreatic Line Control from a Fine-Grained Tailings High Stacked Dam under Complicated Geography Conditions

1
Faculty of Land Resources Engineering, Kunming University of Science and Technology, Kunming 650093, China
2
Beijing General Research Institute of Mining and Metallurgy Technology Group, Beijing 100084, China
3
Yunnan International Technology Transfer Center for Mineral Resources Development and Solid Waste Resource Utilization, Kunming 650093, China
4
State Key Laboratory of Hydroscience and Engineering, Department of Hydraulic Engineering, Tsinghua University, Beijing 100084, China
*
Author to whom correspondence should be addressed.
Appl. Sci. 2023, 13(23), 12859; https://doi.org/10.3390/app132312859
Submission received: 3 November 2023 / Revised: 26 November 2023 / Accepted: 28 November 2023 / Published: 30 November 2023

Abstract

:
Background: It is adverse for the safety of a tailings dam to use fine-grained tailings as the materials for a high tailings dam because of the low penetration coefficient, the slow consolidating velocity, and the bad physical mechanical property. Furthermore, with the influence of complicated geography conditions, the phreatic line will be increased enormously when encountering special conditions, which directly affect the safe operation of the tailings dam. Methods: In this study, based on the engineering, geological, and hydrogeological conditions and survey results of a tailings dam, a 210 m fine-grained tailings dam located in three gullies was selected and used to simulate the three-dimensional seepage field of a tailings dam under a steady saturated state by using the finite element software MIDAS GTS. The permeability coefficient was inverted, the seepage field of the project under different working conditions was simulated, and the position of the phreatic line was obtained. The controlled position of phreatic lines was determined by combining the seepage field with the stability requirements. Results: Back analysis could accurately reflect the actual permeability coefficient of each partition of tailings dams. Due to the multiple areas of seepage accumulation, large valley corners, and narrowing of the dam axis, the phreatic line of the shoulder region was elevated by 2~3 m compared to the surrounding area and was thereby the most critical region of the tailings dam seepage control. The stability requirements and minimum controlled position of the phreatic line requirements could be met when the controlled position of the phreatic line was 23 m. Conclusion: This study revealed the key areas and reasons why the tailings dam’s phreatic line is prone to be uplifted under complicated geography conditions. It was very critical to control the local phreatic line by adopting local horizontal seepage drainage measures or radiation wells in the key areas of the tailings dam to ensure the safety of the tailings dam. In addition to strengthening the daily monitoring of the key areas and the exfiltration facilities of the tailings dam, it is recommended to carry out determination tests of the permeability coefficient and particle size at regular intervals. The findings could provide countermeasures for seepage control.

1. Introduction

A tailings dam is an essential solid waste storage facility in mining production and has been recognized as a kind of man-made source of danger with a high potential energy and high collapsing force [1,2,3,4]. In particular, a tailings dam with a storge capacity greater than 1 million cubic meters and high dams is a major hazard. The tailings dam will cause huge disasters to the lives, property, and environment of downstream people once an accident occurs, and the consequences are incalculable [5,6,7,8,9,10]. As an example, the Brumadinho tailings dam in Brazil failed in 2019. The dam failure resulted in the spillage of nearly 1.17 million cubic meters of tailings, covering approximately 9 km downstream and inundating an area of 300,000 square meters, which ultimately resulted in the deaths of 259 people and the disappearance of 11 others [11]. According to incomplete statistics, more than 20,000 tailings dams have been built around the world, with the larger ones having a capacity of 10 million cubic meters or even more than 100 million cubic meters [12]. China is a large mining country with more than 15,000 tailings dams, discharging 300 million tonnes of tailings per year. Currently, the most serious tailings dam accident in China was the tailings dam failure of Xinta Mining Company in Xiangfen County, Shanxi Province, which resulted in 258 deaths, 34 injuries, and environmental pollution damage [13]. With the increasing improvement of technological levels, tailing dams are developing in the direction of high fine-grained tailing dams. In recent years, some gold mines have produced tailings, more than 90% of which were smaller than 74 μm and more than 90% of which were smaller than 37 μm, in order to improve gold recovery. Notably, large numbers of 150~200 m-high pile tailings dams have also been created due to restrictive land policies. Generally, it is adverse for the safety of tailings dams to use fine-grained tailings as materials in a high tailings dam because of the low penetration coefficient, the slow consolidating velocity, and the bad physical mechanical property. The phreatic line of the tailings dam, with the influence of complicated geography conditions, is increased enormously when encountering special conditions such as the failure of drainage facilities or increased rainfall. According to statistics, it has become one of the most important factors affecting the safety of tailings dams that seepage failure in the dams accounts for 30–40% [14]. Currently, most tailings dams are wet stockpiles, and it is very important to carry out seepage analyses and slope stability studies on tailings dams [15].
In recent years, researchers at home and abroad have carried out many studies on the law of the spatial seepage field of fine-grained tailings ponds with high stacked dams, as well as on the control measures for seepage and stability. Rong Gui et al. [16] showed that the migration of fine-grained tailings was caused by internal erosion which increased the permeability and reduced the shear strength of the tailings. Fuqi Kang et al. [17] showed the dynamic characteristics of tailing silt and investigated the growth of the hysteresis curve, the development of pore pressure, and the energy dissipation law of tailing silt. Xiuwei Chai et al. [18] showed that the particle size distribution of tailing sand could affect its strength, and the larger the particle size was, the greater the shear strength would be. Chao Zhang et al. [19,20,21] investigated the effect of particle size on tailings’ shear strength and dam stability, as well as the dynamic stability of tailings dams. Qiang Li et al. [22] established a multiyear rainfall model and proposed that the main reason for the formation of a relatively stable seepage field was infiltration. Qinglan Qi et al. [23] proposed a new theory for conceptualizing three-dimensional numerical models and applied the theory to simulate the leachate field of a tailings dam. Houxiang Liu et al. [24] performed a transient seepage analysis of tailings dams considering the coupling of stress and seepage fields. Chen Zhang [25] et al. showed the influence of a different dry and upstream slope ratio on the seepage and stability of a tailings dam and the longer the length of the dry beach, the lower the phreatic line and the greater the safety factor. The higher the upstream slope ratio, the lower the phreatic line and the greater the safety factor. RICO et al. [26] concluded that the seepage field was an important indicator influencing tailings dam stability. Jiaxu Jin et al. [27] analyzed the seepage field of seepage discharge facilities under normal operation and damage and concluded that the permeability of the starter dam was closely related to the seepage stability of tailings dams. Bascetin Atac et al. [28,29] carried out numerical modelling analyses of two different types of tailings dams and concluded that the type of tailing dam and the duration of an earthquake directly affected the maximum displacement value formed on the ground. In another study, it was found that the use of cement and fly ash could improve the volume compressibility coefficient of the tailings, which was beneficial to the stability of tailings dams. Guangzhi Yin et al. [30,31] carried out numerical simulations and indoor physical modelling experiments when considering the number of factors influencing the seepage pattern of tailings dams under rainfall conditions. Hongwei Deng et al. [32] investigated the effect of beach width on the stability of tailings dams by three-dimensional seepage modelling. Wensong Wang et al. [33] showed that the static and dynamic stability of fine-grained tailings dams in high-seismic areas could conform to the specification by constructing high starter dams and providing adequate seepage drainage facilities. Jianxin Yang et al. [34] found that higher water levels both lead head at the top dam, lower the bottom at the same time, and result in greater destabilization. Xu Z et al. [35] studied the seepage characteristics of tailings dams, considering the special case of physical and chemical blockages. Yonghao Yang et al. [36] conducted a case study on the application of geotextiles in tailings dams, and the results showed that this method was effective for seepage control during construction. Chong Liu et al. [37] proposed a novel drainage system for seepage and stability analyses of tailings dams. This new drainage system could reduce the infiltration line and meet dam stability requirements.
The study of tailings seepage failure belongs to a multidisciplinary field, which involves disciplines such as mining, geotechnical, hydrological, geological, seismic, slope, and seepage mechanics [38]. Current research has focused on the model test method and numerical simulation method. The model test method has the unique advantage of accurately depicting dynamic contours in specific projects [39]. However, it has limitations in reflecting the actual behavior of seepage, as it is difficult to determine the mapping relationship between the field and model length scales. Numerical simulation techniques are effective tools for studying seepage analyses of tailings dams, due to their ability to characterize models realistically [40]. In seepage analyses of complex projects such as tailings dams, the traditional method directly uses parameters obtained from tests for calculations; sometimes the test parameters may be biased, making it difficult to accurately reflect the seepage field. This research was performed to simulate a three-dimensional seepage and analyze the stability of a 210 m-high upstream tailings storage facility. In this study, seepage back analyses were carried out using measured phreatic line data to obtain seepage parameters that coincide with on-site seepage. The obtained seepage parameter values were then used as input parameters for numerical simulation to carry out seepage analysis. The purpose of this study was to reveal the key areas and reasons why the tailings dam’s phreatic line was prone to be uplifted under complicated geography conditions, and at the same time to carry out seepage stability analysis and controlled phreatic line research, and to put forward countermeasures for seepage control. These findings will provide reference and guidance for the construction and daily safety management of high pile tailings dams with fine-grained tailings under similar complex terrain conditions.

2. Materials and Methods

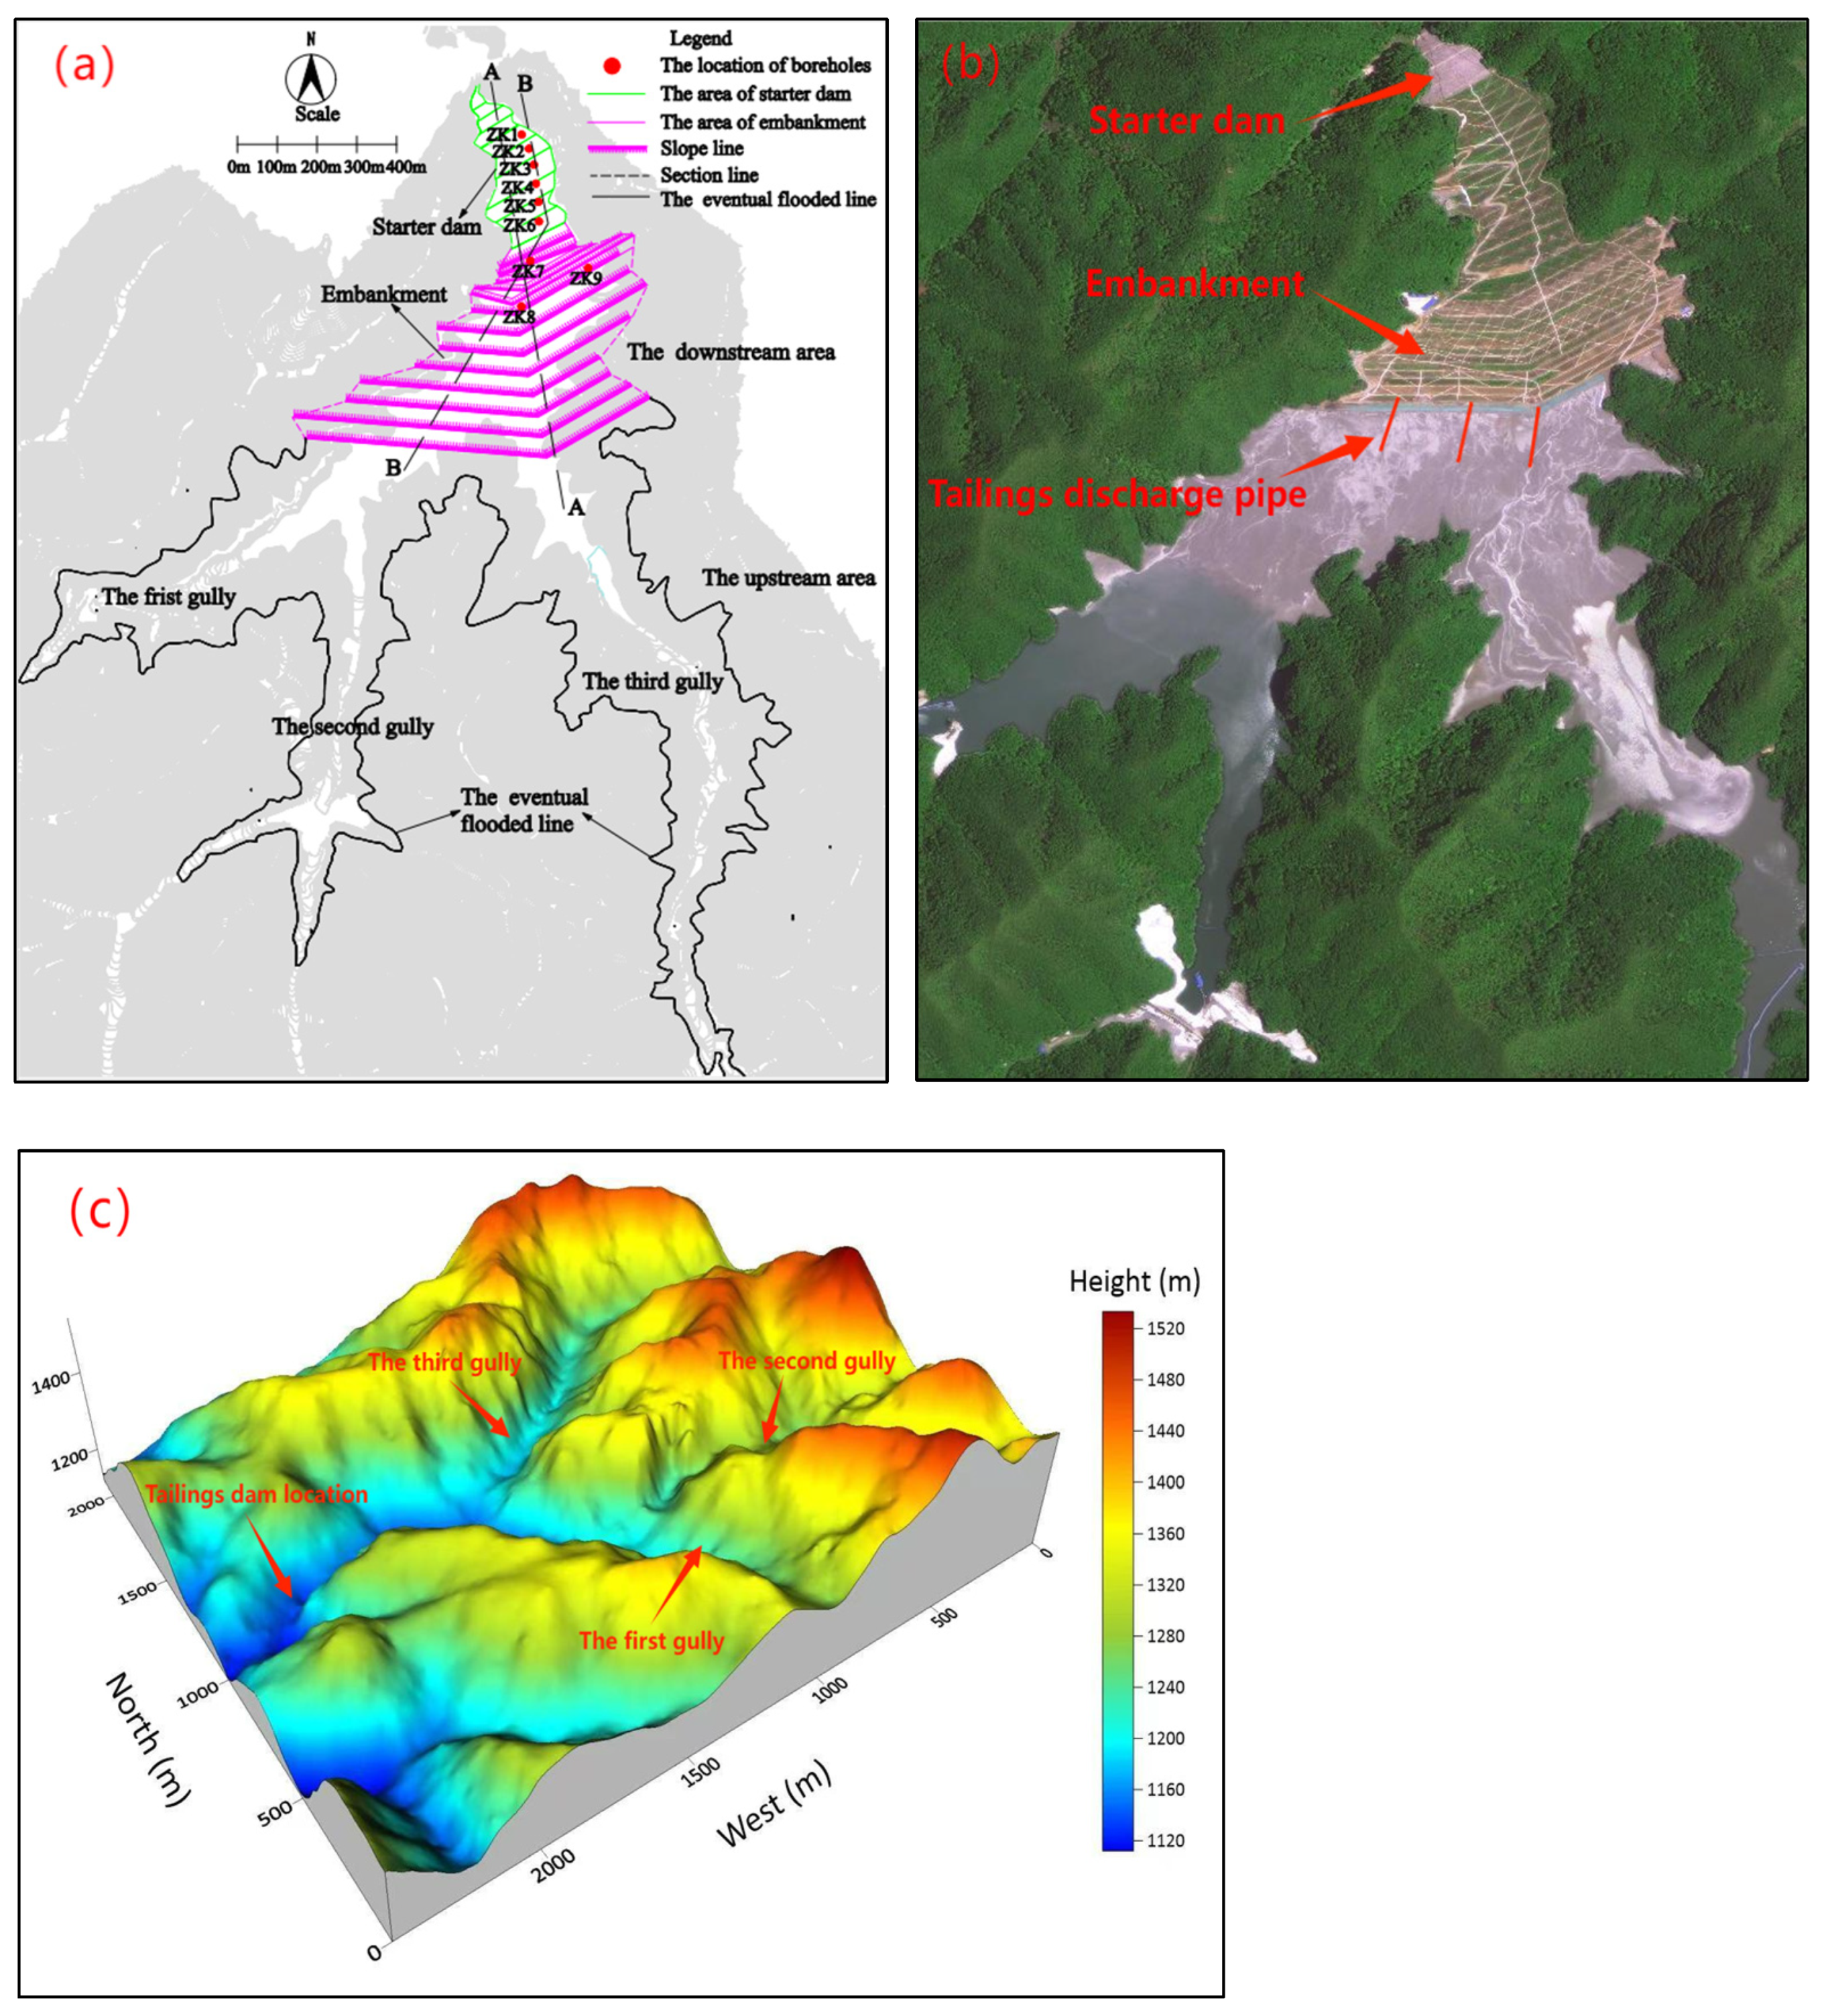
2.1. Basic Information about Tailings Dam

A tailings dam is an upstream valley tailings dam and is located at the confluence of three gullies, which are numbered as the first branch gully, the second branch gully, and the third branch gully from the left bank to the right bank. The average specific slope of the river valley is 8–10% and the slope of the mountains on both sides is 50~90°. The height of the reservoir area is 1100–1500 m a.s.l, with a relative height difference of 400 m. There are no landslides, mudslides, subsidence, and other adverse geological conditions within the tailings dam area. The development of karst in the tailings dam area is dominated by shallow karst, while the deep karst is not developed and the shallow karst has no influence on the tailing dam. The seismic intensity of the area is 6 degrees and the design basic seismic acceleration value is 0.05 g. There are artificial layers (Qml) and slightly weathered dolomitic marble (jxb3). The main types of tailing sand layers are fine sand tailings, silty sand tailings, silt tailings, and silty clay tailings. The physical and mechanics index of rock and tailing sand layers are presented in Table 1 and Table 2. The rainfall is concentrated from June to August every year for the tailings dam. The maximum rainfall in this region is 1386.6 mm, the minimal rainfall is 403.3 mm, and the average annual rainfall is 746.3 mm. The reservoir area belongs to a medium–high mountain area, with a relatively large height difference and steep slopes. The bedrock is exposed, the valleys are developed, and the vegetation is sparse, which is conducive to the natural discharge of atmospheric precipitation and surface runoff. The source of replenishment water in the reservoir area is insufficient and the hydrogeological conditions are simple. The layout of the tailings dam is shown in Figure 1.
The tailings dam is dammed by the upstream embankment method. The starter dam is a permeable rockfill dam with a height of 60 m, and the embankment height is 150 m, the total dam height is 210 m, and the total storage capacity is approximately 59.9 million cubic meters. The tailings dam is classified as second class, with a current dam height of 160 m and an elevation above sea level of 1250 m. The final embankment has an elevation of above sea level of 1300 m. For the complicated geography condition that the tailings dam was constructed in three gullies at the same time, the three-dimensional seepage numerical simulation was used for back analysis of the seepage flow field and seepage field mutual influence law analysis, to reveal the key areas and reasons why the tailings dam’s phreatic line was prone to be uplifted under complicated geography conditions. In the meantime, seepage stability analysis and controlled phreatic line control research were performed to put forward countermeasures for seepage control.

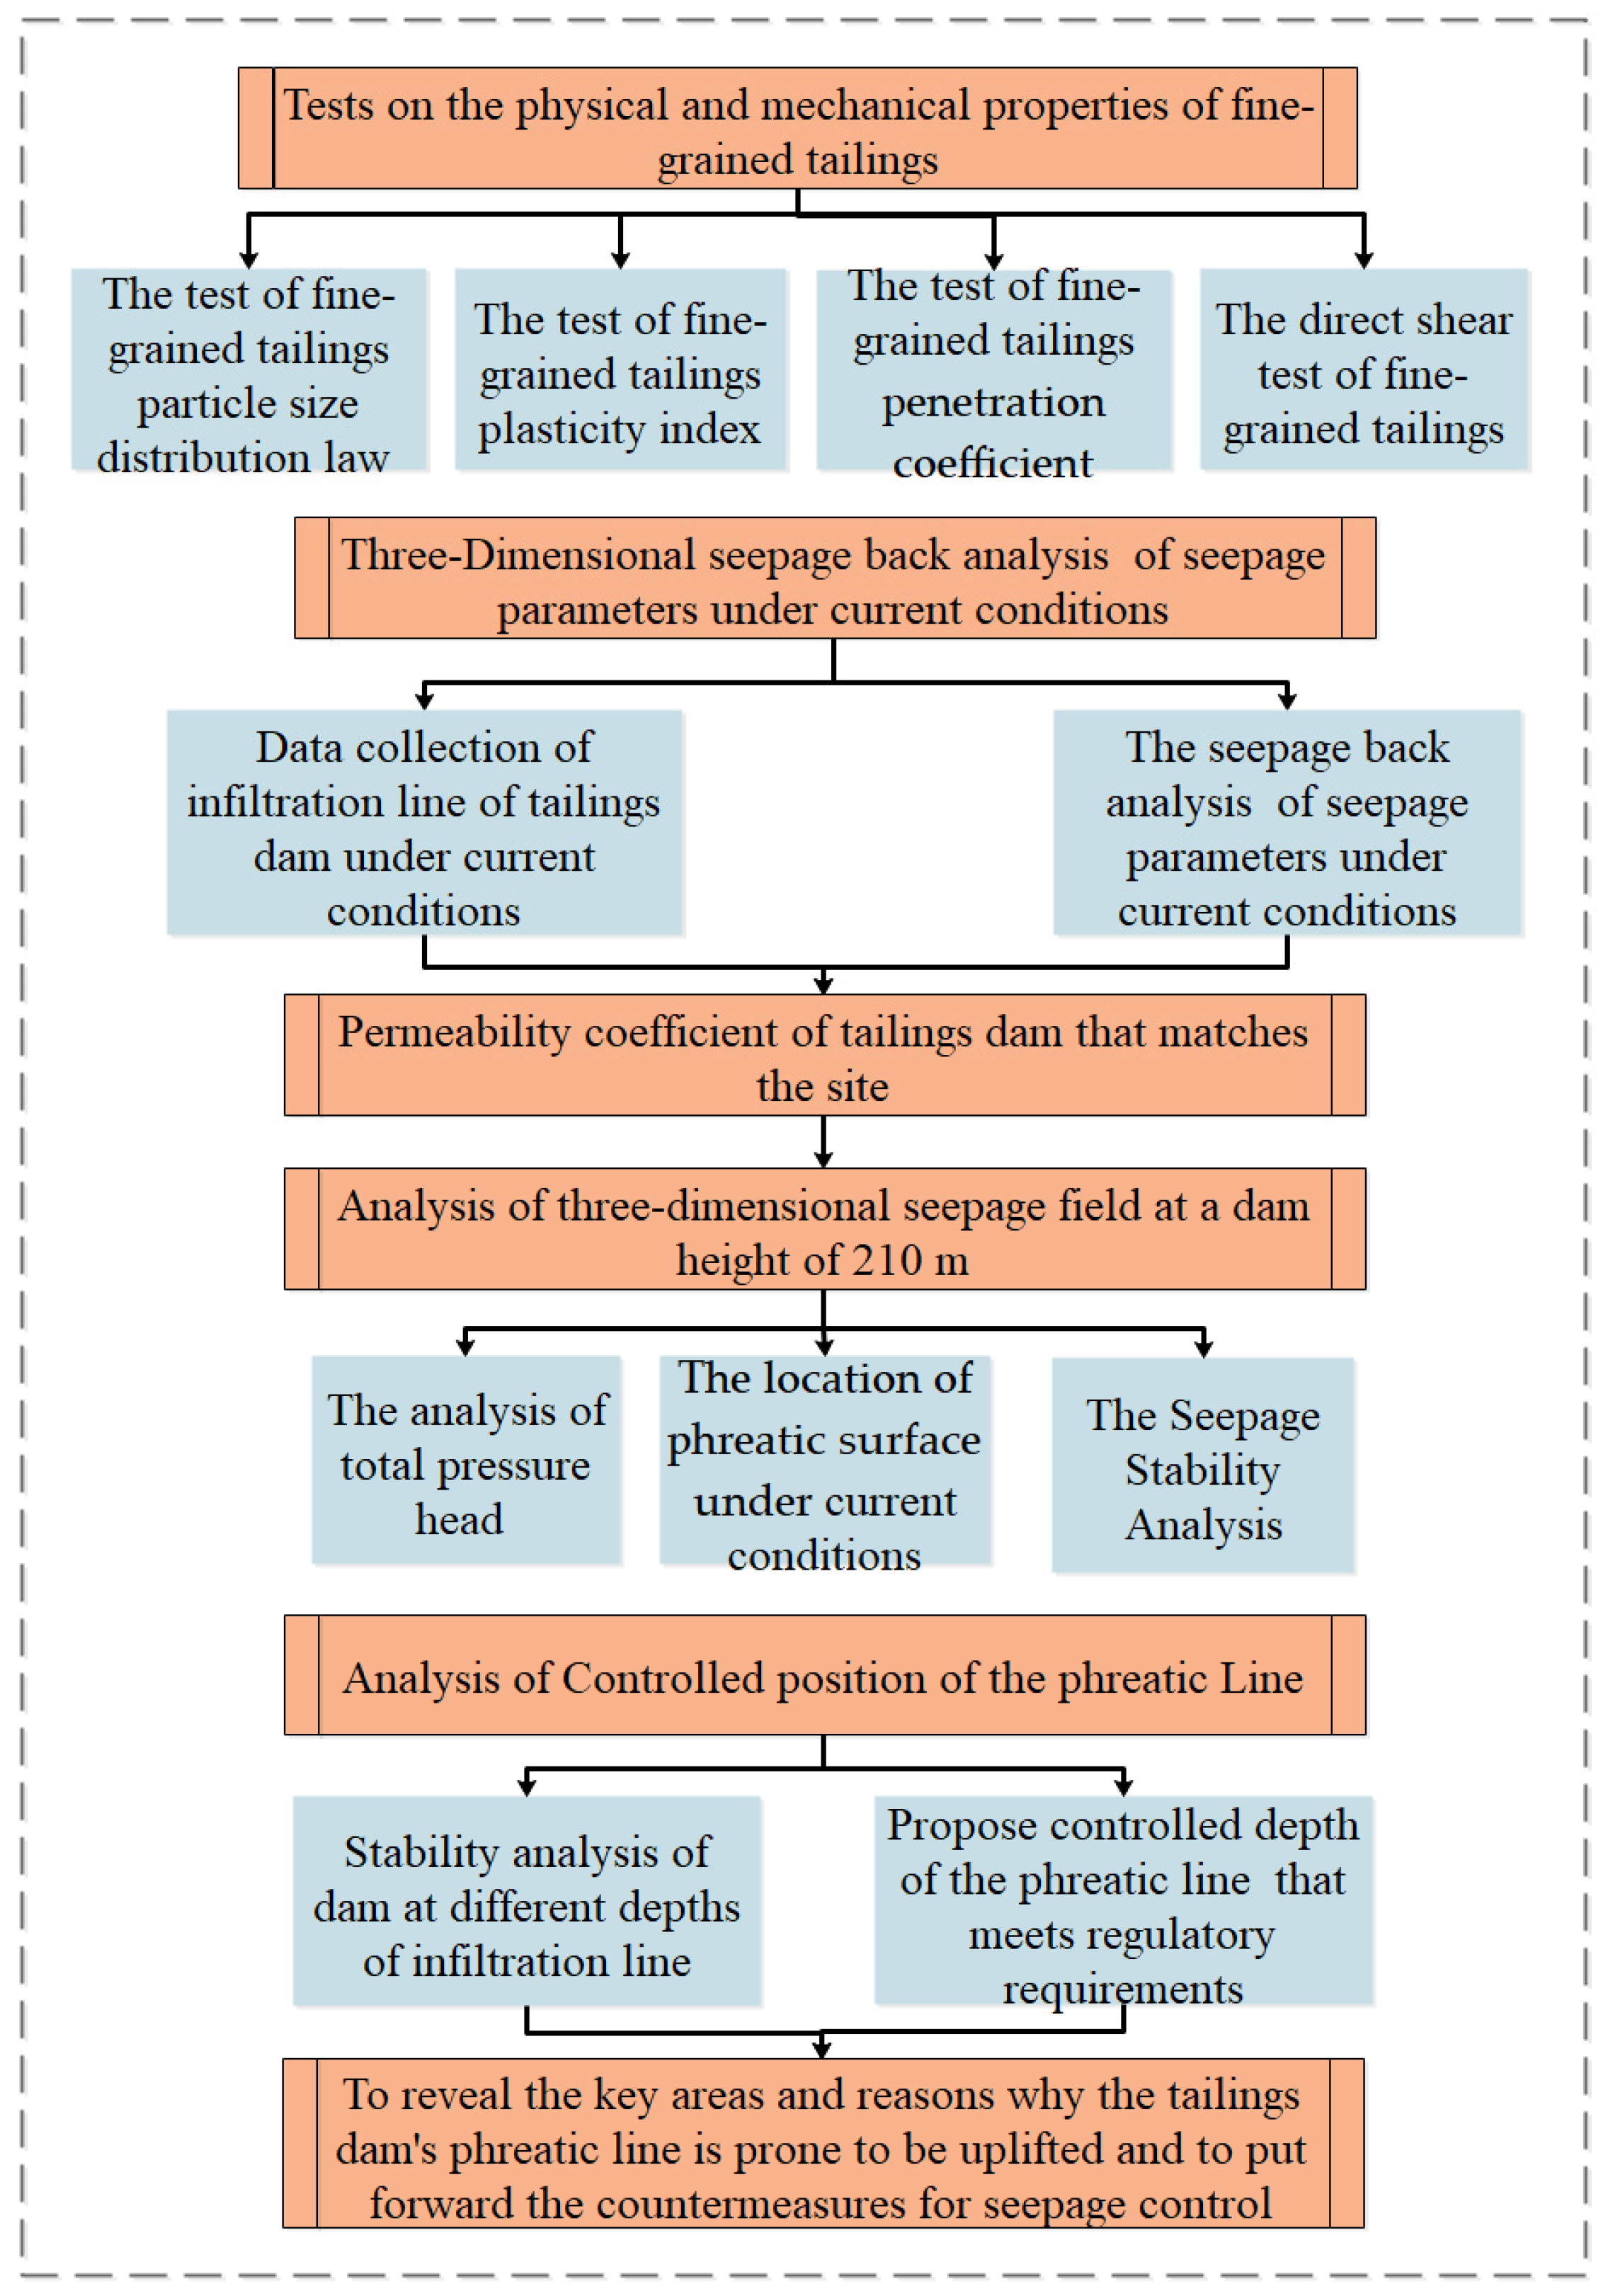
2.2. Research Processes

In this study, a 210 m fine-grained tailings dam located in three gullies was selected and used for seepage back analysis, seepage field mutual influence law analysis, seepage stability analysis, and controlled phreatic line control research. The flow diagram of this study is shown in Figure 2.

2.3. Physical Properties of Tailings Material

Through particle analysis of full-size tailings, it was found that tailings with a content of less than 0.074 mm accounted for 70.6% of the total tailings, and tailings with a content of less than 0.005 mm accounted for 15.5% of the total tailings, which indicated that the tailings are fine-grained. The results of particle analysis of tailings samples are shown in Table 1.
Table 1. Results of particle analysis of tailings samples.
Tailings Particle Size Range/mmMass Content/%
≥0.07429.4
≥0.037~<0.07427.2
≥0.019~<0.0375.4
≥0.005~<0.01922.5
<0.00515.5
The engineering investigation was carried out along the horizontal and vertical directions of the tailings dam through drilling, and physical and mechanical indicators such as particle size, average particle size, and plasticity index were tested on the extracted tailings samples at different vertical depths. Based on the sedimentation laws and physical parameters of tailings, the beach surface tailings were divided into four zones: fine sand tailings, silty sand tailings, silt tailings, and silty clay tailings. The representative physical parameters of tailings in different zones are shown in Table 2.
Table 2. Physical properties of tailings in different layers.
MaterialsFine Sand TailingsSilty Sand TailingsSilt TailingsSilty Clay Tailings
Density (KN/m3)17.919.420.119.9
Particles with particle size larger than 0.074 mm (%)88.260.440.328.4
Mean particle size/dp (mm)0.260.100.060.04
Plasticity index//8.114.7
Penetration coefficient (cm/sec)3.25 × 10−41.93 × 10−41.02 × 10−40.16 × 10−4
Internal friction angle/φ (°)33.831.026.216.7
Cohesion values/c (kPa)8.39.310.14.9

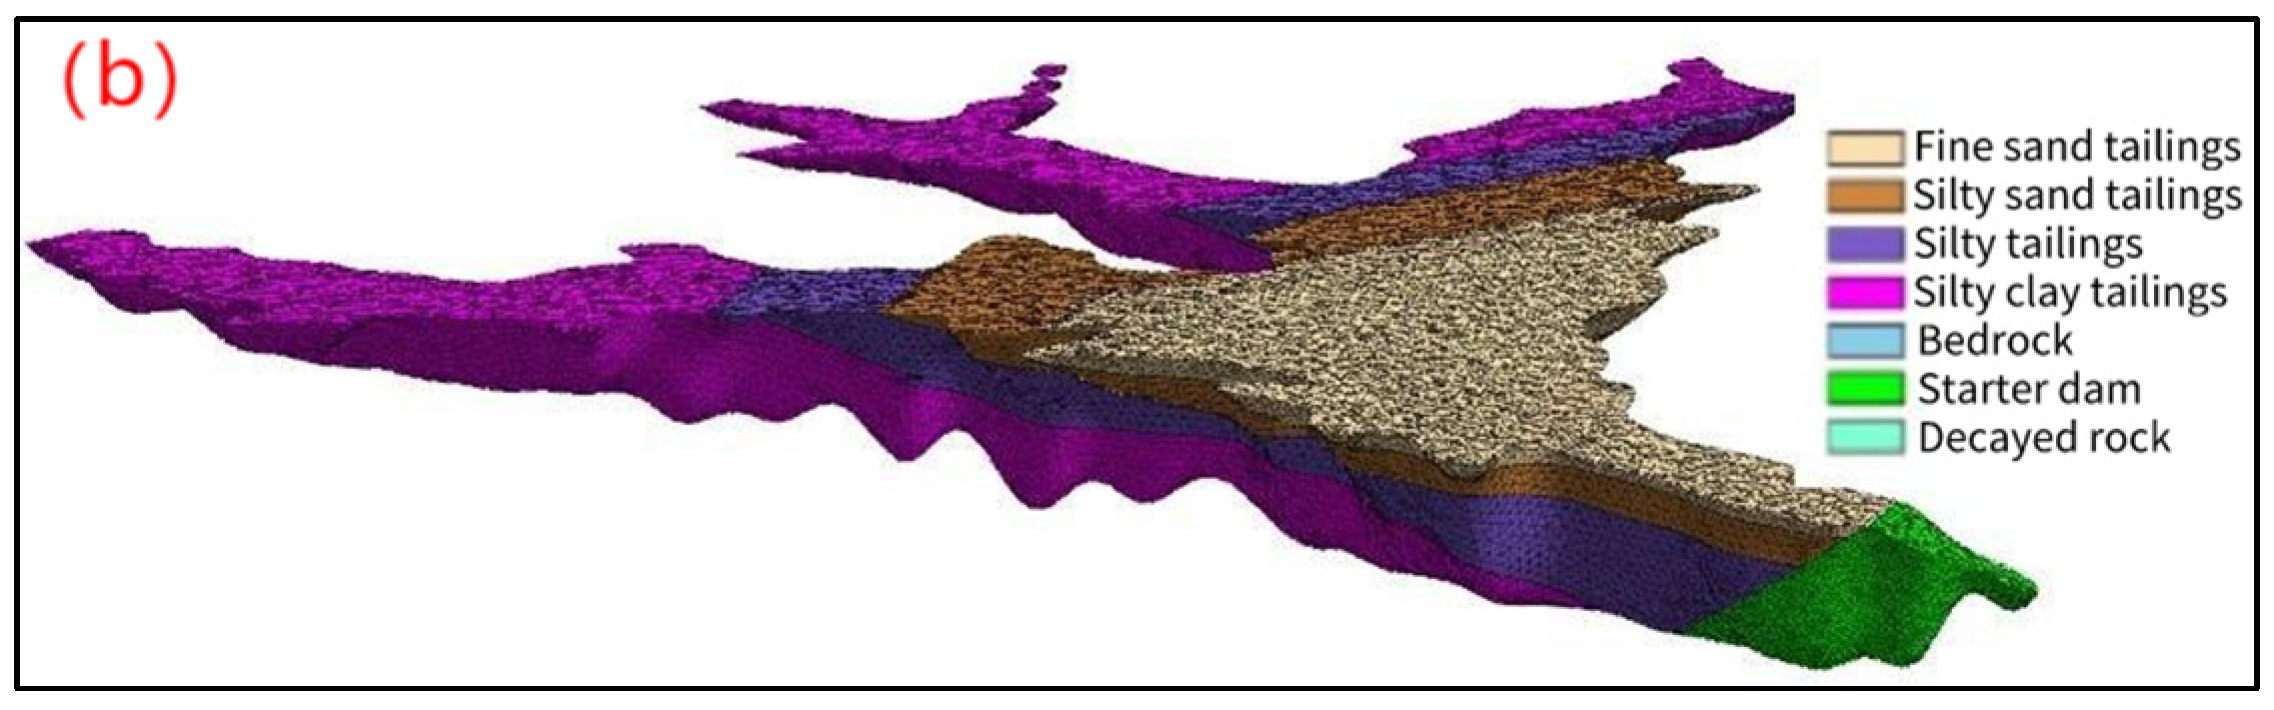
2.4. Tailings Dam Model

MIDAS GTS NX 2023 finite element software was used to construct a three-dimensional model covering the tailings dam, tailings gully, bedrock, and tailings beach surface. The model was centered on the tailings dam, taking the length of 3000 m, width of 3000 m, and height of 900 m as the calculation boundary area. In the three-dimensional seepage numerical simulation of the tailings dam, considering the beach width under normal water level and flood-water-level conditions, the reservoir surface within the top of the deposited beach was considered as the upstream head boundary. The beach width is 280 m under normal water-level conditions and 130 m under flood-level conditions. The mountain surfaces on both sides of the model were defined as the impermeable boundary, the downstream mountain surface of the initial dam was defined as the downstream head boundary, and the downstream slope of the initial dam was defined as the potential overflow boundary. The boundary conditions are shown in Figure 3a.

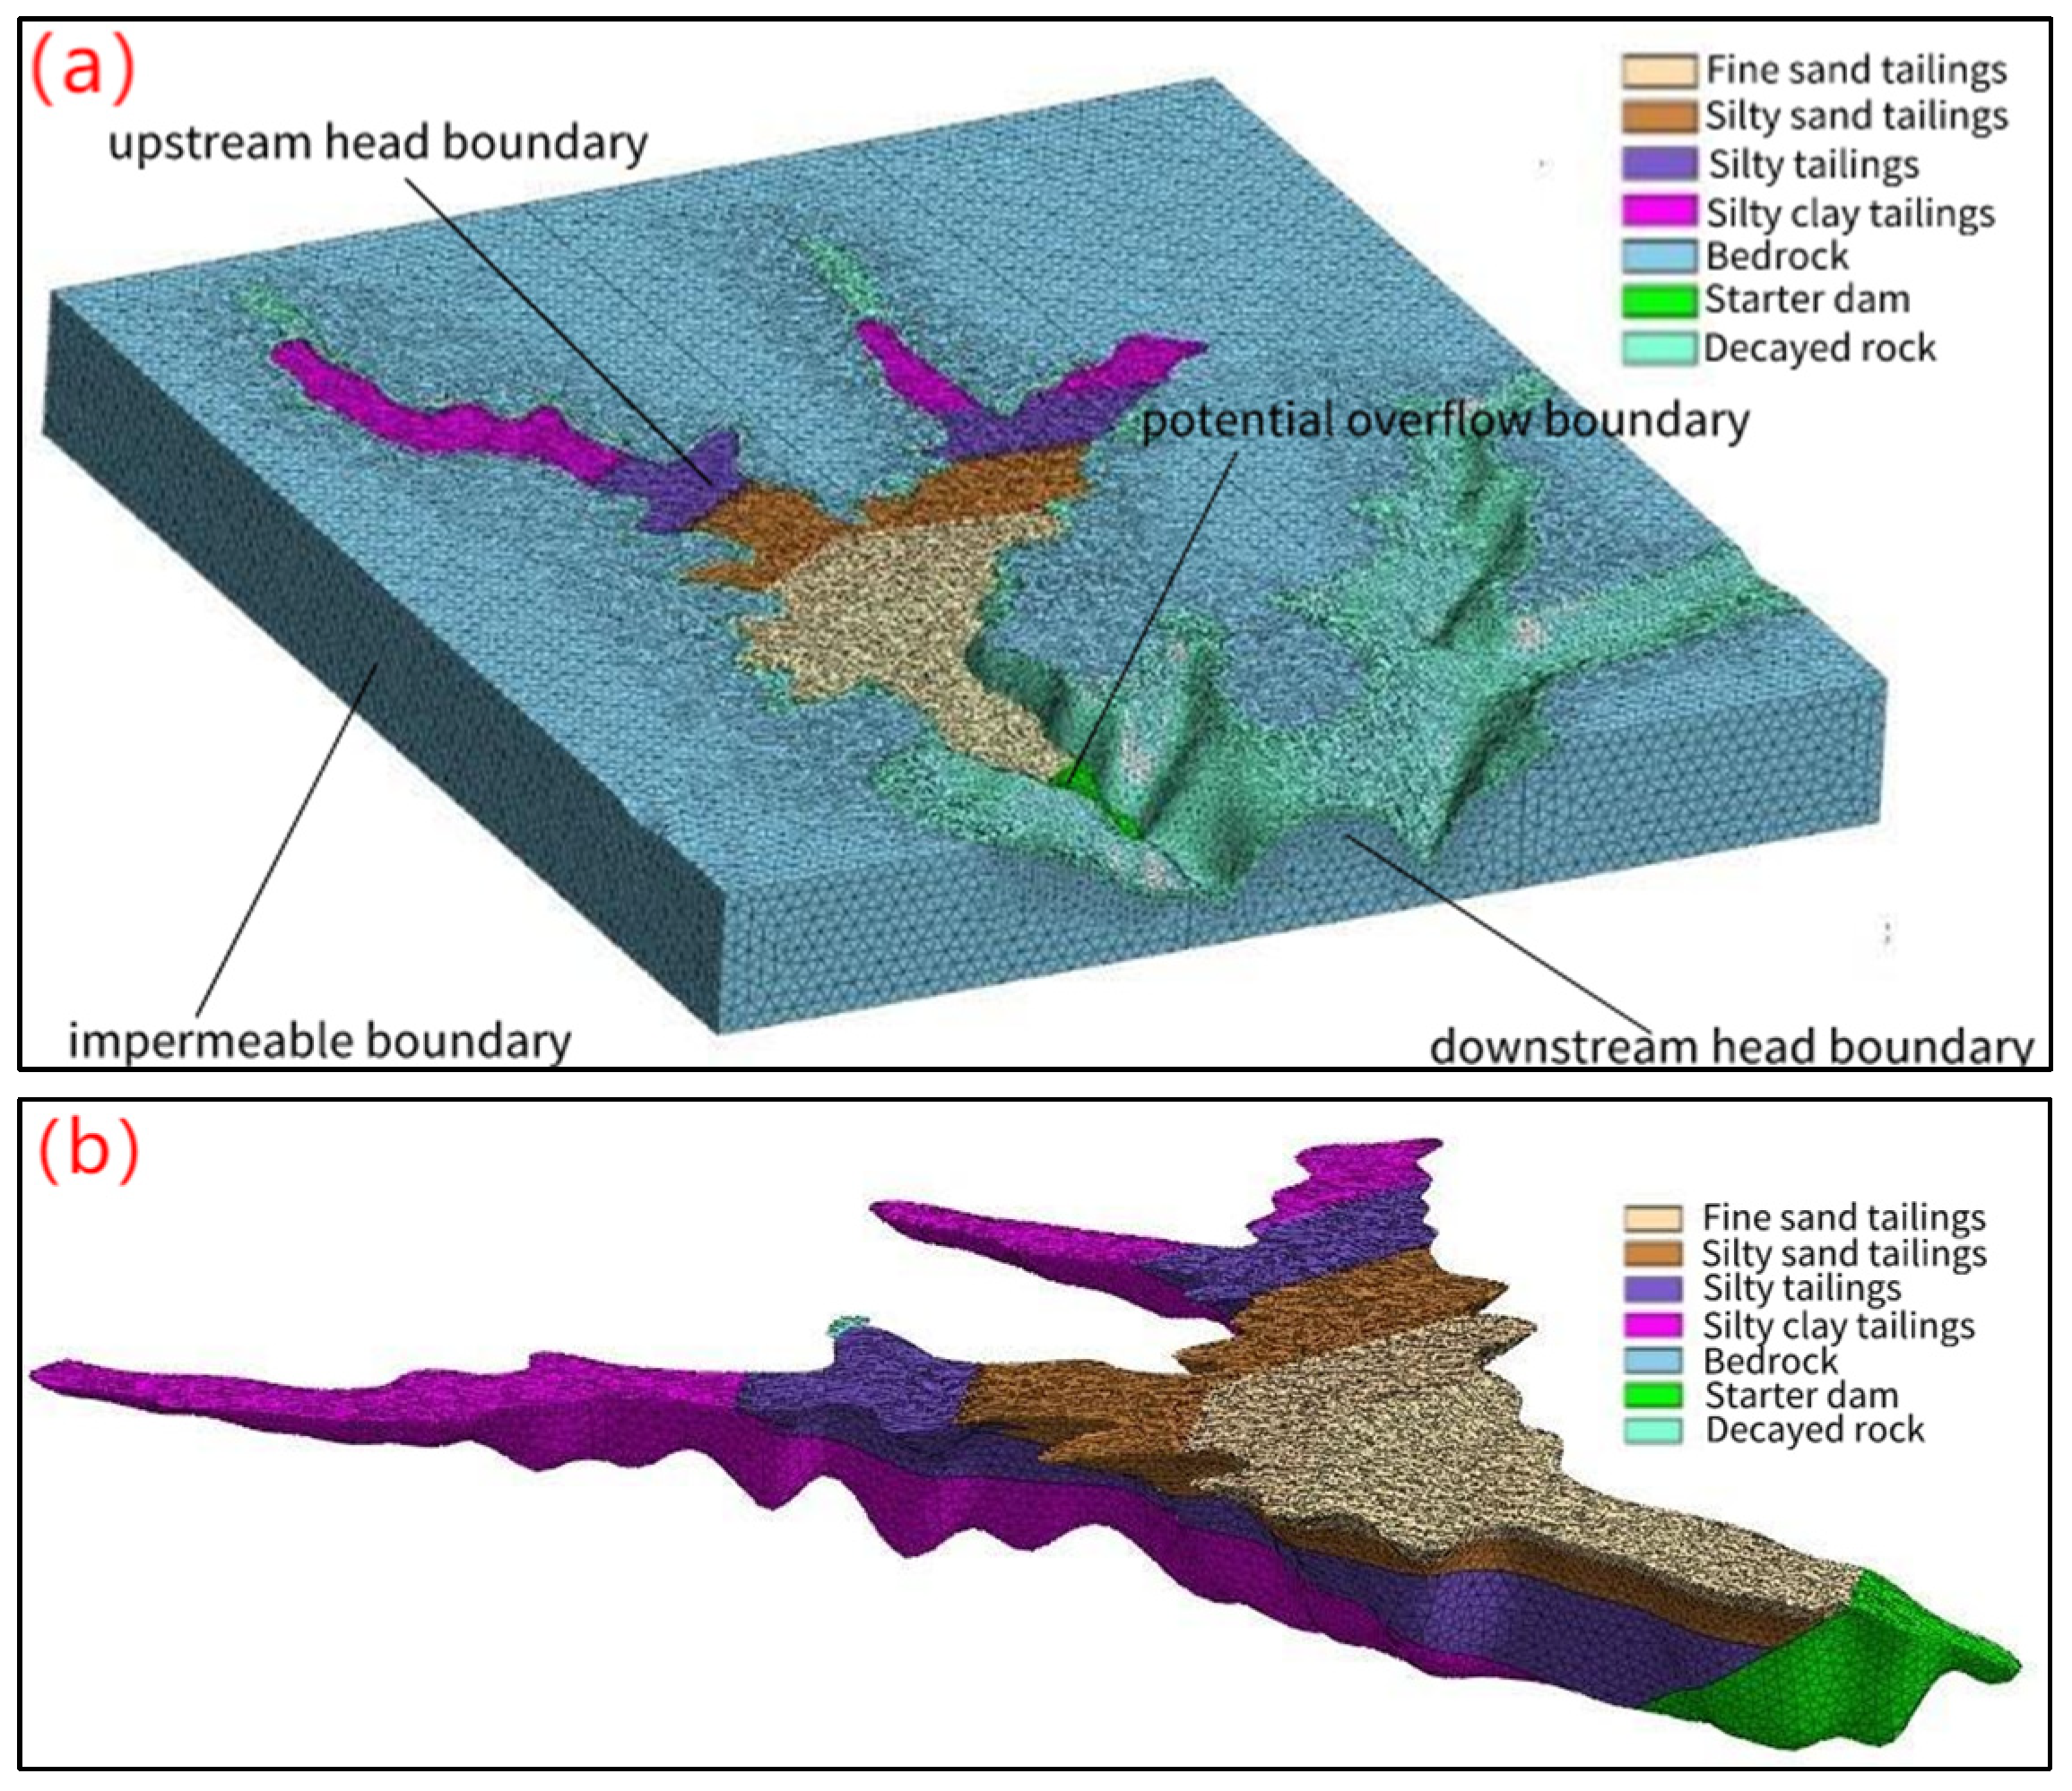
2.4.1. Three-Dimensional Seepage Back Analysis Model

The model for three-dimensional seepage back analysis was completed based on the current tailings dam at a dam height of 160 m. The model was uniformly divided into tetrahedral meshes and encrypted in key areas, and finally divided into 3,635,752 nodes and 908,938 mesh cells, with the grid model of the tailings dam shown in Figure 3. Figure 3 is the finite element model of the 160 m tailings dam which was established by using the finite element software of MIDAS GTS. The boundary conditions of the tailings dam model are labelled in Figure 3. The boundary conditions mainly include the upstream head boundary, downstream head boundary, impervious boundary, and potential overflow boundary.

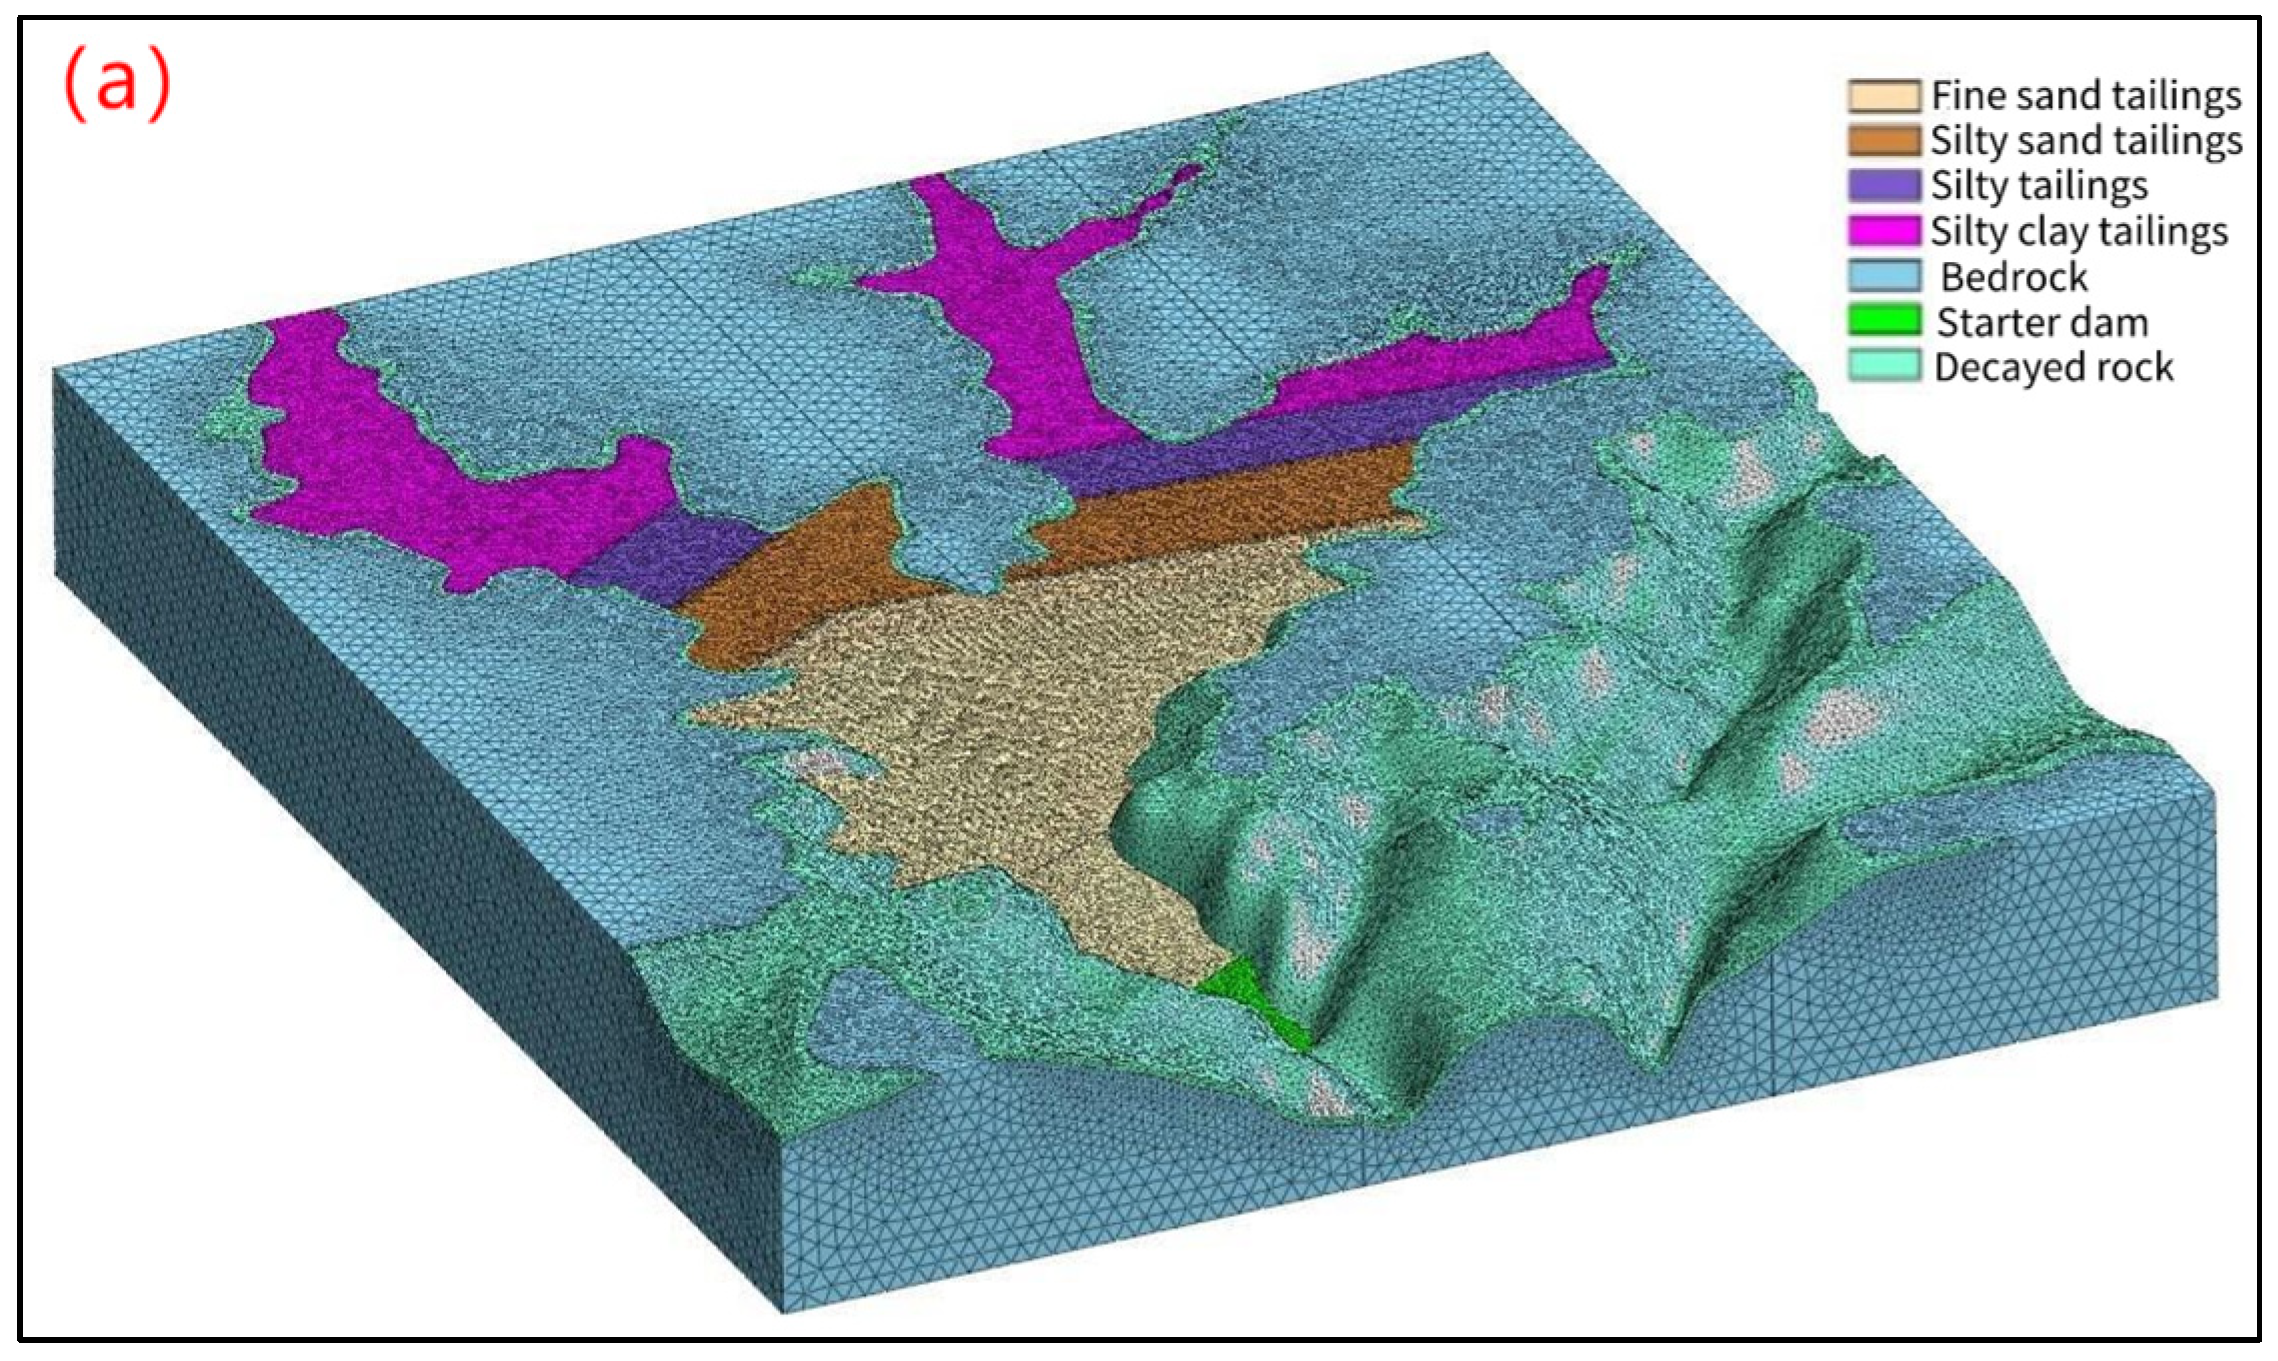
2.4.2. The Model of Three-Dimensional Seepage Simulation and Stability Analysis

The model for three-dimensional seepage numerical simulation and stability analysis was completed based on the tailings dam at a dam height of 210 m. The model was uniformly divided into tetrahedral meshes and encrypted in key areas, and finally divided into 6,036,684 nodes and 1,509,171 mesh cells, with the grid model of the tailings dam shown in Figure 4.
Figure 4 is the finite element model of the 210 m tailings dam which was established by using the finite element software of MIDAS GTS. Boundary conditions were set as above, and this analysis contains two working conditions: normal water level and flood level.

3. Results

3.1. Three-Dimensional Seepage Back Analysis of the Penetration Coefficient

To more accurately analyze the three-dimensional seepage field distribution law of the high fine-grained tailings dam under complex topographic conditions, the measured data of the phreatic line from ZK1 to ZK9 (the boreholes are distributed at different heights of the tailings dams) were used for carrying out the back analysis of the penetration coefficient and the infiltration characteristics of the current tailings dam (Table 3).
The best solutions of the permeability coefficient for the tailings dam were obtained by back analysis using the finally developed model (Table 4). During the analysis of the current dam height, the seepage calculation was carried out using the best solutions of the permeability coefficient for seepage calculation, and the resulting infiltration line depth was compared with the measured depth in the field; we considered that the results of the inversion calculation were good when the absolute error and the relative error between the calculated infiltration line depth and the measured depth were limited to a certain range. Table 4 shows that the permeability coefficients of the tailings obtained from inversion analysis were smaller than those obtained from indoor tests, and the permeability coefficients of the tailings were also smaller than the reference values in “Code for Design of Tailings Facilities“ (GB50863-2013). The main reason for this situation was that the role of tailings’ impoundment drainage measures has been equivalently reflected in the best-fit model permeability coefficients. At the same time, because the tailings belong to the fine-grained tailings, and tailings less than 0.019 mm accounted for 38% of the total tailings mass and tailings less than 0.005 mm accounted for 15.5% of the total tailings mass, tailings with heavy clay content could led to the small permeability coefficient of the tailings.

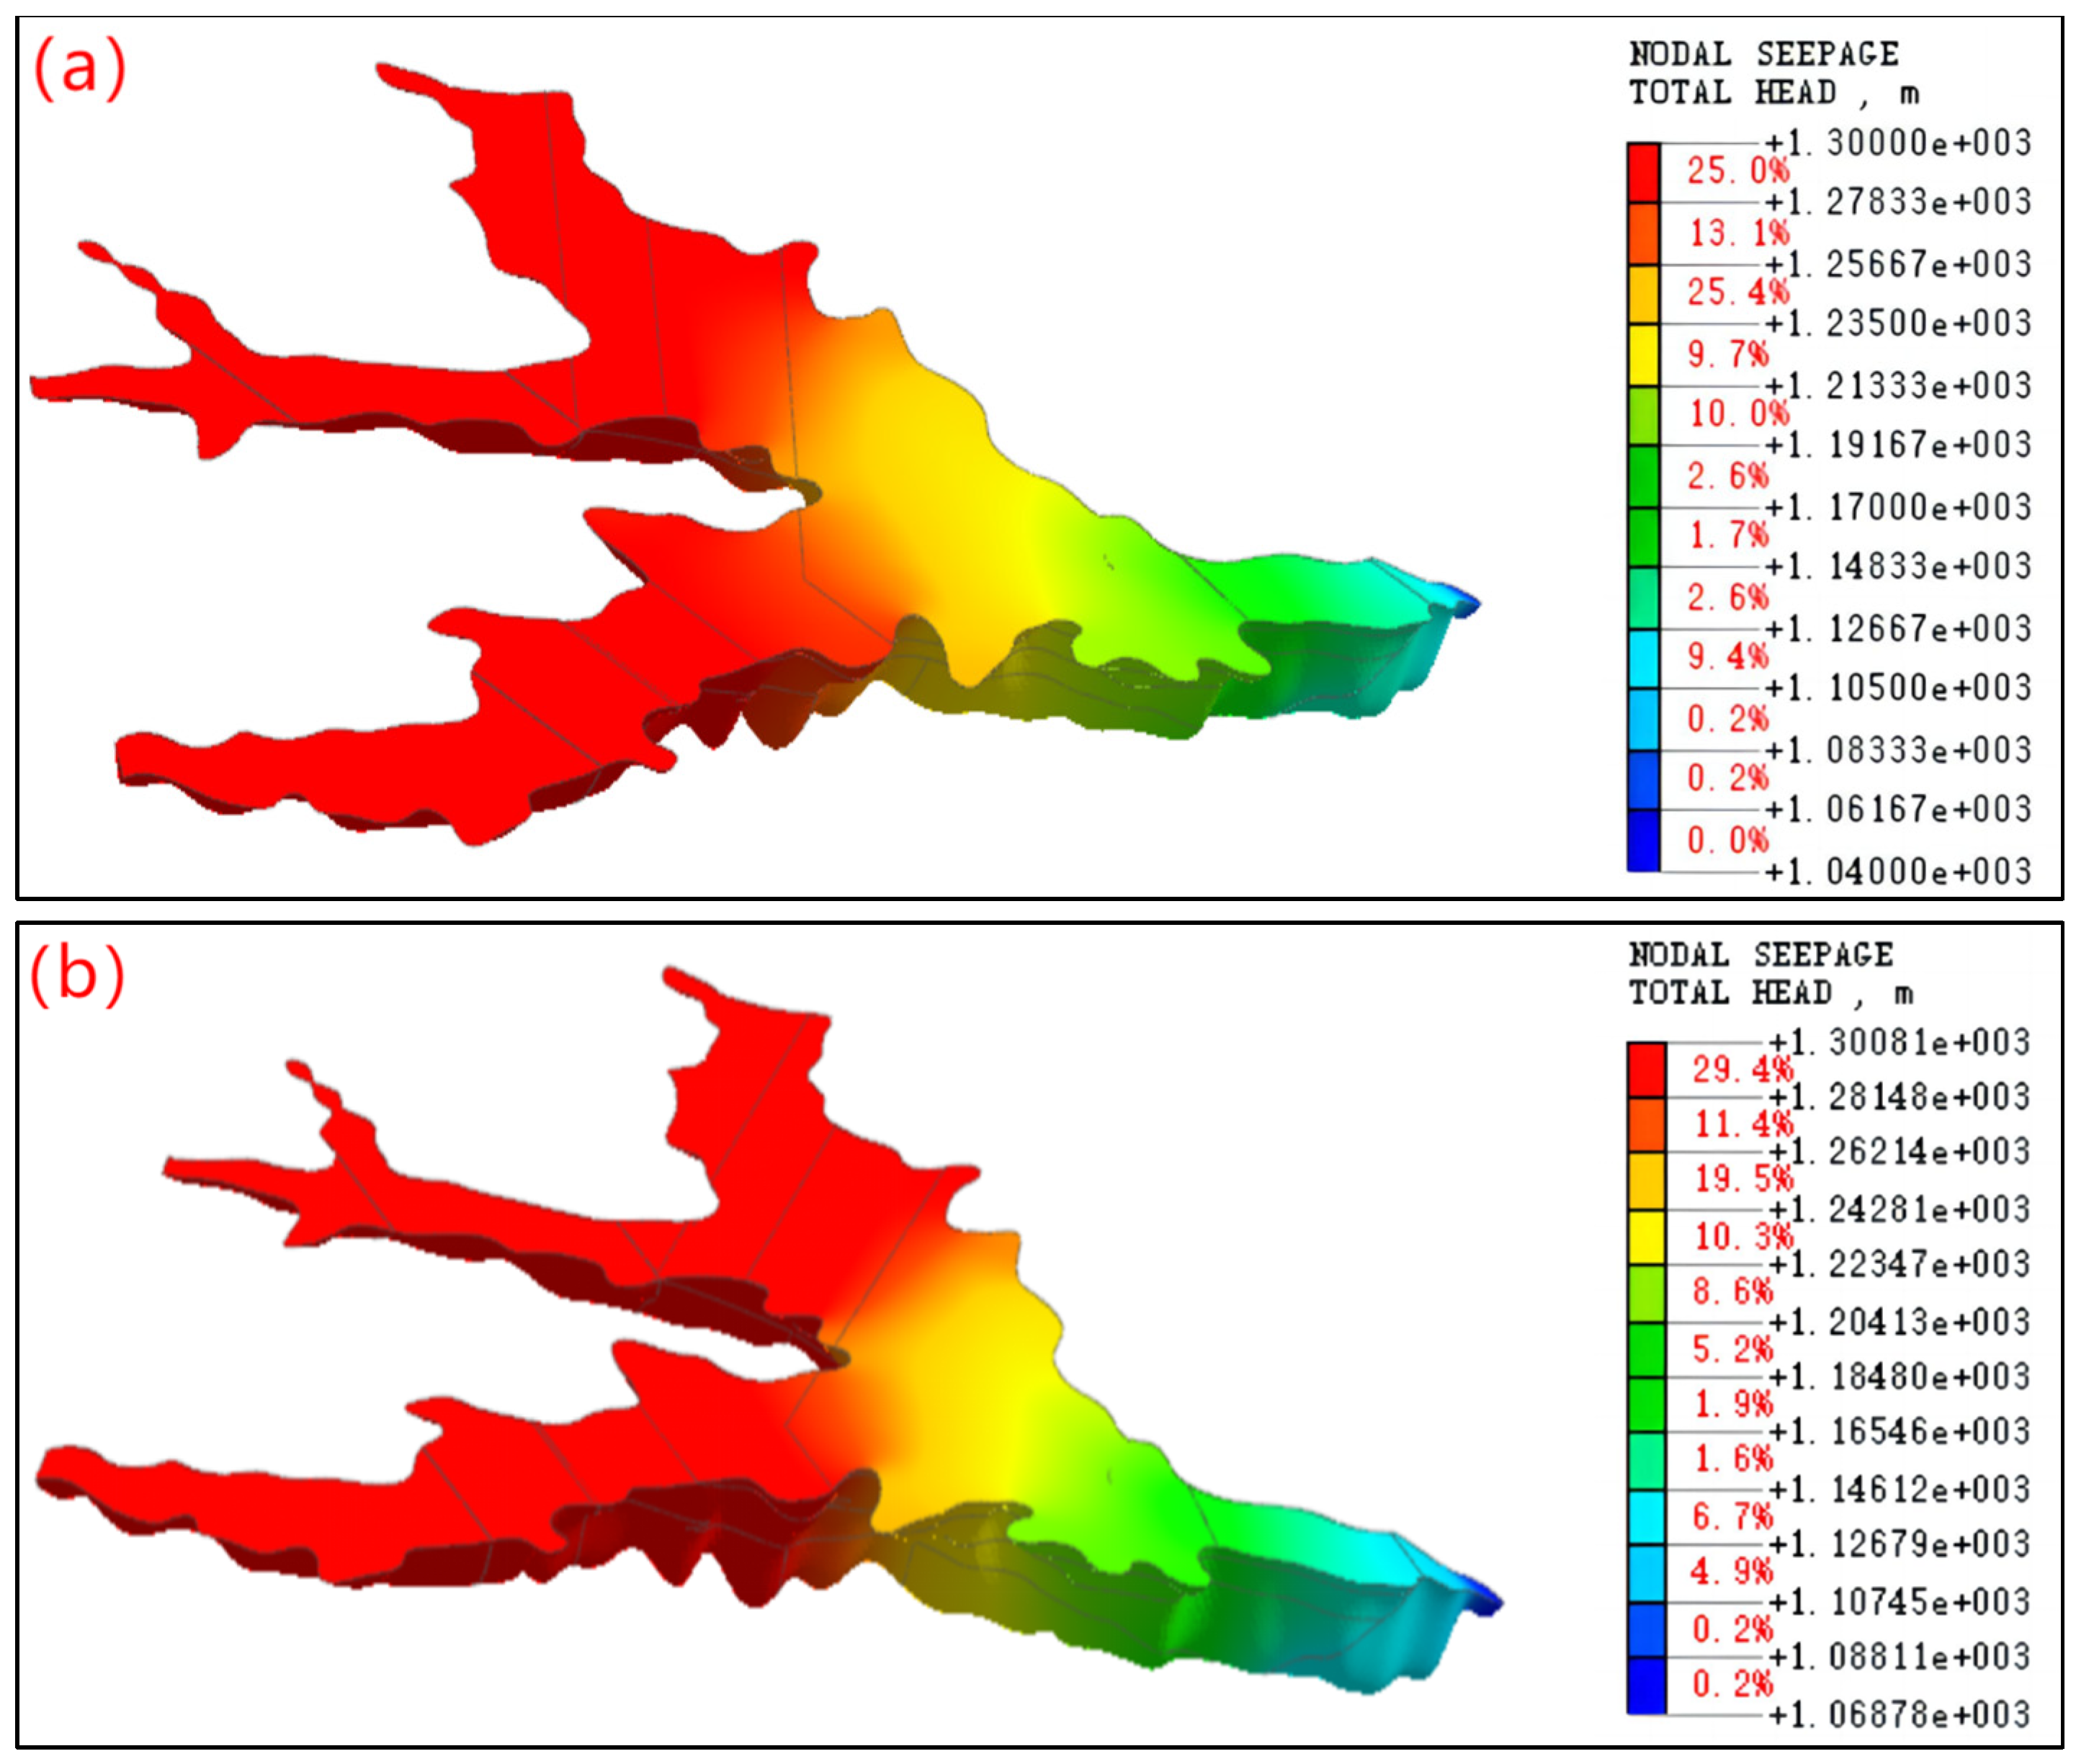
3.2. Analysis of Three-Dimensional Seepage Field at a Dam Height of 210 m
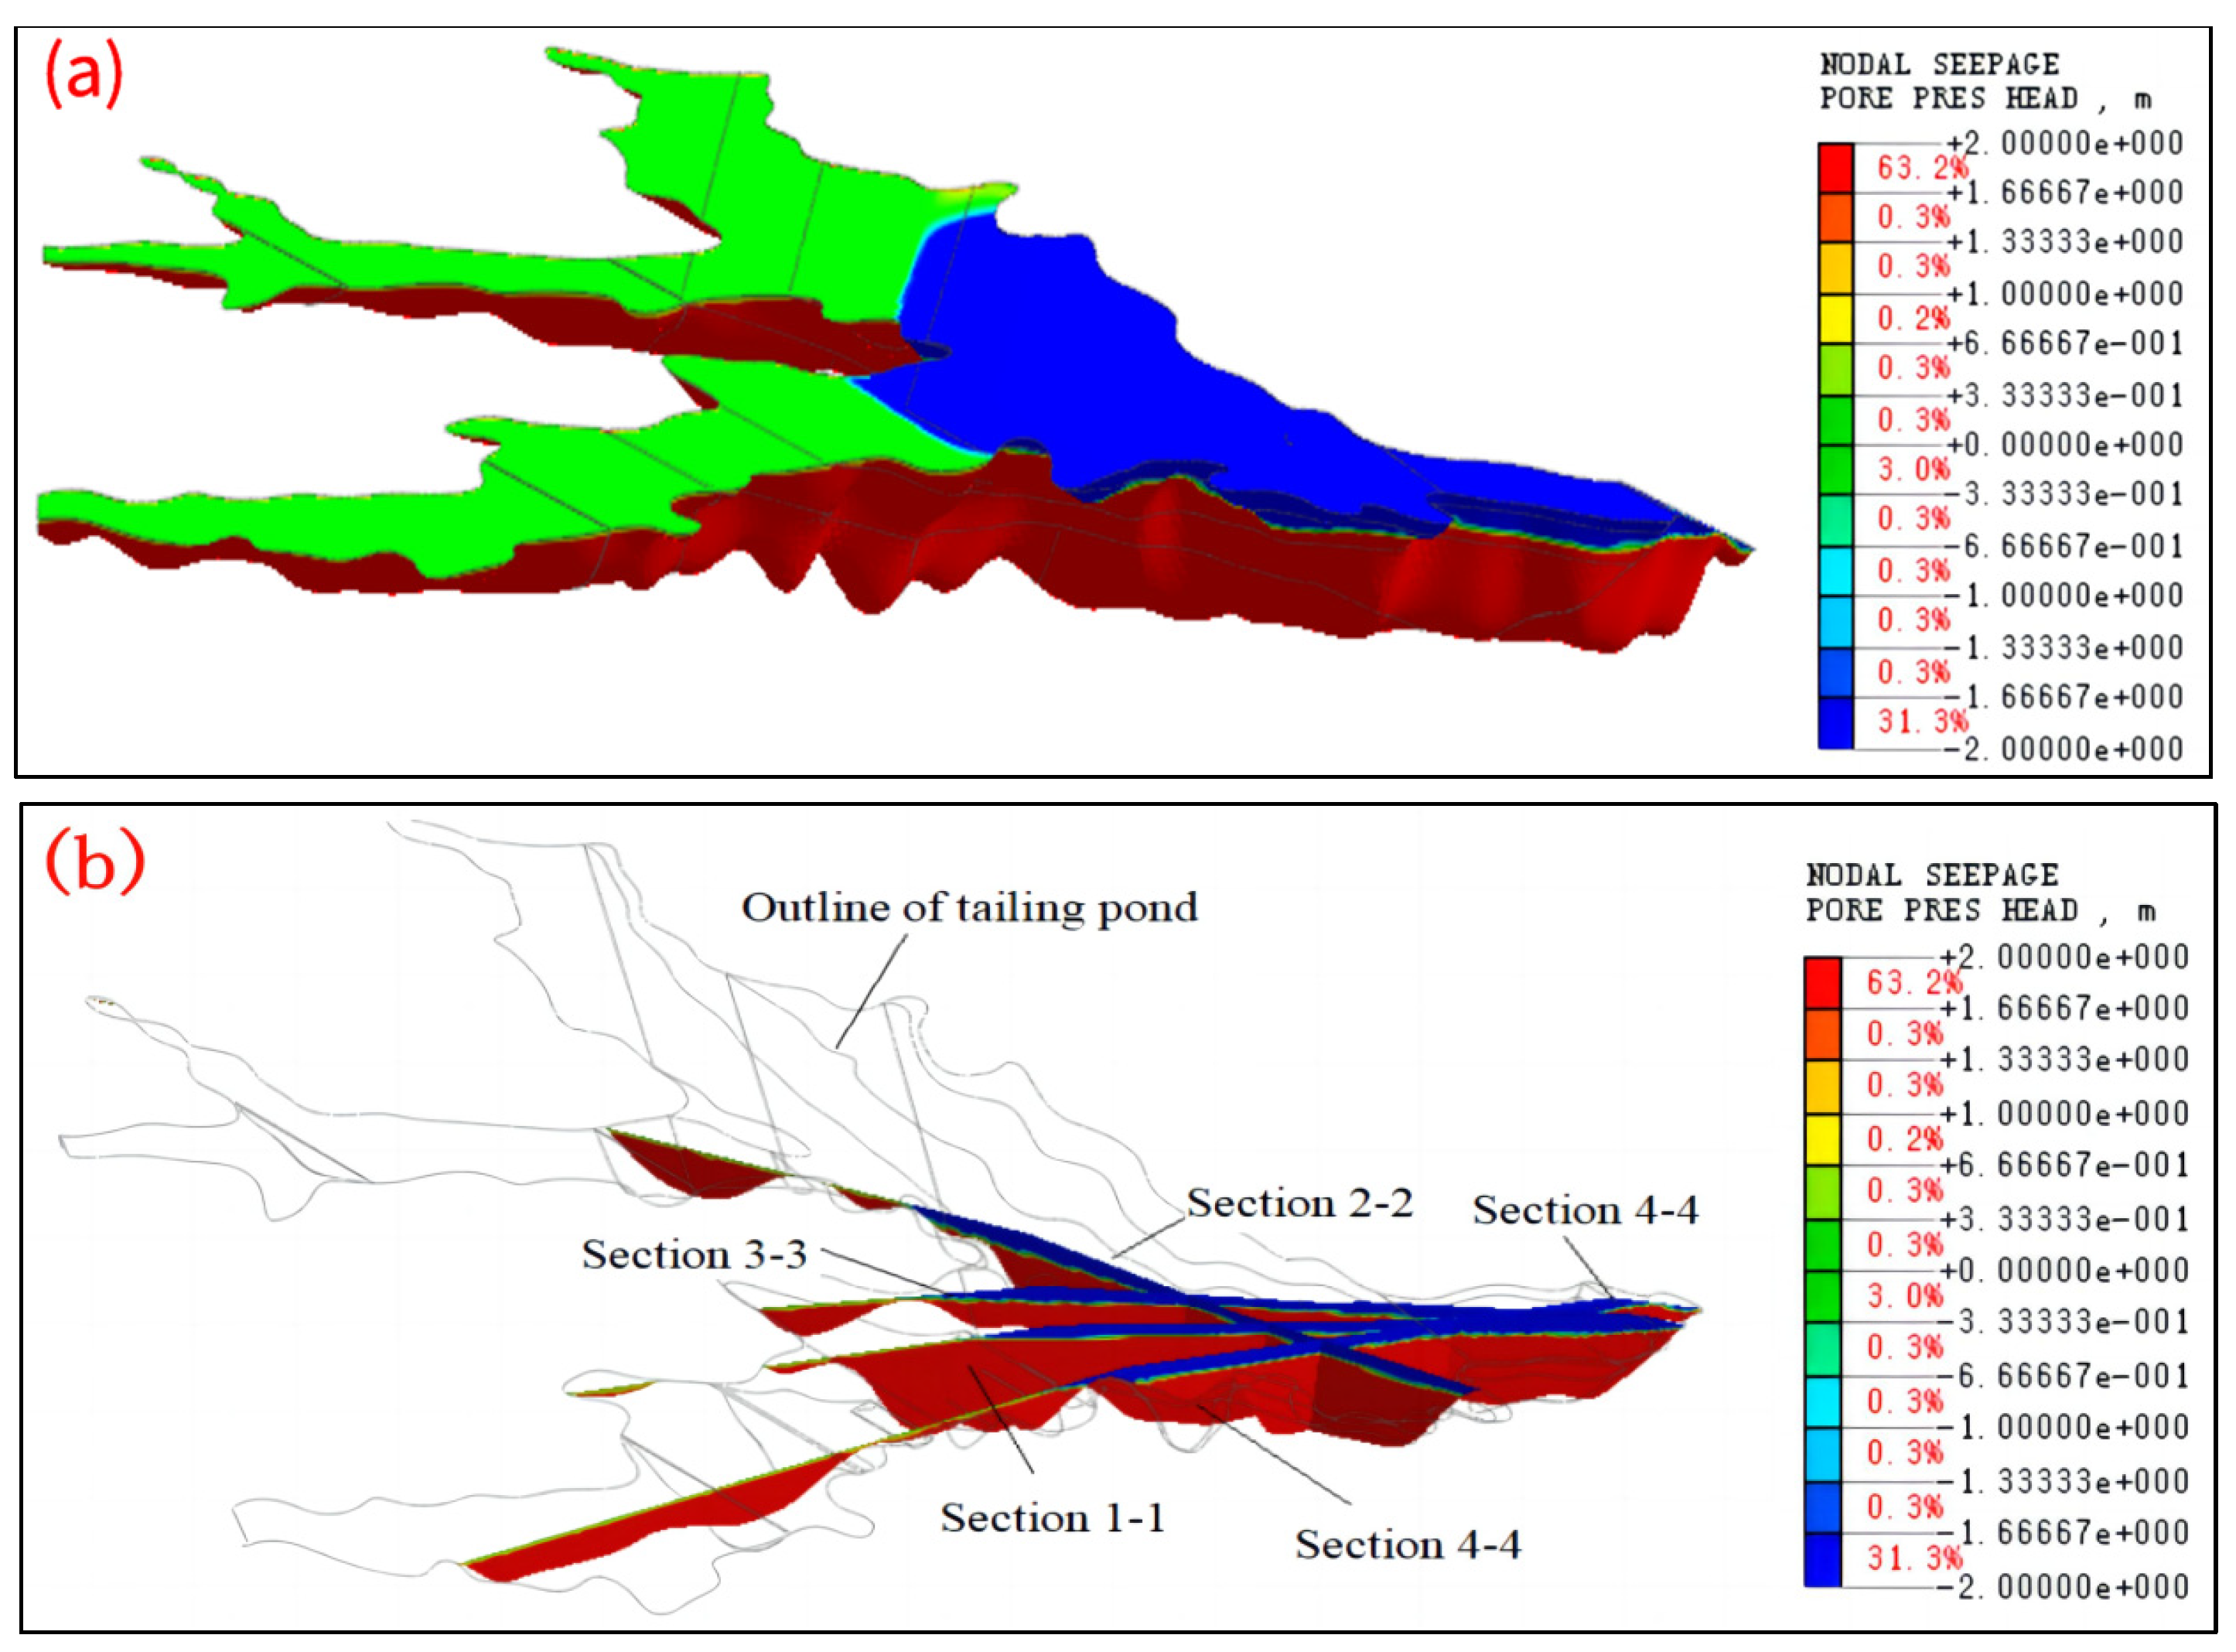
The fitted permeability coefficients were used to perform a three-dimensional seepage field interaction analysis under complex conditions of multiple gullies at a dam height of 210 m. Three-dimensional seepage analyses of the tailings dams were carried out under normal and flood conditions, resulting in the distribution pattern of total pressure head, the location of the spatial phreatic surface, and the influence of multi-gully pooled seepage on the phreatic surface under different conditions. The total pressure head distribution cloud atlas for the tailings dam is shown in Figure 5 and the spatial phreatic surface distribution cloud atlas for the dam is shown in Figure 6 and Figure 7.
In Figure 5, different colors represent different values of the total pressure head. The values from largest to smallest are represented by red-to-blue colors, respectively. The red area is mainly found in the reservoir area, indicating that the area, all of which is under water, is a saturated area. In Figure 6, Figure 7 and Figure 8, the blue area represents the part above the phreatic surface, which is a non-saturated area. The red area represents the part below the phreatic surface, which belongs to the fully saturated region. The green area is located on the interface of the red and blue colors and represents the phreatic surface, and its head pressure value is 0 m. Figure 6b and Figure 7b show the location of the phreatic line for four typical sections for each condition. Section 2-2 passes through the first main ditch, Section 4-4 passes through the third main ditch, and Sections 1-1 and 3-3 pass through the intersection of the two main ditches.
According to the analysis results, it can be seen that:
(1)
The total head value decreased gradually from upstream to downstream. Taking the flood condition as an example, the maximum value of the upstream head was 1300 m and the minimum value of the downstream head was 1060 m, which was in accordance with the engineering law. The distribution pattern of the total pressure head in the flood condition was basically consistent with that in the normal water-level condition, but the overall distribution increased slightly in the direction of the starter dam, mainly because the length of the beach width in the flood condition was smaller than the length of the dry beach in the normal water-level condition.
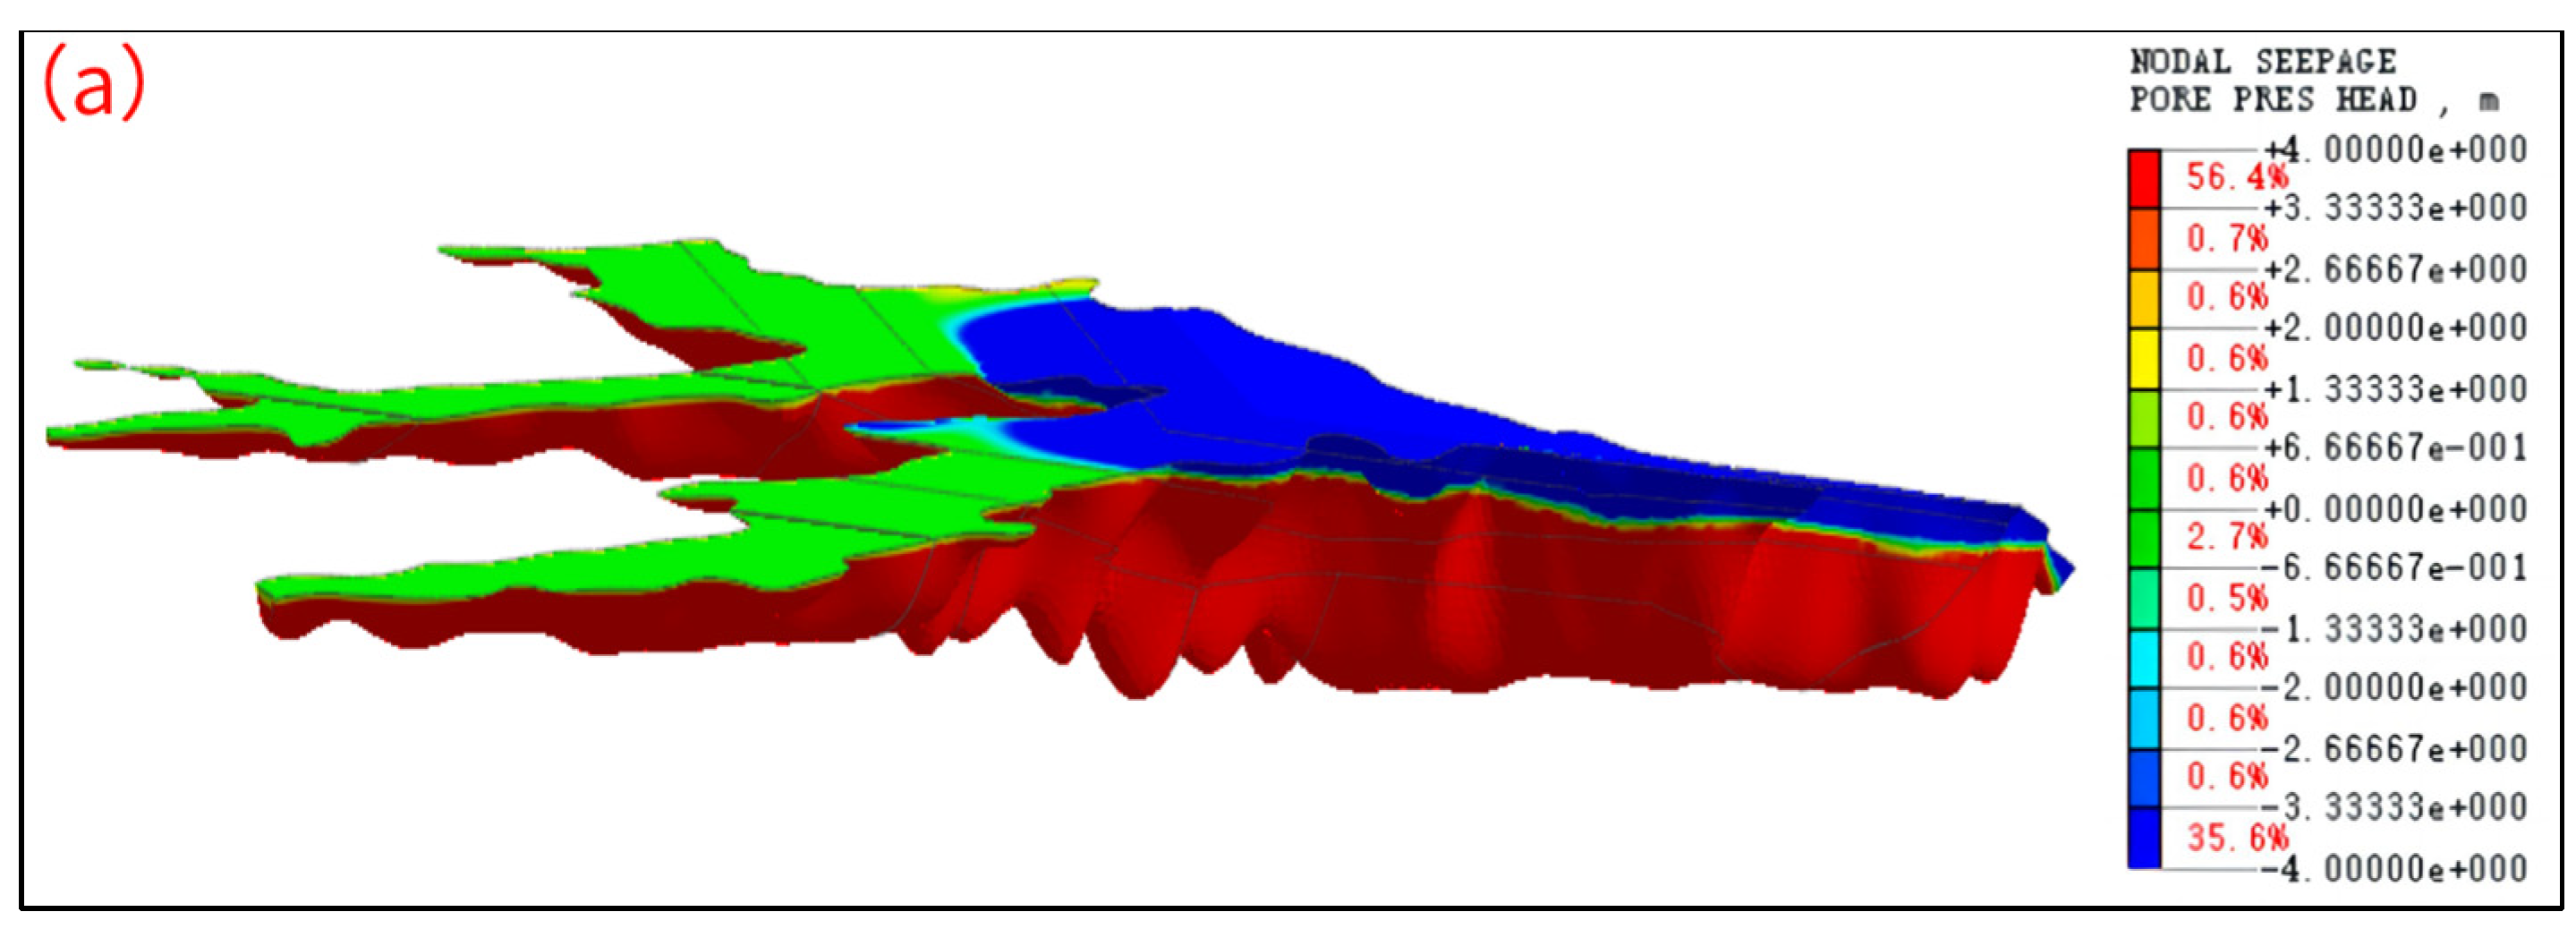
(2)
Under normal water-level conditions, the phreatic surface was uniformly distributed, presenting shallow upper and deeper lower parts, rapidly decreasing after infiltration from the beach surface, and then infiltrating downward along the tailing chalk layer to reach the overflow near the initial dam. The location of the phreatic line of most of the areas of the embankment was approximately 25 m~28 m. Under the flood-level condition, the distribution pattern of the phreatic line was similar to that of the normal water-level condition. However, due to the relatively high water level, the location of the phreatic surface of the dam was elevated compared to that of the normal water-level condition, and the depth of the phreatic line of the embankment was approximately 23~25 m in most areas.
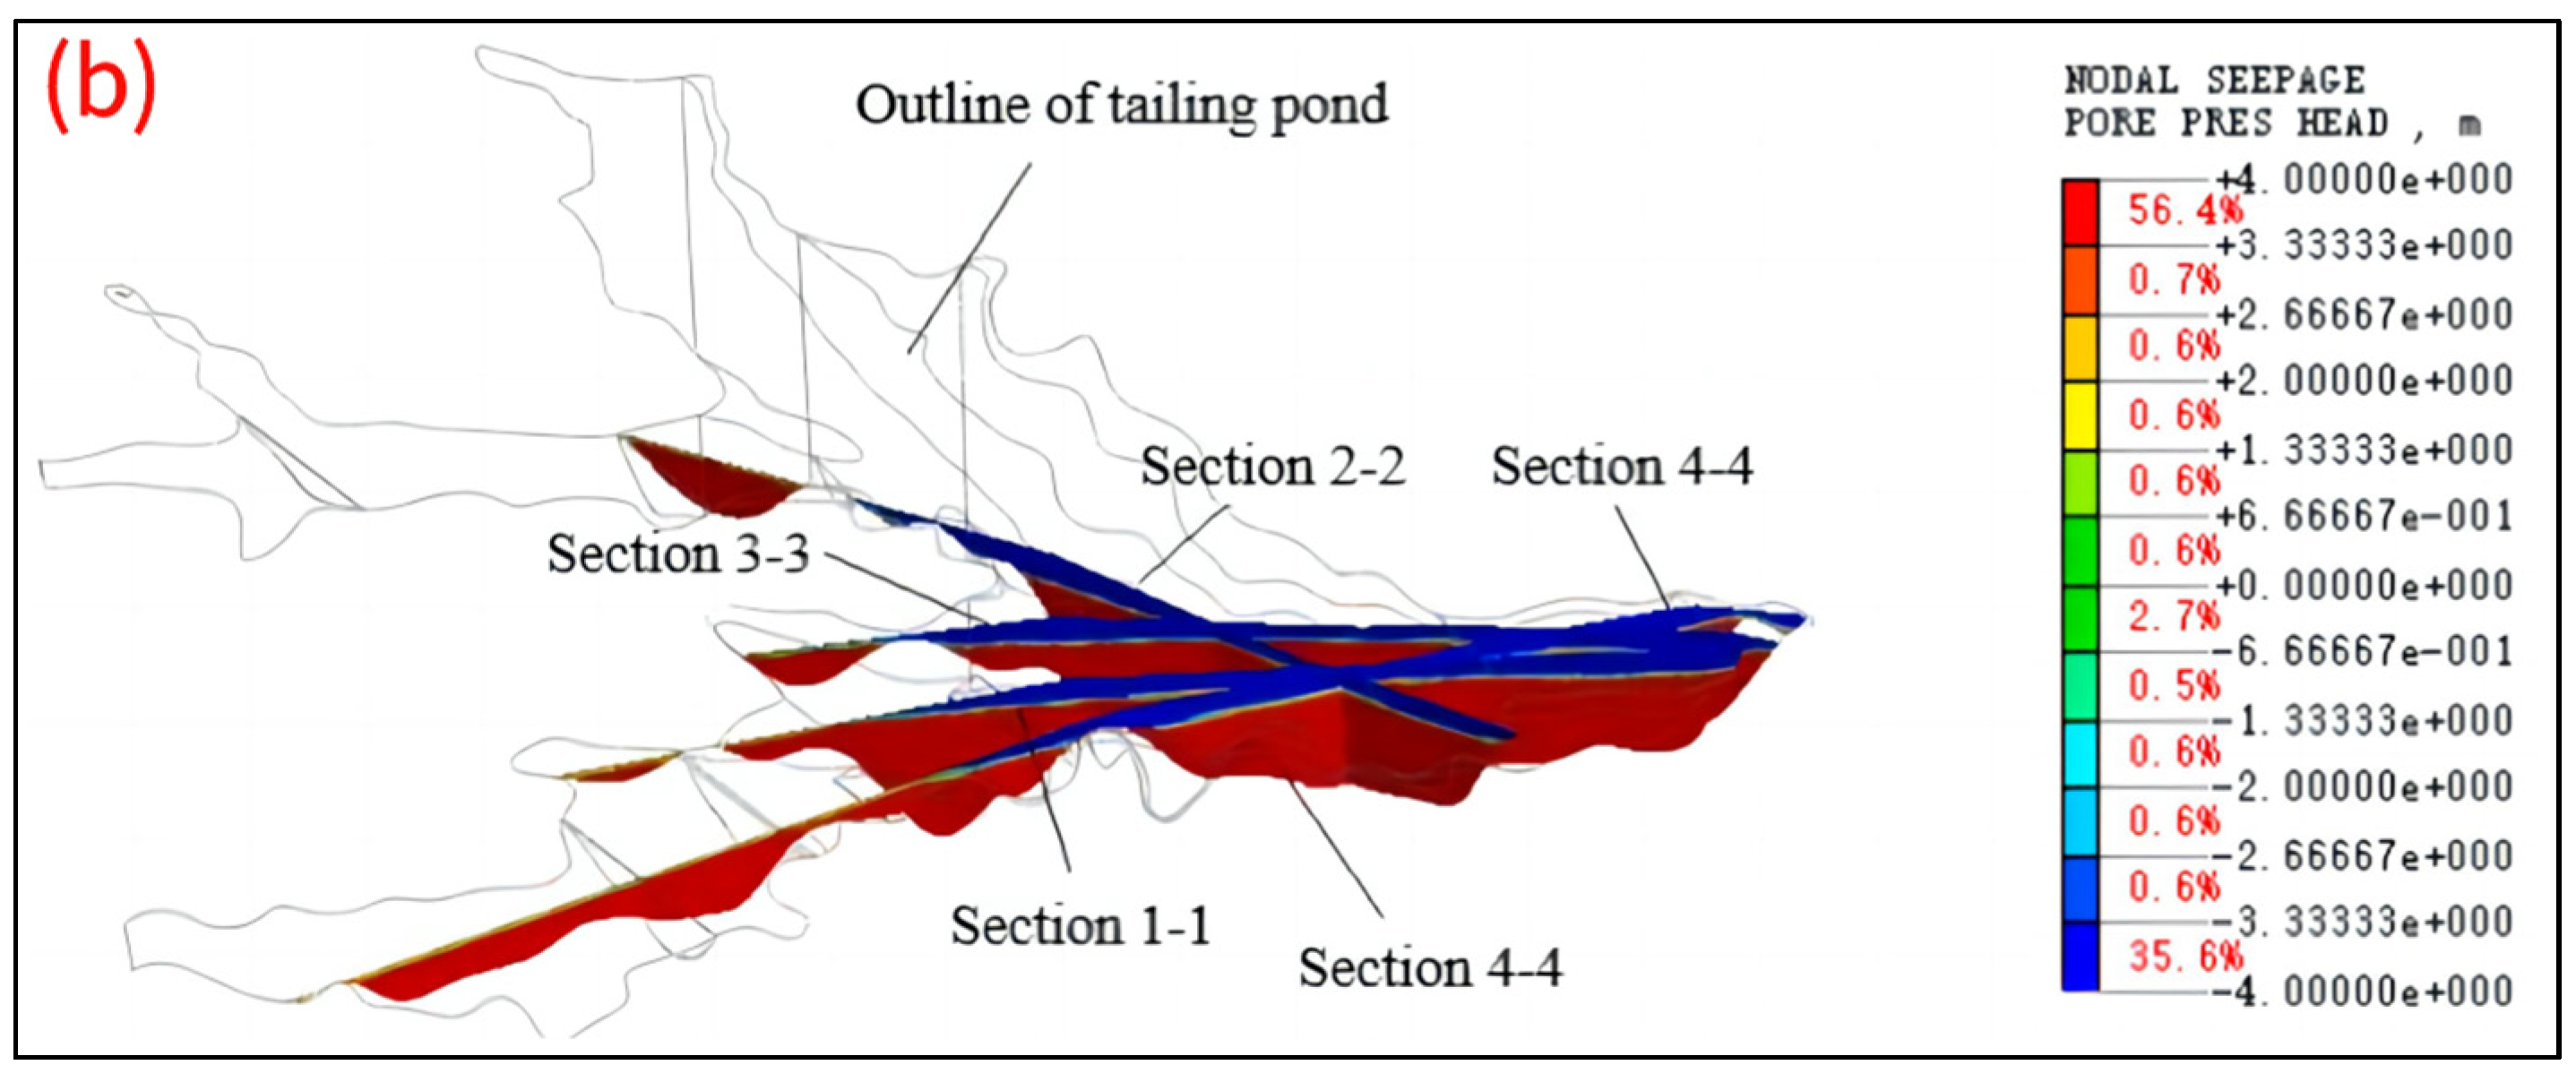
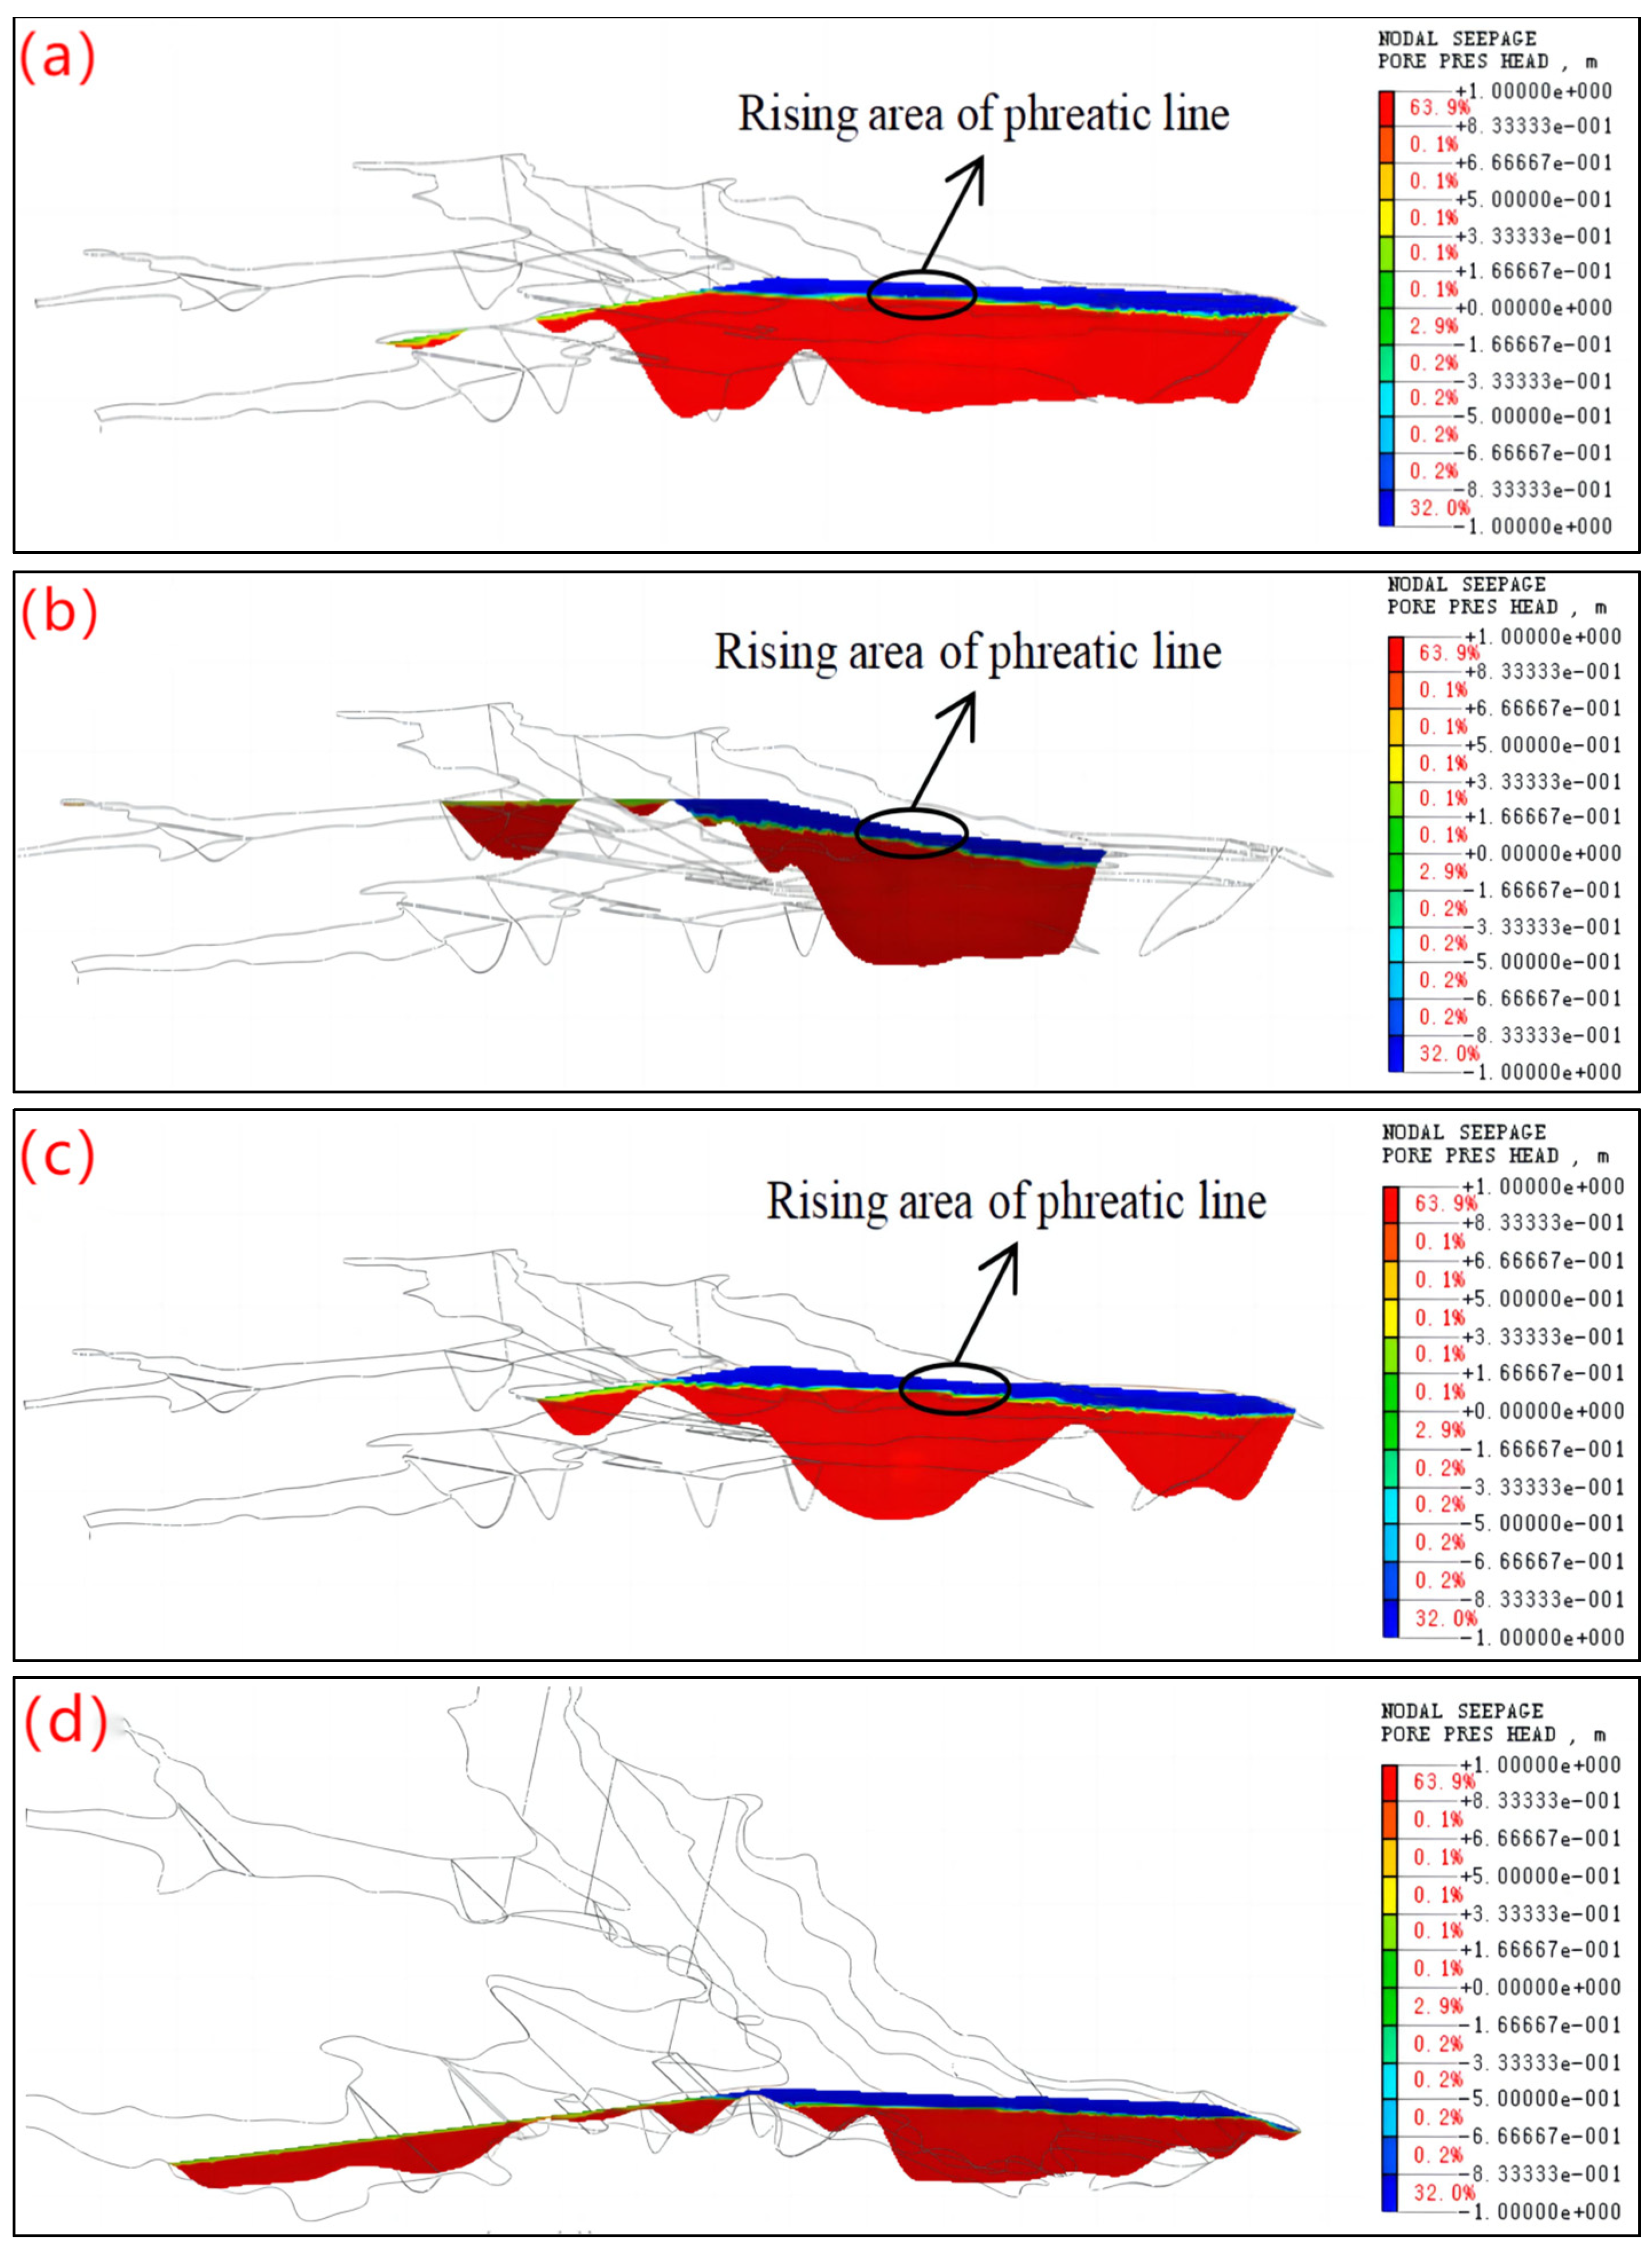
(3)
The distribution patterns of the phreatic lines in the four profiles were basically the same; neither no seepage overflow from the stacked dam slopes nor the starter dam slopes occurred, and all of them showed a relative elevation of the measured phreatic lines at the turn of the gully.

3.3. Regional Analysis of the Minimum Phreatic Line of Dams

In this study, the seepage field under the condition of flood level was selected to calculate the results, and the phreatic lines of Section 1-1 to Section 4-4 were analyzed. The analysis results are shown in Figure 8.
Through comparative analysis, it can be concluded that, in the region of 1220 m to 1250 m a.s.l., on the left shoulder of the tailing pond (near the first gully and the second gully side), the phreatic line of Section 1-1, Section 2-2, and Section 3-3 was uplifted, and the depth of the phreatic line was approximately 2~3 m higher than that in the surrounding area of the dam. Section 4-4 was relatively far away from the shoulder of the left bank of the dam, so the phreatic line was less affected and smoother. Therefore, the area of 1220 m to 1250 m a.s.l. on the left bank shoulder was the key area for the control of the phreatic line, and the seepage discharge measures in this area should be further increased.

3.4. Seepage Stability Analysis
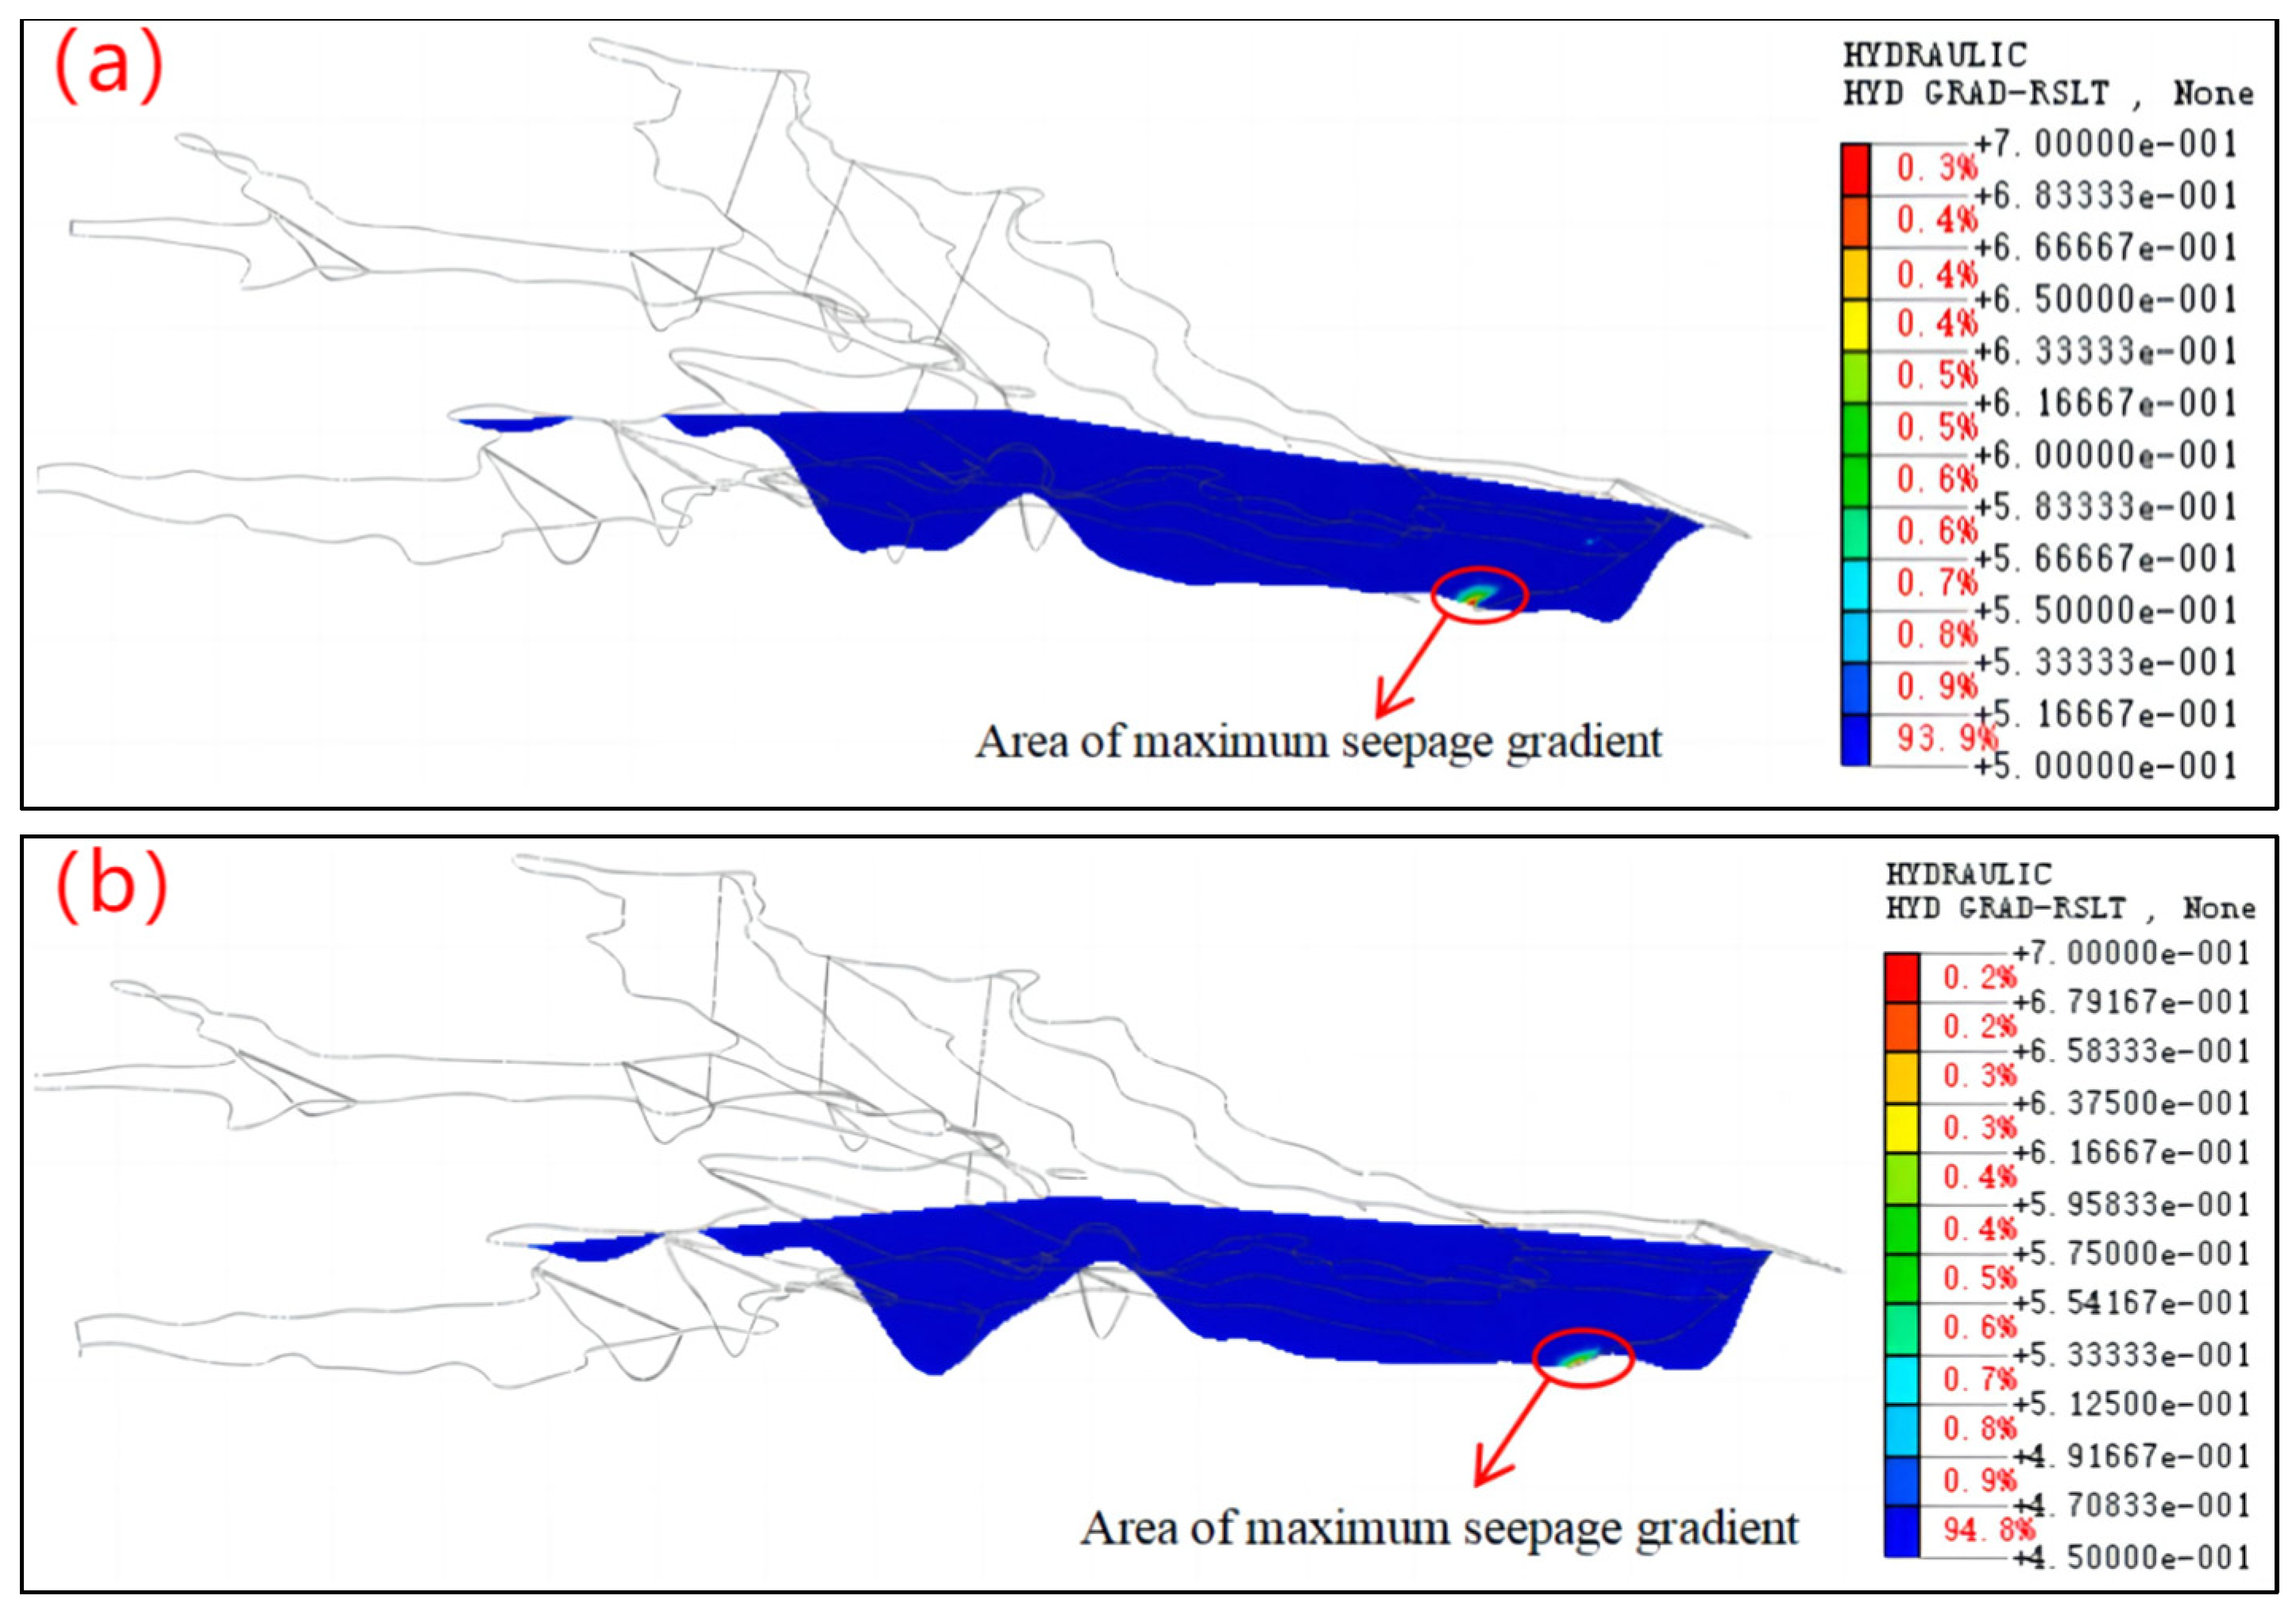
The seepage stability of a tailings dam refers to the deformation and failure characteristics of the tailings under the action of seepage. If not handled in a timely manner, it can cause major safety accidents and affect normal production. The foundation of the tailings dam was moderately weathered marble, and there was no possibility of seepage deformation damage in the dam base layer. Therefore, this article mainly analyzes the seepage stability of the tailings dam body. According to the three-dimensional seepage calculation results of tailings dams under various working conditions, the seepage gradient of the starter dam at the inner slope foot was the largest, and this area was the most unfavorable position. There were silt tailings distributed at this position, with a specific gravity value of (GS) 2.78 and a pore ratio of (e) 0.735. According to the critical slope calculation formula (1), the critical seepage gradient of the silt tailings at the foot of the starter dam slope was 1.02.
i cr = G s 1 1 + e
In the equation:
i c r —Critical seepage gradient of silt tailings.
GS—Ratio of particle density of silt tailings to the density of water.
e—Pore ratio of silt tailings.
The results of the seepage gradient at the foot of the starter dam slope under normal water level and flood-level conditions at a height of 210 m are shown in Figure 9, and the corresponding relationship between the calculated seepage gradient and the critical seepage gradient is shown in Table 5.
According to the analysis results, it can be seen that:
(1)
The seepage gradient of the dam body slightly increased under flood-level conditions compared to normal water-level conditions, which was due to the shortening of the seepage diameter under flood-level conditions.
(2)
Whether under flood-level conditions or normal water-level conditions, the seepage gradient of tailings near the starter dam slope was less than the critical seepage gradient of 1.02, indicating that there would be no seepage deformation or seepage damage, and the stability of seepage of the tailings dam body was safe.

3.5. Analysis of Controlled Position of the Phreatic Line
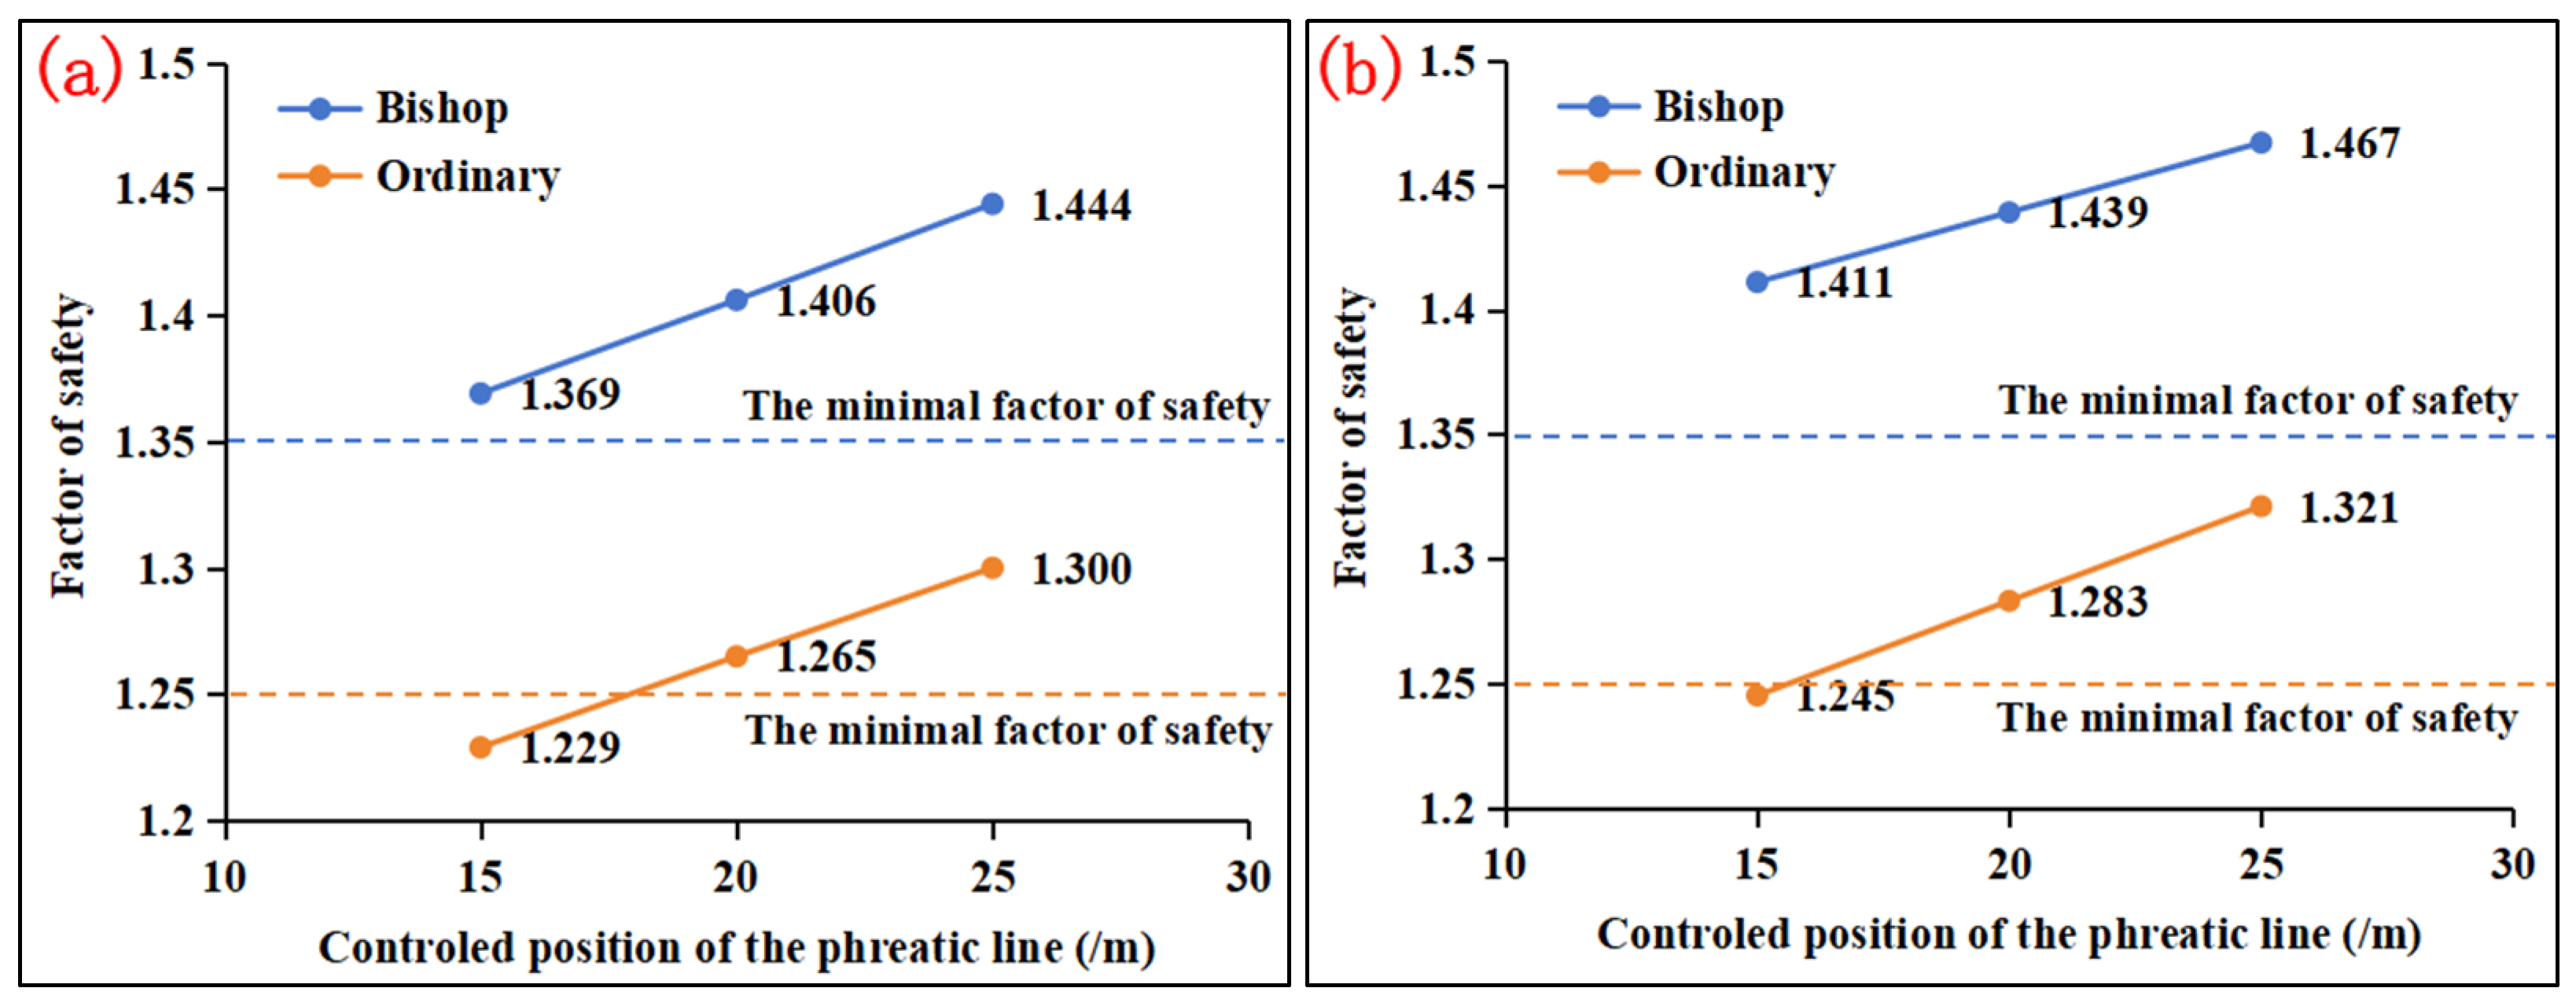
The controlled position of the phreatic line meets both the requirement on the criticized position of the phreatic line and the requirement on the minimum buried depth of the phreatic line on the downstream slope of the embankment. When the height of the tailings dam reached 210 m and the storage capacity was less than 100 million cubic meters, according to 3.3.1 of the “Code for Design of Tailings Facilities” (GB50863-2013), the tailings dam was classified as a second-class storage, and the stability of the controlled position of the phreatic line was executed according to the second-class storage standard. The minimum safety factor for anti-sliding stability of dam slopes required by the specifications is shown in Table 6.
Three fitting phreatic lines were selected for calculating the controlled position of the phreatic line, with burial depths of 15 m, 20 m, and 25 m. The control depth was based on the phreatic line depth when the safety factor of the dam body’s anti-sliding stability was slightly greater than the standard value. Taking the stability calculation of Section A-A and Section B-B as examples (the distribution of profile positions is shown in Figure 1), the stability test of the dam body was conducted under normal water-level conditions for different burial depths of the phreatic line. The computational models for Section A-A and Section B-B are shown in Figure 10 and the test results are shown in Figure 11. In Figure 11, the blue solid line represents the factor of safety calculated using the Bishop method and the orange solid line represents the factor of safety calculated using the ordinary method. The blue dashed line represents the minimum factor of safety required in the code for the Bishop method and the orange dashed line represents the minimum factor of safety required in the code for the ordinary method. When the solid line is above the dashed line, it indicates that the dam could meet the stability requirements, and when the solid line is below the dashed line, it indicates that the dam does not meet the stability requirements under this controlled position of the phreatic line.
According to the analysis results, it can be seen that:
(1)
For section A-A, when the controlled position of the phreatic line was at a buried depth of 20 m, the ordinary method calculation result under normal operation was 1.265 and was greater than the minimum safety factor specified of 1.250, while the simplified Bishop method calculation result was 1.406 and greater than the minimum safety factor specified of 1.350. When the controlled position of the phreatic line was at a buried depth of 15 m, the calculation result of the ordinary method under normal operation was 1.229, which was less than the minimum safety factor specified of 1.250. After the interpolation calculation, when the controlled position of the phreatic line was 19 m, the calculation result of the ordinary method was greater than 1.250, which meets the requirements of the specification. According to the “Safety Regulations for Tailings Ponds” (GB39496-2020), the buried depth of the controlled position of the phreatic line of the embankment should not be less than 1.2 times that obtained by calculation. Therefore, the controlled position of the phreatic line of section A-A was controlled at a buried depth of 23 m.
(2)
For Section B-B, when the controlled position of the phreatic line was at a buried depth of 20 m, the ordinary method calculation result under normal operation was 1.283 and was greater than the minimum safety factor specified of 1.250, while the simplified Bishop method calculation result was 1.439 and greater than the minimum safety factor specified of 1.350. When the controlled position of the phreatic line was at a buried depth of 15 m, the calculation result of the ordinary method under normal operation was 1.245, which was less than the minimum safety factor specified of 1.250. After the interpolation calculation, when the controlled position of the phreatic line was 16 m, the calculation result of the ordinary method was greater than 1.250, which meets the requirements of the specification. According to the “Safety Regulations for Tailings Ponds” (GB39496-2020), the buried depth of the controlled position of the phreatic line of the embankment should be more than 1.2 times that obtained by calculation. Therefore, the controlled position of the phreatic line of section B-B was controlled at a buried depth of 19.2 m.
(3)
According to the stability test results of different controlled positions of the phreatic lines for Sections A-A and B-B, it can be concluded that the stability requirements and minimum controlled position of the phreatic line requirements could be met when the controlled position of the phreatic line was 23 m.

4. Analysis and Discussion

The best solutions for the permeability coefficients of the tailings dams are presented in Table 4 and, comparing them with the permeability parameters obtained from the tests in Table 2, it can be observed that the fitted tailings permeability coefficients were all greater than the values of the indoor tests. The main reason for this situation was that the role of tailings impoundment drainage measures has been equivalently reflected in the best-fit model permeability coefficients. During the back analysis, it was found that although the inversion analysis model could equivalently reflect the effect of the exfiltration measures, the location of the fitted phreatic line was still somewhat higher than the actual phreatic line depth. On the other hand, it suggested that the use of equivalent permeability coefficients for calculations was on the safe side. The permeability coefficient was comprehensively considered as the engineering site conditions and could be used for three-dimensional seepage analysis of a tailings dam. The analysis results are consistent with the conclusions of reference [41,42]. Therefore, the drilling data and exploration results should be used as much as possible so that the established finite element model can contain more real measurement information, which is especially important in the inverse analysis. In the process of establishing a finite element model, modeling should be based on a realistic situation, but appropriate model simplification is also necessary. The model generated by this software was consistent with the actual terrain and the calculated values were in good agreement with the measured values, which is consistent with the conclusions of references [23,32]. Under both normal water-level and flood-level conditions, the phreatic surface did not intersect with the slopes of the initial dam and the accumulation dam, and seepage would not overflow from the dam slope. The results are consistent with the reference, indicating that the permeability coefficient of the starter dam is crucial for the stability of the tailings dam.
Based on the actual measured data of the phreatic line, it can be concluded that under the existing drainage measures, the depth of the infiltration line can generally be maintained above 25 m. In the later stage, the control phreatic line of the tailings dam that will be required is 23 m. It is preliminarily judged that the requirements could be met with corresponding measures taken. When the tailings dam was raised to 210 m, the calculated phreatic line was 23~28 m, and the control phreatic line was required to be greater than 23 m, which could meet the requirement but the richness was not big. Therefore, the seepage discharge facilities in the reservoir area should be strengthened during the heightening process to ensure the safe operation of the tailings dam in the later stage.
Under the flood-level condition, the distribution pattern of the phreatic line is similar to that of the normal water-level condition. However, due to the relatively high water level, the location of the phreatic surface of the dam is elevated compared to that of the normal water-level condition. The elevation of the phreatic line in the left dam abutment area is relatively obvious, and the calculation results are consistent with reference [14], with both showing the elevation of the phreatic line due to the influence of the mountain. Therefore, the area of 1220 m to 1250 m a.s.l. on the left bank shoulder was the key area for the control of the phreatic line, and the seepage discharge measures in this area should be further increased, and local horizontal drainage methods can be used to control the seepage line [27].
The main causes of localized phreatic line elevation are summarized below:
(1)
The seepage from three valleys was superimposed in the common area of the three valleys in the tailings dam; therefore, the seepage amount in this area was larger than that in other areas.
(2)
The confluence area was affected by the conditions of valley and reservoir types, and the length of the dam axis was significantly narrowed, forming a bottleneck effect.
(3)
The second gully in this area turned and the dam body deflected. In addition, due to the blocking effect of the left bank mountain, the left phreatic line in this area was slightly higher than the right phreatic line.

5. Conclusions

The seepage stability of tailings dams is very important for their stability. At present, numerical simulation is widely used in the simulation of a tailings dam seepage flow field to accurately determine seepage stability and reduce online monitoring costs. Therefore, studying the seepage problem of tailings dams and simulating the seepage field of tailings dams is an important task. In this study, the engineering profile and geological conditions of the tailings dam were provided, from which a finite element model was developed, and the physical and mechanical parameters of the tailings sand in different layers were measured by carrying out indoor experiments, which were then used as the basis for inverse analyses, and the results were further used for numerical simulations. Total head, phreatic lines, and seepage safety coefficients under different working conditions were derived. The main conclusions are summarized below:
(1)
This study used seepage back analysis to obtain the permeability coefficients of tailings in different layers and conducted an analysis of the mutual influence law of seepage field by the coefficients, revealing the key areas and reasons, and proposed countermeasures for seepage control. These findings will provide reference and guidance for the construction and daily safety management of high pile tailings dams with fine-grained tailings under similar complex terrain conditions. The next study will investigate the impact of different drainage measures on the control of seepage in sensitive areas and conduct on-site practice.
(2)
Back analysis using drilling data to establish a finite element model was a very practical and effective method in practical engineering, which could accurately reflect the actual permeability coefficient of each partition of tailings dams and lay the foundation for the later seepage calculation of the tailings dam.
(3)
Due to the comprehensive influence of complicated geography conditions such as multiple areas of seepage accumulation, large valley corners, and narrowing of the dam axis, there was a significant difference in the spatial seepage characteristics of a high fine-grained tailings dam. In the region of 1220 m to 1250 m a.s.l. on the left shoulder of the tailing dam, the phreatic line was elevated by 2 m~3 m compared to the surrounding area and was the most critical region of the tailings dam seepage control.
(4)
The seepage gradient of the starter dam at the inner slope foot was the largest, which was smaller than the critical seepage gradient, and seepage failure could not occur. When the tailings dam was 210 m high, the depth of the phreatic line was controlled to be 23 m, which could be easily controlled by setting corresponding drainage facilities.
(5)
In addition to strengthening the daily monitoring of the key areas of the tailings dam, it was critical to control the local phreatic line and ensure the safe of the tailings dam by adopting local horizontal seepage drainage measures or radiation wells. It is recommended to carry out determination tests of the permeability coefficient and particle size at regular intervals, and ensure that the permeability coefficient of the tailing sand does not change accordingly, and strengthen the monitoring of the exfiltration facilities. The research results can possibly be applied to a tailing dam with similar geological conditions, particle size distribution, sedimentation pattern, and permeability coefficient as this tailing dam.

Author Contributions

Conceptualization, Y.H., G.W., X.Z. and B.Z.; methodology, Y.H. and G.W.; software, Y.H. and B.Z.; validation, X.Z.; formal analysis, Y.H. and B.Z.; investigation, Y.H. and X.Z.; data curation, Y.H.; writing—original draft preparation, Y.H. and B.Z.; writing—review and editing, Y.H.; supervision, G.W. and B.Z. All authors have read and agreed to the published version of the manuscript.

Funding

This research received no external funding.

Institutional Review Board Statement

Not applicable.

Informed Consent Statement

Not applicable.

Data Availability Statement

The data presented in this study are available on request from the corresponding author. The data are not publicly available due to Specificity of the project.

Conflicts of Interest

Authors Yabing Han and Xudong Zhang were employed by the company Beijing General Research Institute of Mining and Metallurgy Technology Group. The remaining authors declare that the research was conducted in the absence of any commercial or financial relationships that could be construed as a potential conflict of interest.

References

  1. Sun, E.; Zhang, X.; Li, Z. The internet of things (IOT) and cloud computing (CC) based tailings dam monitoring and pre-alarm system in mines. Safety Sci. 2012, 50, 811–815. [Google Scholar] [CrossRef]
  2. Mura, J.; Gama, F.; Paradella, W.; Negrão, P.; Carneiro, S.; de Oliveira, C.; Brandão, W. Monitoring the Vulnerability of the Dam and Dikes in Germano Iron Mining Area after the Collapse of the Tailings Dam of Fundão (Mariana-MG, Brazil) Using DInSAR Techniques with TerraSAR-X Data. Remote Sens. 2018, 10, 1507. [Google Scholar] [CrossRef]
  3. Yin, G.; Li, G.; Wei, Z.; Wan, L.; Shui, G.; Jing, X. Stability analysis of a copper tailings dam via laboratory model tests: A Chinese case study. Miner. Eng. 2011, 24, 122–130. [Google Scholar] [CrossRef]
  4. Zou, W.; Zhang, Q.; Shi, L.; Miao, Y. Release Rules and Groundwater Contamination Risk of Heavy Metals from Dump and Tailings Pond of a Copper Mine in Jiangxi. Nonferrous Met. Eng. 2016, 6, 90–94. [Google Scholar]
  5. Wang, G.; Hu, B.; Tian, S.; Ai, M.; Liu, W.; Kong, X. Seepage field characteristic and stability analysis of tailings dam under action of chemical solution. Sci. Rep. 2021, 11, 4073. [Google Scholar] [CrossRef]
  6. Santamarina, J.C.; Torres-Cruz, L.A.; Bachus, R.C. Why coal ash and tailings dam disasters occur. Science 2019, 364, 526–528. [Google Scholar] [CrossRef]
  7. Liang, Y. Tailings Dam Collapse in Nandan on 18 October. Coast. Environ. 2000, 12, 7. [Google Scholar]
  8. Palmer, J. Anatomy of a Tailings Dam Failure and a Caution for the Future. Engineering 2019, 5, 605–606. [Google Scholar] [CrossRef]
  9. Van Niekerk, H.J.; Viljoen, M.J. Causes and consequences of the Merriespruit and other tailings-dam failures. Land. Degrad. Dev. 2005, 16, 201–212. [Google Scholar] [CrossRef]
  10. Liu, H. Enlightenment of the Brumadinho Tailings Pond Collapse in Brazil to the Upstream Embankment. Nonferrous Met. Eng. Res. 2020, 41, 49–51. [Google Scholar]
  11. Chronology of Major Tailings Dam Failures, World Information Service on Energy. Available online: https://www.wise-uranium.org/mdaf.html (accessed on 21 December 2021).
  12. Azam, S.; Li, Q. Tailings dam failures: A review of the last one hundred years. Geotech. News 2010, 28, 50–54. [Google Scholar]
  13. Yong, W.; Li, X.K.; Xin, Z. Discussion on the causes for tailings dam accidents at home and abroad. Met. Mine 2009, 7, 139–142. [Google Scholar]
  14. Gan, H.; Bi, Q.; Cui, X. Three-dimensional seepage field analysis of high-stack tailings dam by upstream method under complex reservoir type condition. Nonferr. Metal. 2018, 70, 26–30. [Google Scholar]
  15. Shahriari, M.; Aydin, M.E. Lessons Learned from Analysis of Los Frailes Tailing Dam Failure. In International Conference on Applied Human. Factors and Ergonomics; Springer: Cham, Switzerland, 2017; pp. 309–317. [Google Scholar]
  16. Gui, R.; He, G. The Effects of Internal Erosion on the Physical and Mechanical Properties of Tailings under Heavy Rainfall Infiltration. Appl. Sci. 2021, 11, 9496. [Google Scholar] [CrossRef]
  17. Kang, F.; Wang, G.; Li, Y.; Cai, B.; Li, S.; Zhao, L.; Li, X. Analysis of the Dynamic Stability of Tailing Dams: An Experimental Study on the Dynamic Characteristics of Tailing Silt. Appl. Sci. 2023, 13, 5250. [Google Scholar] [CrossRef]
  18. Chai, X.; Sheng, Y.; Liu, J.; Xu, Y.; Liu, H. Experimental Study on the Mechanical Properties of Saturated Tailing Sand with Different Particle Sizes. Appl. Sci. 2022, 12, 12231. [Google Scholar] [CrossRef]
  19. Zhang, C. Dynamic Properties of Tailings and the Stability Analysis of Tailings Dam; Institute of Rock & Soil Mechanics, The Chinese Academy of Sciences: Wuhan, China, 2005. [Google Scholar]
  20. Zhang, C.; Yang, C. Effect of fines content on liquefaction properties of tailings material. Rock Soil. Mech. 2006, 27, 1133–1137. [Google Scholar]
  21. Zhang, C.; Man, C.; Yang, C.; Chen, Q.; Pan, Z. Effects of particle diameter on shear strength of tailings and stability of tailings dams. Chin. J. Geotech. Eng. 2019, 41, 145–148. [Google Scholar]
  22. Li, Q.; Wu, B.; Li, X.; Jia, S.; Zhen, F.; Gao, S. The Relatively Stable Seepage Field: A New Concept to Determine Seepage Field in the Design of a Dry-Stack Tailings Pond. Appl. Sci. 2022, 12, 12123. [Google Scholar] [CrossRef]
  23. Qi, Q.; Zhang, L.; Li, G. Numerical simulation of 3-D seepage field in the tailings of complex terrain. J. Hydro. Eng. 2012, 31, 157–161. [Google Scholar]
  24. Liu, H.; Li, N.; Liao, X.; Gong, J.; Fang, F. Unsteady seepage analysis of tailing dams considering coupling of stress and seepage fields. Chin. J. Geotech. Eng. 2004, 23, 2870–2875. [Google Scholar]
  25. Zhang, C.; Chai, J.; Cao, J.; Xu, Z.; Qin, Y.; Lv, Z. Numerical Simulation of Seepage and Stability of Tailings Dams: A Case Study in Lixi, China. Water 2020, 12, 742. [Google Scholar] [CrossRef]
  26. Rico, M.; Benito, G.; Diez-Herrero, A. Floods from tailings dam failures. J. Hazard. Mater. 2008, 154, 79–87. [Google Scholar] [CrossRef] [PubMed]
  27. Jin, J.; Liang, L.; Chen, T.; Xu, H.; Dong, T. The Seepage Calculation and the Drainage Design of Tailings Dam. Met. Mine. 2013, 6, 155–157. [Google Scholar]
  28. Bascetin, A.; Tuylu, S.; Adiguzel, D.; Eker, H.; Odabas, E. Numerical Modelling of Pb-Zn Mine Tailing Dam Based on Soil Stability. In Proceedings of the 18th Symposium on Environmental Issues and Waste Management in Energy and Mineral Production 2019, SWEMP 2018, Santiago, Chile, 19–23 November 2018; pp. 181–187. [Google Scholar]
  29. Bascetin, A.; Adiguzel, D.; Eker, H.; Tuylu, S. The investigation of geochemical and geomechanical properties in surface paste disposal by pilot-scale tests. Int. J. Min. Reclam. Env. 2022, 36, 537–551. [Google Scholar] [CrossRef]
  30. Yin, G.; Wei, Z.; Wang, L. Numerical simulation analysis about seepage field of Longdu tail bay. Rock Soil. Mech. 2003, 24, 25–28. [Google Scholar]
  31. Yin, G.; Jing, X.; Wei, Z.; Li, X. Study of model test of seepage character eristic and field measurement of course and fine tailings dam. Chin. J. Rock Mech. Eng. 2010, 29, 3710–3718. [Google Scholar]
  32. Deng, H.; Li, S.; Deng, J. 3D-numerical simulation on the stability of tailings dam under the coupled stress and seepage fields. J. Saf. Environ. 2016, 16, 133–138. [Google Scholar]
  33. Wang, W.; Yin, G.; Wei, Z.; Jing, X.; Yang, Y.; Chen, Y. Analysis of the dynamic response and stability of fine-grained tailings dam by upstream embankment method in the area of high intensity earthquake. Chin. J. Rock Mech. Eng. 2017, 36, 1201–1214. [Google Scholar]
  34. Yang, J.; Hu, J.; Wu, Y.; Zhang, B. Numerical Simulation of Seepage and Stability of Tailing Dams: A Case Study in Ledong, China. Sustainability 2022, 14, 12393. [Google Scholar] [CrossRef]
  35. Xu, Z.; Yang, X.; Chai, J.; Qin, Y.; Li, Y. Permeability Characteristics of Tailings considering Chemical and Physical Clogging in Lixi Tailings Dam, China. J. Chem. 2016, 2016, 8147845. [Google Scholar] [CrossRef]
  36. Yang, Y.; Wei, Z.; Cao, G.; Yang, Y.; Wang, H.; Zhuang, S.; Lu, T. A case study on utilizing geotextile tubes for tailings dams construction in China. Geotext. Geomembr. 2019, 47, 187–192. [Google Scholar] [CrossRef]
  37. Liu, C.; Shen, Z.; Gan, L.; Xu, L.; Zhang, K.; Jin, T. The Seepage and Stability Performance Assessment of a New Drainage System to Increase the Height of a Tailings Dam. Appl. Sci. 2018, 8, 1840. [Google Scholar] [CrossRef]
  38. Peng, K.; Zhou, J.; Zou, Q.; Zhang, J.; Wu, F. Effects of stress lower limit during cyclic loading and unloading on deformation characteristics of sandstones. Constr. Build. Mater. 2019, 217, 202–215. [Google Scholar] [CrossRef]
  39. Wu, T.; Qin, J. Experimental Study of a Tailings Impoundment Dam Failure Due to Overtopping. Mine Water Environ. 2018, 37, 272–280. [Google Scholar] [CrossRef]
  40. Jing, X.; Chen, Y.; Xie, D.; Williams, D.J.; Wu, S.; Wang, W.; Yin, T. The Effect of Grain Size on the Hydrodynamics of Mudflow Surge from a Tailings Dam-Break. Appl. Sci. 2019, 9, 2474. [Google Scholar] [CrossRef]
  41. Li, K.; Deng, X.; He, M.; Chai, J.; Li, S. Finite element modeling of back analysis of permeability coefficient of tailing dam based on boring data. Chin. J. Rock Mech. Eng. 2004, 23, 4329–4332. [Google Scholar]
  42. Xu, W.; Chai, J.; Chen, X.; Liu, Z.; Du, C. Inversion analysis of seepage parameters for Donggou tailing filling dam. Geotech. Investig. Surv. 2009, 37, 66–69. [Google Scholar]
Figure 1. Layout of the tailings dam (Sections A-A and B-B are typical). (a) Layout of the tailings dam and distribution of drilling positions. (b) Aerial view of the tailings dam. (c) The 3D model diagram of the tailings dam and surrounding mountains.
Applsci 13 12859 g001
Figure 2. Flow diagram of study.
Applsci 13 12859 g002
Figure 3. Grid diagram for 160 m dam height. (a) Models containing the tailings dam and surrounding mountains. (b) Models containing the starter dam and embankment.
Applsci 13 12859 g003
Figure 4. Grid diagram for 210 m dam height. (a) Models containing the tailing dams and surrounding mountains. (b) Models containing the starter dam and embankment.
Applsci 13 12859 g004aApplsci 13 12859 g004b
Figure 5. Distribution of total head. (a) Normal water-level condition. (b) Flood-water-level condition.
Applsci 13 12859 g005
Figure 6. Map of the location of the phreatic surface under normal water-level conditions (the middle part of the red and blue junction is the location of the phreatic surface of the dam). (a) The spatial phreatic surface. (b) The phreatic line of the dam body in a typical profile.
Applsci 13 12859 g006aApplsci 13 12859 g006b
Figure 7. Map of the location of the phreatic surface under flood-water-level conditions. (a) The spatial phreatic surface. (b) The phreatic line of the dam body in a typical profile.
Applsci 13 12859 g007
Figure 8. Distribution of phreatic lines in different profiles of the tailings dam (210 m dam height) under flood-level conditions. (a) Section 1-1, (b) Section 2-2, (c) Section 3-3, (d) Section 4-4.
Applsci 13 12859 g008
Figure 9. Area of maximum seepage gradient of the dam body at a height of 210 m. (a) Normal water-level conditions (i = 0.679). (b) Flood-water-level conditions (i = 0.690).
Applsci 13 12859 g009
Figure 10. The computational models of different sections. (a) Section A-A, (b) Section B-B.
Applsci 13 12859 g010
Figure 11. Safety factors for different controlled position of the phreatic lines. (a) Section A-A, (b) Section B-B.
Applsci 13 12859 g011
Table 3. Measured depth of phreatic line in different boreholes.
Borehole NumberZK1ZK2ZK3ZK4ZK5ZK6ZK7ZK8ZK9
Measured depth of phreatic line/m25.935.535.833.232.833.333.932.132.8
Table 4. Best solutions of the permeability coefficient for the tailings dam.
MaterialsDensity (KN/m3)Penetration Coefficient (cm/s)
Starter dam21.01.50 × 10−1
Fine sand tailings17.97.24 × 10−4
Silty sand tailings19.45.27 × 10−4
Silt tailings20.12.51 × 10−4
Silty clay tailings19.90.62 × 10−4
Decayed rock22.02.02 × 10−6
Bedrock27.03.10 × 10−6
Table 5. Results of seepage stability analysis.
Operating ModePositionCritical Seepage GradientCalculated Seepage GradientAnalysis
Results
Normal water-level conditionsAt the foot of the starter dam slope1.020.679Steady
Flood-level conditionsAt the foot of the starter dam slope1.020.690Steady
Table 6. The minimum safety factor for anti-sliding stability of dam slopes.
Calculation MethodOperating ConditionGrade of Dam
1234, 5
Simplified Bishop
method
Normal operation1.501.351.301.25
Ordinary methodNormal operation1.301.251.201.15
Disclaimer/Publisher’s Note: The statements, opinions and data contained in all publications are solely those of the individual author(s) and contributor(s) and not of MDPI and/or the editor(s). MDPI and/or the editor(s) disclaim responsibility for any injury to people or property resulting from any ideas, methods, instructions or products referred to in the content.

