
Anchors to Solid Clay Brick Masonry in Tension: Behavior under Monotonic and Repeated Loading for Constant Embedment Depth

 , and
, and
Abstract
:1. Introduction
2. Literature Review
3. The Experimental Campaign
3.1. Materials
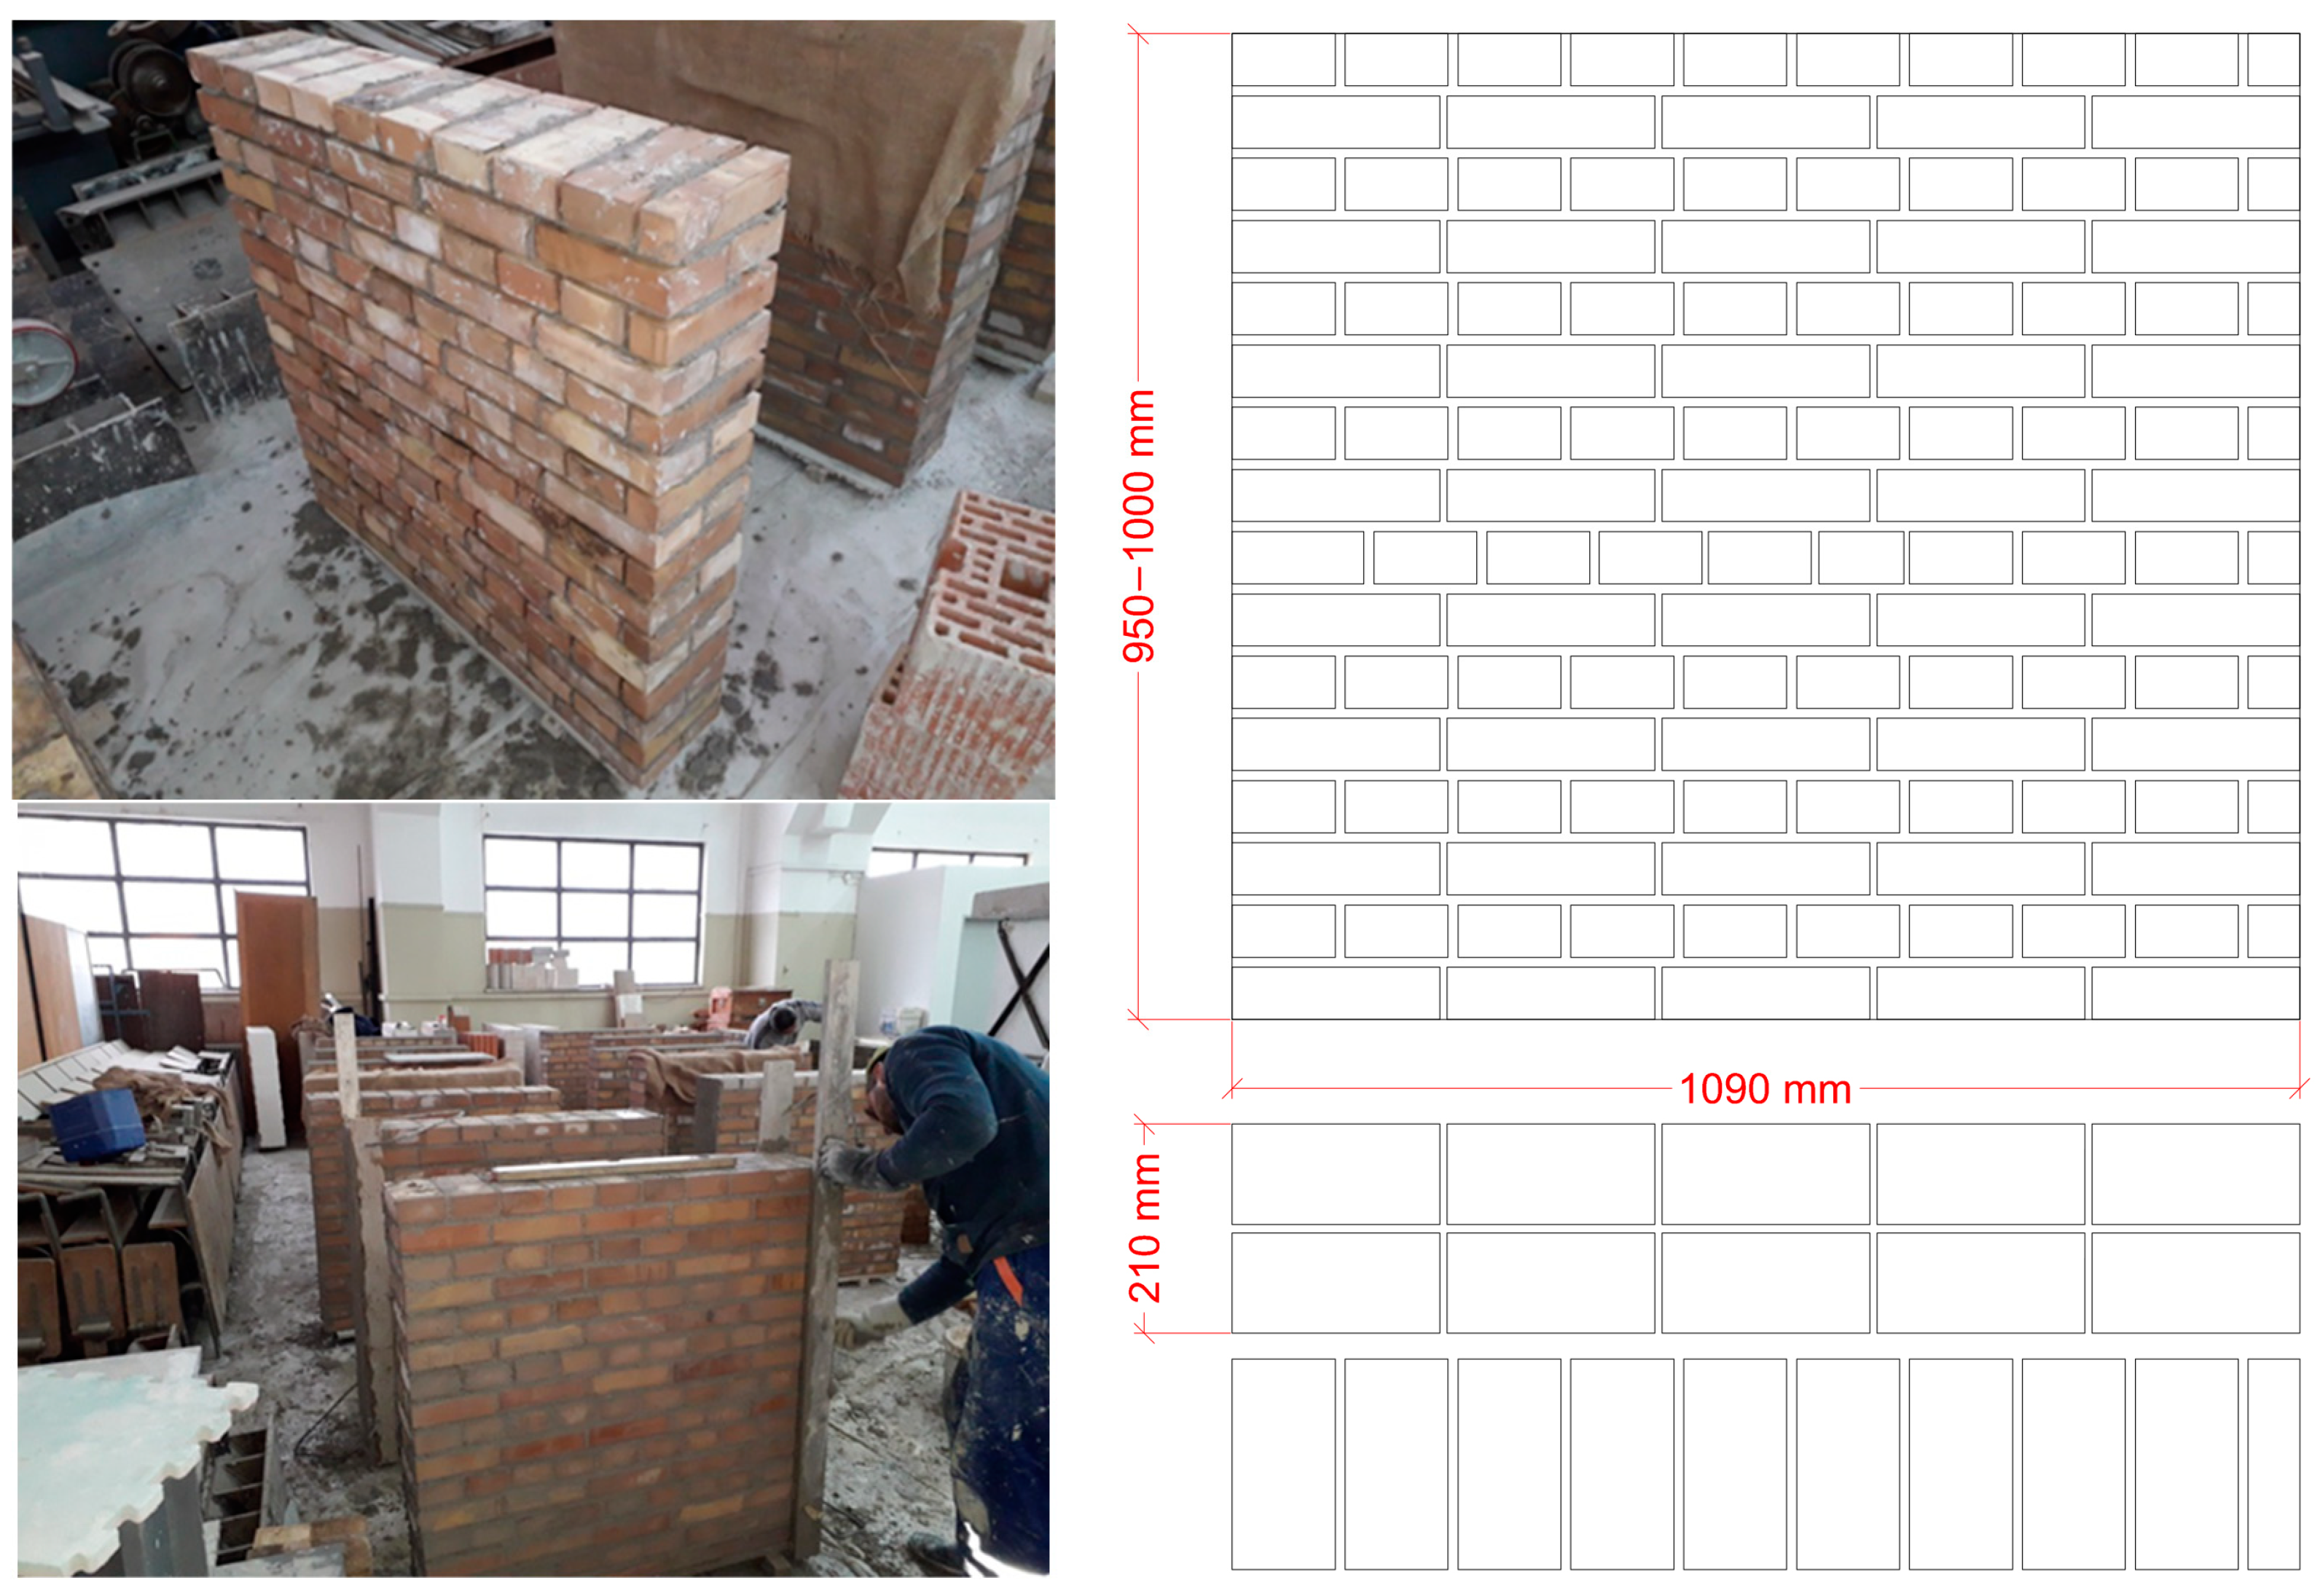
3.2. The Specimen
3.3. Investigated Parameters
3.3.1. Anchor Location
3.3.2. Crack Opening
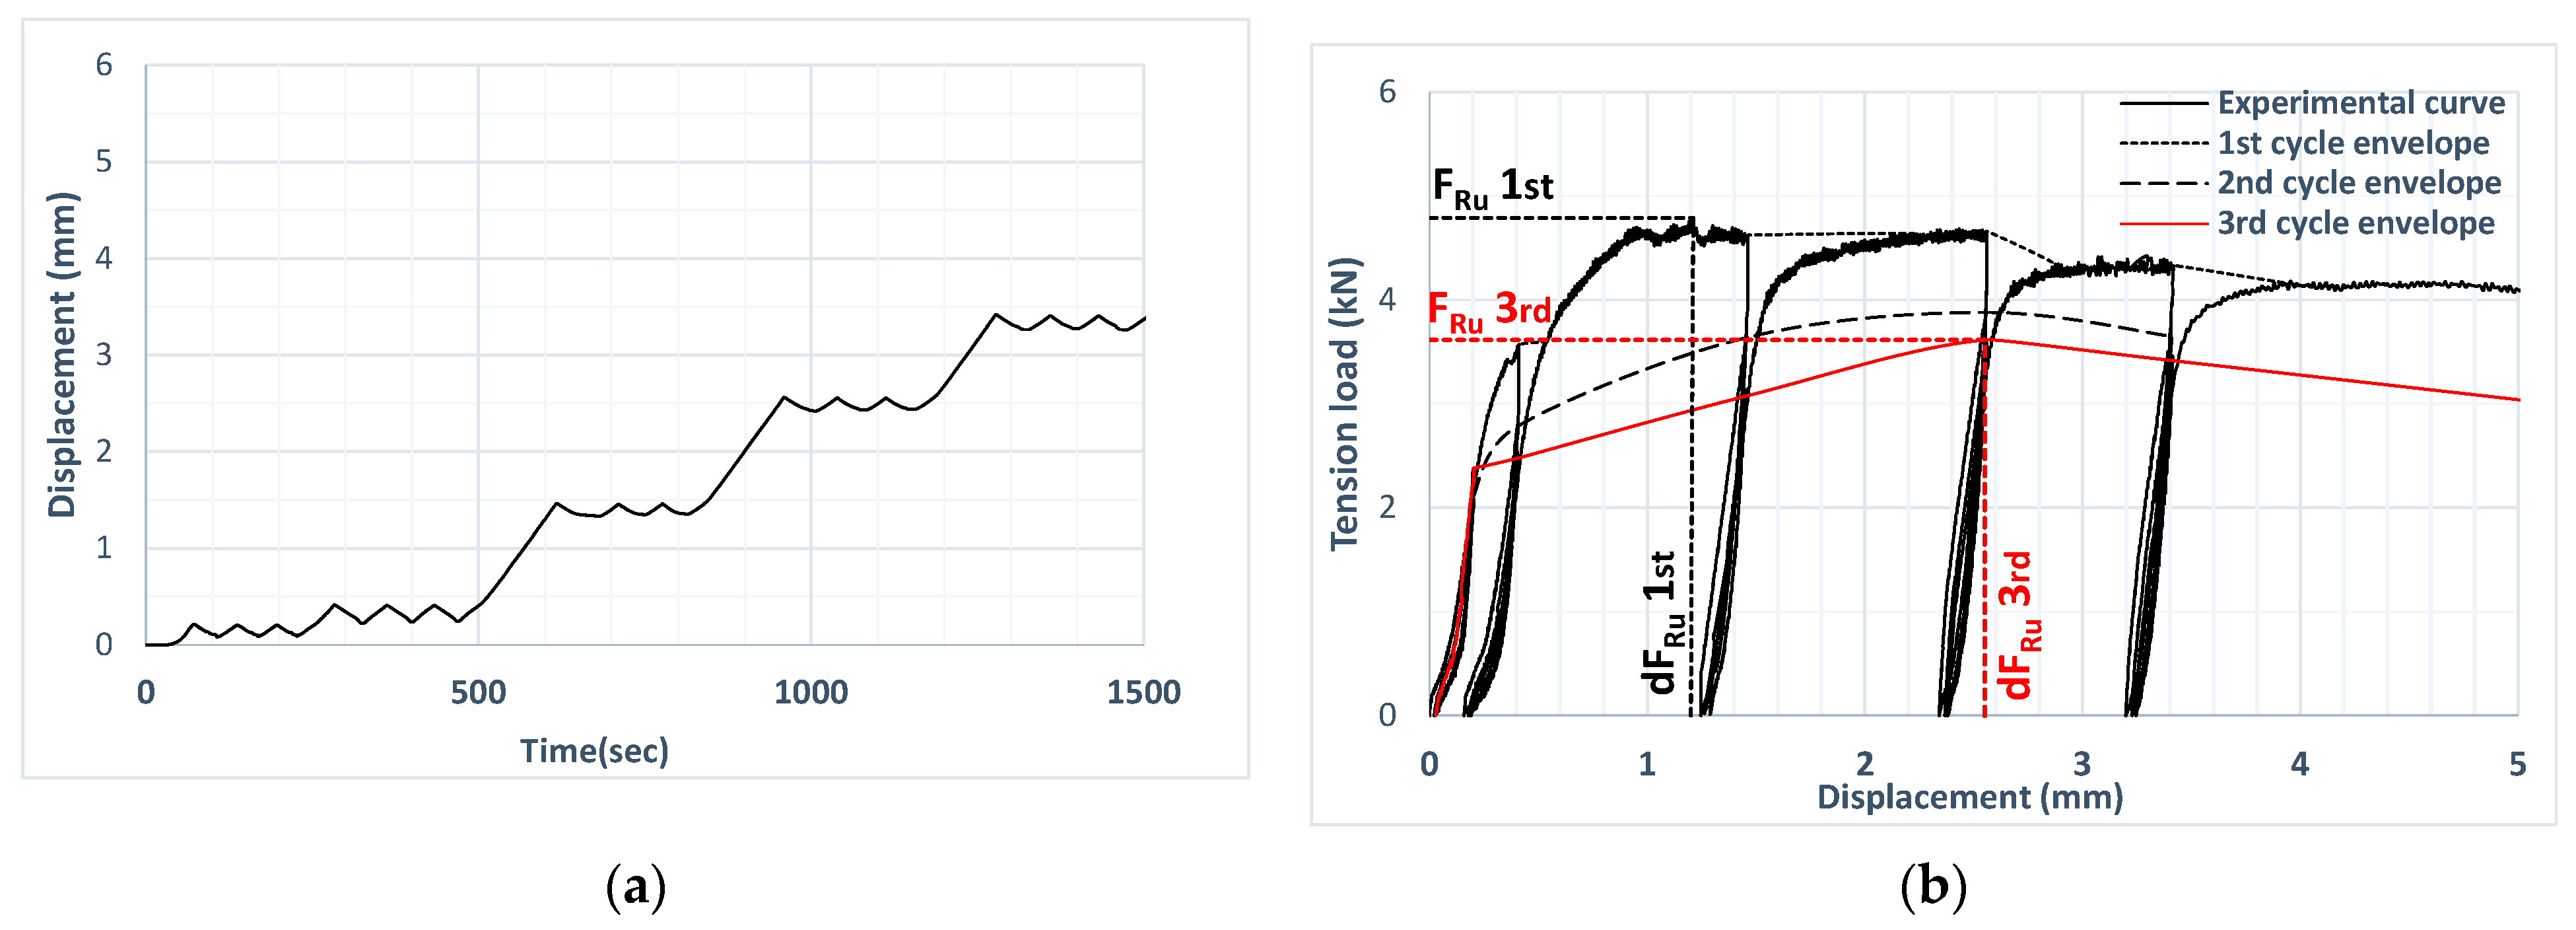
3.3.3. Loading History
4. Test Setup, Instrumentation, and Crack Formation
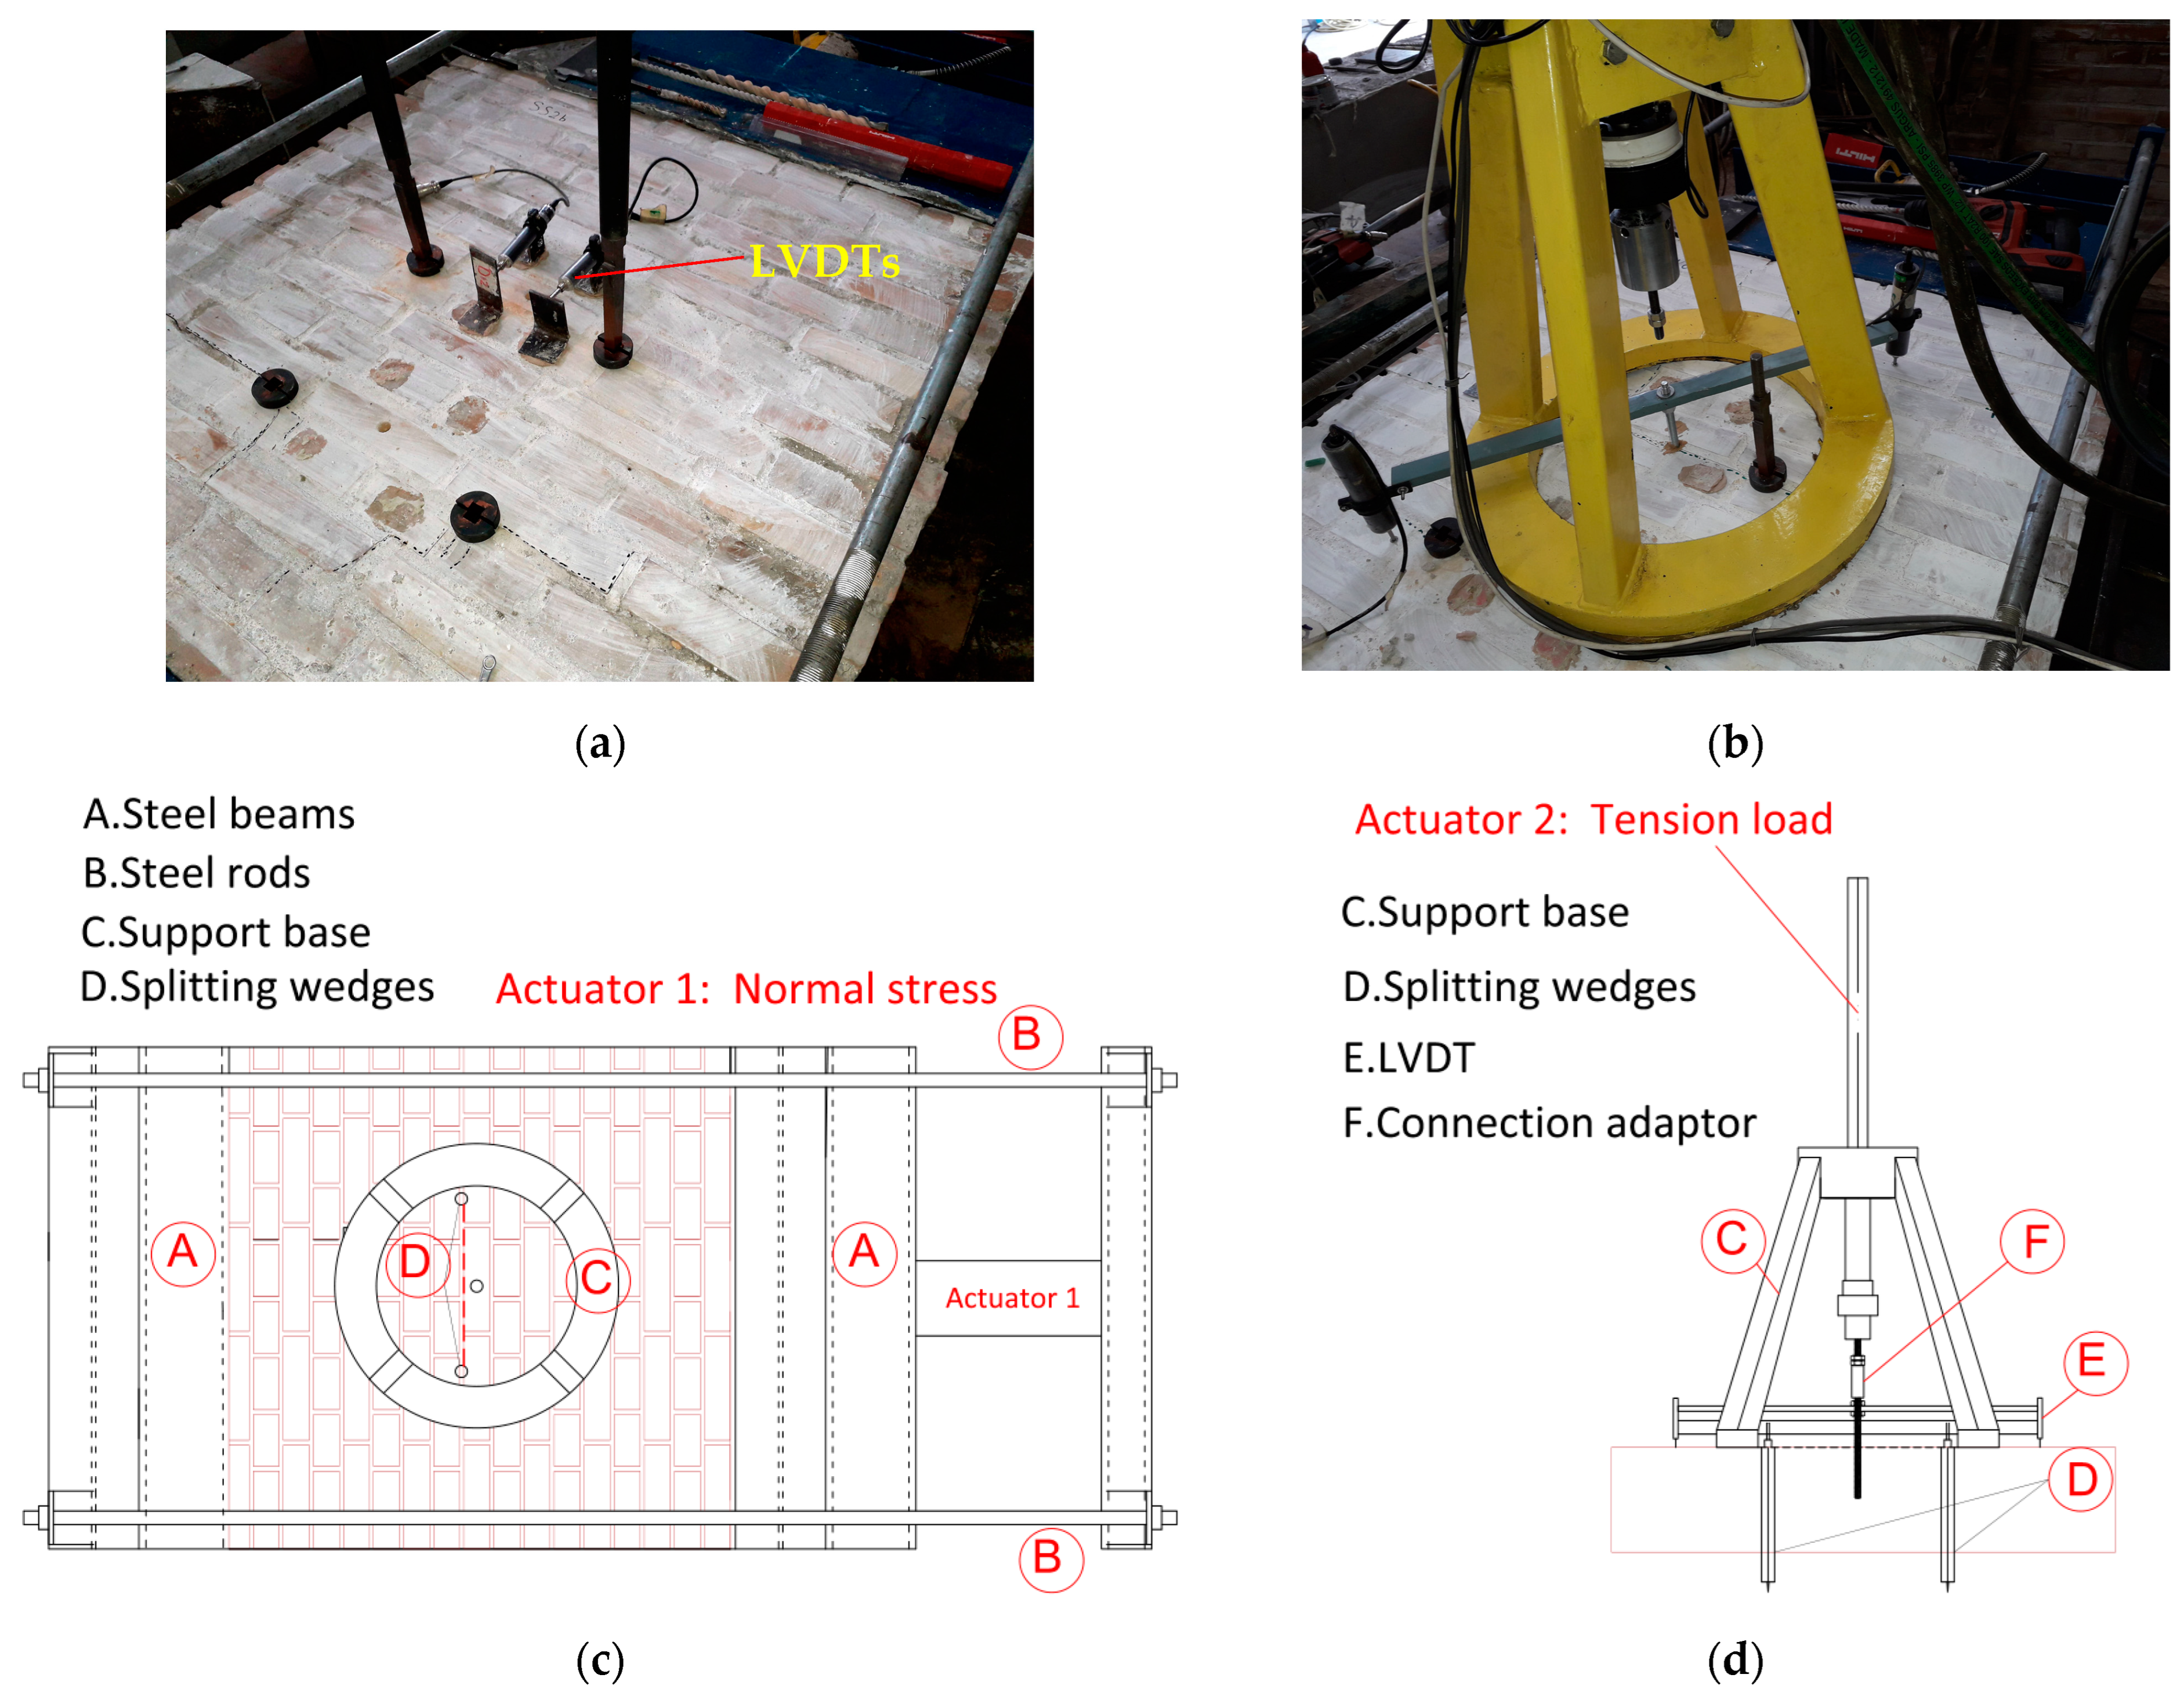
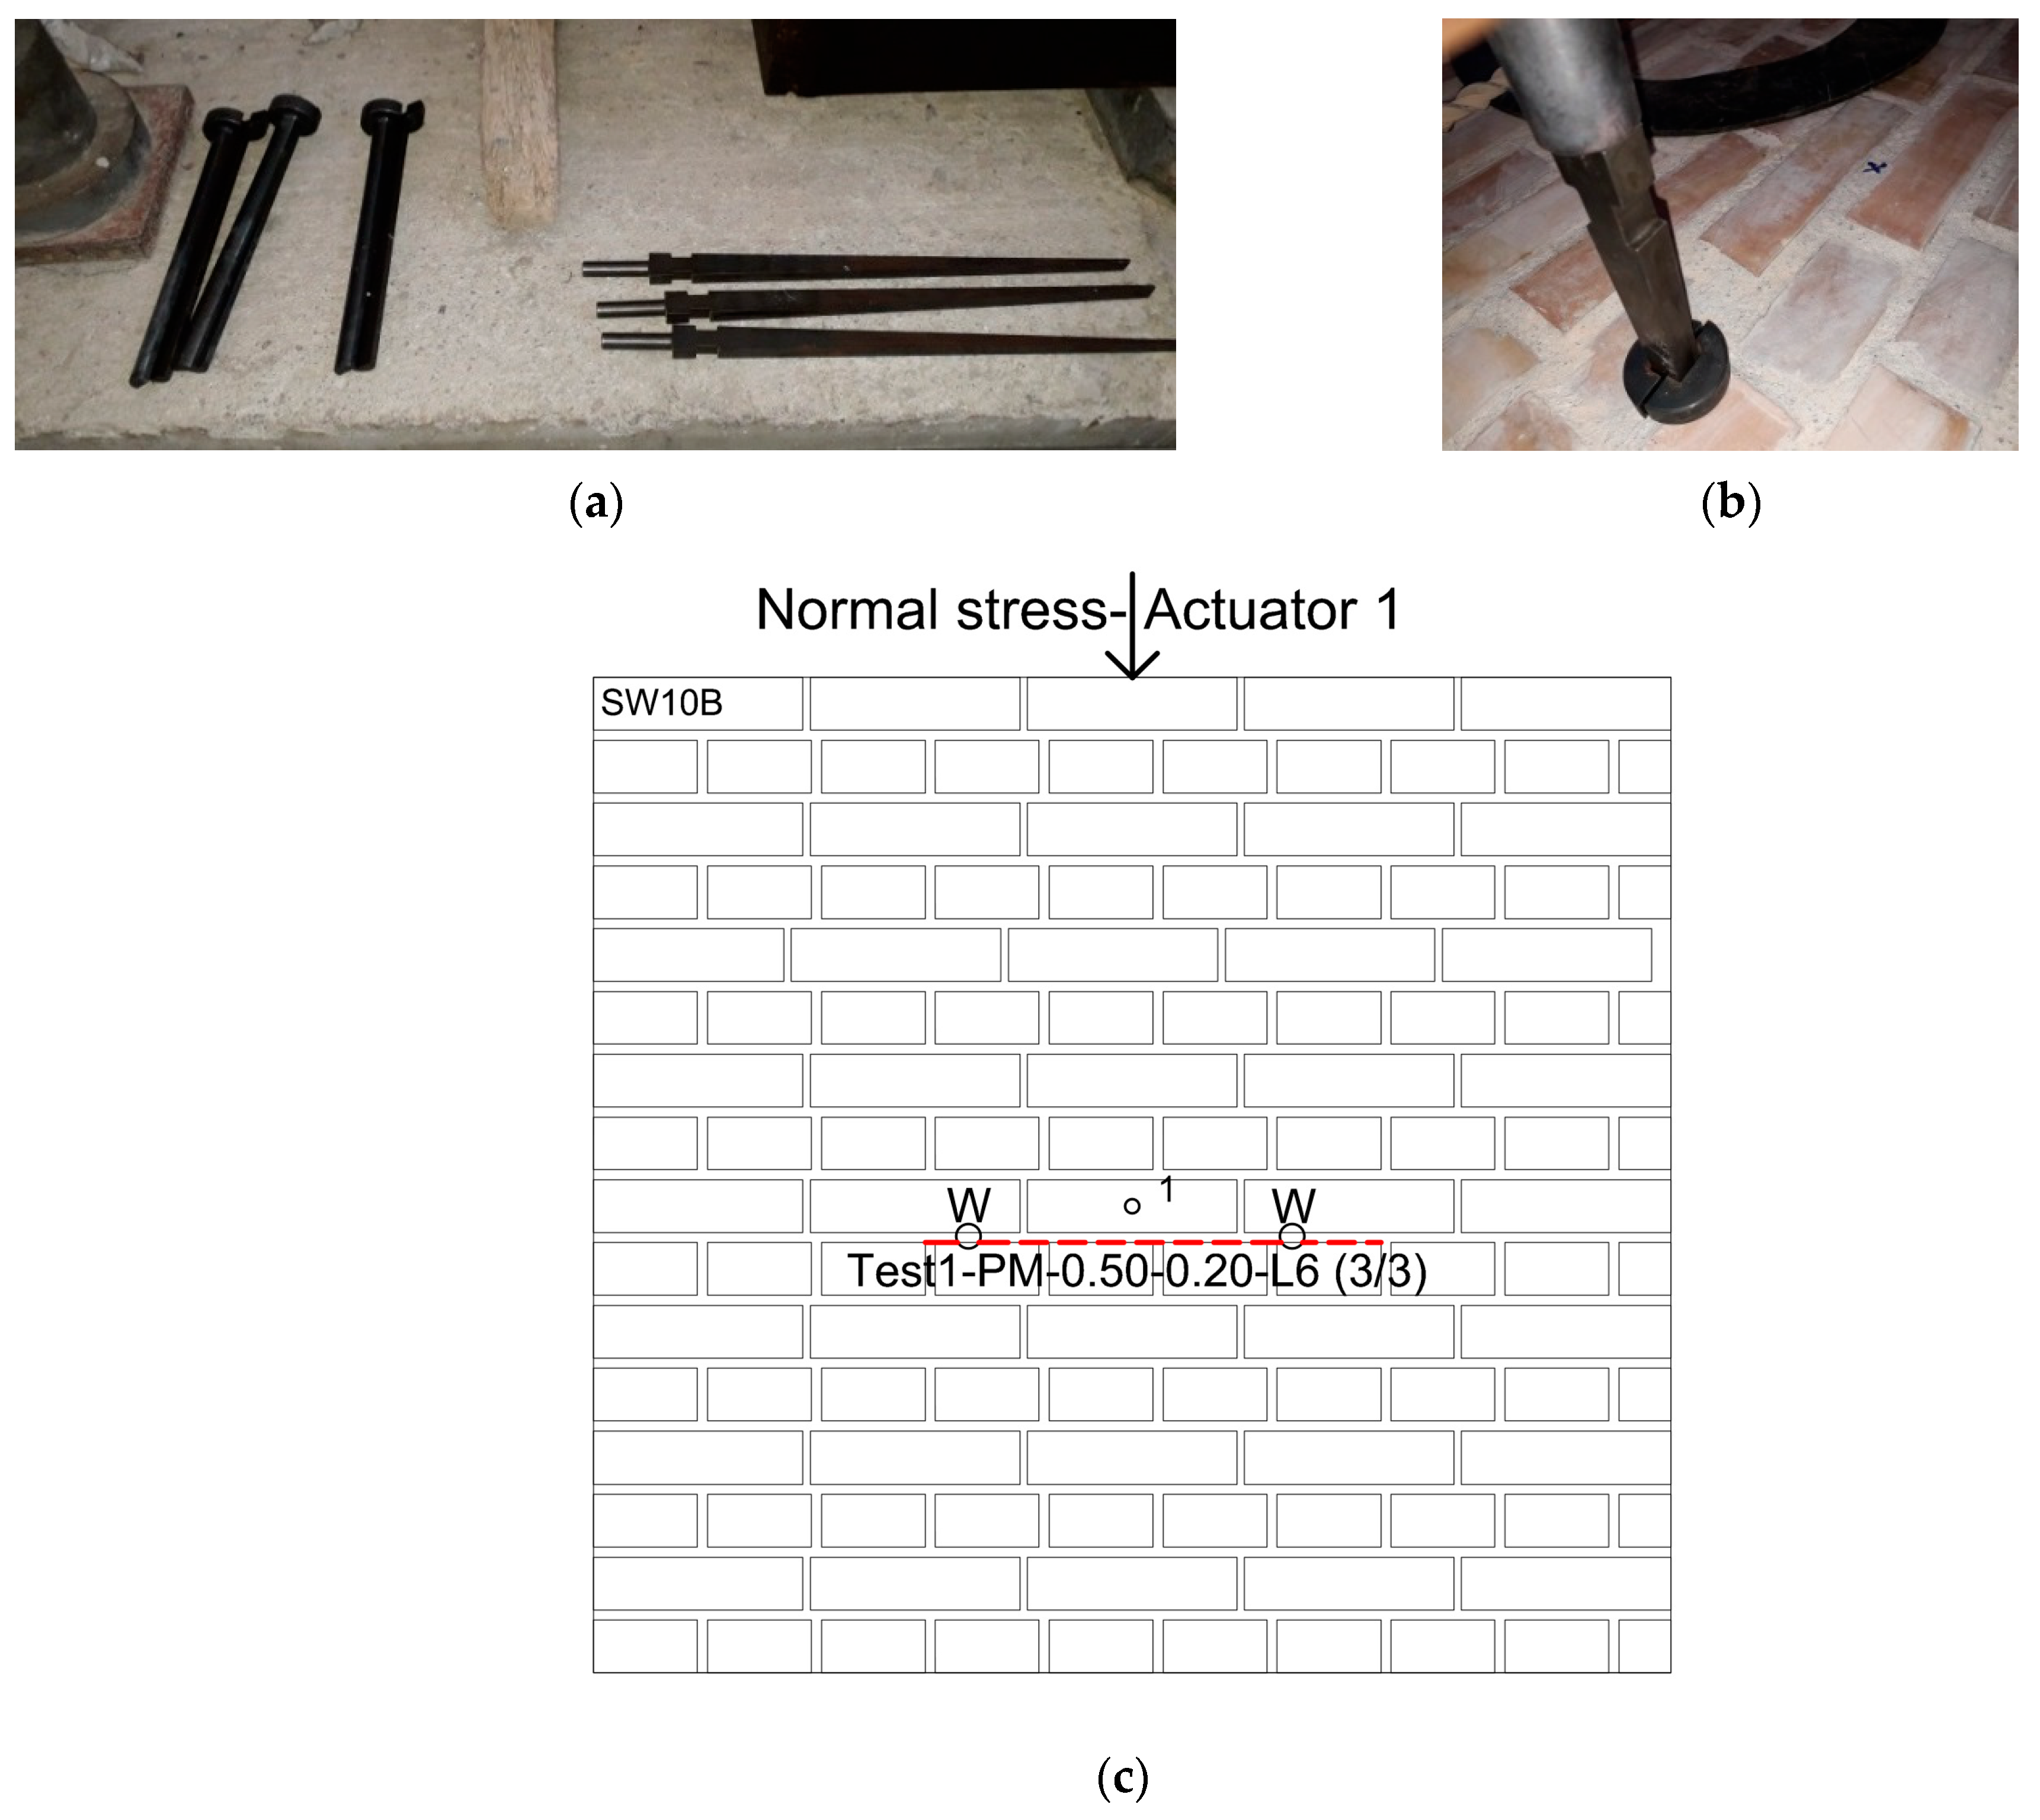
4.1. Experimental Setup and Instrumentation
4.2. Crack Formation
5. Experimental Results and Discussion
5.1. Combination of Parameters
5.2. Failure Modes
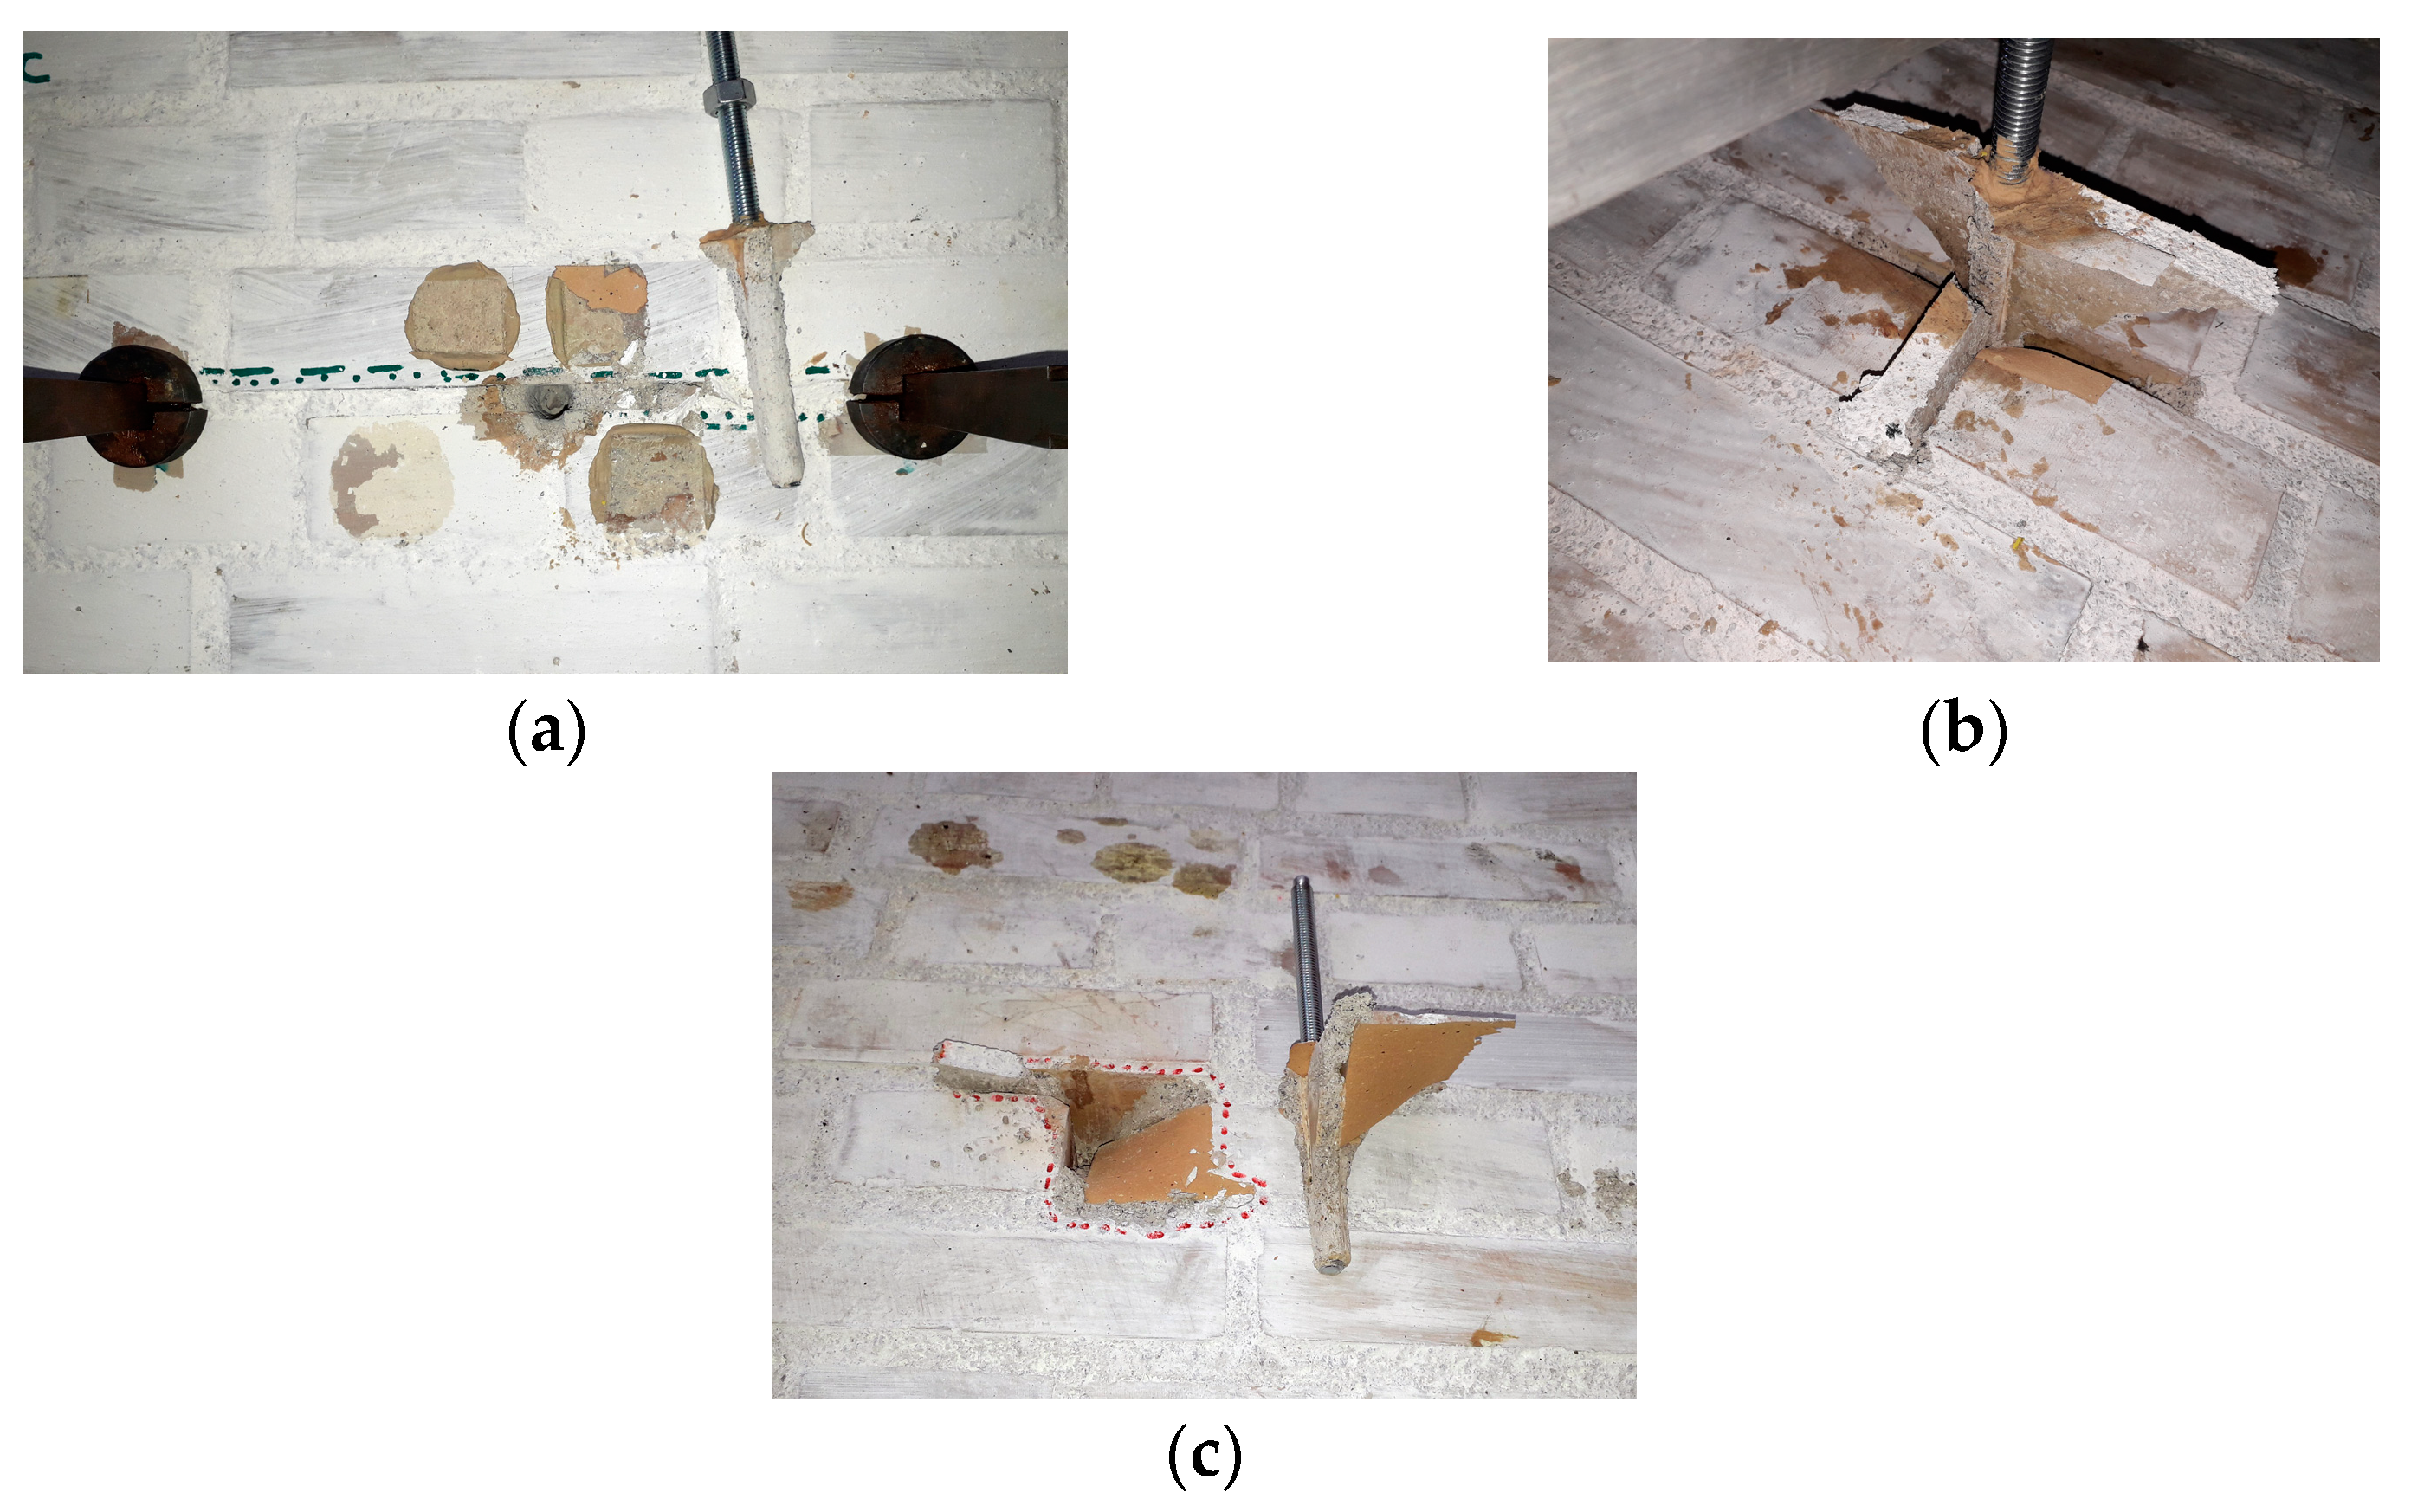
5.2.1. Mortar Joint Locations
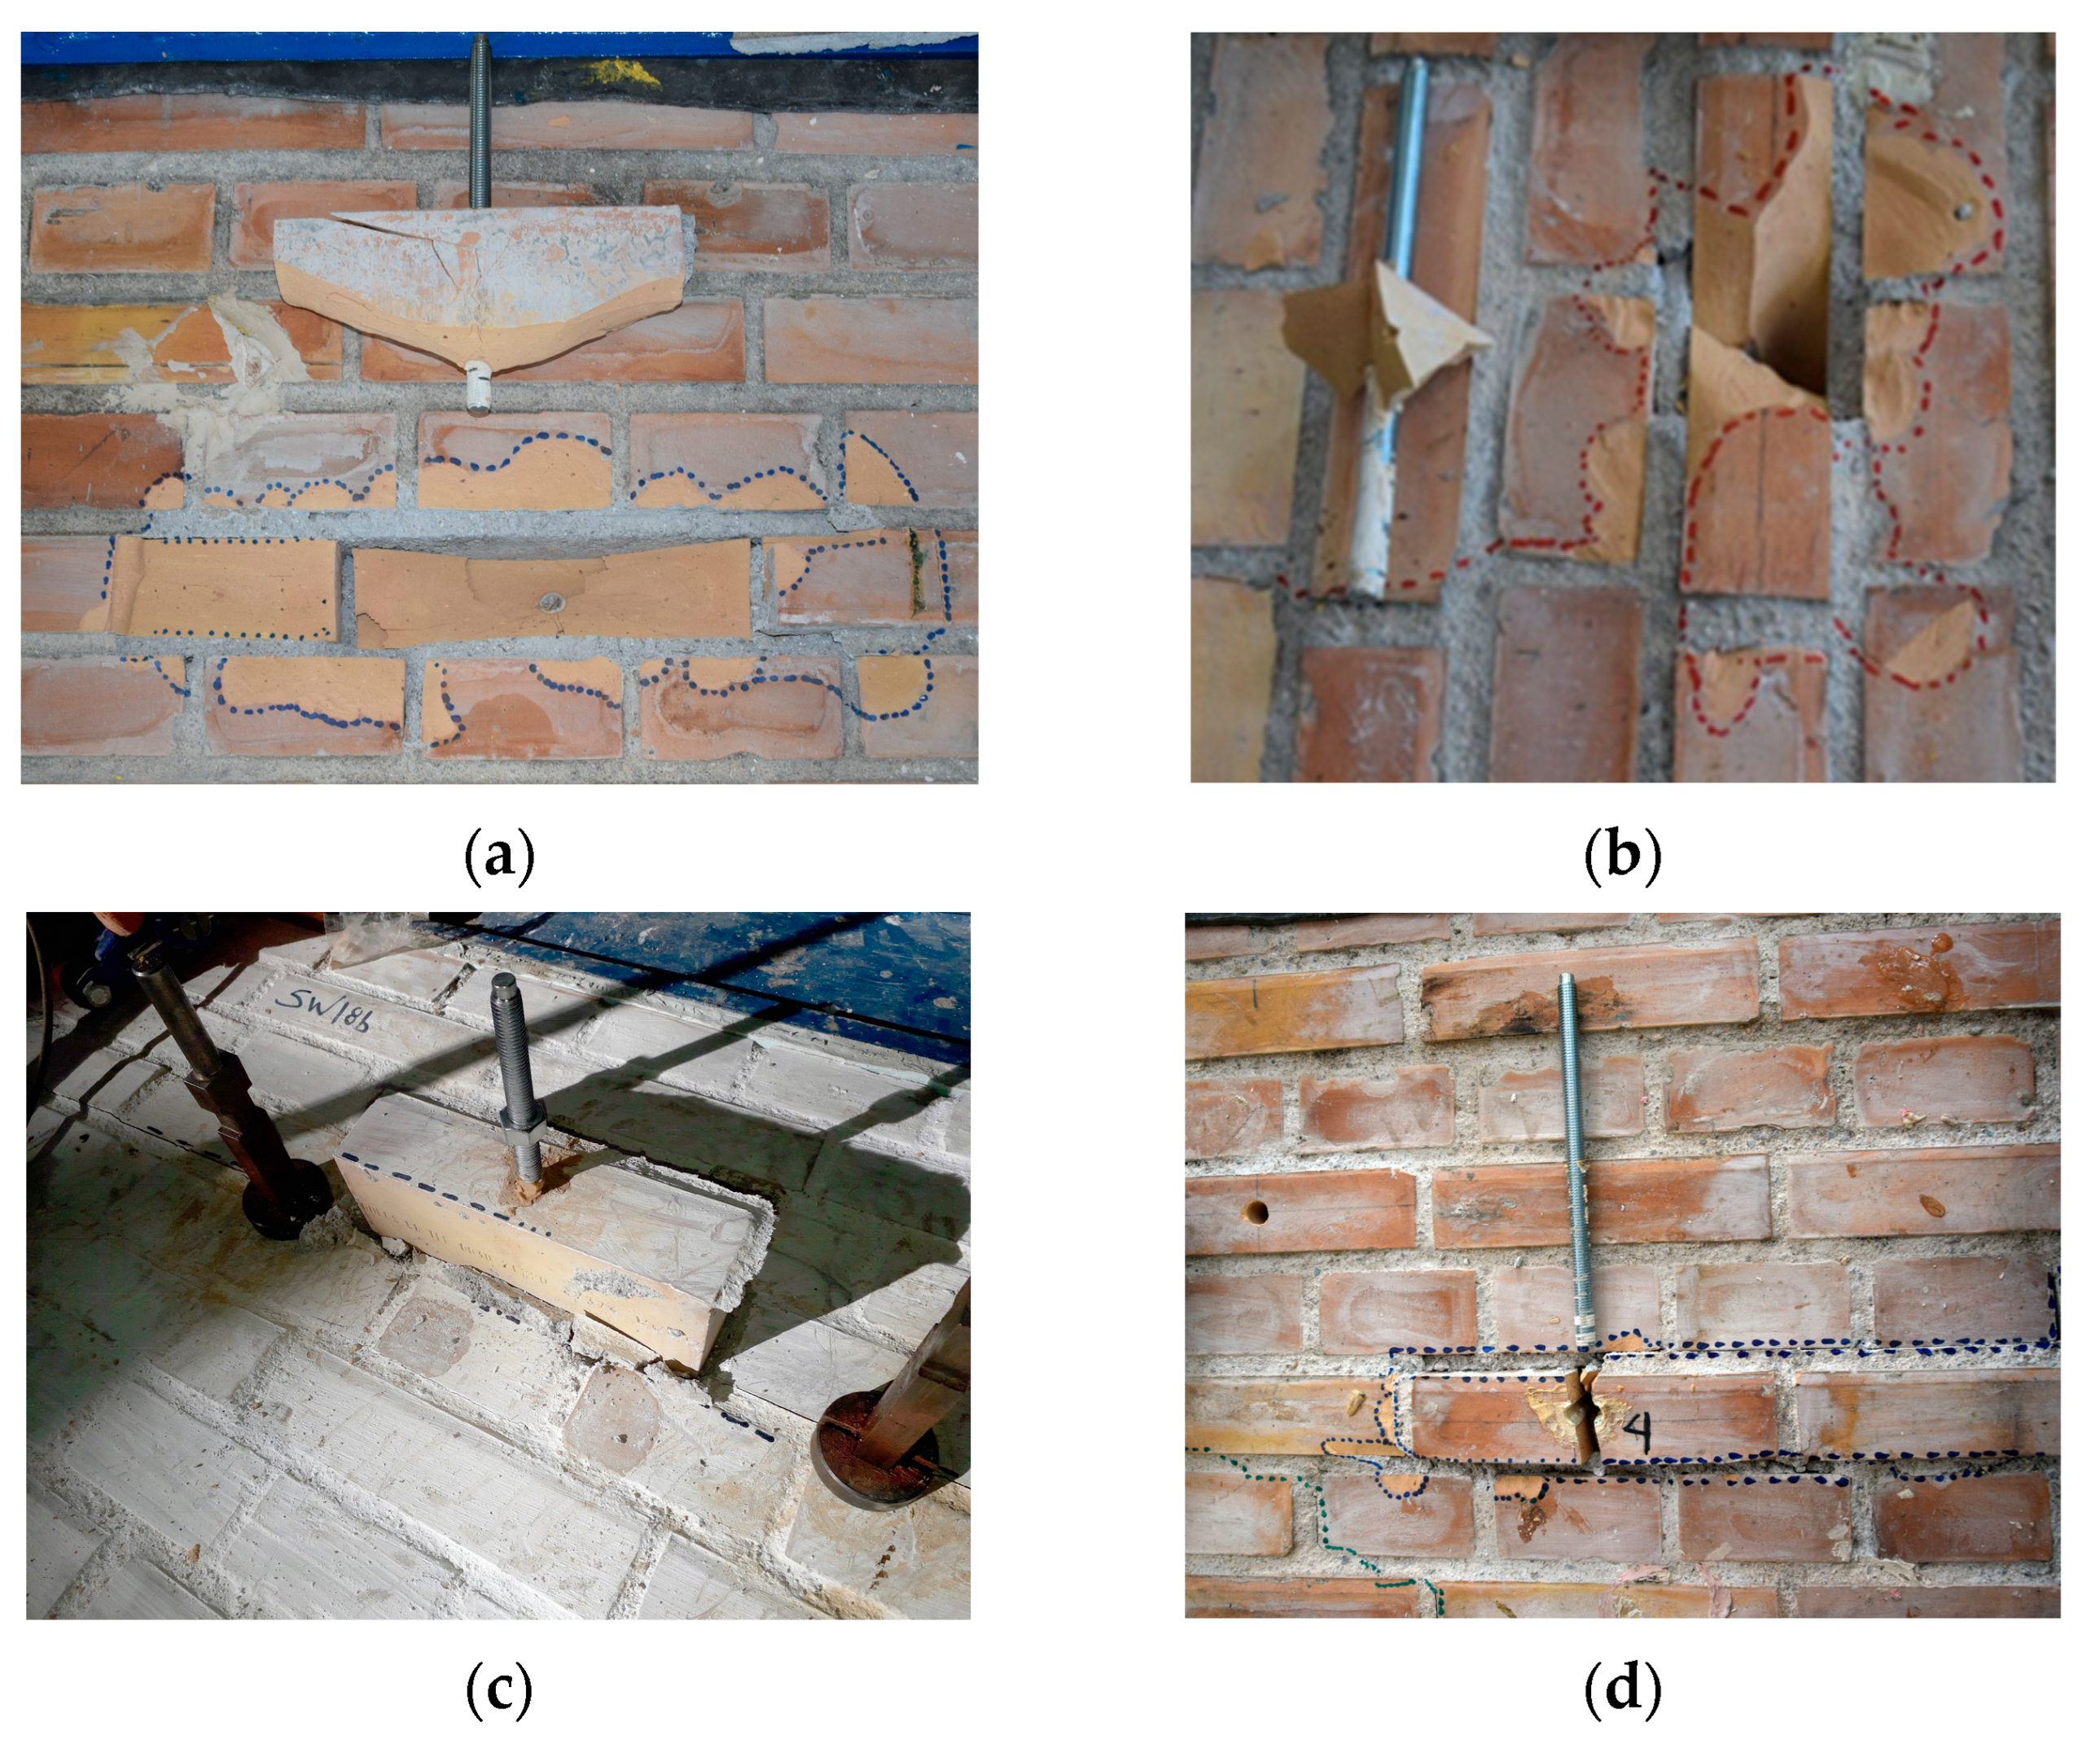
5.2.2. Brick Locations
5.3. The Effects of Investigated Parameters on the Behavior of Anchors
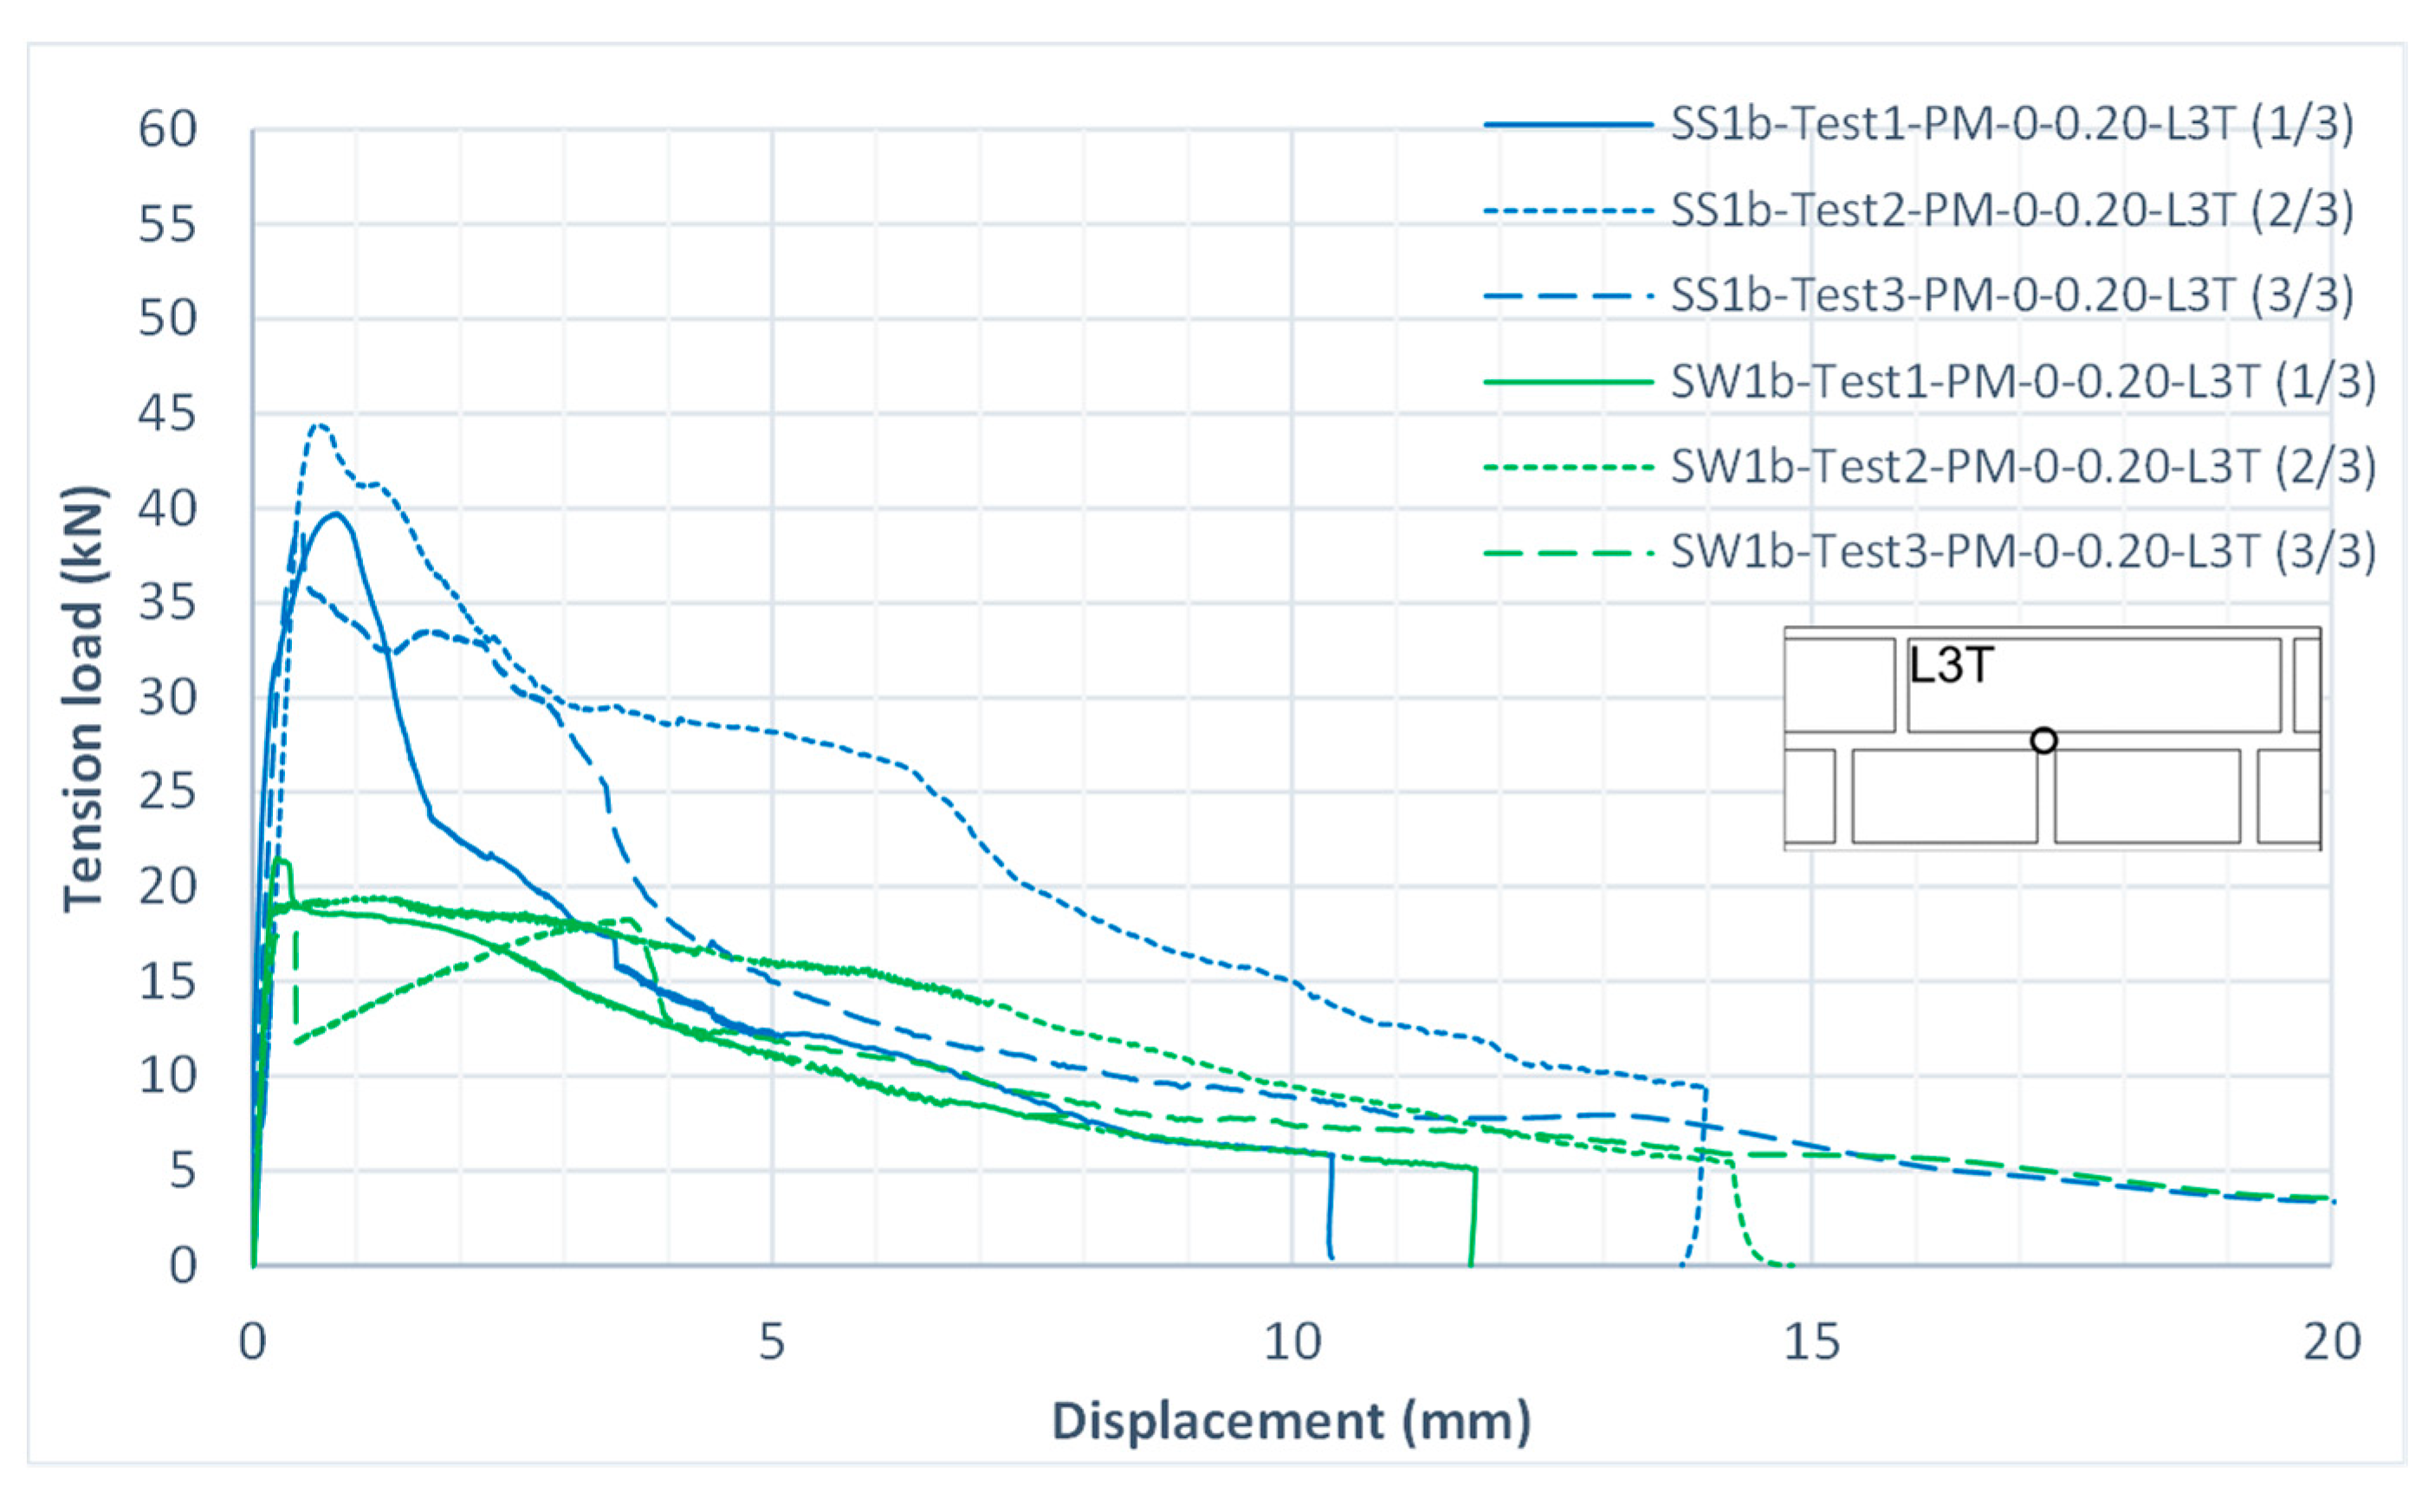
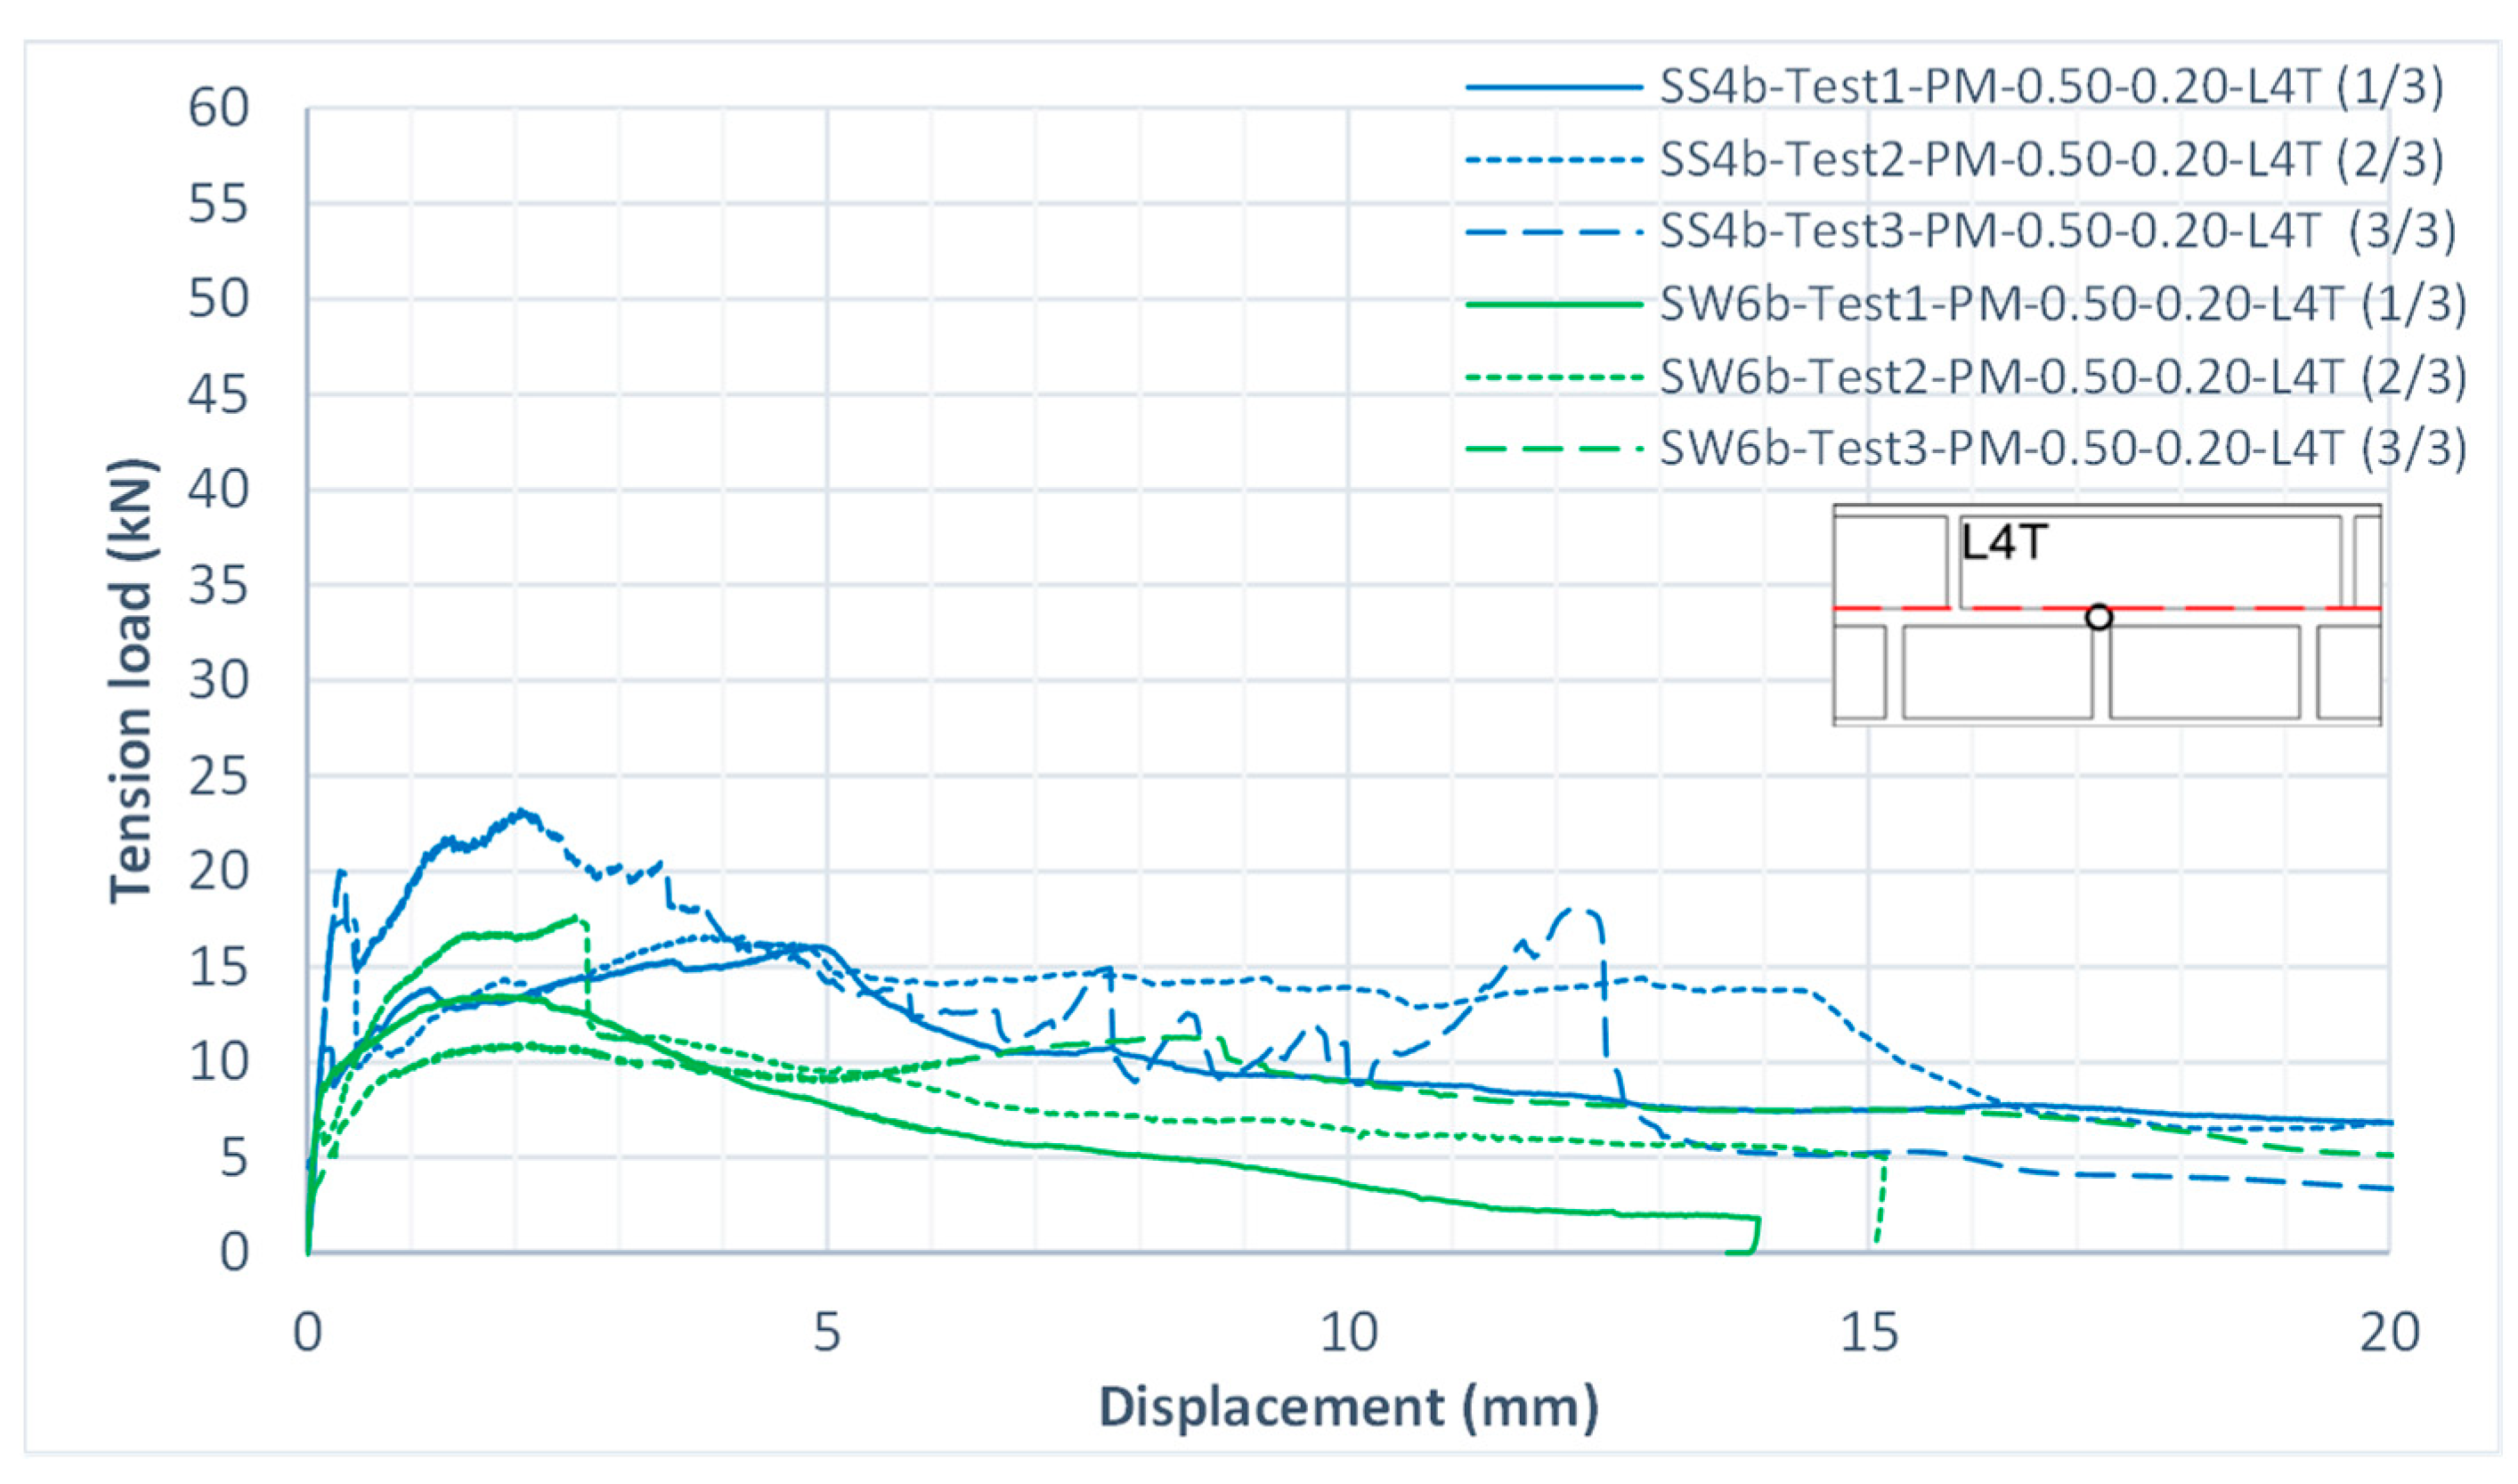
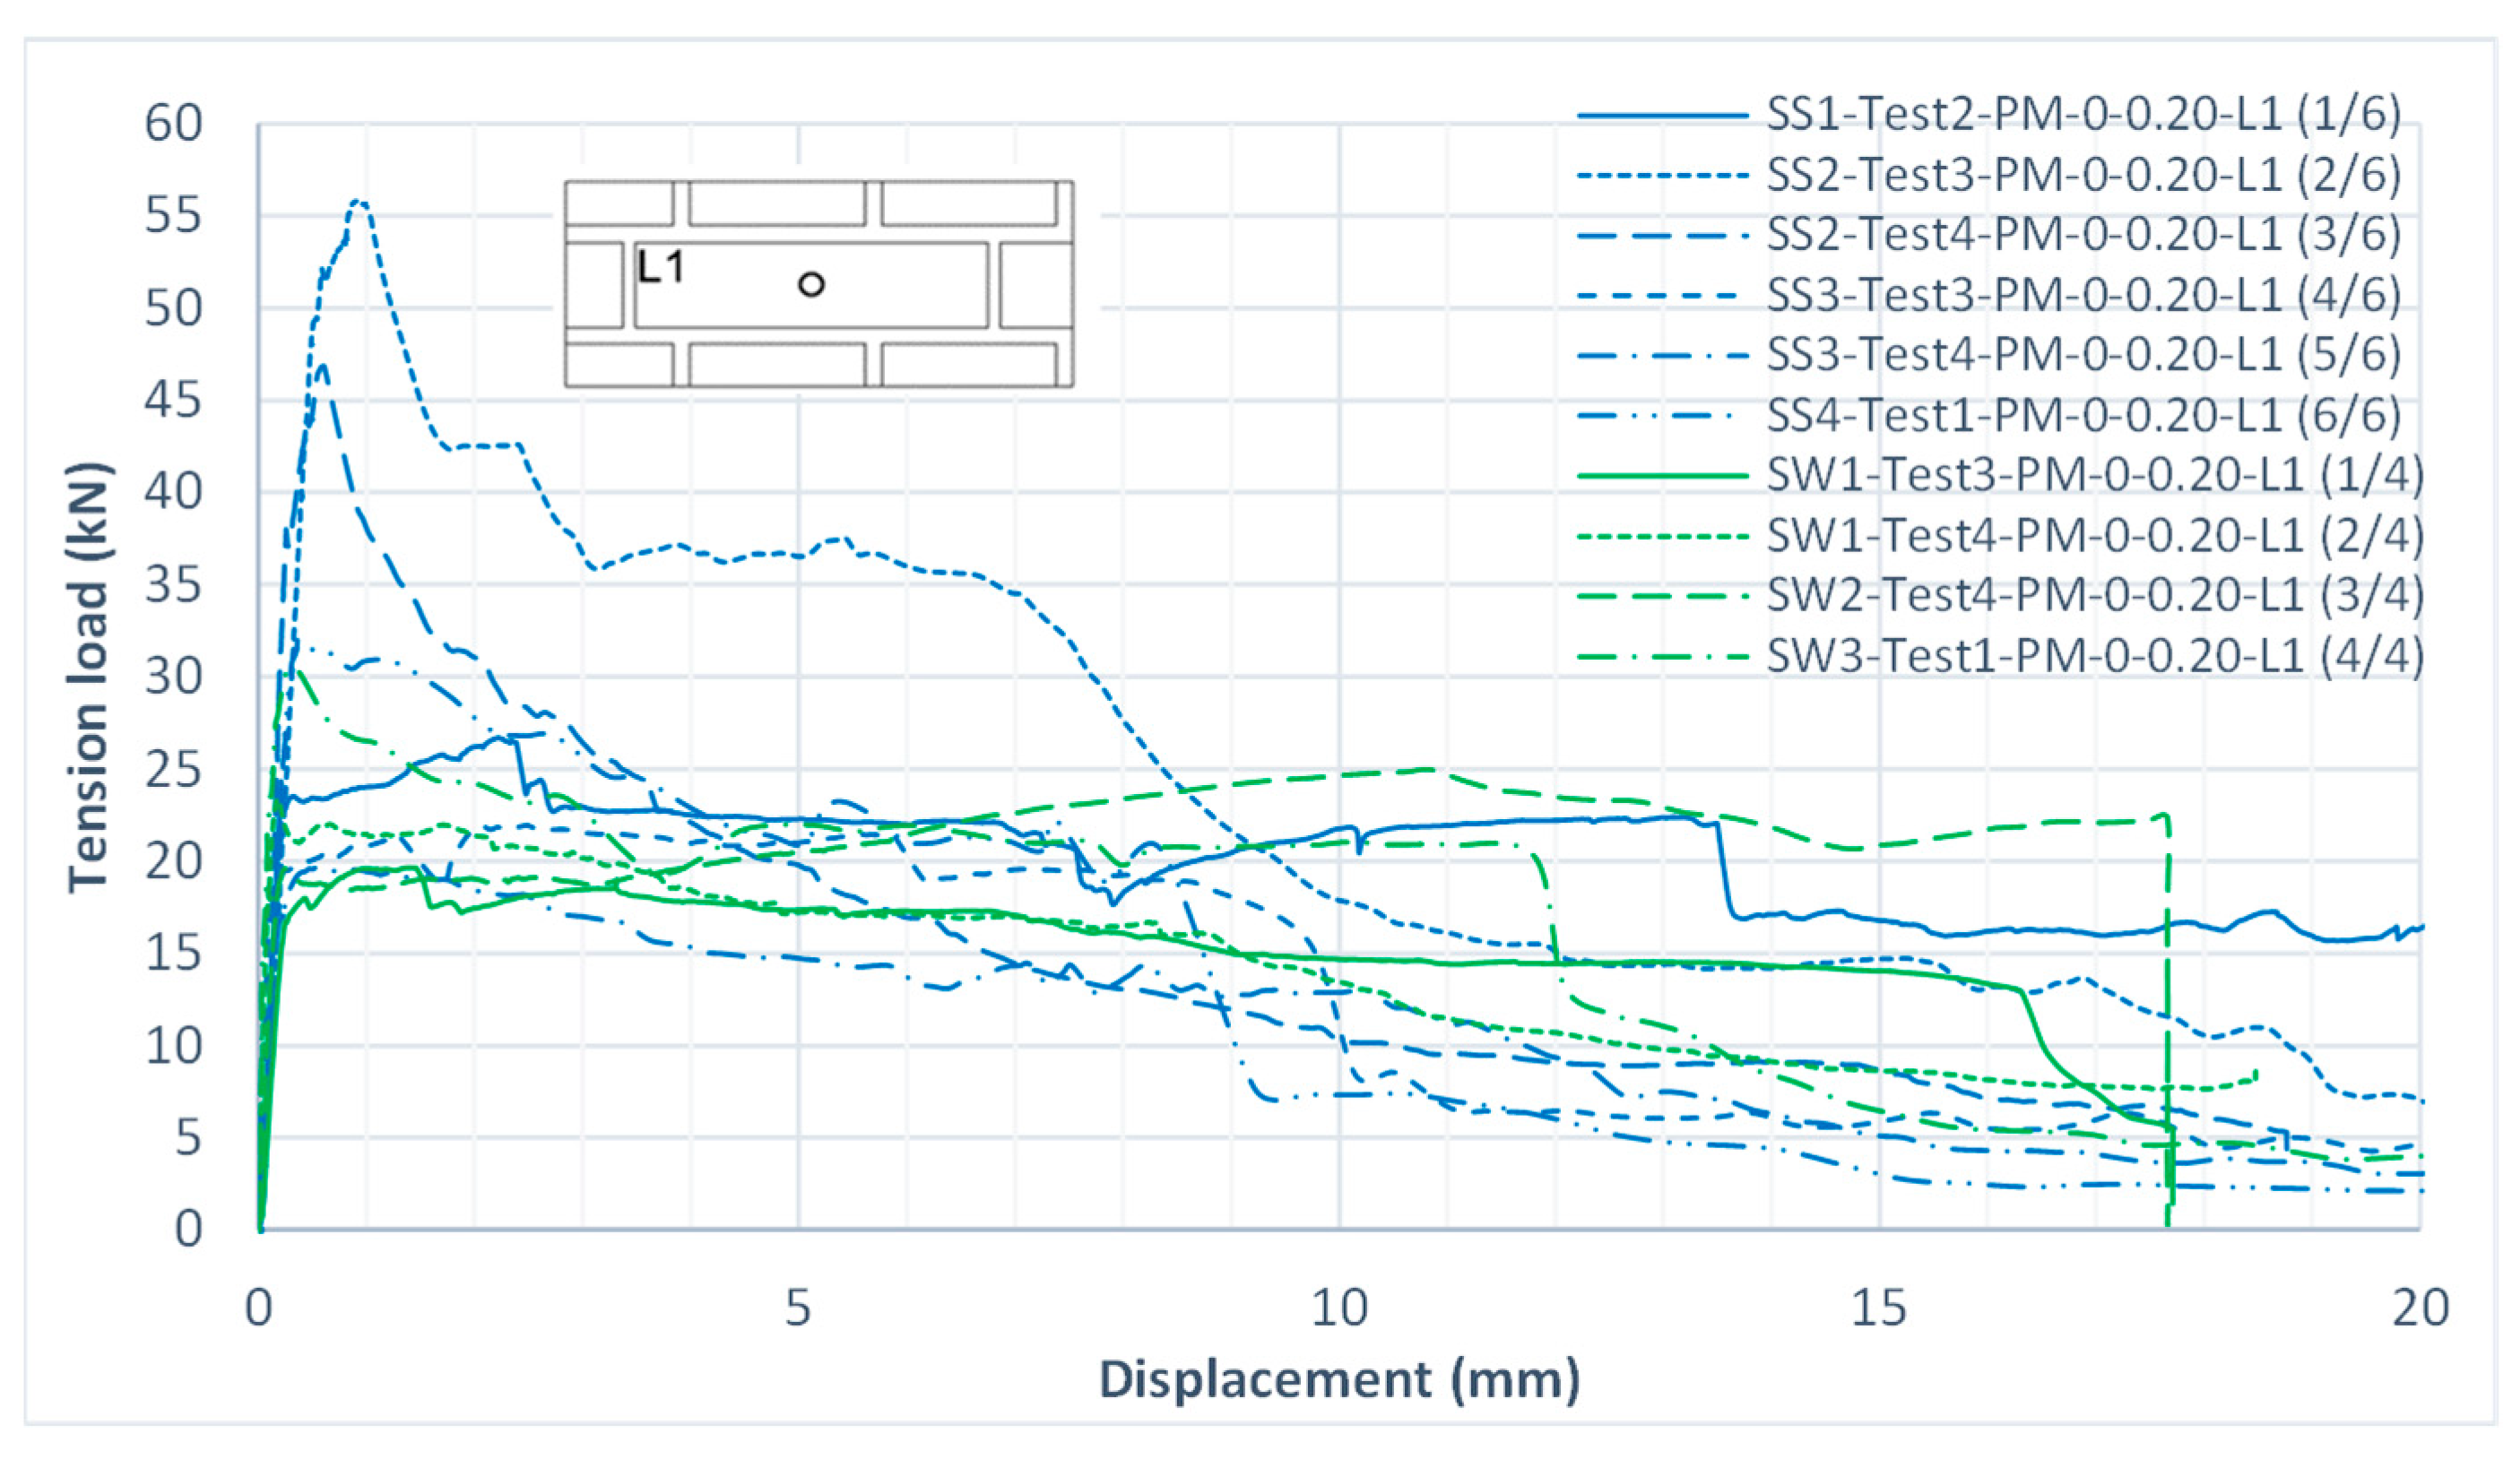
5.3.1. The Effect of Mortar Strength
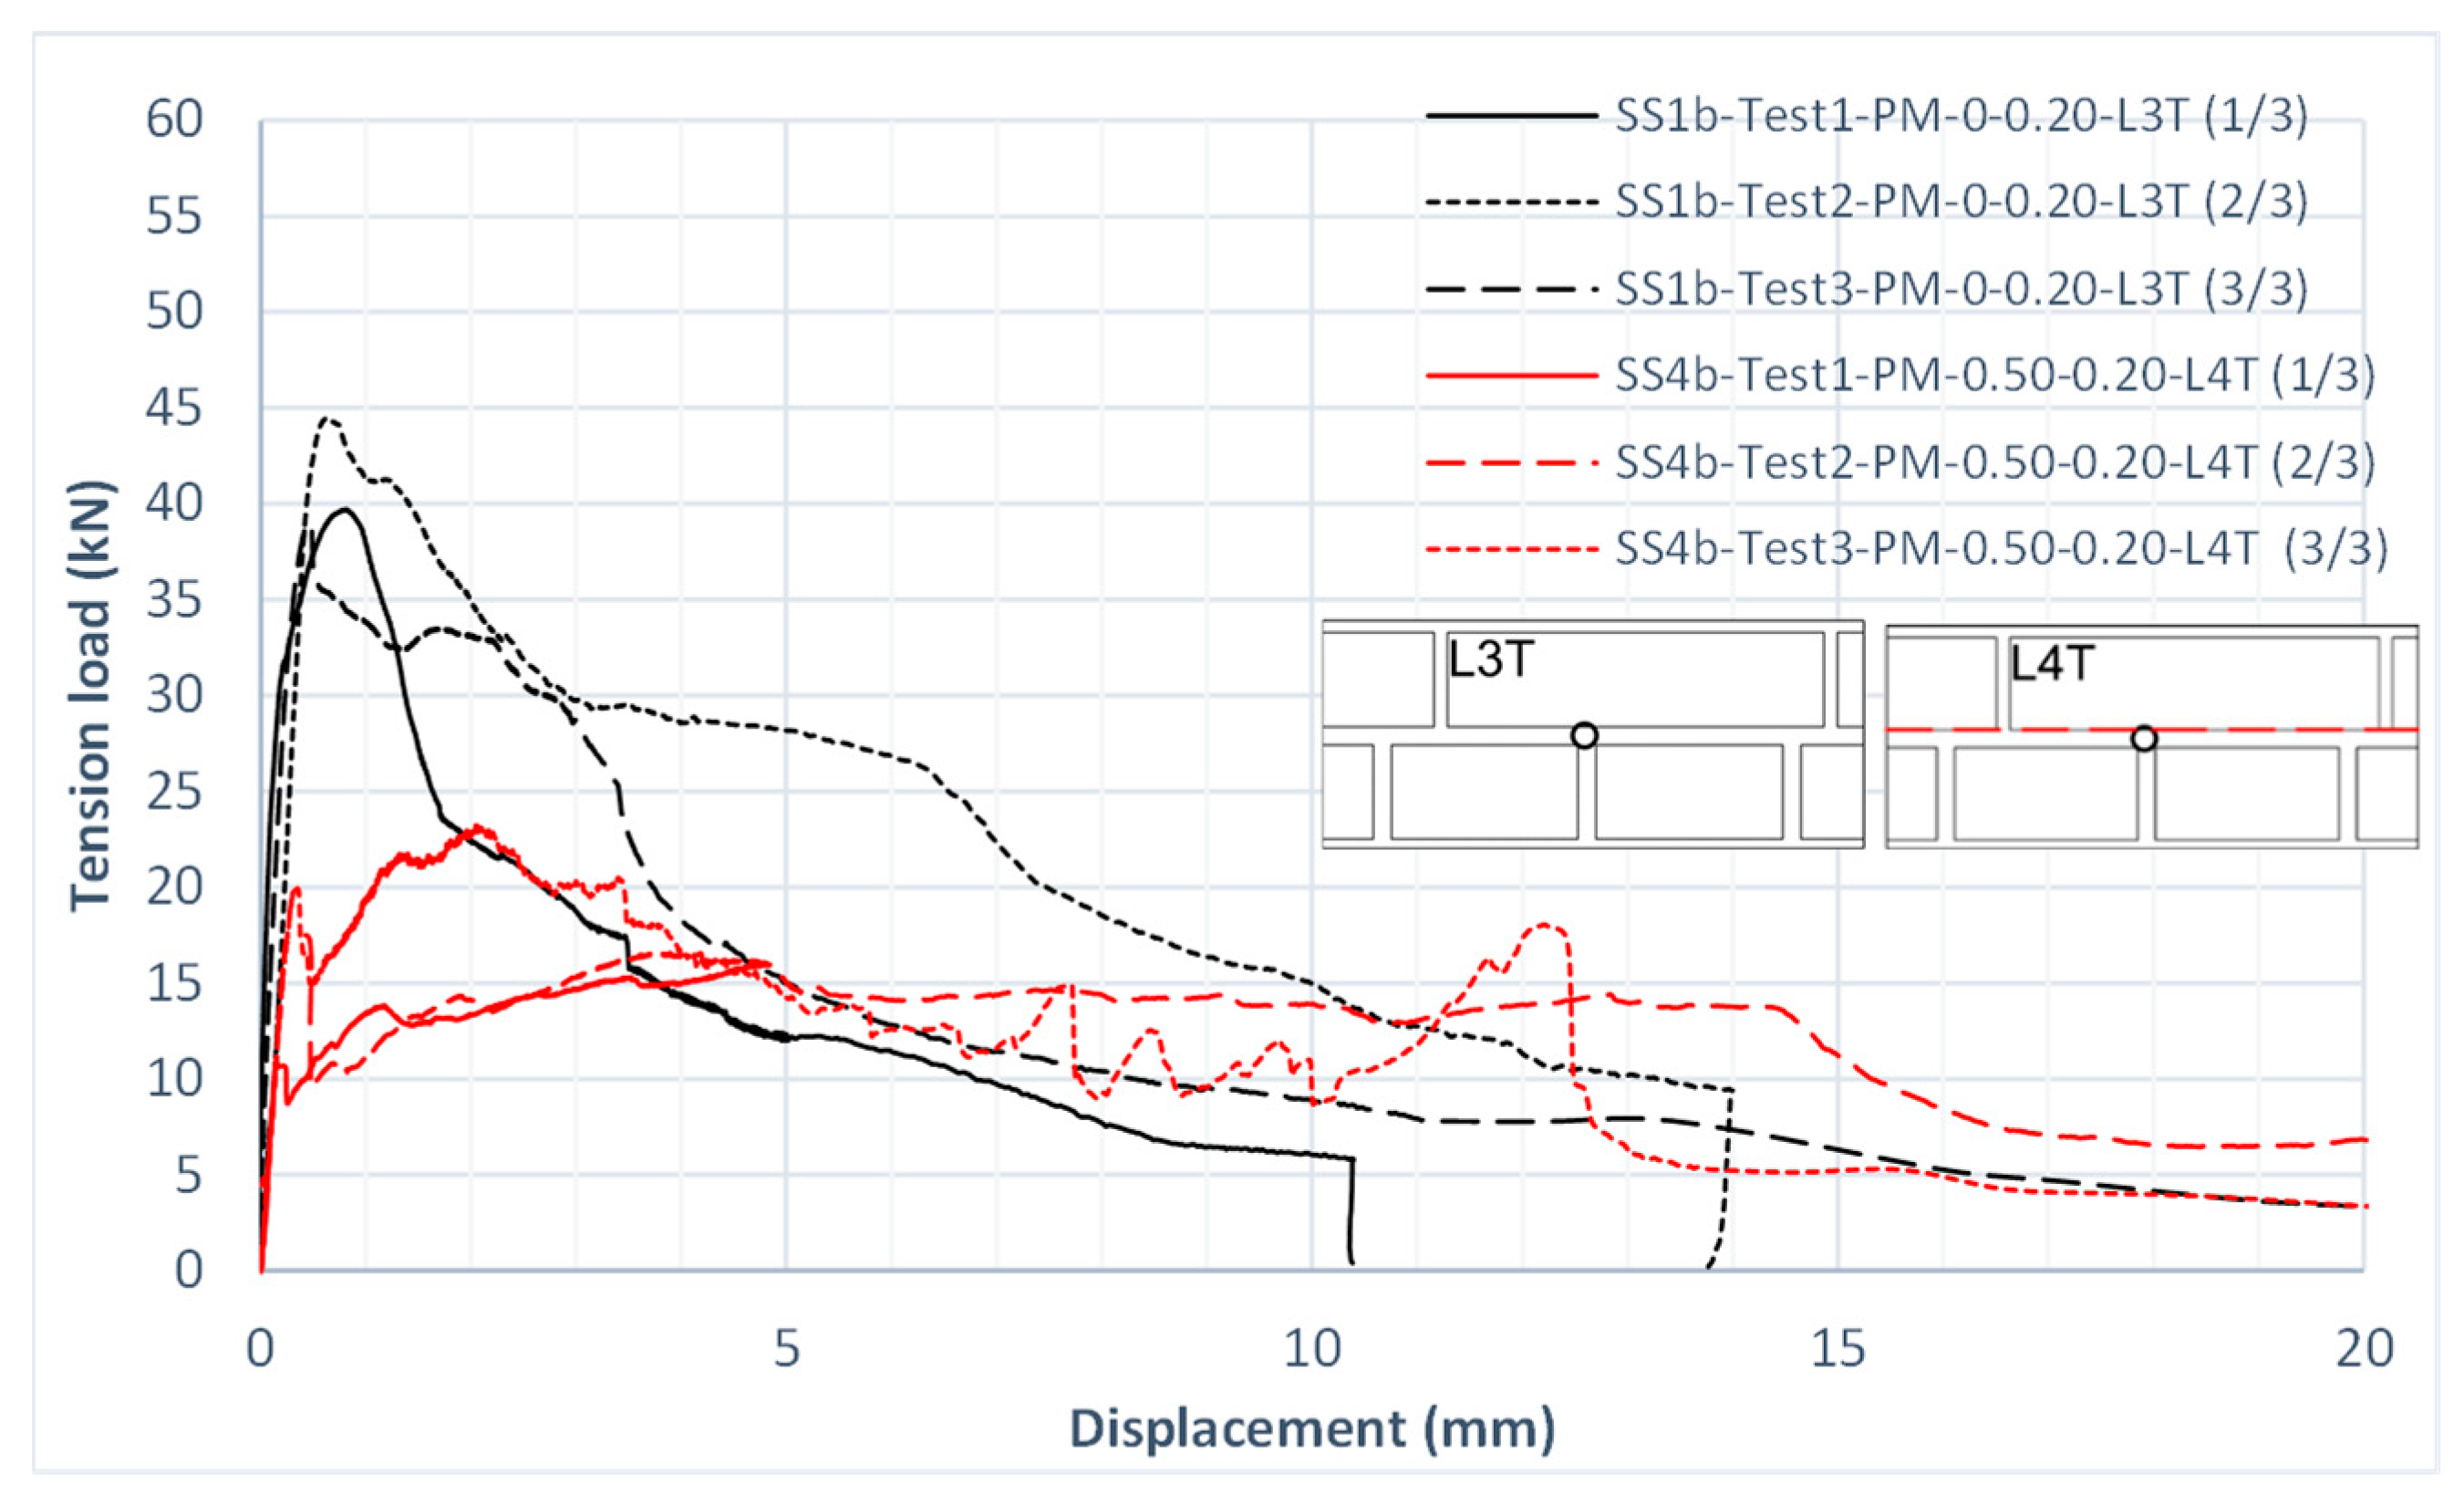
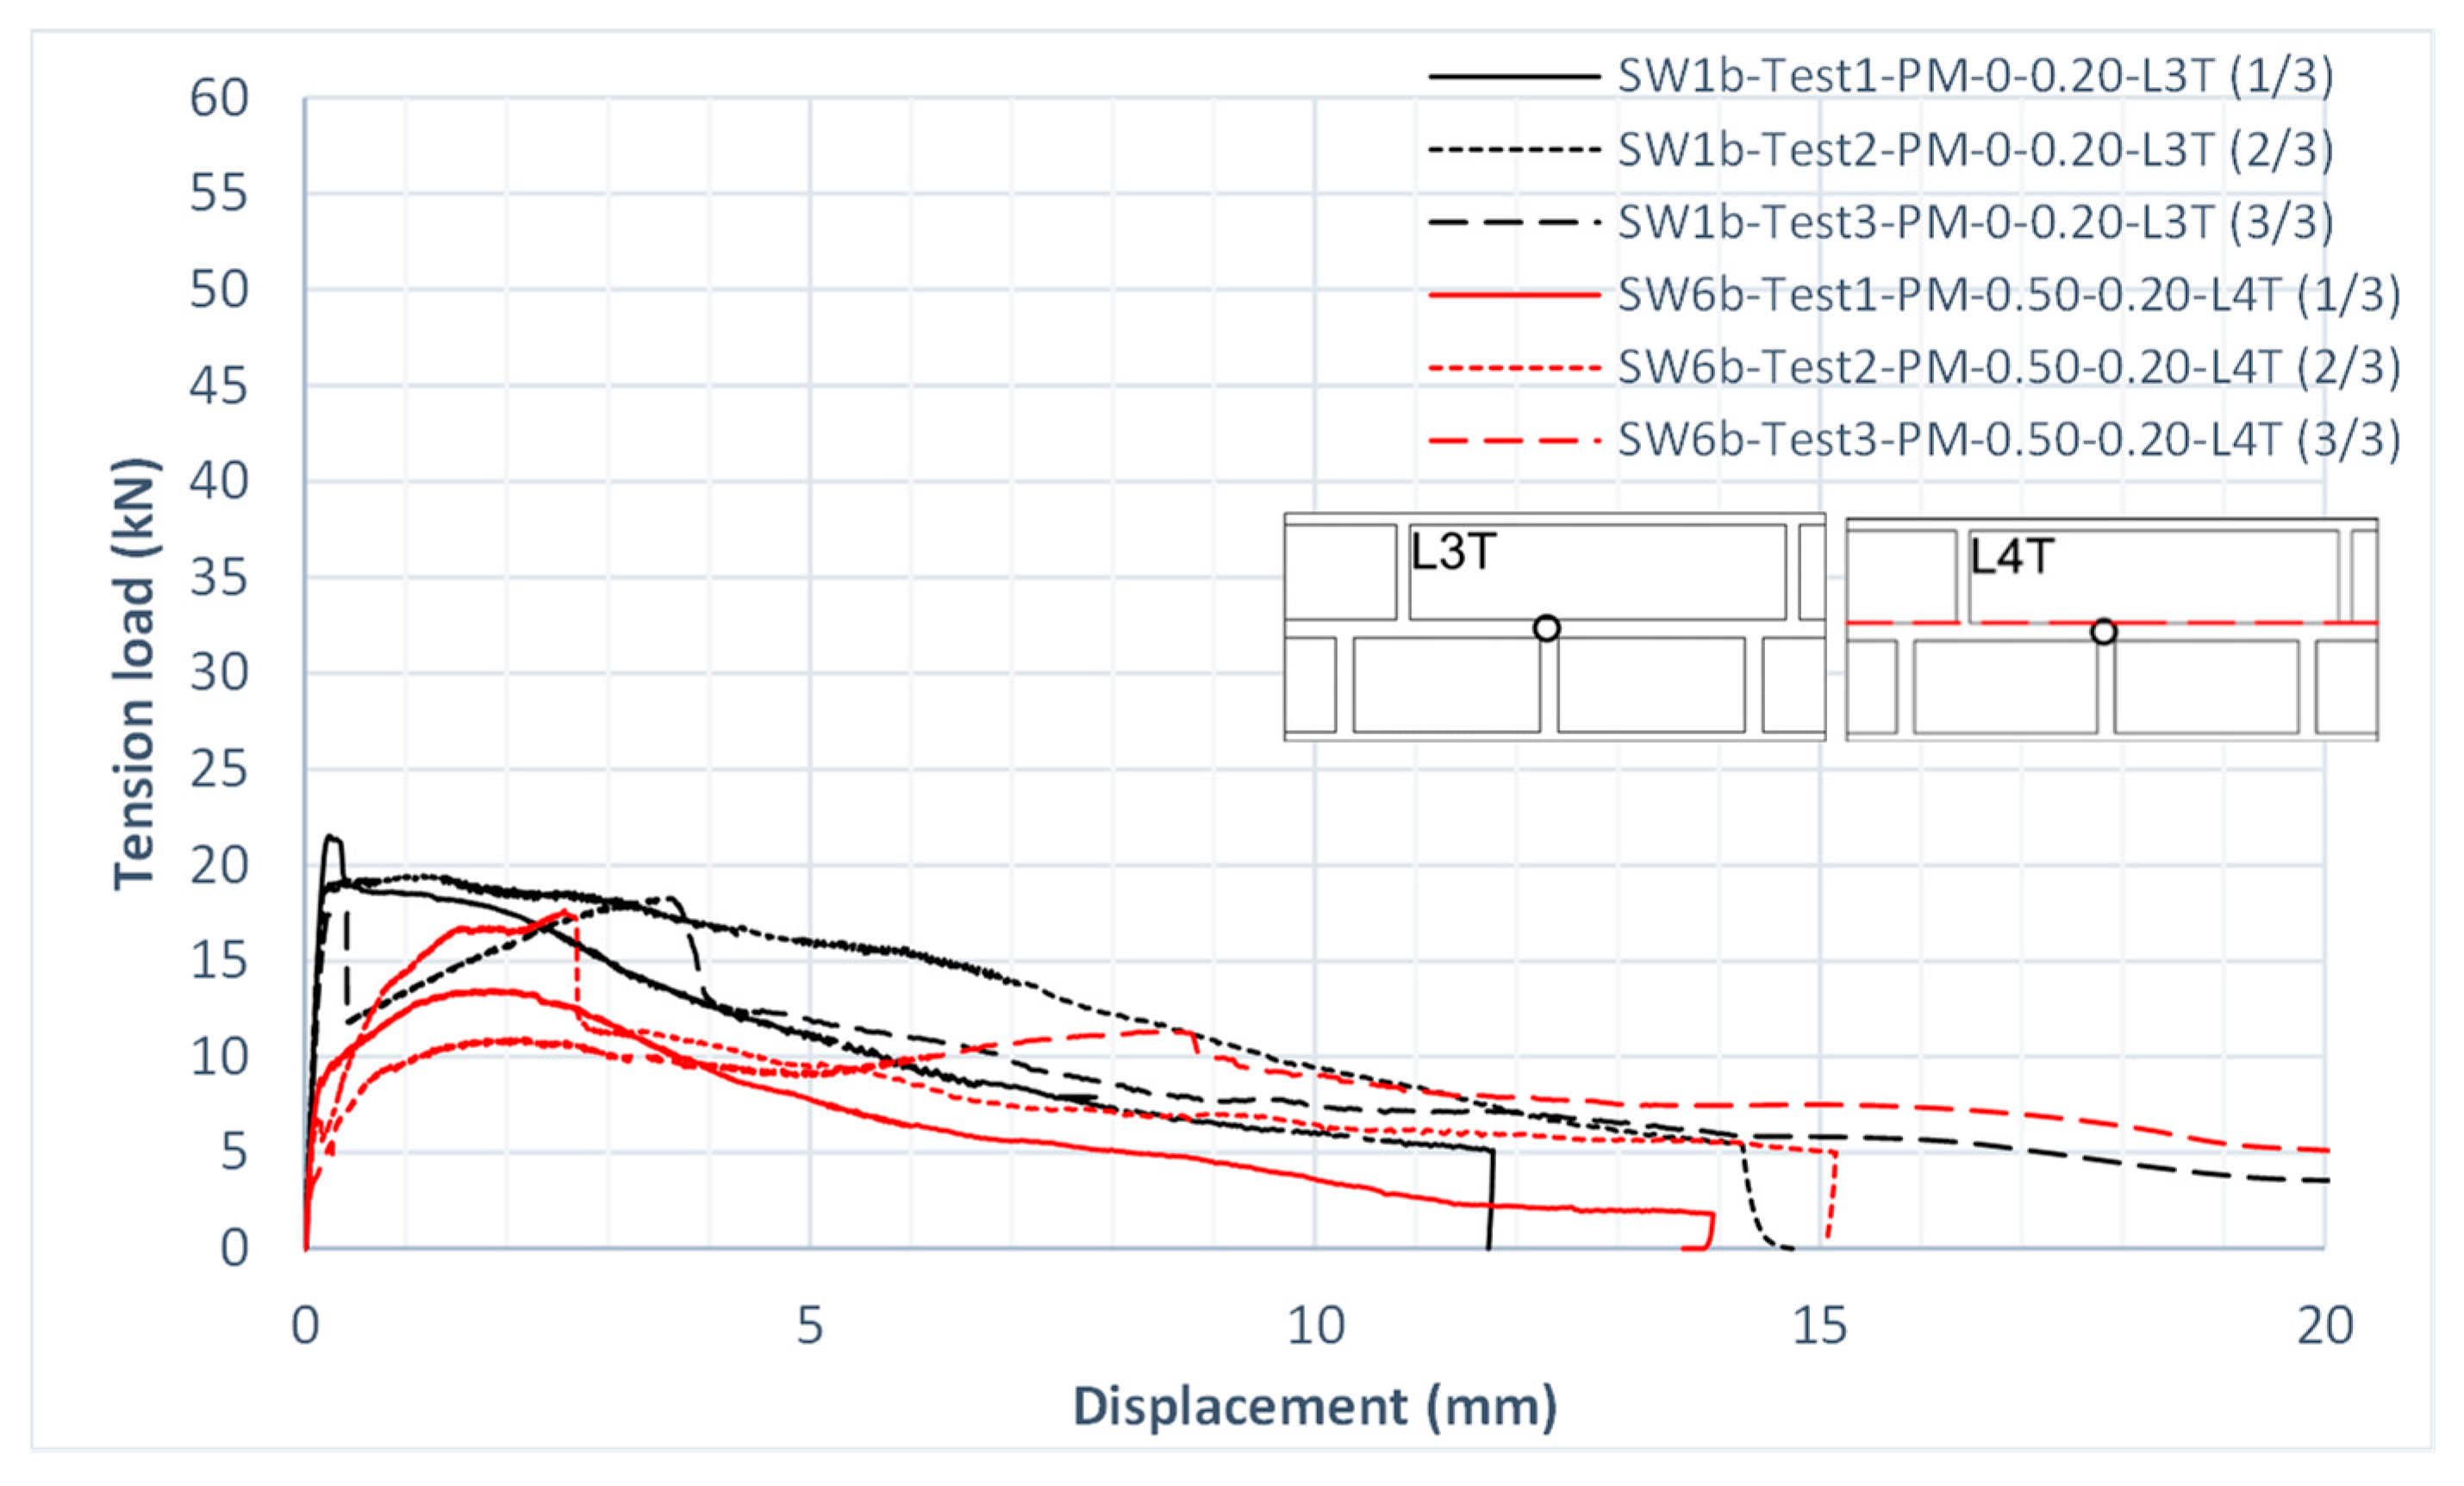
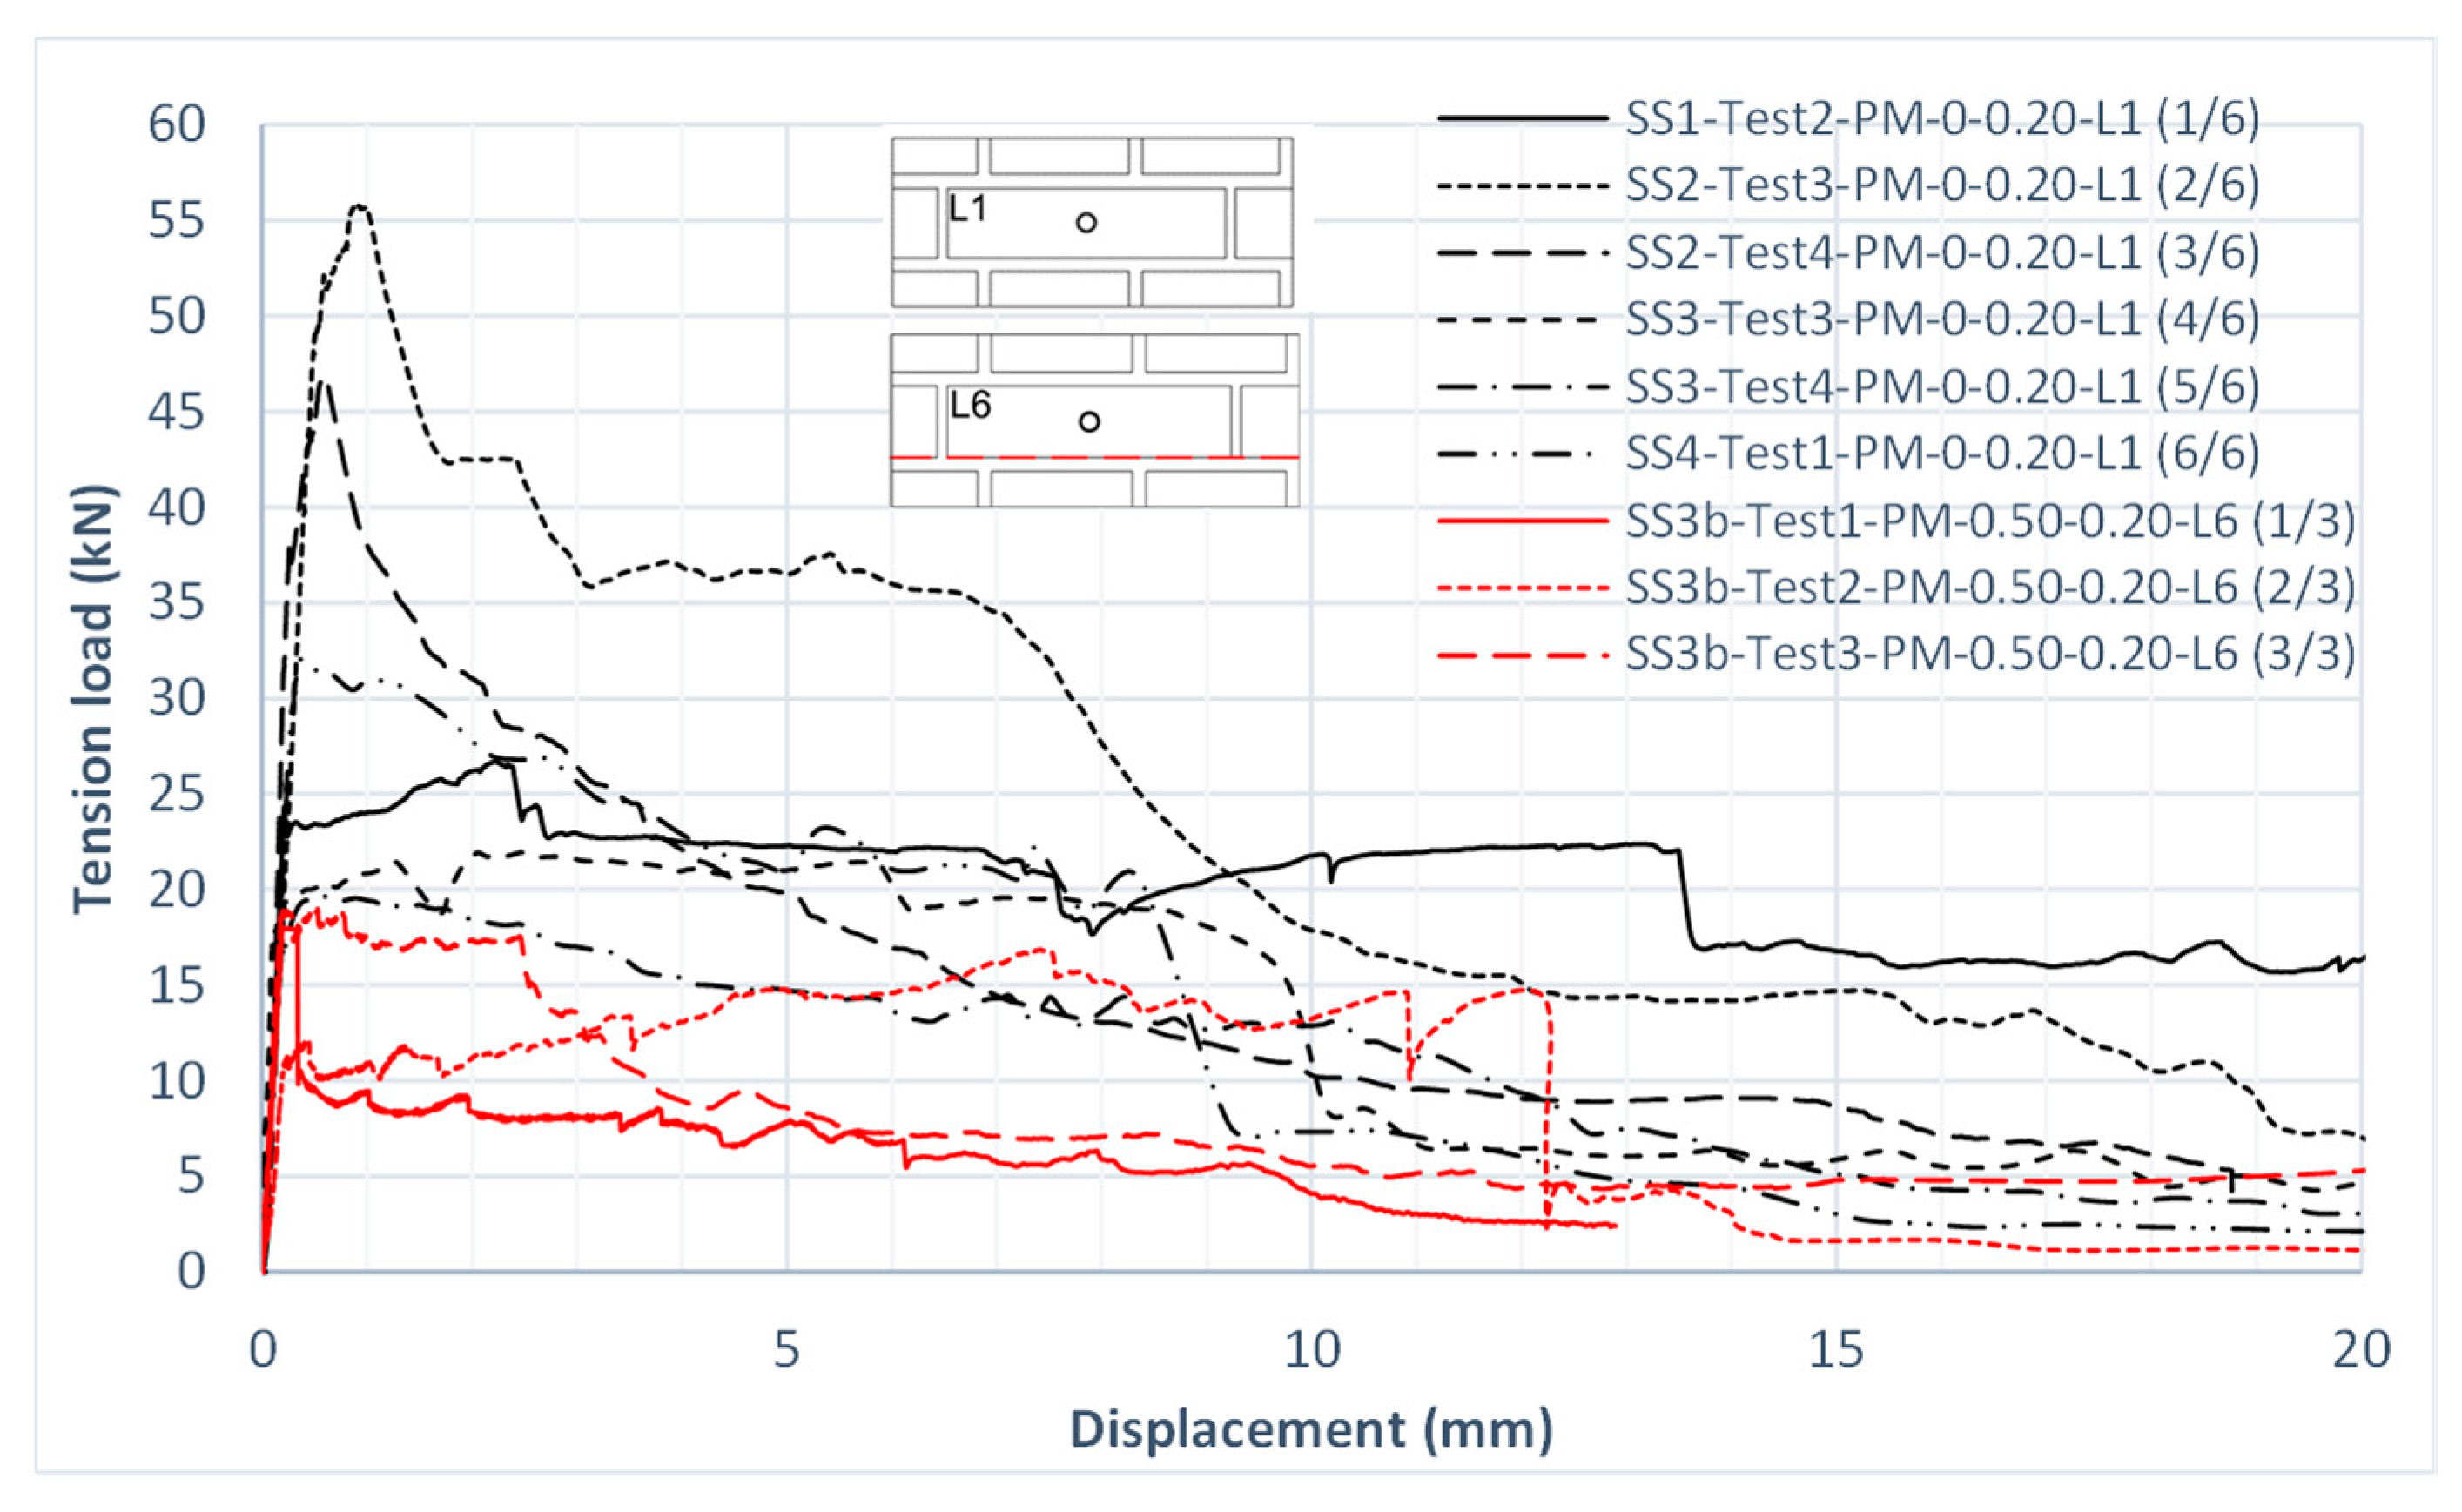
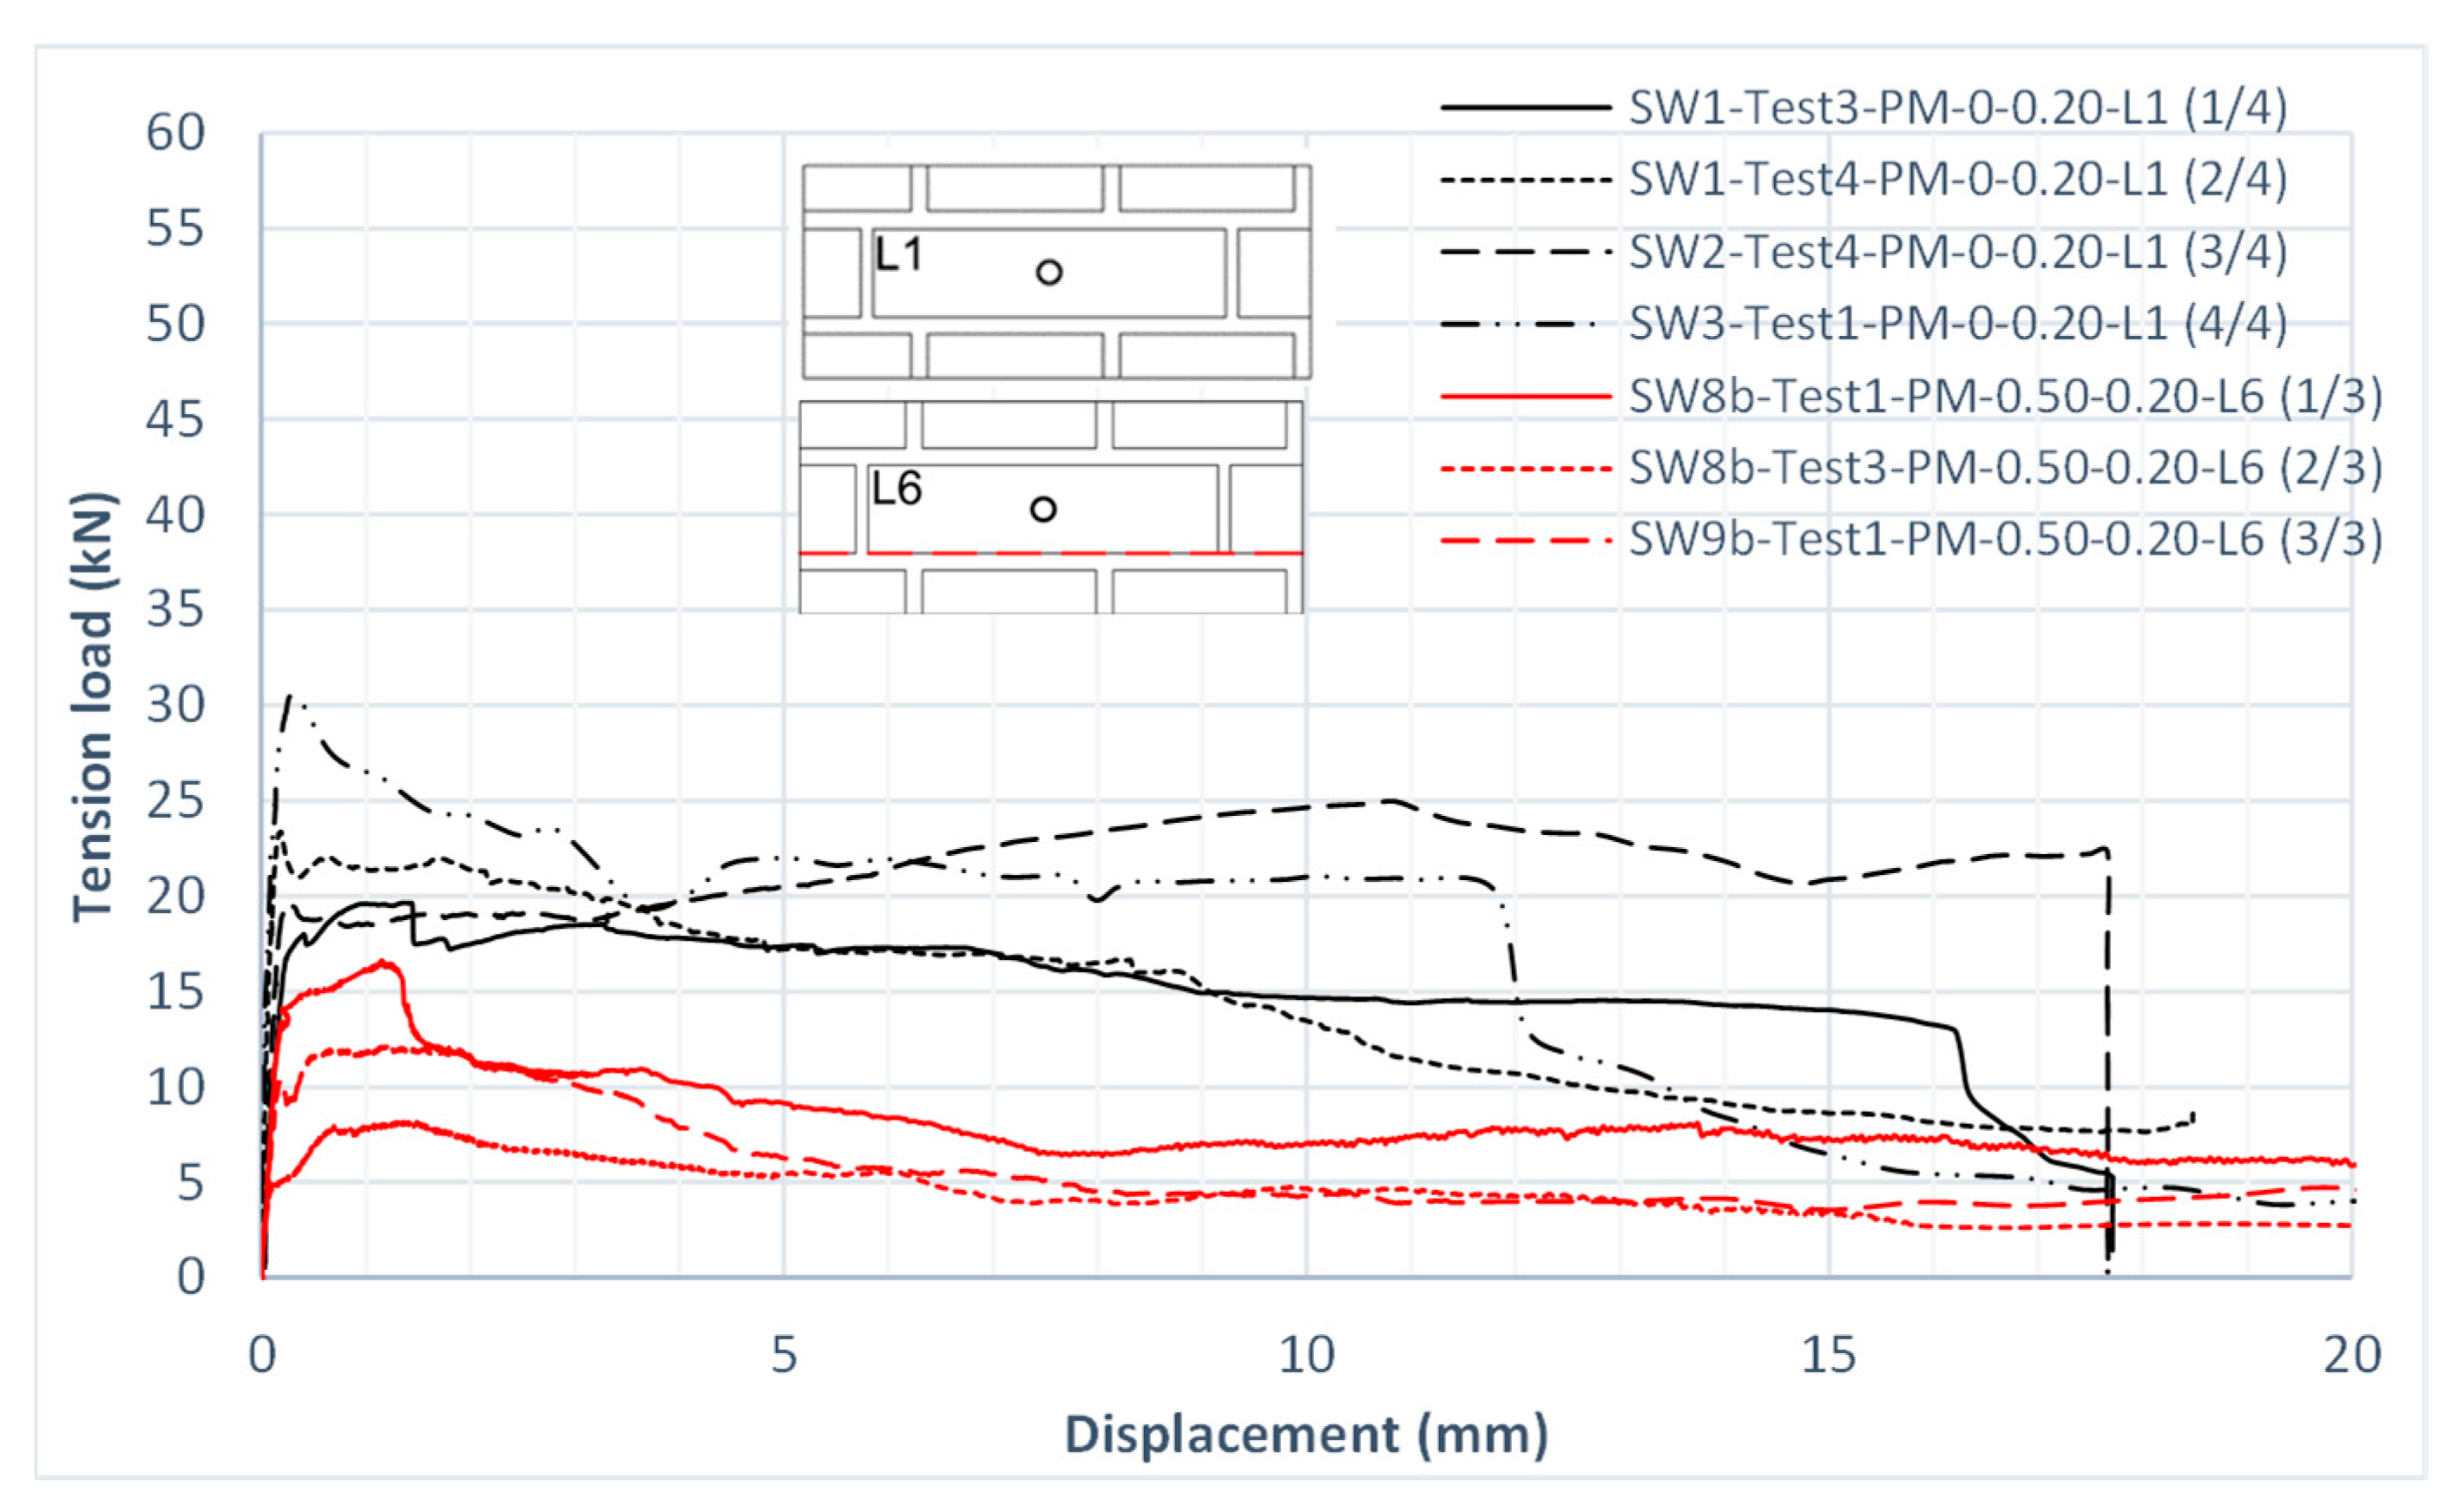
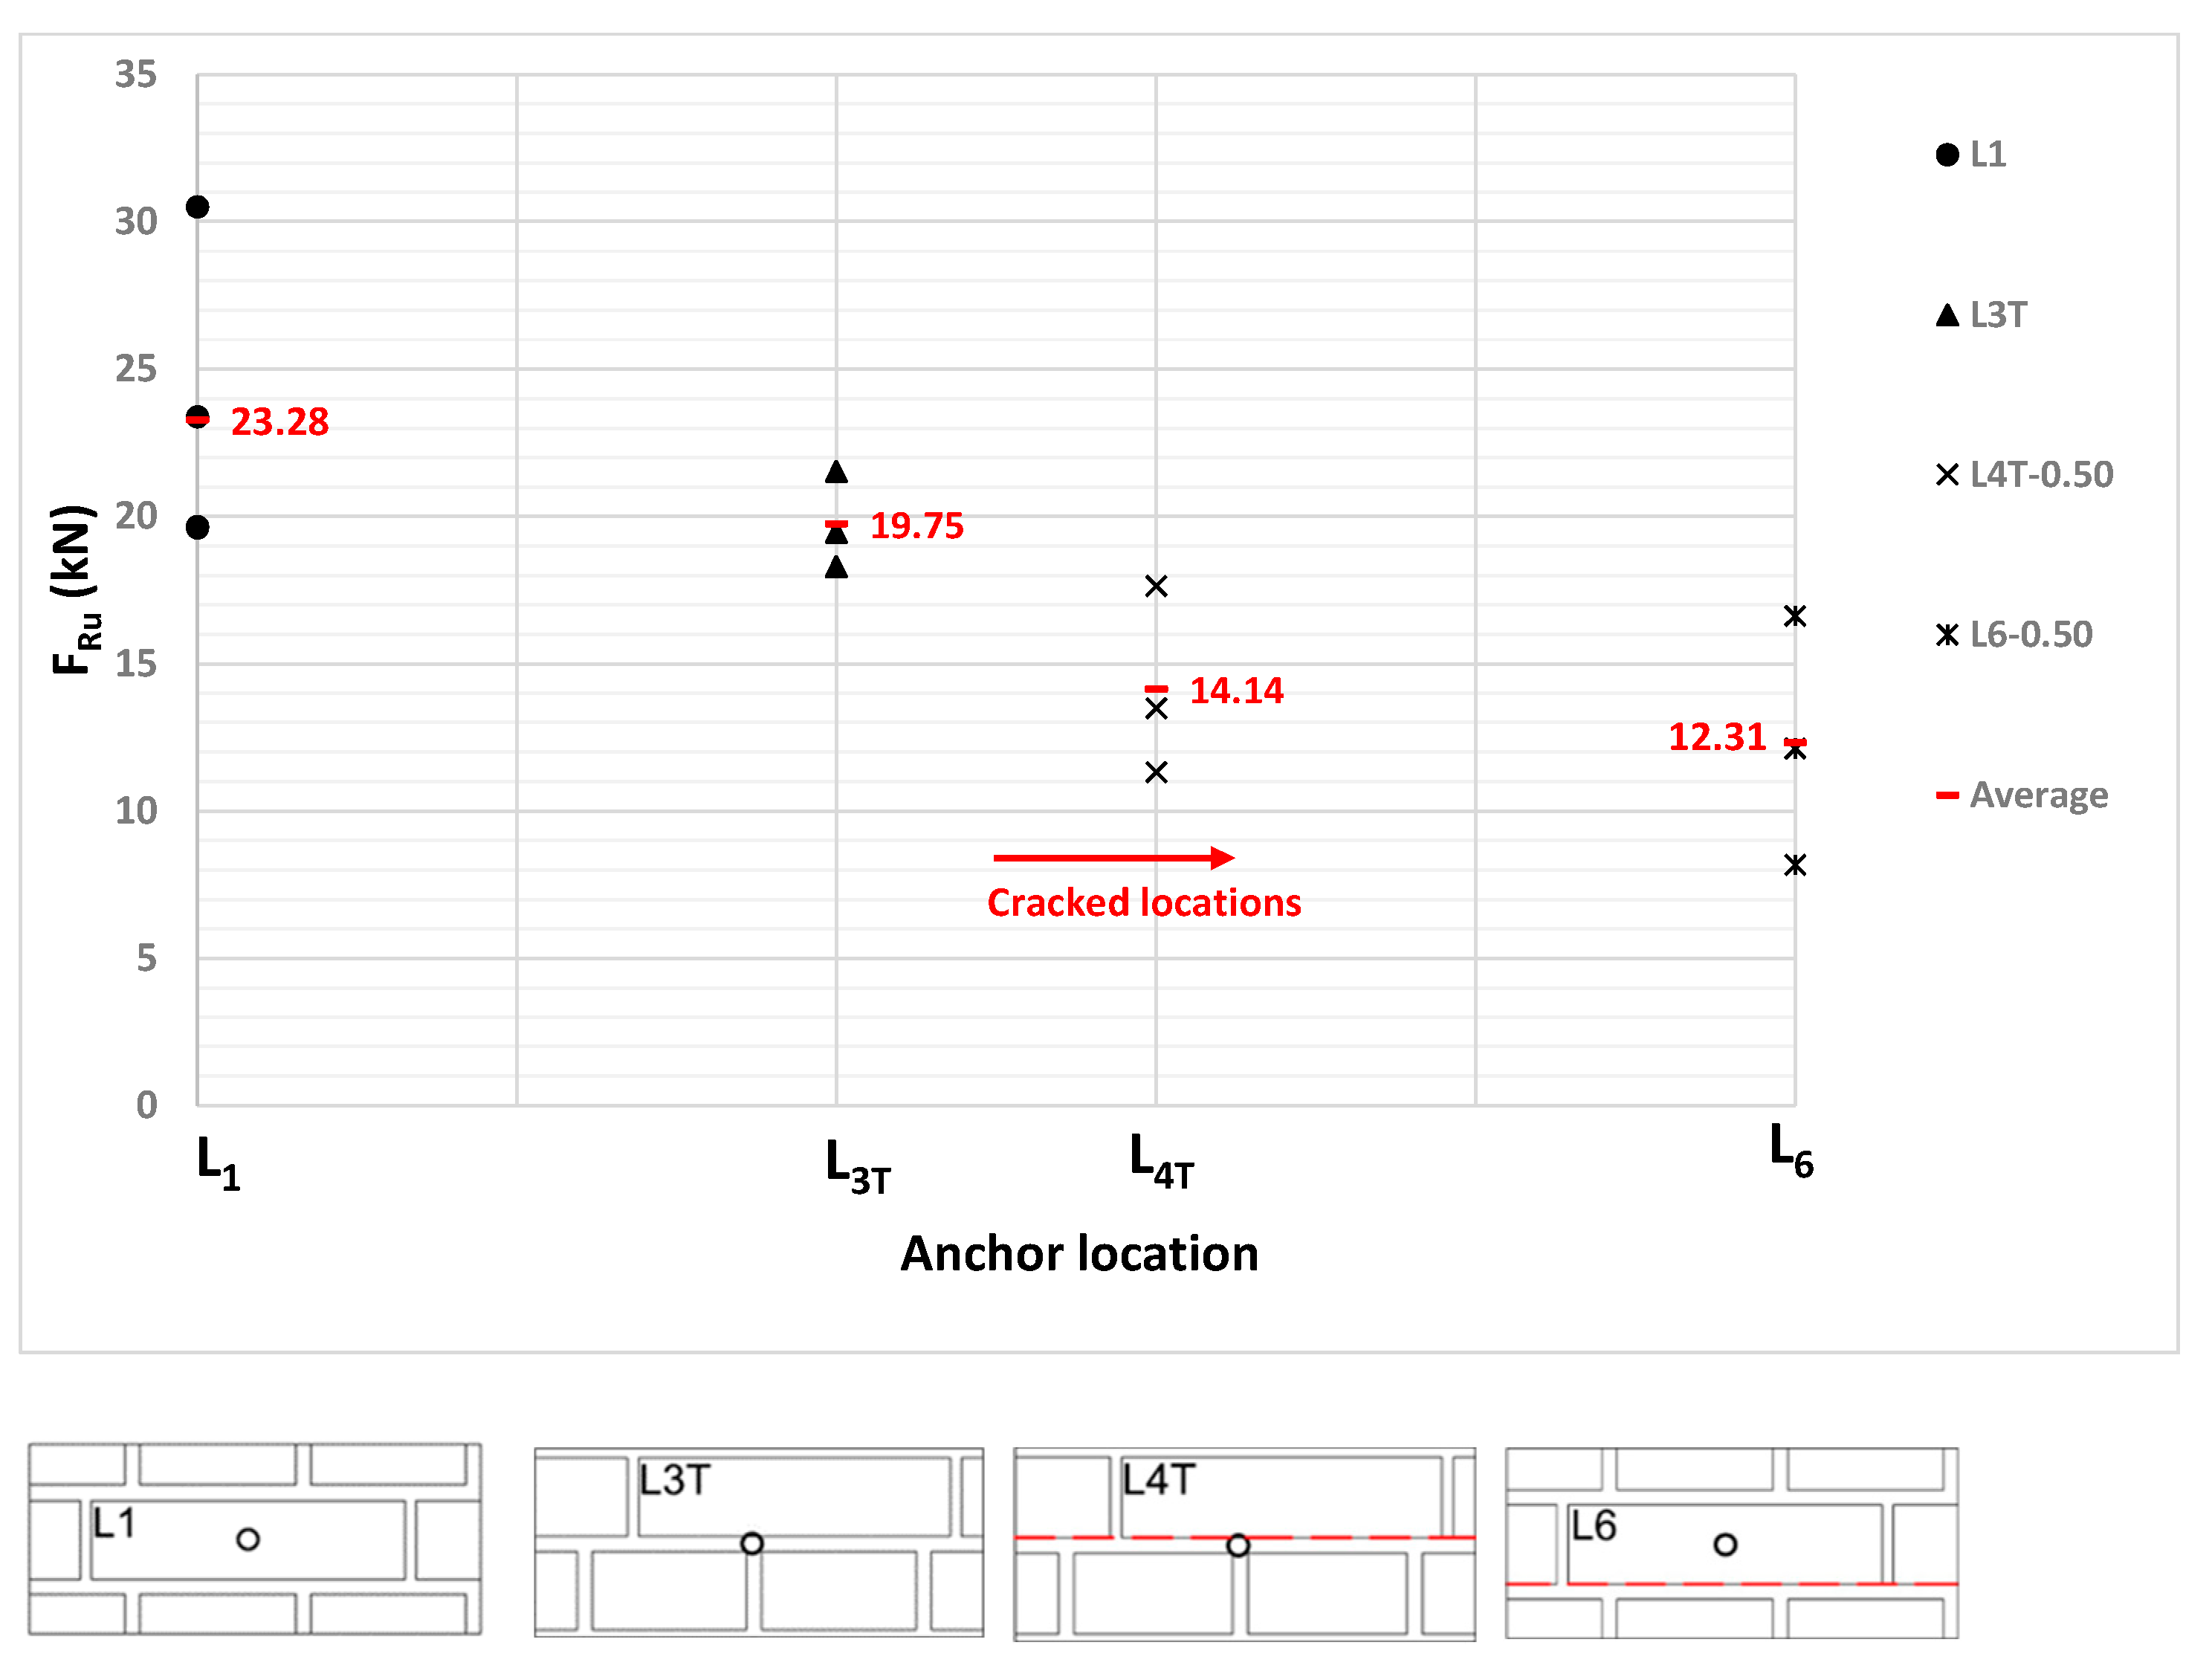
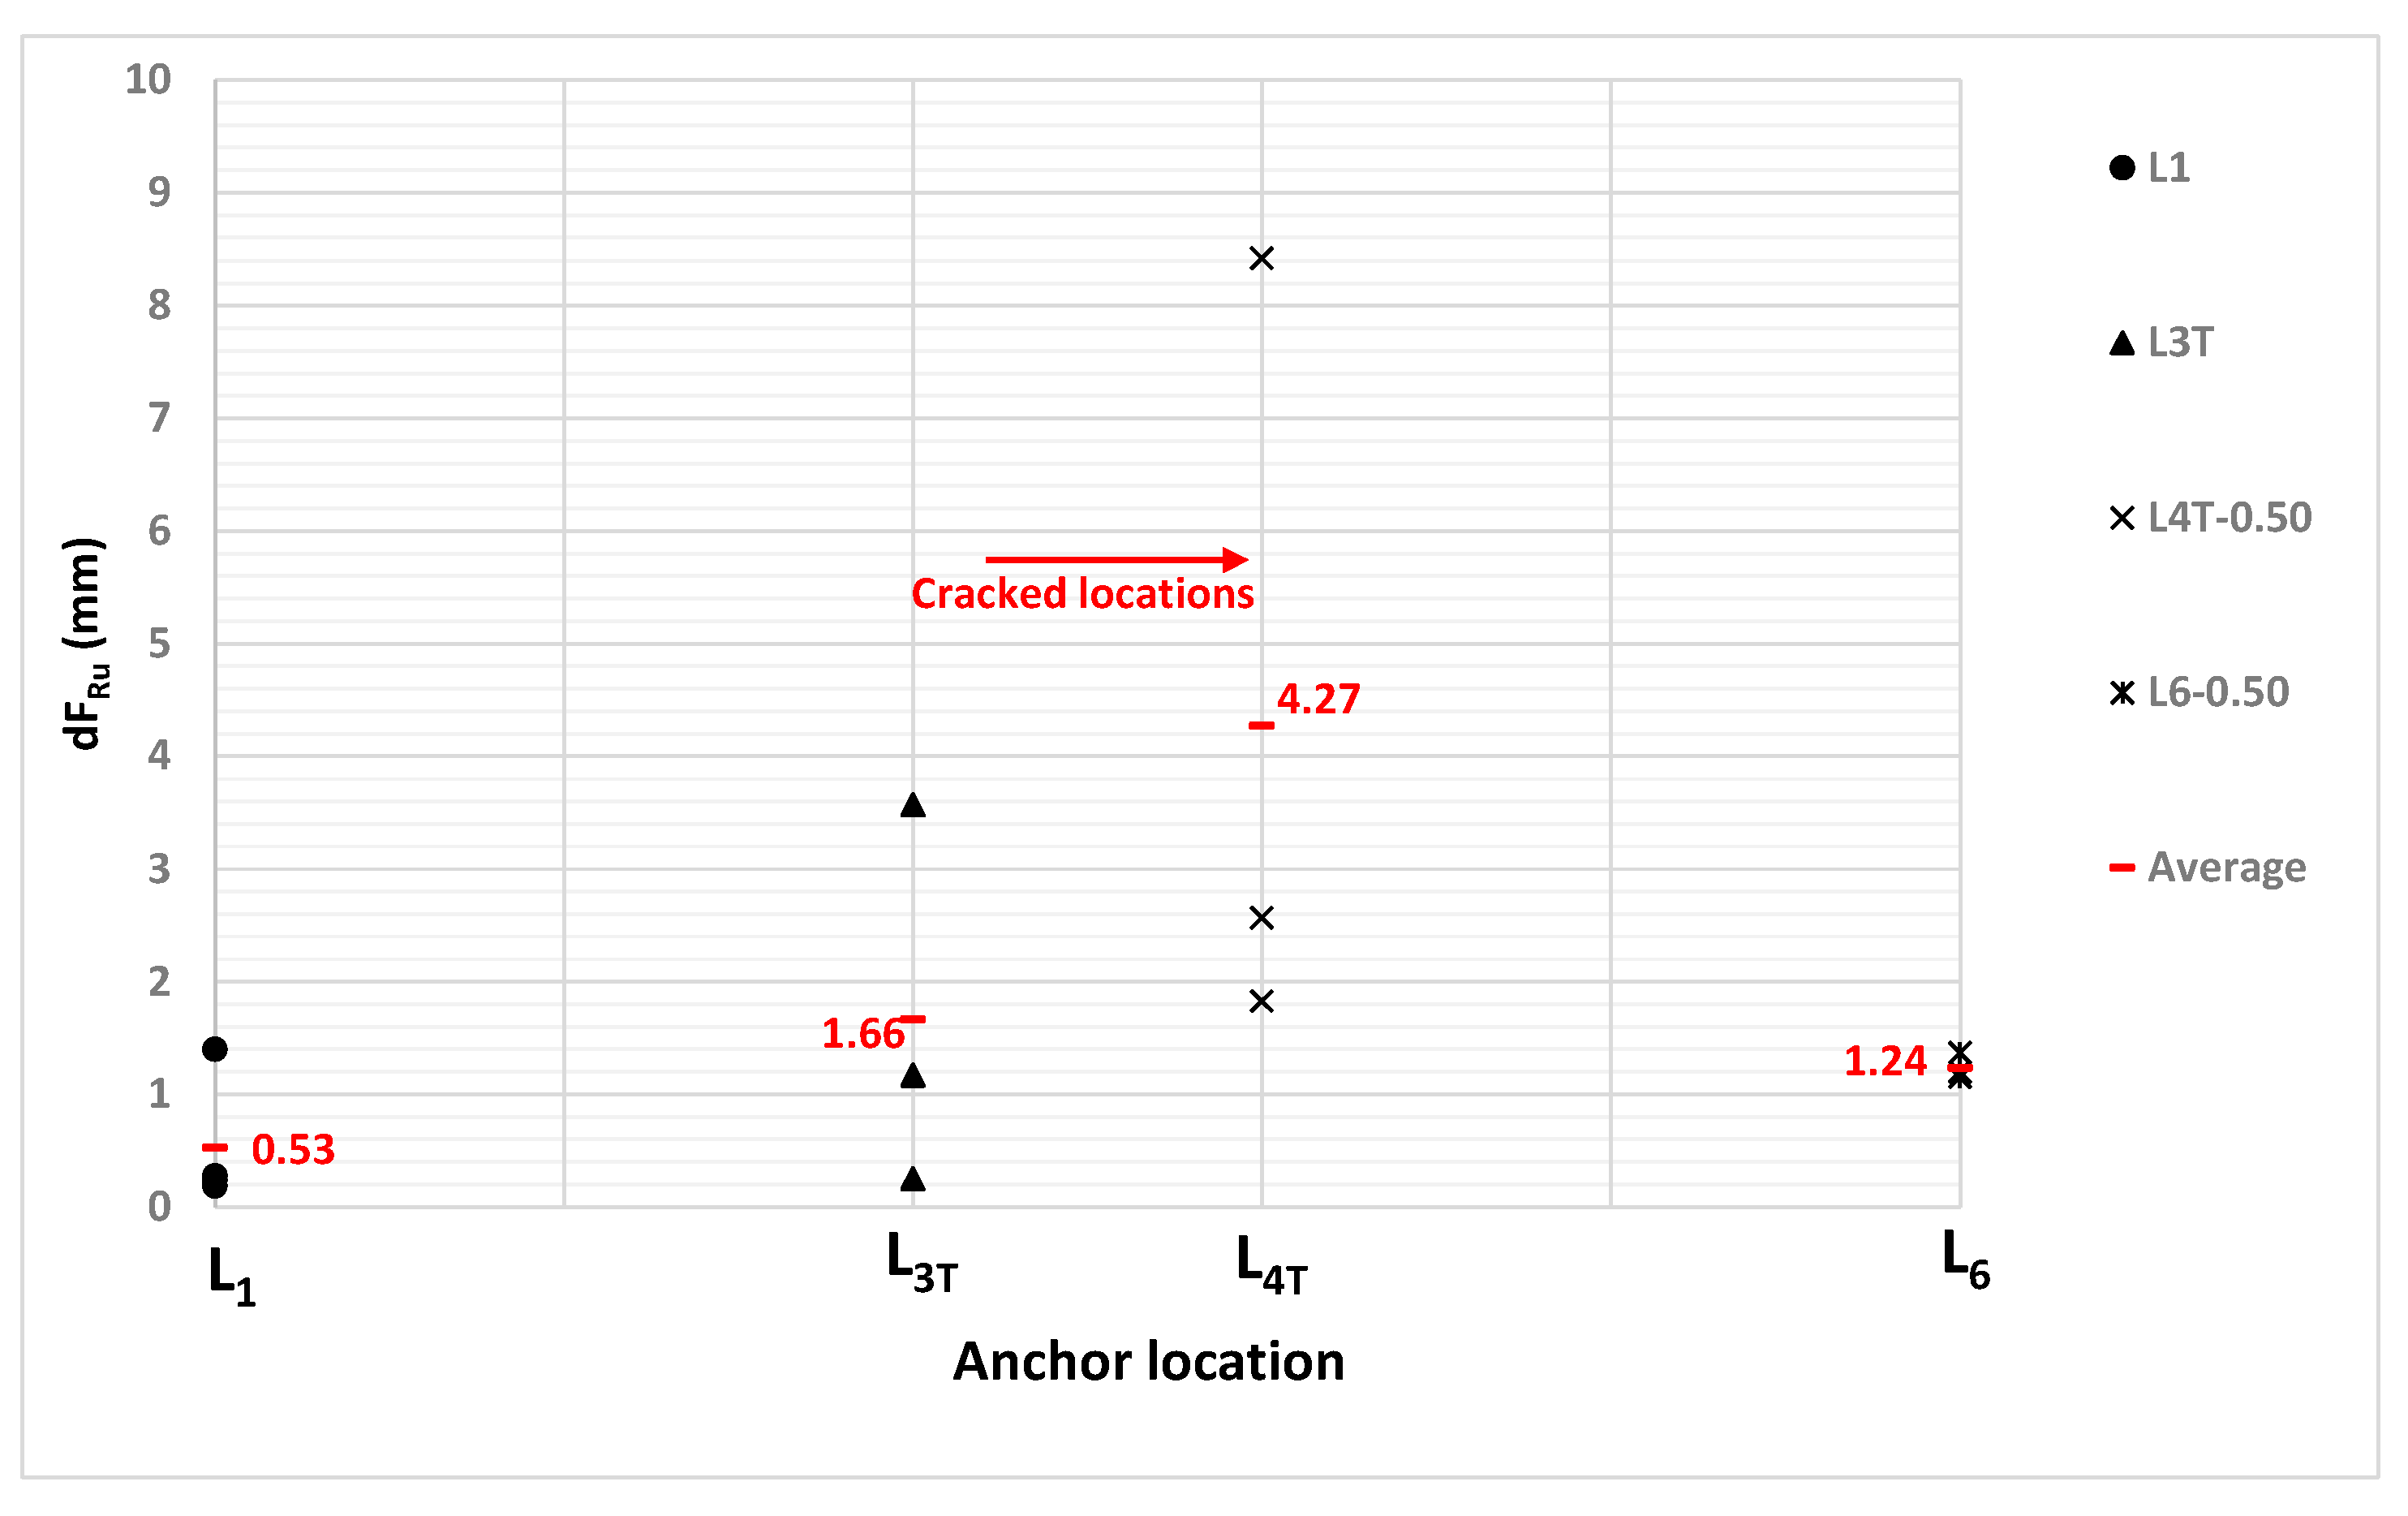
5.3.2. The Effect of Cracking for Various Anchor Locations
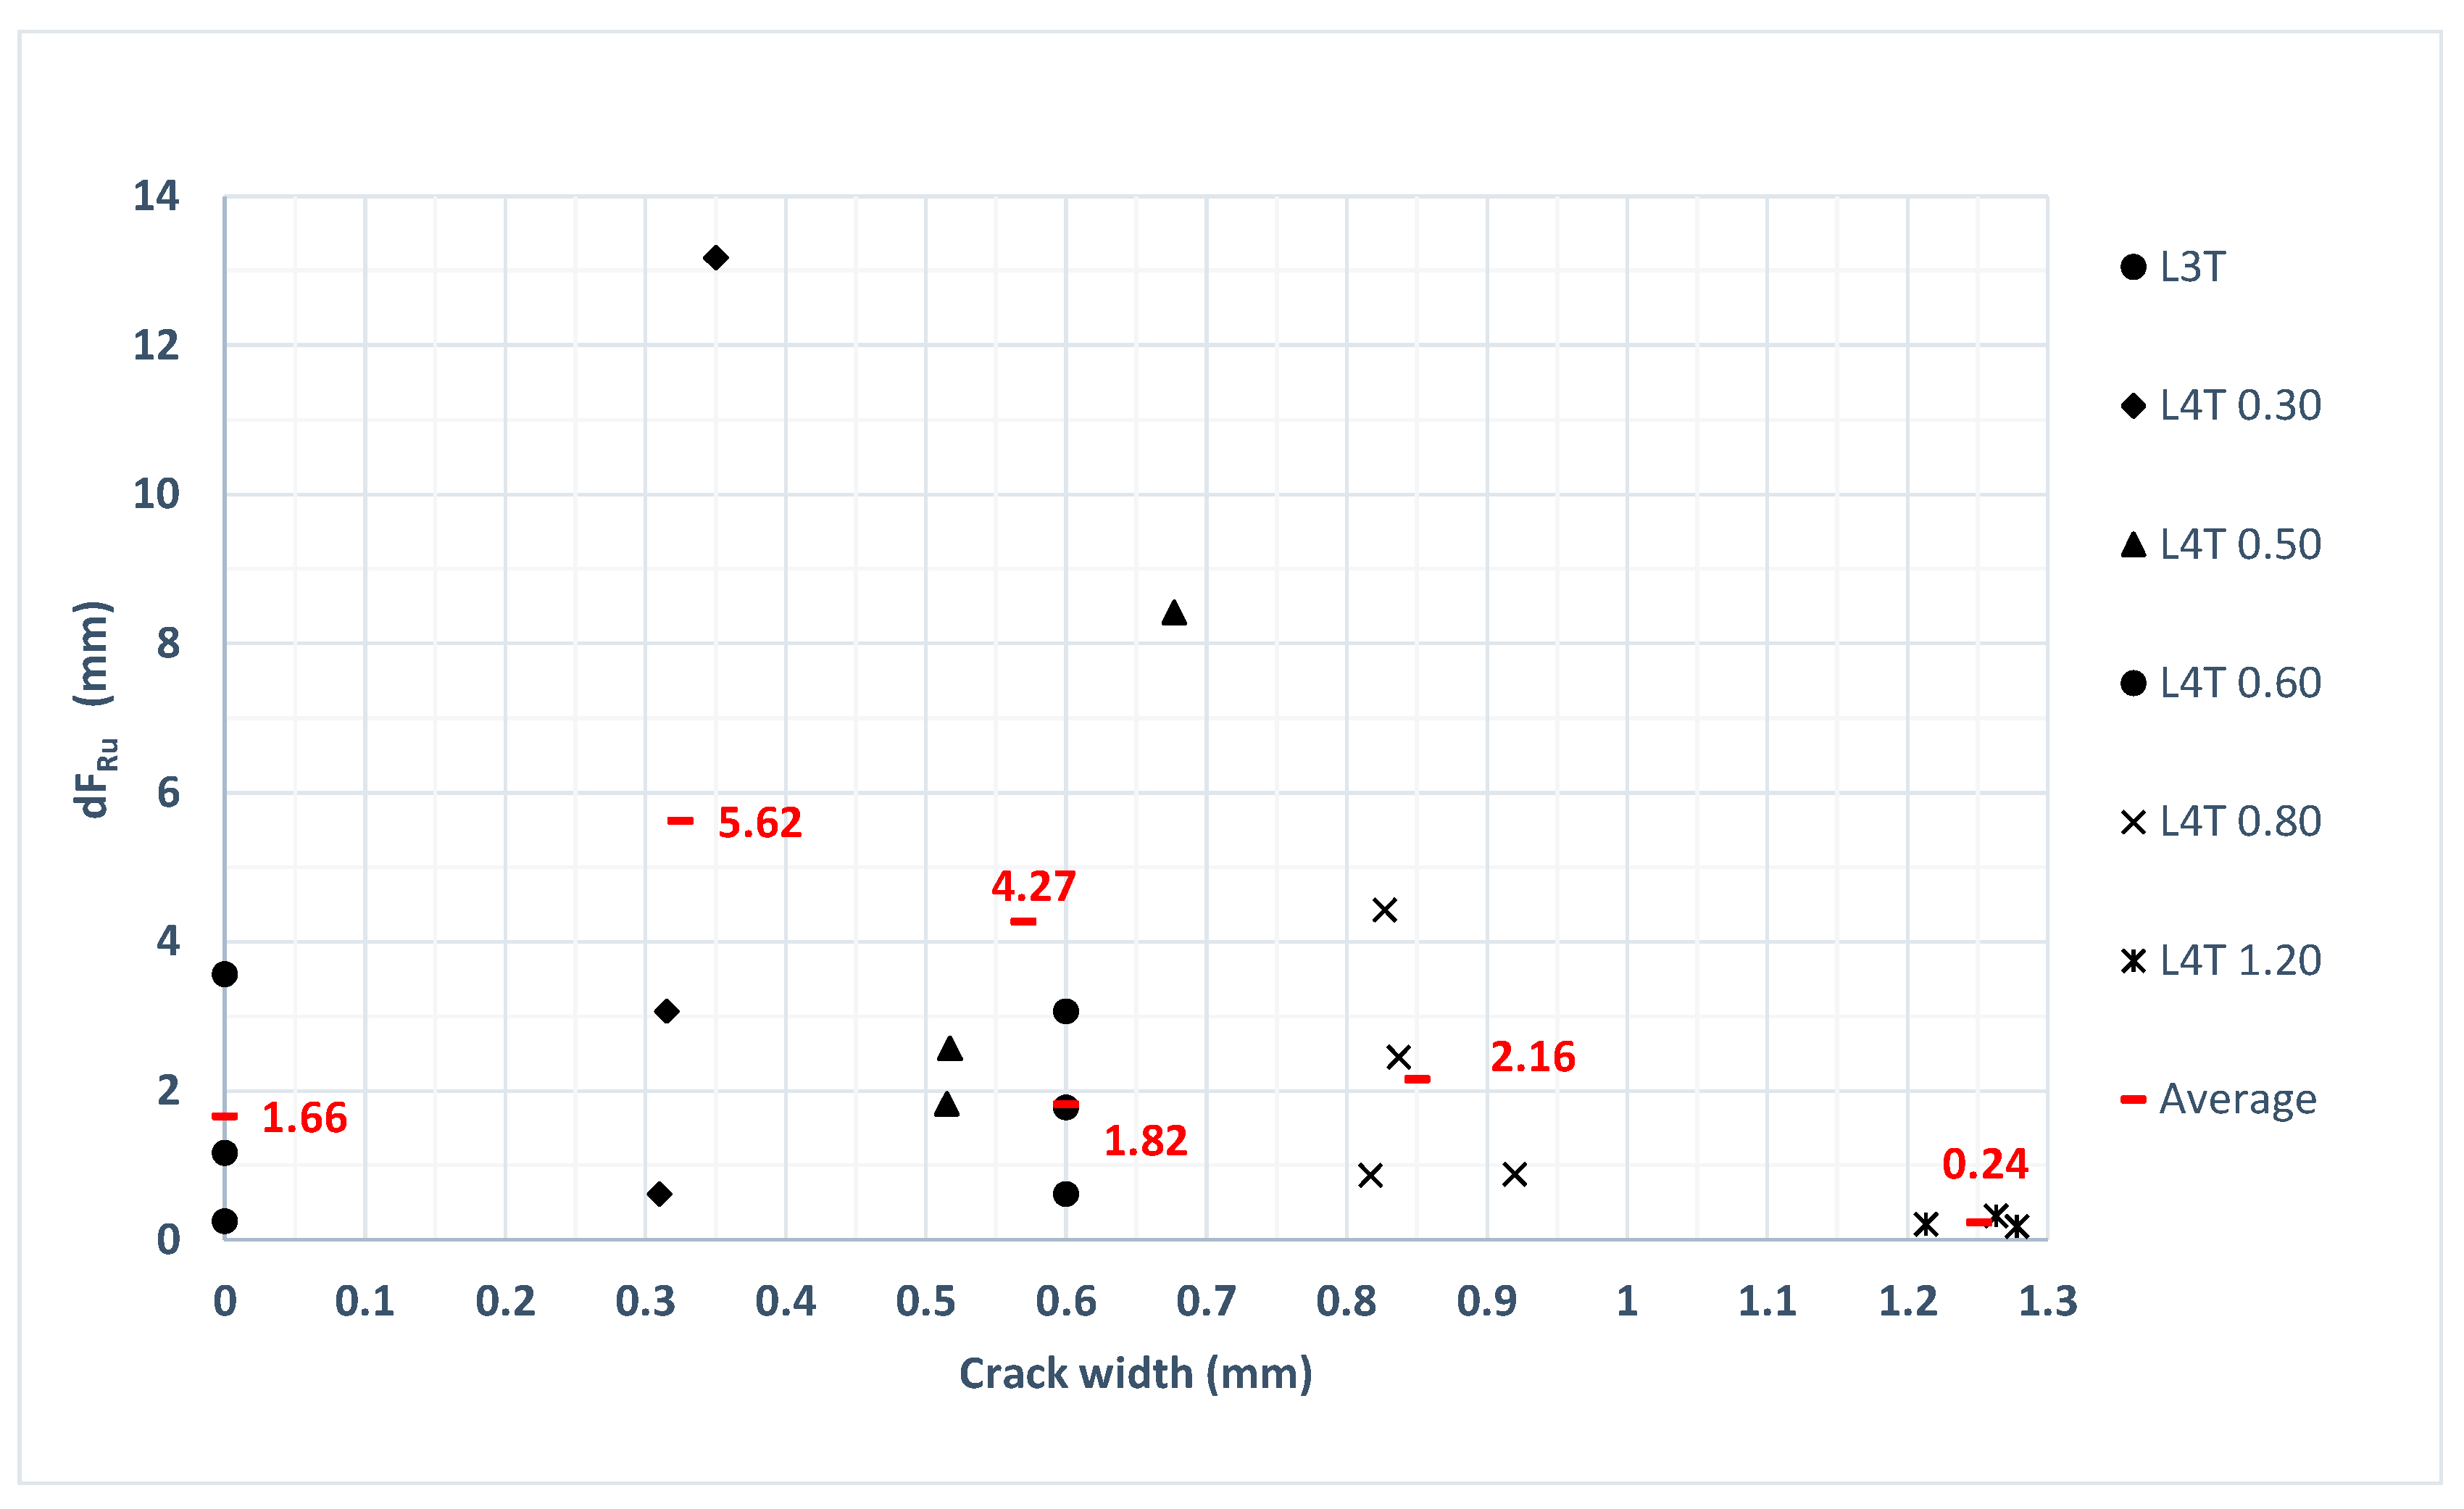
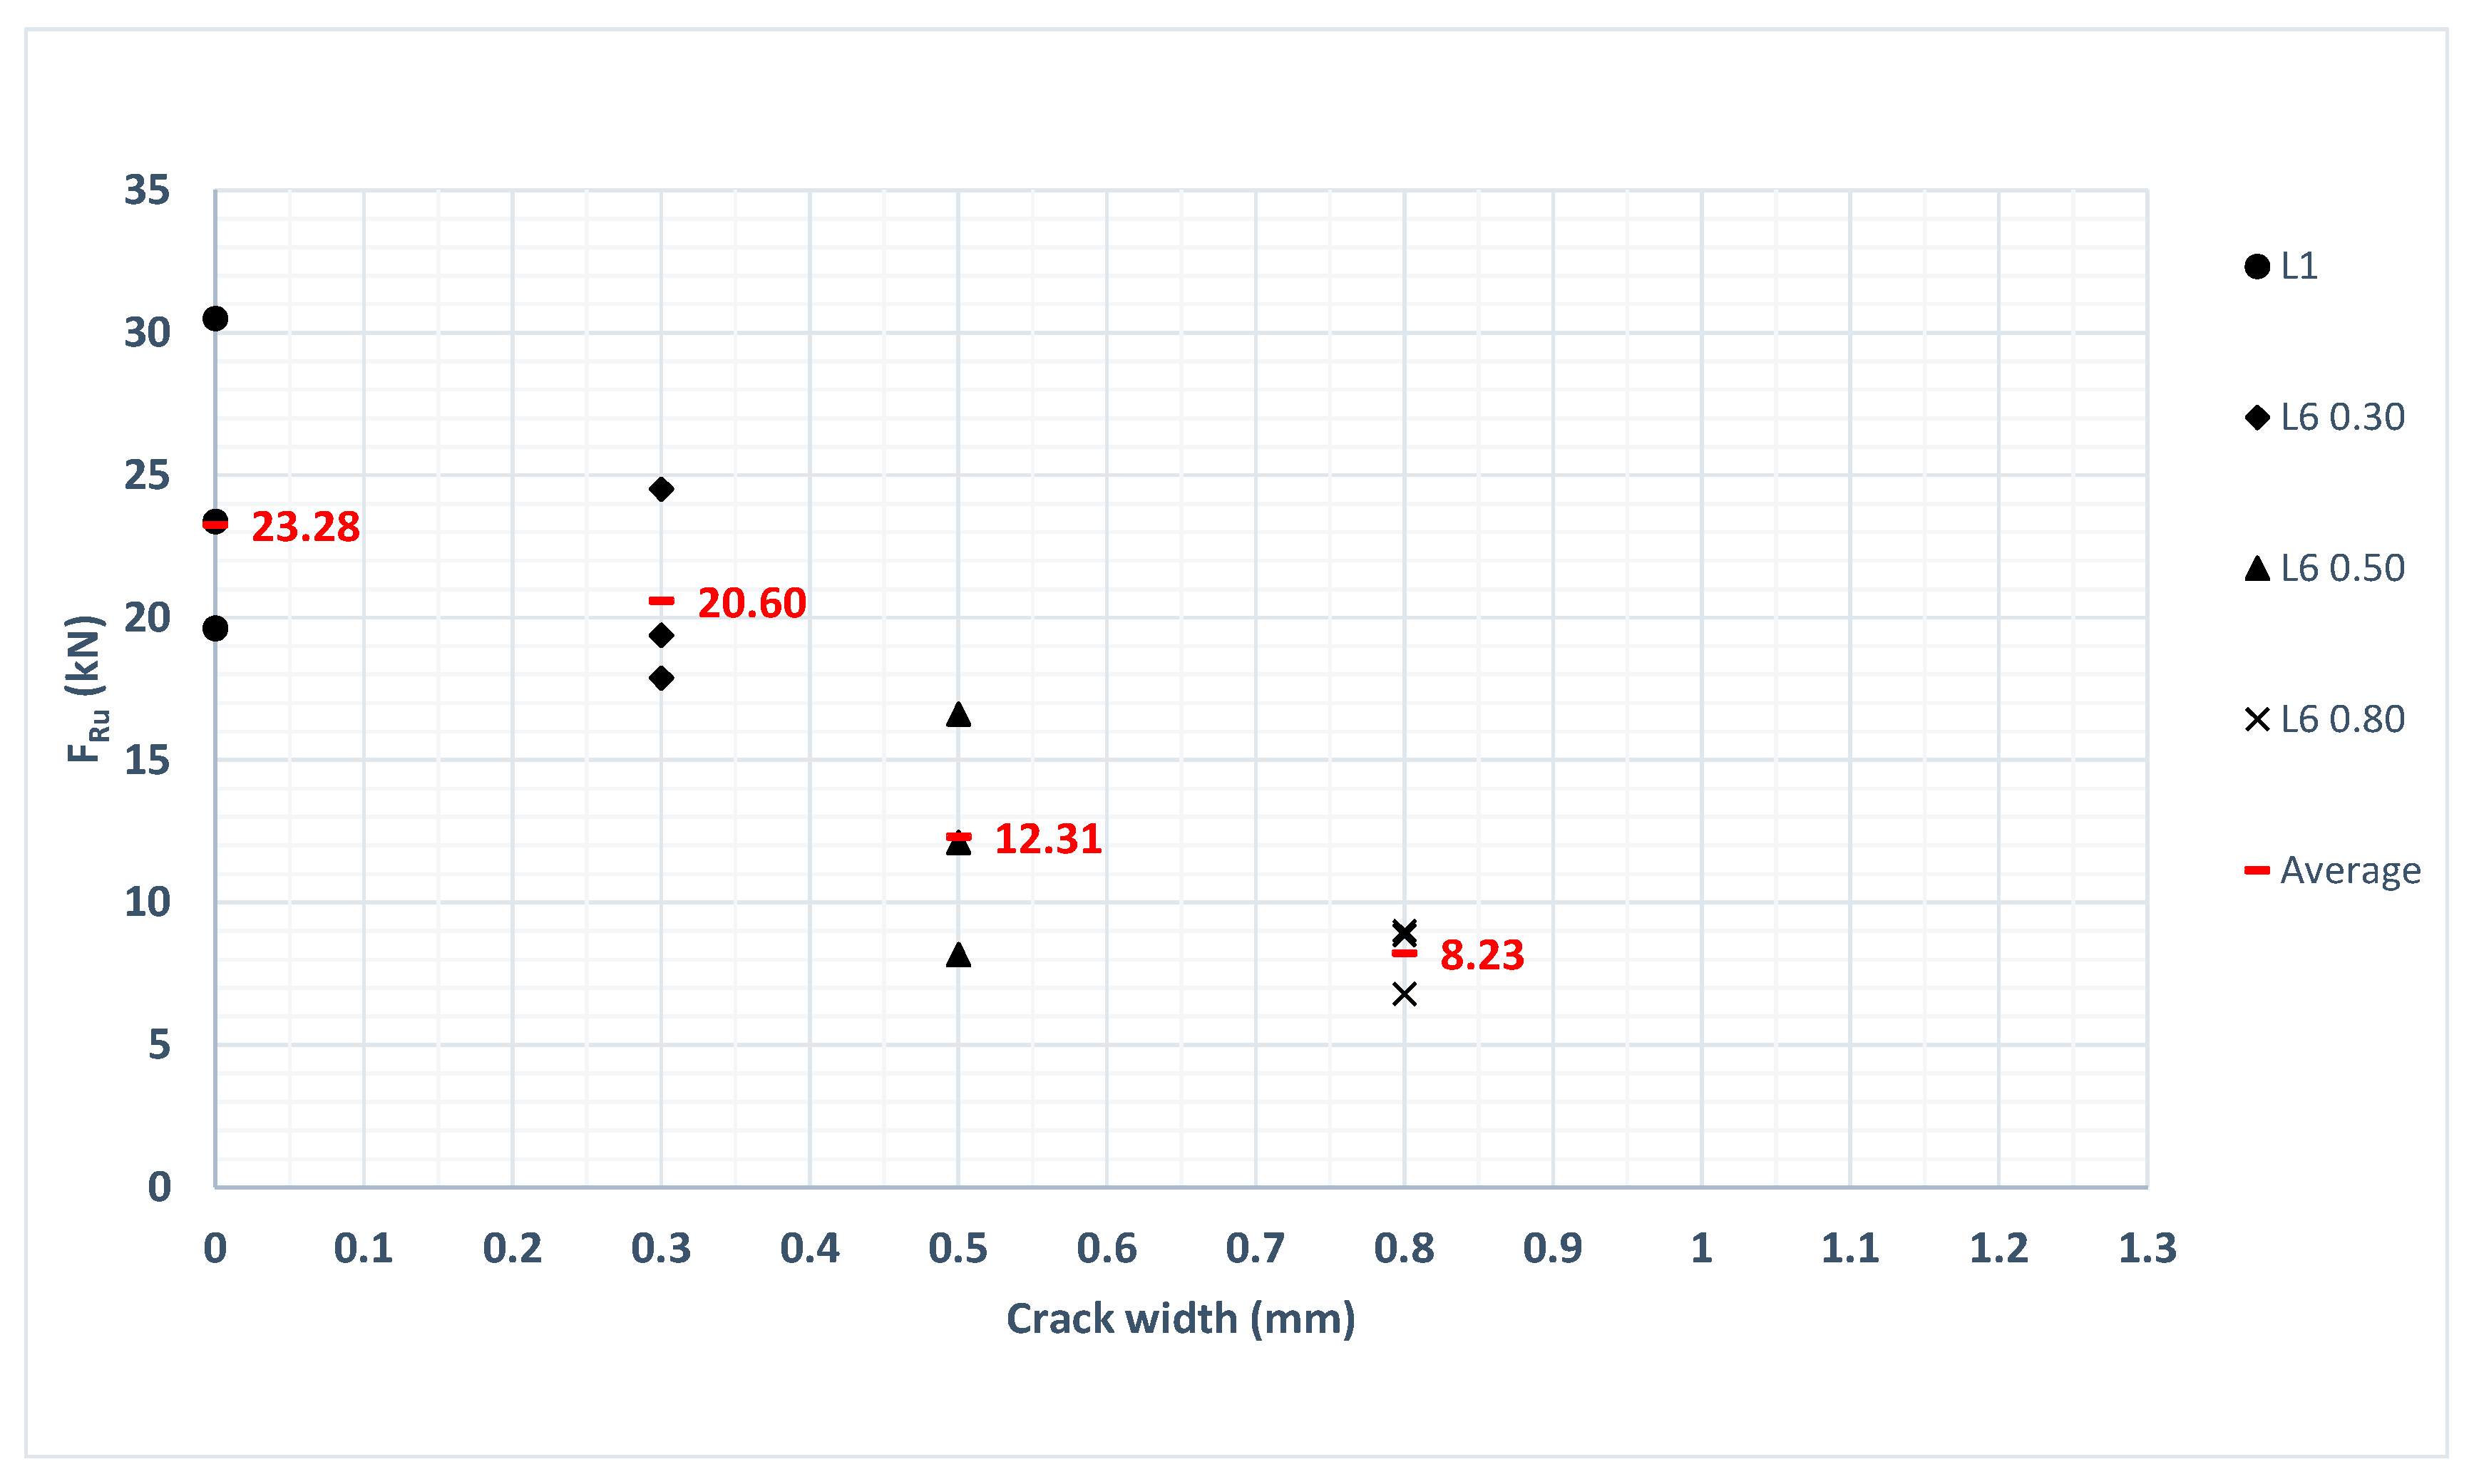
5.3.3. The Effect of Crack Width
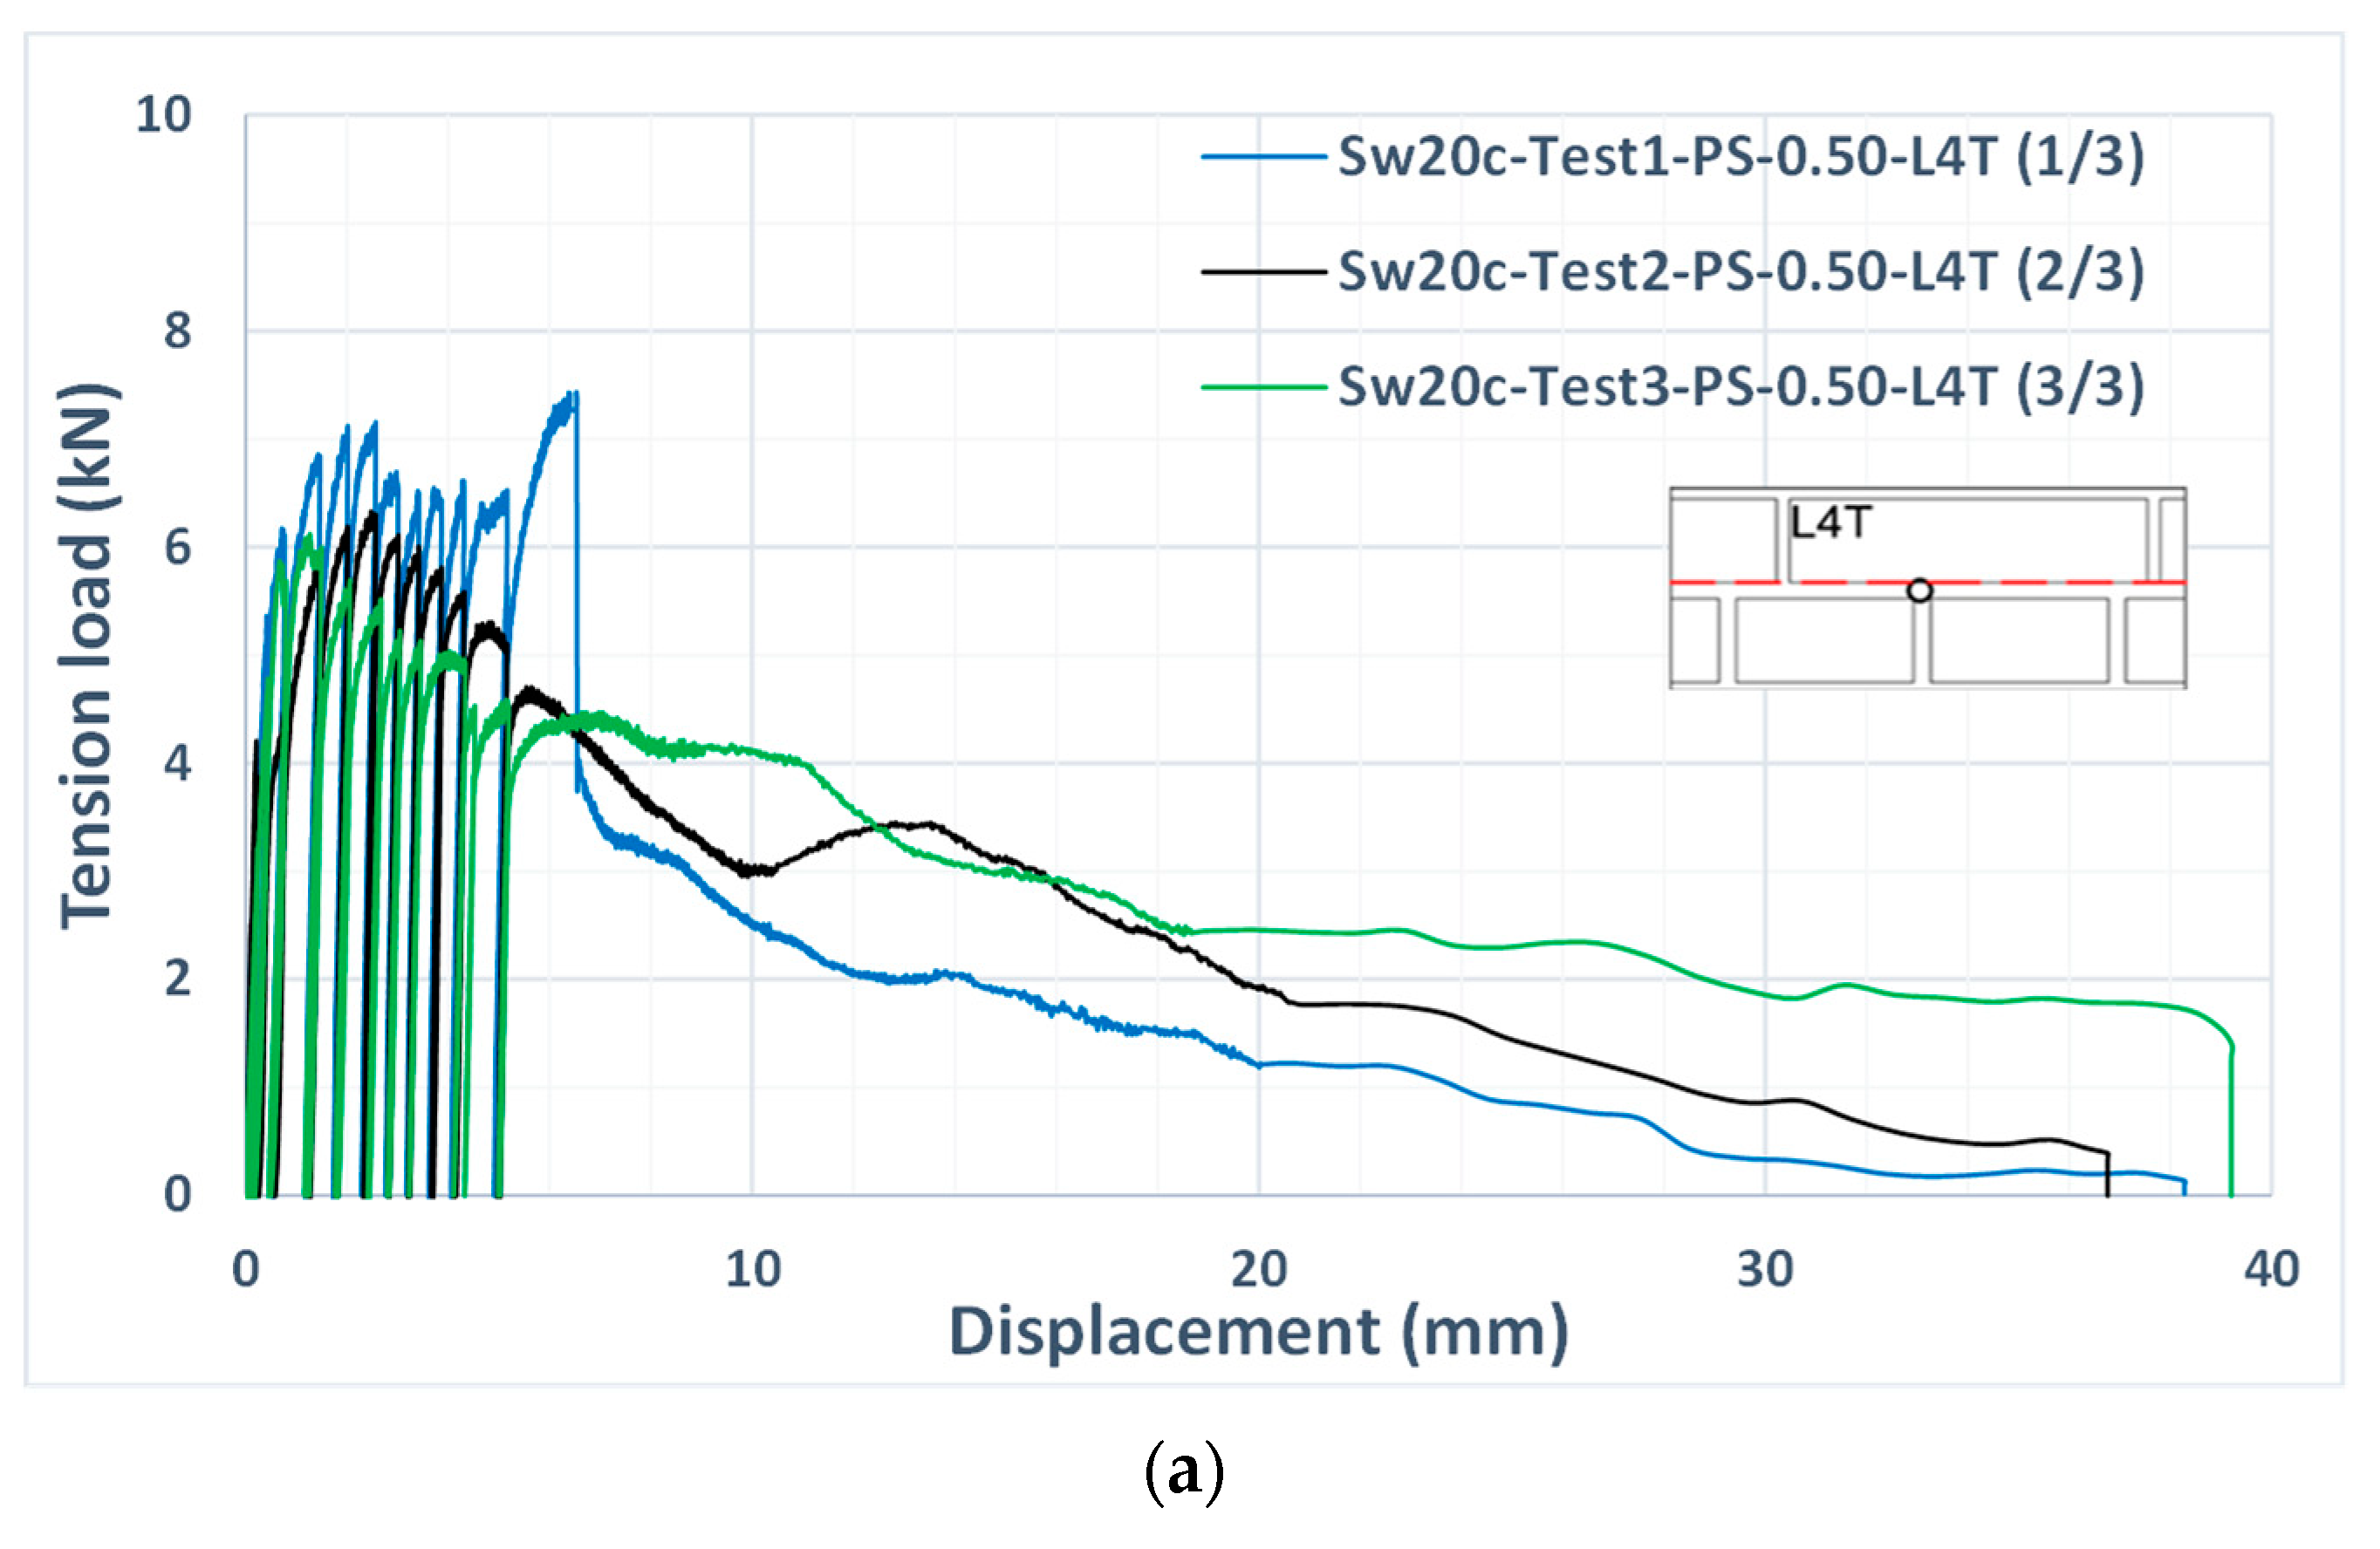
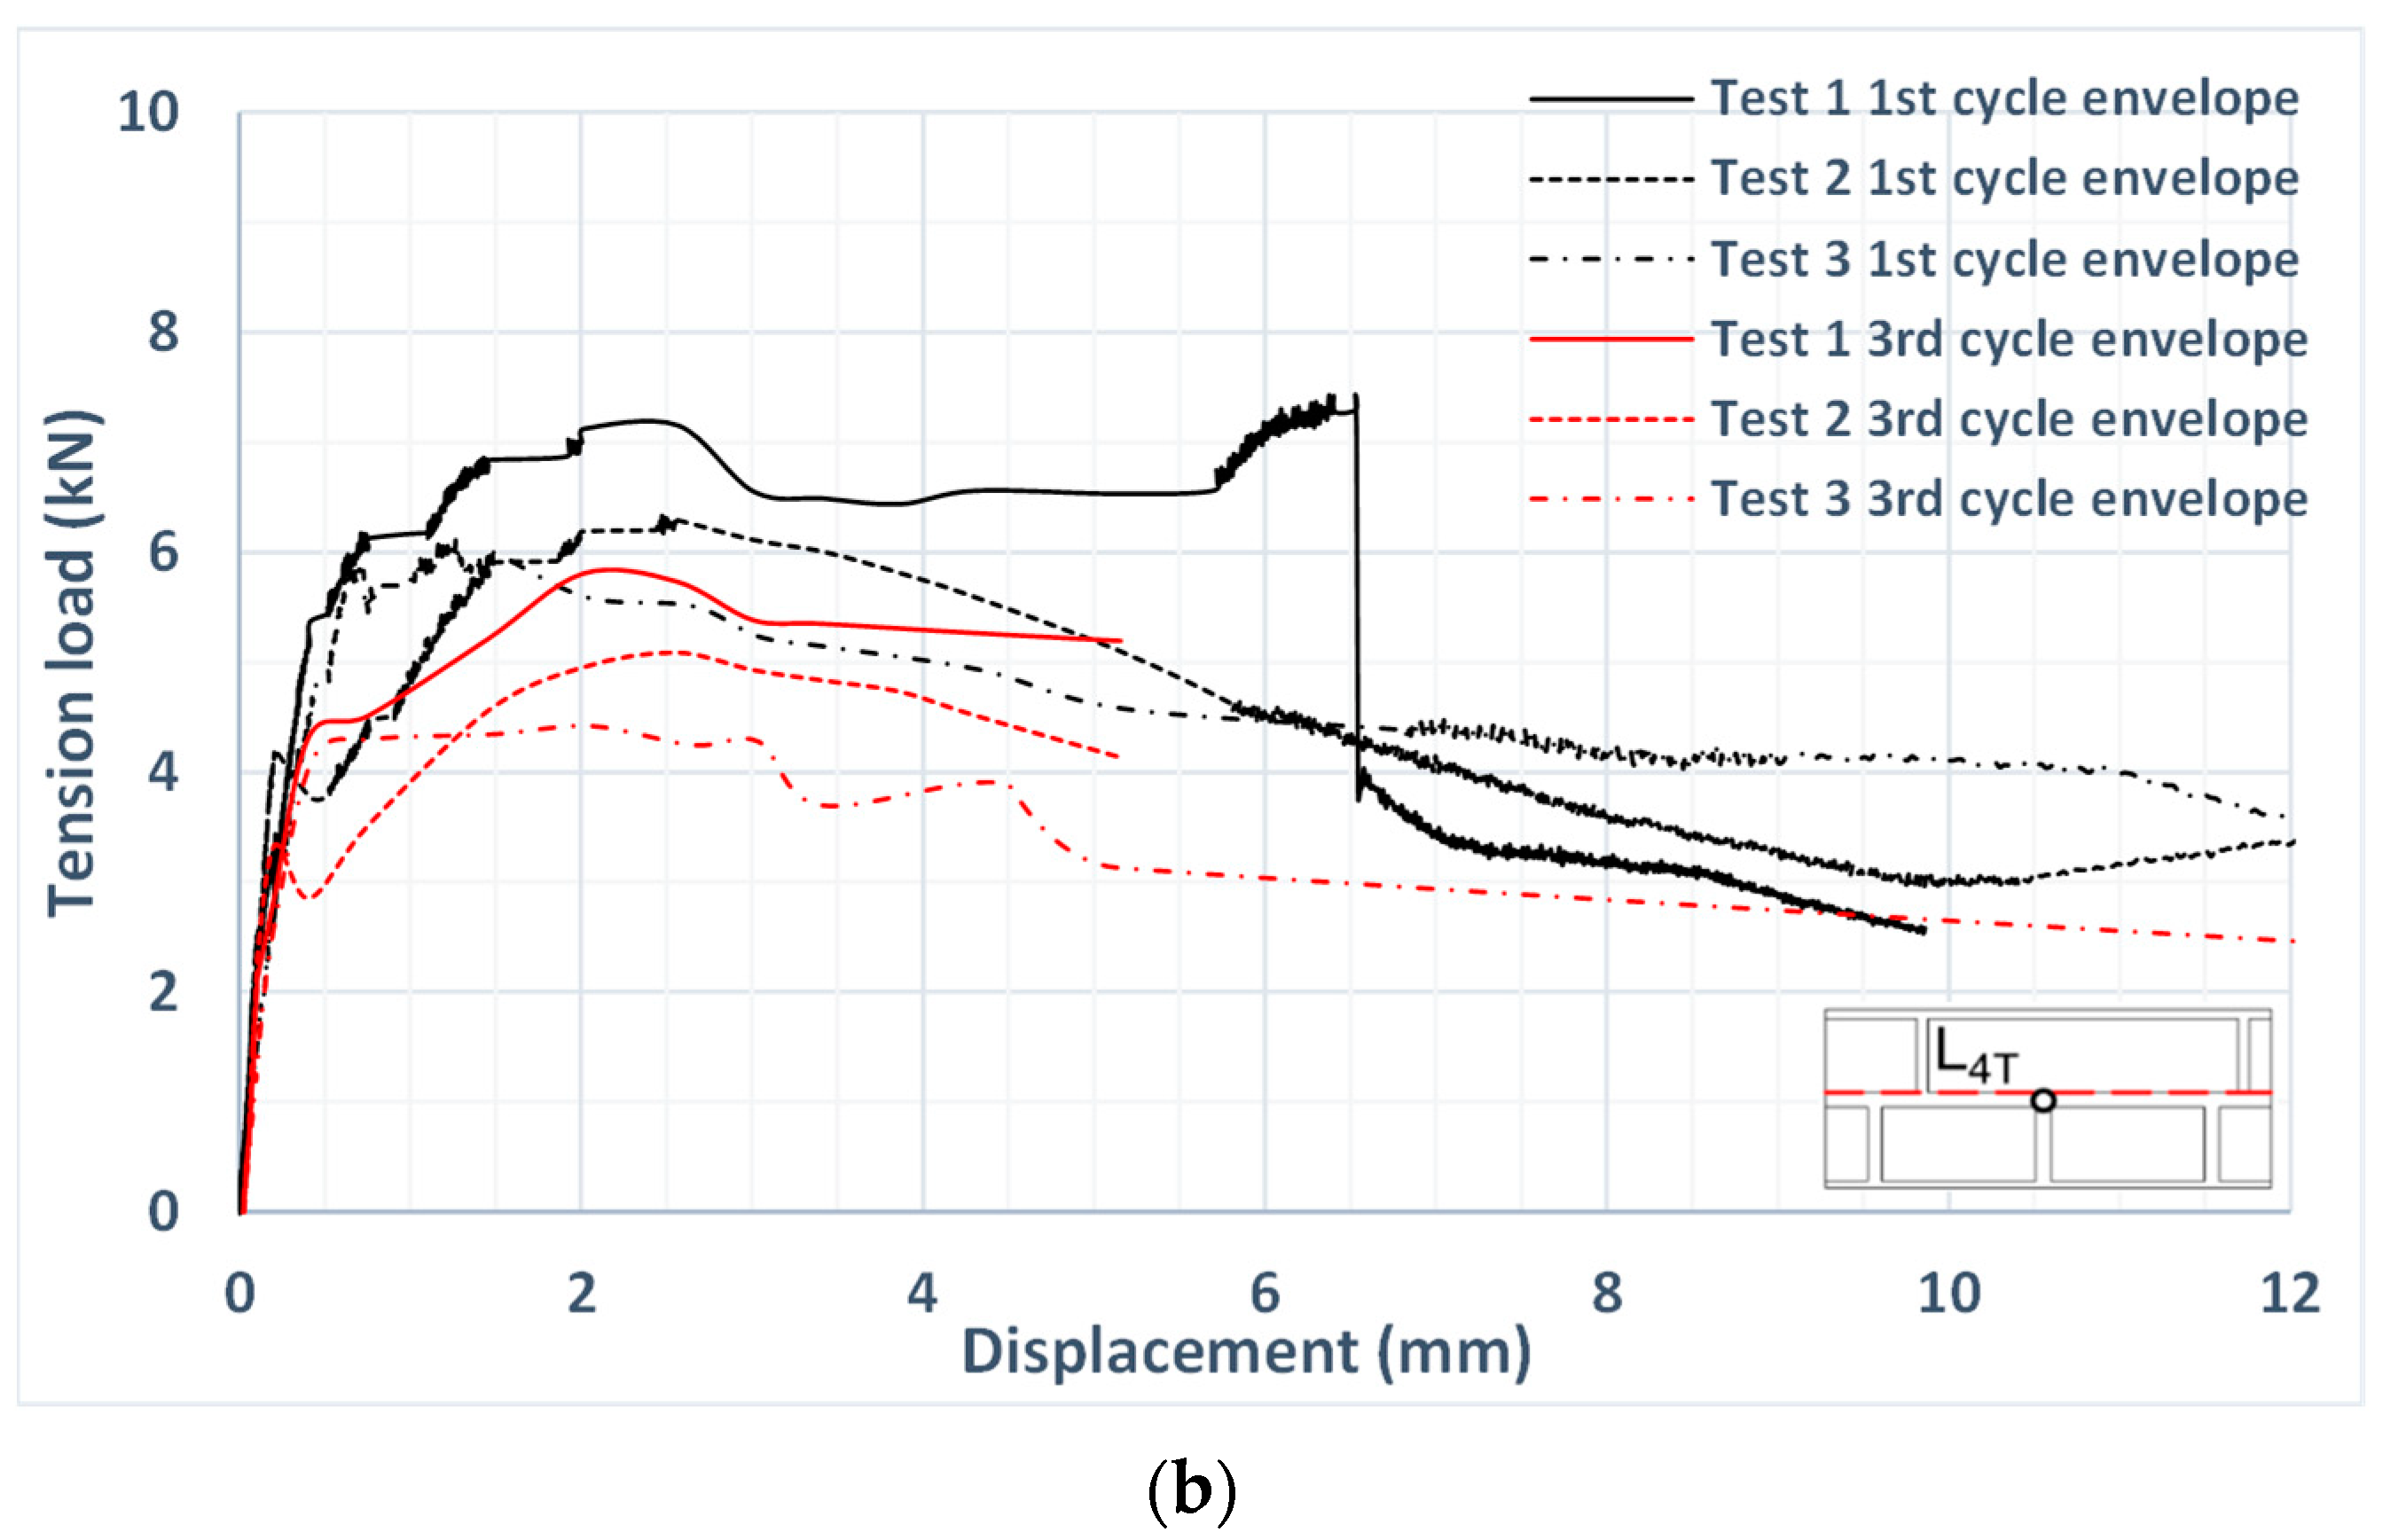
5.3.4. The Effect of Repeated Loading
6. Conclusions
- The mortar quality, and more specifically, its compressive strength, affects the behavior of anchors in tension. Indeed, anchors installed in masonry walls made with weak mortar exhibited reduced capacity compared to the ones installed in walls constructed with strong mortar. This reduction is not proportional to the compressive strength of the mortar; it is more likely proportional to its square root, i.e., proportional to the tensile strength of the mortar. On the other hand, the effect of masonry mortar quality depends on the anchor location (brick or mortar) and on the occurring failure modes. More specifically, the reduction of the tension resistance is more pronounced in the case of anchors installed in mortar joints than for anchors installed in bricks (average reduction factor equal to 0.50 and 0.70 for mortar joint and brick location, respectively). It was observed, however, that the difference between the two examined locations, in terms of the effect of the mortar quality seems to be reduced, when there is a crack either crossing the anchor or at its vicinity (reduction factor equal to 0.75 and 0.70 for mortar joint and brick location respectively). This shows that the effect of cracks governs the behavior of the anchors in tension.
- The presence of a crack, 0.50 mm wide, has led to a substantial reduction of the tension capacity of anchors for both tested locations (between 30% and 50%, depending on the anchor location and on the compressive strength of the masonry mortar), accompanied by an increase in the displacement corresponding to the attainment of the resistance. In parallel, the scatter of both resistance and corresponding displacement values is increased when the masonry is cracked.
- Before making the decision to limit the crack width to 0.50 mm, based on an assessment of the relevant literature, the effects of larger crack values were also investigated. As expected, regardless of the anchor location, the increase in the crack width leads to a decrease in the tension resistance, combined with a more pronounced scatter of the experimental tension resistance values.
- Anchors subjected to repeated loading have exhibited a moderate reduction of their tension resistance (by 20% approximately), both for brick and mortar locations.
- A significant observation is that the reduction of the tension capacity due to various adverse parameters, the increase in the displacement at tension resistance, as well as the effect of the investigated parameters on the scatter of the experimental results are closely related to the failure mode that takes place. It was observed that there is a variety of possible failure modes. Their effect can be interpreted, after testing, but their occurrence cannot be reliably predicted. Indeed, in addition to some basic failure modes (such as anchor or brick pull-out), further failure modes are observed, involving a smaller or larger portion of the mortar joint or the adjacent brick. Those failures seem to depend on the local conditions and, thus, they cannot be predicted on the basis of average characteristics of the materials or based on the construction typology of the wall.
Author Contributions
Funding
Institutional Review Board Statement
Informed Consent Statement
Data Availability Statement
Conflicts of Interest
References
- TR 054; Design Methods for Anchorages with Metal Injection Anchor and Screw Anchors for Use in Masonry. EOTA: Brussels, Belgium, 2016; Last amended July 2022.
- EAD330076-01-0604; Metal Injection Anchors for Use in Masonry. EOTA: Brussels, Belgium, 2021.
- Arifovic, F.; Nielsen, M.P. Strength of Anchors in Masonry; Byg Rapport; No. R-134; Technical University of Denmark: Kongens Lyngby, Denmark, 2006. [Google Scholar]
- Dizhur, D.; Campbell, J.; Schultz, A.; Ingham, J. Observations from the 2010/2011 Canterbury Earthquakes and Subsequent Experimental Pull-Out Test Program of Wall-to-Diaphragm Adhesive Connections. J. Struct. Eng. Soc. N. Z. 2013, 27, 11–20. [Google Scholar]
- NZSEE. Assessment and Improvement of the Structural Performance of Buildings in Earthquakes; New Zealand Society for Earthquake Engineering: Wellington, New Zealand, 2006. [Google Scholar]
- FEMA 547/2006; Techniques for the Seismic Rehabilitation of Existing Buildings 2006. FEMA: Washington, DC, USA, 2006.
- Giresini, L.; Puppio, M.L.; Taddei, F. Experimental pull-out tests and design indications for strength anchors installed in masonry walls. Mater. Struct. 2020, 53, 103. [Google Scholar] [CrossRef]
- Algeri, C.; Poverello, E.; Plizzari, G.; Giuriani, E. Experimental study on the injected anchors behaviour on historical masonry. Adv. Mater. Res. 2010, 133, 423–428. [Google Scholar] [CrossRef]
- Muñoz, R.; Lourenço, P.B.; Moreira, S. Experimental Results on Mechanical Behaviour of Metal Anchors in Historic Stone Masonry. Constr. Build. Mater. 2018, 163, 643–655. [Google Scholar] [CrossRef]
- Ramirez, R.; Muñoz, R.; Lourenço, P.B. On Mechanical Behavior of Metal Anchors in Historical Brick Masonry: Testing and Analytical Validation. Appl. Sci. 2023, 13, 3999. [Google Scholar] [CrossRef]
- Paganoni, S.; D’Ayala, D. Testing and design procedure for corner connections of masonry heritage buildings strengthened by metallic grouted anchors. Eng. Struct 2014, 70, 278–293. [Google Scholar] [CrossRef]
- Silveri, F.; Riva, P.; Profeta, G.; Poverello, E.; Algeri, C. Injected Anchors for The Seismic Retrofit of Historical Masonry Buildings: Experimental Study on Brick Masonry. In Proceedings of the SAHC2014—9th International Conference, Mexico City, Mexico, 14–17 October 2014. [Google Scholar]
- Cattaneo, S.; Vafa, N. Tensile Capacity of Adhesive Anchors in Damaged Masonry. Appl. Sci. 2021, 11, 10135. [Google Scholar]
- Mirra, M.; Ravenshorst, G.; de Vries, P.; Messali, F. Experimental characterisation of as-built and retrofitted timber-masonry connections under monotonic, cyclic and dynamic loading. Constr. Build. Mater. 2022, 358, 129446. [Google Scholar] [CrossRef]
- Burton, C.; Visintin, P.; Griffith, M.; Vaculik, J. Laboratory investigation of pull-out capacity of chemical anchors in individual new and vintage masonry units under quasi-static, cyclic and impact load. In Structures; Elsevier: Amsterdam, The Netherlands, 2021; Volume 34, pp. 901–930. [Google Scholar]
- Ceroni, F.; Di Ludovico, M. Traditional and innovative systems for injected anchors in masonry elements: Experimental behavior and theoretical formulations. Constr. Build. Mater. 2020, 254, 119178. [Google Scholar] [CrossRef]
- Eligehausen, R.; Mallée, R.; Silva, J. Anchorage in Concrete Construction; Ernst & Sohn: Berlin, Germany, 2006. [Google Scholar]
- Meyer, A. Zum Tragverhalten von Injektionsdübeln in Mauerwerk. Ph.D. Thesis, Universität Stuttgart, Stuttgart, Germany, 2006. [Google Scholar]
- ETA-19/0160; Hilti HIT-HY 270 with HAS-U. Metal Injection Anchors for Use in Masonry. DIBt: Berlin, Germany, 2019.
- EAD 330499-01-0601; Bonded Fasteners for Use in Concrete. EOTA: Brussels, Belgium, 2018.
- Vintzileou, E.; Tselios, I.; Karagiannaki, D. Quantification of damage to masonry structures under seismic conditions. In Proceedings of the 17th International Brick and Block Masonry Conference, IBMAC, Kraków, Poland, 5–8 July 2020. [Google Scholar]
- ASCE 41; Seismic Evaluation and Retrofit of Existing Buildings: ASCE/SEI, 41–17. American Society of Civil Engineers Institute, Structural Engineering: Reston, VA, USA, 2017.
- SEAOC Vision. Performance-Based Seismic Engineering; Structural Engineers Association of California: Sacramento, CA, USA, 2000. [Google Scholar]
- FEMA-356; Prestandard and Commentary for the Seismic Rehabilitation of Buildings. ASCE: Washington, DC, USA, 2000.
- ACI374.2R-13; Guide for Testing Reinforced Concrete Structural Elements under Slowly Applied Simulated Seismic Loads. American Concrete Institute Committee: Farmington Hills, MI, USA, 2013.


| (a) | ||||||
| Construction Phase | Phase 1 | Phase 2.1 | Phase 2.2 | Phase 2.3 | Phase 3.1 | Phase 3.2 |
| fmc, min (MPa) | - | 2.81 | 1.88 | 1.75 | 2.01 | 2.25 |
| fmc, max (MPa) | - | 7.63 | 3.48 | 2.72 | 5.12 | 3.54 |
| fmc, mean (MPa) | 3.42 | 4.53 | 2.84 | 2.29 | 3.41 | 2.89 |
| CoV (%) | 16.91 | 36.27 | 11.79 | 13.45 | 26.92 | 13.34 |
| (b) | ||||||
| Construction Phase | Phase 1 | Phase 2.1 | Phase 2.2 | |||
| fmc, min (MPa) | - | 21.34 | 10.11 | |||
| fmc, max (MPa) | - | 29.13 | 27.26 | |||
| fmc, mean (MPa) | 17.78 | 26.31 | 17.01 | |||
| CoV (%) | 24.93 | 6.93 | 35.25 | |||
| Threaded Rod M12 | ||
|---|---|---|
| Nominal diameter of drill bit, d0 (mm) | 14 | |
| Drill hole depth = embedment depth, h0 = hef (mm) | 50…300 | |
| Maximum diameter of clearance hole in the fixture, dr (mm) | 14 | |
| Minimum wall thickness, hmin (mm) | h0 + 30 | |
| Brush HIT-RB | 14 | |
| Maximum torque moment, Tmax (Nm) | 10 | |
 | ||
| Type of wallette–Number of wall specimens and phase within the program *–Number of tests on the same wallette–Type of loading and loading protocol–Crack width (mm)–Value of normal stress (MPa)–Anchor location (Number of test/total number of identical tests) |
| Type of Wallette: SS: Solid bricks with strong mortar SW: Solid bricks with weak mortar |
| Protocol: PM: Monotonic test PS: Repeated test according to the displacement-based loading protocol |
| Crack width: 0.30–0.50–0.60–0.80–1.20 mm |
| Anchor location: L1: uncracked brick/uncracked mortar joint L3T: uncracked T-mortar joint L4T: cracked T-mortar joint (intersection of horizontal and vertical mortar joint) L6: uncracked brick with an adjacent cracked horizontal mortar joint |
| Example: SS4b-Test1-PM-0.50-0.20-L4T(1/3) The test was performed on an anchor installed in a wall made with solid bricks and strong mortar (SS). It was the fourth (4) wallette of the second (b) phase of the program. It was the first test on the wall (Test 1), performed under monotonic loading (PM). The crack width was equal to 0.50 mm and the normal stress applied on the wall was equal to 0.20 MPa. The location was cracked T-joint (L4T). It was the first out of three identical tests (1/3). |
| Failure Mode | Description | Percentage of Occurrence (%) |
|---|---|---|
| AP | Anchor pull-out | 10 |
| APM | Anchor pull-out with parts of the adjacent mortar joints | 77 |
| APB | Anchor pull-out with parts of the adjacent mortar joints and breakout cone of the adjacent brick | 13 |
| Failure Mode | Description | Percentage of Occurrence (%) |
|---|---|---|
| BC | Brick breakout cone | 11 |
| SBC | Shallow brick breakout cone with anchor pull-out and pull-through failure | 3 |
| BP | Brick pull-out failure | 56 |
| BS | Brick splitting followed by anchor pull-through | 30 |
| Test Name/Location | Mortar fmc,mean (MPa) | Crack Width (mm) | FRu (kN) | Mean Value per Series | CoV (%) | dFRu (mm) | Mean Value per Series | CoV (%) | Failure Mode |
|---|---|---|---|---|---|---|---|---|---|
| SS1-Test2-PM-0-0.20-L1(1/6) | 26.70 | 2.22 | BS/BP | ||||||
| SS2-Test3-PM-0-0.20-L1(2/6) | 55.80 | 0.90 | BC | ||||||
| SS2-Test4-PM-0-0.20-L1(3/6) | 17.78 | Uncracked | 46.85 | 33.84 | 42.78 | 0.60 | 1.19 | 77.72 | BC/BS |
| SS3-Test3-PM-0-0.20-L1(4/6) | 21.95 | 2.49 | BS/BP | ||||||
| SS3-Test4-PM-0-0.20-L1(5/6) | 19.67 | 0.55 | BP | ||||||
| SS4-Test1-PM-0-0.20-L1(6/6) | 32.06 | 0.37 | BC | ||||||
| SS1b-Test1-PM-0-0.20-L3T(1/3) | 39.79 | 0.81 | APB | ||||||
| SS1b-Test2-PM-0-0.20-L3T(2/3) | 26.31 | Uncracked | 44.49 | 41.08 | 7.25 | 0.62 | 0.64 | 26.02 | APM |
| SS1b-Test3-PM-0-0.20-L3T(3/3) | 38.97 | 0.48 | APB | ||||||
| SS4b-Test1-PM-0.50-0.20-L4T(1/3) | 16.06 | 4.88 | AP | ||||||
| SS4b-Test2-PM-0.50-0.20-L4T(2/3) | 26.31 | 0.50 | 17.30 | 18.86 | 20.32 | 0.46 | 2.46 | 90.89 | APΜ |
| SS4b-Test3-PM-0.50-0.20-L4T(3/3) | 23.23 | 2.05 | APB | ||||||
| SS3b-Test1-PM-0.50-0.20-L6(1/3) | 18.11 | 0.34 | ΒP | ||||||
| SS3b-Test2-PM-0.50-0.20-L6(2/3) | 26.31 | 0.50 | 16.85 | 17.98 | 5.96 | 7.41 | 2.76 | 145.95 | BP |
| SS3b-Test3-PM-0.50-0.20-L6(3/3) | 18.98 | 0.53 | BP | ||||||
| SW1-Test3-PM-0-0.20-L1(1/4) | 19.65 | 1.4 | BS/BP | ||||||
| SW1-Test4-PM-0-0.20-L1(2/4) | 3.42 | Uncracked | 23.37 | 23.28 | 22.01 | 0.19 | 0.53 | 110.49 | BS |
| SW2-Test4-PM-0-0.20-L1(3/4) | 19.61 | 0.24 | BS/BP | ||||||
| SW3-Test1-PM-0-0.20-L1(4/4) | 30.50 | 0.28 | BS | ||||||
| SW1b-Test1-PM-0-0.20-L3T(1/3) | 21.52 | 0.25 | APΒ | ||||||
| SW1b-Test2-PM-0-0.20-L3T(2/3) | 4.53 | Uncracked | 19.45 | 19.75 | 8.31 | 1.17 | 1.66 | 103.05 | APΜ |
| SW1b-Test3-PM-0-0.20-L3T(3/3) | 18.28 | 3.57 | APΜ | ||||||
| SW8b-Test2-PM-0.30-0.20-L4T(1/3) | 19.22 | 13.18 | AP | ||||||
| SW10b-Test2-PM-0.30-0.20-L4T(2/3) | 4.53 | 0.30 | 10.44 | 13.42 | 37.46 | 0.60 | 4.86 | 148.11 | APΜ |
| SW10b-Test3-PM-0.30-0.20-L4T(3/3) | 10.59 | 0.81 | APΜ | ||||||
| SW6b-Test1-PM-0.50-0.20-L4T(1/3) | 13.48 | 1.83 | APM | ||||||
| SW6b-Test2-PM-0.50-0.20-L4T(2/3) | 4.53 | 0.50 | 17.64 | 14.14 | 22.74 | 2.57 | 4.27 | 84.48 | APΜ |
| SW6b-Test3-PM-0.50-0.20-L4T(3/3) | 11.31 | 8.42 | APΜ | ||||||
| SW18c-Test1-PM-0.50-0.20-L4T(1/3) | 9.17 | 2.08 | APM | ||||||
| SW18c-Test2-PM-0.50-0.20-L4T(2/3) | 2.89 | 0.50 | 6.44 | 7.21 | 23.72 | 2.66 | 2.78 | 27.43 | APΜ |
| SW18c-Test3-PM-0.50-0.20-L4T(3/3) | 6.02 | 3.59 | APΜ | ||||||
| SCW14-Test1-PM-0.30-0.20-L4T(1/3) | 13.59 | 1.78 | APM | ||||||
| SW2b-Test2-PM-0.30-0.20-L4T(2/3) | 4.53 | 0.60 | 10.68 | 11.09 | 20.94 | 0.62 | 1.82 | 67.22 | APΜ |
| SW2b-Test3-PM-0.30-0.20-L4T(3/3) | 9.00 | 3.07 | APΜ | ||||||
| SW11b-Test1-PM-0.80-0.20-L4T(1/4) | 7.78 | 0.87 | APM | ||||||
| SW12b-Test1-PM-0.80-0.20-L4T(2/4) | 2.84 | 0.80 | 8.39 | 8.34 | 46.68 | 0.88 | 2.16 | 78.20 | APΜ |
| SW12b-Test3-PM-0.80-0.20-L4T(3/4) | 3.85 | 2.45 | APM | ||||||
| SW12b-Test3-PM-0.80-0.20-L4T(4/4) | 13.34 | 4.43 | APΜ | ||||||
| SW19b-Test2-PM-1.20-0.20-L4T(1/3) | 8.41 | 0.21 | APM | ||||||
| SW19b-Test3-PM-1.20-0.20-L4T(2/3) | 2.29 | 1.20 | 9.71 | 7.63 | 33.47 | 0.32 | 0.24 | 31.15 | APΜ |
| SW20b-Test1-PM-1.20-0.20-L4T(3/3) | 4.78 | 0.18 | APΜ | ||||||
| SW4b-Test1-PM-0.30-0.20-L6(1/3) | 19.38 | 0.72 | BP | ||||||
| SW4b-Test2-PM-0.30-0.20-L6(2/3) | 4.53 | 0.30 | 24.52 | 20.60 | 16.89 | 1.24 | 0.88 | 35.01 | BP |
| SW4b-Test3-PM-0.30-0.20-L6(3/3) | 17.89 | 0.69 | BP | ||||||
| SW8b-Test1-PM-0.50-0.20-L6(1/3) | 16.62 | 1.15 | BP | ||||||
| SW8b-Test3-PM-0.50-0.20-L6(2/3) | 4.53 | 0.50 | 8.18 | 12.31 | 34.32 | 1.37 | 1.24 | 9.30 | BP |
| SW9b-Test1-PM-0.50-0.20-L6(3/3) | 12.12 | 1.20 | BP | ||||||
| SW15b-Test1-PM-0.80-0.20-L6(1/3) | 9.01 | 2.97 | BP | ||||||
| SW15b-Test2-PM-0.80-0.20-L6(2/3) | 2.84 | 0.80 | 6.81 | 8.86 | 14.94 | 1.22 | 1.48 | 93.66 | BP |
| SW16b-Test1-PM-0.80-0.20-L6(3/3) | 8.86 | 0.24 | BP |
| Test Name/Location | Mortar fmc,mean (MPa) | Crack Width (mm) | FRu, 1st cycle (kN) | dFRu, 1st cycle (mm) | FRu, 3rd cycle (kN) | dFRu, 3rd cycle (mm) | FRu,3/FRu,1 | Failure Mode |
|---|---|---|---|---|---|---|---|---|
| SW20c-Test1-PS-0.50-0.20-L4T(1/3) | 7.43 | 6.53 | 5.80 | 2.01 | 0.78 | APM | ||
| SW20c-Test2-PS-0.50-0.20-L4T(2/3) | 2.89 | 0.50 | 6.33 | 2.47 | 5.09 | 2.56 | 0.80 | AP |
| SW20c-Test3-PS-0.50-0.20-L4T(3/3) | 6.12 | 1.27 | 4.42 | 2.06 | 0.72 | APΜ | ||
| Mean value | 6.63 | 3.42 | 5.10 | 2.21 | 0.77 | |||
| CoV (%) | 10.62 | 80.52 | 13.52 | 13.76 | ||||
| SW4-Test3-PM-0-0.20-L1(1/3) | 14.57 | 0.19 | 11.11 | 0.104 | 0.76 | BP | ||
| SW4-Test4-PM-0-0.20-L1(2/3) | 3.41 | Uncracked | 29.60 | 0.30 | 21.49 | 0.37 | 0.73 | BS/SBC |
| SW4-Test1-PM-0-0.20-L1(3/3) | 13.90 | 0.90 | 11.59 | 0.21 | 0.85 | BS/BP | ||
| Mean value | 19.36 | 0.46 | 14.73 | 0.23 | 0.78 | |||
| CoV (%) | 45.85 | 82.48 | 39.78 | 58.73 |
Disclaimer/Publisher’s Note: The statements, opinions and data contained in all publications are solely those of the individual author(s) and contributor(s) and not of MDPI and/or the editor(s). MDPI and/or the editor(s) disclaim responsibility for any injury to people or property resulting from any ideas, methods, instructions or products referred to in the content. |
© 2023 by the authors. Licensee MDPI, Basel, Switzerland. This article is an open access article distributed under the terms and conditions of the Creative Commons Attribution (CC BY) license (https://creativecommons.org/licenses/by/4.0/).
Share and Cite
Tselios, I.; Vintzileou, E.; Karagiannaki, D.; Christidis, K.; Palieraki, V.; Welz, G. Anchors to Solid Clay Brick Masonry in Tension: Behavior under Monotonic and Repeated Loading for Constant Embedment Depth. Appl. Sci. 2023, 13, 12917. https://doi.org/10.3390/app132312917
Tselios I, Vintzileou E, Karagiannaki D, Christidis K, Palieraki V, Welz G. Anchors to Solid Clay Brick Masonry in Tension: Behavior under Monotonic and Repeated Loading for Constant Embedment Depth. Applied Sciences. 2023; 13(23):12917. https://doi.org/10.3390/app132312917
Chicago/Turabian StyleTselios, Ioulios, Elizabeth Vintzileou, Despina Karagiannaki, Konstantinos Christidis, Vasiliki Palieraki, and Georg Welz. 2023. "Anchors to Solid Clay Brick Masonry in Tension: Behavior under Monotonic and Repeated Loading for Constant Embedment Depth" Applied Sciences 13, no. 23: 12917. https://doi.org/10.3390/app132312917
APA StyleTselios, I., Vintzileou, E., Karagiannaki, D., Christidis, K., Palieraki, V., & Welz, G. (2023). Anchors to Solid Clay Brick Masonry in Tension: Behavior under Monotonic and Repeated Loading for Constant Embedment Depth. Applied Sciences, 13(23), 12917. https://doi.org/10.3390/app132312917