Article

A Microalgae Photobioreactor System for Indoor Air Remediation: Empirical Examination of the CO2 Absorption Performance of Spirulina maxima in a NaHCO3-Reduced Medium

1
Spirulinafarms Ltd., Bitgaram-ro, Naju-si 58211, Jeollanam-do, Republic of Korea
2
Independent Researcher, 3F, 28, Yongmeori-gil, Gimcheon-si 18487, Gyeongsangbuk-do, Republic of Korea
3
Department of Architecture, Kyung Hee University, 1732 Deogyeong-daero, Yongin-si 17104, Gyeonggi-do, Republic of Korea
4
Department of Architecture, School of Engineering, Ajou University, 206 World cup-ro, Yeongtong-gu, Suwon-si 443749, Gyeonggi-do, Republic of Korea
*
Author to whom correspondence should be addressed.
Appl. Sci. 2023, 13(24), 12991; https://doi.org/10.3390/app132412991
Submission received: 16 October 2023 / Revised: 22 November 2023 / Accepted: 26 November 2023 / Published: 5 December 2023
(This article belongs to the Section Green Sustainable Science and Technology)

Abstract

:
Microalgae-based photobioreactors (PBRs) have gained attention as a sustainable solution for indoor air quality (IAQ) control. This study investigates indoor CO2 absorption performance of Spirulina maxima (S. maxima) in NaHCO3-limited cultivation (standard: NaHCO3-free medium = 1:1 v/v%) of a lab-scale PBR system. Cultivation performance of three medium amendments (standard, 50% NaHCO3, and NaHCO3-free) was compared by observing cell growth for 30 days in a controlled environment. Empirical examinations were conducted to evaluate the algal CO2 uptake, and overall system performance in the culture volumes of 2, 4, and 7 L and natural indoor CO2 concentration of ~1100 ppm. We found CO2 was reduced by ~55%, in an air chamber of 0.064 m3, showing the greatest mitigation rate (~20%) on Day 4. Under a high concentration of CO2 (10,000 ppm), the CO2 levels were decreased up to ~90% before saturation. This research provides valuable insights into the development of S. maxima-activated IAQ control systems for airtight buildings.

1. Introduction

1.1. Background Problems in Indoor CO2 Mitigation

Indoor air quality (IAQ) can be 3–100 times worse than the outdoor air, due to the concentration of assorted gaseous pollutants [1,2]. In IAQ indication of building space, carbon dioxide (CO2), which represents 60~85% of greenhouse gas (GHG), is considered among the most significant air constituents that impact occupant safety, work productivity, and well-being in the spatial environment [3]. Therefore, it is needed to find active, lower-risk, and economically more sustainable building solutions to dilute indoor CO2 and improve air sterility.
Technical methods to reduce CO2 largely include (i) pollutant source control, (ii) increased ventilation, and (iii) indoor air purification. Regarding (i) and (ii), it is straightforward to manage indoor CO2 levels adequately by developing monitoring systems and refreshing the air readily at exact source positions. However, it becomes suboptimal in practice because CO2 is emitted with random living activities and metabolic respiration. Especially in densely occupied buildings, it is almost impossible to prevent CO2 concentration through direct source management due to the complex spatial air streaming. In effect, natural/forced-air ventilation performance highly depends on outdoor atmospheric composition [4] and often becomes very expensive due to the extra energy demand for air conditioning. The recent energy-oriented building system operation tends to risk IAQ deterioration, as recirculated indoor air may convey an excessive level of CO2 [5]. Poor building design and improper system planning may have indoor space vulnerable to air contamination. Meanwhile, non-ventilation decarbonizing technologies [6,7,8] such as the ionized absorber-based indoor air cleaning by means of physical/chemical scrubbing can be considered [9,10,11]. Nevertheless, it is not always more effective than mechanical air filtering, since its efficiency depends on the CO2 concentration, size, and type of ionizer, and the ventilation rate of the area being treated. Most oxidation technologies are tailored to remove volatile organic compounds (VOCs) because CO2 is a stable compound that does not readily react with oxygen in air streams. It is also important to note that those methods are affected by degradation of the absorbents, corrosion, and high pressure drop [12,13]. Many existing air cleaning systems based on the traditional physicochemical remediation often significantly suffer from drawbacks of a high installation/maintenance expense and generation of secondary gas pollutants [14,15,16].
To overcome the above limitations, biological air remediation using plants and microorganisms (phytoremediation) has drawn attention recently [17,18,19]. For example, in the phytoremediation that uses the metabolic ability of living plants to catabolize and detoxify contaminated compounds [20], Sansevieria (Snake plant) can absorb CO2 at ~0.49 ppm/m3 [21], and, in a closed chamber (1 m3), house plants can reduce CO2 to 17~24% [22], up to 51~77% by combining ventilation [23]. Nevertheless, there still exist unavoidable obstacles in actual implementation: large planting areas, constant fertilization and irrigation, potential generation of toxic byproducts, daytime CO2 accumulation from the soil substrate, etc. Irga et al. [24] report that a leaf area of 57 m2 absorbs only 13% of CO2 generated per person.

1.2. Microalgae-Based Air Remediation

Microalgae provide an alternative solution for biological IAQ improvement [13,25,26,27,28,29]. This method is highly advantageous because of very little energy use for algae growth (10 to 50 g/m2/day, doubling the mass every 24 h [27]) and faster carbon removal due to the high cellular photosynthetic efficiency (~12%) [30]. It is reported that microalgae are approximately 50 times more efficient than terrestrial plants in CO2 reduction [31] and reduce CO2 emissions up to 85% [31]. Also, keeping and growing generic algae do not necessarily require complicated equipment or expensive conditions. Natural abundance, low investment cost, ecological adaptivity, and rapid renewability have algae among the most promising organisms for environmental air remediation [32,33].
Microalgae-derived air cleaners are emerging in consumer products. AlgenAir, Inc., founded by Fucich and Abernathy in Pittsburgh, PA, USA, in 2018, launched a home algae air-purifying device, the aerium 3.0 [34]. Its simple design with an algae subscription service makes it convenient for ordinary occupants to install, use, and repair. The LIQUID3, developed by the University of Belgrade in Serbia, 2021 [35], is the first large-scale algal photobioreactor that is supposed to resolve urban air pollution. Furthermore, Hypergiant, Inc. (Austin, TX, USA) [36] in the U.S. claims to employ artificial intelligence (AI) for optimal algae growth and HVAC system integration.

1.3. Research Question: Spirulina for CO2 Removal and NaHCO3-Reduced Cultivation

At present, microalgae species have been explored for their direct carbon assimilating potential [37,38]. Among the myriad 70,000 algae species, one of the most studied is Spirulina because they are part of the largest taxonomic groups and the massive biomass is industrially producible even in inorganic/heterotrophic culture media [39,40]. Spirulina (Arthrospira), a genus of photosynthetic cyanobacteria, are a filamentous and free-floating biomass that can photoautotrophically thrive in mineral-rich aquatic surfaces with high pH (8~10) and carbonate substances. Spirulina vary in their CO2 capture performance according to their species and culture conditions, but they generally have excellent photosynthetic efficiency, high tolerance against environmental perturbation, and the ability to absorb substantial amounts of CO2 from the atmosphere. In de Morais and Costa’s study [41], 415 mg of CO2/L/d was processed by Spirulina sp. at ~12% of CO2 concentration. In Cheng et al.’s study [42], Spirulina sp. absorbed up to 27 to 38% CO2. Some researchers suggest that Chlorella sp. is the most appropriate for CO2 mitigation [28,43], but the choice of the best algae species depends on the purpose of use and growing conditions. For example, the biomass of C. vulgaris and S. plantensis is 251.64 and 318.16 mg/L/day, respectively [44], and S. maxima carries a very high amount of protein (60~71% [38]). Considering that algae can fix about two times greater CO2 than its biomass, it indicates that Spirulina may outperform other species in growth and bio-productivity [45]. Indeed, Shabani et al. [46] revealed that the CO2 sequestration rate of S. platensis was about three times greater (0.49 g/L/d) than other microalgae in natural water at 10% CO2 supply.
These advantages make Spirulina bioreactors a strongly viable option to support/replace the conventional building systems. However, the biochemical complexity of the cultivation medium and complicated growth kinetics thereof become a major barrier to public spread of the microalgal photobioreactors. The Spirulina cultures generally need alkalinity (pH), inorganic salts, nitrogen, and especially a high amount of carbon dioxide sources (CO2, HCO3, etc.), and it often increases cost in enclosed culture systems, since NaHCO3 takes the largest portion in the standard Society of Toxicology (SOT) medium (~76%) [47]. The need for regular replenishment and adjustment of the chemical composition to meet the optimal nutritional requirements becomes a limiting factor in their public use. To settle this challenge, a few researchers [13,48] demonstrate that CO2 added by external aeration substitutes for the inorganic carbon supply from sodium bicarbonate (NaHCO3). Although NaHCO3 is a readily available form of CO2 for Spirulina’s photosynthesis, exploiting CO2 through mechanical aeration can be a more renewable and controlled alternative for the bioreactors, reducing cost and potential contamination associated with the sodium content.

1.4. Study Objectives

To fill the gap in the indoor CO2-cleaning performance of the S. maxima genus [49] and the problem in the agal medium of the Spirulina phytoremediation (Figure 1), we hypothesized that NaHCO3-reduced SOT amendment can provide an economical and convenient method to improve IAQ, based on da Rosa [13]’s finding. To examine the S. maxima growth and indoor CO2 removal effectiveness in a NaHCO3-reduced (by 50%) medium, we devised a low-cost custom-designed photobioreactor. CO2 removal through S. maxima respiration is empirically examined using a comparative analysis and field measurements within a controlled environment. This study presents scientific evidence on the air purification function of S. maxima according to the growth and development in a biochemically constrained culture medium. Note that this study limited its scope to the experimental results of the presented S. maxima cultivation and air system operation, and the removal efficiency of organic pollutants or byproduct gases was not covered.

2. Materials and Methods

2.1. Material and Culture Preparation: Algal Strain, Growth Medium, and Inoculum

S. maxima (LB2340, UTEX) was selected. The S. maxima strains of ~2 v/v% (150 mL) were subcultured in our lab for 5 days in a modified SOT medium (7.5 L), based on the standard nutrient composition (g/L H2O): K2HPO4 (0.5), NaNO3 (2.5), K2SO4 (1), NaCl (1), MgSO4∙7H2O (0.2), CaCl2∙2H2O (0.04), FeSO4∙7H2O (0.01), and C10H16N2O8 (0.8) with an A5 solution (H3BO3 (2.86), MnSO4·7H2O (2.5), ZnSO4·7H2O (0.222), CuSO4·5H2O (0.079), Na2MoO4·2H2O (0.021)) [50] (results of the empirical media synthesis are presented in Section 3.1). Note purified tap water (20~21 °C) was used without distillation or extra boiling to consider potential massive economic processing of Spirulina cultivation. For sterilization, we irradiated the water with ultraviolet rays (UVC and UVA) for 45 min at 23~28 °C. Dissolved inorganic carbon (DIC) in the medium was ~0.5 mol/L, and the initial pH of the medium was 9.5~9.8 and it was settled at a level between 10 and 10.5. For cost-effective algal growth, we prepared a modified SOT solution (7.5 L) in which NaHCO3 was cleared to allow atmospheric carbon dioxide to dissolve naturally, reducing the medium production cost, and then it was inoculated with 7.5 L of the SOT-cultured S. maxima at a 1:1 ratio.

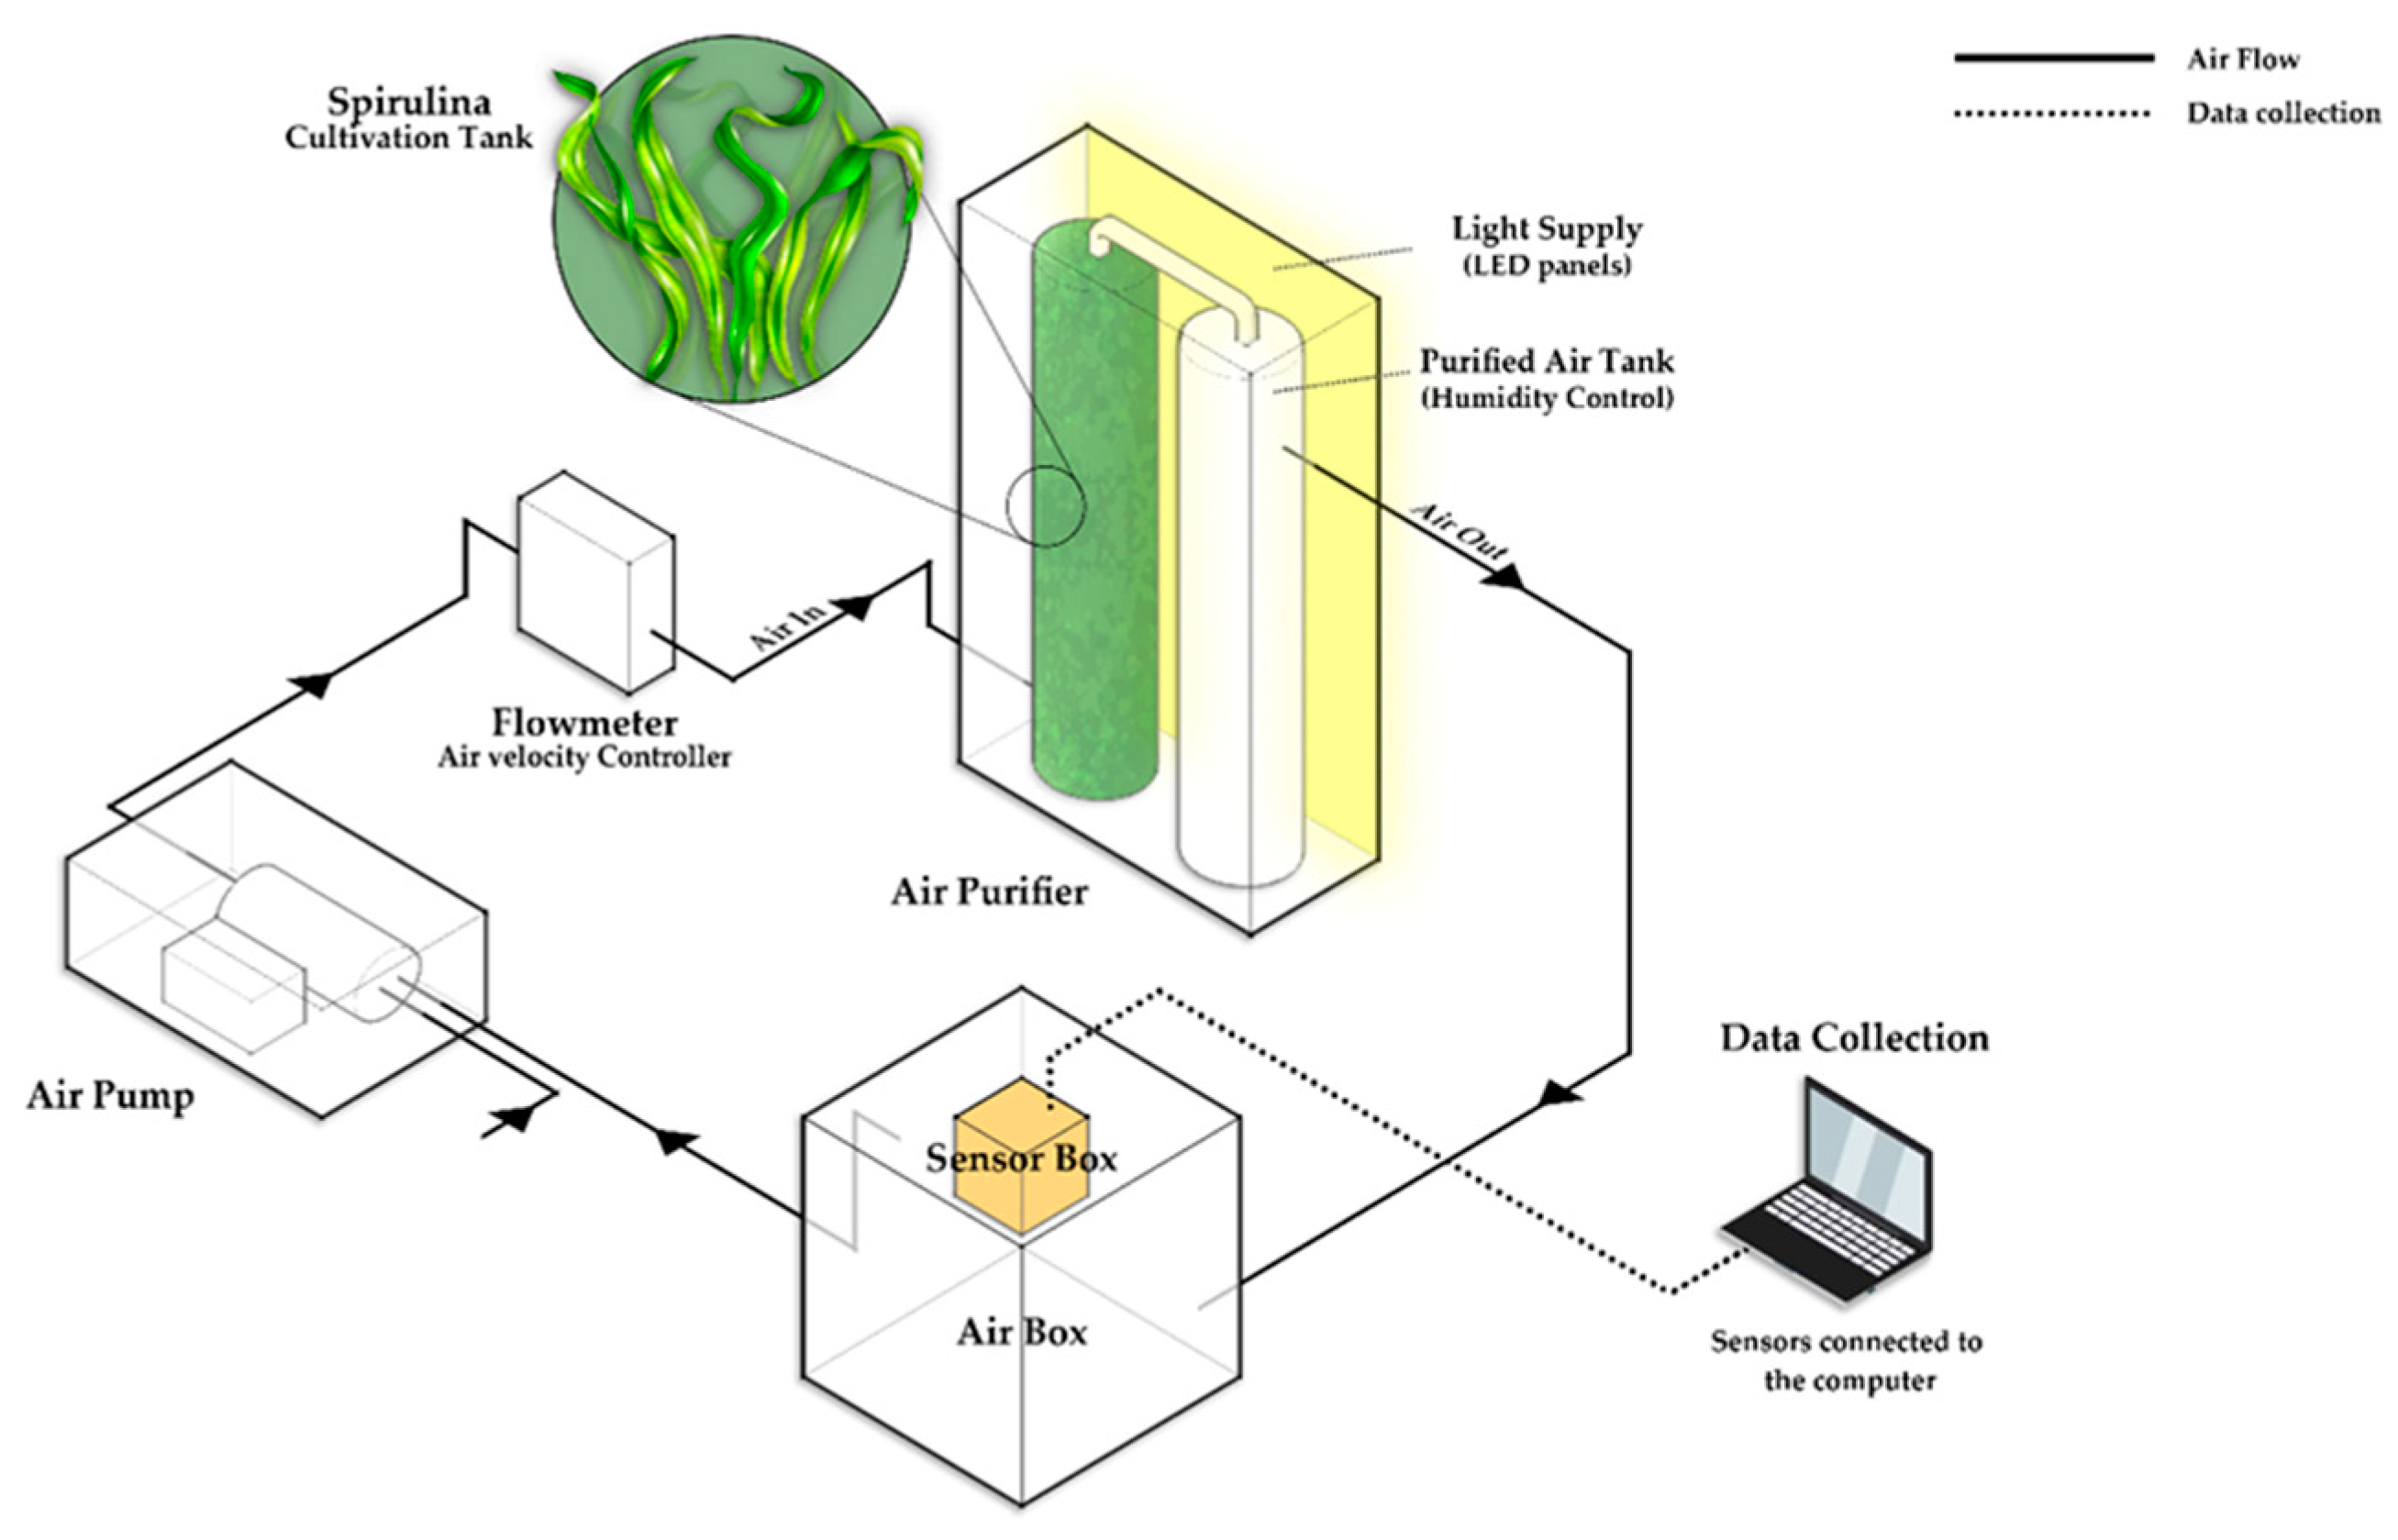
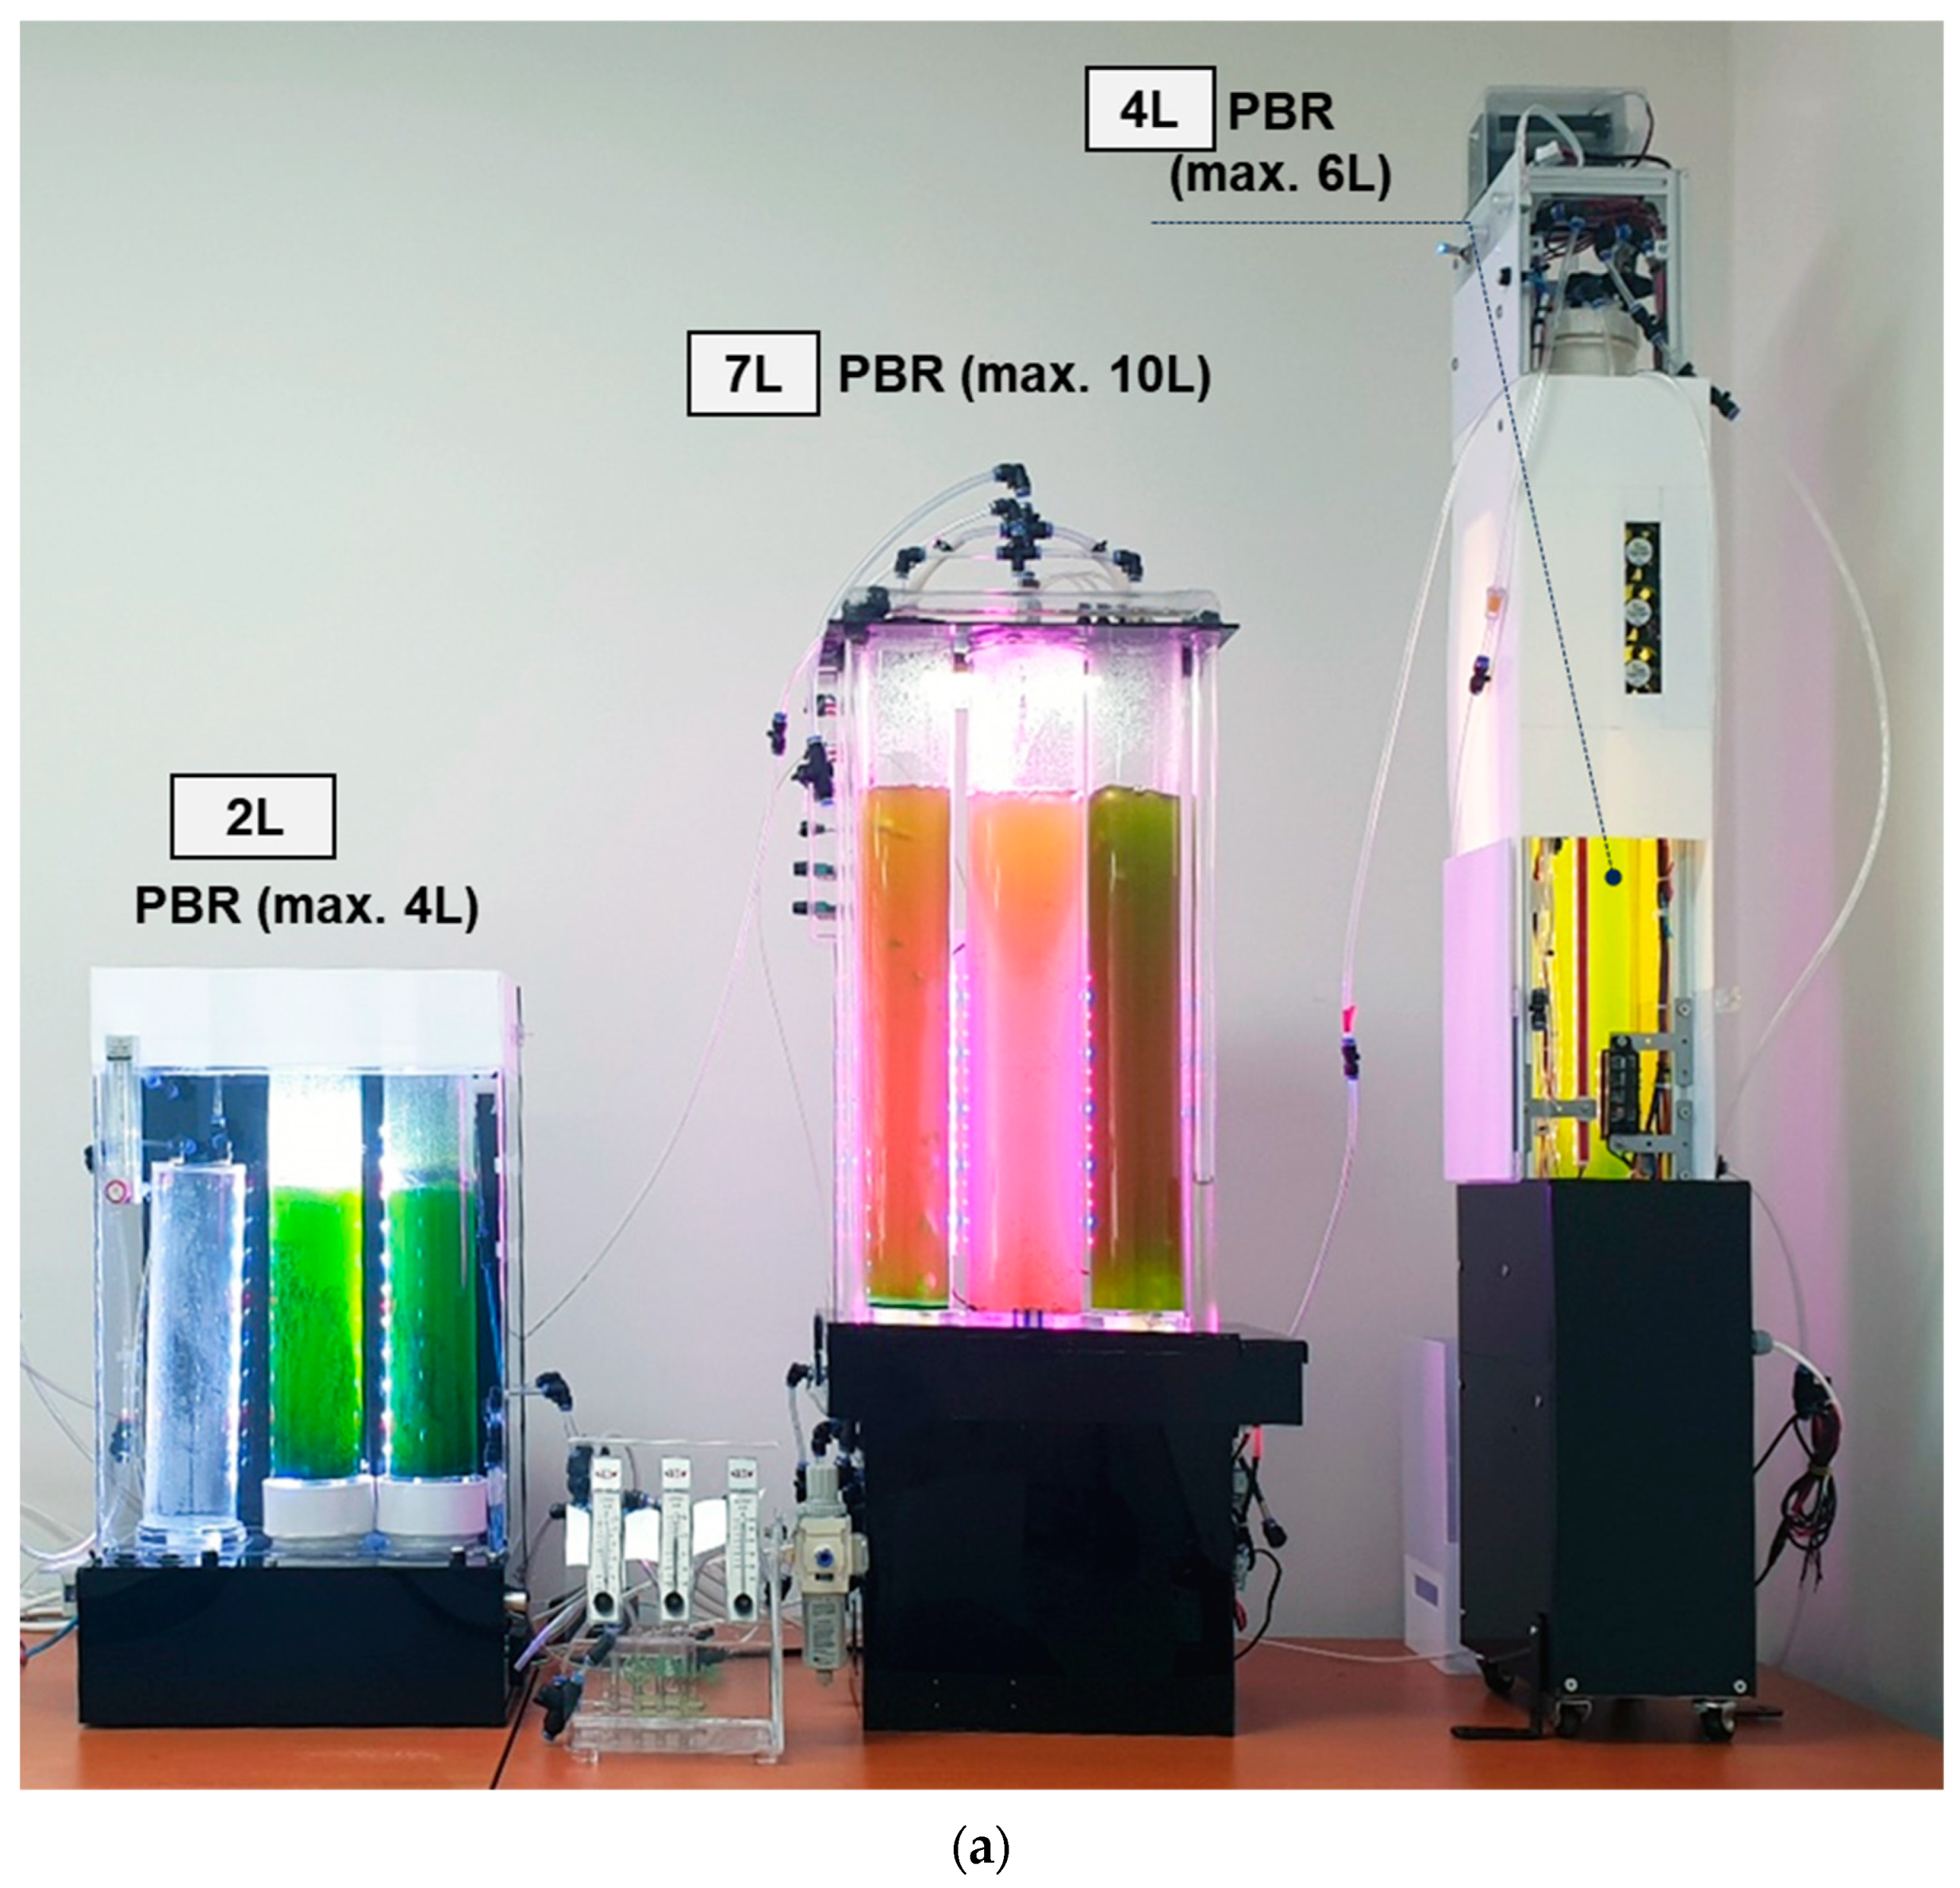
2.2. Equipment Development: Design and Fabrication of a Purification System

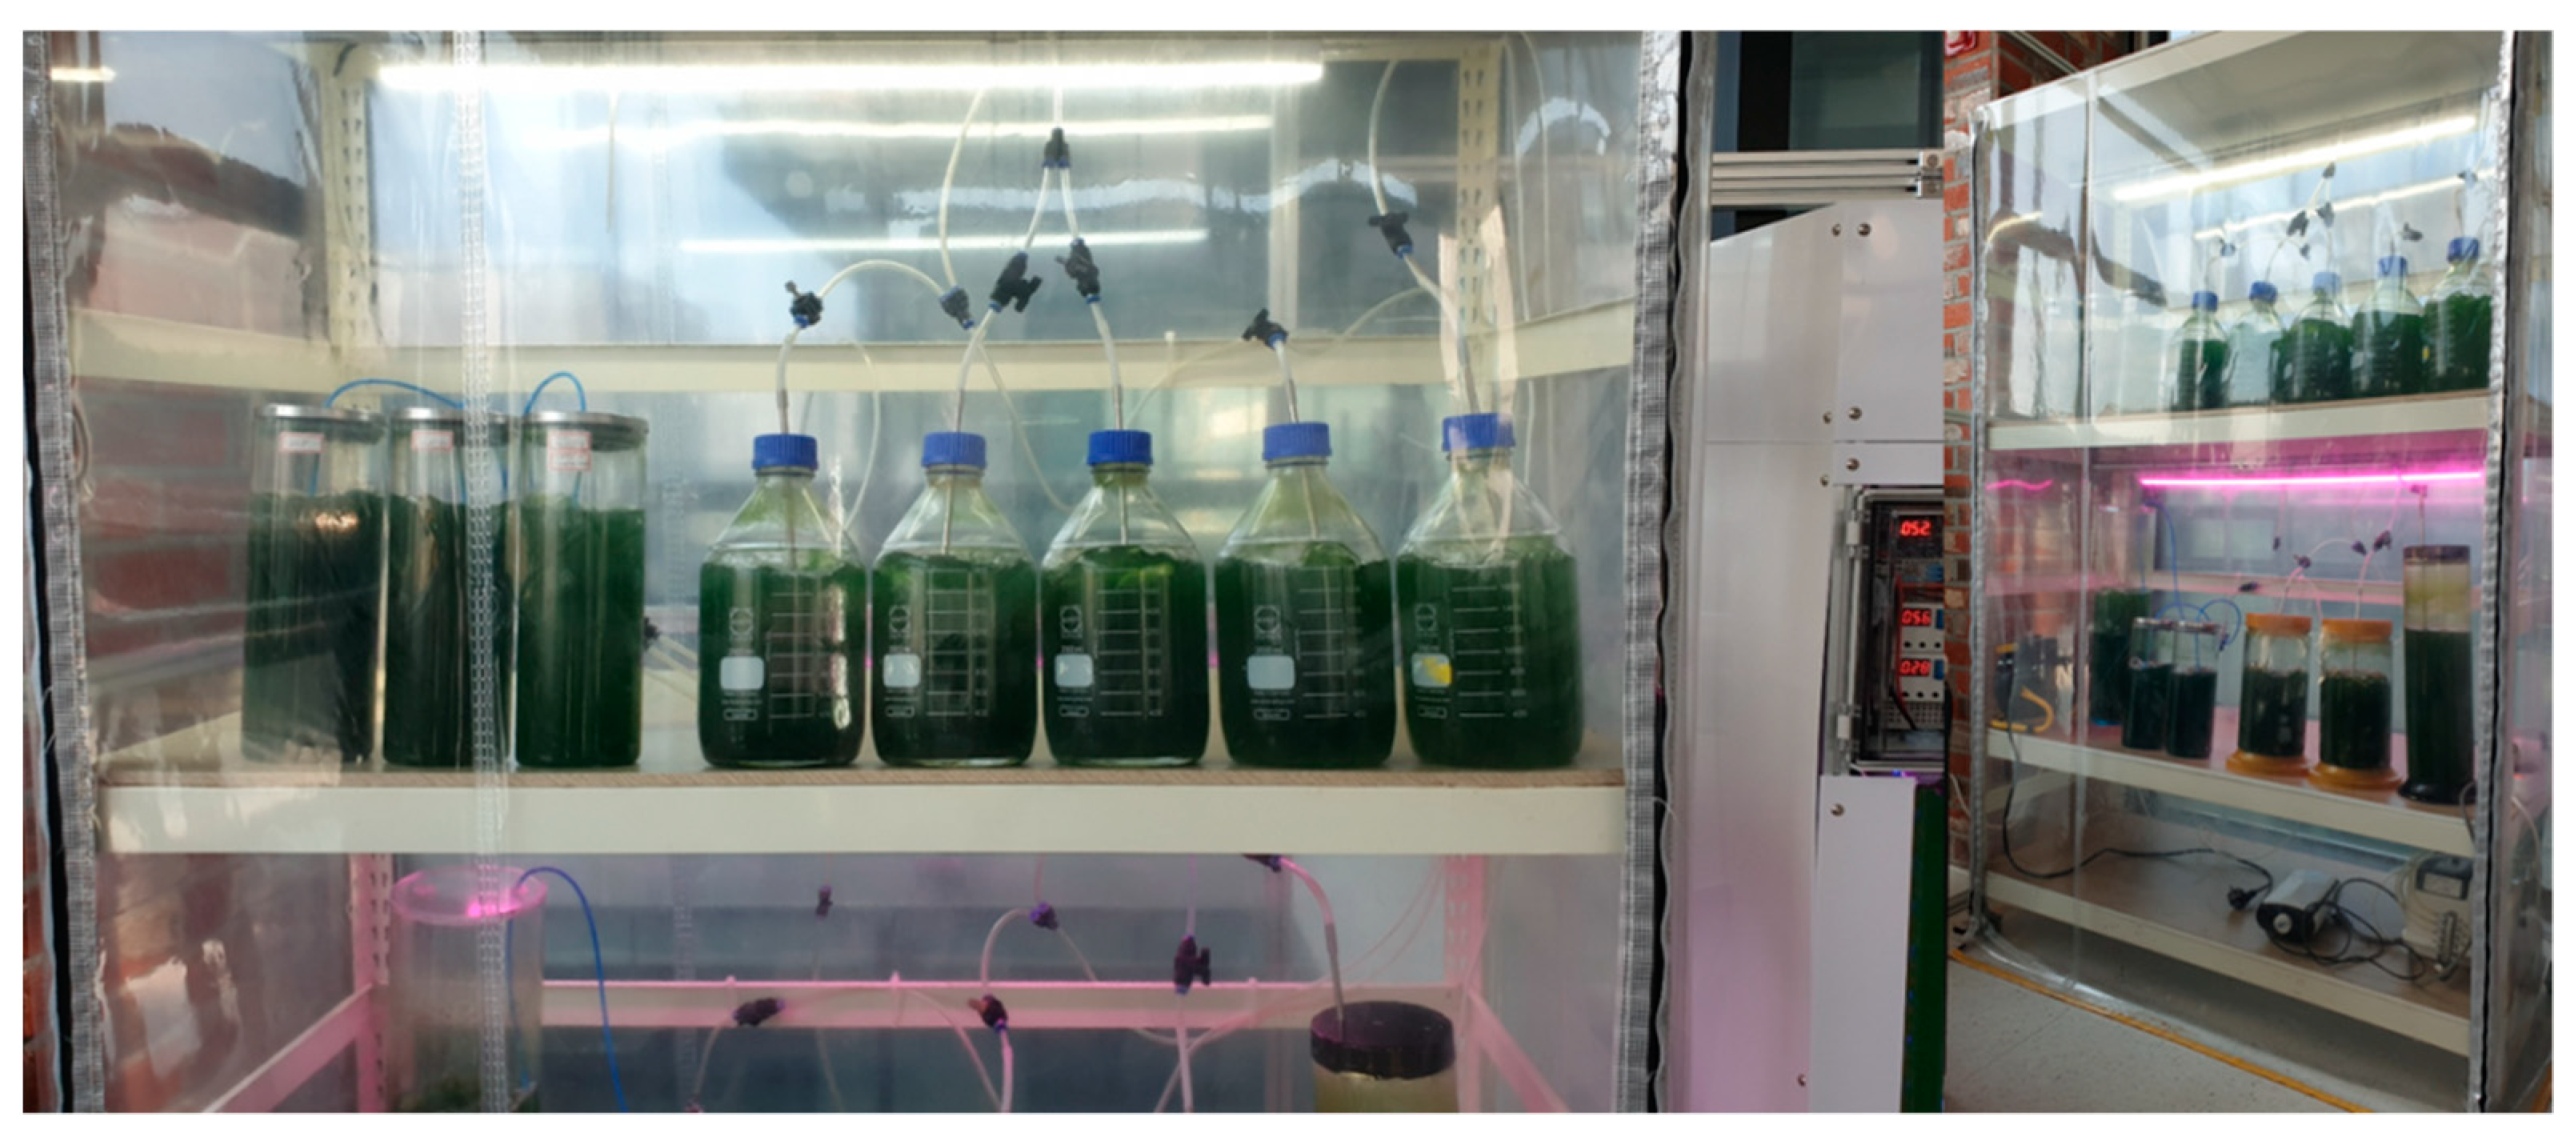
An integration scheme of the household agal air purifier is illustrated in Figure 2, and the experimental equipment was engineered as shown in Figure 3a,b. The central air-exchange container (Figure 2) consists of a set of plexiglass cylindrical columns: bubble column photobioreactors (PBRs) filled with an S. maxima medium and an aseptically closed empty vessel for moisture filtering and flushing out the fresh air. It is known that bubble column reactors are advantageous in temperature control, low pressure drop, and high rate of interfacial areas [51], and we prepared three container systems with vertically arranged PBRs whose maximum liquid containing capacities are 4 L (two 2 L bottles, inner diameter = 76 mm, height = 400 mm, and thickness = 2 mm each), 6 L (a single bottle, inner diameter = 86 mm, height = 950 mm, and thickness = 2 mm), and 10 L (one 4 L and two 3 L bottles, thickness = 2 mm), respectively (Figure 3a). A portable electric water pump (12 V DC, 5.16 W, 6.5 L/min, YHD337412-0703, YeHaus, Yuyao, China) was connected through plastic tubes (inner diameter = 4.8 mm) at the bottom of PBRs to inject the medium liquid. A vacuum pump system of three optional mini airflow pumps (12 V, 10 W, >max. 15 L/min, ZR5551PM, Zhirong Huaguan, Dongguan, China) powered with a 12 V DC converter (LRS350-12, MEAN WELL, Seoul, South Korea) was used to stir the microalgae, constantly creating small bubbles with external air mixed to the PBRs, so that the medium is partially recirculated within the PBRs for active algal incubation and air exchange. An effluent chimney tube was connected to the top of the air-discharging column, and a closed plexiglass chamber (400 × 400 × 400 mm) was devised to collect decarbonized air from the air tube.

2.3. Experiment Procedure and Measurement Methods

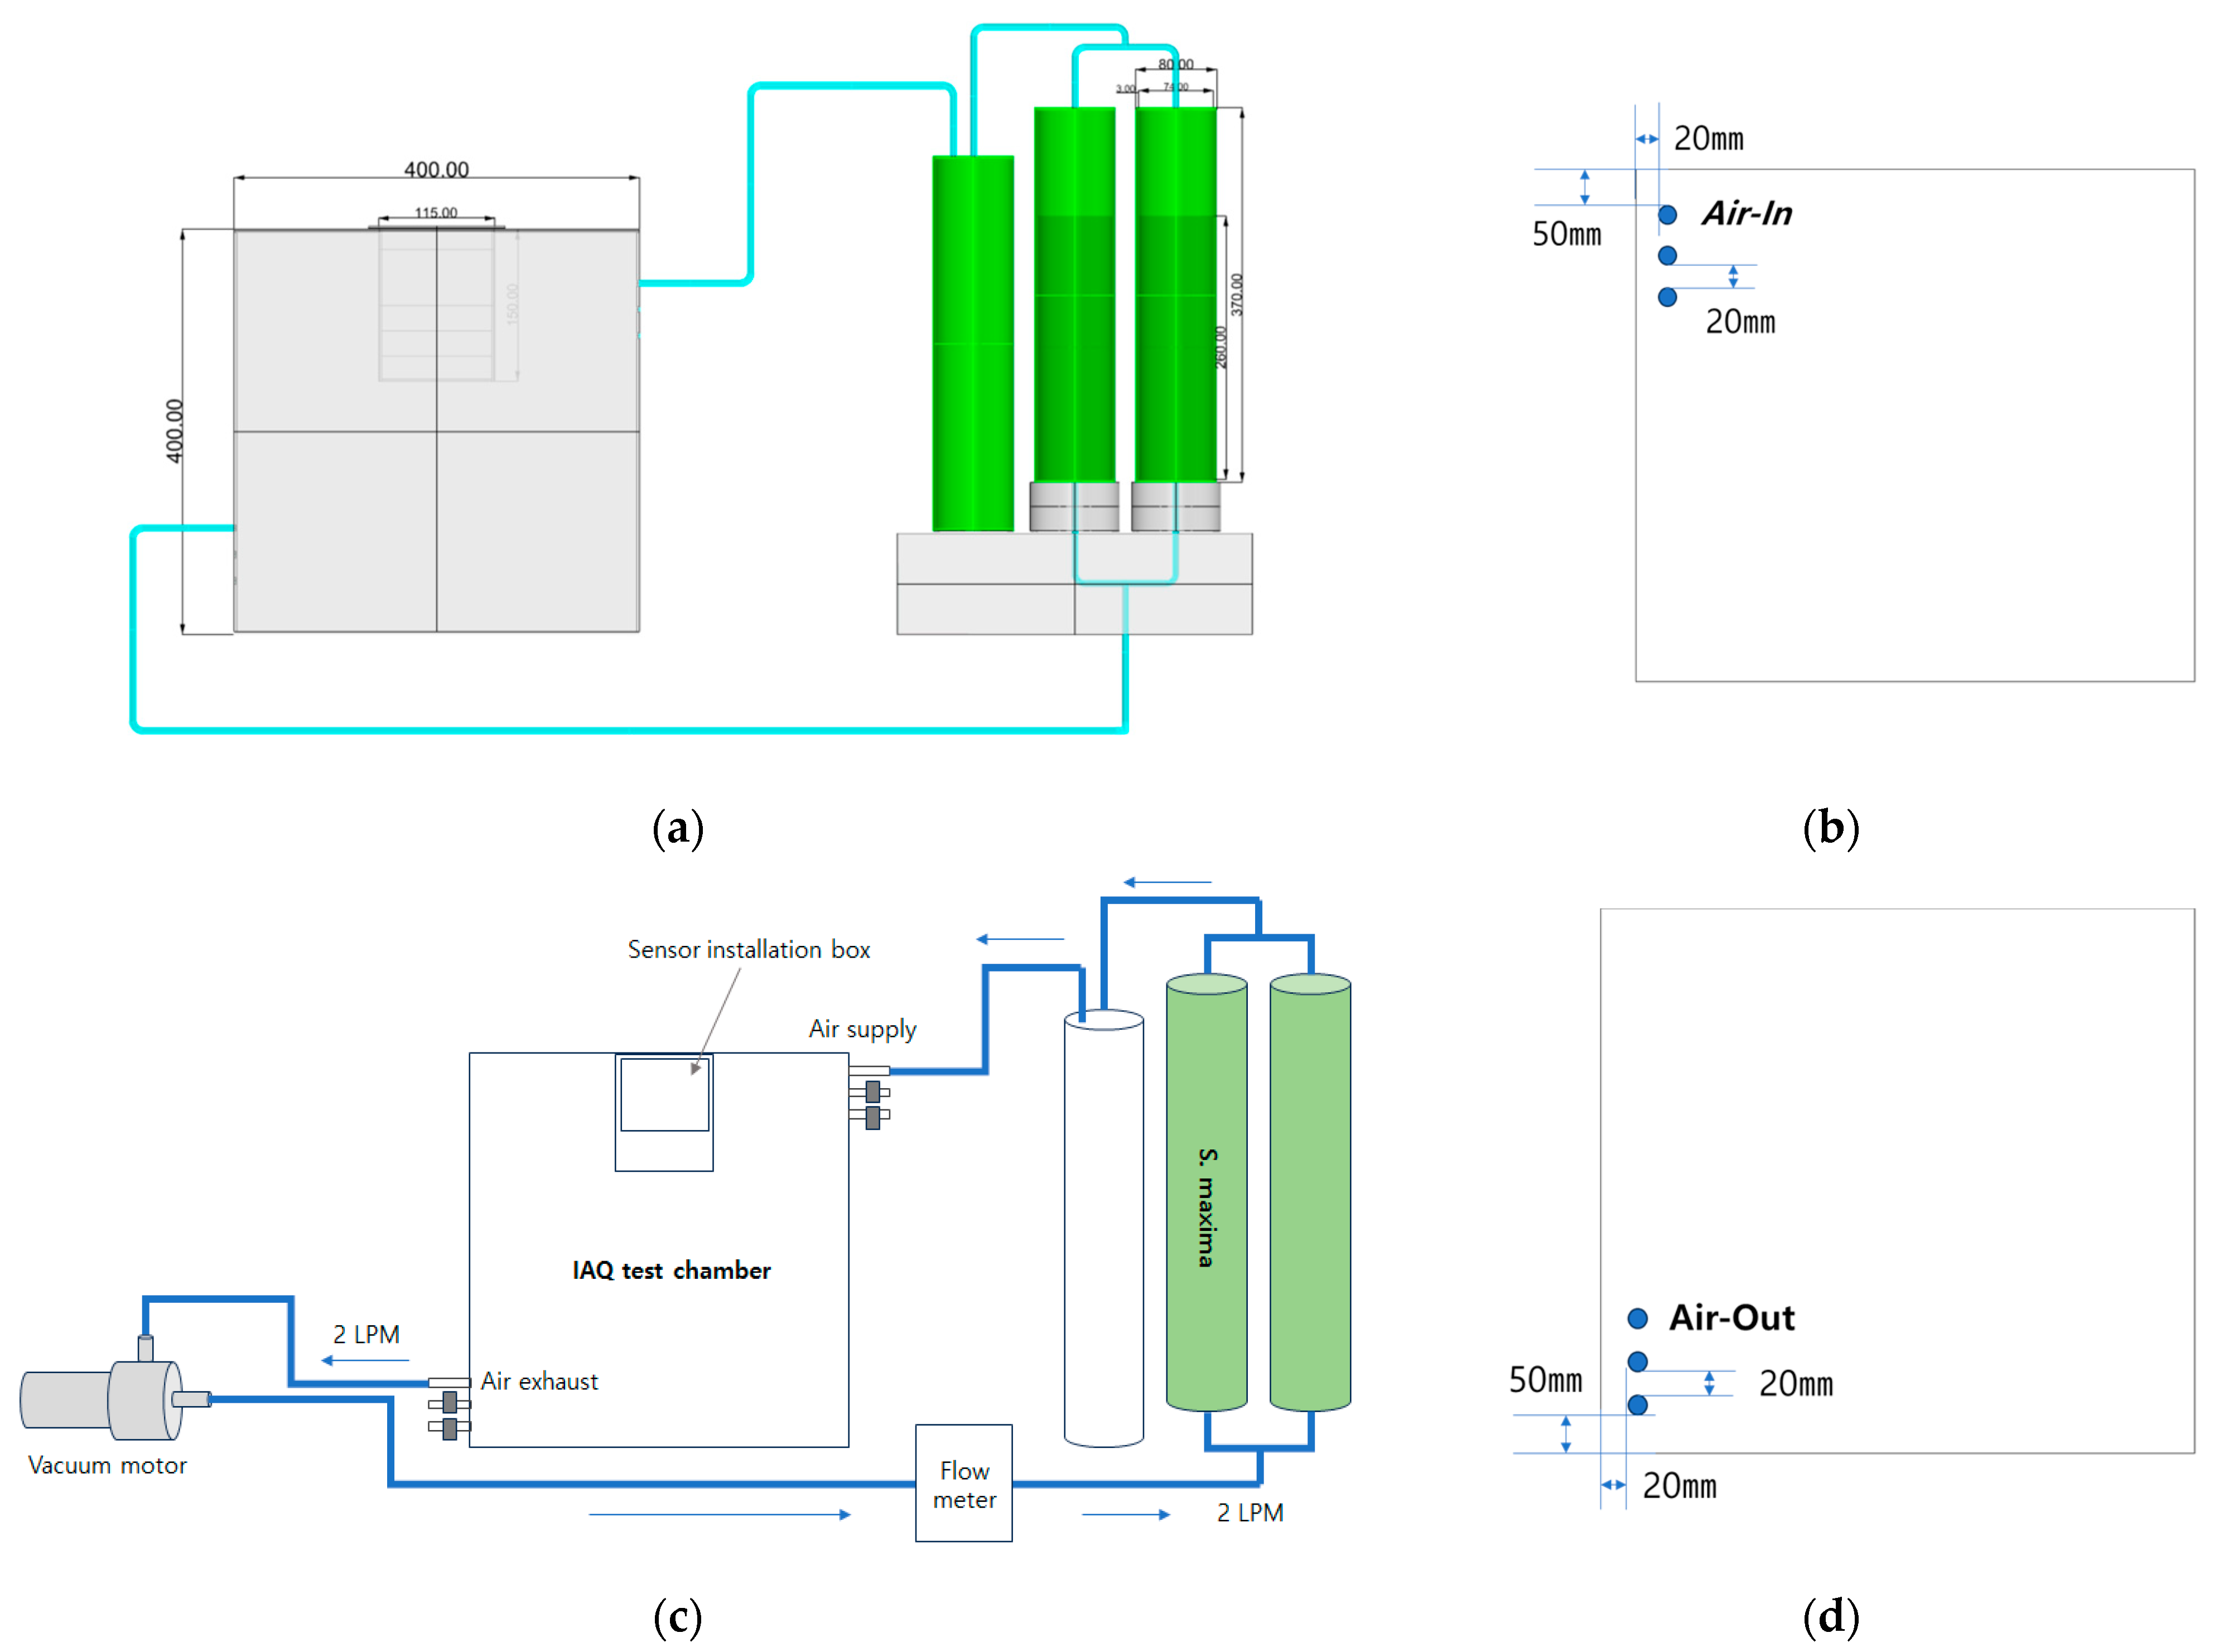
The whole system was set up on a desk near a side wall of a general small office room (Republic of Korea) with a floor area of 53 m2 and ceiling height of 2.5 m, and all windows and doors were closed during our tests to prevent daylight and occupancy disturbance (Figure A1). For the start-up of the experiments, the PBR columns were filled with the Spirulina medium so that a gas–liquid interfacial area of each cylinder became approximately 78.5 cm2, and they were incubated at ~25 °C with 24 h continuous artificial backlights (3500~4800 lux) (Figure 3a). Plant-growth light emitting diode (LED) strips were used to create test light regimes illuminating the algal cylinder vessels: 7.2 W/12 V white LED, 28.8 W/12 V yellow LED, and 14.4 W/12 V purple lighting (two red (660 nm) and one blue (460 nm) LED combination) for the 4 L, 6 L, and 10 L container, respectively. After a 24 h incubation period, we evaluated IAQ by detecting the gas escaped from the air discharger column directly linked to PBRs through an air hole at the center of the chamber ceiling. To that end, a computer monitoring system with electrochemical gas sensors was equipped in the test environment: two SGP30 multi-pixel gas sensors (Adafruit, New York, NY, USA, range: 400~60,000 ppm eCO2, resolution: 15 %Vol) for CO2 and a SEN0322 oxygen sensor (DFRobot, Shanghai, China, range: 0~25 %Vol, resolution: 0.15 %Vol) for O2 concentrations. The I2C (inter-integrated circuit) sensor modules were wired to a Raspberry Pi 4B board outside the chamber. Note that spatial CO2 concentrations were estimated by averaging two SGP30 readings, and three small air outlets were built at the bottom of a chamber side so that each was connected to an airflow control pump and an inner pressure of the chamber space remained at the atmospheric pressure (1.013 × 10⁵ Pa) while in the inflow of the PBR-filtered air. The 4 L, 6 L, and 10 L volumes of PBRs were filled with a 2, 4, and 7 L medium with S. maxima inoculated. Two different tests were carried out to identify CO2 removal performance of the developed air purifier system: (i) measurement of the gas composition by activating entire PBRs simultaneously and (ii) measurement by operating only a single PBR container system, respectively (stopping all, other than target PBRs). The gas composition of CO2 and O2 was monitored at an interval of 15 s, considering the response time limits of the sensors. To test removal potential under high CO2 concentration, high-grade CO2 (10,000 and 6000 ppm) was forcibly injected using commercial CO2 diffusers (Ista, Taiwan, 5500 mL of CO2 at 1 atm, 25 °C). It was blown through the headspace of the chamber, maintaining the constant air exhaustion rate and prolongation of gas–liquid equilibration time (Figure 4).

2.4. Culture Treatment, Observation, and Data Analysis

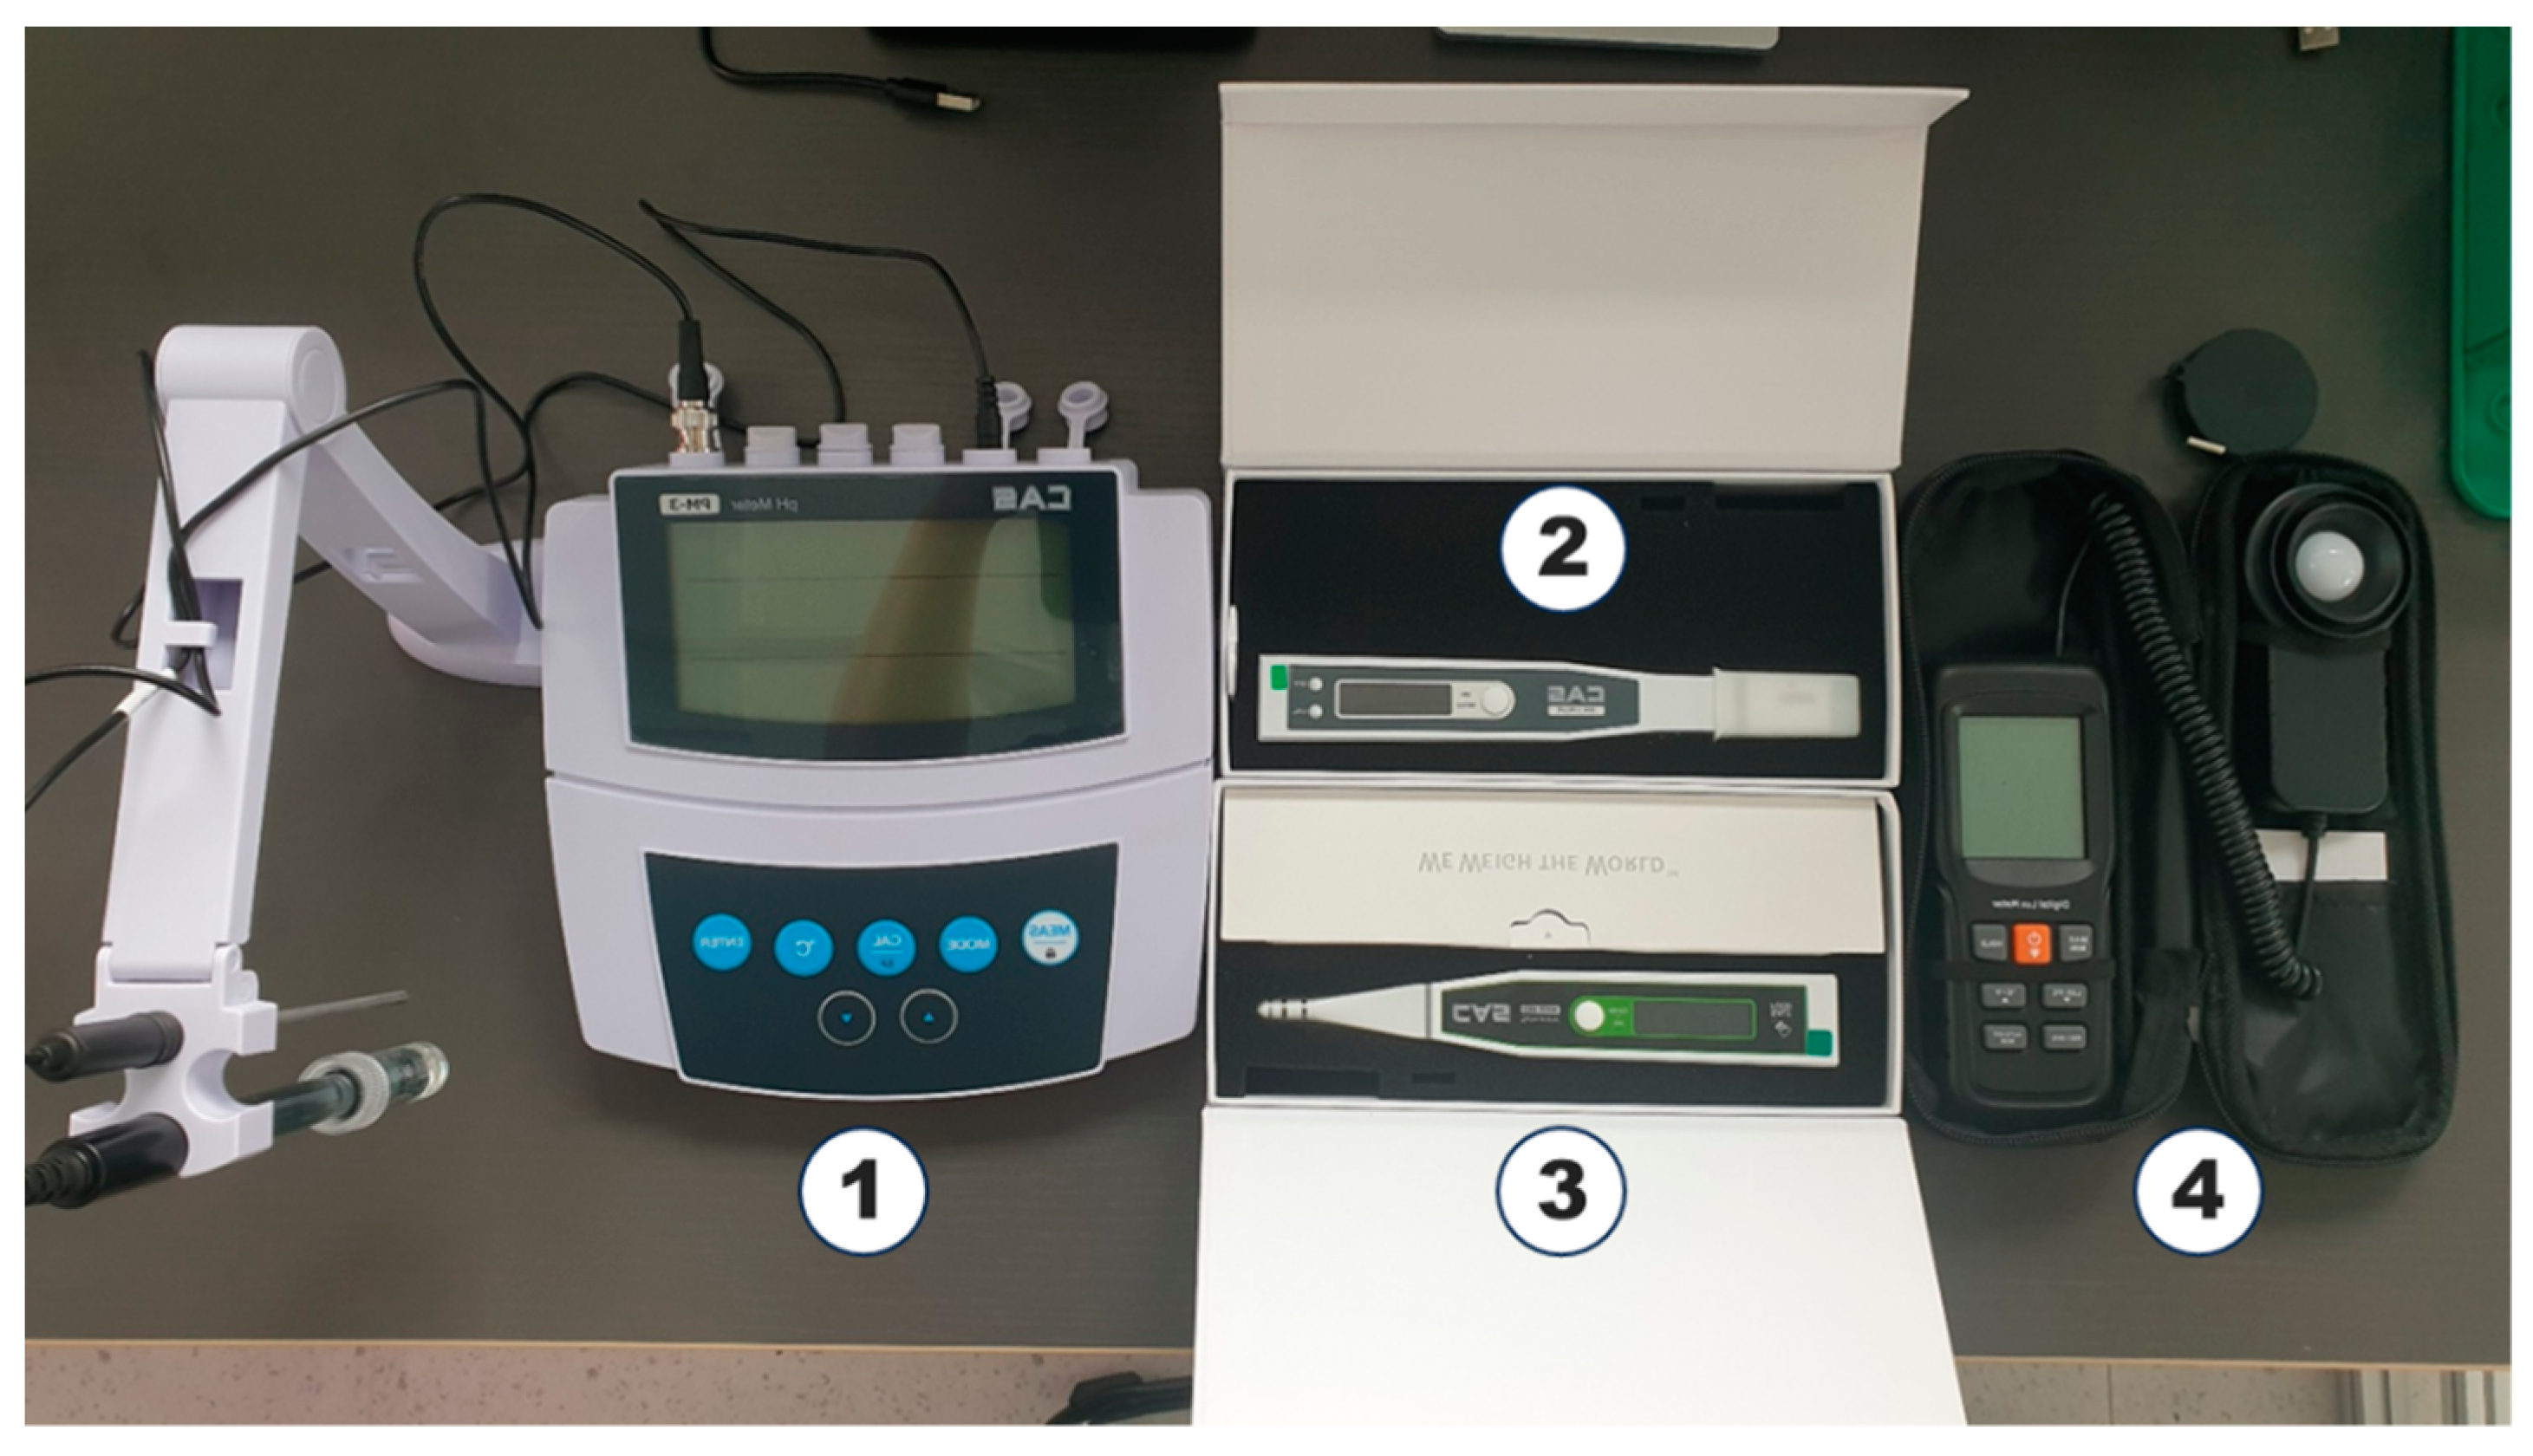
Non-invasive and fast microscopic observations were performed to characterize cultivation states (cell concentration and proliferation) under different nutrient composition and cultivation. To characterize the microalgal cell growth in a NaHCO3-exclusive biochemical condition, we examined three different experimental treatments (cases) in the laboratory: (1) the modified standard SOT in which SOT-cultivated S. maxima were injected, (2) sodium bicarbonate (NaHCO3)-free SOT with S. maxima cultivated in the modified SOT, and (3) sodium bicarbonate (NaHCO3)-free SOT with S. maxima cultivated in sodium bicarbonate (NaHCO3)-free SOT. Note that the semicontinuous operation mode was considered; to control the nutritional and light environment, a small volume of seed cultures was incubated first in batches and fed into large media later. To prepare for the inoculum cultures, S. maxima was sterilized for 15 min at 121 °C and transferred in a 250 mL conical flask with >~3000 lux LED irradiated to provide a suitable photoautotrophic condition for 30 days. A spirulina seed batch of 50 mL was injected afterwards into 1500 mL of different suspension media each (~3.33%) at an initial pH of 8.44 in Case 1 and 7.15 in Cases 2 and 3, respectively. The salinity was 1.23% (492 mg) in Case 1 and 0.41% (164 mg) in Cases 2 and 3. The cultivation cylinder vessels were individually and equally aerated at 1.5 L/min through ϕ 4 mm air tubes in the lab (Figure 5). Then, we identified the influence of NaHCO3 in S. maxima cell growth in a room environment for 2 weeks. Viable cell sizes, structures, and populations were examined by imaging magnified at ×120~7000 (BX53M, Olympus, Tokyo, Japan). Culture samples for the analysis were taken aseptically from the top surface of the suspended solutions. The pH values were obtained using a calibrated Benchtop pH Tester, PM-3 (CAS, Seoul, Republic of Korea) (Figure A2).
On the other hand, air diffusion in the test chamber was simulated to justify the positions of sensor installation and measurement of gas concentrations. Ansys Fluent (ver. 2022 R2) software was used for computational fluid dynamics (CFD). For data analysis results, the mean value of CO2 concentration per each treatment was compared using the Mann–Whitney U test and the variance using Levene’s test. The Kruskal method was applied to compare removal efficiencies upon CO2 reinforcement. Dunn’s test was followed as a post hoc analysis for multiple pairwise comparison. Data difference was considered significant at p-value ≤ 0.001. All statistical analyses were performed using R™ via RStudio 1.3.959 (RStudio, Inc., Boston, MA, USA). The nortest and lawstat packages were used to carry out the Anderson–Darling (AD) normality and Brown–Forsythe variance test, respectively, in R™.

3. Results and Discussion

3.1. Examination of Culture Media Recipes

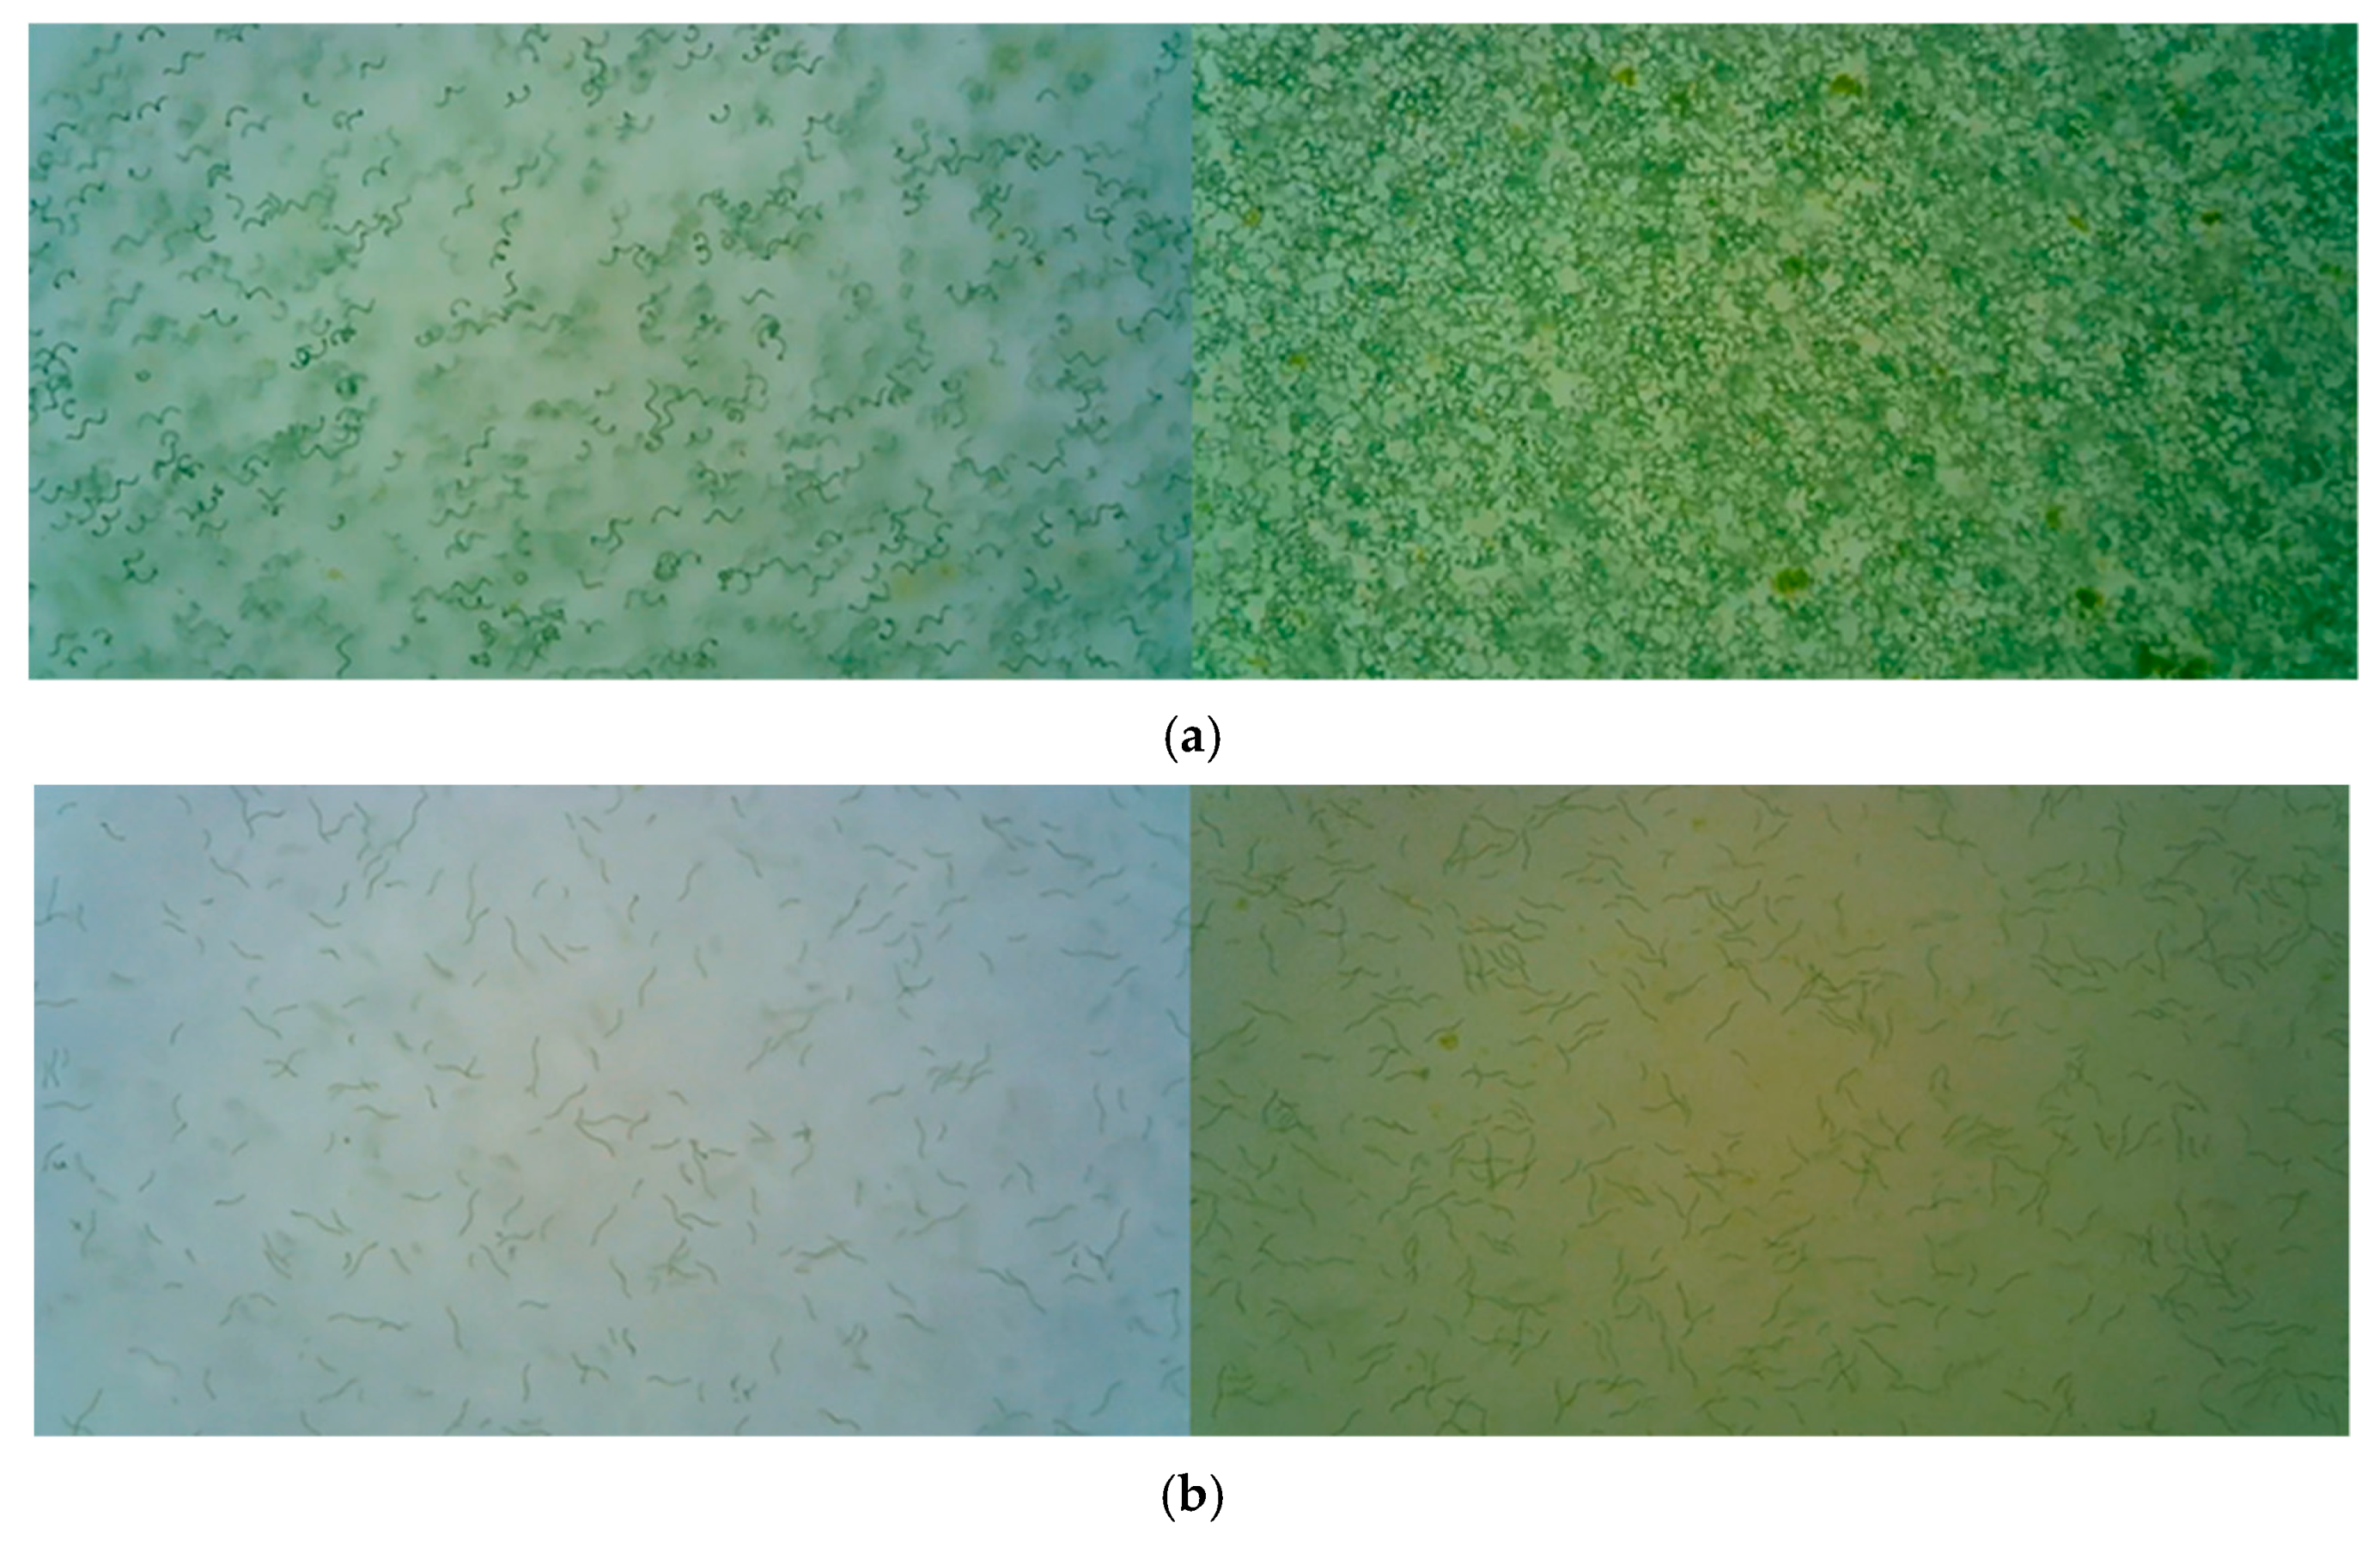
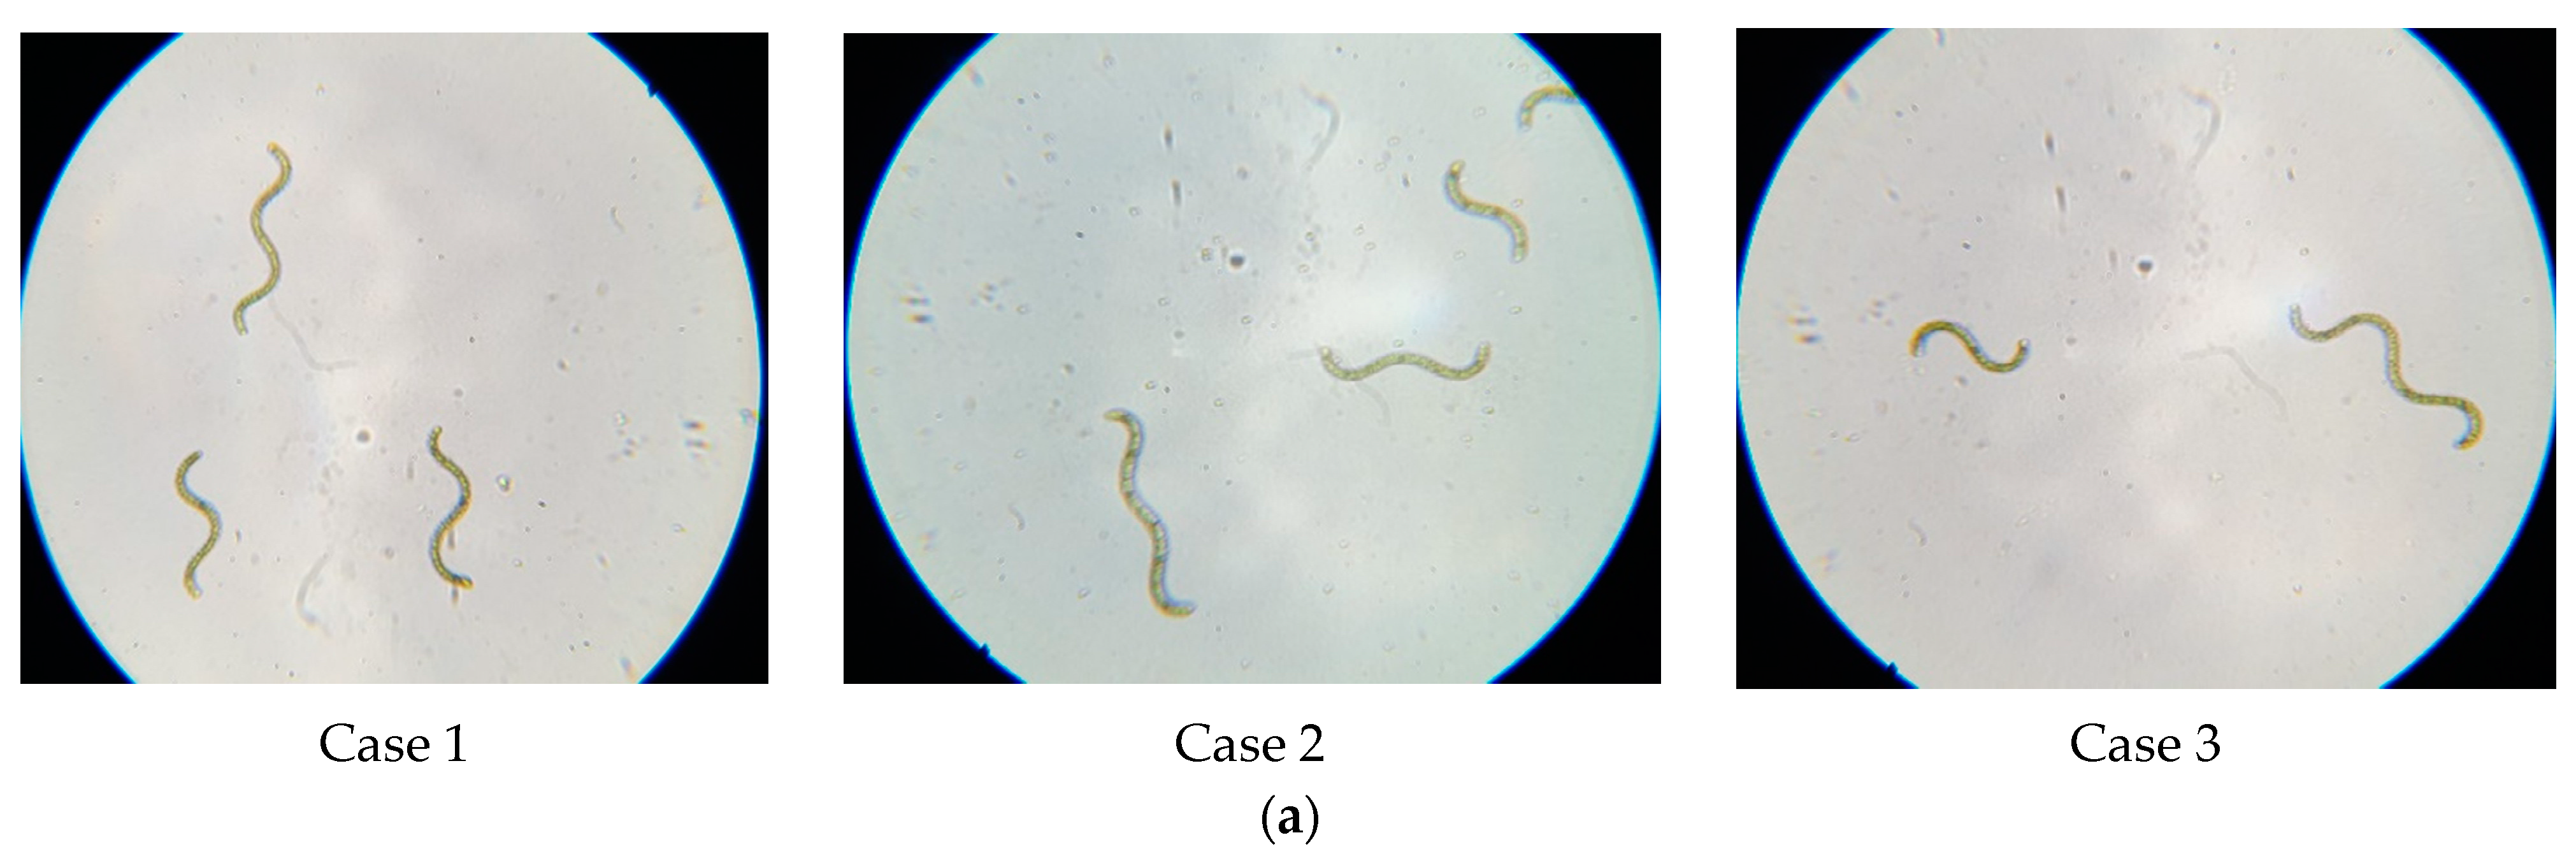
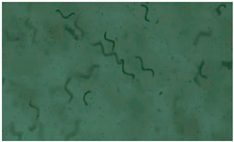
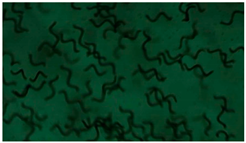
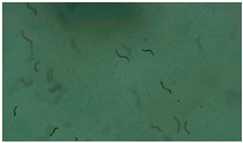
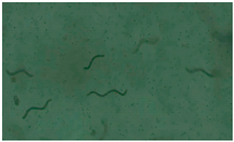
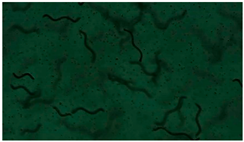
In our study, we have two different seed cultures, the grown in the modified SOT incl. NaHCO3 and excl. NaHCO3, and each was used for Case 1, 2, and 3, respectively. We observed that the cells were actively grown in a NaHCO3-enriched medium (modified SOT), as aggregated in the filaments with a well-developed spiral form. Figure 6 compares the cell growth status of the seed cultures during the 30 incubation days (Day 14 and 28). Figure 6a shows a large population of S. maxima in a high concentration. Each cell exhibits a clear three-dimensionally left-handed (LH) open helicoidal structure, and the numbers of cells were exponentially multiplied after 28 days. However, resulting cultures in the SOT excl. NaHCO3 (Figure 6b) showed a severely lower cell concentration. The sparse cell population and linear form of filament aggregates indicates that the cell growth was limited and remained unsettled in the medium. Even after 28 days, we observed that the cell structures were not able to develop LH coils vividly and the cell density on Day 28 appeared only as good as that on Day 14 in the NaHCO3-inclusive SOT. From [52,53], we may suppose that Spirulina proliferation was affected by proper nutrient balance such as nitrogen and carbon more critically than light intensity or temperature. Particularly, bicarbonate is served as an external inorganic substance for the carbonic anhydrase reaction to derive CO2 for photosynthesis. This result supports the previous findings [47,54], and Figure 6b reveals that NaHCO3 deficiency significantly reduced the growth rate (below the average cell reproducibility of 25% per day [55]).
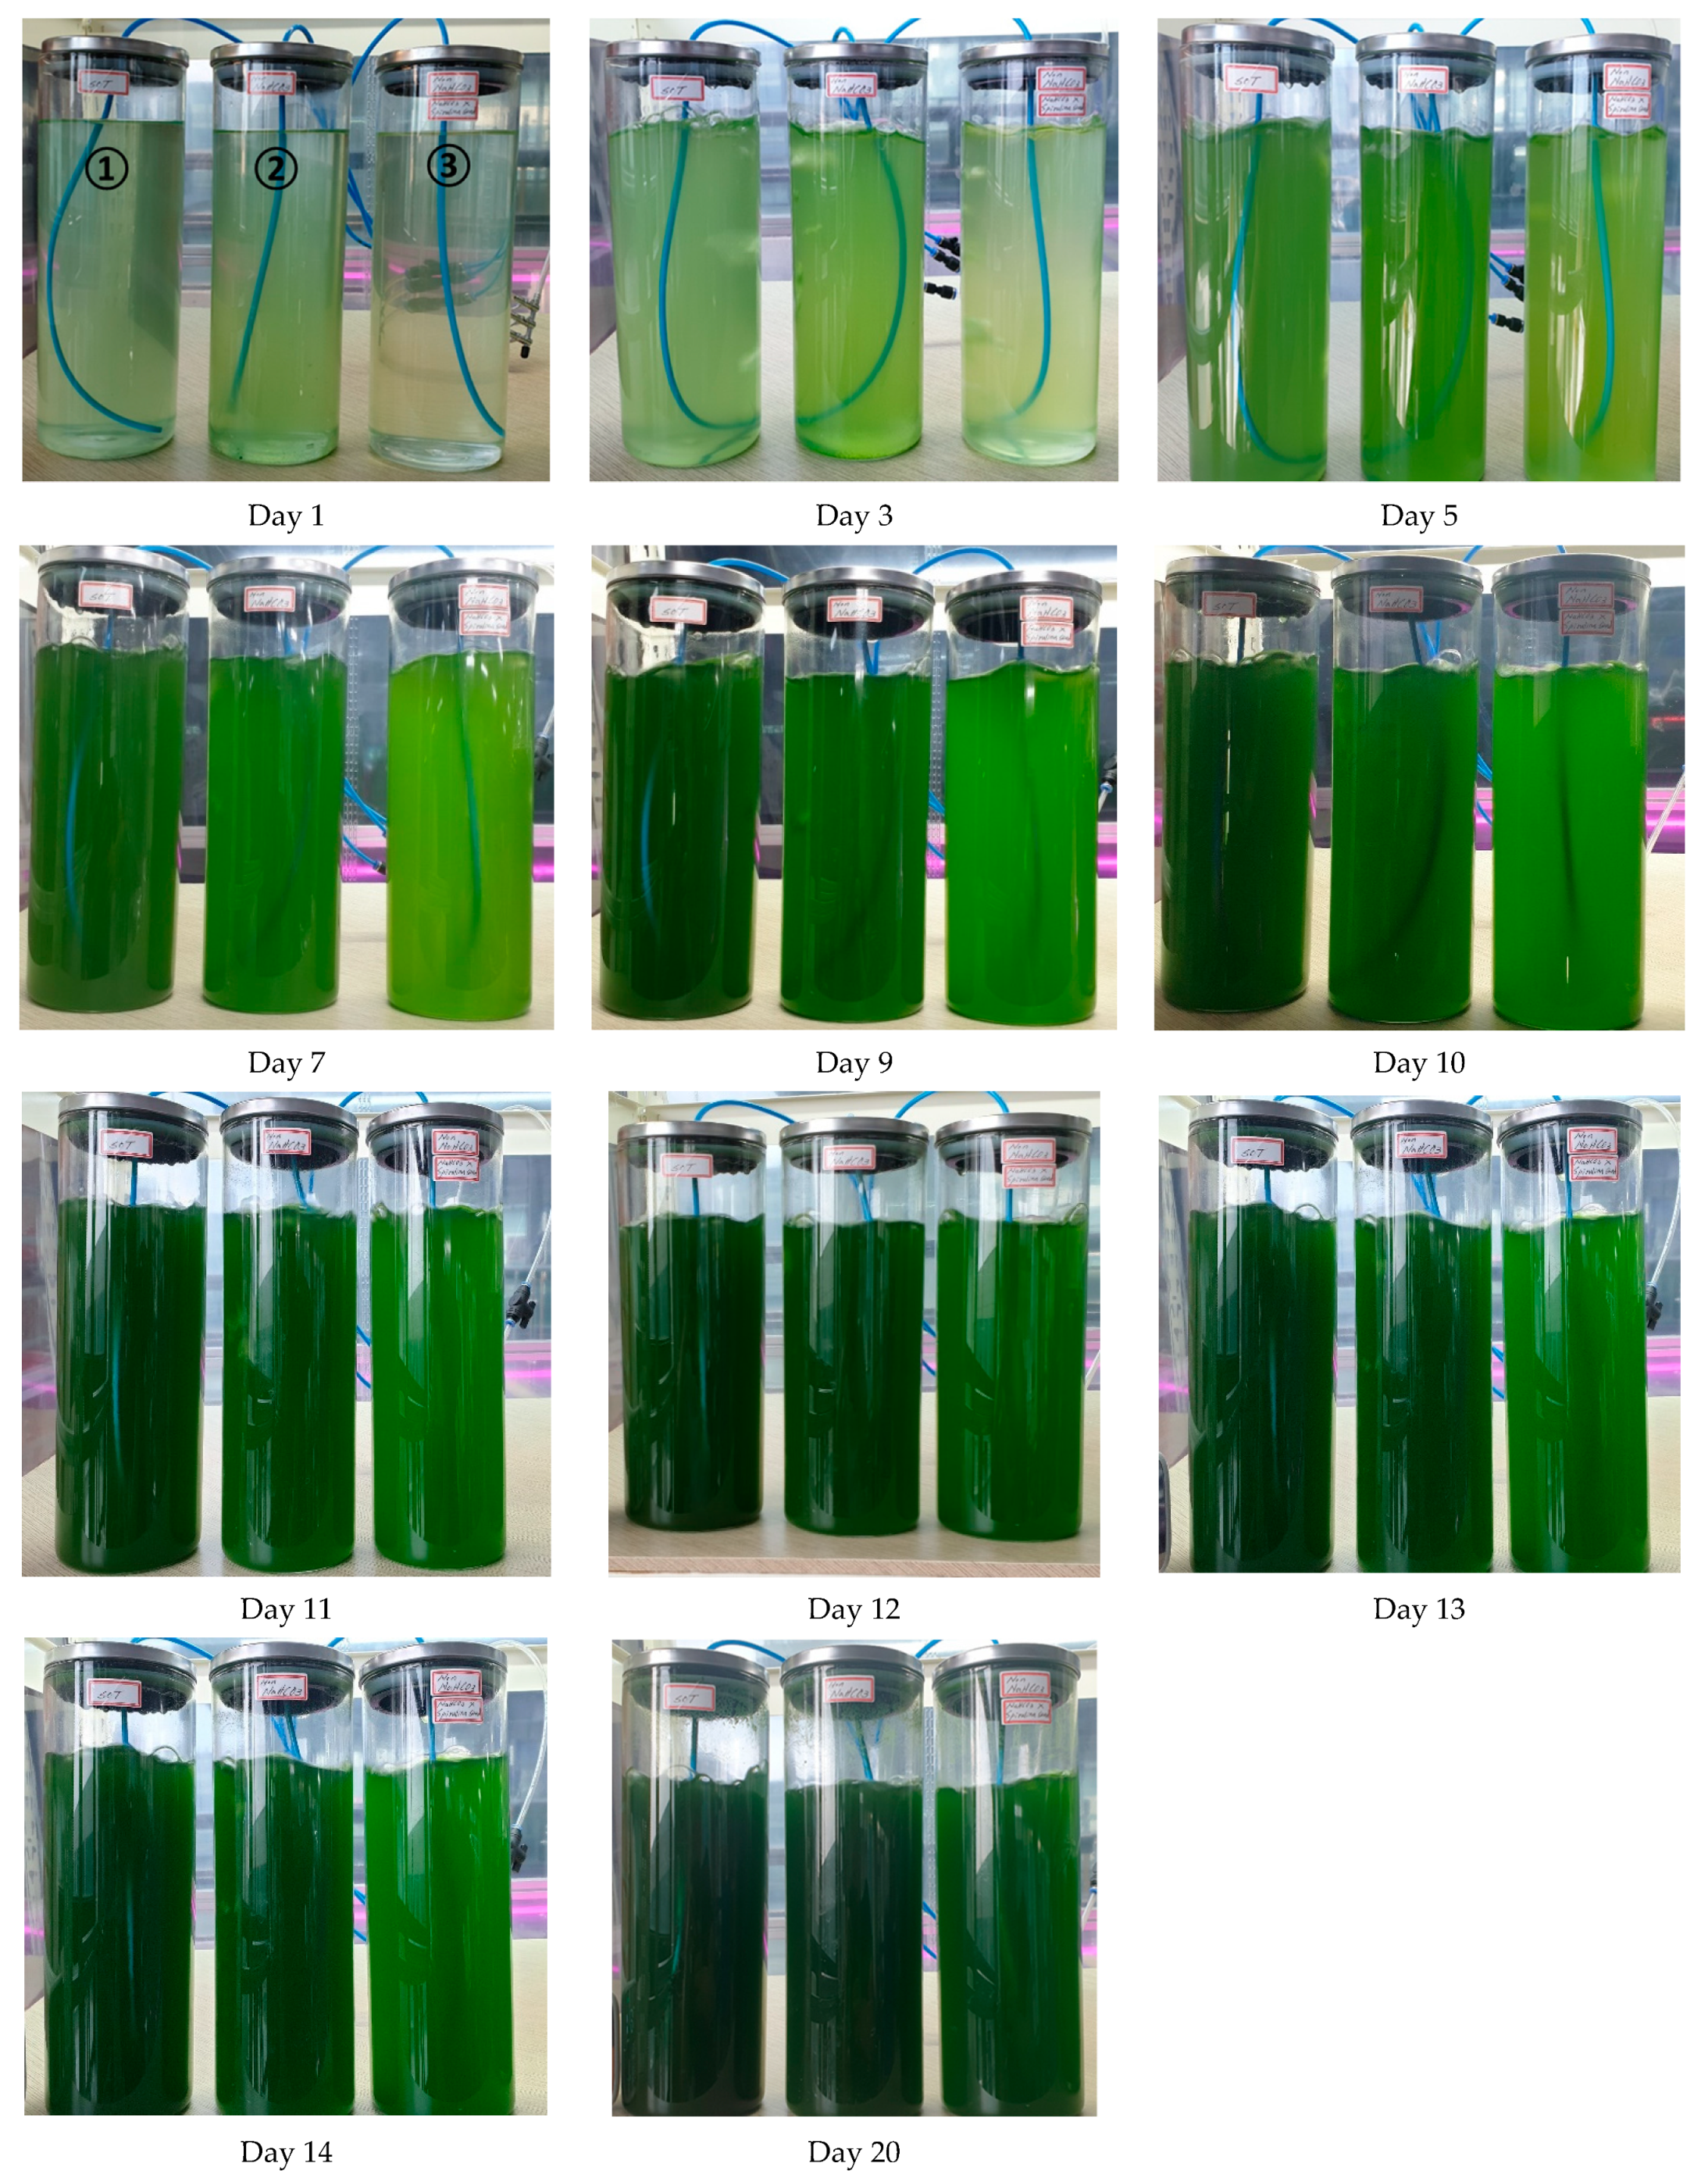
Figure 7 exhibits the results of the S. maxima growth in three different media during 20 days. As shown in Table 1, the liquid solution temperature was measured to be constant all the way at ~29 to ~30 °C under an average light intensity of 6842.5 lux. It was observed that Case 3 was almost translucent in the beginning and Case 2 appeared slightly thicker in visual solution concentration than 1 until the first 5 days, even though their initial cultures were identical. In Table 2, we identified that Case 1 became optically denser, exhibiting characteristic green coloration after Day 7. However, after Day 12, such difference was relented, while the solution density of Case 3 was the thinnest. This observation was confirmed by the measurement of gaps in optical density (O.D.) between 1 and 2, which was about 21.2 and 16.0% on Day 10 and 20, respectively. Suboptimal growth such as the markedly lagging development finds that the nutritional state of the parent culture is considerably important for the early-stage promotion of cultivation. Nevertheless, in this test, the NaHCO3-exclusive medium performed well to proliferate the S. maxima culture after a certain period of time. This result suggests that, in enclosed reactors, the insufficient phototrophic growth due to the lack of bicarbonate can be supplemented by automatic external aeration, CO2 dissolution thereof in water. It is certain that CO2 is poorly soluble compared to NaHCO3, and the carbon limitation constrains microalgal growth [56]. However, Monteiro et al. [57] find that constant aeration with artificial illumination improves S. maxima growth, and, despite such a positive impact of bicarbonate addition on the rapid cultivation, Mokashi et al. [58] reveal that the growth rate is not linearly related to the NaHCO3 content. Also, note that increased cell mobility attributed to the artificially aerated stirring yields reduced intercellular shading, which can lead to better light penetration and photosynthesis.
Typically, as a unicellular organism, Spirulina exponentially grow from the 4th to 15th days, if nutrient and light conditions are met. The coloration of the bottles in Figure 7 indicates that the culture in Case 1 experienced an exponential growth phase from Day 5 to 14, whereas that in Case 2 underwent longer (2~3 day delay) and smooth growth phases. However, Case 3 showed highly lagged biological development. Even though they appeared thriving enough and became stationary after Day 20, the O.D. of Case 3 was only about 60% or less of O.D. 1 (Table 1). In general, the pH values successively increase as Spirulina grows and phototrophic degradation decreases medium alkalinity. A notable feature in the NaHCO3-free SOT cultivation (2 and 3) was that the low pH values (8.69 and 7.92) due to the deficient bicarbonate metabolism increased by 2~3% on Day 20. This demonstrates that S. maxima continued to grow (or maintained metabolic activity at the least), slowly though, in the carbon-limited environment. It is visible that cell propagation from the parental filaments still occurred after 14 days.
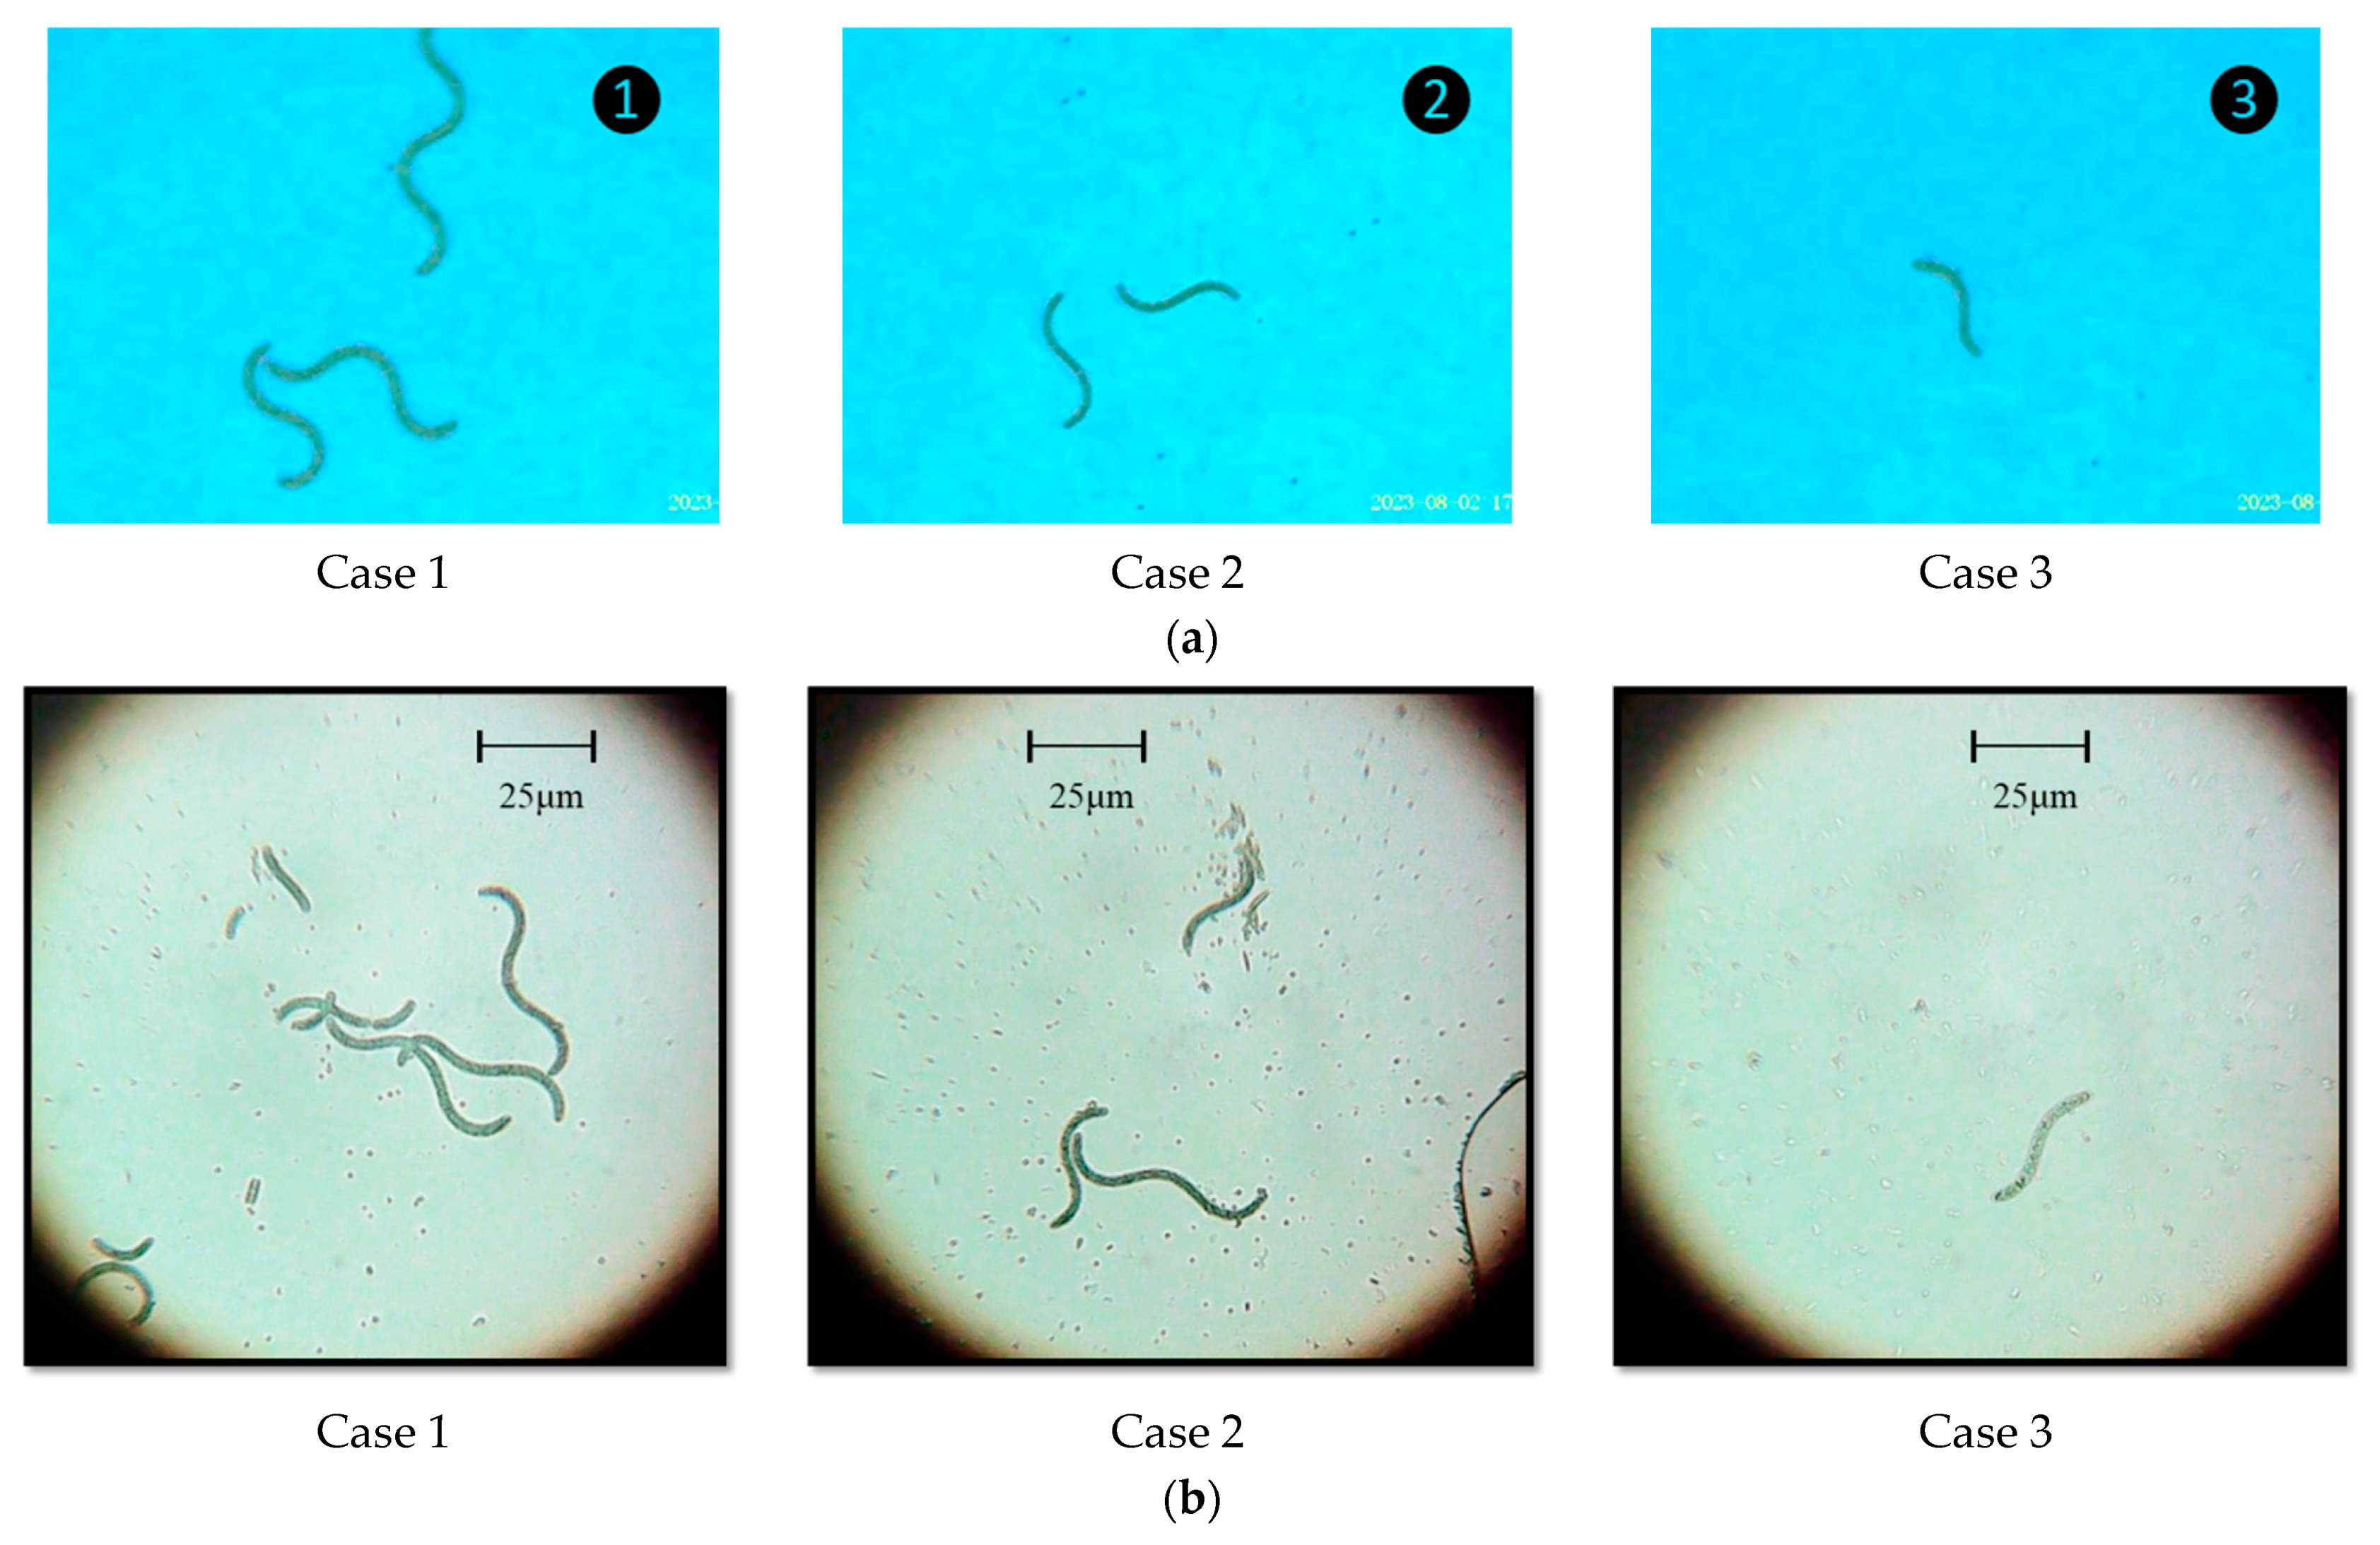
In Figure 8a, the microscopy of Case 1 on Day 14 shows that the divided cells started to grow due to the relatively abundant HCO3 availability. The typical size of Spirulina appears bigger on a cellular scale due to its helical shape (8~9 μm in diameter and 100~200 μm in trichome length [50]), comparing to other species such as the spherical Chlorella cells (2~10 μm [58]). Figure 8 shows that the filaments increased in length (50~60 μm) and morphed to structure the typical spirals. However, in all cases, the cell spirals were not entirely skewed to develop the helix geometry during this process. In Case 3, it seems conceivable that carbon starvation in both the parent cultivation and growth medium resulted in poor cell growth because only few cell spin-offs were visible even in a stationary mature stage (Day 30, Figure 9).

3.2. Air Dispersion in the Chamber

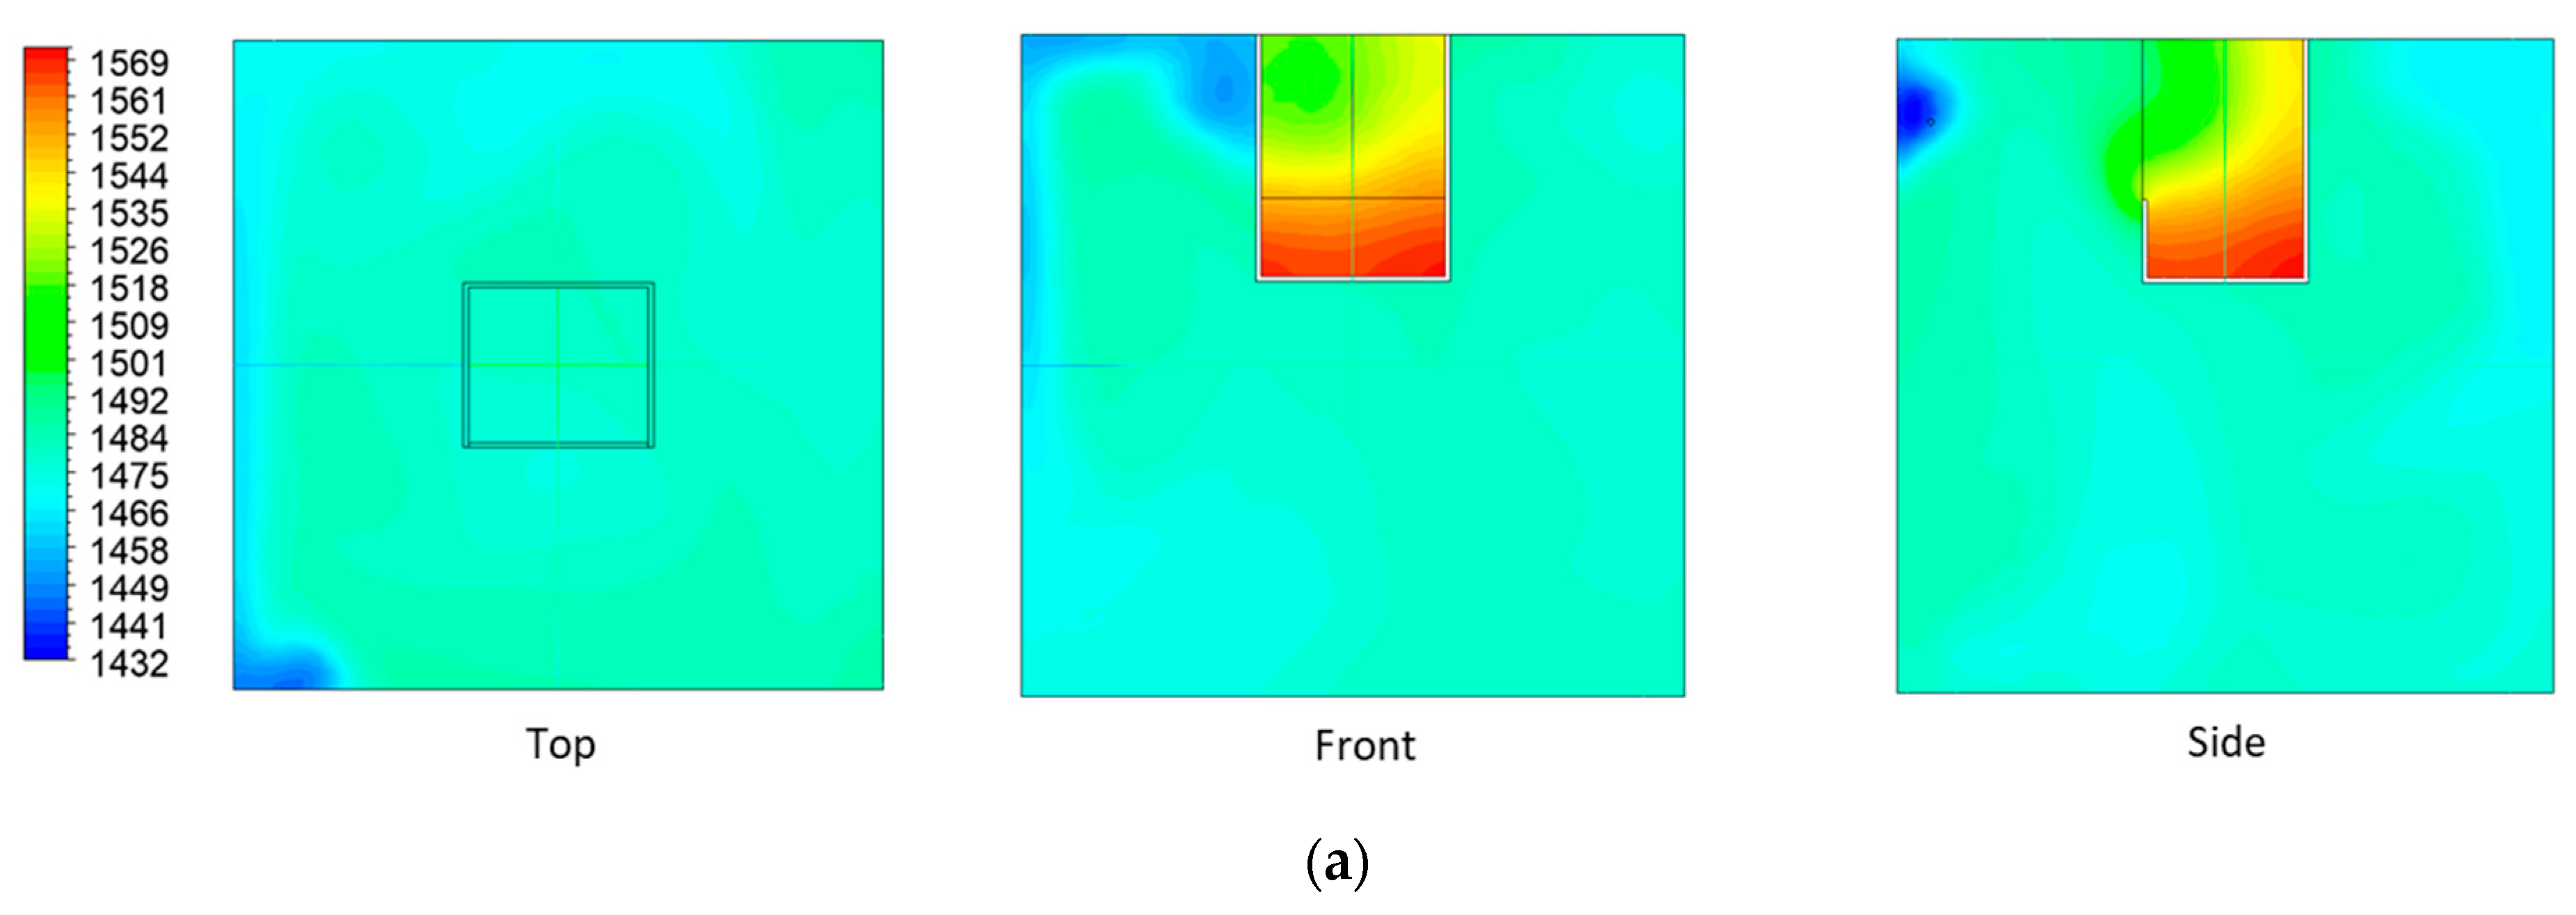
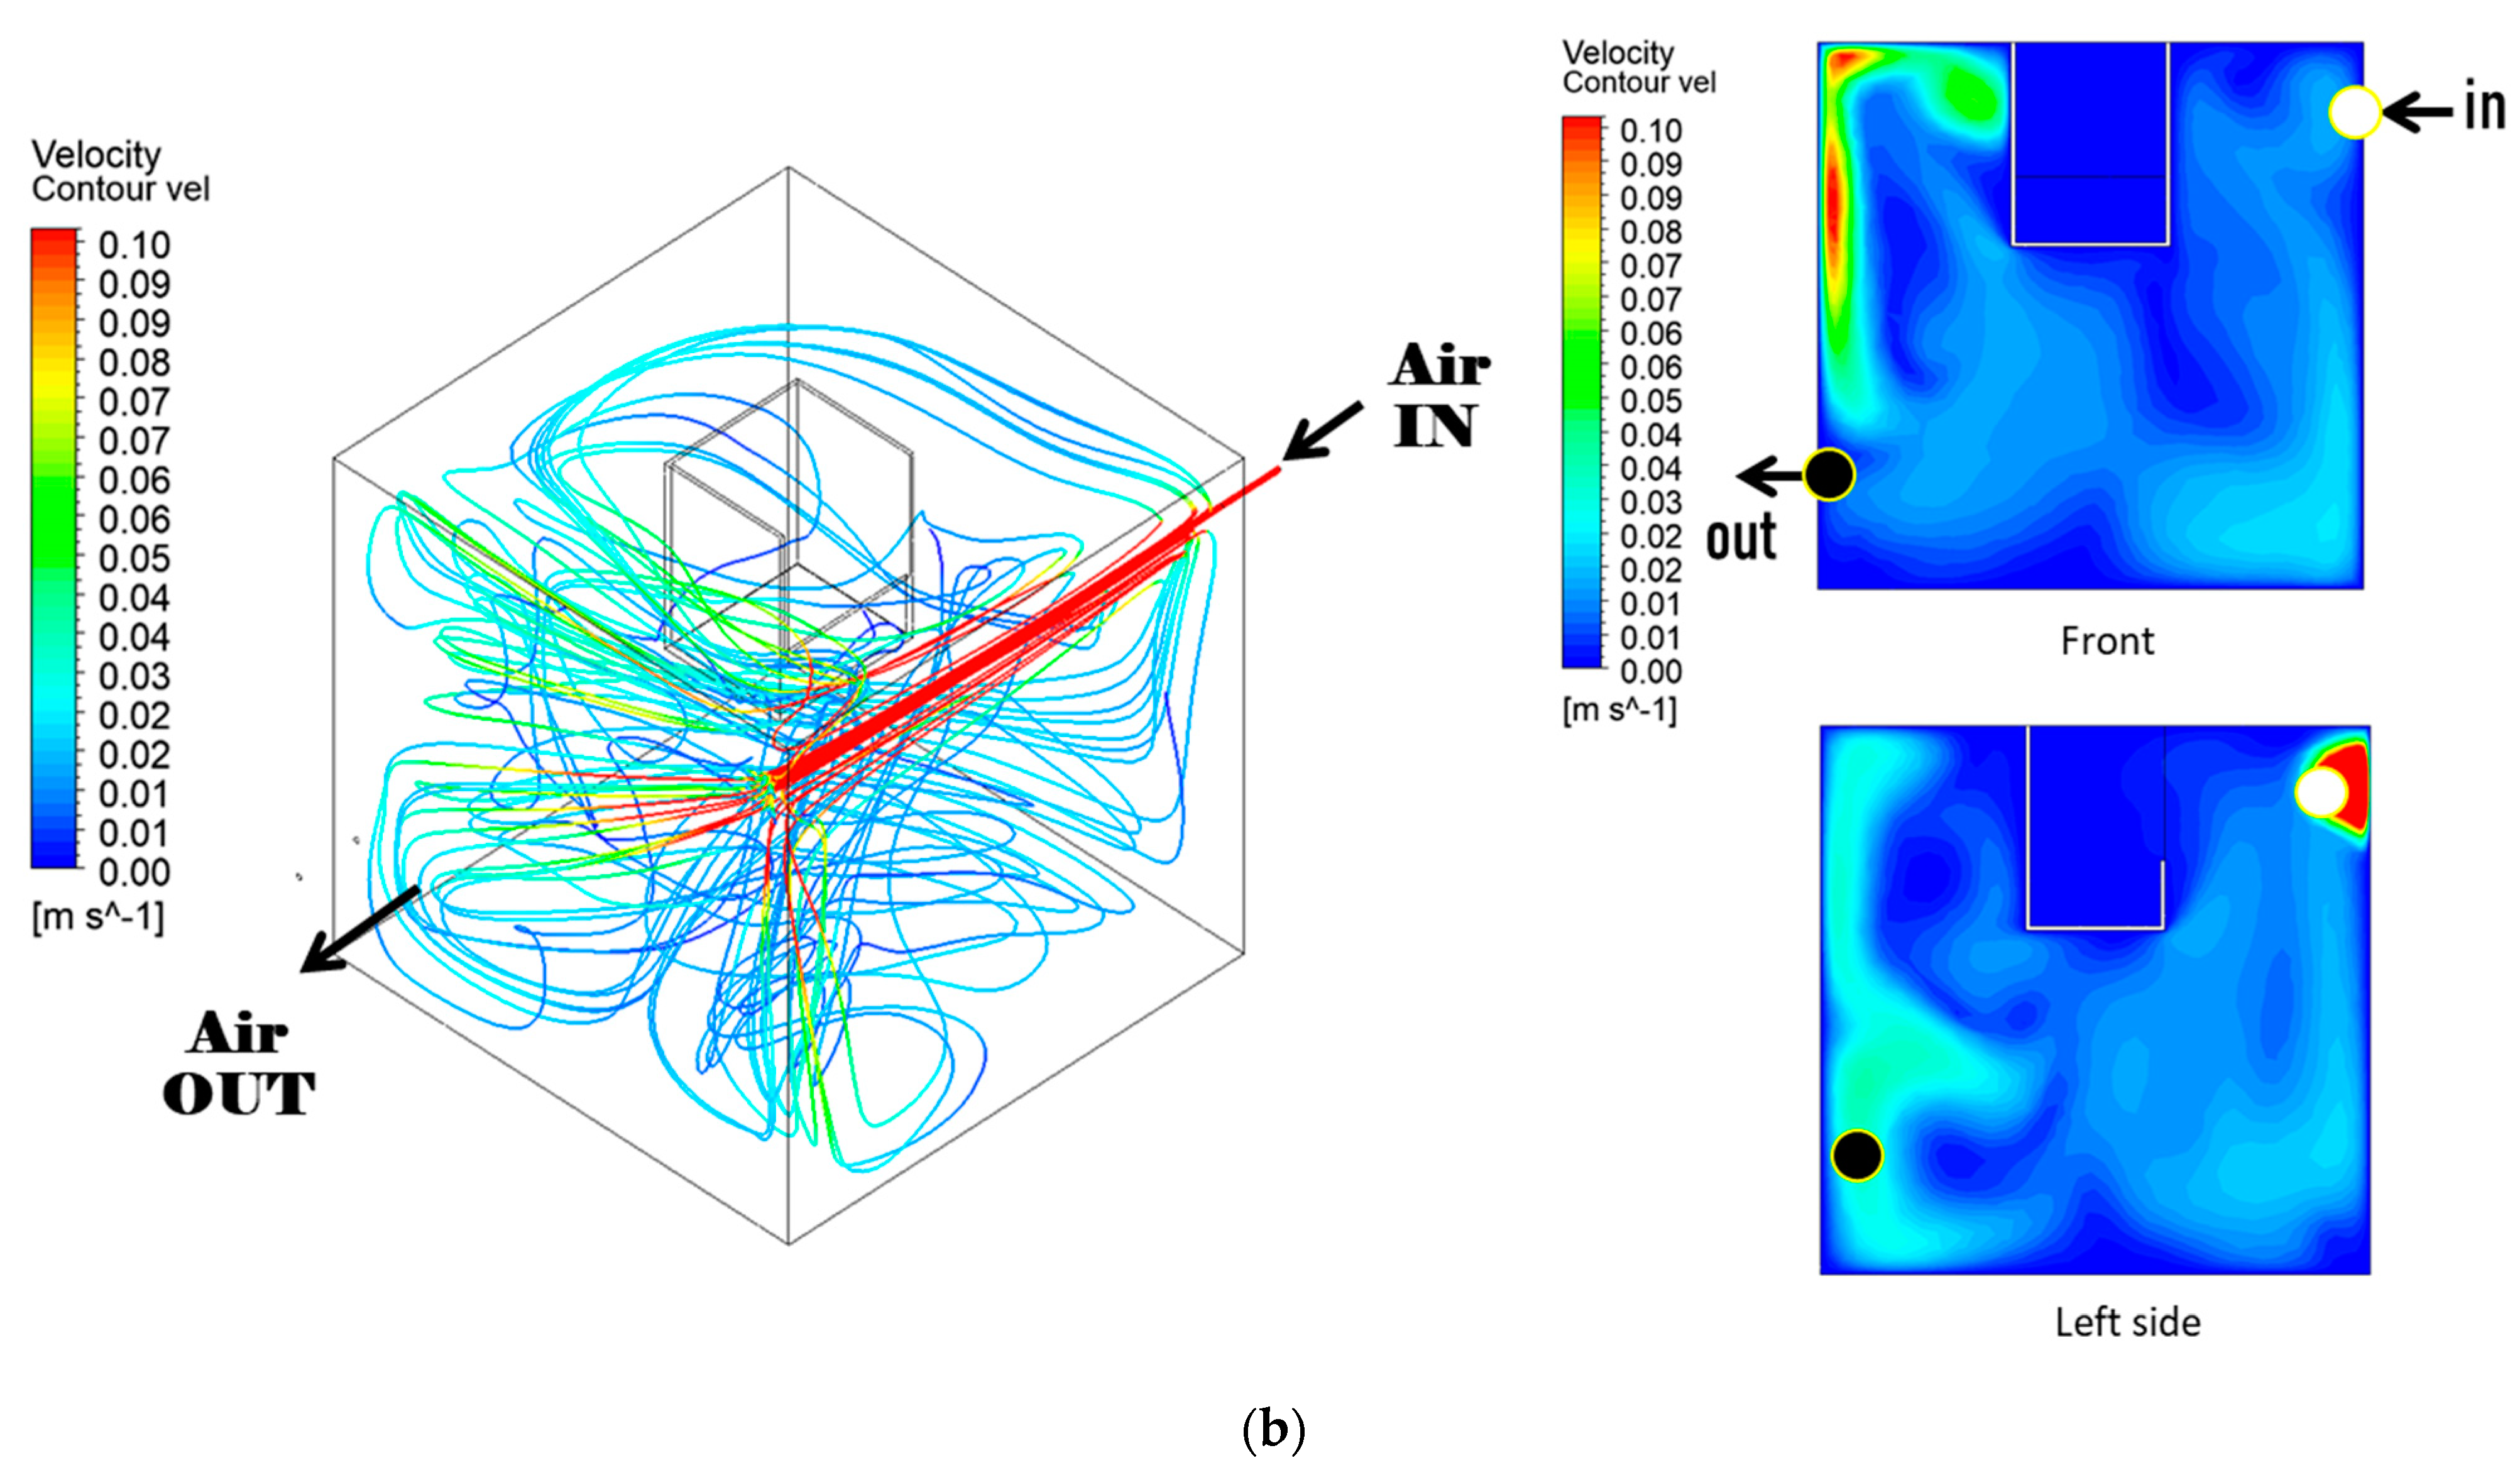
The chamber geometry for CFD is illustrated in Figure 10. The air (CO2) flow in the chamber was modeled as transient laminar fluid with the gravity and energy equations activated. An airflow rate of 2 L/min was assigned on the inlet and outlet as a boundary condition. A total of 5000 ppm was set to an initial CO2 level of the inlet air. The results show that the front upper corner space close to the inlet was significantly affected and the indoor air became turbulent immediately (5 s). However, Figure 10b shows that the flow distribution became homogeneous in a stationary phase (<60 min). We found that the in situ CO2 sensor position can be justified by comparing Figure 3b and these CFD results.

3.3. Air Purification Performance

The results in Section 3.1 suggest that NaHCO3-free SOT can be used for our device. To identify an immediate CO2 removal effect of the developed PBR-based air system using a 1:1 (vol.) mixture of the NaHCO3-free SOT and SOT, gas concentrations of the test chamber in the room (Figure 3) were tracked during the first 7 days after installation and the vessel cultivation using the NaHCO3-free SOT. The air temperature and humidity in the chamber were 26.9 ± 0.8 °C and 63.3 ± 3.8%. As seen in Table 3, we found that the air exchange through the S. maxima PBRs does not necessarily lead to revamping the gas composition other than carbon dioxide. The oxygen almost invariably remained at about 20%, and other gases including volatile organic compounds (VOCs) were not significantly reduced.
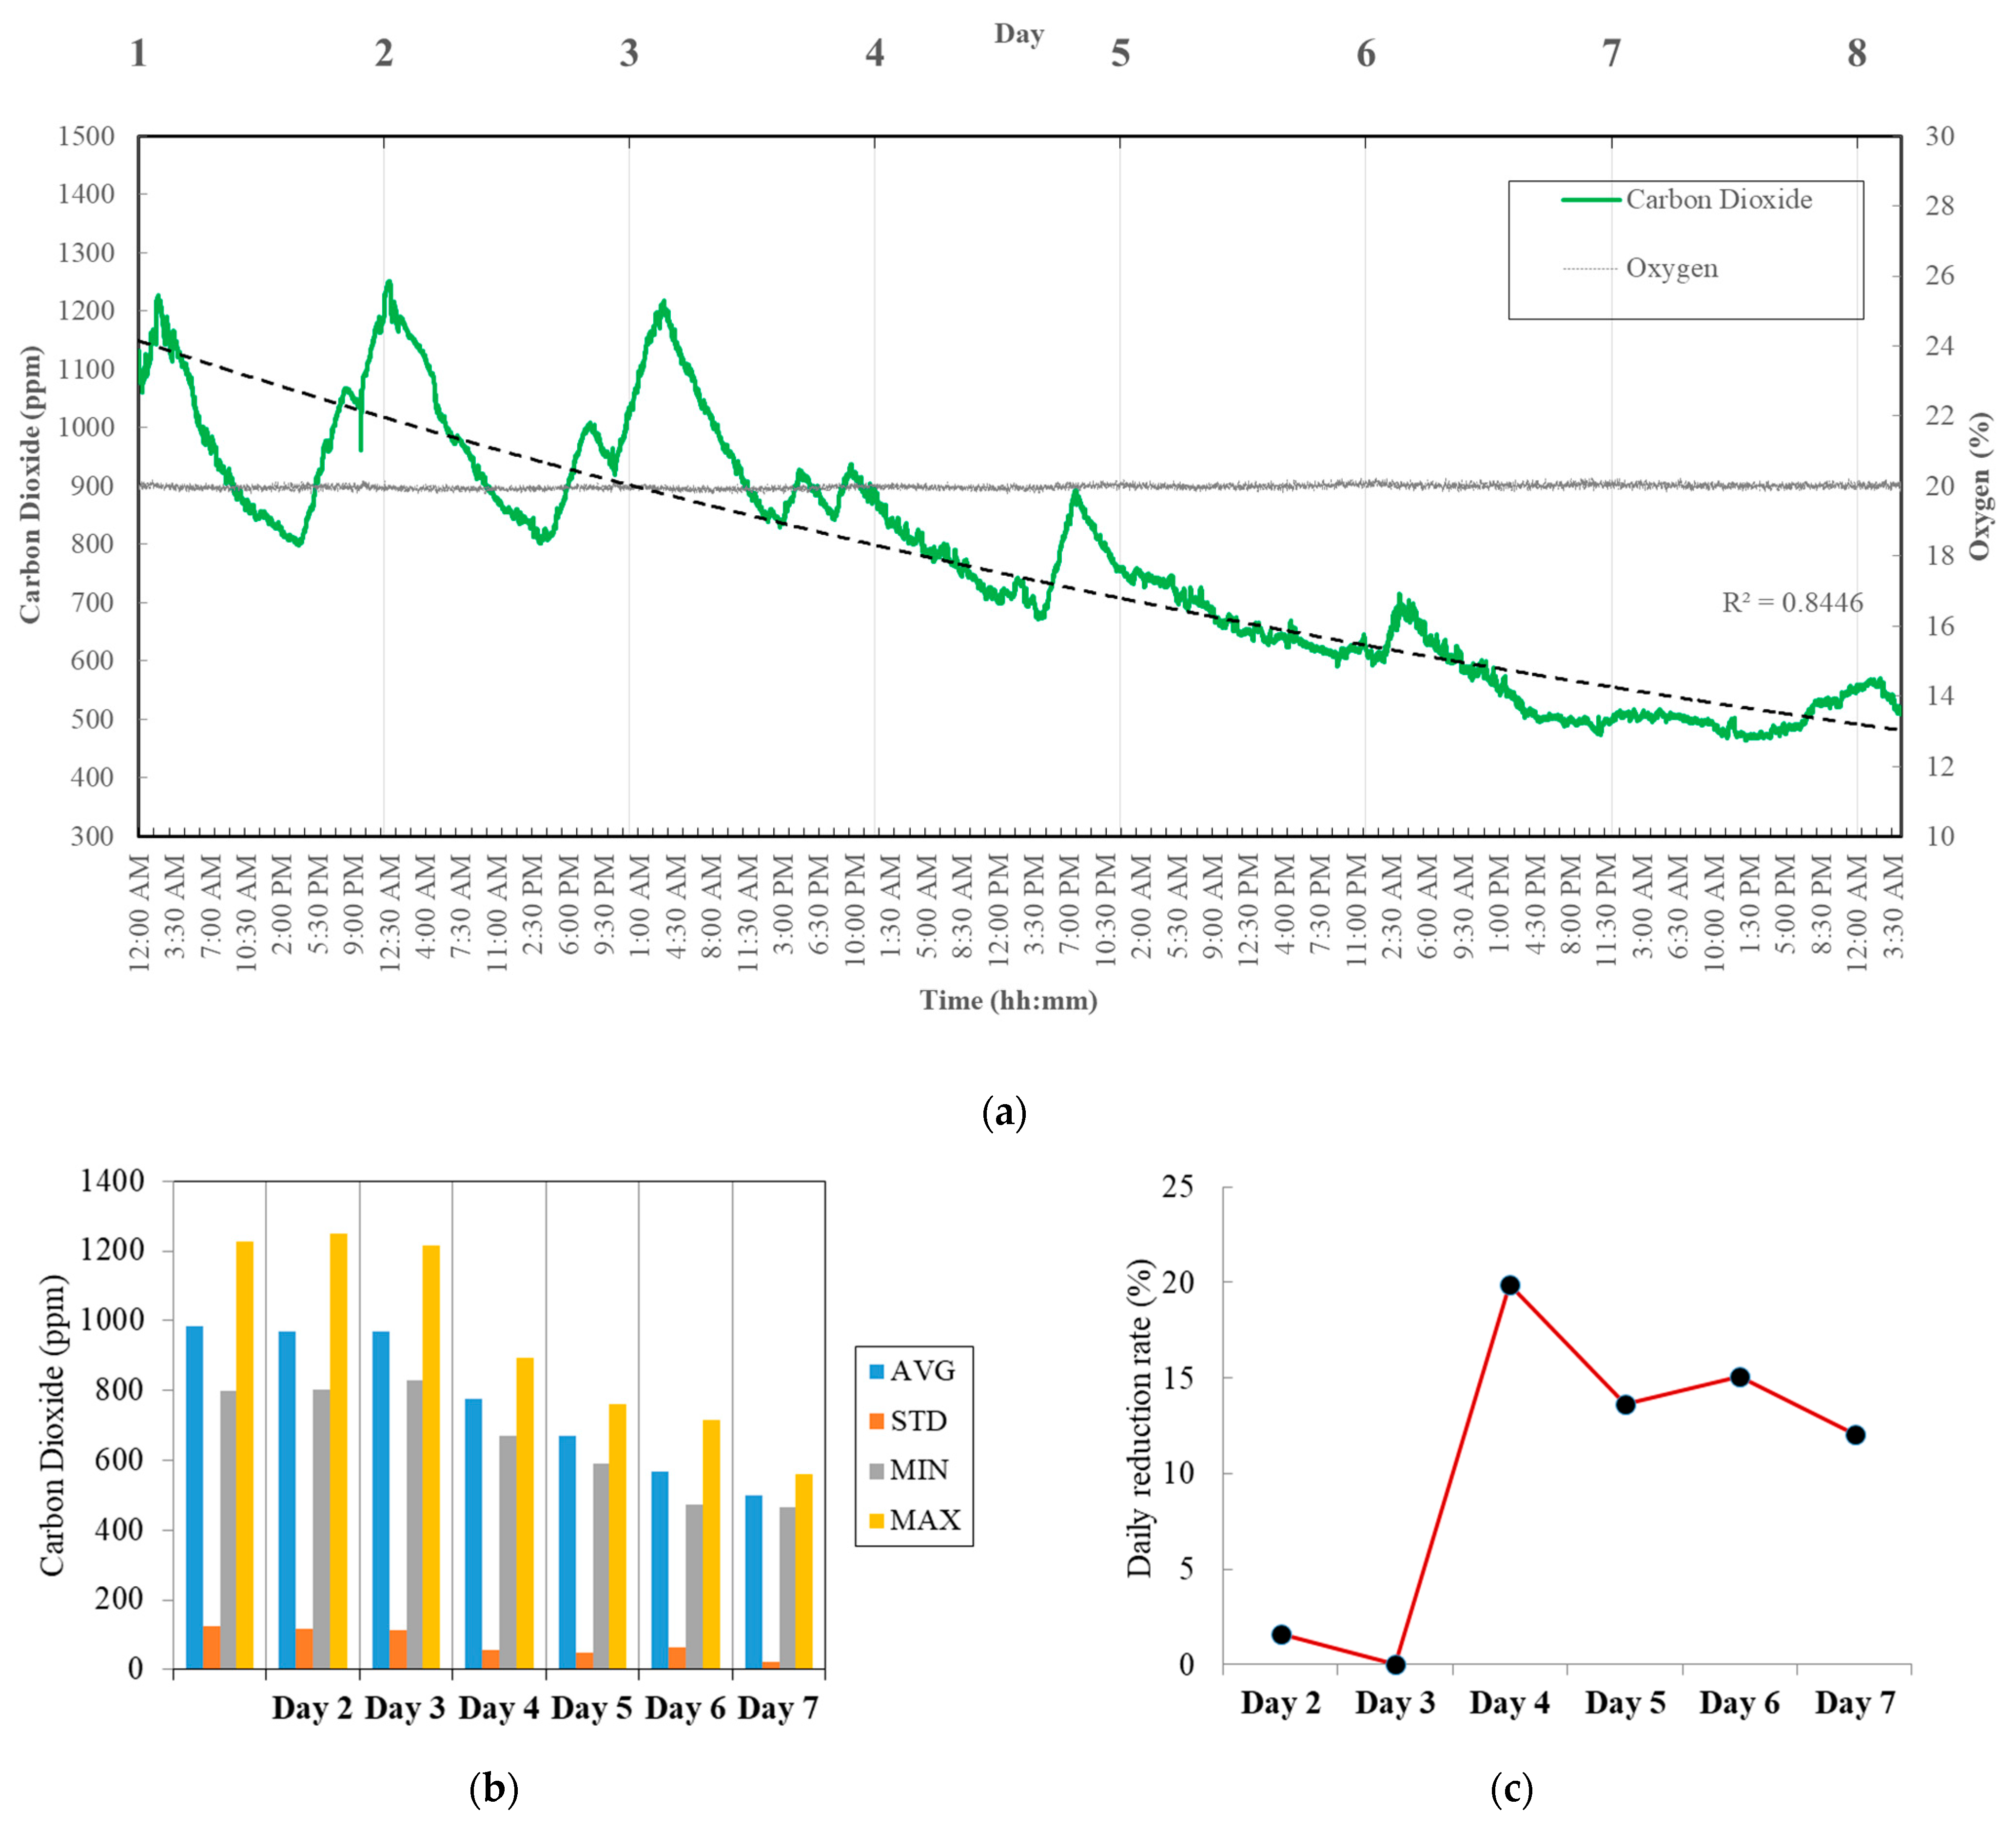
Figure 11a presents overall trends of CO2 reduction. Starting from ~1100 ppm in a non-treated environmental state, the CO2 concentration gradually decreased by 55%, less than 500 ppm after 7 days. The regular fluctuations during the lag phase (1~3 days) of algal growth parallel a cyclic metabolic pattern of S. maxima; CO2 decreases due to daytime photosynthesis and increases during the night respiration. Before Day 3, it was seen that CO2 accumulations were peaked at 12:00~2:00 a.m., but the peak intensity noticeably decreased since Day 4. In Figure 11b, the changes in daily average CO2 concentration suggest that the exponential cell growth during Day 3 and 4 (see Figure 7) results in a sharp CO2 decline with a diminutive respiration effect. The reduction rates in Figure 11c confirm a thriving event on Day 4, which is consistent with study [31] revealing that Spirulina cultures undergo exponential growth regimes in 3~7 days followed by stationary phases.
Figure 12 compares CO2 reduction performance of our modified NaHCO3-exclusive SOT and the standard SOT. In Figure 13a–c, CO2 concentrations differed by about 300 ppm, which reveals that early cell growth highly depends on the readily available carbon content. However, note that such gaps were quickly narrowed after Day 4. The Mann–Whitney U test result confirmed that the average concentration in the NaHCO3-exclusive SOT was significantly lower than that in the standard SOT treatment. Also, the Brown–Forsythe test revealed that the null hypothesis could not be rejected, and their variance could be considered similar (Table 4).

3.4. Performance of Individual PBRs under High-Grade CO2

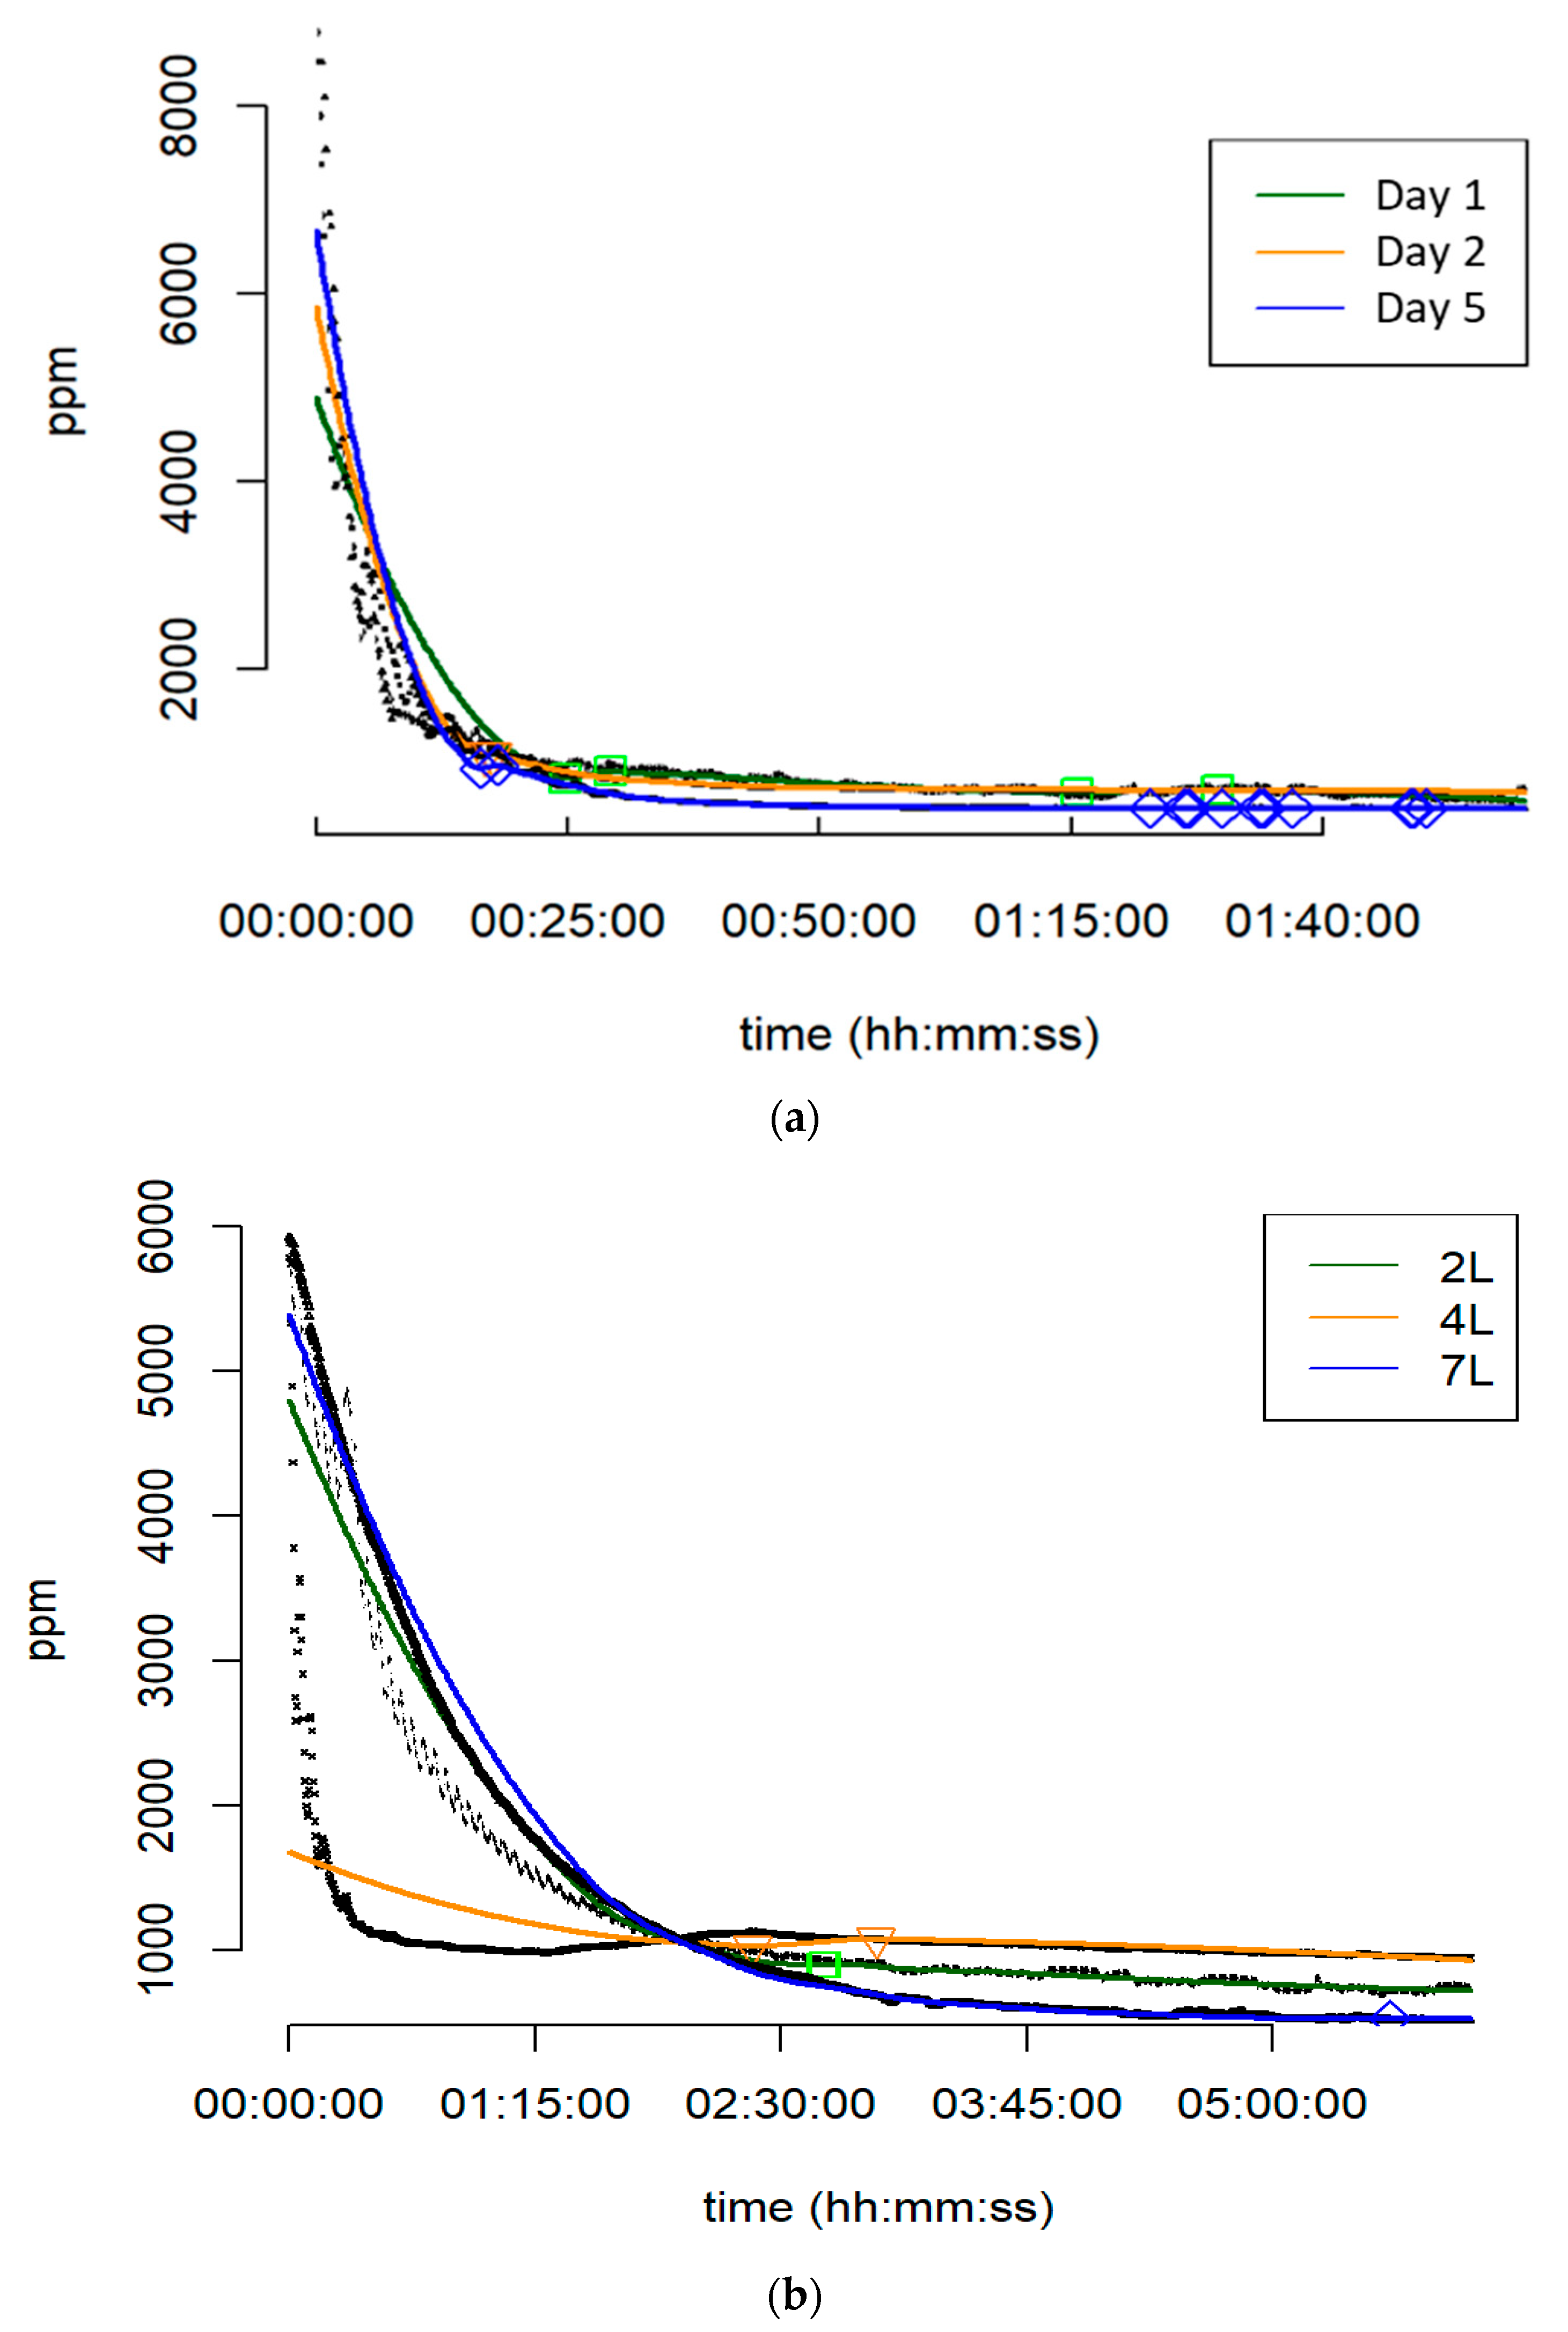
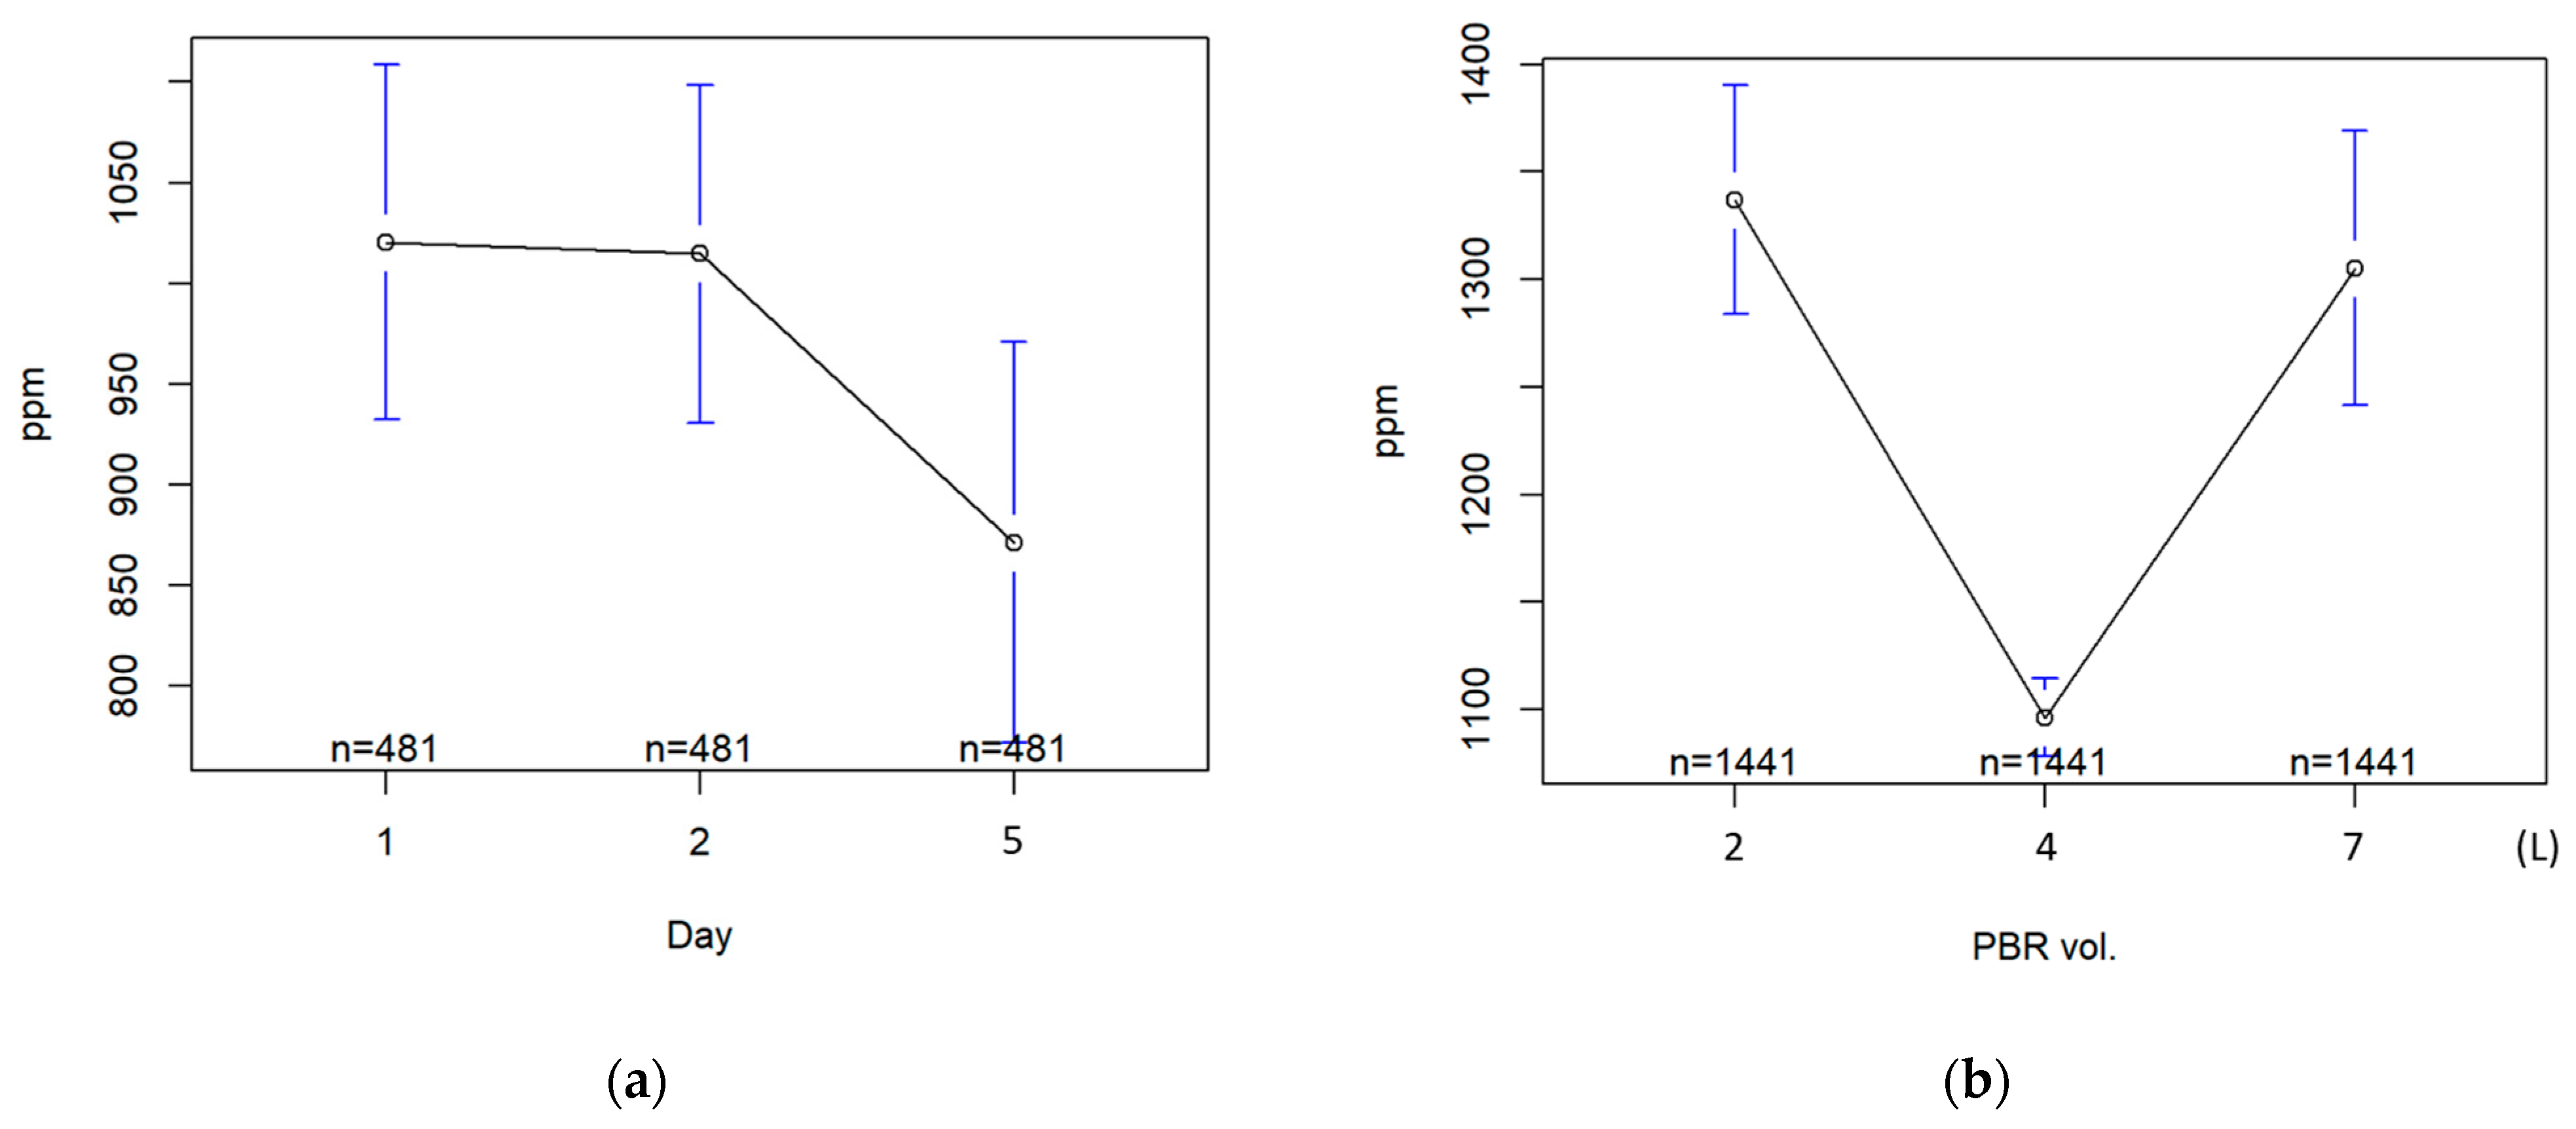
We conducted an additional test to identify the removal effect under a very high CO2 level, according to a date of cultivation (Day 1, 2, and 5) and volumetric capacity (Figure 14, Table 5). A 10,000 and 6000 ppm dose of CO2 (for daily observation and separate PBR test, respectively) were initially supplied in 30 s and mechanically reinforced to circulate the system through the air tubes at a rate of 2 L/min. Each test was started at 12:00 PM and continued for 6 h. Figure 13 displays the measured data distributions and their polynomial approximation. As the profiles show in Figure 13a, for all dates, the CO2 concentrations in the chamber were shortly decayed in 25 min and leveled off afterwards. Nevertheless, note that their absorption behaviors were different. Estimated from the fit curves, they began to stabilize at 24 min 37 s (Day 1), 17 min 7 s (Day 2), and 16 min 48 s (Day 4), respectively. The mean value of 871.2 ppm on Day 5 was significantly lower than that of Day 1 and 2 (1020.4 and 1014.5 ppm). The Kruskal–Wallis rank sum test followed by the Dunn test using the Bonferroni method supported this difference, which confirmed better performance of the system on Day 5.
As expected in the developmental states and Figure 11a, this suggests that the system improves the IAQ more efficiently after full-fledged S. maxima growth. However, note that the Dunn test p-values showed that variances were significantly different in all the cases, but it finds that the variance of Day 1 and Day 2 was statistically identical. Figure 13b characterizes an impact of the culture volume and light on individual PBRs’ performances on Day 7. The largest volume (7 L) showed a stable settlement at the minimum of 515 ppm at the end. Also, the 7L-PBR performance more continuously saturated until the end of the test, while the 2L- and 4L-PBR tended to reach a plateau earlier (at ~2 h 43 min and ~2 h 21 min, respectively). It is interesting to note that the quickest CO2 drop (Figure 14b) was detected in the 4L-PBR illuminated by the highest power (28.8 W) yellow LED. This result parallels the fact that increased energy intensity rapidly activates photosynthetic production of microalgae before saturation [59]. Meanwhile, one may assume that the 7-L PBR should have showed better CO2 mitigation during the early stage, since the cell’s vital response is generally the most sensitive at red LED wavelengths of 640–700 nm [60]. However, this result does not contradict the existing findings [52,61] that light source color has a far lesser impact on cultivation than the amount of photon energy reception.

3.5. Study Limitations and Further Implications

Building codes and green building standards increasingly regulate airtight construction for energy efficiency. It gives rise to significant extra energy use for ventilation, which may take 40% of the primary energy use [62]. Low-cost renewable microalgal air-remedying systems can offer a useful option in this context.
For practical use of such a living PBR system for IAQ improvement, note that the photosynthetic performance must be affected by the choice of species, nutritional status, seasonality, and room conditions, including temperature, light intensity, and carbon density. Accordingly, although the IAQ-modifying ability was clinically proved by comparing other treated cases, a lack of parallel test groups per each case may lead to uncertainty in data interpretation and limit generalizing the above findings. A further parametric analysis is necessary to identify influence of the individual environmental factors (e.g., water pH, evaporative loss, aeration rate, and CO2 supply dose) on the cell growth in varying NaHCO3 content and biochemical composition. Cultivation of the algae in harsh, cold, and low-sun interior environments can be considered to investigate the system performance in respect to different scenarios of building occupancy.
On the other hand, for greater commercial possibility of the system operation, technological and market maturity need to be achieved to make the product and process more economical in a close-knit culturist–consumer chain. As some techno-economic studies regarding microalgae for biofuel production suggest [63,64], the developed system might not be viable for a large-scale use or mass production. Nevertheless, in the present experimental stage, it is very challenging to discuss large-scale economic feasibility such as payback periods and return on investment (ROI), other than a small-facility life-cycle analysis or compromise between the promising opportunity of the microalgae as air-remedying material and immediate availability of existing building systems.

4. Conclusions

Microalgae-based phytoremediation can provide an ecologically safe indoor air-cleaning method. A main goal of our experiments was to develop a S. maxima-activated CO2-absorbing system and demonstrate CO2 removal potential in a low-sodium-bicarbonate PBR environment. We investigated the effect of bicarbonate SOT amendment on the S. maxima culture and CO2 absorption performance in indoor growth. The morphological characteristics of the cell growth demonstrated that S. maxima can be cultured in the NaHCO3-reduced SOT, even though its full development could be slightly delayed. We developed an indoor PBR system that cultured S. maxima in a total 13 L volume of NaHCO3-reduced (by 50%) SOT media and measured CO2 change in the test chamber. The results suggest that the developed microalgae system integrated with a low-rate air circulation can eliminate about 55% and 83~92% of CO2 in the air, in a natural room state and under high CO2 concentrations. It was confirmed that that air quality control critically depends on the vitality of the microalgae in the photobioreactors. Considering that general use of microalgal air-control applications is often limited by cultivation complexity, it can be drawn that use of the NaHCO3-contrained SOT medium may offer an effective solution to encourage the development of microalgae-enabled ventilation systems in the future.

Author Contributions

M.H. and J.P.: conceptualization, investigation, resources; H.Y.: formal analysis, writing—original draft, review and editing; I.K.: review and editing. All authors have read and agreed to the published version of the manuscript.

Funding

This research was supported by a Korea Agency for Infrastructure Technology Advancement (KAIA) grant funded by the Ministry of Land, Infrastructure and Transport (Grant: RS-2021-KA163269), the National Research Foundation of Korea (NRF), grant number: NRF-2021R1C1C100340312, and an Ajou University Research Grant (S-2021-G0001-00016).

Institutional Review Board Statement

Not applicable.

Informed Consent Statement

Not applicable.

Data Availability Statement

Data is contained within the article.

Acknowledgments

The authors thank Mijin Kim (ARTS Lab, Ajou University) and S.H. Choi (ENGLINK, South Korea) for their assistance in this research.

Conflicts of Interest

Author Myungho Han was employed by the company Spirulinafarms Ltd. The remaining authors declare that the research was conducted in the absence of any commercial or financial relationships that could be construed as a potential conflict of interest.

Appendix A

Figure A1. Test room.
Applsci 13 12991 g0a1
Figure A2. Measuring equipment: ① pH meter (CAS Benchtop), ② Auxiliary portable pH meter (CAS High Precision pH Meter PM-1 PLUS), ③ Salinity meter (Salinometer CSF-2500, CAS, Seoul, South Korea), and ④ Light meter (YL-103, Range 0~100,000 LUX ± 3%+5 LUX, Lutron, Washington, DC, USA).
Applsci 13 12991 g0a2

References

  1. Fayad, M.A.; Al-Ogaidi, B.R.; Abood, M.K.; Al-Salihi, H.A. Influence of post-injection strategies and CeO2 nanoparticles additives in the C30D blends and diesel on engine performance, NOX emissions, and PM characteristics in diesel engine. Part. Sci. Technol. 2022, 40, 824–837. [Google Scholar] [CrossRef]
  2. Klepeis, N.; Nelson, W.; Ott, W.; Robinson, J.; Tsang, A.; Switzer, P.; Behar, J.; Hern, S.; Engelmann, W. The National Human Activity Pattern Survey (NHAPS): A resource for assessing exposure to environmental pollutants. J. Expo. Anal. Environ. Epidemiol. 2001, 11, 231–252. Available online: https://escholarship.org/uc/item/1zg3q68x (accessed on 14 March 2023). [CrossRef] [PubMed]
  3. Persily, A. Development and application of an indoor carbon dioxide metric. Indoor Air 2022, 32, e13059. [Google Scholar] [CrossRef] [PubMed]
  4. Blocken, B.; van Druenen, T.; Ricci, A.; Kang, L.; van Hooff, T.; Qin, P.; Xia, L.; Ruiz, C.A.; Arts, J.; Diepens, J.; et al. Ventilation and air cleaning to limit aerosol particle concentrations in a gym during the COVID-19 pandemic. Build. Environ. 2021, 193, 107659. [Google Scholar] [CrossRef] [PubMed]
  5. Ng, L.; Poppendieck, D.; Dols, W.; Emmerich, S. Evaluating Indoor Air Quality and Energy Impacts of Ventilation in a Net-Zero Energy House Using a Coupled Model. Sci. Technol. Built Environ. 2018, 24, 124–134. [Google Scholar] [CrossRef]
  6. Yu, C.-H.; Huang, C.-H.; Tan, C.-S. A Review of CO2 Capture by Absorption and Adsorption. Aerosol Air Qual. Res. 2012, 12, 745–769. [Google Scholar] [CrossRef]
  7. Mata, T.M.; Oliveira, G.M.; Monteiro, H.; Silva, G.V.; Caetano, N.S.; Martins, A.A. Indoor Air Quality Improvement Using Nature-Based Solutions: Design Proposals to Greener Cities. Int. J. Environ. Res. Public Health 2021, 18, 8472. [Google Scholar] [CrossRef]
  8. Hinkov, I.; Lamari, F.D.; Langlois, P.; Dicko, M.; Chilev, C.; Pentchev, I. Carbon Dioxide Capture by Absorption (Review). J. Chem. Technol. Metall. 2016, 51, 609–626. [Google Scholar]
  9. Fang, M.; Xiang, Q.; Zhou, X.; Ma, Q.; Luo, Z. Experimental Study on CO2 Absorption into Aqueous Ammonia-based Blended Absorbents. Energy Procedia 2014, 61, 2284–2288. [Google Scholar] [CrossRef]
  10. Lin, C.-C.; Lin, H.-T. Removal of Carbon Dioxide from Indoor Air Using a Cross-Flow Rotating Packed Bed. Energy Procedia 2013, 37, 1187–1193. [Google Scholar] [CrossRef]
  11. Hu, S.-C.; Shiue, A.; Chang, S.-M.; Chang, Y.-T.; Tseng, C.-T.; Mao, C.-C.; Hsieh, A.; Chan, A. Removal of carbon dioxide in the indoor environment with sorption-type air filters. Int. J. Low-Carbon Technol. 2017, 12, 330–334. [Google Scholar] [CrossRef]
  12. Ito, T.; Otani, Y.; Namiki, N. Electrostatic Separation of Carbon Dioxide by Ionization in Bifurcation Flow. Aerosol Air Qual. Res. 2014, 4, 91–104. [Google Scholar] [CrossRef]
  13. da Rosa, G.M.; Moraes, L.; Cardias, B.B.; de Souza, M.R.A.Z.; Costa, J.A.V. Chemical absorption and CO2 biofixation via the cultivation of Spirulina in semicontinuous mode with nutrient recycle. Bioresour. Technol. 2015, 192, 321–327. [Google Scholar] [CrossRef] [PubMed]
  14. Karimi-Maleh, H.; Ghalkhani, M.; Dehkordi, Z.S.; Singh, J.; Wen, Y.; Baghayeri, M.; Rouhi, J.; Fu, L.; Rajendran, S. Mof-enabled pesticides as developing approach for sustainable agriculture and reducing environmental hazards. J. Ind. Eng. Chem. 2023, in press. [Google Scholar] [CrossRef]
  15. Ghalkhani, M.; Teymourinia, H.; Ebrahimi, F.; Irannejad, N.; Karimi-Maleh, H.; Karaman, C.; Karimi, F.; Dragoi, E.N.; Lichtfouse, E.; Singh, J. Engineering and application of polysaccharides and proteins-based nanobiocatalysts in the recovery of toxic metals, phosphorous, and ammonia from wastewater: A review. Int. J. Biol. Macromol. 2023, 242, 124585. [Google Scholar] [CrossRef] [PubMed]
  16. Saleem, H.; Zaidi, S.J.; Ismail, A.F.; Goh, P.S. Advances of nanomaterials for air pollution remediation and their impacts on the environment. Chemosphere 2022, 287, 132083. [Google Scholar] [CrossRef] [PubMed]
  17. Luo, J.; Yang, G.; Igalavithana, A.D.; He, W.; Gao, B.; Tsang, D.C.; Ok, Y.S. Effects of elevated CO2 on the phytoremediation efficiency of Noccaea caerulescens. Environ. Pollut. 2019, 255, 113169. [Google Scholar] [CrossRef]
  18. Govindaraju, M.; Fowmitha Banu, J.; Senthamil Selvi, S.; Goel, M. CO2 Sequestration Through Phytoremediation Techniques with Special Emphasis on Urban Forestry to Mitigate Climate Change Impact. In Climate Change and Green Chemistry of CO2 Sequestration. Green Energy and Technology; Goel, M., Satyanarayana, T., Sudhakar, M., Agrawal, D.P., Eds.; Springer: Singapore, 2021. [Google Scholar] [CrossRef]
  19. Ravindra, K.; Mor, S. Phytoremediation potential of indoor plants in reducing air pollutants. Front. Sustain. Cities 2022, 4, 1039710. [Google Scholar] [CrossRef]
  20. Thomas, C.K.; Kim, K.J.; Kays, S.J. Phytoremediation of Indoor Air. HortScience 2015, 50, 765–768. [Google Scholar] [CrossRef]
  21. Thongsanit, P.; Ananpattarachai, J.; Sonklin, W.; Techowanich, A.; Jewyou, P.; Kooktaisong, A. Efficiency of Snake Plants Absorb Carbon Dioxide in Offices. In Proceedings of the International Conference on Chemical, Metallurgy and Material Science Engineering (CMMSE-2015), Pattaya, Thailand, 10–11 August 2015; pp. 16–20. [Google Scholar] [CrossRef]
  22. Suhaimi, M.M.; Leman, A.M.; Safii, H. Indoor Plants as Agents Deterioration of Gas Pollutants. ARPN J. Eng. Appl. Sci. 2016, 11, 10944–10949. [Google Scholar]
  23. Sharma, S.; Bakht, A.; Jahanzaib, M.; Lee, H.; Park, D. Evaluation of the Effectiveness of Common Indoor Plants in Improving the Indoor Air Quality of Studio Apartments. Atmosphere 2022, 13, 1863. [Google Scholar] [CrossRef]
  24. Irga, P.J.; Tropy, F.R.; Burchett, M.D. Can hydroculture be used to enhance the performance of indoor plants for the removal of air pollutants? Atmos. Environ. 2013, 77, 267–271. [Google Scholar] [CrossRef]
  25. Mata, T.M.; Martins, A.A.; Calheiros, C.S.C.; Villanueva, F.; Alonso-Cuevilla, N.P.; Gabriel, M.F.; Silva, G.V. Indoor Air Quality: A Review of Cleaning Technologies. Environments 2022, 9, 118. [Google Scholar] [CrossRef]
  26. Yewale, P.; Wagle, N.; Lenka, S.; Bannigol, P.; Junnarkar, M.; Prakash, D.; Mandal, A.; Stigh, C.; Sahasrabudhe, T.; Vannalwar, T.; et al. Studies on Biosmotrap: A multipurpose biological air purifier to minimize indoor and outdoor air pollution. J. Clean. Prod. 2022, 357, 132001. [Google Scholar] [CrossRef]
  27. Sudhakar, K.; Suresh, S.; Premalatha, M. An Overview of CO2 Mitigation Using Algae Cultivation Technology. Int. J. Chem. Res. 2011, 3, 110–117. Available online: http://www.bioinfo.in/contents.php?id=23 (accessed on 3 April 2023).
  28. Iglina, T.; Iglin, P.; Pashchenko, D. Industrial CO2 Capture by Algae: A Review and Recent Advances. Sustainability 2022, 14, 3801. [Google Scholar] [CrossRef]
  29. Miranda, A.M.; Hernandez-Tenorio, F.; Ocampo, D.; Vargas, G.J.; Sáez, A.A. Trends on CO2 Capture with Microalgae: A Bibliometric Analysis. Molecules 2022, 27, 4669. [Google Scholar] [CrossRef]
  30. Singh, S.P.; Singh, P. Effect of CO2 concentration on algal growth: A review. Renew. Sustain. Energy Rev. 2014, 38, 172–179. [Google Scholar] [CrossRef]
  31. Suali, E.; Sarbatly, R. Conversion of Microalgae to Biofuel. Renew. Sustain. Energy Rev. 2012, 16, 4316–4342. [Google Scholar] [CrossRef]
  32. German Power Plant Testing CO2-Scrubbing Algae, 2010, Space Daily. Available online: https://www.spacedaily.com/reports/German_power_plant_testing_CO2-scrubbing_algae_999.html (accessed on 28 March 2023).
  33. Clarens, A.F.; Resurrection, E.P.; White, M.A.; Colosi, L.M. Environmental Life Cycle Comparison of Algae to Other Bioenergy Feedstocks. Environ. Sci. Technol. 2010, 44, 1813–1819. [Google Scholar] [CrossRef]
  34. The Aerium 3.0, AlgenAir. Available online: https://algenair.com (accessed on 15 March 2023).
  35. LIQUID3: Urban Photo-Bioreactor. Available online: https://liquid3.rs (accessed on 15 March 2023).
  36. de Leon, S.P. Hypergiant Is Using AI And Algae To Take on Climate Change, 23 January 2020, Forbes. Available online: https://www.forbes.com/sites/cognitiveworld/2020/01/23/hypergiant-ai-algae-climate-change/?sh=1a5a8bb728c3 (accessed on 15 March 2023).
  37. Wang, W.N.; Soulis, J.; Yang, Y.J.; Biswas, P. Comparison of CO2 Photoreduction Systems: A Review. Aerosol Air Qual. Res. 2014, 14, 533–549. [Google Scholar] [CrossRef]
  38. Klinthong, W.; Yang, Y.-H.; Huang, C.-H.; Tan, C.-S. A Review: Microalgae and Their Applications in CO2 Capture and Renewable Energy. Aerosol Air Qual. Res. 2015, 15, 712–742. [Google Scholar] [CrossRef]
  39. Zhu, B.; Shen, H.; Li, Y.; Liu, Q.; Jin, G.; Han, J.; Zhao, Y.; Pan, K. Large-Scale Cultivation of Spirulina for Biological CO2 Mitigation in Open Raceway Ponds Using Purified CO2 from a Coal Chemical Flue Gas. Front. Bioeng. Biotechnol. 2020, 7, 441. [Google Scholar] [CrossRef] [PubMed]
  40. Cheng, Y.W.; Lim, J.S.M.; Chong, C.C.; Lam, M.K.; Lim, J.W.; Tan, I.S.; Foo, H.C.W.; Show, P.L.; Lim, S. Unravelling CO2 capture performance of microalgae cultivation and other technologies via comparative carbon balance analysis. J. Environ. Chem. Eng. 2021, 9, 106519. [Google Scholar] [CrossRef]
  41. de Morais, M.G.; Costa, J.A.V. Carbon Dioxide Fixation by Chlorella kessleri, C. vulgaris, Scenedesmus obliquus and Spirulina sp. Cultivated in Flasks and Vertical Tubular Photobioreactors. Biotechnol. Lett. 2007, 29, 1349–1352. [Google Scholar] [CrossRef]
  42. Cheng, I.; Zhang, I.; Chen, H.; Gao, C. Carbon Dioxide Removal from Air by Microalgae Cultured in a Membrane-Photobioreactor. Sep. Purif. Technol. 2006, 50, 324–329. [Google Scholar] [CrossRef]
  43. Voskian, S.; Hatton, T.A. Faradaic electro-swing reactive adsorption for CO2 capture. Energy Environ. Sci. 2019, 12, 3530–3547. [Google Scholar] [CrossRef]
  44. Sydney, E.B.; Sturm, W.; de Carvalho, J.C.; Thomaz-Soccol, V.; Larroche, C.; Pandey, A.; Soccol, C.R. Potential carbon dioxide fixation by industrially important microalgae. Bioresour. Technol. 2010, 101, 5892–5896. [Google Scholar] [CrossRef]
  45. Margarites, A.C.; Volpato, N.; Araújo, E.; Cardoso, L.G.; Bertolin, T.E.; Colla, L.M.; Costa, J.A.V. Spirulina platensis is more efficient than Chlorella homosphaera in carbohydrate productivity. Environ. Technol. 2017, 38, 2209–2216. [Google Scholar] [CrossRef]
  46. Shabani, M.; Sayadi, M.H.; Rezaei, M.R. CO2 bio-sequestration by Chlorella vulgaris and Spirulina platensis in response to different levels of salinity and CO2. Proc. Int. Acad. Ecol. Environ. Sci. 2016, 6, 53–61. [Google Scholar]
  47. Soni, R.A.; Sudhakar, K.; Rana, R.S. Comparative study on the growth performance of Spirulina platensis on modifying culture media. Energy Rep. 2019, 5, 327–336. [Google Scholar] [CrossRef]
  48. Jung, C.H.G.; Braune, S.; Waldeck, P.; Küpper, J.-H.; Petrick, I.; Jung, F. Morphology and Growth of Arthrospira platensis during Cultivation in a Flat-Type Bioreactor. Life 2021, 11, 536. [Google Scholar] [CrossRef] [PubMed]
  49. Lamtham, S.; Sornchai, P. Biofixation of CO2 from a power plant through large-scale cultivation of Spirulina maxima. South Afr. J. Bot. 2022, 147, 840–851. [Google Scholar] [CrossRef]
  50. Ogawa, T.; Terui, G. Studies on the growth of Spirulina platensis. (I) On the pure culture of Spirulina platensis. J. Ferment. Technol. 1970, 48, 361–367. [Google Scholar]
  51. Kantarci, N.; Borak, F.; Ulgen, K.O. Bubble column reactors. Process Biochem. 2005, 40, 2263–2283. [Google Scholar] [CrossRef]
  52. Pimolrat, P.; Direkbusarakom, S.; Chinajariyawong, C.; Powtongsook, S. The effect of sodium bicarbonate concentrations on growth and biochemical composition of Chaetoceros gracilis Schutt. Kasetsart Univ. Fish. Res. Bull. 2010, 34, 40–47. [Google Scholar]
  53. Korea Research Institute of Bioscience and Biotechnology. The Medium Composition for Optimum Growth and Maximum Biomass of Spirulina genus. Korean Patent KR1020040065536A, 2006. Available online: https://patents.google.com/patent/KR100622025B1/ko (accessed on 29 August 2022).
  54. Peng, X.; Liu, S.; Zhang, W.; Zhao, Y.; Chen, L.; Wang, H.; Liu, T. Triacylglycerol accumulation of Phaeodactylum tricornutum with different supply of inorganic carbon. J. Appl. Phycol. 2014, 26, 131–139. [Google Scholar] [CrossRef]
  55. Rodrigues, M.S.; Ferreira, L.S.; Converti, A.; Sato, S.; Carvalho, J.C.M. Fed-batch cultivation of Arthrospira (Spirulina) platensis: Potassium nitrate and ammonium chloride as simultaneous nitrogen sources. Bioresour. Technol. 2010, 101, 4491–4498. [Google Scholar] [CrossRef]
  56. Aishvarya, V.; Pradhan, N.; Nayak, R.R.; Sukla, L.B.; Mishra, B.K. Enhanced inorganic carbon uptake by Chlorella sp. IMMTCC-2 under autotrophic conditions for lipid production and CO2 sequestration. J. Appl. Phycol. 2012, 24, 1455–1463. Available online: https://grow-organic-spirulina.com/product-category/live-spirulina-culture/ (accessed on 9 March 2023). [CrossRef]
  57. Monteir, M.P. da C.; Luchese, R.H.; Absher, T.M. Effect of Three Different Types of Culture Conditions. Arch. Biol. Technol. 2010, 53, 369–373. [Google Scholar] [CrossRef]
  58. Mokashi, K.; Shetty, V.; George, S.A.; Sibi, G. Sodium Bicarbonate as Inorganic Carbon Source for Higher Biomass and Lipid Production Integrated Carbon Capture in Chlorella vulgaris. Achiev. Life Sci. 2016, 10, 111–117. [Google Scholar] [CrossRef]
  59. Soletto, D.; Binaghi, L.; Ferrari, L.; Lodi, A.; Carvalho, J.C.M.; Zilli, M.; Converti, A. Effects of carbon dioxide feeding rate and light intensity on the fed-batch pulse-feeding cultivation of Spirulina platensis in helical photobioreactor. Biochem. Eng. J. 2008, 39, 369–375. [Google Scholar] [CrossRef]
  60. Wati, A.; Rusva, R.; Umar, L. Effect of LED Wavelengths and Light-Dark Cycle on Photosynthetic Production of Chlorella Kessleri for AlgaeBased Biosensor Optimization. J. Phys. Conf. Ser. 2019, 1351, 012003. [Google Scholar] [CrossRef]
  61. Bialevich, V.; Zachleder, V.; Bišová, K. The Effect of Variable Light Source and Light Intensity on the Growth of Three Algal Species. Cells 2022, 11, 1293. [Google Scholar] [CrossRef] [PubMed]
  62. Pe’rez-Lombard, L.; Ortiz, J.; Pout, C. A review on buildings energy consumption information. Energy Build. 2008, 40, 394–398. [Google Scholar] [CrossRef]
  63. Branco-Vieira, M.; Mata, T.M.; Martins, A.A.; Freitas, M.A.; Caetano, N.S. Economic analysis of microalgae biodiesel production in a small-scale facility. Energy Rep. 2020, 6, 325–332. [Google Scholar] [CrossRef]
  64. Llamas, B.; Suárez-Rodríguez, M.C.; González-López, C.V.; Mora, P.; Gabriel Acién, F. Techno-economic analysis of microalgae related processes for CO2 bio-fixation. Algal Res. 2021, 57, 102339. [Google Scholar] [CrossRef]
Figure 1. Air-cleaning mechanism of the Spirulina microalgae.
Applsci 13 12991 g001
Figure 2. Agal air purification: system scheme.
Applsci 13 12991 g002
Figure 3. System setting and installation of experimental equipment: (a) PBRs, (b) Test chamber and sensors.
Applsci 13 12991 g003aApplsci 13 12991 g003b
Figure 4. Test equipment setup (IAQ test air chamber): (a) dimensions of equipment, (b) air chamber—inlet view (right side), (c) air circulation scheme, (d) air chamber—outlet view (left side).
Applsci 13 12991 g004
Figure 5. Lab facility: cultivation of S. maxima in different medium.
Applsci 13 12991 g005
Figure 6. Microscopy (×150) of the seed cultures in different media: (a) SOT, (b) SOT excl. NaHCO3 (Day 14 (left), Day 28 (right)).
Applsci 13 12991 g006
Figure 7. Observation of Spirulina growth in different medium treatments (~Day 20): ① Standard SOT (injection of the initial cells cultured in SOT), ② Sodium bicarbonate (NaHCO3)-free SOT (injection of the initial cells cultured in SOT), and ③ SOT excl. NaHCO3 (injection of the initial cells cultured in NaHCO3-free SOT).
Applsci 13 12991 g007
Figure 8. Magnified (×1000) observation of S. maxima cell growth: (a) Day 4, (b) Day 14.
Applsci 13 12991 g008
Figure 9. Cellular microscopy on Day 30: (a) ×1000, (b) ×7000.
Applsci 13 12991 g009aApplsci 13 12991 g009b
Figure 10. Transient CFD simulation of the air dispersion in the test chamber: (a) Initial, 5 s, (b) Stationary, 60 min.
Applsci 13 12991 g010aApplsci 13 12991 g010b
Figure 11. Test results (all PBRs): (a) Chamber CO2 decrease, (b) CO2 reduction per day, (c) Reduction rate per day.
Applsci 13 12991 g011
Figure 12. Test results: (a) Day 1, (b) Day 2, (c) Day 3, (d) Day 5, and (e) Day 7.
Applsci 13 12991 g012
Figure 13. Test results (forced CO2 injection): (a) Daily comparison of CO2 decrease, (b) CO2 decrease and PBR capacity.
Applsci 13 12991 g013
Figure 14. Test results (forced CO2 injection): bar charts: (a) Daily, (b) PBR capacity.
Applsci 13 12991 g014
Table 1. Medium treatments: Cultivation environment.
Factor123
DateABABAB
pH10.019.418.698.837.928.16
Medium temperature (°C)30.129.230.229.030.129.1
Lighting intensity (lux)6842.5 ± 869.0 (Min: 5948, Max: 7629)
CO2 supply (ppm)732.5 ± 44.5
(Lab) Air temperature (°C)32.0 ± 0.3
(Lab) Air humidity (%)98 ± 0.7
O.D.0.520.810.410.680.370.49
Note: A—Day 10, B—Day 20.
Table 2. Magnified cell growth status on Day 9, 14, and 30 (×200).
No.Day 9Day 14Day 30
1Applsci 13 12991 i001Applsci 13 12991 i002Applsci 13 12991 i003
2Applsci 13 12991 i004Applsci 13 12991 i005Applsci 13 12991 i006
3Applsci 13 12991 i007Applsci 13 12991 i008Applsci 13 12991 i009
Table 3. Gas measurement result (chamber, 7 days).
VOCs (ppb)CO (ppm)O2 (%)CH4NO2NH3
μ12998.619.98621.8100.496.7
σ9336.50.0731.914.012.7
Min.0619.745198276
Max.47424220.25704175165
Table 4. Statistical analysis of the carbon dioxide density in the chamber.
Medium Day 1Day 2Day 3Day 5Day 7
SOT excl. NaHCO3μ817.9885.5709.6497.6521.0
σ6.123.117.95.816.6
p-Value**************
Max.828928743510547
Min.807842671479483
Standard SOTμ533.0525.6413.9442.6532.2
σ10.223.612.816.917.1
p-Value***************
Max.542580476465588
Min.486452365373489
Mann–Whitney Up-Value***************
Brown–Forsythep-Value0.767*********0.805
*** p < α, α = 0.001, ** p < β, β = 0.01.
Table 5. Forced CO2 injection: Statistical analysis of the carbon dioxide density in the chamber.
TestParameterDay 1Day 2Day 52 L4 L7 L
μ1020.41014.5871.21337.01096.31305.3
σ982.9940.11112.61028.5349.21231.0
Min.584686504695949515
Kruskalp-Value******
*** p < α, α = 0.001.
Disclaimer/Publisher’s Note: The statements, opinions and data contained in all publications are solely those of the individual author(s) and contributor(s) and not of MDPI and/or the editor(s). MDPI and/or the editor(s) disclaim responsibility for any injury to people or property resulting from any ideas, methods, instructions or products referred to in the content.