Article

A Comparison of the Use of Artificial Intelligence Methods in the Estimation of Thermoluminescence Glow Curves

Vocational School of Imamoglu, Department of Computer Technologies, Cukurova University, Adana 01700, Turkey
Appl. Sci. 2023, 13(24), 13027; https://doi.org/10.3390/app132413027
Submission received: 10 November 2023 / Revised: 30 November 2023 / Accepted: 1 December 2023 / Published: 6 December 2023

Abstract

:
In this study, the thermoluminescence (TL) glow curve test results performed with eleven different dose values were used as training data, and its attempted to estimate the test results of the curves performed at four different doses using artificial intelligence methods. While the dose values of the data used for training were 10, 20, 50, 100, 150, 220, 400, 500, 600, 700, and 900 Gy, the selected dose values of the data for the testing were 40, 276, 320, and 800 Gy. The success of the experimental and artificial neural network results was determined according to the mean squared error (RMSE), regression error (R2), root squared error (RSE), and mean absolute error (MAE) criteria. Studies have been carried out on seven different neural network types. These networks are adaptive network-based fuzzy inference system (ANFIS), general regression neural network (GRNN), radial basis neural network (RBNN), cascade-forward backprop neural network (CFBNN), Elman backprop neural network (EBNN), feed-forward backprop neural network (FFBNN), and layer recurrent neural network (LRNN). This study concluded that the neural network with the Elman backpropagation network type demonstrated the best network performance. In this network, the training success rate is 80.8%, while the testing success rate is 87.95%.

1. Introduction

Thermoluminescence (TL) involves the excitation of electrons from the valence band to the conduction band after an insulator or semiconductor material absorbs energy from an ionizing source so that they are captured by electron traps associated with defects or impurities in the crystal lattice. As a result, with the excitation of electrons in the valence band, free electrons in the conduction band and free holes in the valence band are created. There are electron and hole traps at different depths in the forbidden energy gap. When an insulating or semiconductor material is heated, the trapped electrons will be released into the conduction band after absorbing enough heat energy (activation energy), depending on the trap depth. As the electrons that exit the conduction band return to their steady state, they will not be caught in the traps at the metastable energy level and will merge with the holes in the recombination center (luminescence center). Thus, the amount of radiation stored in the material is emitted as photons. The emitted light intensity is recorded as a function of temperature and is called the “glow curve” and consists of one or more luminescence peaks. Each luminescence peak can ideally be associated with a particular electron or hole capture center [1].
Since the first application of thermoluminescence (TL) in 1965, this technique has made significant advances in many areas, from dating to the detection of irradiated food, environmental dose determination, and its use in medical applications [2]. Any TL material’s dosimetric characteristics are primarily determined by its sensitivity, energy response, stability, and kinetic parameters, which measure the trap emitting centers that produce TL emission. In this study, we tried to estimate the test data results with artificial intelligence methods based on feed-forward, backpropagation, and supervised learning techniques.
A neural network consists of simple linear or non-linear computing elements that are composed of many neurons, interconnected in complex ways, and often organized in layers. Artificial neural networks (ANN) consist of many neurons, and these neurons work simultaneously to perform complex tasks. Thus, it has many advantages, such as being able to learn with different learning algorithms, unsupervised learning, pattern recognition and classification, fault tolerance, parallel operation, and real-time information processing.
A neural network (NN) is an efficient method widely used in machine learning fields such as classification, clustering, and pattern recognition due to its efficiency in solving complex non-linear problems. The neural network model can be used as a predictive model for a particular application, a data processing system. In this study, temperature (T (°C)) and dose values (Gy) were used as input data, and TL signal intensity was used as output data.
In this study, the results of the dose–response curves of the study previously published by Dogan [3] were used as data. The aim of this study is to prove how close the experimental results and the trained artificial intelligence results are to each other. To demonstrate this, four signal intensity values were excluded from the data obtained for 15 different doses, and training was conducted with the remaining 11. Subsequently, efforts were made to determine these four excluded doses. To advance the study to the next stage, two consecutive signal intensity values corresponding to the excluded doses were selected. The modeling techniques used in this study are adaptive network-based fuzzy inference system (ANFIS), general regression neural network (GRNN), radial basis neural network (RBNN), cascade-forward backprop neural network (CFBNN), Elman backprop neural network (EBNN), feed-forward backprop neural network (FFBNN), and layer recurrent neural network (LRNN), respectively. The precursors of feed-forward, backpropagation, and time-delay network structures were used in this study. They all have different middleware connections. In this study, we tried to find the type of network that makes the best approach.

2. Related Work

Although there are few studies on radiation and its applications, there is an increasing number of studies in the literature in this field [4,5]. Sang Yoon Lee et al. [6] developed a new dose evaluation algorithm using a feed-forward neural network using the Bayes-optimized error backpropagation method to achieve higher accuracy in a new personal OSL dosimetry system in α-Al2O3:C by utilizing its optical properties and energy dependencies. Kardan et al. [7] used a neural network method to expediate neutron spectra unfolding in spectrometry with threshold activation detectors (used to measure high-density uptakes such as those in main beams near reactors and accelerators). Nelson and Rittenour [8] presented an alternative method to Rosetta Lite v.1.1 software for calculating soil moisture, which is an important factor for dose rate determination in luminescence and other dating methods. In the study by Yadollahi et al. [9], the Taguchi method and artificial neural network (ANN) were applied to find the optimal RSC mixture containing lead slag aggregate to find the most suitable mixture for all desired quality properties in the production of radiation shielding concrete (RSC). Kröninger et al. [10] used artificial neural networks to predict fading time and irradiation dose using luminescence curve data from LiF thermoluminescence (TL) dosimeters. In their study, Isik et al. [11] simulated the change of the luminescence signal against 10 different dose values using 18 hidden layer neurons and found a 99% similarity between the experimental result and the simulation result. In the same study, the results of the fading test, which is important for determining whether a material is dosimetric, showed similar results in this study. With the help of their research, Derugin et al. [12] provide the first machine-learning-supported radiation protection dosimetry using controversial models.

3. Material and Methods

3.1. Materials

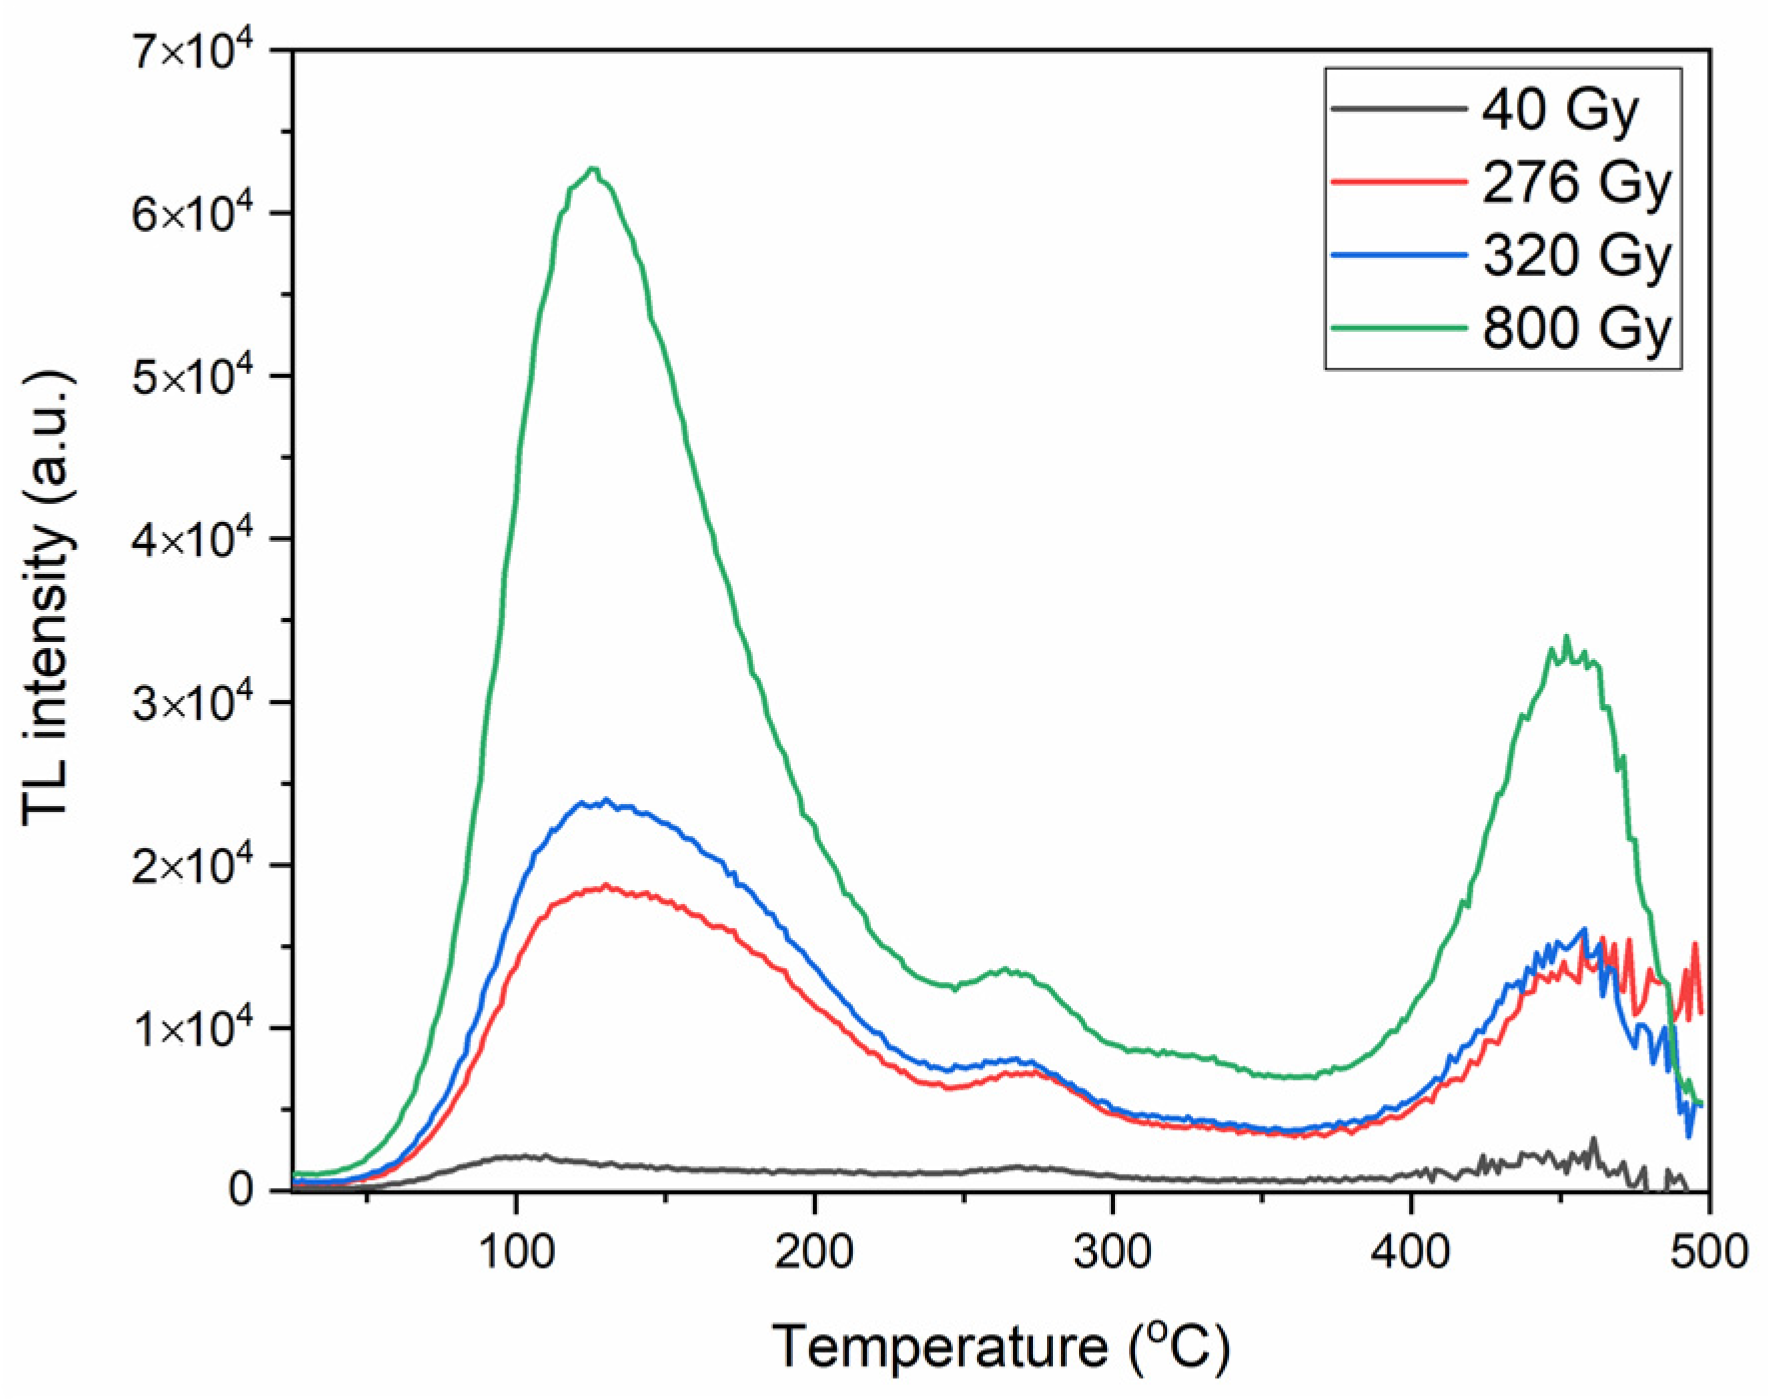
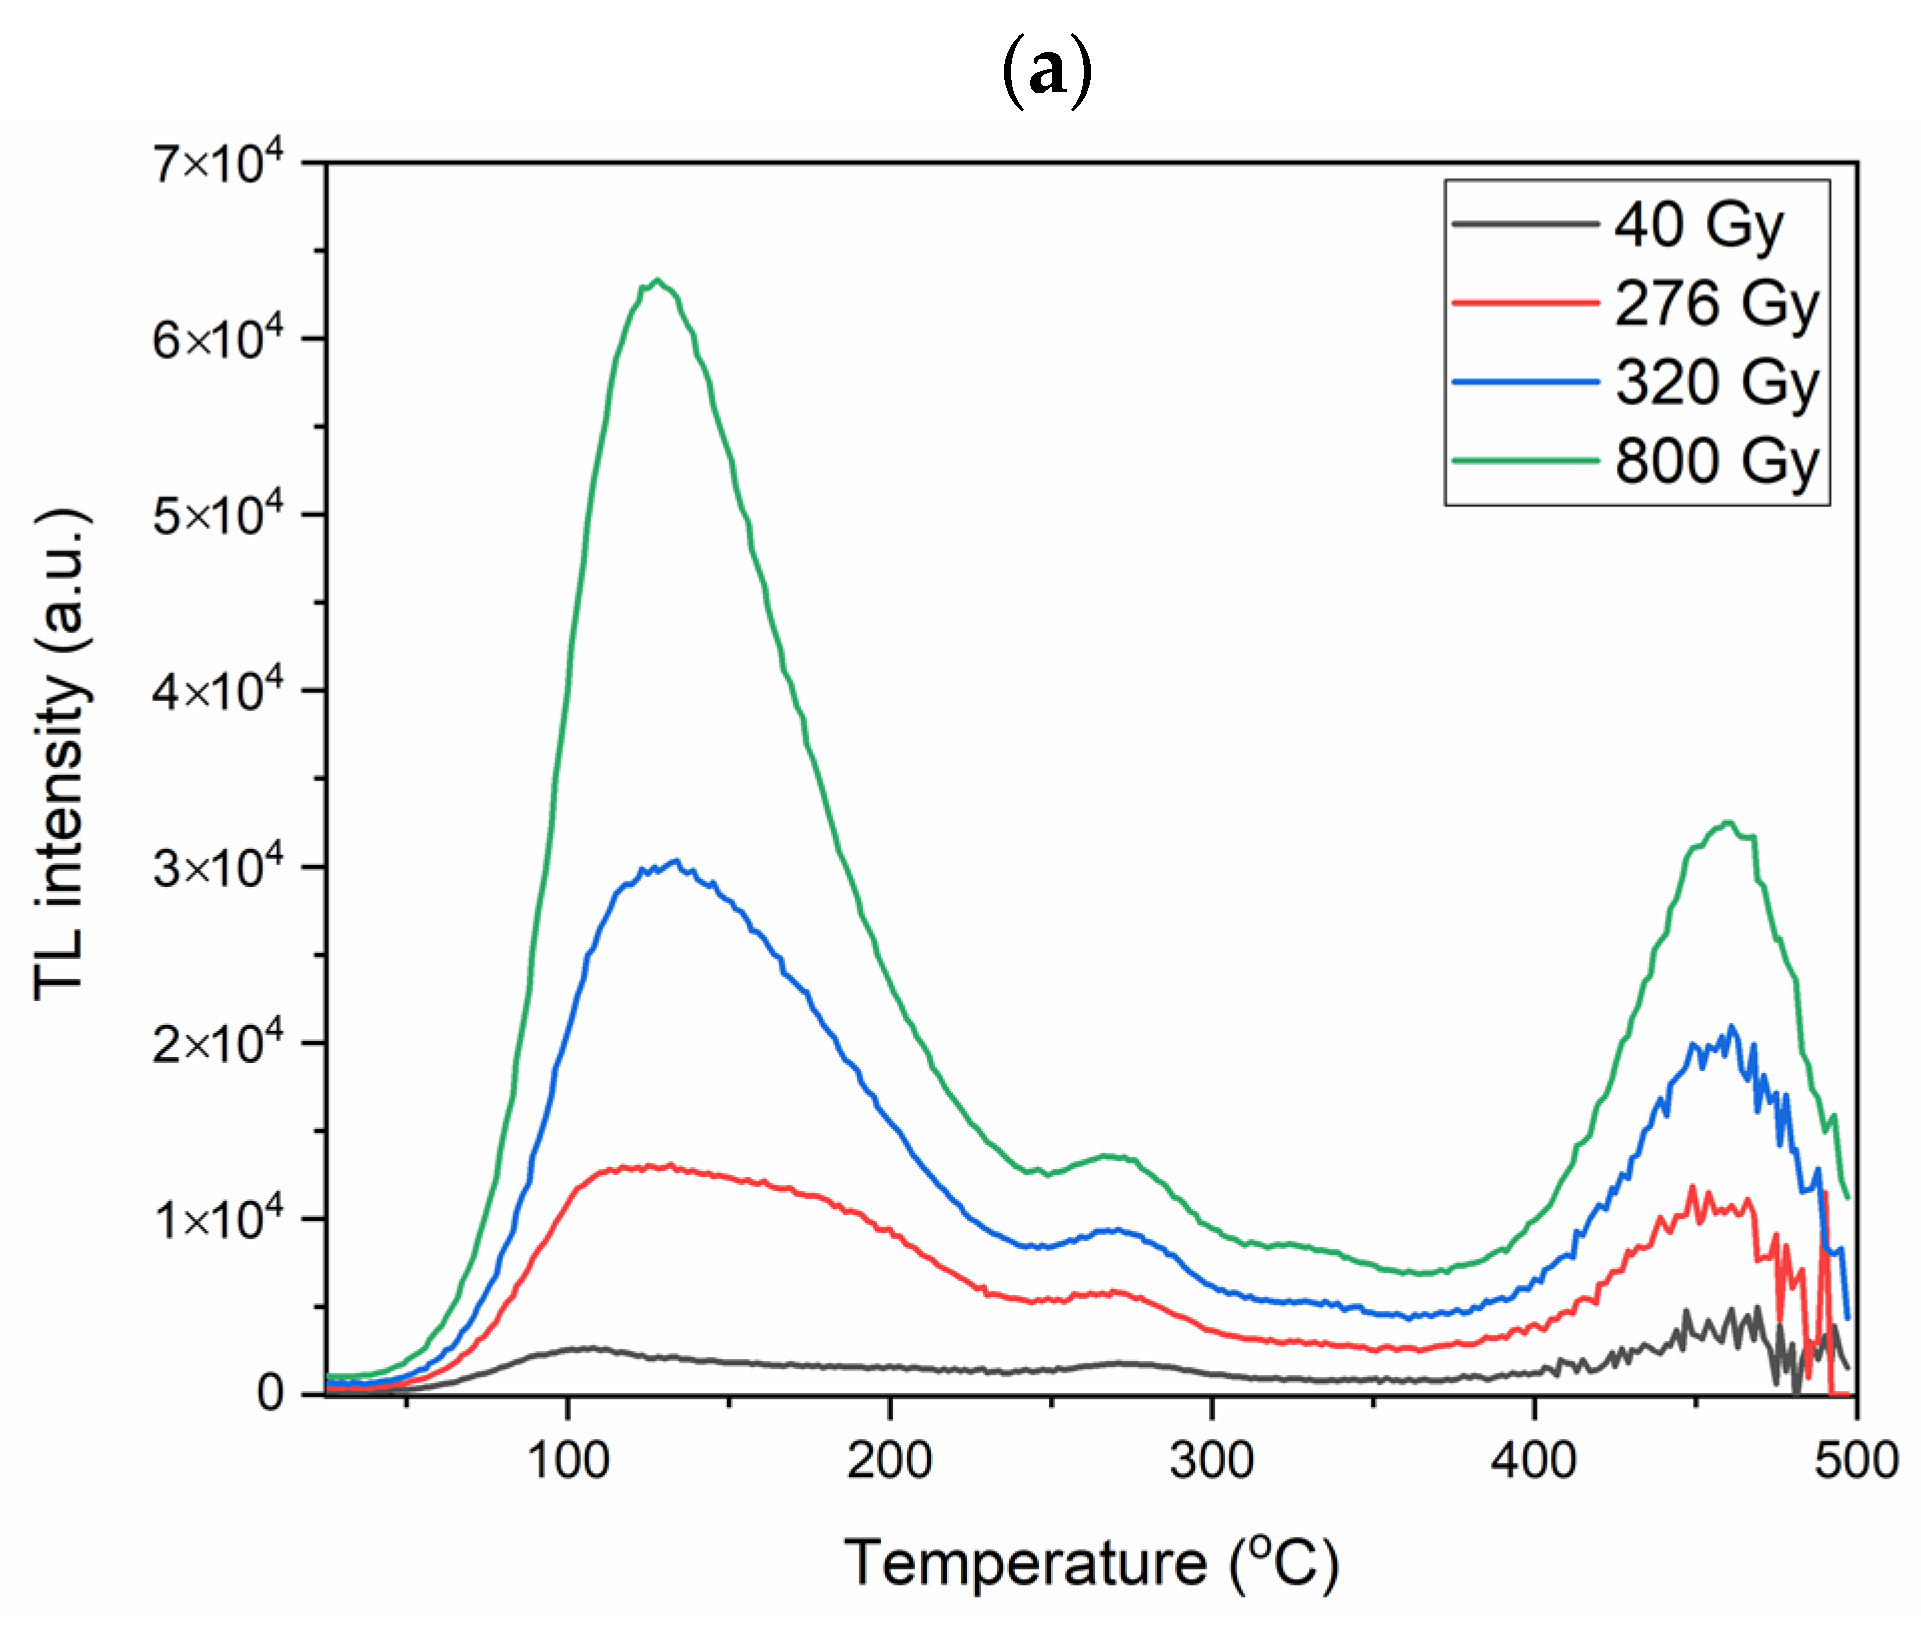
The dose–response curves of thermoluminescence (TL) curves of aluminosilicate samples from Harmancık/İstanbul (Turkey), which is a K-rich silicate, are shown in Figure 1. In the Dogan study, the luminescence glow curve data, called the purple sample, presented in the dose–response curve, were used for the training of artificial intelligence methods. Experimental results of TL glow curves for all doses are provided in Figure 1. In the experimental study, the sample was heated from room temperature (RT) to 500 °C to obtain TL glow curves. An automated Lexsyg Smart TL/OSL reader was used to perform TL experimental measurements at a linear heating rate of 2 °Cs−1.
Fifteen different dose values were considered in this study (10, 20, 40, 50, 100, 150, 220, 276, 320, 400, 500, 600, 700, 800, and 900 Gy). The experimental results of four of these dose values (40, 276, 320, and 800 Gy) were subtracted from the total data, and we attempted to train artificial neural networks with the remaining data. To determine the TL signal intensities obtained from these 4 dose values used, the results obtained from the experimental method (Figure 2) were compared with the results obtained from different neural networks. Additionally, in this study, consecutive dose values of 276 and 320 Gy were chosen to further push artificial intelligence methods.
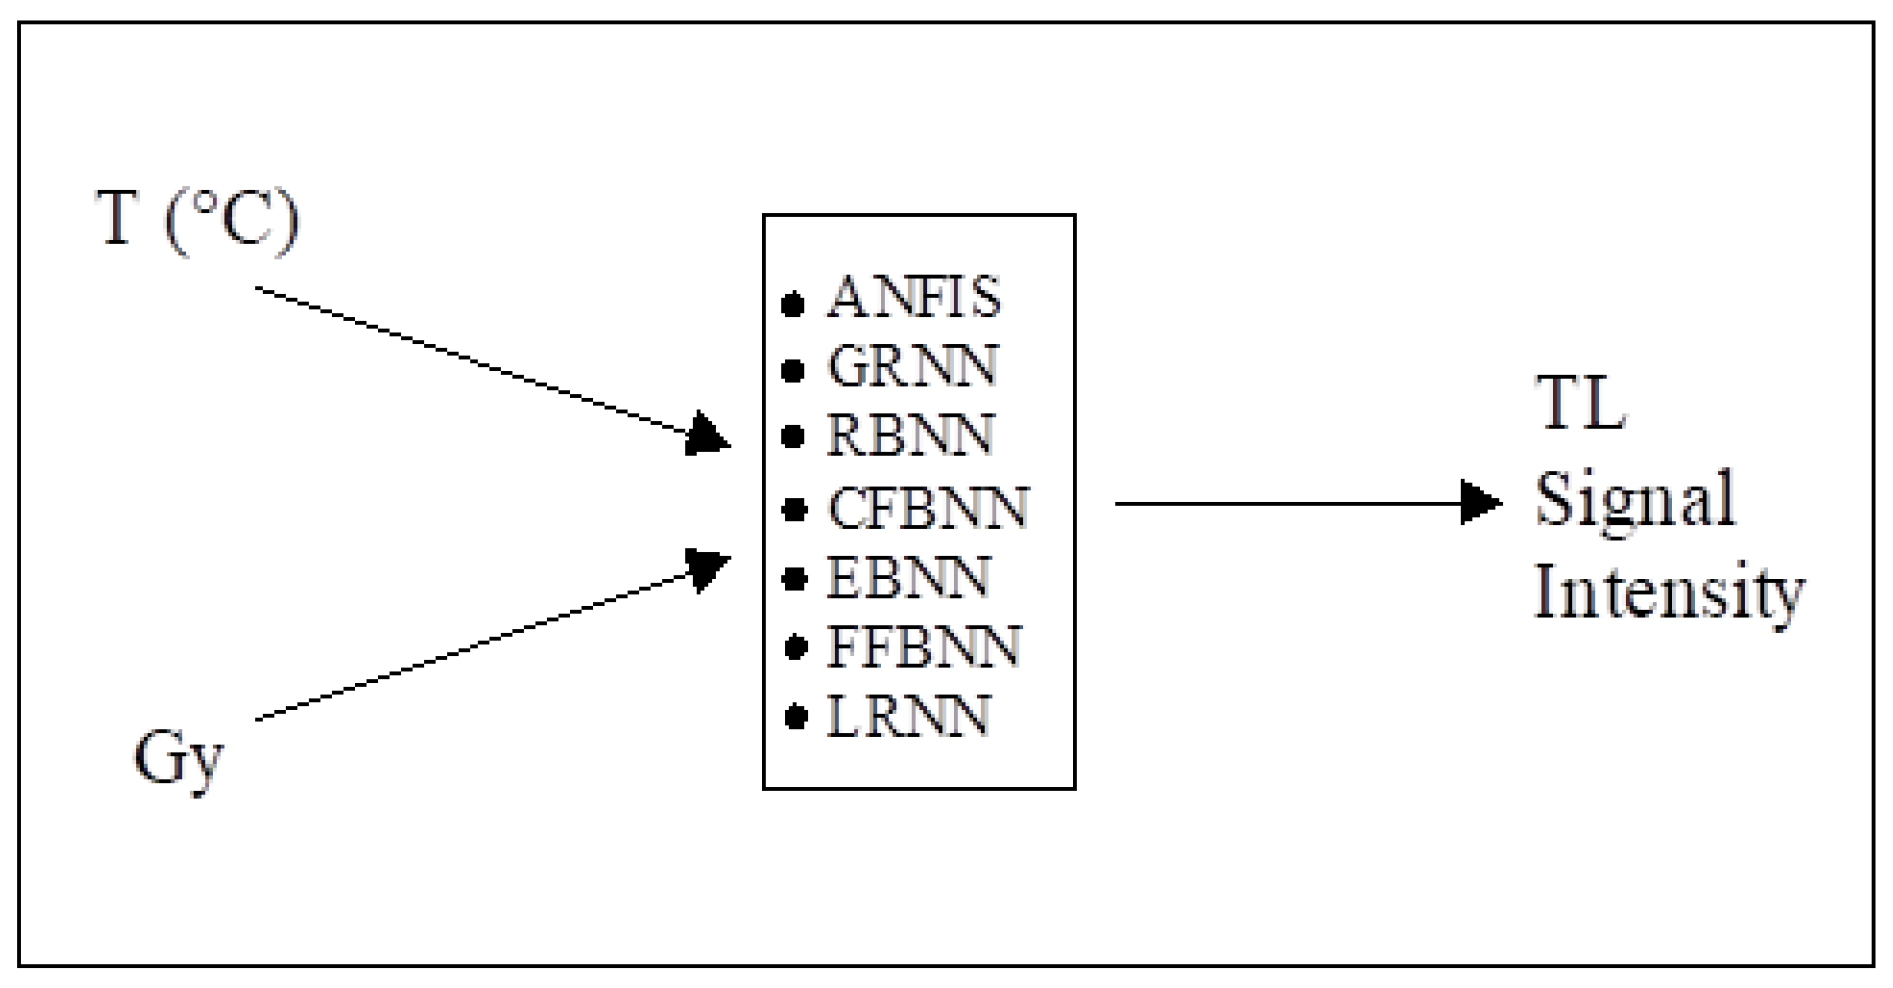
As seen in Figure 3, two different types of data for input and one data type for output were used in artificial neural networks training and testing.
These are application temperature values (T (°C)) and dose values (Gy) for input data and TL signal intensity values for output data. A TL intensity value was obtained at each application step so a dose value against temperature could be obtained. A total of 3069 rows of data were used as training input data. In the testing phase, a total of 1116 rows of data were used. All artificial intelligence studies were carried out using the relevant neural network toolboxes in the MATLAB/Simulink environment. Training of networks was not achieved by determining a learning rate value.

3.2. Methods

3.2.1. ANFIS

In 1993, Jang proposed the ANFIS method. The parameters of ANFIS have been optimized within the framework of the adaptive neural network. An adaptive network is a network structure made up of nodes and the links to which these nodes are connected. The adaptive network forces the output of each node to depend on the parameters of that node. On the other hand, the learning algorithm determines how these parameters should be changed in order to minimize the defined error measure [13].
In ordinary neural networks, nodes have the same functionality, and nodes in neighboring layers are completely interconnected. However, in neural fuzzy systems, the nodes have different functionality, and the nodes in the neighboring layers are not completely connected to each other. These differences are usually compatible with a special part of the fuzzy system. Modern neural fuzzy systems are generally feed-forward and multilayered. The ANFIS model includes a fuzzy system like Sugeno and uses backpropagation learning [14].

3.2.2. GRNN

General regression neural network is a network model used for system modeling and parameter-dependent prediction purposes. It was presented by Donald F. Specht in 1991 [15]. In this network structure, the learning phase is fast and can be used effectively with a small number of data. GRNN structure is a feed-forward network structure based on probability density function. During programming, the user chooses a spread value. To achieve the most suitable performance, the spread value must be adjusted between 0 and 1. The smaller the number, the better the best-fit approximation. The higher the value, the smoother the performance of approximation [16].

3.2.3. RBNN

The structure of RBNN, in the most general sense, is a structure that includes radially symmetric interlayer processor elements. It is one of the artificial neural network structures used in multivariate modeling and convergence [17]. Moody and Darken proposed the RBNN/RBFN, a frequently utilized neural network structure in practical contexts. [18]. An RBF network is a type of feed-forward neural network. The spread factor parameter is important in RBNN/RBFN performance.

3.2.4. CFBNN

Cascade-Forward Backprop Neural Networks share similarities with feed-forward networks but distinguish themselves by incorporating connections from the input and every preceding layer to subsequent layers. Like feed-forward networks, a cascade network with two or more layers can adeptly learn any finite input–output relationship provided sufficient hidden neurons [19]. The development and popularization of the computationally efficient backpropagation algorithm, often credited to Rumelhart et al. [20,21], played a crucial role in transforming it into a practical and widely adopted technique for training multilayer feed-forward networks.

3.2.5. EBNN

Elman networks can be classified as feed-forward neural networks, distinguished by the inclusion of layer recurrent connections featuring tap delays. Elman [22] artificial neural network is a type of artificial neural network that has the whole multilayer artificial neural network structure and additionally contains the interlayer outputs as a parallel input layer [23]. The Elman backprop neural network earns the label of a partially reversible network due to the consistent weights (W) in its recurrent connections. This stability allows the network to maintain and recall information over time, showcasing a partial reversibility that is beneficial for tasks involving sequential dependencies and temporal patterns. The Elman network’s learning takes place according to the generalized delta learning rule in multilayer perceptrons [24].

3.2.6. FFBNN

The backpropagation algorithm stands out as the most widely employed training algorithm in various applications. Its popularity stems from its simplicity, ease of understanding, and the ability to be mathematically proven, making it the preferred choice for many [20]. This algorithm is called backpropagation because it tries to reduce the errors backward from the output to the input. Backpropagation is a generalized algorithm for the delta rule used in multilayer networks. In the backpropagation network, the errors are propagated backward by the derivative of the feed-forward transmission function via the same links used in the feed-forward mechanism [25].

3.2.7. LRNN

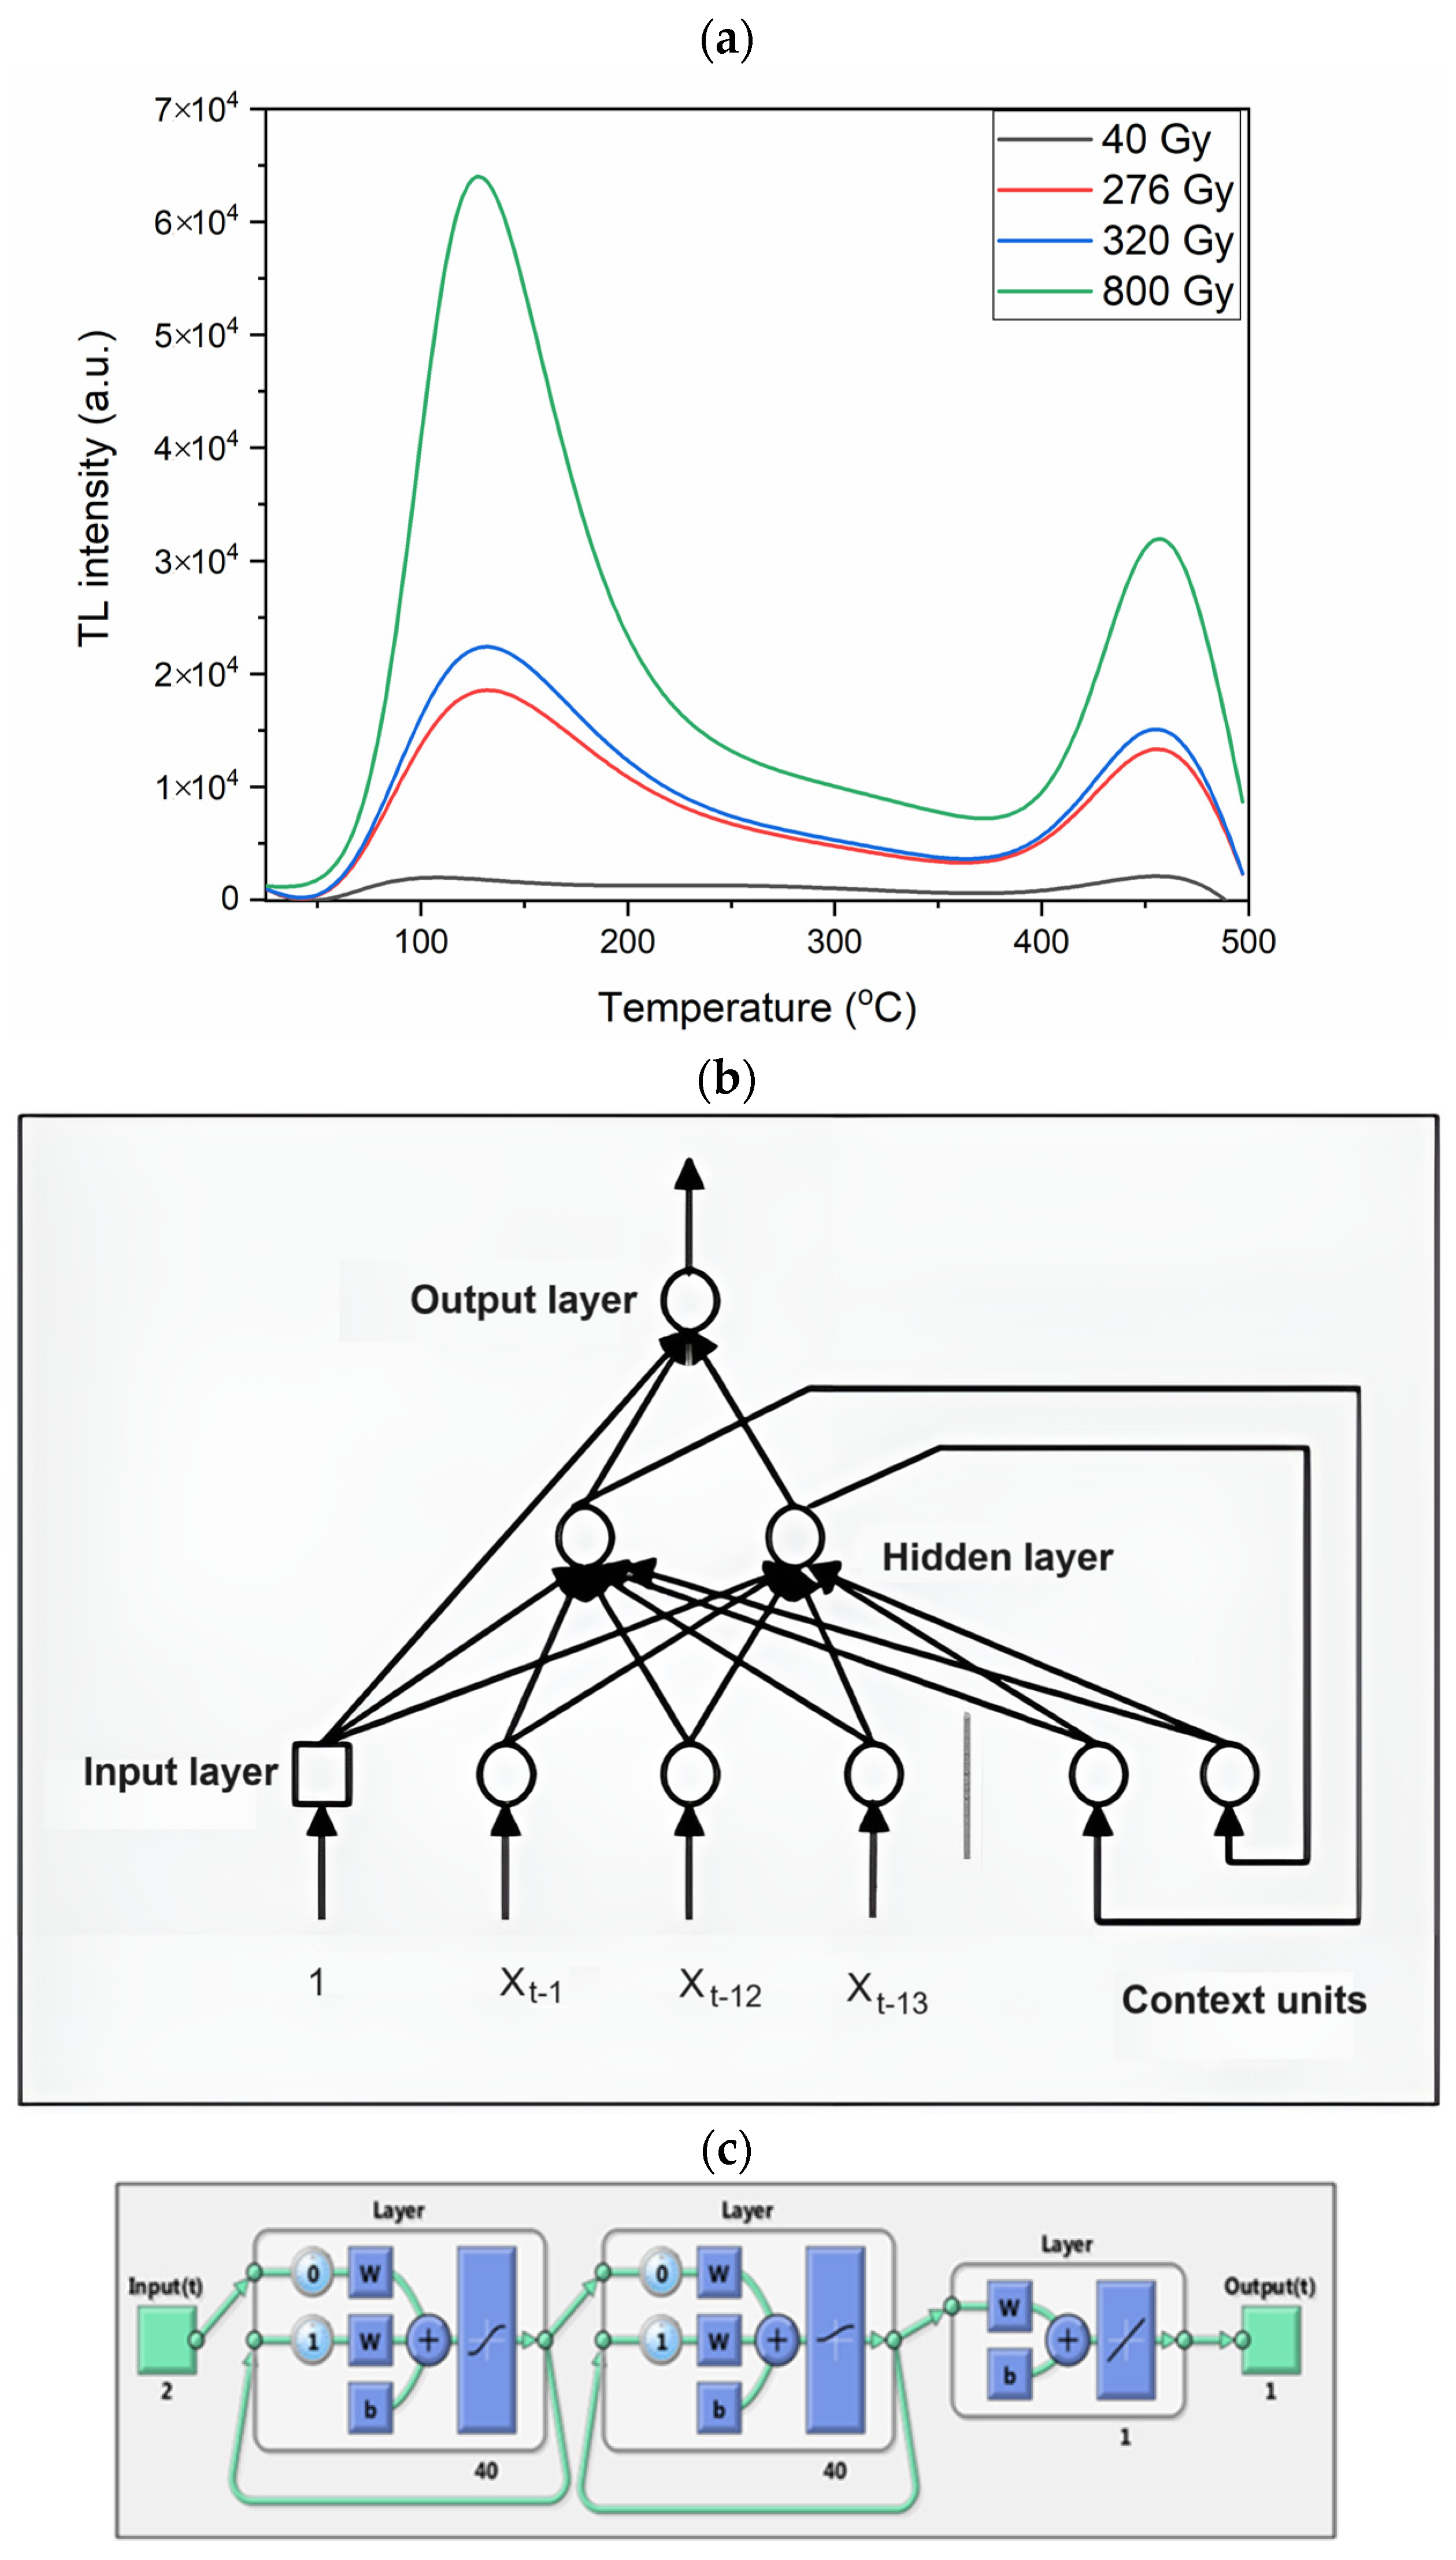
Layer recurrent neural networks (LRNNs) stand out from conventional feed-forward networks by incorporating recurrent connections and tap delays in each layer, enabling them to exhibit an infinite dynamic response to time series input data. This architectural innovation enhances LRNNs’ capability to effectively capture and retain long-term dependencies. While LRNNs share similarities with time-delay networks (timedelaynet) and distributed delay networks (distdelaynet), their unique strength lies in transcending finite input responses, allowing seamless adaptation to intricate temporal dependencies. Layer recurrent neural networks are similar to feed-forward networks. Only difference is each layer has a recurrent connection with a tap delay associated with it. This allows the network to have an infinite dynamic response to time series input data. This network is similar to the time-delay (timedelaynet) and distributed delay (distdelaynet) neural networks, which have finite input responses [26]. Elman [22] first presented a basic form of the layer recurrent network. With the exception of the last layer, every layer of the network in the LRNN has a feedback loop with a single delay [27].

4. Results and Discussions

4.1. ANFIS

The fuzzy toolbox (>fuzzy) in MATLAB is used for the data training of ANFIS. There are eight membership function (MF) types under the Generate FIS menu. These are trimf, trapmf, gbellmf, gaussmf, gauss2mf, pimf, dsigmf, and psigmf. Also, the values of the input set numbers (MFs) can be changed in this menu. In this study, the determined MF values are 3 3, 4 4, 5 5, and 6 6. Necessary training has been undertaken in ANFIS for all function types with different input set numbers (MFs); the results are shown in Figure 4. In all training, the fault tolerance was selected as 0, and the epoch number was selected as 5000.
As a result of 32 different trials seen in Figure 4, the ANFIS method with gaussmf membership function, which has 6 6 input set numbers, provided the best performance. The minimum error results obtained are training root mean squared error (RMSE) = 1881.10; testing RMSE = 2291.24; training R2 = 0.9753; testing R2 = 0.9619; training root square error (RSE) = 1213.37; testing RSE = 808.03; training mean absolute error (MAE) = 0.39; and testing MAE = 0.21. Here, increasing the numbers of the input set and the epoch values changes the results positively.
While calculating the error values, the following formulas were used:
Root mean squared error (RMSE) [28] (Aj = actual values; Pj = predicted values; n = size of the data set):
R M S E = 1 n t = 1 n ( A j P j ) 2
Regression error (R2) [29]: (TSS = total sum of squares; RSS = residuals sum of squares).
R 2 = T S S R S S T S S
Root square error (RSE) [30]:
R S E = t = 1 n ( P j A j ) 2 A j
Mean absolute error (MAE) [31]:
M A E = t = 1 n ( P j A j ) A j n
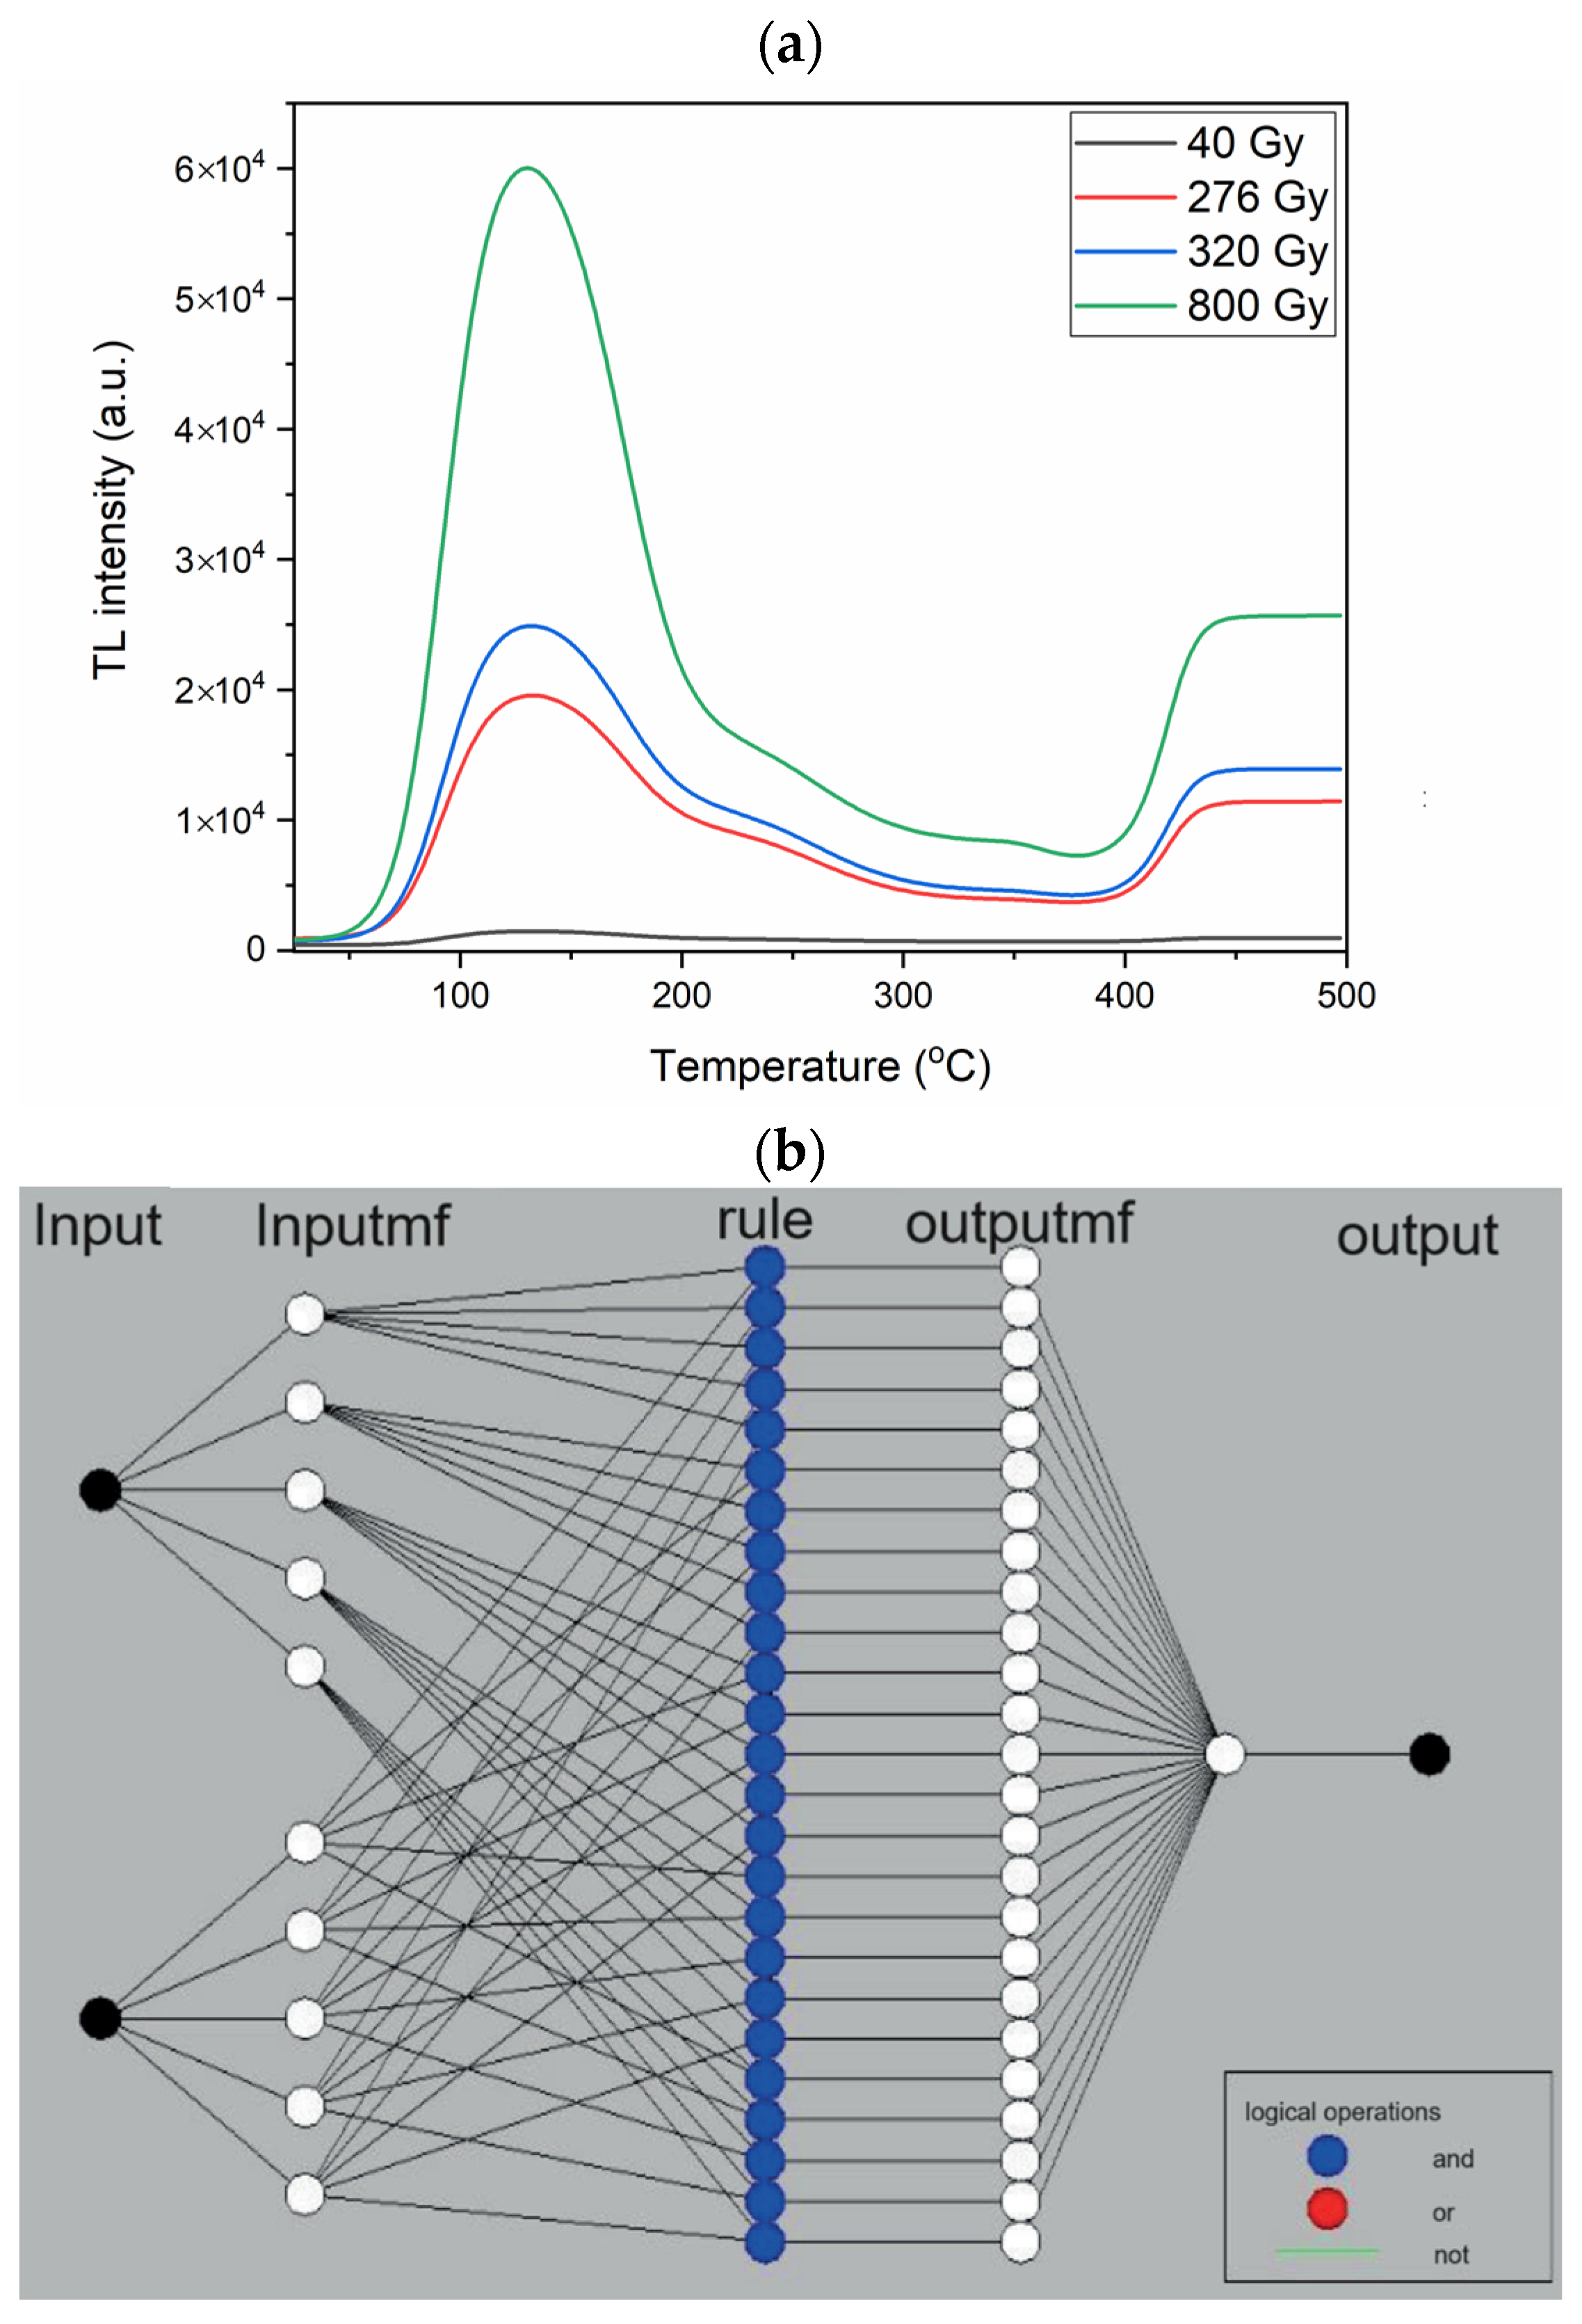
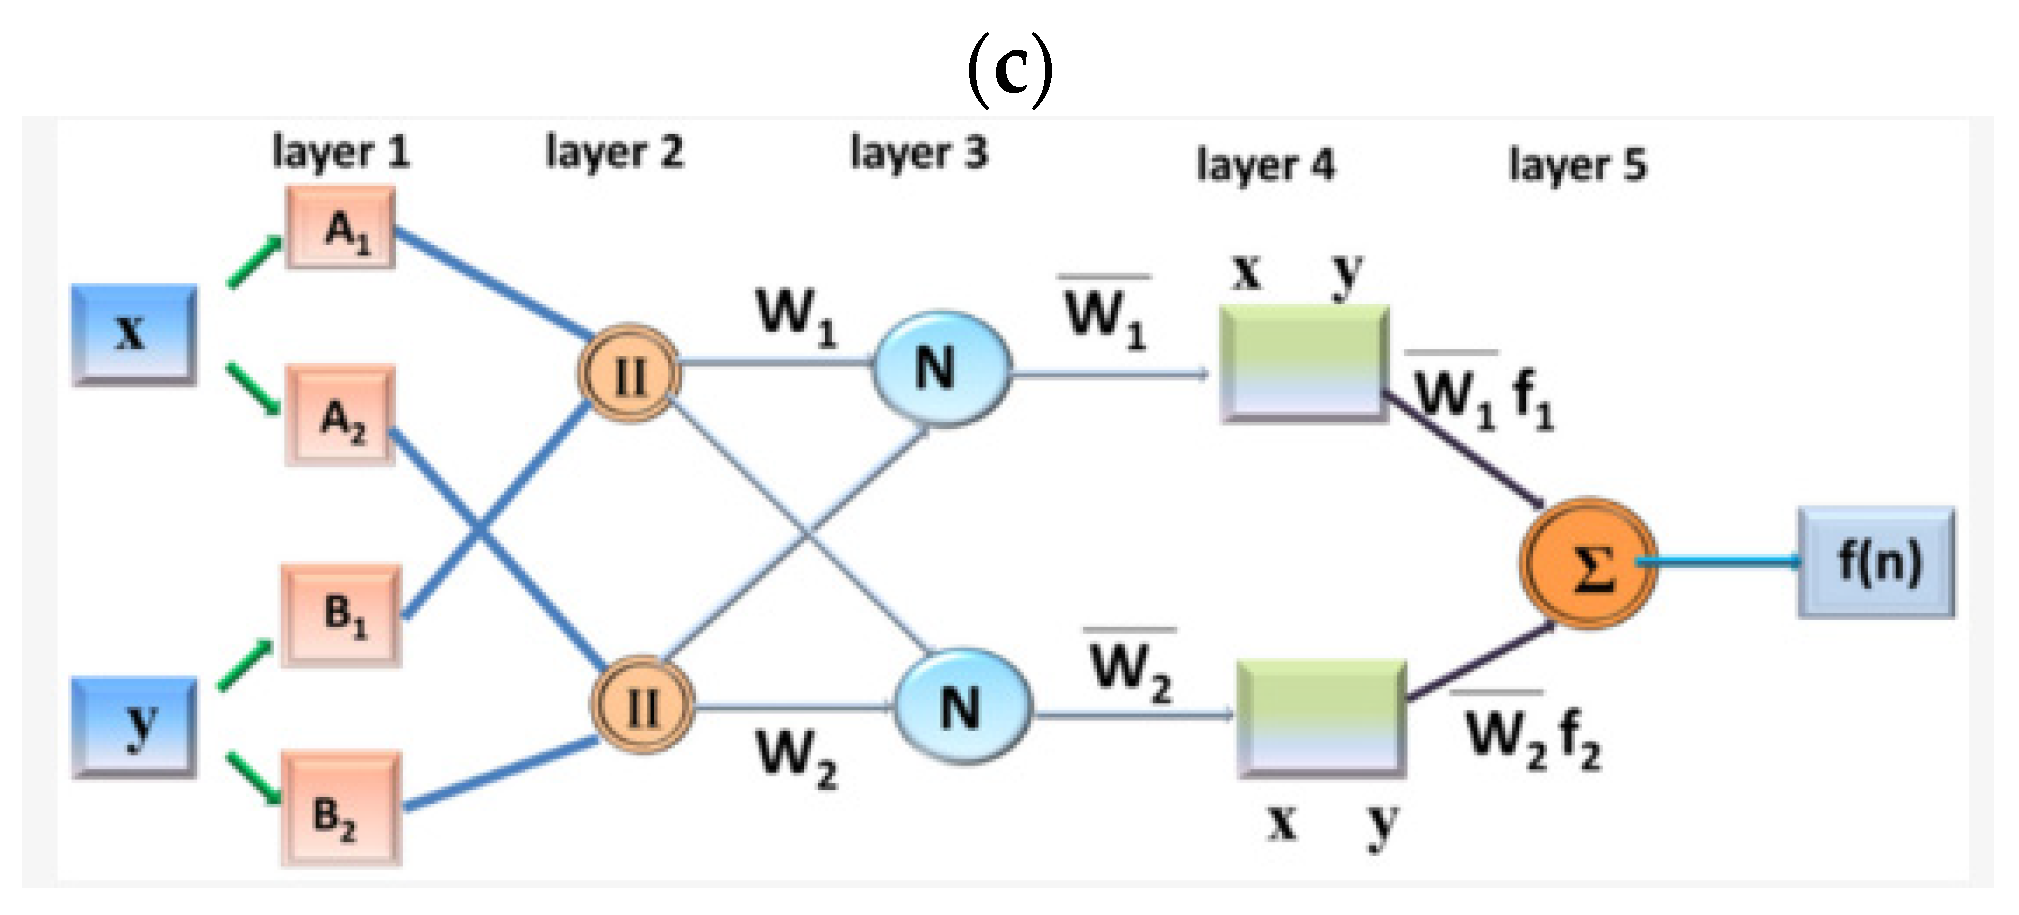
As seen in Figure 5b, the network has five layers; also, Figure 5c shows the network structrure (Gaussmf 66). In this study, while the process was carried out with ANFIS, studies were carried out with different input set numbers (3 3, 4 4, 5 5, and 6 6). These can be increased or decreased by the user. However, there is no guarantee that the results will be better when increased. The most successful of these was the network with 66 entry sets. Figure 5b shows the network structure used in this study. The number of fuzzy rules is 36, and the number of nodes is 101. It also has input set numbers of 6 and 6, and its membership function is gaussmf. During the training, 3 and 3 input set numbers had nine fuzzy rules and 35 node numbers. Additionally, 4 and 4 input set numbers had 16 fuzzy rules and 53 node numbers. Further, 5 and 5 input set numbers had 25 fuzzy rules and 75 node numbers. When the number of input sets increased, it caused an increase both in the fuzzy rules and in the number of nodes of the network. In Figure 2 and Figure 5a, ANFIS test results and actual experimental results are shown. By increasing the number of input sets and the epoch value, the similarity rate of the graphics can be changed. The neural network toolbox in the MATLAB/Simulink program (>nntool) was used during the training of all network structures except GRNN and RBNN. In all trials, the epoch number was set as 5000, and the target error value was 0. The training process of network structures for GRNN and RBNN was carried out by writing code; the target error value for these networks was 100.

4.2. GRNN

Here, five different spread values (0.01, 0.1, 1, 10, 100) were utilized to find the best performance. The training results of these different spread values are shown in Table 1.
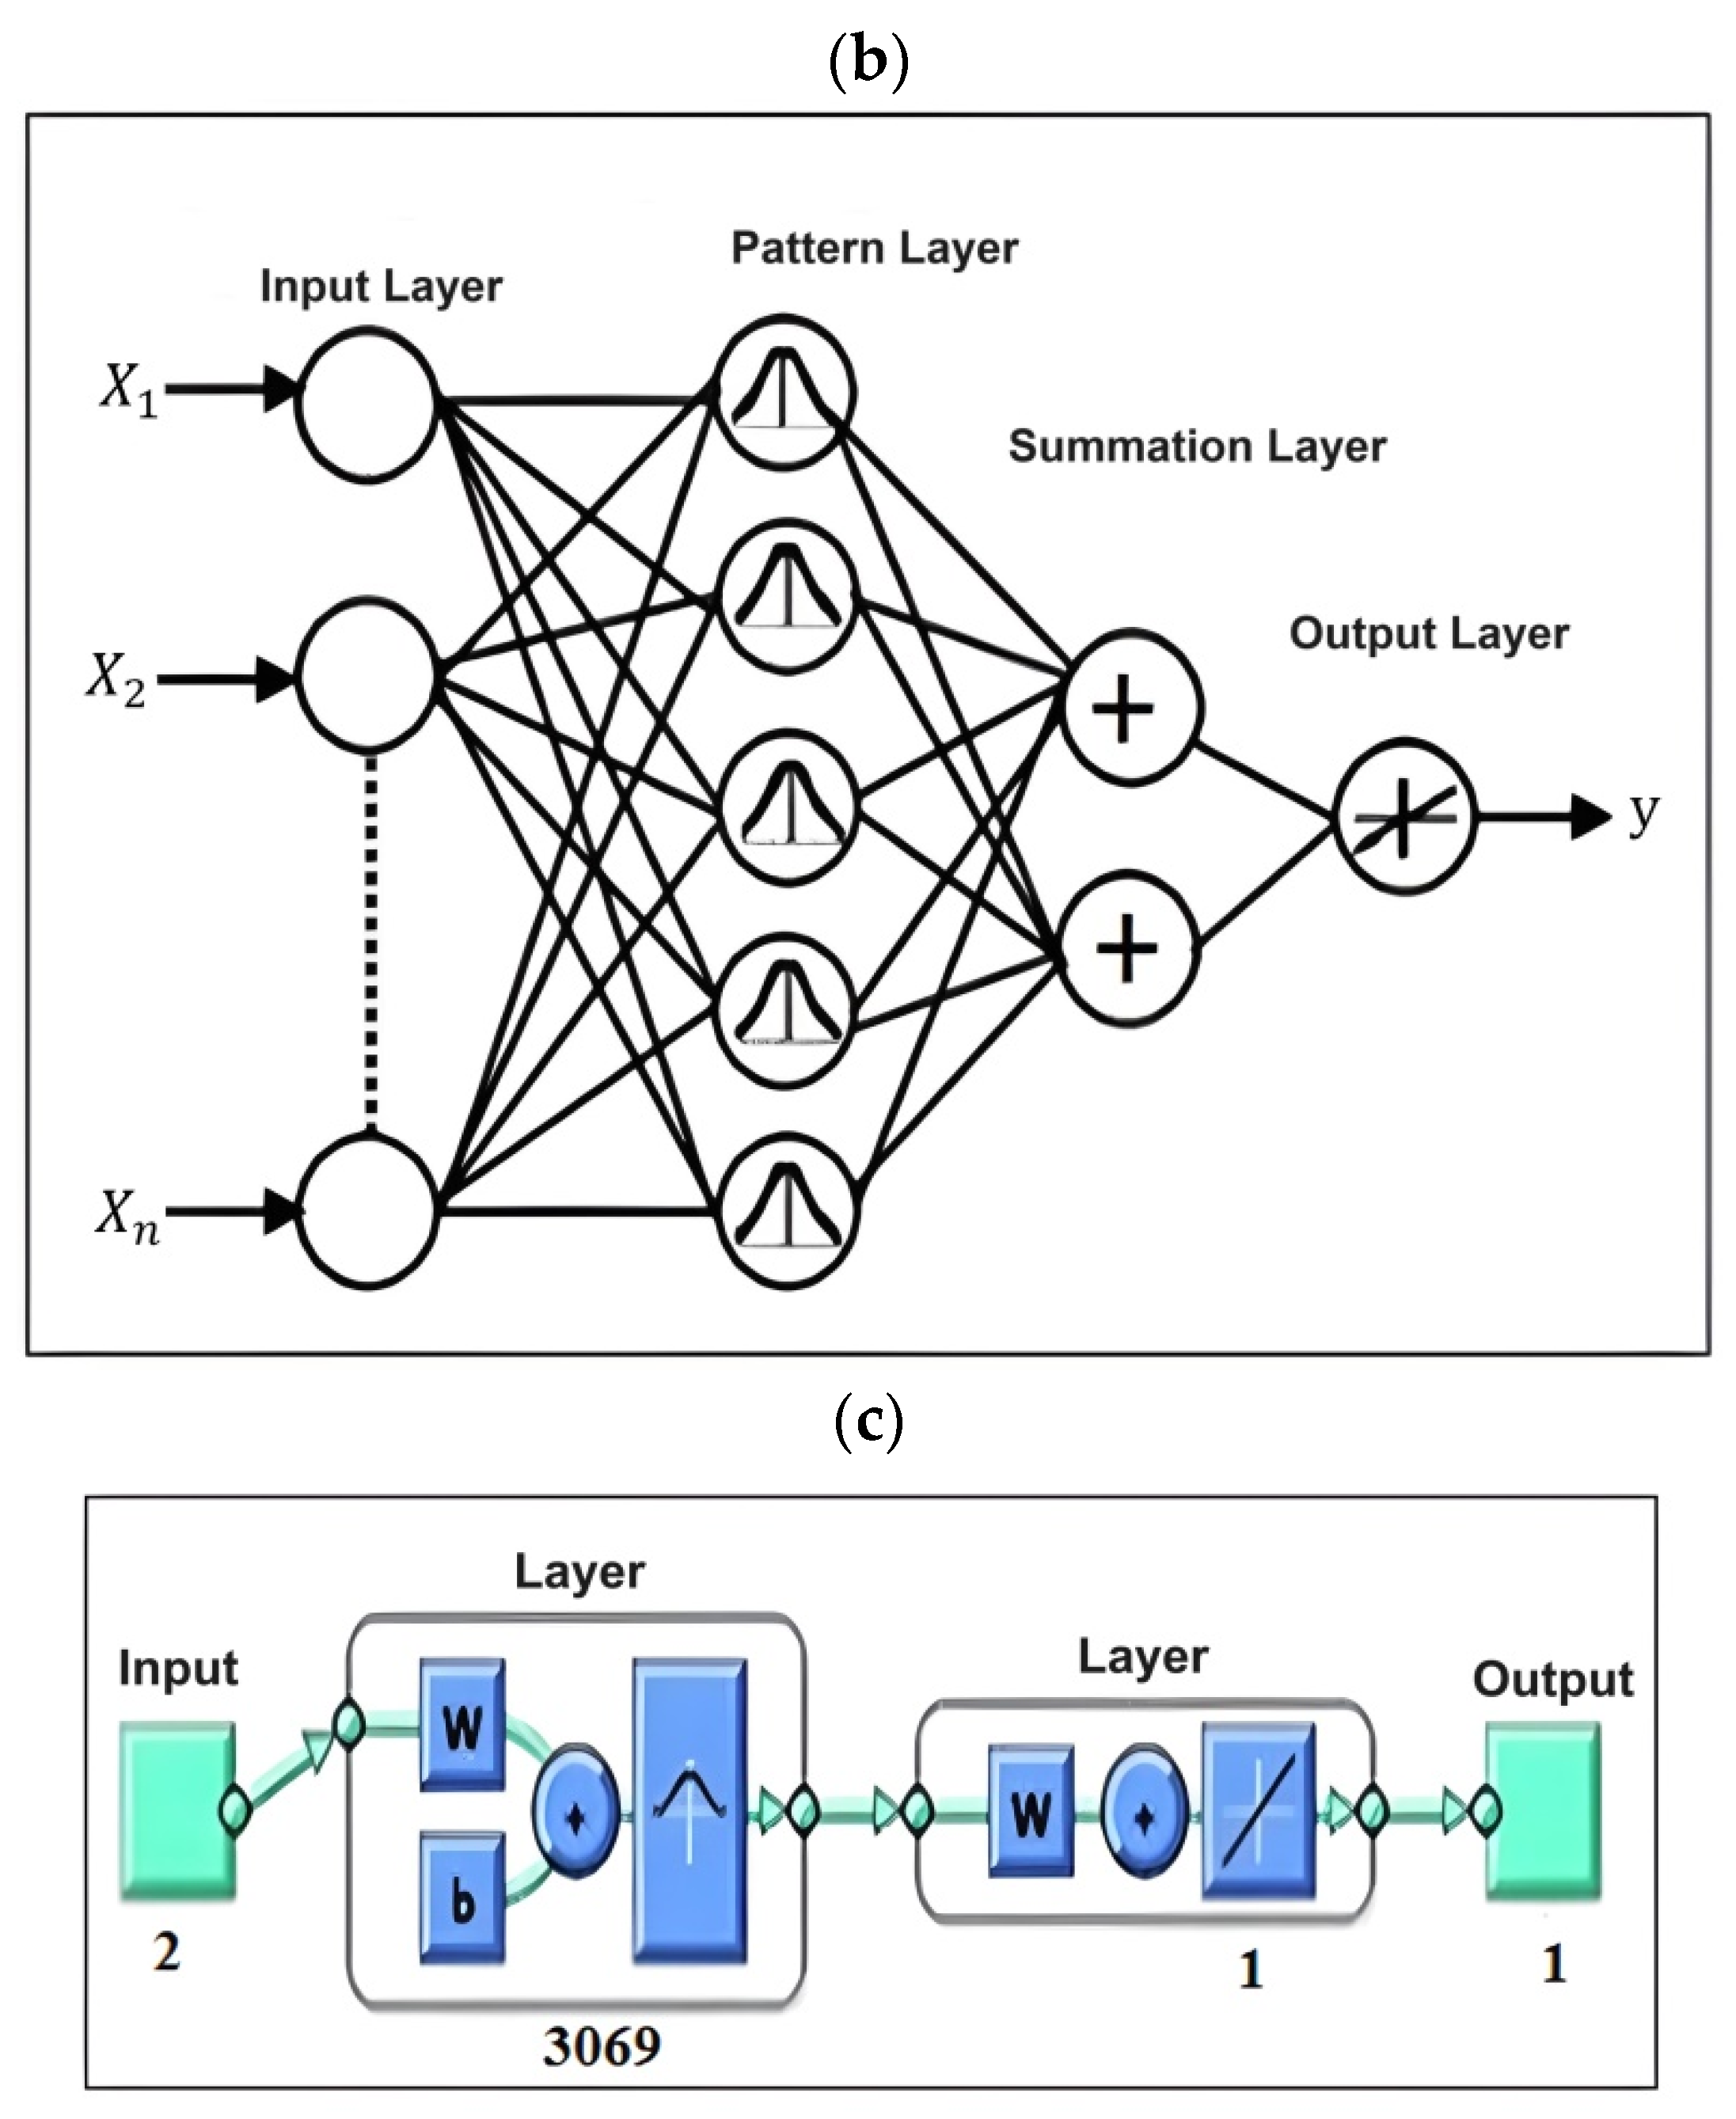
According to the results of Table 1, the best performance was achieved when the spread value was 0.1. Choosing a spread value smaller than 0.1 will not change the training results. Choosing a spread value larger than 0.1 will continuously reduce the success of the training results. As seen in Figure 2 and Figure 6a, the results of the network are very close to the experimental results. The results of the 276 Gy and 320 Gy experiments do not fully match the expected predictions. Figure 6b is a general image showing the GRNN structure. In the ‘Pattern layer’ layer of the network, neurons are automatically generated—as many as the number of rows of input data (in this study, 3069). The transfer function used in the neurons in the ‘Hidden layer’ is Radbas(n). The transfer function used in neurons in the ‘Output Layer’ layer is Purelin(n). The ‘Summation layer’ is always one more than the number of neurons in the ‘Output Layer’. These are the characteristic features of this network. Figure 6c is the general view of GRNN in MATLAB. This figure is automatically produced in MATLAB. The number of input/output data types and the number of neurons in the layers are automatically displayed below the picture.

4.3. RBNN

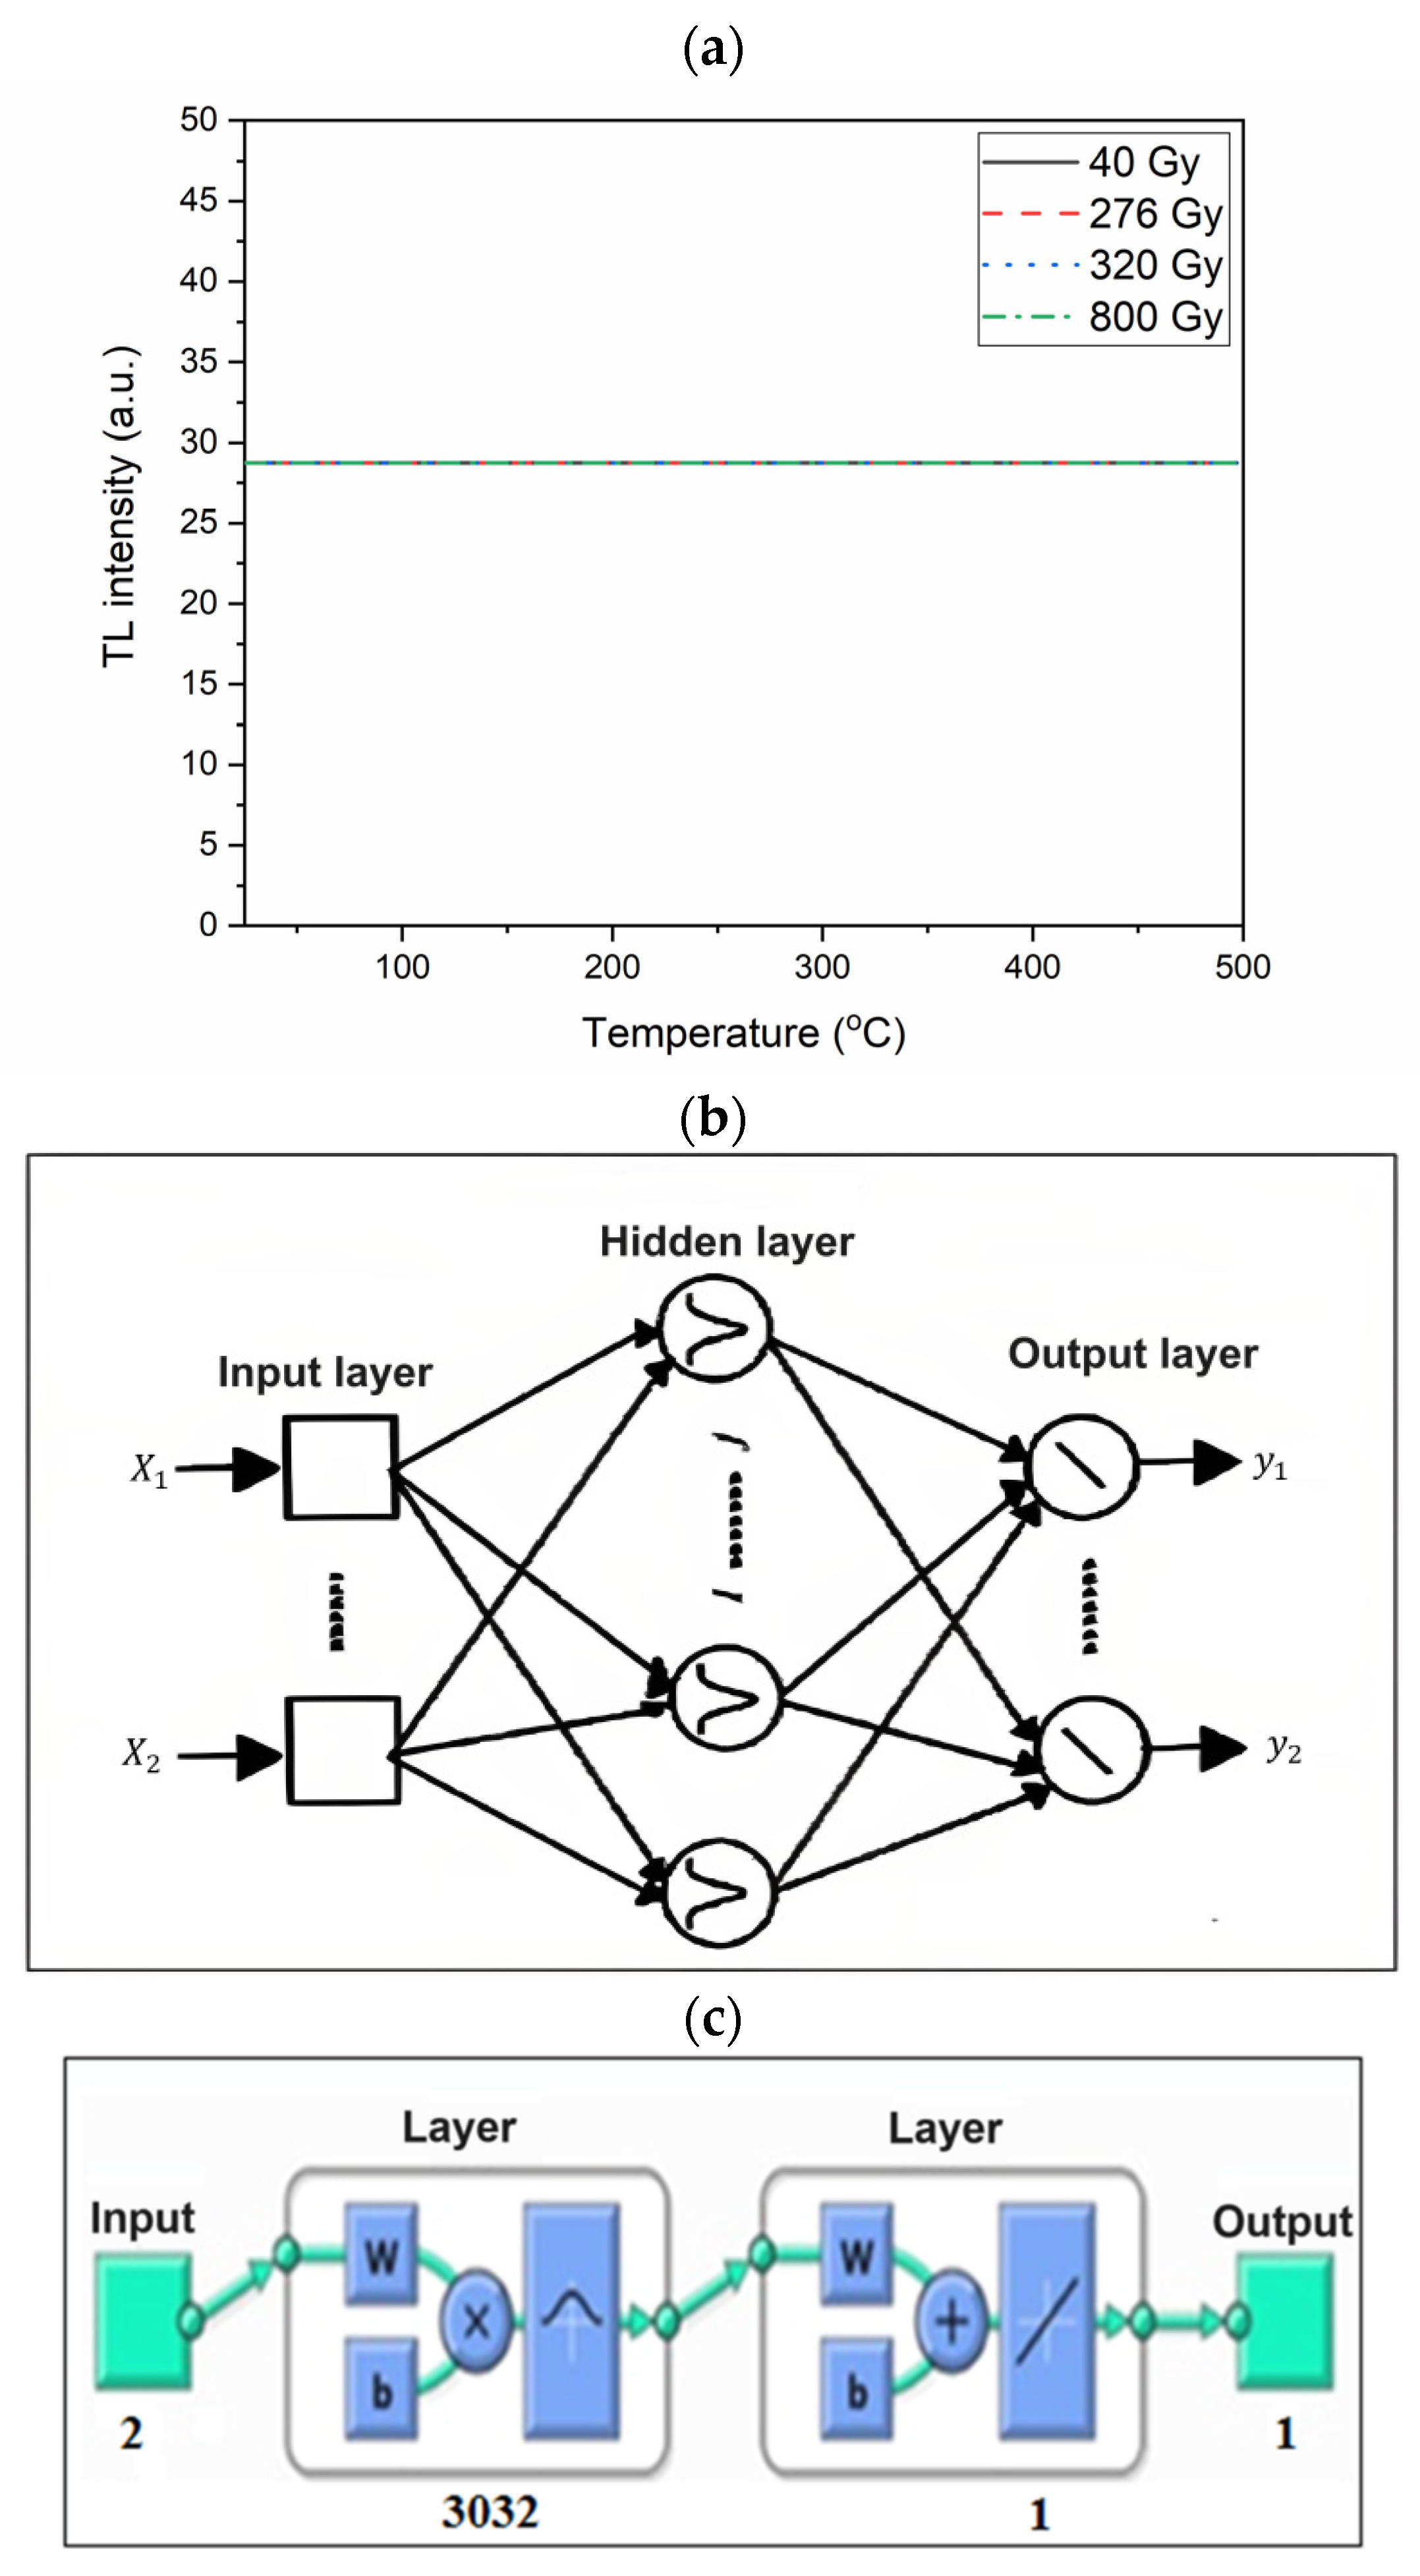
In this section, the training results with different spread constant (sc) and error goal (eg) values are shown in Table 2. The best result was obtained with sc:10 and eg:10 values. When looking at Figure 7a, the test results are far from what was expected (Figure 2). The structure of the network is seen in Figure 7b,c. Figure 7b is the general network structure of RBNN. While the transfer function used in the neurons in the ‘Hidden layer’ is called Radbas(n), the transfer function used in the neurons in the ‘Output Layer’ layer is called Purelin(n). While the input data should be 3069, the same as the number of rows in the ‘Hidden layer’ of the network, 3032 hidden neurons were produced because the neuron was generated automatically.

4.4. CFBNN

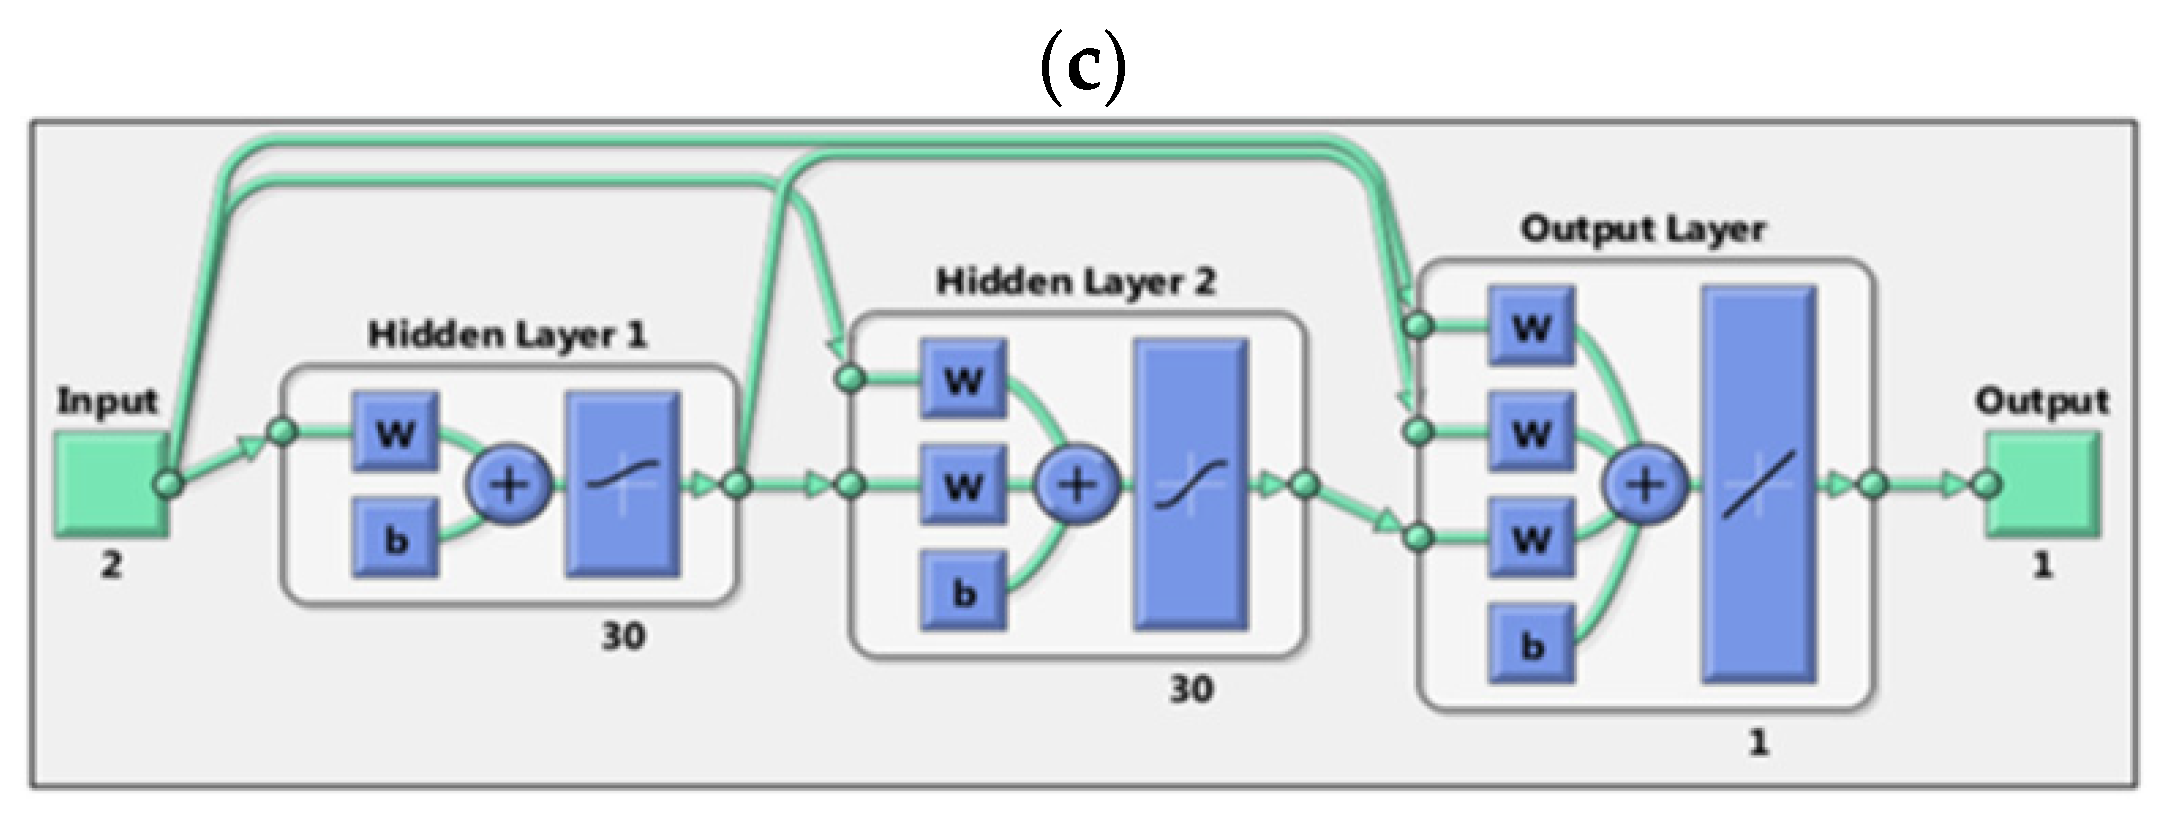
Using this method, four different network structures working with different training functions with one or two hidden layers were studied. The basic properties of the networks are provided in Table 3. Performance comparisons of the networks are also included in Table 4. According to the test results, the third experiment with two hidden layers and the trainscg training function produced the best results. Figure 2 and Figure 8a show the results of this training and experimental results, respectively. The results are far from the actual experimental values. Figure 8b is a general figure showing the CFBNN structure. Figure 8c shows network representation in MATLAB. The results in the first five columns in Table 4 are taken from the neural network toolbox. The data in the other column were calculated from the relevant formulas (Equations (1)–(4)).

4.5. EBNN

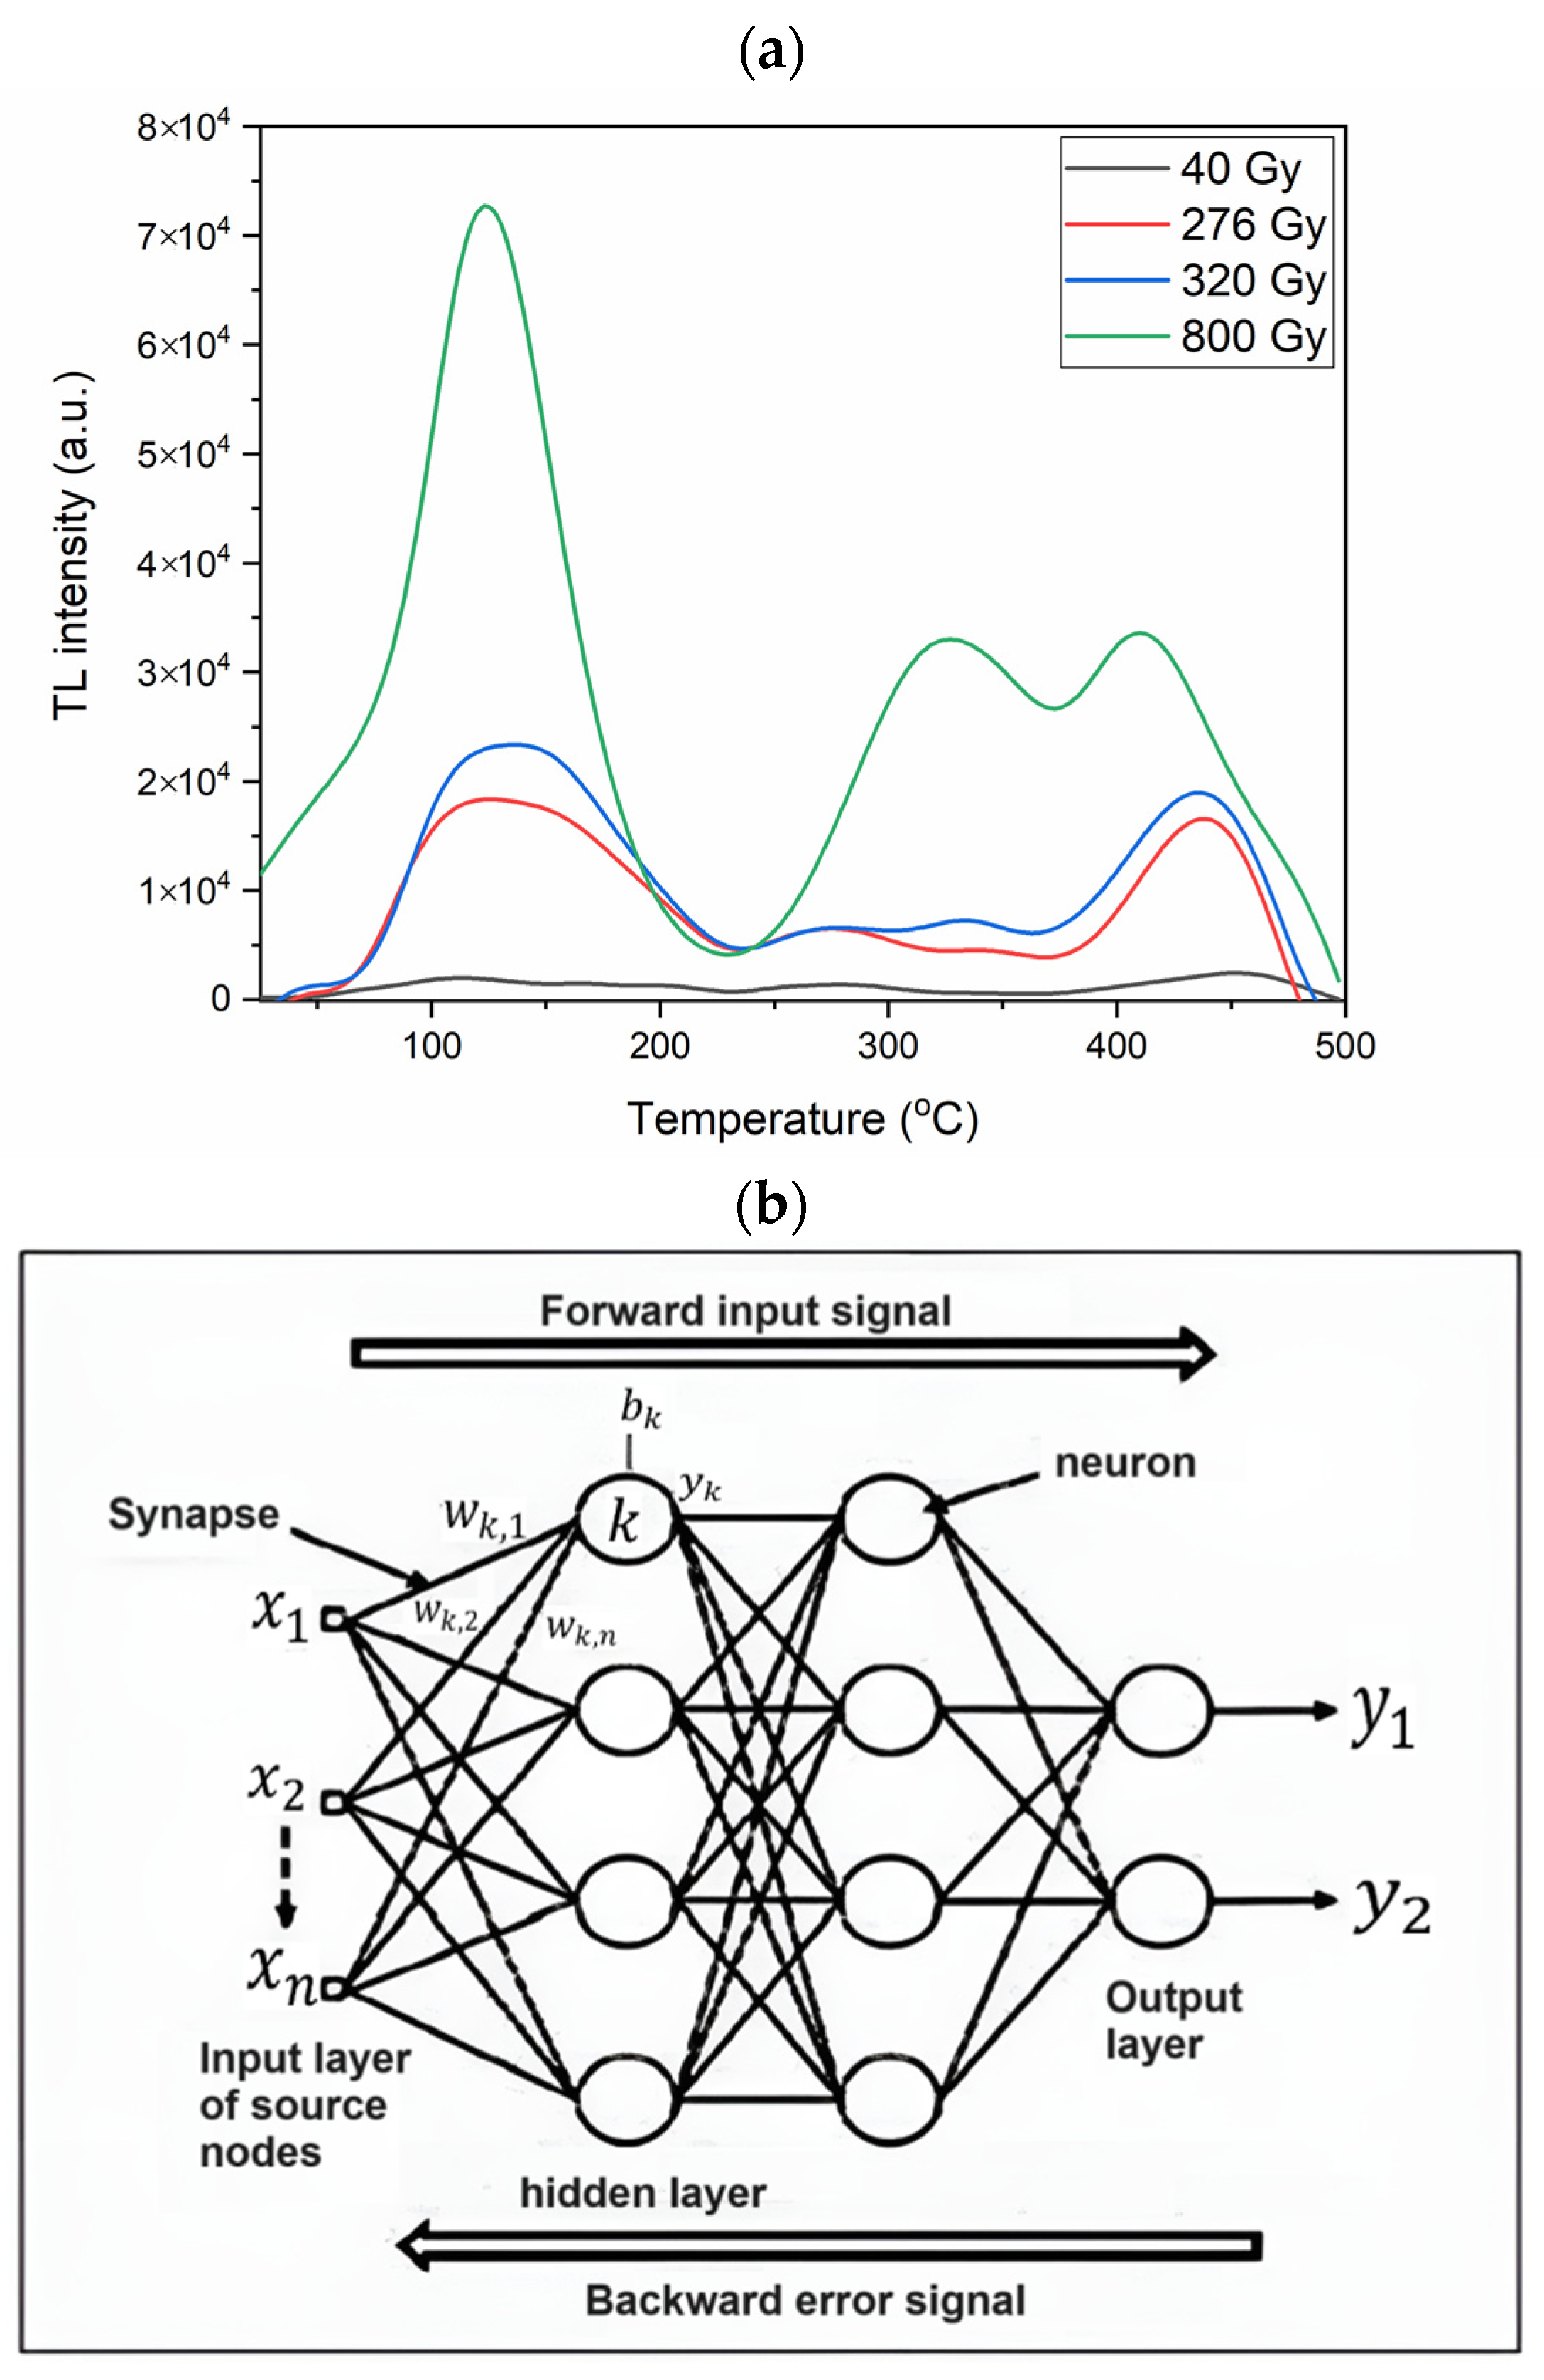
In EBNN results, four different network structures working with different training functions with one or two hidden layers are studied. The basic properties of the networks are tabulated in Table 5. Performance comparisons of the networks are also included in Table 6. According to the test results, the fourth experiment with two hidden layers and the trainoss training function produced the best results. Test results and experimental observations are provided in Figure 2 and Figure 9a, respectively. EBNN structure and EBNN representation in the program are provided in Figure 9b,c, respectively. Figure 9c is the general view of EBNN in MATLAB. This shape is automatically generated by MATLAB. The number of input/output data types and the number of neurons in the layers are shown below the figure. The results in the first five columns in Table 6 are taken from the neural network toolbox. Only the fifth column’s data are included here because the data of the first four columns are not displayed in the toolbox. Only visual representations are available in the MSE result graph. The data in the other column were calculated from the relevant formulas.

4.6. FFBNN

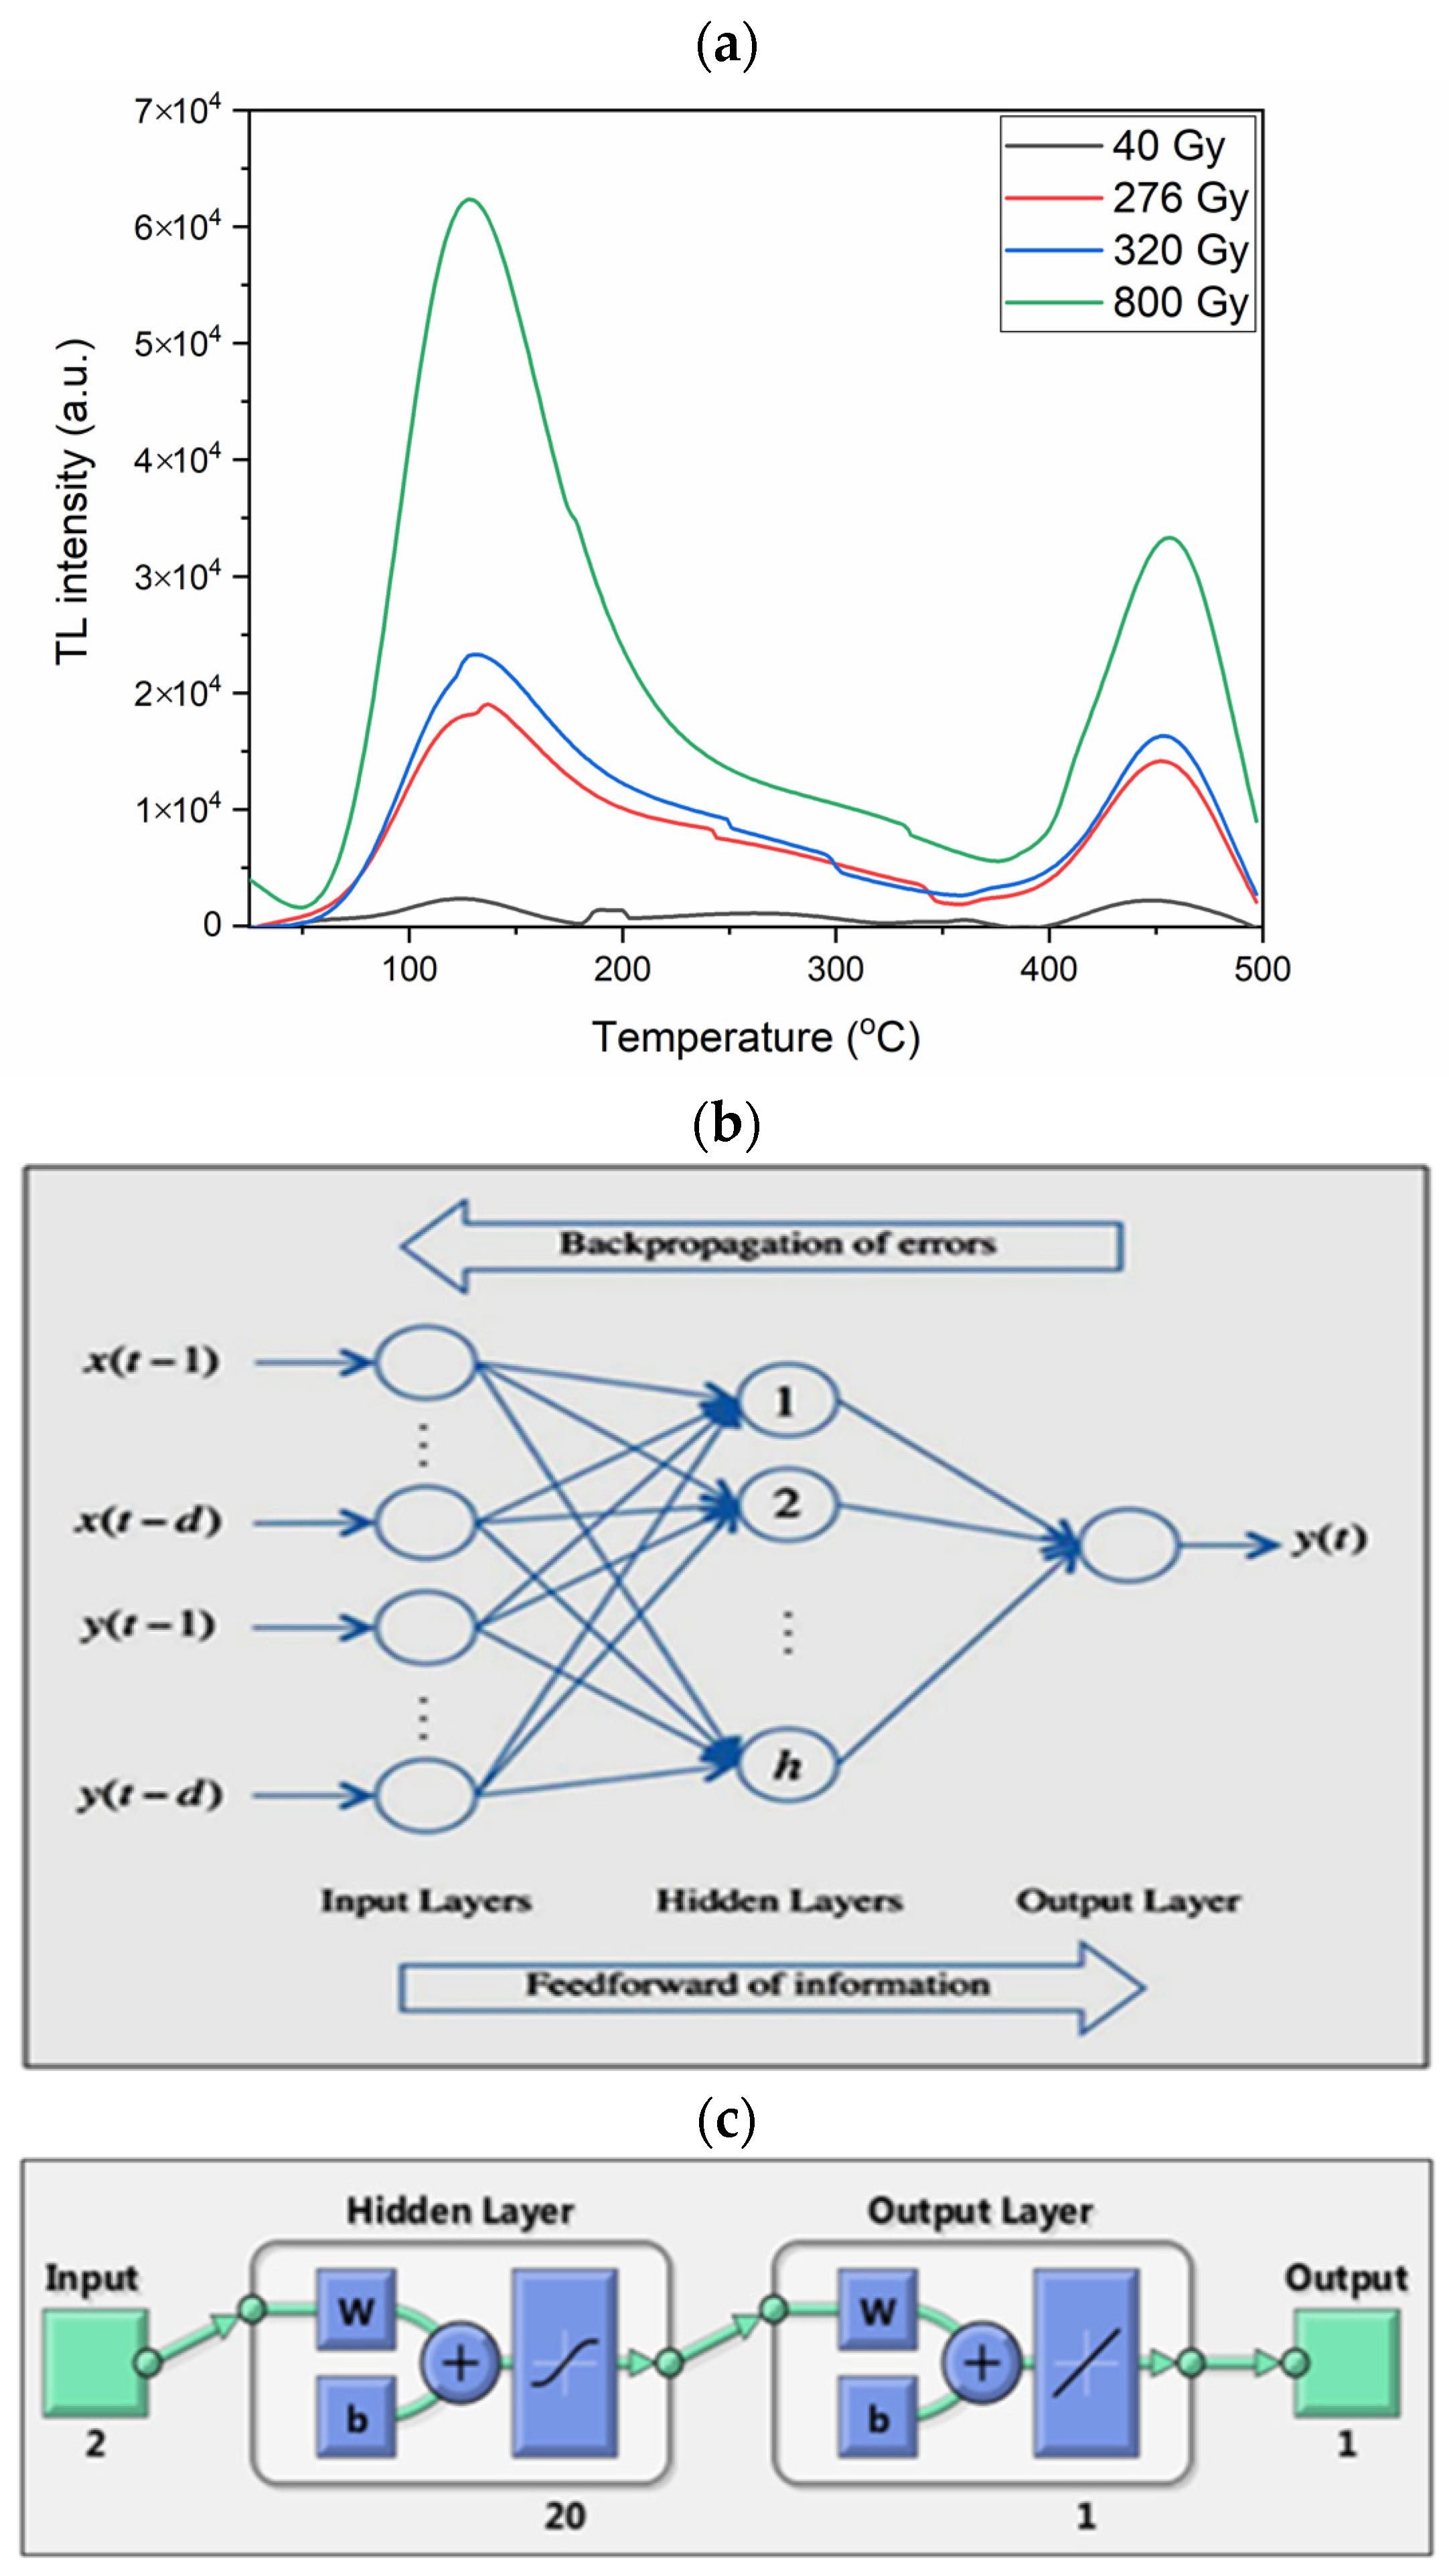
Using this method, four different network structures working with different training functions with one or two hidden layers were studied. The basic properties of the networks are provided in Table 7. Performance comparisons of the networks are also included in Table 8. According to the test results, the second experiment with one hidden layer and the trainlm training function produced the best results. Figure 10a shows the results of this training. The experimental observation result is provided in Figure 2 for comparison with Figure 10a. Figure 10b and Figure 10c, respectively, show the network structure and the program’s representation of the FFBNN. The results in the first five columns in Table 8 are taken from the neural network toolbox. The data in the other column were calculated from the relevant formulas.

4.7. LRNN

Using this method, four different network structures working with different training functions with one or two hidden layers were studied. Table 9 presents the main characteristics of the networks. Performance comparisons of the networks are also included in Table 10. According to the test results, the fourth experiment with two hidden layers and the trainoss training function produced the best results. The results of this training are shown in Figure 11a. Figure 11b and Figure 11c, respectively, illustrate network structure and representation. The results in the first five columns in Table 10 are taken from the neural network toolbox. Only the fifth column data are included here because the data of the first four columns are not displayed in the toolbox. Only visual representations are available in the MSE result graph. The data in the other column were calculated from the relevant formulas.
In order to understand whether a material has dosimetric properties, dose–response experiments, varying heating rate experiments, and reusability and fading experiments should be performed against the exposed dose. The amount of research on how machine learning can be used in this regard continues to increase. Kucuk et al. determined the TL signal intensity depending on the applied dose [32]. It is stated by the authors that the method, which was designed for specific zinc borates and allowed the application of standard learning algorithms to the neural network, encountered limitations that limited its applicability to different examples. Isık et al. used artificial intelligence methods in fading time [11], heating rate, and reusability studies [33]. In addition, artificial intelligence methods were used by Mentzel et al. on the duration or source of the exposure dose [34]; Theinart et al. used them on the estimation of the irradiation dose [35]; and Salido et al. used them to determine kinetic properties such as activation energy and frequency factor. Toktamış et al. [36] studied the effect of machine learning on TL features in rock salt samples. For this purpose, they divided the glow curve data into three different types. Of these, better accuracy was achieved by choosing 80% training and 20% testing using polynomial and radial basis function kernels.
In this study, we focused on approximating all values of signal intensities of four different unknown doses with experimental values, and the results were obtained by applying the network training to the methods by starting from the beginning for each method. Experimental data are raw data, and no pre-processing process was applied. The training of networks was not achieved by determining a learning rate value. Training trials were applied as 32, 5, 6, 4, 4, 4, and 4 for ANFIS, GRNN, RBNN, CFBNN, EBNN, FFBNN, and LRNN, respectively. The total time is 800, 25, 30, 80, 80, 80, and 80 for each, for a total of 1175 min. In the experimental results, Elman proved that machine learning methods with backpropagation network types are superior to others. In this study, the minimum value of the TL signal is 50, and the maximum value is approximately 7104. When data are entered within the TL signal intensity value range similar to this study, it is highly likely that the results will be the same. Studies on the applicability of this method in determining the dosimetric properties of a material will gradually increase, and it is thought that this study will benefit researchers in terms of method selection.
It is useful to acknowledge some limitations of the current study. In ANFIS, the entry set numbers are 33, 44, 55, and 66, and the number of epochs is 5000. When these values increase, the duration of the training also increases. The error tolerance required from the training was chosen as zero. Spread values (0.01, 0.1, 1, 10, 100) were selected in GRNN. During the training phase, the user chooses a spread value, usually in the range of 0–1, which is important for optimal performance. This study investigated five spread values, including experimental choices such as 10 and 100. The values were adjusted by decreasing them by ten digits to provide clarity in interpreting the result. The smallest spread value was determined by meeting certain criteria, such as the Education R2 result being 1, the Education RSE result being 0, and the Education MAE result being 0. In this network structure, the target is to have a maximum error value of zero. This condition is specified, but the network trains itself for this target. In this network structure of RBNN, the goal is to have a maximum error value of zero. CFBNN was used in this study with a maximum of two hidden layers. Neuron numbers 10 and 20 were preferred in a single hidden layer. Neuron numbers 30 and 40 were preferred in the two hidden layers. The transfer functions of the hidden layers were constantly swapped as log and tan. Both cases were examined. In the last output layer, the purelin transfer function was the only one used in all networks. These were all limitations we set. It is optional to further reduce or increase the number of neurons or hidden layers. It is not guaranteed that increasing results will yield better results. The limitations of EBNN, FFBNN, and LRRNN are the same as CFBNN.
Here, for testing, with the manual Excel formula, if the data were within the map ratio, then 1 was printed; otherwise, 0 was printed. All data were scanned, and success rates were determined by checking whether they were within the error rates. The results, according to 5%, 10%, and 15% errors of all networks, are shown in Table 11. Since raw data were used during training, the highest success rate was achieved with the EBNN, which had a 15% error rate. The success rate in this network is 80.8% for training and 87.95% for testing. Since smoothing was not performed in signal processing during the operation of the TL signal, it caused disorganization in the data. This situation negatively affected the success of the networks. Although the training data in the GRNN were very high, the test data results were low. The reason for this is that the number of neurons in the hidden layer is the same as the number of input data (3069), and the assignment of this high number of neurons reduced the success of the network [37].

5. Conclusions

A well-trained neural network model could be used as a predictive model for a particular application. Here, a study was made in order to predict the glow curves from the thermoluminescence dose–response of the aluminosilica sample with the use of machine learning algorithms, and we tried to predict the results of four different dosimeter experiments with seven different artificial intelligence methods (ANFIS, GRNN, RBNN, CFBNN, EBNN, FFBNN, LRNN). The aim here is to make an estimation of the test results that is not measured and to inform the user about the possible results. The application temperature values T (°C) and Gy dose values were used as input variables, and we attempted to estimate TL signal intensity values. While the networks were being trained, 73.3% of the total data was reserved for training and 26.6% for testing, and during the training phase, test data were never introduced to the networks. The studies were carried out in the direction of 0 error goals and 5000 epochs. The current situation provides valuable information about the network structures that need to be studied for better results. As a result of the studies, the best network performance was obtained with the neural network, which has the Elman backpropagation network type. When comparing the performance comparison of the neural networks, how close they are to 1 for the results of R2 and also to 0 for the results of MSE, RSE, and MAE is essential for the results. The performance rankings of the other networks are shown in Table 12. In this study, it was observed that artificial intelligence provides valuable results in an application that has very unpredictable results, such as determining the change of signal intensity according to dose. It is predicted that the popularity of ANN in examining the dosimetric properties of materials will continue to increase in the future.

Funding

This research received no external funding.

Institutional Review Board Statement

Not applicable.

Informed Consent Statement

Not applicable.

Data Availability Statement

Data are contained within the article.

Acknowledgments

The author expresses gratitude for the financial backing provided through the Scientific Research Projects of Cukurova University FBA 2023 15883 project.

Conflicts of Interest

The author declares no conflict of interest.

References

  1. McKeever, S.W.S. Thermoluminescence of Solids; Cambridge University Press: Cambridge, UK, 1985. [Google Scholar]
  2. Aitken, M.J. Thermoluminescence Dating; Academic Press: London, UK, 1985. [Google Scholar]
  3. Dogan, T. Comparison of the thermoluminescence kinetic parameters for natural alkali-rich aluminosilicates minerals. Appl. Radiat. Isot. 2019, 149, 174–181. [Google Scholar] [CrossRef] [PubMed]
  4. Lyons, W.B.; Fitzpatrick, C.; Flanagan, C.; Lewis, E. A novel multipoint luminescent coated ultra violet fibre sensor utilising artificial neural network pattern recognition techniques. Sens. Actuators A Phys. 2004, 115, 267–272. [Google Scholar] [CrossRef]
  5. Karaman, Ö.A.; Ağır, T.T.; Arsel, İ. Estimation of solar radiation using modern methods. Alex. Eng. J. 2021, 60, 2447–2455. [Google Scholar] [CrossRef]
  6. Lee, S.Y.; Kim, B.H.; Lee, K.J. An application of artificial neural intelligence for personal dose assessment using a multi-area OSL dosimetry system. Radiat. Meas. 2001, 33, 293–304. [Google Scholar] [CrossRef] [PubMed]
  7. Kardan, M.R.; Koohi-Fayeghc, R.; Setayeshia, S.; Ghiassi-Neja, M. Fast neutron spectra determination by threshold activation detectors using neural networks. Radiat. Meas. 2004, 38, 185–191. [Google Scholar] [CrossRef]
  8. Nelson, M.S.; Rittenour, T.M. Using grain-size characteristics to model soil water content: Application to dose-rate calculation for luminescence dating. Radiat. Meas. 2015, 81, 142–149. [Google Scholar] [CrossRef]
  9. Yadollahi, A.; Nazemi, E.; Zolfaghari, A.; Ajorloo, A.M. Application of artificial neural network for predicting the optimal mixture of radiation shielding concrete. Prog. Nucl. Energy 2016, 89, 69–77. [Google Scholar] [CrossRef]
  10. Kröninger, K.; Mentzel, F.; Theinert, R.; Walbersloh, J. A machine learning approach to glow curve analysis. Radiat. Meas. 2019, 125, 34–39. [Google Scholar] [CrossRef]
  11. Işık, İ.; Işık, E.; Toktamış, H. Dose and fading time estimation of glass ceramic by using artificial neural network method. Dicle Üniversitesi Mühendislik Fakültesi Mühendislik Derg. 2021, 12, 47–52. [Google Scholar] [CrossRef]
  12. Derugin, E.; Kröninger, K.; Mentzel, F.; Nackenhorst, O.; Walbersloh, J.; Weingarten, J. Deep TL: Progress of a machine learning aided personal dose monitoring system. Radiat. Prot. Dosim. 2023, 199, 767–774. [Google Scholar] [CrossRef]
  13. Türkşen, İ.B. Dereceli (Bulanık) Sistem Modelleri; Abaküs Yayıncılık: İstanbul, Turkey, 2015. [Google Scholar]
  14. Baykal, N.; Beyan, T. Bulanık Mantık, Uzman Sistemler ve Denetleyiciler; Bıçaklar Kitabevi: Ankara, Turkey, 2004. [Google Scholar]
  15. Specht, D.F. A General Regression Neural Network. IEEE Trans. Neural Netw. 1991, 2, 568–576. [Google Scholar] [CrossRef] [PubMed]
  16. Sahroni, A. Brief Study of Identification System Using Regression Neural Network Based on Delay Tap Structures. GSTF J. Comp. 2013, 3, 17. [Google Scholar] [CrossRef]
  17. Sağıroğlu, Ş.; Beşdok, E.; Erler, M. Mühendislikte Yapay Zeka Uygulamaları I, Yapay Sinir Ağları; UFUK Yayıncılık: Kayseri, Turkey, 2003. [Google Scholar]
  18. Moody, J.; Darken, C.J. Fast Learning in Networks of Locally-Tuned Processing Units. Neural Comput. 1989, 1, 281–294. [Google Scholar] [CrossRef]
  19. Network Knowledge. Available online: https://www.mathworks.com/help/deeplearning/ref/cascadeforwardnet.html?s_tid=srchtitle_cascadeforwardnet_1 (accessed on 24 September 2021).
  20. Rumelhart, D.E.; Hinton, G.E.; Williams, R.J. Learning Representations by Back-Propagating Errors. Nature 1986, 323, 533–536. [Google Scholar] [CrossRef]
  21. Desai, V.S.; Crook, J.N.; Overstreet, G.A., Jr. A comparison of neural networks and linear scoring models in the credit union environment. Eur. J. Oper. Res. 1996, 95, 24–37. [Google Scholar] [CrossRef]
  22. Elman, J. Finding structure in time. Cogn. Sci. 1990, 14, 179–211. [Google Scholar] [CrossRef]
  23. Şen, Z. Yapay Sinir Ağları İlkeleri; Su Vakfı Yayınları: İstanbul, Turkey, 2004. [Google Scholar]
  24. Öztemel, E. Yapay Sinir Ağları, 3rd ed.; Papatya Yayıncılık: İstanbul, Turkey, 2012. [Google Scholar]
  25. Elmas, Ç. Yapay Zeka Uygulamaları, 3rd ed.; Seçkin Yayıncılık: Ankara, Turkey, 2016. [Google Scholar]
  26. Layer Recurrent Neural Network, Layrecnet Command. Available online: https://www.mathworks.com/help/deeplearning/ref/layrecnet.html?s_tid=srchtitle_layrecnet_1 (accessed on 26 September 2021).
  27. Design Layer Recurrent Neural Networks. Available online: https://www.mathworks.com/help/deeplearning/ug/design-layer-recurrent-neural-networks.html?searchHighlight=Design%20Layer-Recurrent%20Neural%20Networks&s_tid=srchtitle (accessed on 26 September 2021).
  28. Karunasingha, D.S.K. Root Mean Square Error or Mean Absolute Error? Use Their Ratio as Well. Inf. Sci. 2022, 585, 609–629. [Google Scholar] [CrossRef]
  29. Chicco, D.; Warrens, M.J.; Jurman, G. The Coefficient of Determination R-Squared is More Informative than SMAPE, MAE, MAPE, MSE and RMSE in Regression Analysis Evaluation. PeerJ Comput. Sci. 2021, 7, 623. [Google Scholar] [CrossRef]
  30. Schubert, A.L.; Hagemann, D.; Voss, A.; Bergmann, K. Evaluating the Model Fit of Diffusion Models with the Root Mean Square Error of Approximation. J. Math. Psychol. 2017, 77, 29–45. [Google Scholar] [CrossRef]
  31. de Myttenaere, A.; Golden, B.; Grand, B.L.; Rossi, F. Mean Absolute Percentage Error for Regression Models. Neurocomputing 2016, 192, 38–48. [Google Scholar] [CrossRef]
  32. Kucuk, N.; Kucuk, I. Computational modeling of thermoluminescence glow curves of zinc borate crystals. J. Inequal. Appl. 2013, 136, 136. [Google Scholar] [CrossRef]
  33. Isik, E.; Toktamis, D.; Er, M.B.; Hatib, M. Classification of thermoluminescence features of CaCO3 with long short-term memory model. Luminescence 2021, 36, 1684–1689. [Google Scholar] [CrossRef]
  34. Mentzel, F.; Derugin, E.; Jansen, H.; Kröninger, K.; Nackenhorst, O.; Walbersloh, J.; Weingarten, J. No More Glowingin the Dark: How Deep Learning Improves Exposure Date Estimation in Thermoluminescence Dosimetry. J. Radiol. Prot. 2020, 41, 4. [Google Scholar]
  35. Theinert, R.; Kröninger, K.; Lütfring, A.; Mender, S.; Mentzel, F.; Walbersloh, J. Fading Time and Irradiation Dose Estimation from Thermoluminescent Dosemeters Using Glow Curve Deconvolution. Radiat. Meas. 2018, 108, 20–25. [Google Scholar] [CrossRef]
  36. Toktamis, D.; Er, M.B.; Isik, E. Classification of thermoluminescence features of the natural halite with machine learning. Radiat. Eff. Defects Solids 2022, 177, 360–371. [Google Scholar] [CrossRef]
  37. Al-Mahasneh, A.J.; Anavatti, S.G.; Garratt, M.A. Review of Applications of Generalized Regression Neural Networks in Identif. and Control of Dynamic Systems. arXiv 2018, arXiv:1805.11236v1. [Google Scholar]
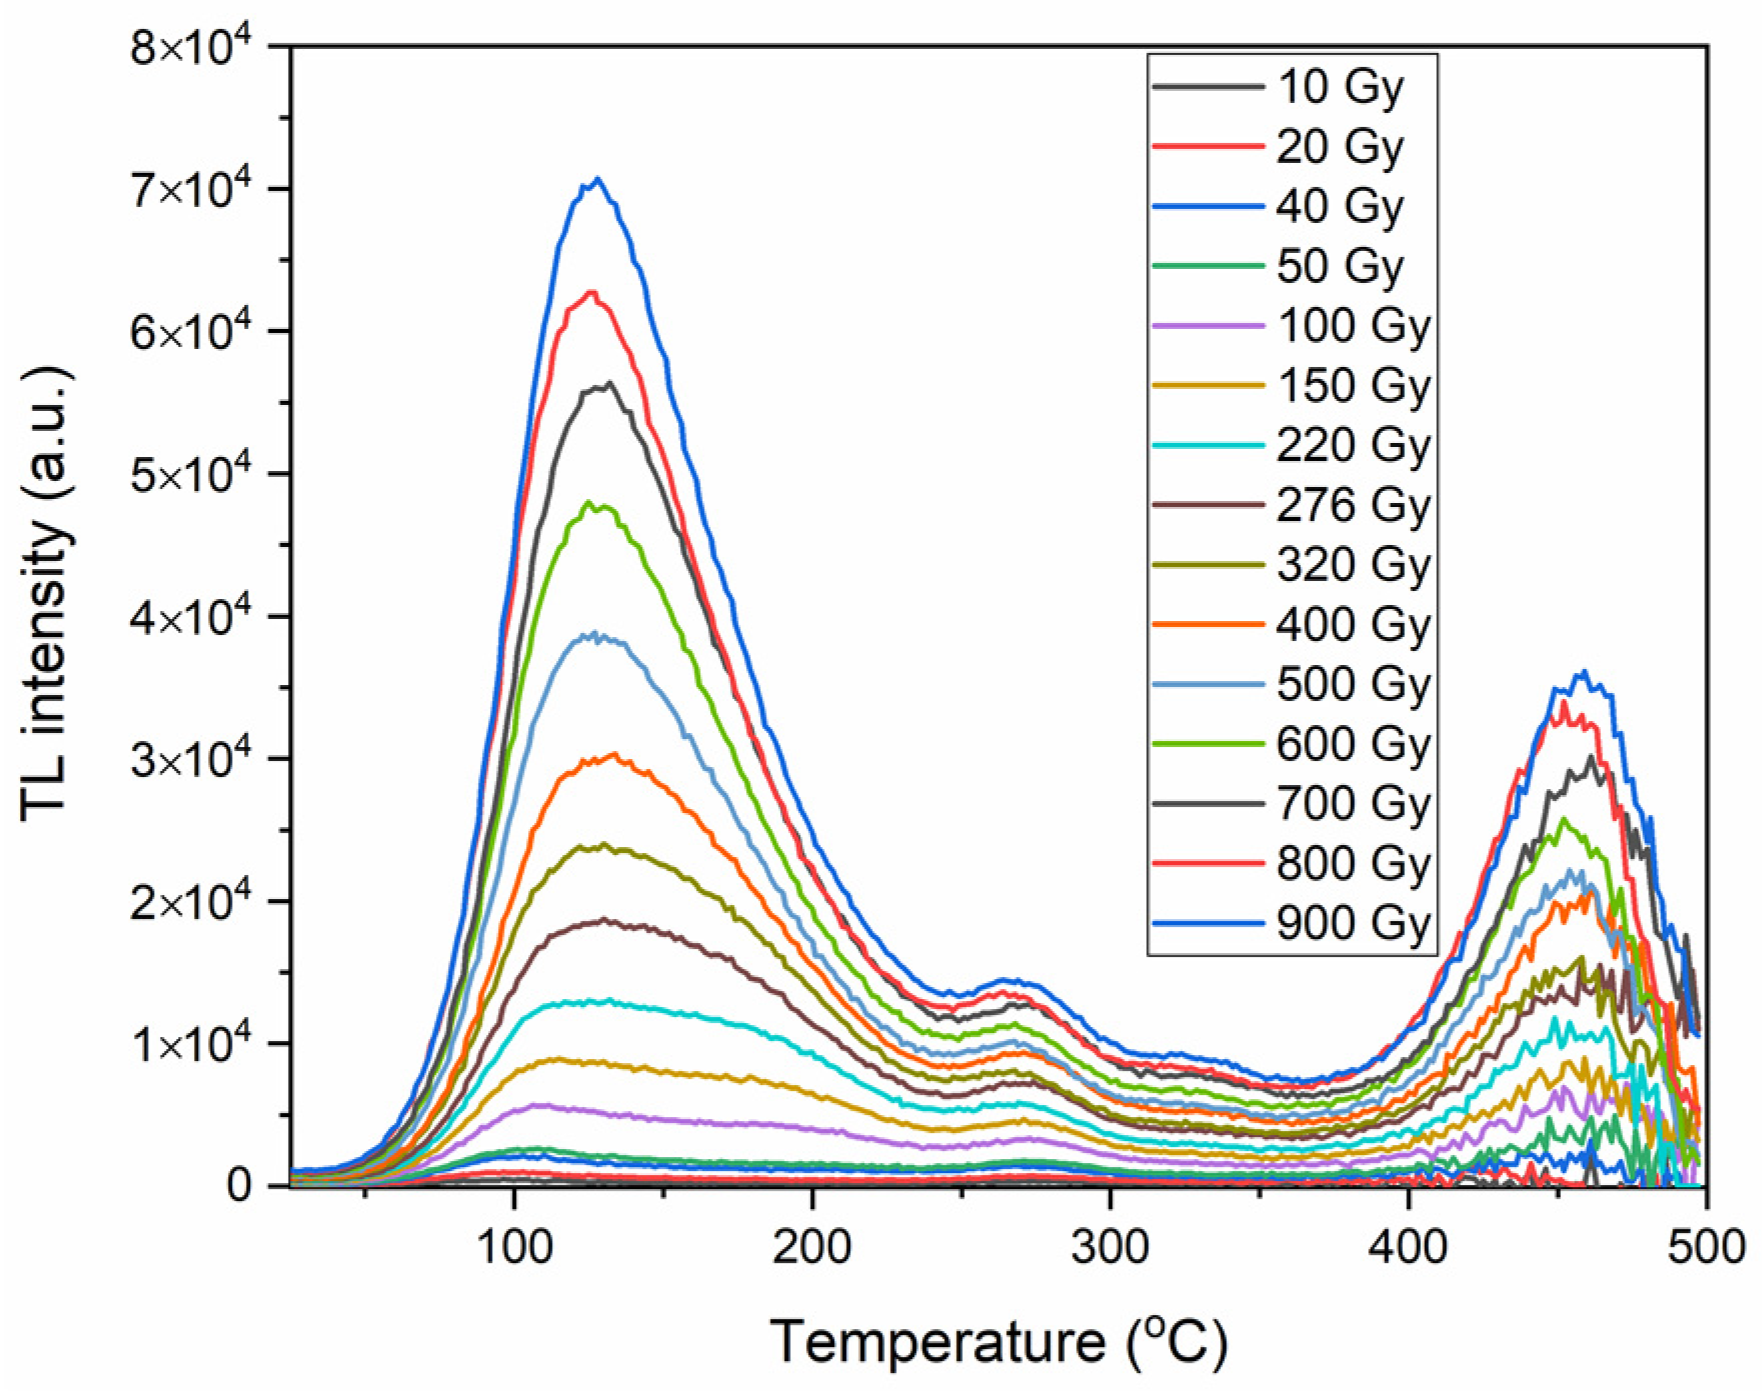
Figure 1. Experimental dose–response of TL glow curves for aluminosilicate sample 10–900 Gy.
Applsci 13 13027 g001
Figure 2. Experiment results for test data.
Applsci 13 13027 g002
Figure 3. Input and output data for NN methods.
Applsci 13 13027 g003
Figure 4. ANFIS error values with different input set numbers. A: training RMSE; B: testing RMSE; C: training R2; D: testing R2; E: training RSE; F: testing RSE; G: training MAE; H: testing MAE.
Applsci 13 13027 g004
Figure 5. ANFIS test results and network structure. (a) Gaussmf 66 test results. (b) Gaussmf 66 network structure in MATLAB. (c) ANFIS general representation.
Applsci 13 13027 g005aApplsci 13 13027 g005b
Figure 6. GRNN test results and network structure. (a) Spread = 0.1 test results. (b) GRNN structure. (c) GRNN representation in MATLAB.
Applsci 13 13027 g006aApplsci 13 13027 g006b
Figure 7. RBNN test results and network structure. (a) Spread = 10; eg = 10 test results. (b) RBNN structure. (c) RBNN representation in MATLAB.
Applsci 13 13027 g007
Figure 8. CFBNN test results and network structure. (a) Trainscg test results. (b) CFBNN structure. (c) CFBNN representation in MATLAB.
Applsci 13 13027 g008aApplsci 13 13027 g008b
Figure 9. EBNN test results and network structure. (a) Trainoss test results. (b) EBNN structure. (c) EBNN representation in MATLAB.
Applsci 13 13027 g009
Figure 10. FFBNN test results and network structure. (a) Trainlm test results. (b) FFBNN structure. (c) FFBNN representation in MATLAB.
Applsci 13 13027 g010
Figure 11. LRNN test results and network structure. (a) Trainoss test results. (b) LRNN structure. (c) LRNN representation in MATLAB.
Applsci 13 13027 g011
Table 1. Performance comparisons of spread values for the GRNN method.
Spread = 0.01Spread = 0.1Spread = 1Spread = 10Spread = 100
Training R2110.99920.99750.5958
Testing R20.95630.95630.95580.95470.5550
Training RSE00163.48330.996645.55
Testing RSE738.81738.81756.07738.883897.21
Training MAE000.03970.18282.1079
Testing MAE0.27930.27930.28540.26681.4342
Table 2. Performance comparisons of spread and error goal values for the RBNN method.
sc: 0.01
eg: 1.10−11
sc: 0.1
eg: 1.10−11
sc: 0.1
eg: 0.1
sc: 1
eg: 1
sc: 10
eg: 10
sc: 0.02
eg: 0.01
Training R21110.99990.99991
Testing R24.94 × 10−304.94 × 10−302.03 × 10−318.69 × 10−313.12 × 10−324.94 × 10⁻³⁰
Training RSE1.37 × 10−91.37 × 10−92.88676.1533-1.37 × 10⁻⁹
Testing RSE3349.343349.343348.673349.853339.813349.34
Training MAE3.96 × 10−133.96 × 10−130.000270.000990.004523.96 × 10−13
Testing MAE110.999061.000710.986521
Table 3. The basic properties of the CFBNNs.
Network TypeTraining FunctionLayer 1 Transfer FunctionLayer 1 NeuronLayer 2 Transfer FunctionLayer 2 NeuronLayer 3 Transfer FunctionLayer 3 Neuron
1Cas. For. Backp.TRAINBFGLOGSIG10PURELIN1--
2Cas. For. Backp.TRAINLMTANSIG20PURELIN1--
3Cas. For. Backp.TRAINSCGLOGSIG30TANSIG30PURELIN1
4Cas. For. Backp.TRAINOSSTANSIG40LOGSIG40PURELIN1
Table 4. Performance comparisons of the CFBNNs.
Train.
R
Valid.
R
Test.
R
All.
R
MSETrain
R2
Test.
R2
Train.
RSE
Test.
RSE
Train
MAE
Test
MAE
10.89210.87990.84090.88373.20 × 1070.780.705098.62817.272.331.33
20.99870.99820.99850.99864.84 × 1050.990.63742.743611.560.390.96
30.99930.99880.99940.99923.08 × 1050.990.68336.233000.460.190.71
40.99920.99910.99900.99912.28 × 1050.990.56346.095051.940.201.73
Table 5. The basic properties of the EBNNs.
Network TypeTraining FunctionLayer 1 Transfer FunctionLayer 1 NeuronLayer 2 Transfer FunctionLayer 2 NeuronLayer 3 Transfer FunctionLayer 3 Neuron
1Elman Backp.TRAINBFGLOGSIG10PURELIN1--
2Elman Backp.TRAINLMTANSIG20PURELIN1--
3Elman Backp.TRAINSCGLOGSIG30TANSIG30PURELIN1
4Elman Backp.TRAINOSSTANSIG40LOGSIG40PURELIN1
Table 6. Performance comparisons of the EBNNs.
Train.
R
Valid.
R
Test.
R
All.
R
MSETrain
R2
Test.
R2
Train.
RSE
Test.
RSE
Train
MAE
Test
MAE
1----7.29 × 1070.450.407091.94304.592.101.67
2----3.08 × 1050.990.96521.05889.300.290.32
3----6.84 × 1060.950.931625.4963.830.530.36
4----7.46 × 1050.990.98635.54440.950.280.16
Table 7. The basic properties of the FFBNNs.
Network TypeTraining FunctionLayer 1 Transfer FunctionLayer 1 NeuronLayer 2 Transfer FunctionLayer 2 NeuronLayer 3 Transfer FunctionLayer 3 Neuron
1Feed-For. Backp.TRAINBFGLOGSIG10PURELIN1--
2Feed-For. Backp.TRAINLMTANSIG20PURELIN1--
3Feed-For. Backp.TRAINSCGLOGSIG30TANSIG30PURELIN1
4Feed-For. Backp.TRAINOSSTANSIG40LOGSIG40PURELIN1
Table 8. Performance comparisons of the FFBNNs.
Train.
R
Valid.
R
Test.
R
All.
R
MSETrain
R2
Test.
R2
Train.
RSE
Test.
RSE
Train
MAE
Test
MAE
10.95810.95910.94120.95611.37 × 1070.910.902554.61220.401.150.57
20.99780.99680.99770.99768.37 × 1050.990.98845.97628.650.430.30
30.99920.99900.99900.99912.45 × 1050.990.72314.622227.870.210.54
40.99920.99910.99840.99912.39 × 1050.990.82366.351798.400.200.57
Table 9. The basic properties of the LRNNs.
Network TypeTraining FunctionLayer 1 Transfer FunctionLayer 1 NeuronLayer 2 Transfer FunctionLayer 2 NeuronLayer 3 Transfer FunctionLayer 3 Neuron
1Layer RecurrentTRAINBFGLOGSIG10PURELIN1--
2Layer RecurrentTRAINLMTANSIG20PURELIN1--
3Layer RecurrentTRAINSCGLOGSIG30TANSIG30PURELIN1
4Layer RecurrentTRAINOSSTANSIG40LOGSIG40PURELIN1
Table 10. Performance comparisons of the LRNNs.
Train.
R
Valid.
R
Test.
R
All.
R
MSETrain
R2
Test.
R2
Train.
RSE
Test.
RSE
Train
MAE
Test
MAE
1----7.96 × 1070.450.406575.93965.811.871.45
2----3.67 × 1050.990.72507.672389.230.250.39
3- ---1.06 × 1060.990.98762.05476.370.350.19
4----8.47 × 1050.990.98706.91463.160.310.18
Table 11. Success rates of networks within 5%, 10%, and 15%.
Network
Type
Train.
5% Error
Test.
5% Error
Train.
10% Error
Test.
10% Error
Train.
15% Error
Test.
15% Error
1EBNN 37.30%32.70%58.35%62.18%80.80%87.95%
2LRNN33.69%30.46%52.55%54.92%64.71%68.63%
3FFBNN32.68%20.16%51.80%37.63%64.67%52.24%
4GRNN97.97%13.53%97.97%24.46%97.97%36.11%
5ANFIS26.09%27.95%45.12%49.64%57.57%64.24%
6CFBNN61.51%14.06%73.15%23.92%79.96%33.33%
7RBNN96.64%097.13%097.36%0
Table 12. Performance comparisons of the networks.
Network
Type
Train.
R2
Test.
R2
Train.
RSE
Test.
RSE
Train.
MAE
Test.
MAE
1EBNN0.990.98635.54440.950.280.16
2LRNN0.990.98706.91463.160.310.18
3FFBNN0.990.98845.97628.650.430.30
4GRNN1.000.950.00738.810.000.27
5ANFIS0.970.961213.37808.030.390.21
6CFBNN0.990.68336.233000.460.190.71
7RBNN0.993.12 × 10−32-3339.810.0040.98
Disclaimer/Publisher’s Note: The statements, opinions and data contained in all publications are solely those of the individual author(s) and contributor(s) and not of MDPI and/or the editor(s). MDPI and/or the editor(s) disclaim responsibility for any injury to people or property resulting from any ideas, methods, instructions or products referred to in the content.