Article

Alternative Fuels for the Marine Sector and Their Applicability for Purse Seiners in a Life-Cycle Framework

Faculty of Mechanical Engineering and Naval Architecture, University of Zagreb, Ivana Lučića 5, 10002 Zagreb, Croatia
*
Author to whom correspondence should be addressed.
Appl. Sci. 2023, 13(24), 13068; https://doi.org/10.3390/app132413068
Submission received: 11 October 2023 / Revised: 25 November 2023 / Accepted: 3 December 2023 / Published: 7 December 2023

Abstract

:
Fossil fuel combustion is a major source of Greenhouse Gases (GHGs), which cause global warming. To prevent further increases in anthropogenic GHGs, the global community needs to take action in each segment of the economy, including the shipping sector. Among different measures for reducing shipping emissions, the most promising one is the replacement of conventional marine fuels with alternatives. According to the International Maritime Organisation’s regulations, ships engaged in international shipping need to reduce their annual emissions by at least 50% by 2050. However, this does not apply to fishing vessels, which are highly dependent on fossil fuels and greatly contribute to air pollution. This paper investigates the environmental footprint of a fishing vessel (purse seiner) through the implementation of various alternative fuels. Within the research, Life-Cycle Assessments (LCAs) and Life-Cycle Cost Assessments (LCCAs) are performed, resulting in life-cycle emissions and lifetime costs for each alternative, which are then compared to a diesel-powered ship (baseline scenario). The comparison, based on environmental and economic criteria, highlighted methanol as the most suitable alternative for the purse seiner, as its use onboard resulted in 22.4% lower GHGs and 23.3% lower costs in comparison to a diesel-powered ship.

1. Introduction

1.1. Research Background

Over the last few decades, extensive use of fossil fuels has resulted in increased Greenhouse Gases (GHGs) in the atmosphere. These emissions refer to the emissions of carbon dioxide (CO2), methane (CH4), nitrous oxide (N2O), and fluorinated gases at low concentrations. They form a thin layer in the atmosphere that prevents solar irradiation from being reflected from the Earth’s surface to space, and as a result, it causes the greenhouse effect, which leads to global warming [1]. The Glasgow Climate Pact of 2021 is the most recent climate agreement, which reaffirmed the Paris Agreement’s ambitions for limiting the global average temperature increase to 1.5 °C above pre-industrial levels [2,3]. To combat the global warming problem, some urgent measures need to be taken, including a sharp GHG reduction in all sectors of the economy, including the shipping sector.
According to the Fourth GHG Study of the International Maritime Organisation (IMO), the share of shipping GHG emissions in global anthropogenic GHG emissions in 2018 was 2.89%, an increase of 9.6% compared to 2012. Without any emission reduction measures, the study predicts a great increase in emissions by the end of 2050 [4]. Due to that, the IMO set the Initial Strategy for GHG reduction, which is in line with the Paris Agreement temperature goals. The strategy has three levels of ambitions: reduction in carbon intensity (CO2 emissions per transport work) through the implementation of further phases of the Energy Efficiency Desing Index (EEDI) for new ships; reduction in carbon intensity by at least 40% by 2030 and 70% by 2050; and reduction in total annual GHGs by at least 50%, compared to 2008 levels [5]. In order to achieve IMO decarbonisation goals, the strategy indicated measures with the following timelines: short-term (2018–2023), mid-term (2023–2030), and long-term (2030–) measures. Short-term measures represent the start of reducing shipping emissions with national plans, a tighter EEDI, the Ship Energy Efficiency Management Plan (SEEMP), speed reduction, etc. [6]. As a mid-term measure, the IMO has adopted new ship energy efficiency regulations for existing ships, i.e., the Energy Efficiency Existing Ship Index (EEXI) and Carbon Intensity Indicator (CII), which entered into force on the 1st of January 2023. The EEXI is a technical measure of energy efficiency related to the design of a ship, while the CII represents the operational measure of energy efficiency embedded into the SEEMP, and it measures CO2 emissions per transport work for cargo, cruise, and ro-ro passenger ships over 5000 gross tonnage (GT). Like its predecessor, the EEDI, the EEXI should be applied for all ships above 400 GT, and their calculated, i.e., attained EEXI needs to be less than or equal to the required EEXI [7,8].
The mid-term measure whose implementation represents an incentive towards zero-carbon technologies is the inclusion of the shipping sector in the Emission Trading System (ETS). As of 2024, commercial cargo and passenger ships of above 5000 GT operating in the European Union will be required to purchase carbon allowances for each ton of released CO2 emission [9].

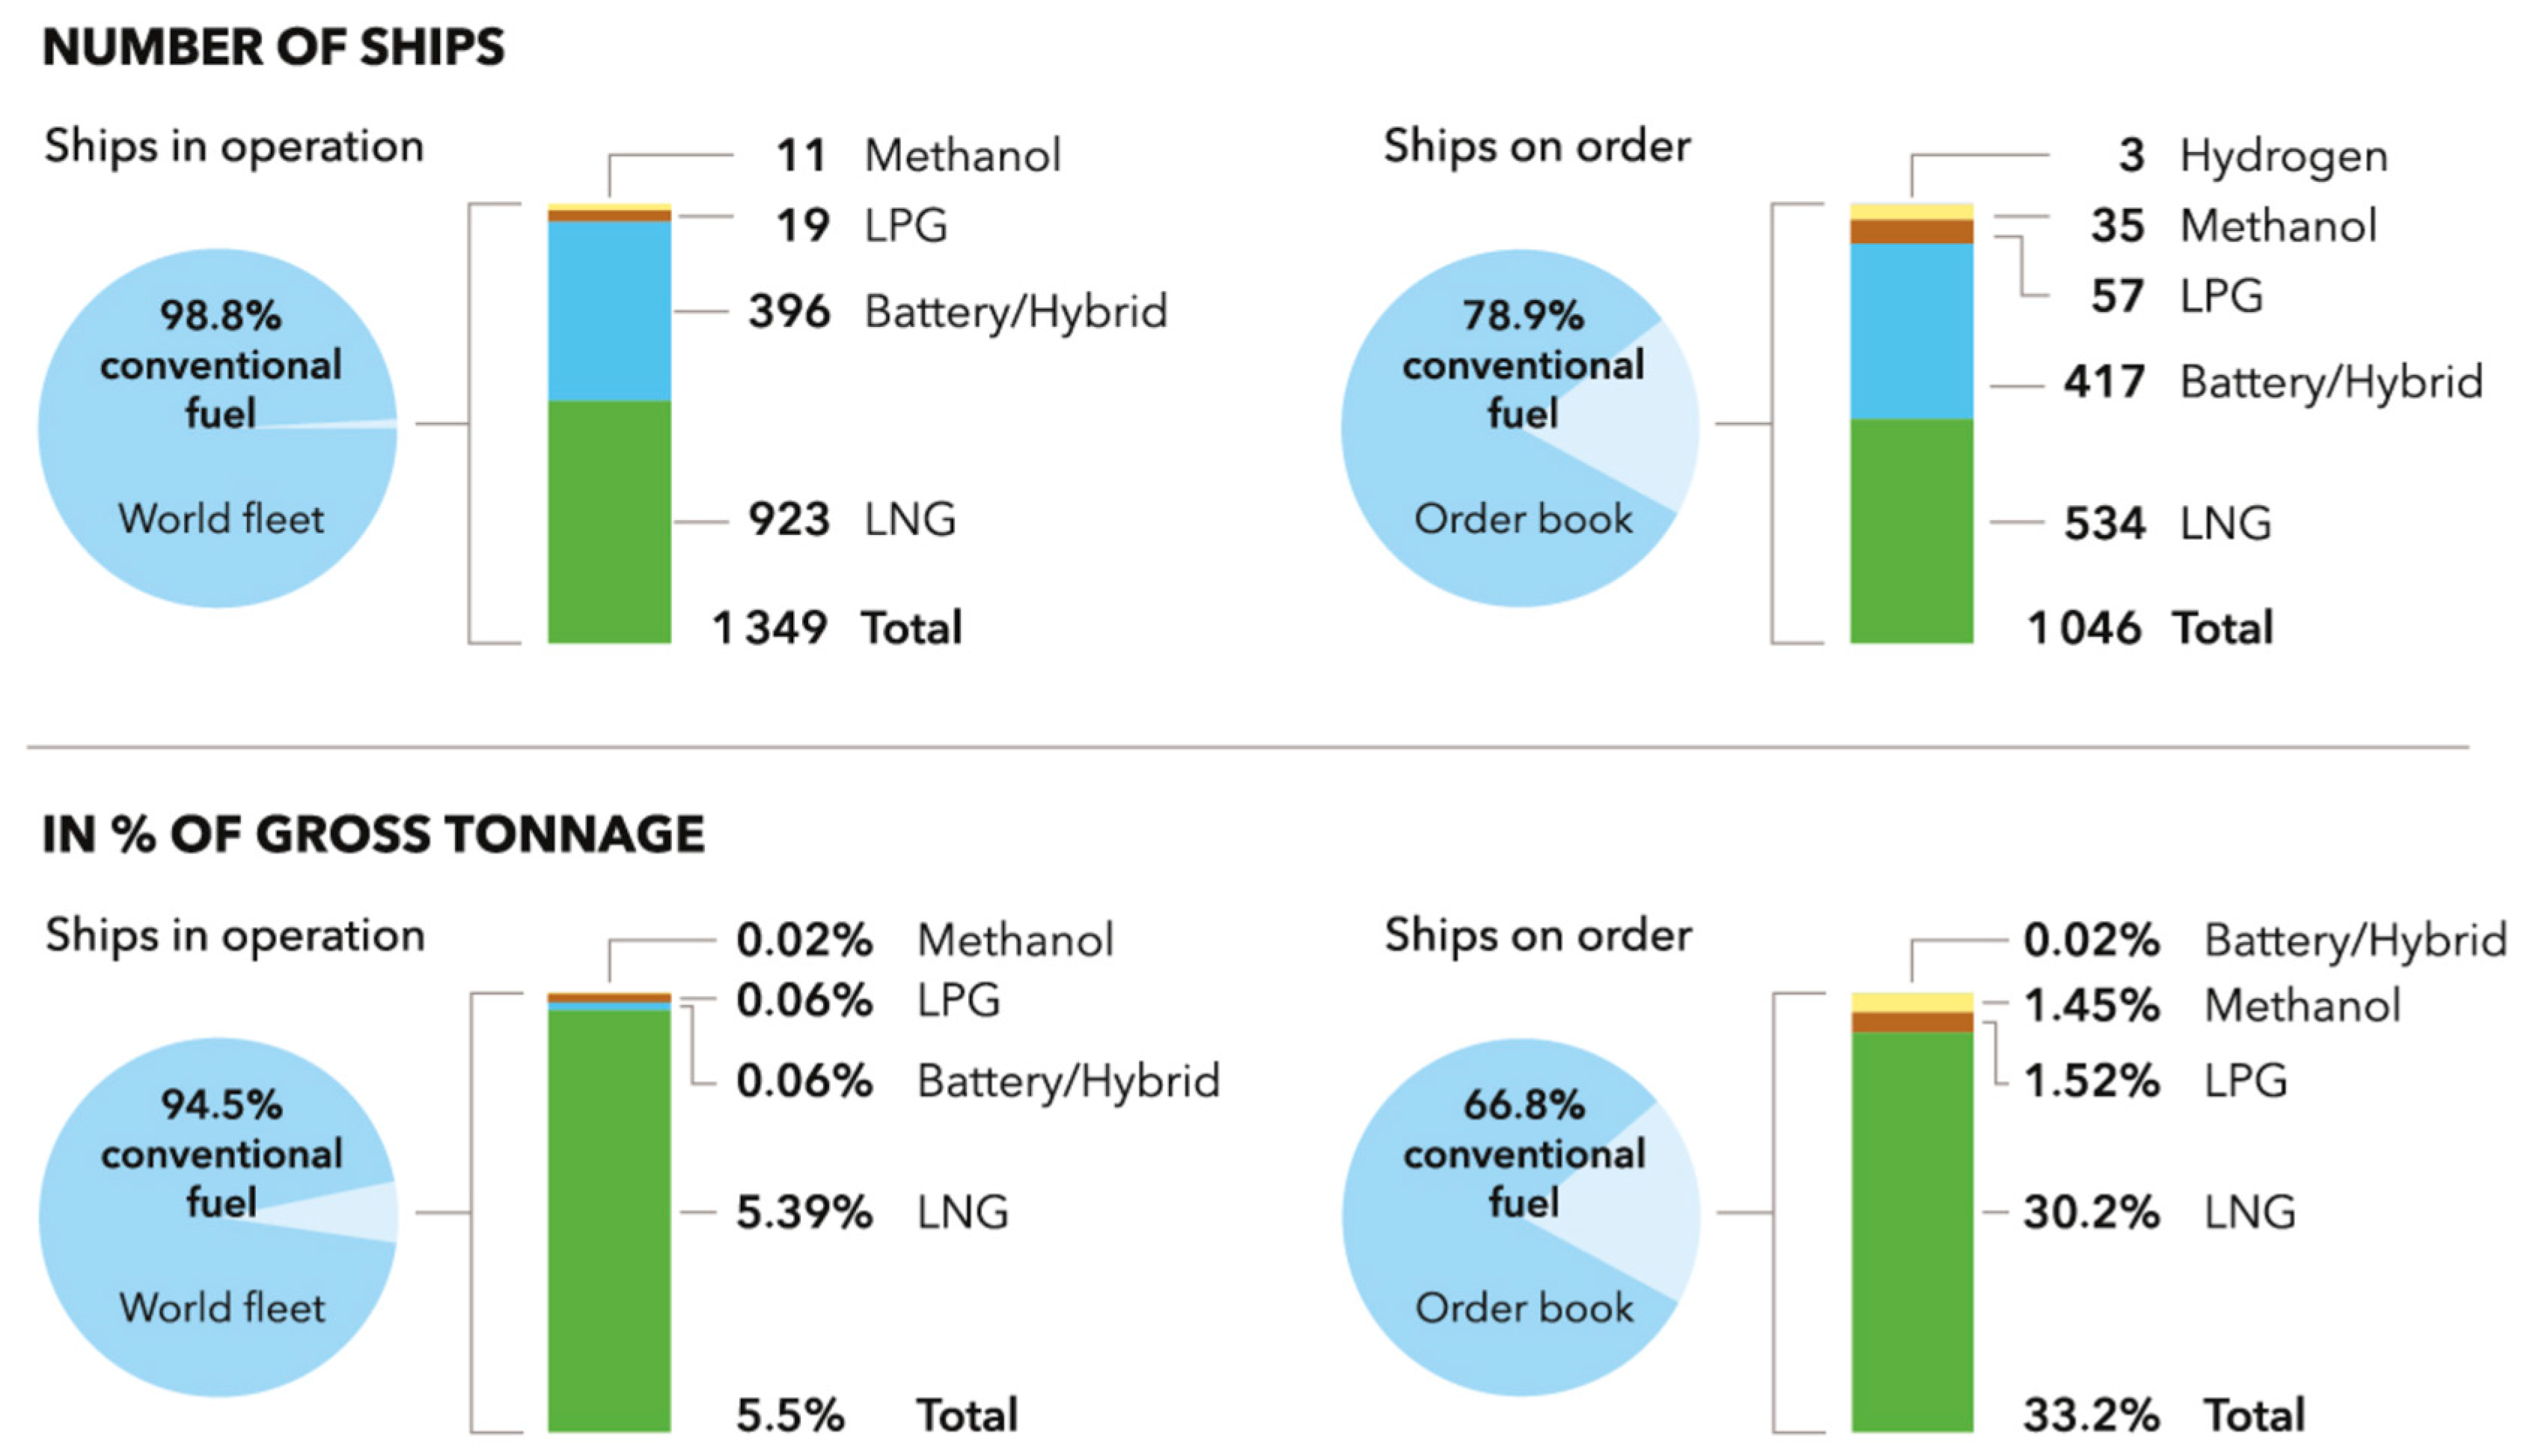
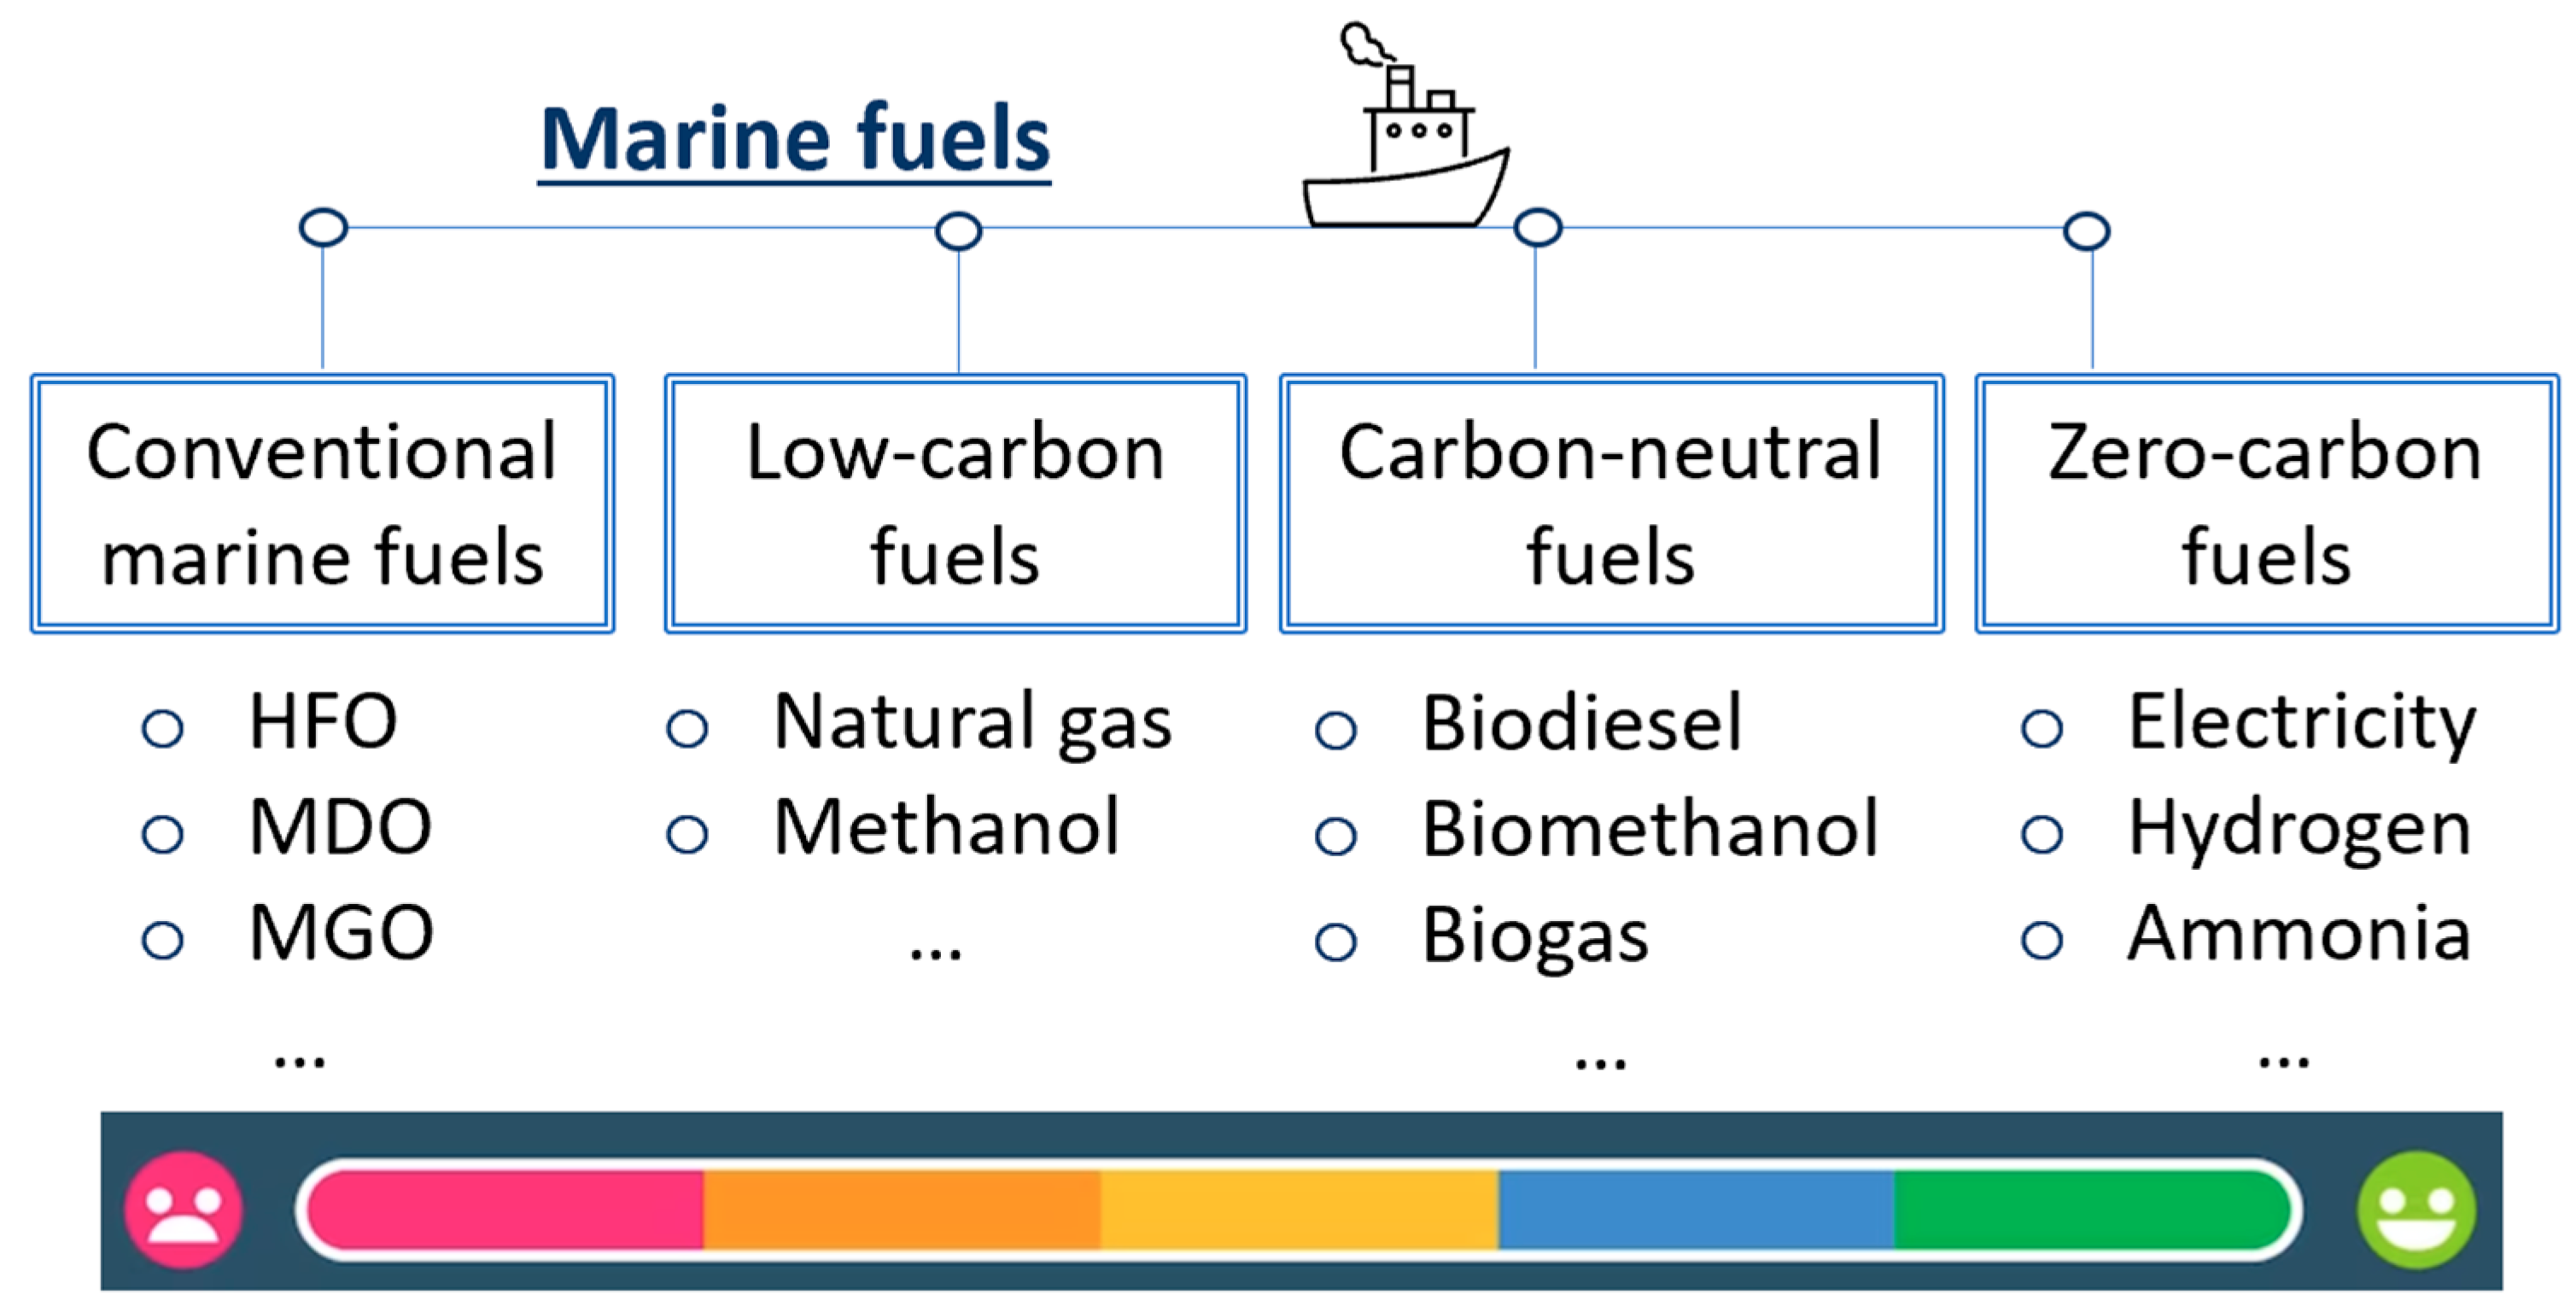
1.2. Review of Alternative Fuels for the Marine Sector

Around 5.5% of GT of ships in operation and one-third of order ships will be powered by alternative marine fuels [10] (Figure 1).
Alternative marine fuels widely investigated within the science community can be divided into low-carbon, carbon-neutral, and zero-carbon fuels (Figure 2).

1.2.1. Low-Carbon Fuels

Low-carbon fuels refer to cleaner fossil fuels with a lower carbon content than conventional marine fuels [11]. Natural gas is a low-carbon fuel with no sulphur and nitrogen atoms compared to conventional marine fuels. Due to that, it can easily be used for operation in Emission Control Areas (ECAs) [12,13]. For transportation purposes, it can be used in compressed form, i.e., Compressed Natural Gas (CNG), or in liquefied form, i.e., Liquefied Natural Gas (LNG) [14]. Natural gas is liquefied by cooling to −163 °C to make handling easier, occupying 600 times less volume than in its gaseous state [15]. Nowadays, most LNG-powered ships are powered by dual-fuel engines, which ensure a smooth transition from fuel to fuel without affecting performance and efficiency [16]. However, current investment costs, undeveloped infrastructure, and safety issues are major limitations for its use as an alternative fuel [17,18,19].
Liquefied Petroleum Gas (LPG) is also considered an alternative to conventional marine fuels due to its high energy density and clean burning properties [20]. According to Yeo et al. [21], LPG is suitable for small to medium-sized domestic ships, such as fishing vessels. Moreover, as onboard LPG energy systems are compatible with ammonia-fuelled systems with only minor modifications, LPG can serve as a transitional fuel for zero-emission shipping with ammonia [22].
Another low-carbon fuel already used in the shipping sector is methanol. Due to its liquid state, methanol can be used in existing diesel infrastructure with minor modifications [23]. Many studies investigated methanol as a marine fuel and concluded that its use reduces harmful emissions [24,25,26,27]. Its major drawback is energy density, which is more than 50% lower than the energy density of conventional fuels [28]. However, methanol is still a suitable alternative fuel for the shipping sector, and nowadays, it is being used onboard ferries, cruisers, tankers, etc. [29].
Dimethyl-ether (DME), a clean-burning liquid fuel of high density, is produced through methanol dehydration. Since its physical properties are similar to LPG, DME can be used in LPG infrastructure and dual-fuel engines intended for LPG [30,31]. When combusted, it results in low CO2 and NOX emissions, while SOX and PM are not emitted [32].

1.2.2. Carbon-Neutral Fuels

Carbon-neutral (or climate-neutral) fuels refer to biofuels due to the general opinion that CO2 emissions released during biofuel combustion will be absorbed by new biomass further used for biofuel production. In this manner, combustion-related CO2 emissions are not considered in the environmental footprint of a biofuel [33]. The first generation of biofuels refers to biofuels produced from edible biomass (e.g., corn, rapeseed, soybean, sugar cane, etc.), while the second generation represents biofuels derived from inedible biomass (e.g., poplar, switchgrass, corn stover, organic waste, etc.). The third and fourth generations of biofuels refer to fuel produced from microalgae and genetically modified microalgae [34].
Gilbert et al. [35] showed that using biofuels as marine fuels reduces GHGs by 57–59% compared to conventional marine fuels. However, their wider use onboard ships faces limitations such as availability, high cost, and sustainability of fuels [36]. Like its fossil counterpart (LNG), Liquefied Biogas (LBG) has been identified as a potential alternative fuel for the shipping sector. The transition from using LNG as ship fuel to LBG does not require additional equipment or cost. Since combustion-based CO2 emissions are not considered, LBG is more environmentally friendly than LNG [37]. The most common biofuel that is being investigated as a marine fuel is biodiesel, which is mainly produced from edible biomass by the transesterification process [34]. Its use onboard has been investigated in many studies [38,39], but it is not a pure fuel. It is limited to blends with diesel (usually 80–95% of diesel and 5–20% of biodiesel) due to poor cold flow properties, which can result in damaging power systems, and limited storage stability [40,41,42].

1.2.3. Zero-Carbon Fuels

Zero-carbon fuels are fuels whose use does not result in CO2 emissions. These fuels represent promising measures for ship decarbonisation and reaching the IMO’s 2050 goal [42].
The electrification of ships represents a game changer for the decarbonisation of the shipping industry. There are three types of electrified ships, i.e., plug-in hybrid ships, hybrid ships, and all-electric ships. Both plug-in hybrid ships and hybrid ships include diesel engines and batteries, while all-electric ships refer to the sole use of batteries for ship power [43]. The main drawbacks of full electrification are limitations regarding battery capacity, degradation and weight, investment costs, charging infrastructure at the docks, and sailing distance [44,45,46]. Different types of batteries are available for maritime purposes. Perčić et al. [47] investigated three batteries (lithium-ion (Li-ion), nickel-metal hydride, and lead batteries) for use in ferries. Li-ion batteries were highlighted as the most environmentally friendly and cost-effective option. With further development of battery technology, i.e., metal–air batteries [48], the full electrification of ships that operate in the open sea could be feasible.
Hydrogen use onboard ships also achieves zero-emission shipping. Based on its cleanliness, i.e., the sources used for its production, hydrogen can be classified by different colours (grey, brown, blue, yellow, pink, green, etc.). However, hydrogen is still primarily produced from natural gas by steam reforming (known as grey hydrogen) [49]. Due to its low volumetric energy density, hydrogen is difficult to store. Often stored in its liquid form, hydrogen evaporates due to heat leakage into the cryogenic tank, known as boil-off gas, which represents a drawback of liquid hydrogen storage [50]. Due to the fast kinetics of electrochemical reactions and its only by-product being water, hydrogen represents the most appropriate fuel for fuel cells. There are different types of fuel cells that are classified based on their operating temperature: low-temperature fuel cells (~80 °C), intermediate-temperature fuel cells (~200 °C), and high-temperature fuel cells (650–1000 °C) [51]. The application of fuel cells onboard usually refers to satisfying auxiliary power needs [52,53]. However, their use for propulsion is entering a new phase, starting with the first ferry fully powered by fuel cells fuelled with liquid hydrogen which has been in operation in Norway since March 2023 [54].
Hydrogen can also be used in an Internal Combustion Engine (ICE), which is less expensive to produce, has a longer lifetime, and does not require fuel purification before use (which is required for low-temperature fuel cells) [55]. However, its use in ICEs encounters several challenges, e.g., potentially high combustion temperatures, which lead to high NOX emissions [56].
Ammonia is a hydrogen-rich fuel whose storage onboard ships is easier than that of hydrogen. It is the second most produced chemical in the world, used mainly as a fertiliser. Its use on board (in ICEs or fuel cells) does not result in CO2 and SOX emissions, while NOX emissions can be eliminated with the proper catalyst. Its main drawbacks are toxicity (for humans and marine life) and corrosiveness, low energy density, and infrastructure, which should be expanded to cover the maritime sector [42].

1.2.4. Electro-Fuels

Electro-fuels are synthetic fuels produced with electricity by combining hydrogen and carbon atoms, either from CO2 captured from industrial processes through carbon capture and utilisation or direct intake from the atmosphere, known as direct air capture. They can be divided into non-carbon-based e-fuels, like hydrogen and ammonia (belonging to zero-carbon fuels), and carbon-based e-fuels, such as e-methanol, e-methane, etc. (belonging to carbon-neutral fuels) [42,57]. Generally, e-fuels are more expensive than their fossil counterparts, and due to that, subsidies are necessary for their production and use, as well as funding future pilot projects regarding e-fuels.

1.2.5. Comparison of Fuels

Some properties of conventional and alternative marine fuels are presented in Table 1.
Besides the qualitative indicators shown in Table 1, environmental and economic analyses are crucial for the decision-making process, i.e., choosing the appropriate alternative fuel for a particular ship that operates in a specific area. Perčić et al. [62] performed a Life-Cycle Assessment (LCA) and Life-Cycle Cost Assessment (LCCA) of different marine fuels and indicated that among the considered alternatives, fully electrified ships are the most environmentally friendly and cost-efficient alternative to diesel power systems installed on ro-ro passenger ships.
Recent studies on alternative fuels in the marine sector are presented in Table 2. Ha et al. [22] performed an LCA of Heavy Fuel Oil (HFO), LNG, LPG, and methanol as marine fuels onboard a Korean bulk carrier. The study indicated that LPG has the lowest GHG emissions, but the country of import significantly affects overall emissions. Similar research was conducted by Spoof-Tuomi and Niemi [63], who investigated an LCA comparison of Marine Diesel Oil (MDO), LNG, and LBG onboard ro-ro passenger ships. The results showed that the most environmentally friendly option is LBG, whose implementation in the shipping sector would be difficult to achieve without any subsidies. Jeong and Yun [64] explored the cost-effectiveness of Low-Sulphur Fuel Oil (LSFO), LNG, and ammonia onboard container ships. Along with capital, investment, and operational costs, carbon cost was also included in the analysis. The study revealed the introduction of carbon allowances into the shipping sector would not be sufficient to replace conventional fuel with ammonia. However, such a tax policy would increase the chance of LNG being more profitable than LSFO.

1.3. Emissions from the Fishing Sector

The fishing sector represents a great part of the food source and the economy of countries with access to the sea. According to the Food and Agriculture Organisation (FAO), more than half of the world’s fish production is generated by developing countries. China is the world leader in the number of captured fish, while Norway is the leader in Europe [72]. Fishing vessels come in different sizes, equipped with different types of gear depending on the target species. They operate on unfixed routes and change course frequently, which makes their power needs highly variable. Around 86% of all motorised fishing vessels have a length of less than 12 m, while less than 2% refer to industrial fishing vessels of over 24 m in length and more than 100 GT [73].
Fishing activities affect aquatic ecosystems in terms of visible pollution such as plastic litter and oil spills, invisible pollution such as microplastics and pollutant dumping (different chemicals), underwater noise, bycatch, ghost fishing, over-exploitation of fish, etc. [74]. Fossil fuel consumption is the most significant environmental problem related to fishing activities, affecting the environment and human health [75,76]. Most fishing vessels are powered by conventional fossil marine fuels, like MDO and Marine Gas Oil (MGO), whose combustion results in GHGs, NOX, SOX, and PM, contributing to global warming and acidification [77]. The fishing sector itself accounts for 1.2% of global oil consumption, which results in the release of 134 million tonnes of CO2 emissions into the atmosphere [78].
To support sustainable fishing and reduce harmful emissions, replacing traditional power systems with alternative ones fuelled with cleaner fuels needs to be performed. Koričan et al. [68] analysed the environmental and economic impact of several alternative fuels implemented on a trawler that performs fishing activities in the Adriatic Sea. The LCA comparison of different powering options indicated that the use of ammonia on board results in the highest life-cycle GHG emissions. The most environmentally friendly solution is a fully electrified vessel. From an economic point of view, the LCCA results showed that hydrogen is the most expensive option for the trawler, while the most cost-efficient option is the use of methanol as an alternative fuel. Kim et al. [20] analysed LPG and bio-LPG compared to conventional marine fuels for fishing vessels. The performed LCA indicated that LPG results in 30% lower GHG emissions than diesel-powered fishing vessels, while bio-LPG can reduce GHGs by over 65%. The nexus between all-electric fishing vessels and Isolated Energy Systems (IES) with a high share of renewables was investigated by Koričan et al. [79]. The study confirmed that all-electric ships, charged in island grids, can reduce the critical excess of electricity production, operating costs of IES, and the emissions of CO2.

1.4. The Aim of This Paper

This paper reviews alternative marine fuels that can be used for fishing vessels and provides environmental and economic analyses of their application in a purse seiner operating in the Adriatic Sea. Koričan et al. [68] already investigated different alternative fuels in a trawler. However, their study lacks an analysis of various emissions and their impact on acidification, eutrophication, and aerosol formation, which significantly affect human health, the atmosphere, and the marine ecosystem. Also, it does not provide insights into the applicability of alternative fuels for purse seiners due to their significantly different operating profile.
By performing an LCA and LCCA, the life-cycle emissions (GHGs, NOX, SOX, and PM) and lifetime costs of different alternative fuels (LNG, LBG, LPG, methanol, DME, electricity, hydrogen, ammonia, biodiesel) are investigated. Environmental and economic analyses of a conventional marine fuel, i.e., diesel, onboard a purse seiner serve as a baseline scenario for the final LCA and LCCA comparison of the considered fuels, thus highlighting the most environmentally friendly and economical power system option.

2. Methodology

2.1. Life-Cycle Assessment

An LCA is a standardised method that offers a holistic approach to assess the environmental impact related to the released emissions and energy used throughout the life-cycle of a product, process, or system [80]. According to ISO guidelines (ISO 14040) [81], an LCA has four fundamental phases: goal and scope, inventory analysis, impact assessment, and interpretation.
The first phase of an LCA represents the definition of its goal, scope, functional unit, system boundary, and the identification of data and impact categories. The Functional Unit (FU) is used to compare the investigated power systems on the same basis, and for this assessment, the FU is the lifetime of a ship, i.e., 20 years. The investigated emissions can be divided into three groups. The first group represents emissions from the Well-to-Tank (WTT) phase, which includes raw material extraction, fuel production, and distribution to the ship. The second group are emissions released during the ship’s operation (the Tank-to-Wake (TTW) phase). The third group of emissions belongs to the Manufacturing (M) phase, related to the manufacturing process of the major elements of a power system (engine, fuel cell, battery, etc.).
Emissions from the WTT and M phases were obtained using the LCA software GREET 2022 [82], whose database contains many products (fuels) and stationary and transportation processes related to their life-cycles. The TTW phase refers to the ship’s operation, i.e., fishing activities. During that time, fuel is used onboard the ship for its propulsion, gear operation, and other activities (hotelling, refrigeration of fish, etc.). Fuel combustion results in tailpipe emissions, ETTW (kg), which are calculated by multiplying emissions factors, EF (kg gas/kg fuel), by fuel consumption, FC (kg), according to the following equation:
E T T W = E F   ·   F C   ,
where EFs are obtained from [22,62,83,84,85] and are presented in Table 3.
Total life-cycle emissions, Ei (kg), are calculated by summing the emissions of a particular gas i (e.g., CO2, CH4, N2O, SOX, NOX, PM) from each LCA phase, namely the M, WTT, and TTW phase:
E i = E W T T , i + E T T W ,   i + E M , i   .
The third phase of an LCA is life-cycle impact analysis, which was carried by means of GREET 2022.
Global Warming Potential, GWP, (kg CO2-eq), was calculated by using CO2-equivalent (CO2-eq) factors over 100 years (CO2: 1; CH4: 36; N2O: 298), as in the following equation [86]:
G W P = 1   ·   E C O 2 + 36   ·   E C H 4 + 298   ·   E N 2 O   .
The contribution of a particular gas to acidification was evaluated by calculating Acidification Potential, AP (kg SO2-eq), obtained by multiplying the emissions of an acidifying gas by SO2-equivalence factors [86]:
A P = 1   · E S O x + 0.7   ·   E N O x
Aerosol Formation Potential, AFP (PM2.5-eq), was obtained by multiplying emission quantities by PM2.5 equivalence factors (PM10: 0.5; SOX: 0.54; NOX: 0.88) [86]:
A F P = 0.5   · E P M 10 + 0.54   ·   E S O x + 0.88   ·   E N O x

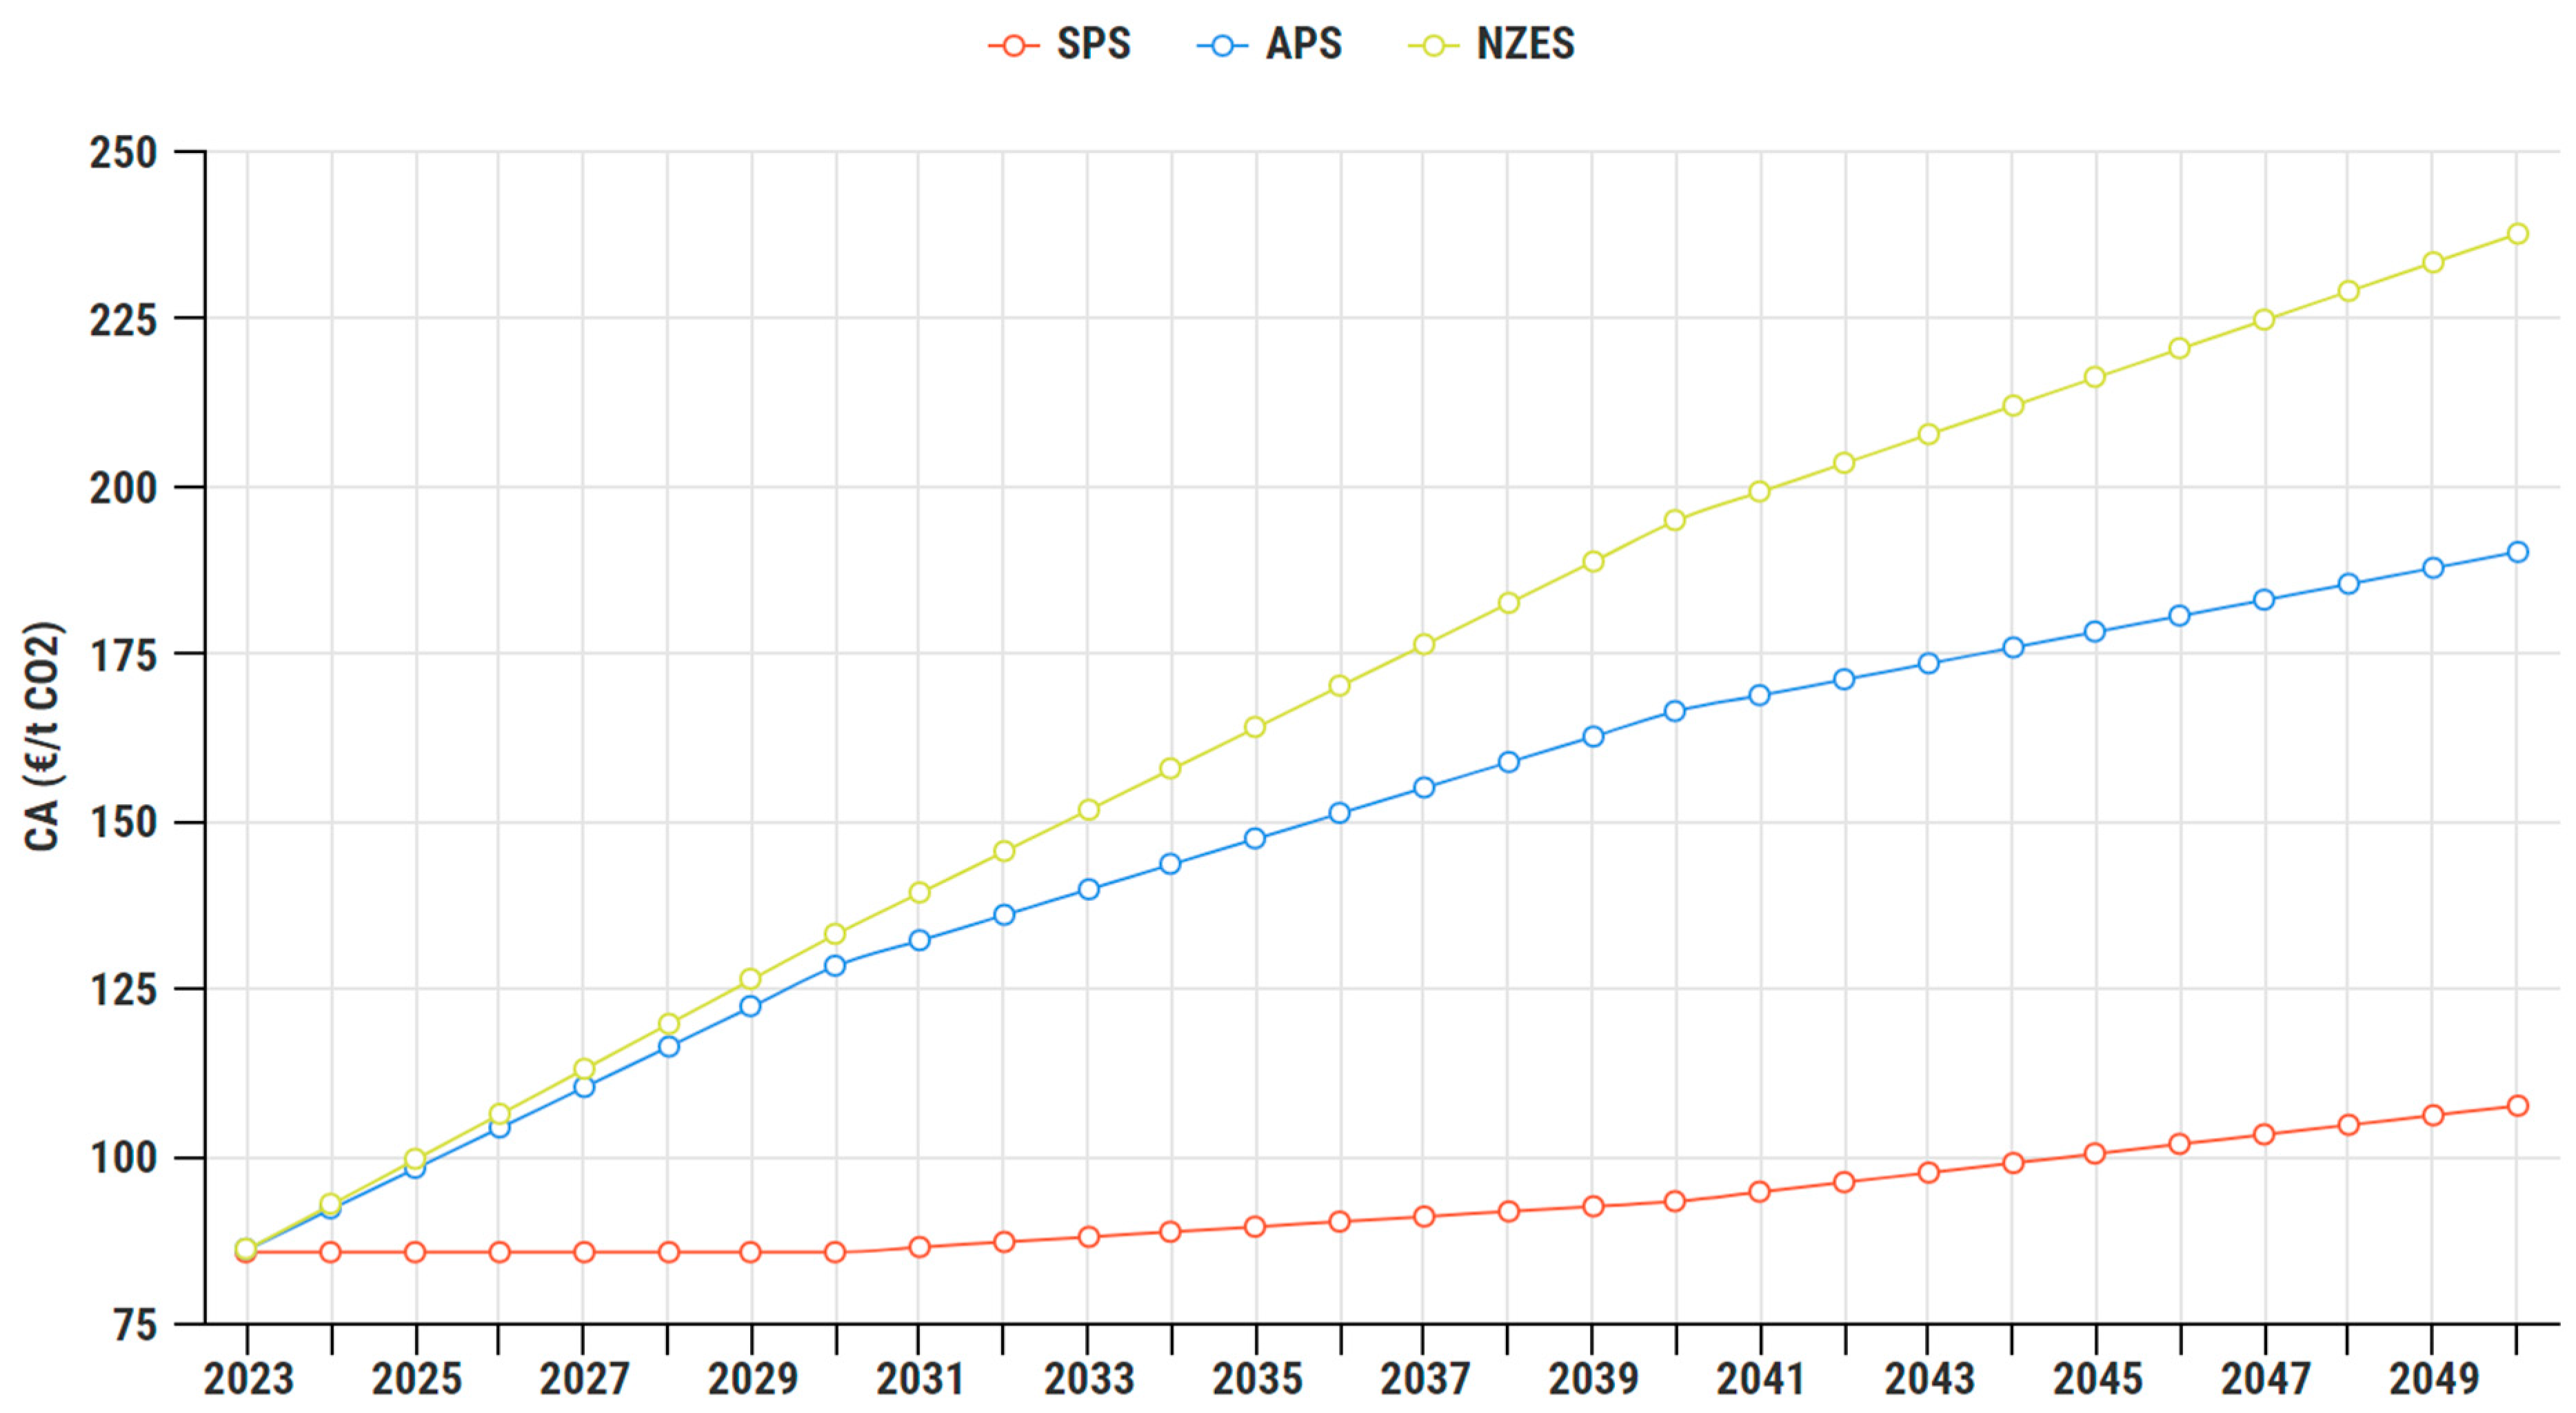
2.2. Life-Cycle Cost Assessment

This economic analysis includes investment, fuel, maintenance costs (costs of maintaining the power system and equipment replacement), and carbon tax for ship power systems that produce tailpipe emissions.
As previously stated, the carbon tax will be implemented in the shipping sector in 2024, and at first, it will be applied to commercial cargo and passenger ships of above 5000 GT, but this work investigates the possibility of its extension to other ship types. The current price of a carbon allowance (September 2023) is around EUR 85/t of CO2, but the International Energy Agency predicts that this value will grow up to EUR 238/t of CO2 by 2050 [87]. According to the World Energy Outlook [88], there are three Carbon Allowance (CA (EUR/t CO2)) scenarios for 2030, 2040, and 2050., i.e., the State Policies Scenario (SPS), Announced Pledges Scenario (APS), and Net Zero Emissions by 2050 Scenario (NZES), where:
  • SPS: current policies and today’s policy intentions and targets for the EU;
  • APS: advanced economies with net zero emissions pledges (including all OECD countries except Mexico);
  • NZES: advanced economies with net zero emissions pledges (including all regions).
These scenarios are presented in Figure 3, where values for other years are obtained by interpolation.
The cost of CO2 emissions only applies to ship power systems that result in tailpipe emissions (biofuels are exempted from the tax). Their annual CO2 emissions from the TTW phase are then multiplied by the CA of a particular year to obtain the carbon tax for that same year.

3. Case Study: Purse Seiner in the Adriatic Sea

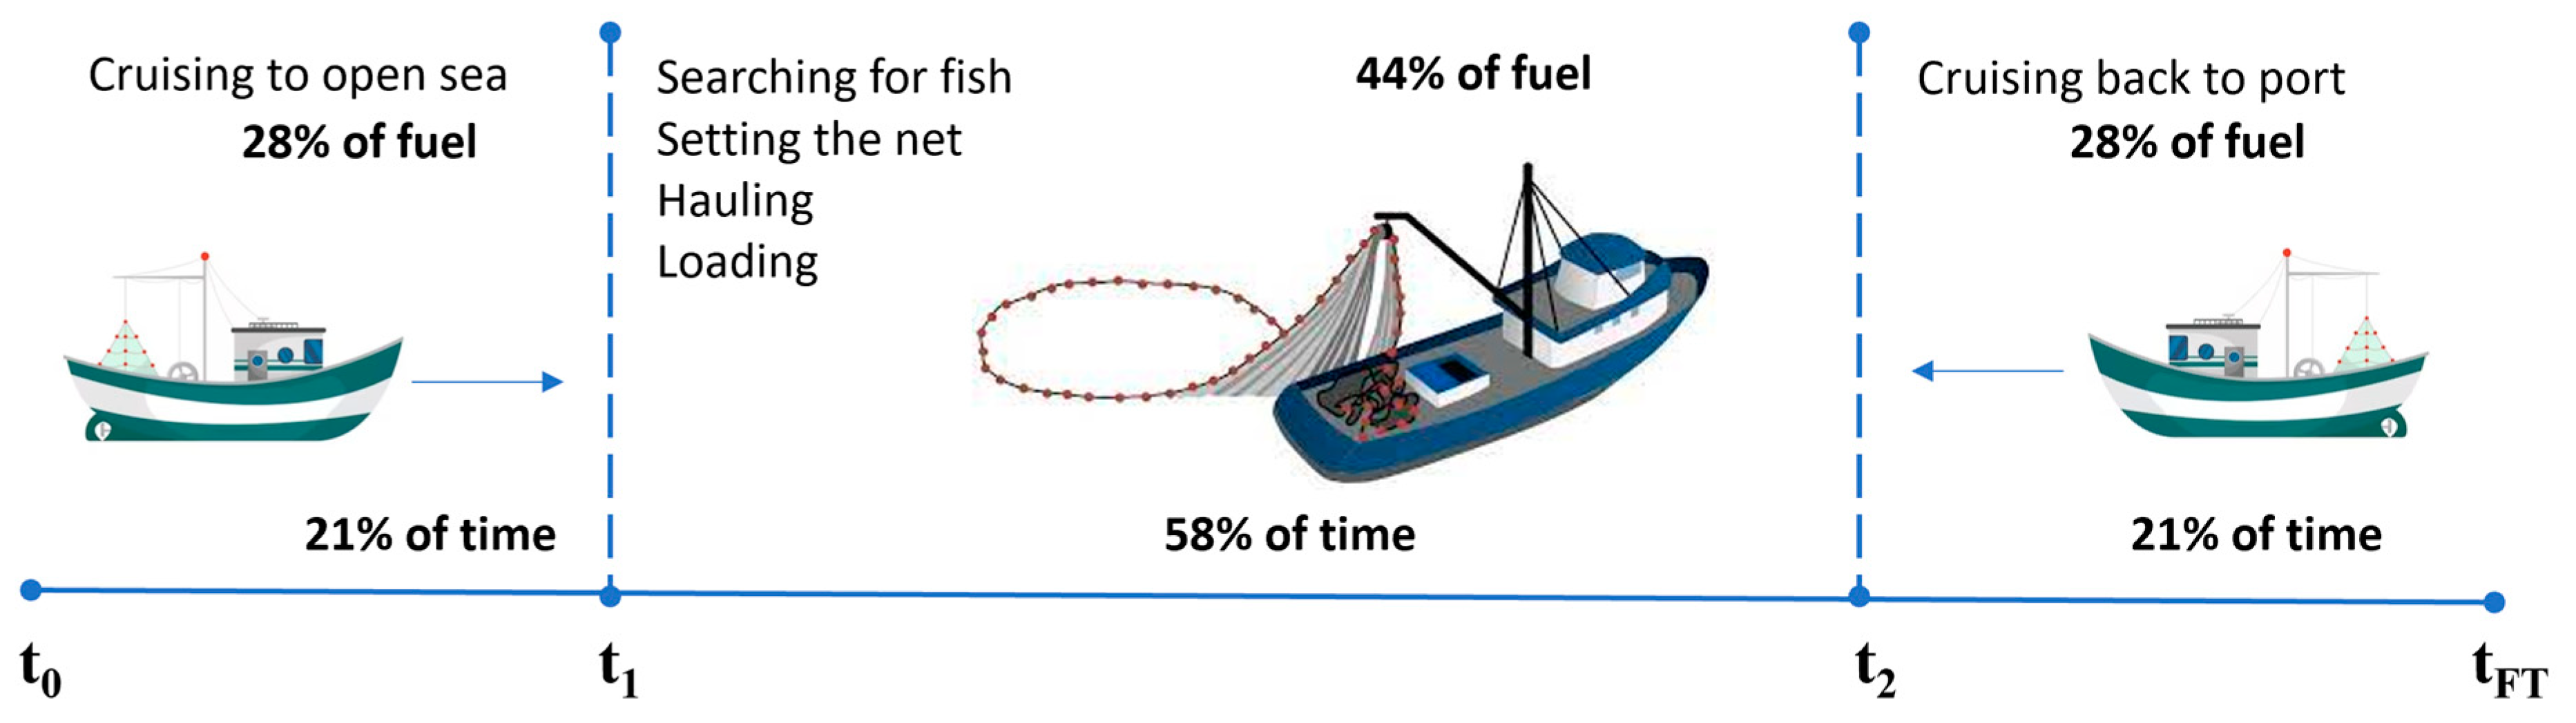
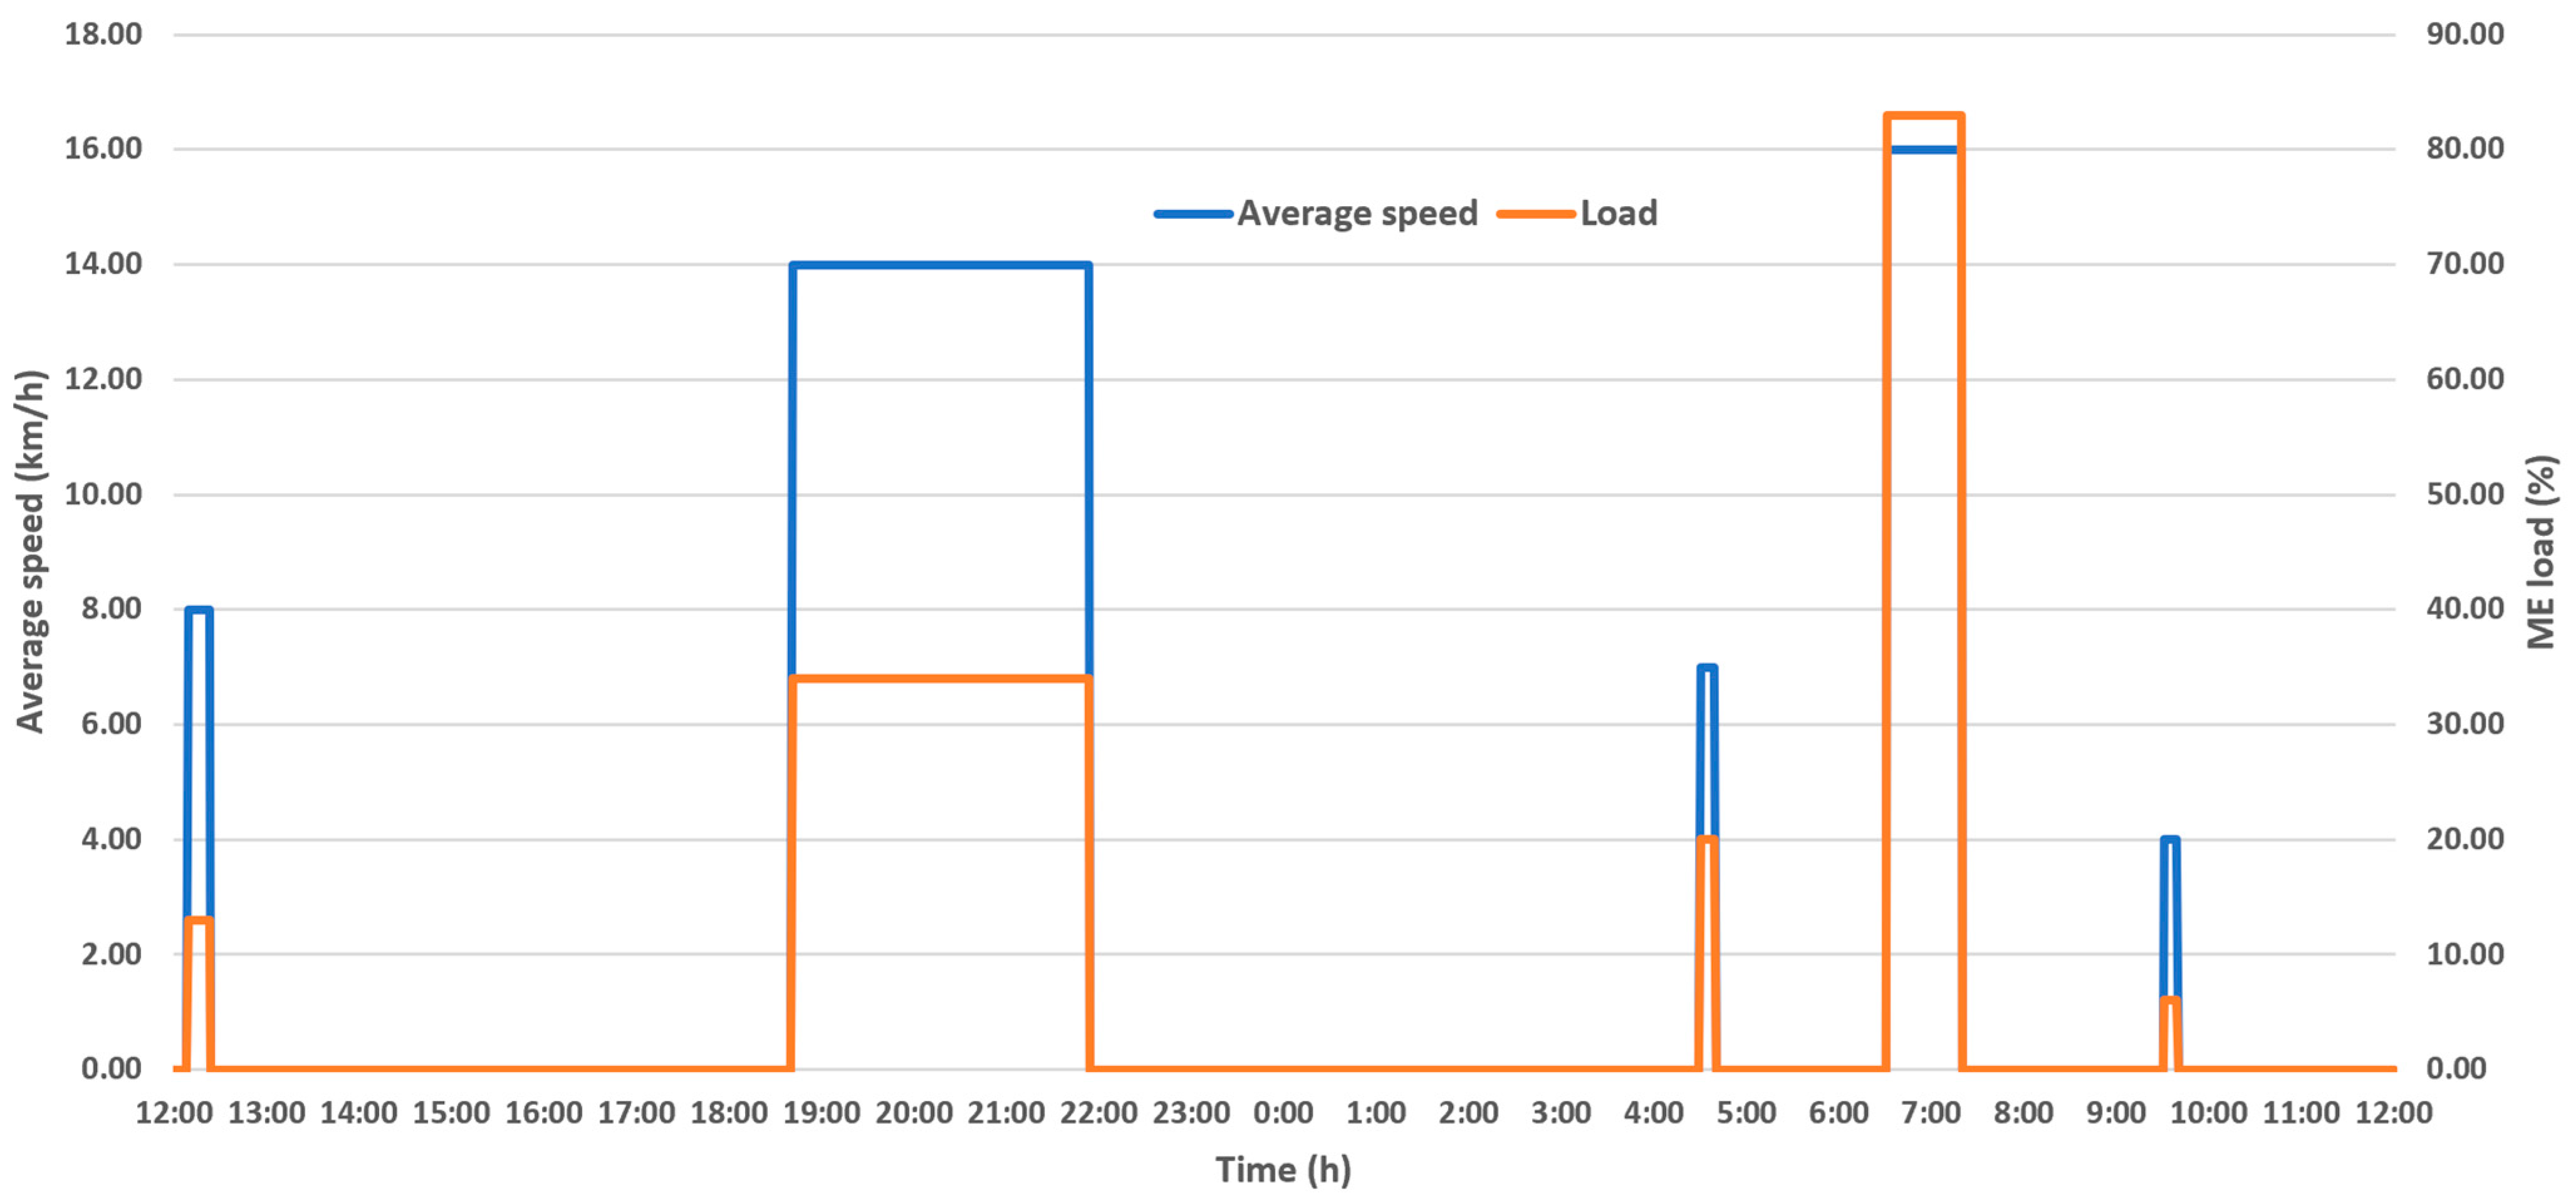
3.1. Ship Particulars and Operative Profile

The Croatian fishing fleet consists of 7808 fishing vessels, whose fishing activities result in nearly 6% of the total catch in the Mediterranean area. Vessels of less than 6 m in length constitute 56.4% of the fleet, while 36.4% of the fleet are vessels between 5 and 12 m long. However, purse seiners 24 to 40 m in length are responsible for 55% of the landing value and 90% of the lending weight [89,90].
The main particulars of the considered purse seiner are presented in Table 4.
Fuel consumption during fishing trips highly depends on the operating profile, which for a purse seiner involves several steps, as presented in Figure 4.
Data on operating times are crucial for investigating the energy consumption of purse seiners. Their working time varies daily and depends on weather conditions and fish season (and on whether catch limitations are in force) [91]. A typical purse seiner follows the timetable detailed in Figure 4: starting the fish trip at time t0, cruising to the open sea till time t1; then, the fishing operation, i.e., harvesting the fish, occurs till time t2, when the purse seiner starts to return to the port.
A number of Croatian fishing vessels were equipped with a fuel monitoring system, GPS, and accessory switches by the authors, providing information about their use of particular engines (main and auxiliary engines). The monitoring system was connected to the software “MAPON”, which collects real-time data on the fishing trip (route, time, location, etc.) [92] (Figure 5).
Using data from MAPON, the load profile of a purse seiner on a random fishing trip is presented in Figure 5. It describes how much time the ship spends at which engine speeds and loads, and it relates only to the main engines. Bearing in mind that fishing vessels do not operate on fixed routes and their fishing trips vary, an average ME load of 56% is used within this paper.
Koričan et al. [93] investigated the operating profiles of several Croatian fishing vessels (purse seiners and trawlers) with MAPON and concluded that for purse seiners, the average daily operating time of the main engines (tME) is four hours, while for auxiliary engines (tAE), it is 15 h. Due to limitations of work quotas (20 days per month) and the suspension of fishing due to the restoration of fish stock, they reported the operating time during the year to be around 200 days [89].
The average power of a ship, Pave (kW), that is required for the ship’s operation (propulsion, fishing, hotelling, gear, etc.) is calculated with the following equation:
P a v e = P M E , a v e + P A E , a v e   ,
where PME,ave (kW) is obtained by multiplying the power of a main engine by 0.56 (average load of 56%), while PAE,ave (kW) is calculated according to the following equation [93]:
P A E , a v e = 0.388   ·   P M E , a v e   .
Furthermore, the energy consumption of a ship, ECA (kWh), is calculated on an annual basis as follows:
E C A = P M E , a v e   ·   t M E , A + P A E , a v e   ·   t A E , A   ,
where tME,A (h) and tAE,A (h) refer to the annual operating time of the main engine and auxiliary engines, which equal 800 h and 3000 h, respectively. The energy needs and ECA for each considered alternative power system are equal to those for the existing diesel-powered ship.
Currently, fishing vessels in Croatia are completely powered by diesel fuel. The annual fuel consumption of diesel, FCD,A (kg), is calculated with the equation:
F C D , A = E C A   · S F C D ,  
where SFCD (kg/kWh) refers to the specific fuel consumption of diesel of 0.190 kg/kWh, which is calculated for the average load of 56% by following the guidelines within the IMO’s fourth GHG study [94].

3.2. LCA Models for Different Power Systems

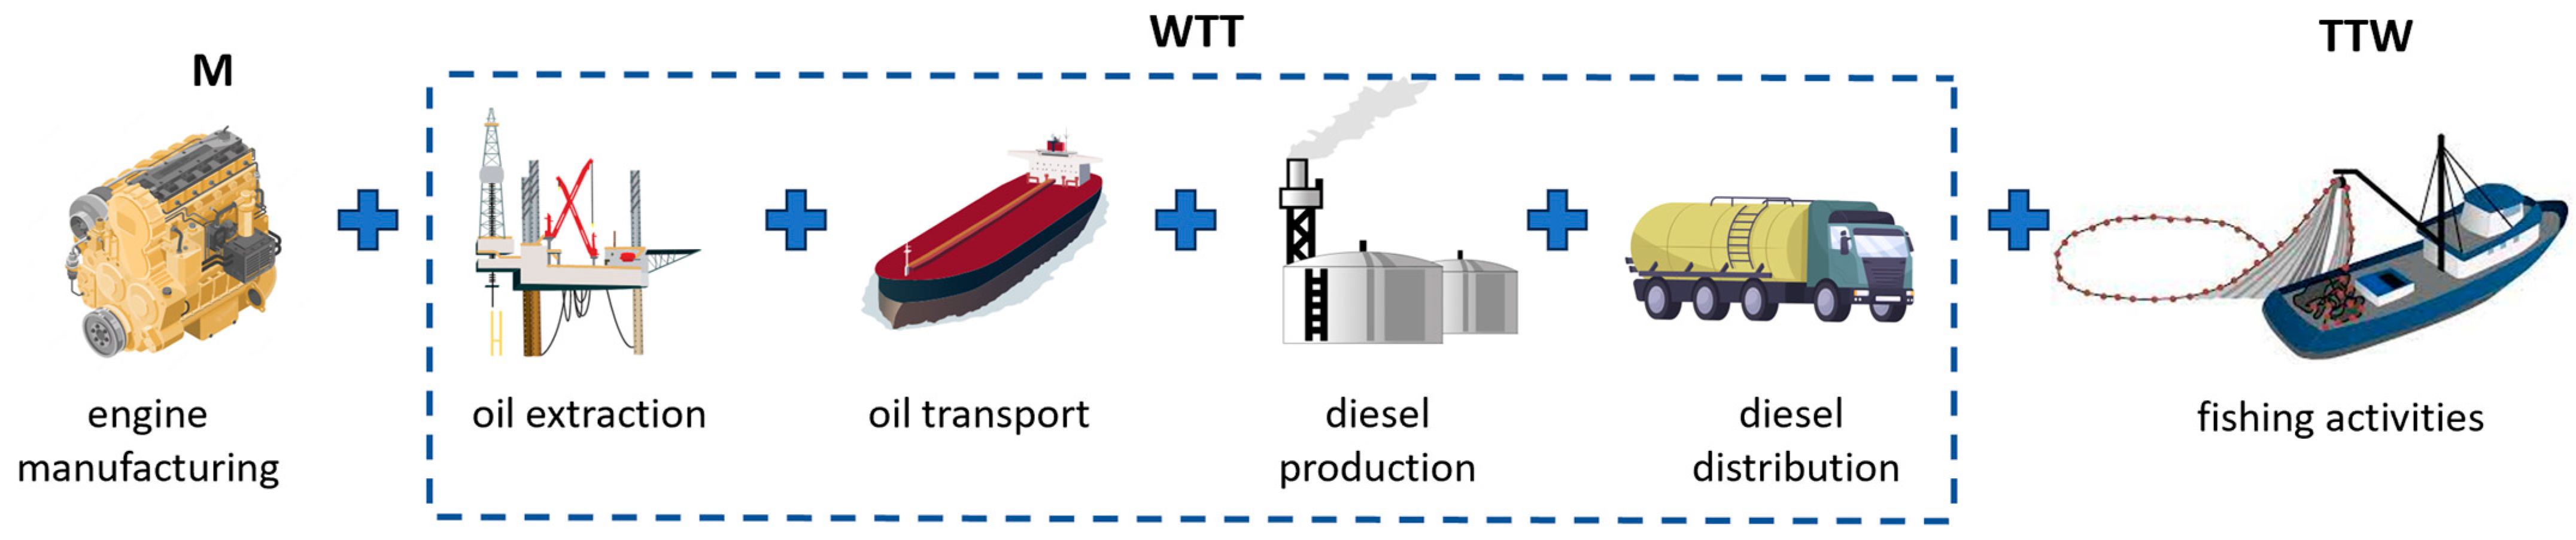
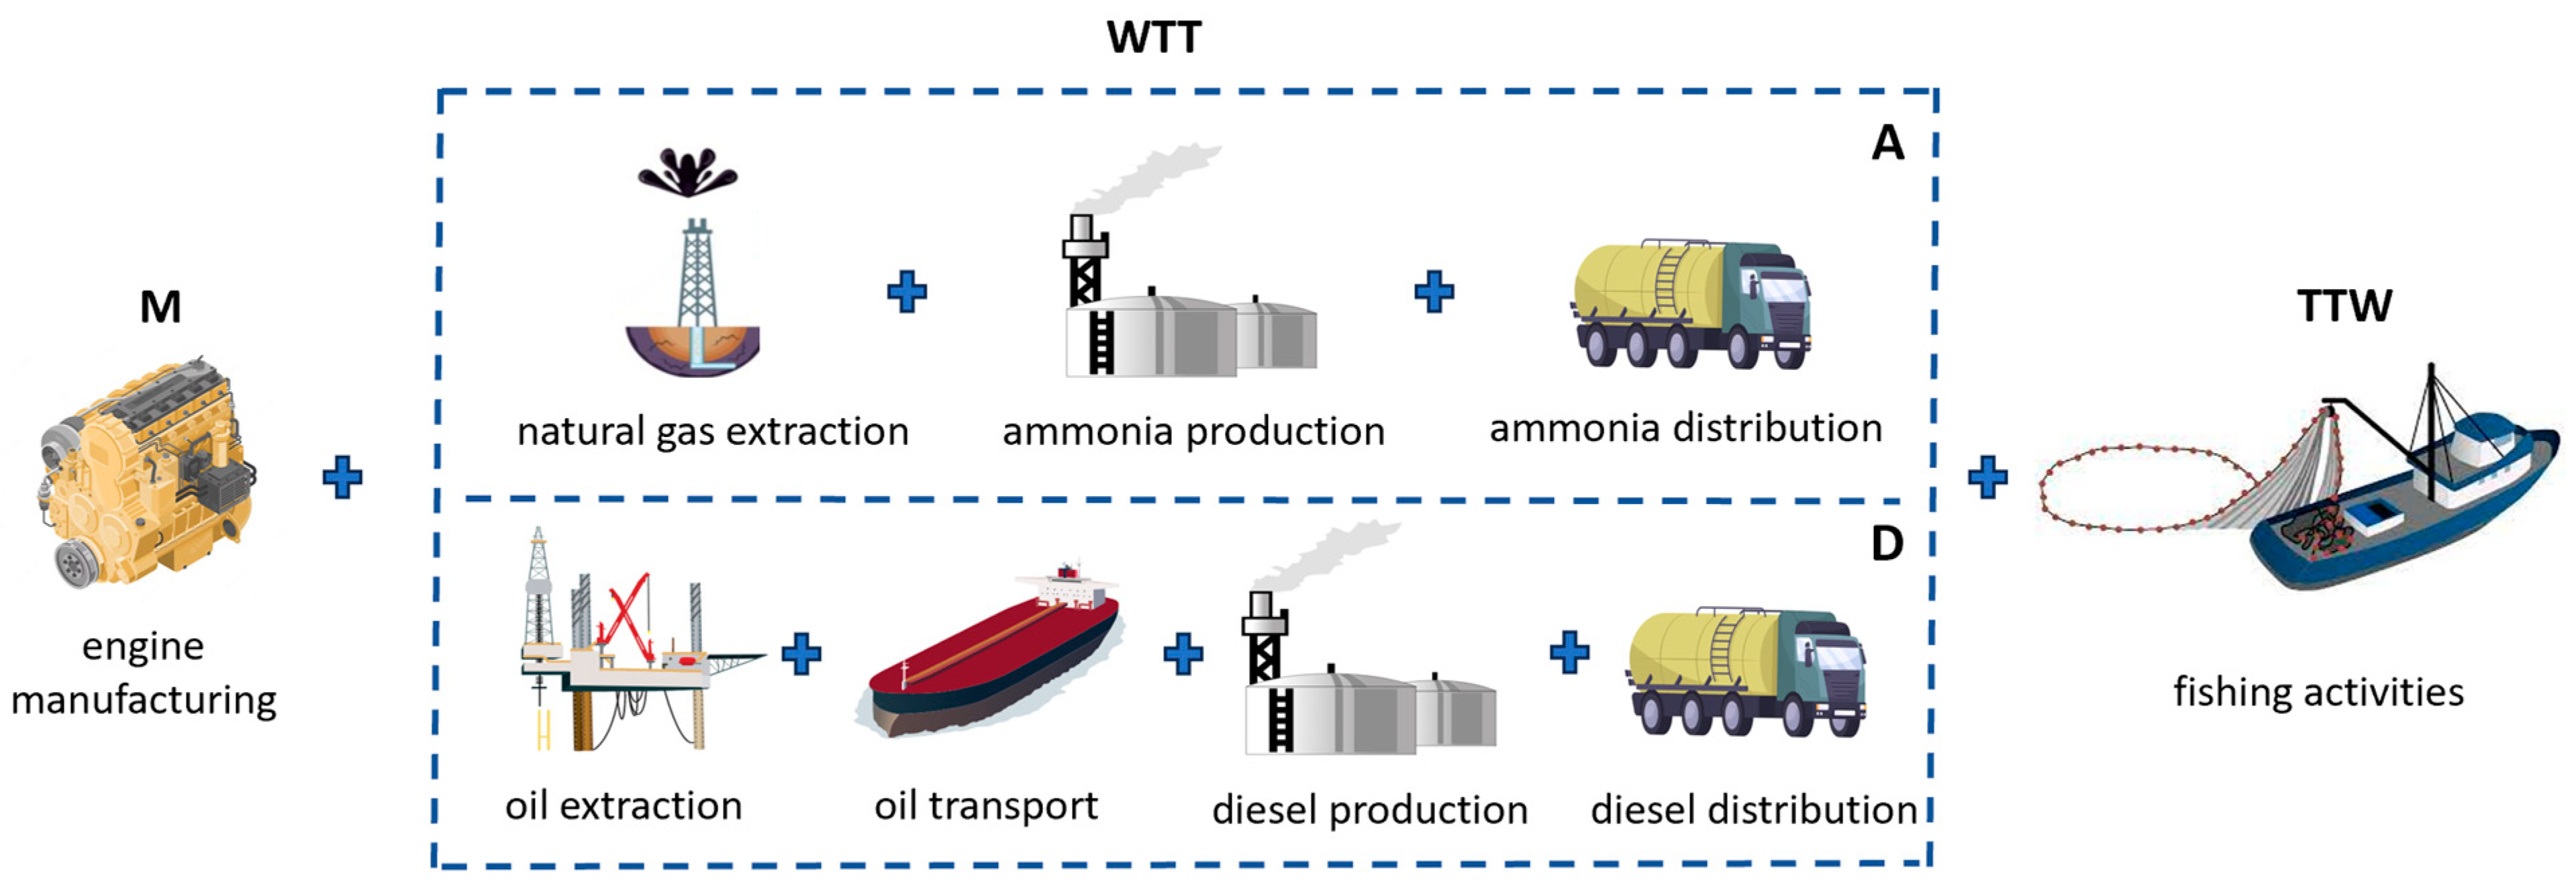
3.2.1. The LCA of a Diesel-Powered Ship

Before analysing the considered alternative power systems, the LCA of the power system currently used in the fishing sector (diesel-powered ship) needs to be performed. It serves as a baseline scenario in the final comparison of the environmental impact of possible fishing fuels. The energy needs of the diesel-powered ship are presented in Section 3.1.
The processes included in the LCA of a diesel-powered ship are shown in Figure 6.
The environmental impact of diesel engines is included within the M phase, which refers to the manufacturing process of the materials that the engine consists of. As presented by Perčić et al. [62], the weight of each material that serves as an input to GREET 2022 is calculated by multiplying the materials’ weight ratios by the weight of the engine m (t), calculated by the following equation [62]:
m = 2 · P a v e 450 .
The WTT phase of diesel includes crude oil extraction in the Middle East and its transportation to Croatia via tanker for 4000 km. Once the oil is imported at the Croatian terminal, it is brought to the refinery in Rijeka through the oil pipeline. At the refinery, the oil is refined. The produced diesel is then distributed to the pump in the port by tank truck for 100 km.
The TTW phase refers to the combustion of diesel in the marine engine. Depending on their emission factor (Table 3), these emissions are calculated with Equation (1).

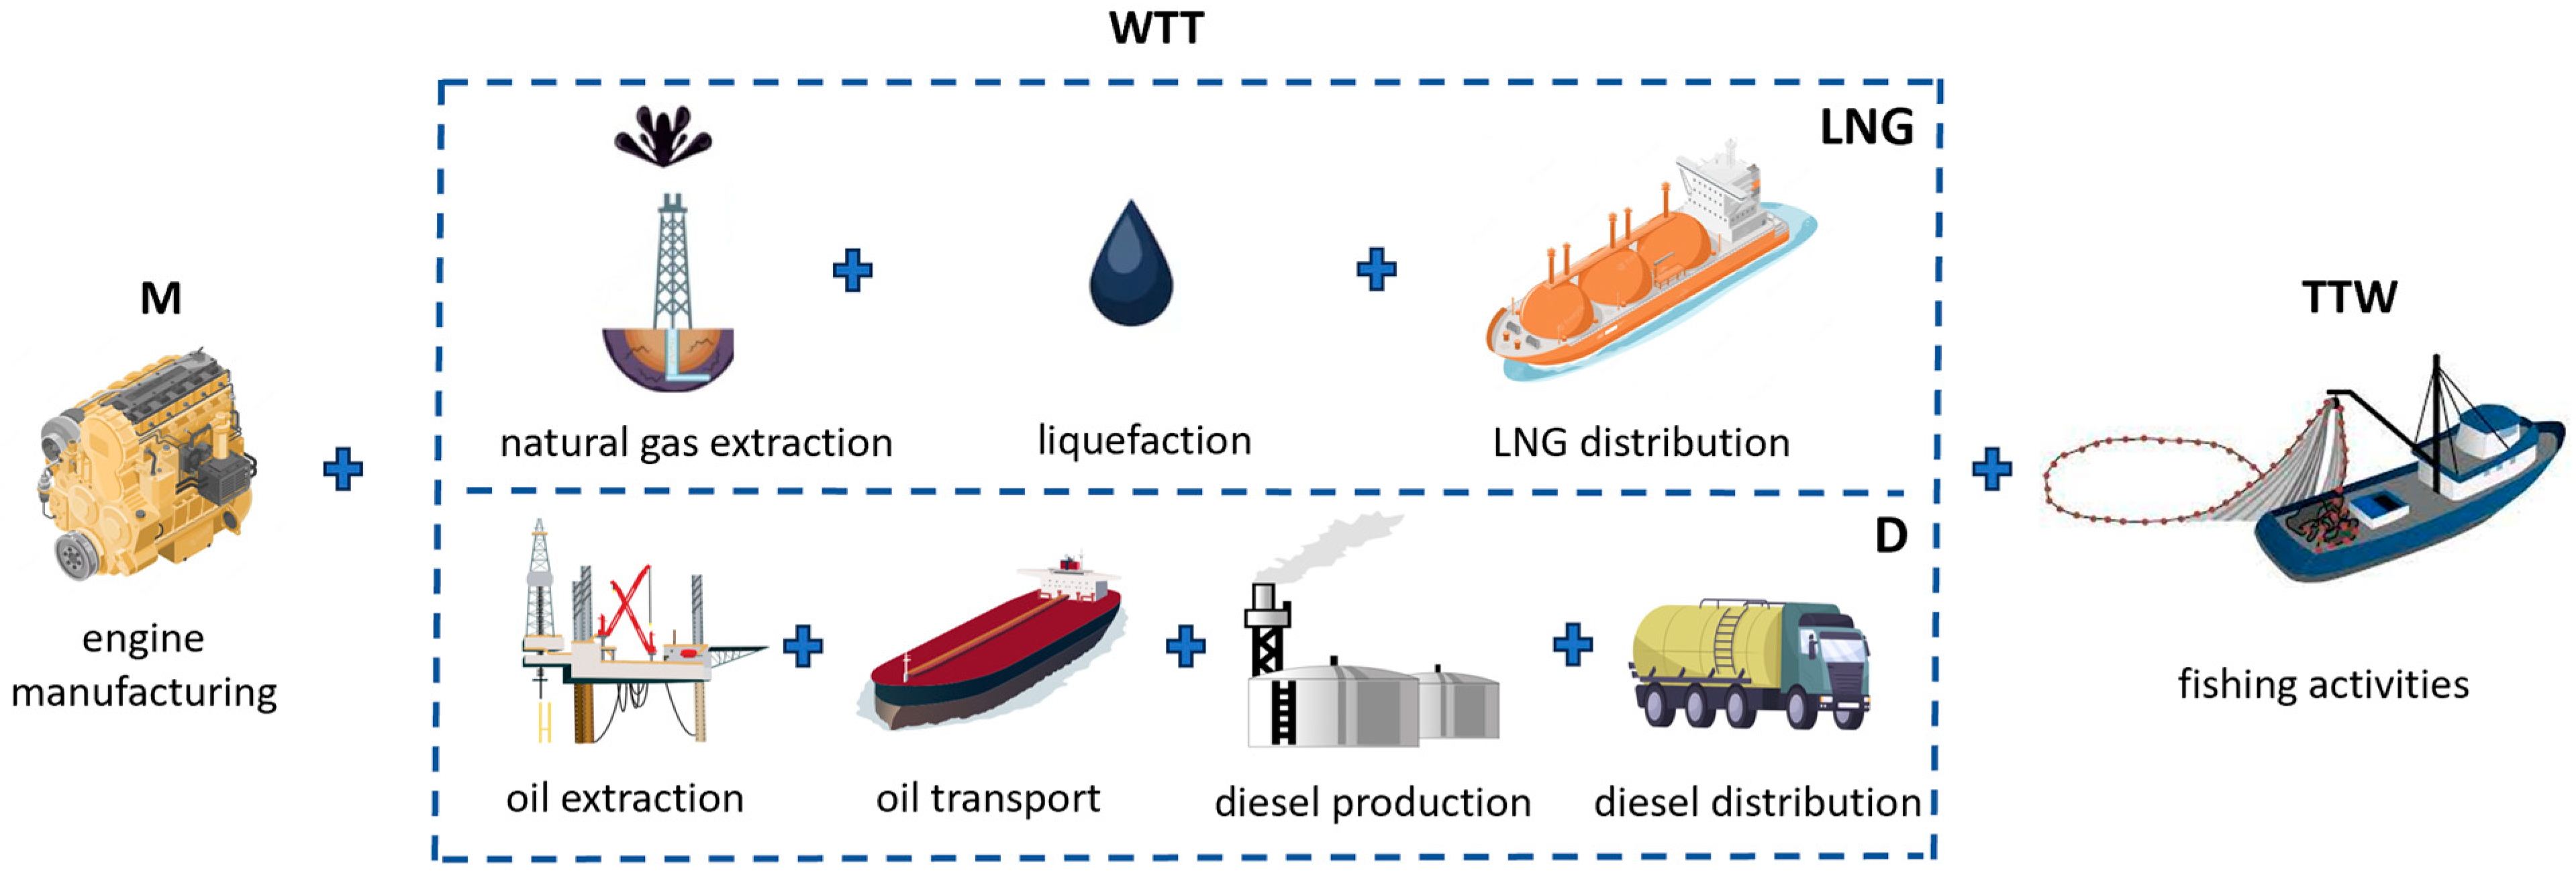
3.2.2. The LCA of an LNG-Powered Ship

The uptake of LNG as an alternative fuel onboard fishing vessels is increasing [37]. LNG-powered ships are powered by dual-fuel engines in which LNG and diesel are used, e.g., modern dual-fuel by Wärtsilä [16]. It is assumed that the purse seiner considered operates only in a dual-fuel mode with 95% LNG (xLNG) and 5% diesel (xP-LNG), used as a pilot fuel to initiate combustion. According to Perčić et al. [62], general equations for the calculation of fuel consumption for a dual-fuel engine are:
F C f = x f   ·   E C   · S F C f ,
F C P f = x p f   ·   E C   ·   S F C p f ,
where x represents the share of fuel in a dual-fuel engine, while the subscripts f and p-f refer to the second and pilot fuels, respectively. Specific fuel consumptions are obtained from [62]. The processes included in the LCA of an LNG-powered ship are presented in Figure 7.
The environmental impact of the engine is the same as that of the diesel engine in Section 3.2.1. The WTT phase includes natural gas extraction in Qatar, where, before transportation to Croatia (for 7000 km), the natural gas is liquefied on site. According to Perčić et al. [62], the general equation for the calculation of TTW emissions released from dual-fuel engines is:
E T T W ,   i = E F f , i   ·   F C f + E F D , i   · F C P f   ,
where EFf and EFD refer to the emission factors of the second fuel and pilot fuel (diesel). The emission factors are presented in Table 3. The methane slip in the TTW phase is calculated by multiplying 5.5 g CH4/kWh [95] by energy consumption and added to CH4 emissions calculated with Equation (13).

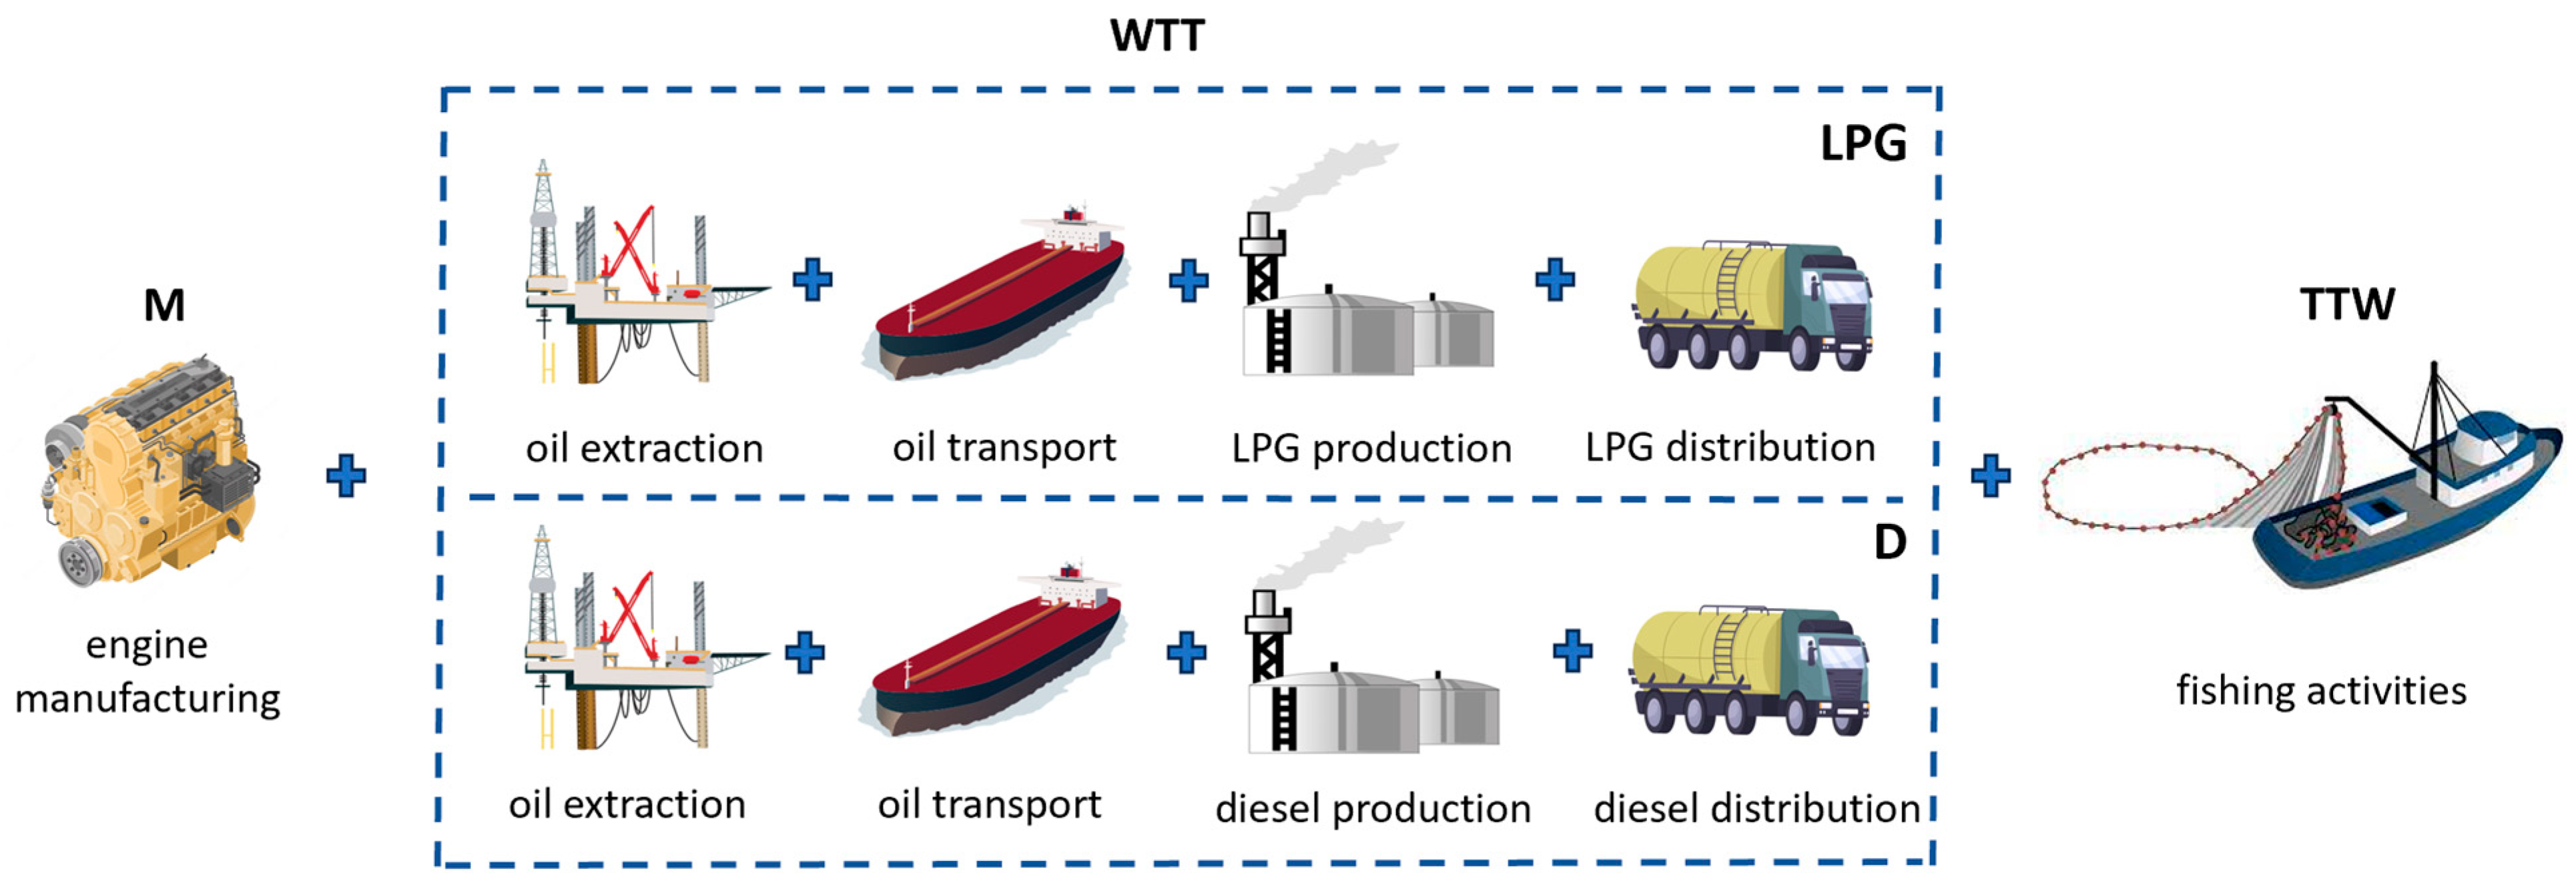
3.2.3. The LCA of an LPG-Powered Ship

In this paper, LPG is used onboard a purse seiner in a dual-fuel engine suitable for LPG. It is assumed that ships operate only in a dual-fuel mode with 95% LPG (xLPG) as the second fuel and 5% diesel (xP-LPG) as the pilot fuel. The fuel consumption of an LPG-powered ship is calculated by Equations (11) and (12). Specific fuel consumptions are obtained from [96]. The processes included in the LCA of an LPG-powered ship are presented in Figure 8.
The environmental impact of the engine is the same as that of the diesel engine in Section 3.2.1, while TTW emissions are calculated based on Equation (13), with emission factors for LPG and diesel presented in Table 3. The WTT phase processes of LPG and diesel as pilot fuels are the same (Section 3.2.1), except the process of fuel production in the Croatian refinery. LPG is assumed to be produced in Europe and then transported to Croatia via tank truck for 2000 km.

3.2.4. The LCA of a Methanol-Powered Ship

Onboard ships, methanol is mainly used as a second fuel in dual-fuel engines. For this assessment, it is assumed that the purse seiner operates only in a dual-fuel mode with 95% methanol and 5% pilot fuel (diesel). Specific fuel consumption is obtained from [97], while the fuel consumption of a methanol-powered ship is calculated with Equations (11) and (12). The processes included in the LCA of a methanol-powered ship are presented in Figure 9.
The environmental impact of the engine is the same as that of the diesel engine in Section 3.2.1, while TTW emissions are calculated based on Equation (13), with emission factors for methanol and diesel presented in Table 3.

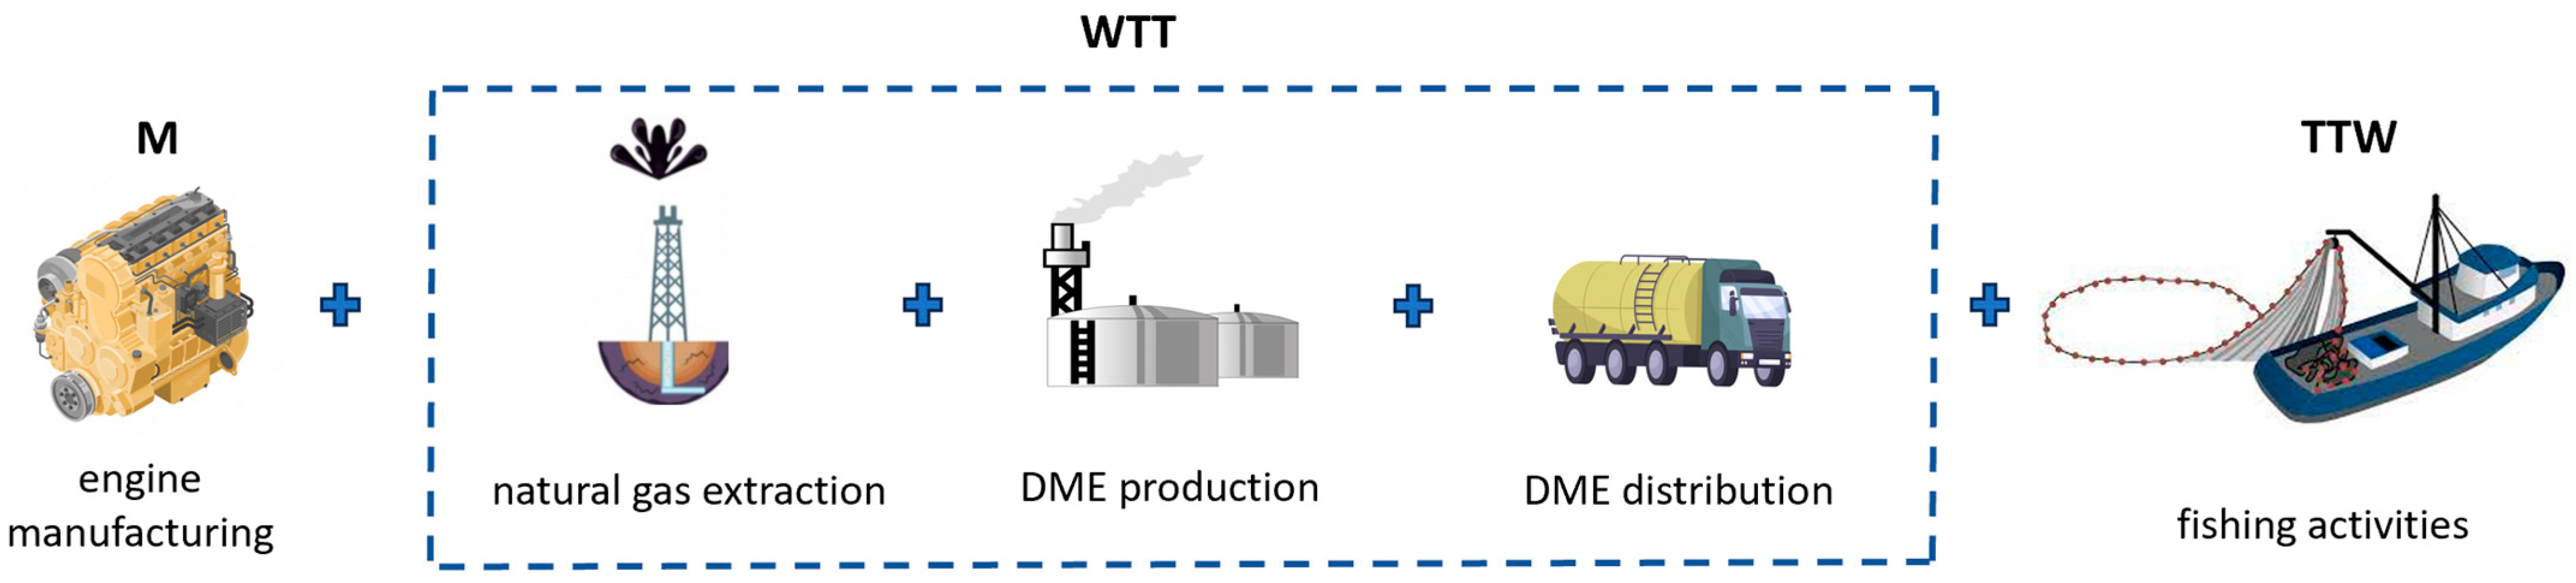
3.2.5. The LCA of a DME-Powered Ship

In contrast to the other low-carbon fuels considered, DME is a compression ignition fuel, and in this paper, it is assumed to be used in a modified ICE. Fuel consumption is calculated with Equation (9) [65]. The processes included in the LCA of a DME-powered ships are presented in Figure 10.
The environmental impact of the engine is the same as that of the diesel engine in Section 3.2.1, while TTW emissions are calculated based on Equation (1), with emission factors for DME presented in Table 3. The WTT phase of DME includes natural gas extraction, the production of DME, and its distribution to the port via tank truck for 1500 km.

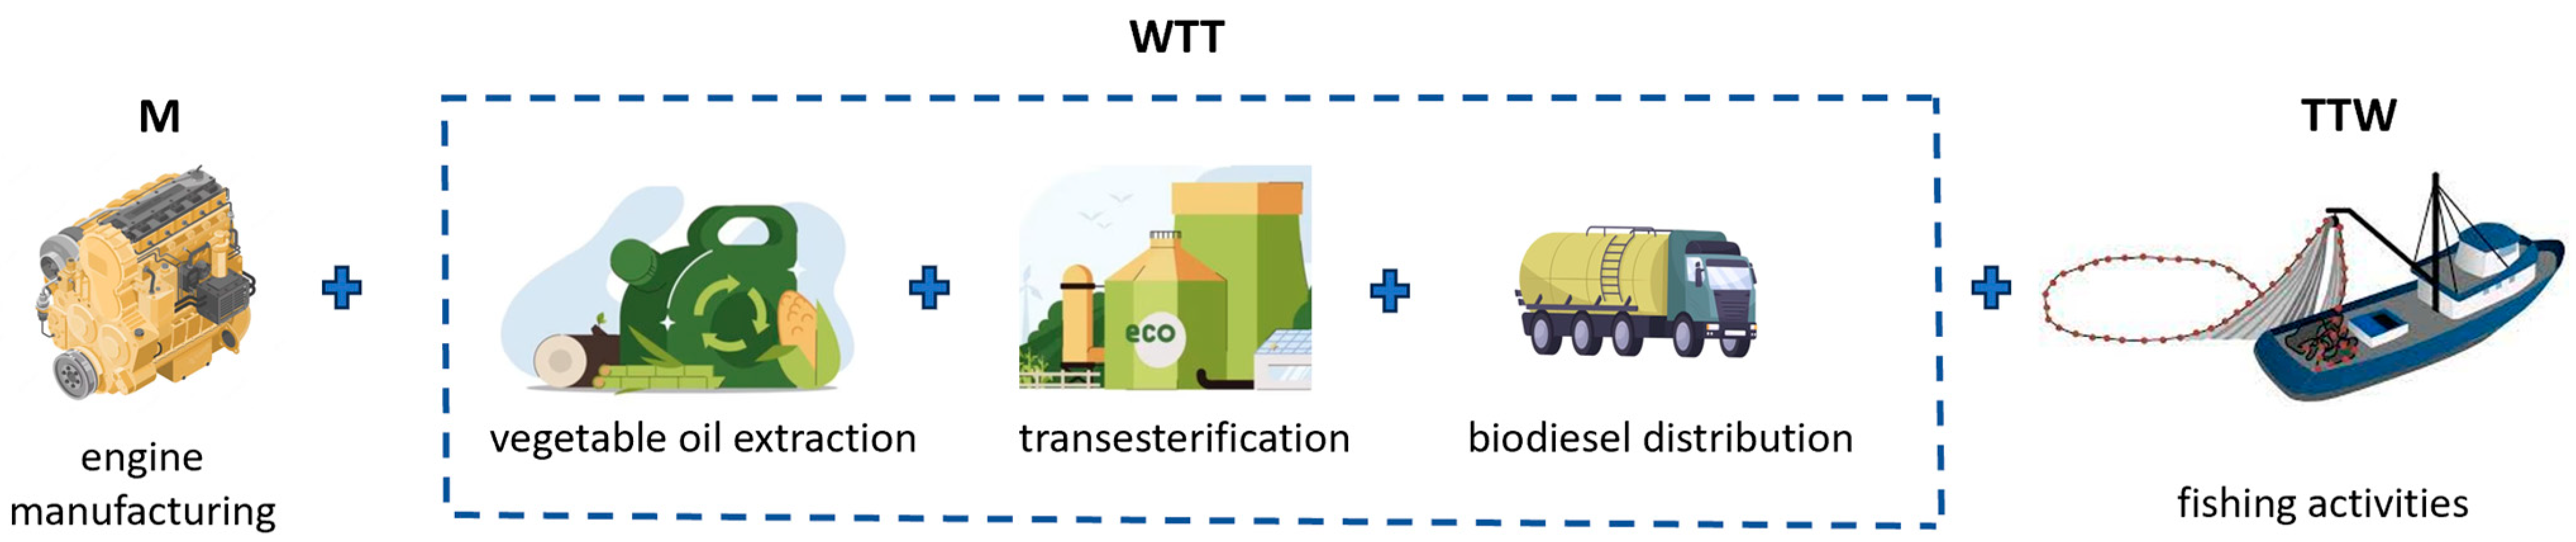
3.2.6. The LCA of a Biodiesel-Powered Ship

Biodiesel is compatible with the existing distribution infrastructure and with diesel engines. Although its use is limited to a blend with diesel, with minor modifications, pure biodiesel can be used [34]. In this paper, pure biodiesel, i.e., B100 (100% biodiesel), and biodiesel–diesel blend B20 (20% biodiesel; 80% diesel) are investigated. It is assumed that the fuel consumption of a diesel-powered ship is the same as the fuel consumption of a biodiesel-powered ship. The processes included in the LCA of a B20-powered ship and the LCA of a B100-powered ship are presented in Figure 11 and Figure 12, respectively.
The environmental impact of the engine is the same as that of the diesel engine in Section 3.2.1, while TTW emissions are calculated based on Equation (1), with emission factors for biodiesel and diesel presented in Table 3. The WTT phase of biodiesel includes soy oil extraction from soybeans, the process of transesterification by which biodiesel is produced, and the transportation of biodiesel to the refuelling station in the port via tank truck for 1000 km.

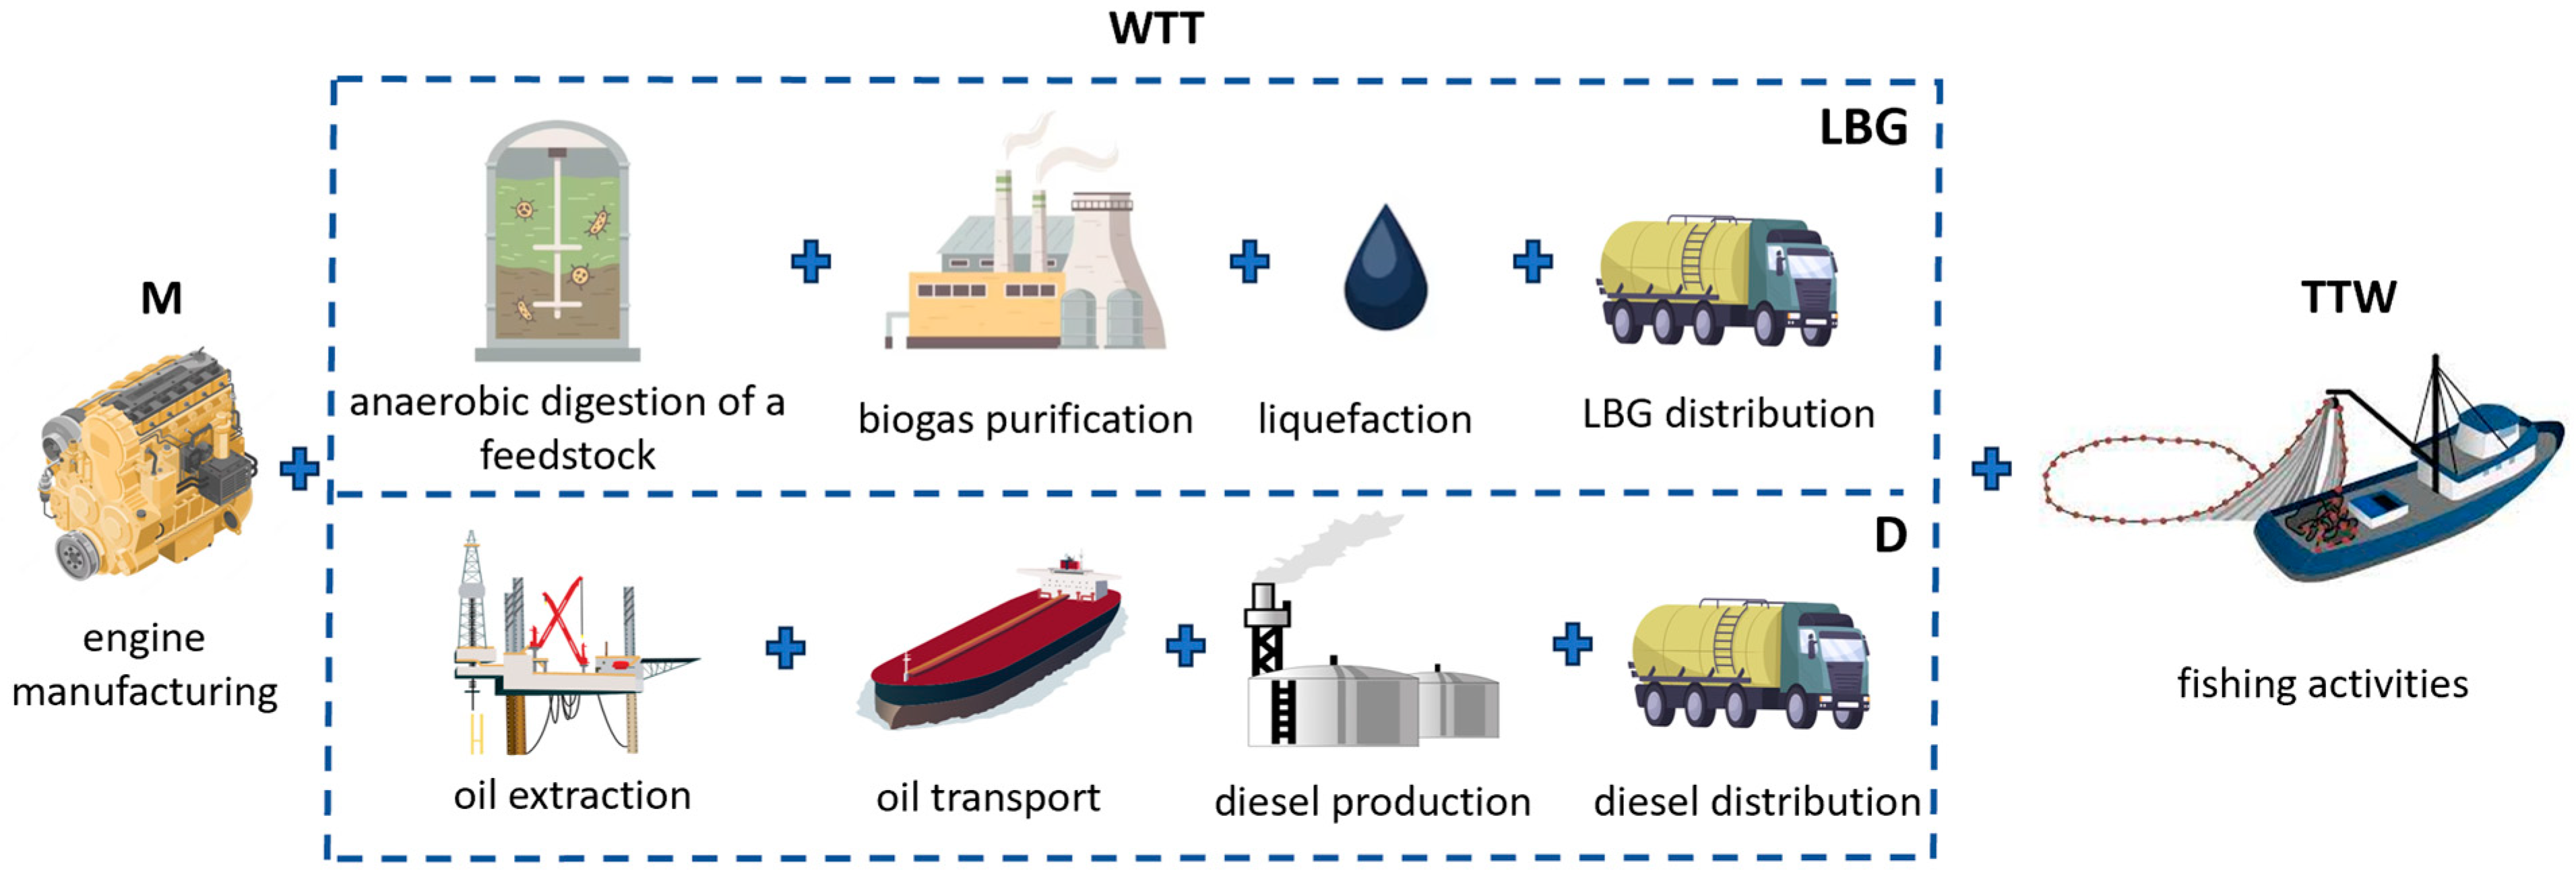
3.2.7. The LCA of an LBG-Powered Ship

LBG, known as bio-LNG or renewable LNG, can be produced from various sources. LBG production from animal waste is considered in this study.
Since LBG and LNG are interchangeable, LBG is used like LNG, in a dual-fuel engine with diesel as the pilot fuel. Specific fuel consumption and equations for the calculation of fuel consumption are presented in Section 3.2.2. The processes included in the LCA of an LBG-powered ship are presented Figure 13.
The environmental impact of the engine is the same as that of the diesel engine in Section 3.2.1, while TTW emissions are calculated based on Equation (13), with emission factors for LBG and diesel presented in Table 3. The methane slip in the TTW phase is considered in the same manner as for LNG. The WTT phase of LBG includes the anaerobic digestion of a feedstock (animal waste), the process of biogas upgrading (biogas purification process, during which methane is separated from CO2 and other gases to form biogas), liquefaction of biogas, and its transportation to storage in the port via tank truck for 2000 km.

3.2.8. The LCA of a Hydrogen-Powered Ship

In this paper, grey hydrogen (produced by natural gas) and green hydrogen (produced from Renewable Energy Sources (RESs)) are investigated to gain an insight into their feasibility, environmental friendliness, and economic performance as marine fuels.
Hydrogen represents an ideal fuel for fuel cells. In this paper, a high-temperature Solid Oxide Fuel Cell (SOFC) is selected for further assessment. The annual fuel consumption of hydrogen in a SOFC, i.e., FCSOFC-H (kg), is calculated with the following equation [86]:
F C S O F C H = E C S O F C η S O F C   ·   L H V H   ,
where ηSOFC refers to SOFC efficiency (60%), LHVH represents lower heating value of hydrogen (kWh/kg), Table 1, while ECSOFC (kWh) refers to the annual energy consumption of an SOFC-powered ship.
Selected SOFCs provide fuel flexibility and higher energy efficiency than low-temperature fuel cells, such as a Proton Exchange Membrane Fuel Cell (PEMFC), but they require higher temperatures for operation. The time required for the fuel cell system to reach its operating temperature is referred to as the start-up time, which for the SOFC equals 30 min [98]. The energy required for heating the fuel cell system, EHFC (kWh), is calculated with the following equation [86]:
E H F C = 0.015 · 6.7   ·   P S O F C .
The processes included in the LCA of a hydrogen-powered ship are presented in Figure 14. During the ship’s operation, there are no tailpipe emissions, i.e., TTW emissions are equal to zero.
The M phase refers to the process of SOFC manufacturing. Its environmental impact is analysed through the weights of the materials used for SOFC manufacturing [26] as inputs for GREET 2022. Its replacement is considered after 20,000 working hours [86]. The WTT phase of hydrogen includes the processes of feedstock processing, hydrogen production and liquefaction, and finally, distribution to the port. Feedstock processing depends on hydrogen origin. Grey hydrogen feedstock processing refers to natural gas extraction, while the feedstock processing of green hydrogen refers to the production of electricity by RESs. It is assumed that each type of hydrogen is produced in Western Europe, liquefied, and transported to Croatia via tank trucks for 1000 km. Besides the WTT phase of hydrogen, the LCA also contains the WTT phase of electricity, since onshore electricity is used for the start-up of the fuel cells, and it includes electricity generation, transmission, and distribution. The sources included in the European electricity mix in the GREET 2022 software are used for electricity generation in Croatia.

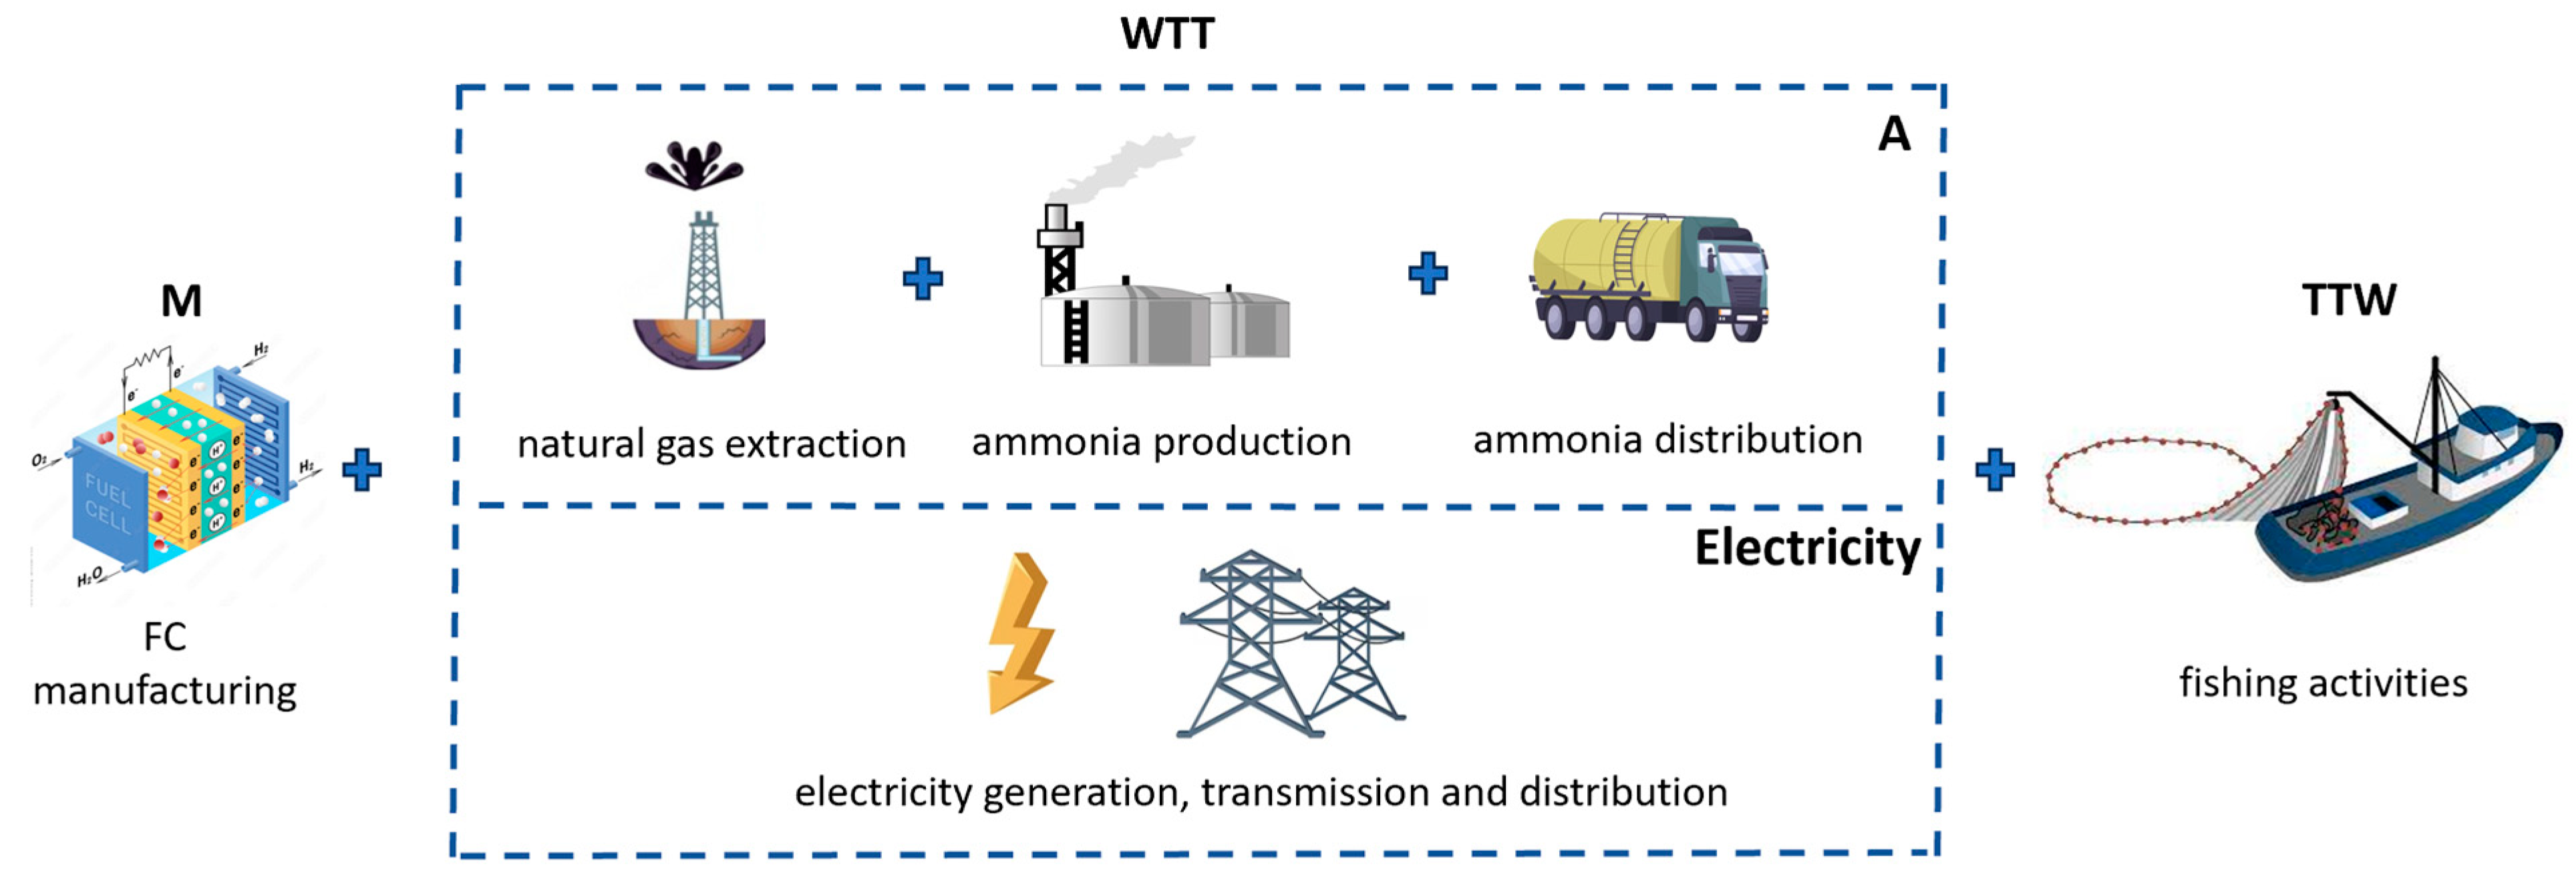
3.2.9. The LCA of an Ammonia-Powered Ship

Ammonia has been widely investigated as a hydrogen carrier. In this paper, its use onboard in a fuel cell and ICE is analysed. As for the fuel cell, the SOFC is considered because it is fuel-flexible and allows for the fast decomposition of ammonia on hydrogen and nitrogen (due to high operating temperatures). If the PEMFC is used instead of the SOFC, the ammonia would need to go through a cracker and a purifier to ensure the provision of pure hydrogen to the fuel cell. That option results in higher costs and fuel consumption [86].
The electricity consumption, average power, and energy consumption of a ship powered by a SOFC correspond to those of the hydrogen-powered ship described in Section 3.2.8. Ammonia consumption is calculated with the following equation:
F C S O F C A = E C S O F C η S O F C A   ·   L H V A   ,
where ηSOFC-A refers to the system efficiency of SOFC fuelled with ammonia (55%) [99] and LHVA represents lower heating value ammonia (kWh/kg) (Table 1) [89].
The processes included in the LCA of an ammonia-powered ship with the fuel cell (A-H) are presented in Figure 15. During fishing activities, there are no tailpipe emissions, i.e., TTW emissions are equal to zero.
The manufacturing of the SOFC and the WTT phase of electricity correspond to the ones from Section 3.2.8. The WTT phase of ammonia includes natural gas extraction, production of ammonia, and its distribution via tank trucks for 1000 km.
Currently, there are no commercially available ammonia ICEs, but MAN promises their availability in 2024 [100]. A dual-fuel marine engine powered by ammonia and diesel has been investigated in many studies. A pilot fuel (MDO or MGO) is used to initiate combustion in a share of 5–10% [101]. In this paper, the pilot use of 5% is assumed, while specific fuel consumptions are obtained from a study by Huang et al. [66], and they equal 358.6 g/kWh for ammonia and 190 g/kWh for the pilot fuel, respectively. Fuel consumptions can be calculated with Equations (11) and (12).
The processes included in the LCA of an ammonia-powered ship (ICE-A) are presented in Figure 16.
The environmental impact of the engine is the same as that of the diesel engine in Section 3.2.1, while TTW emissions are calculated based on Equation (13), with emission factors for diesel presented in Table 3. The WTT phase of ammonia corresponds to the WTT phase of ammonia used in a fuel cell.

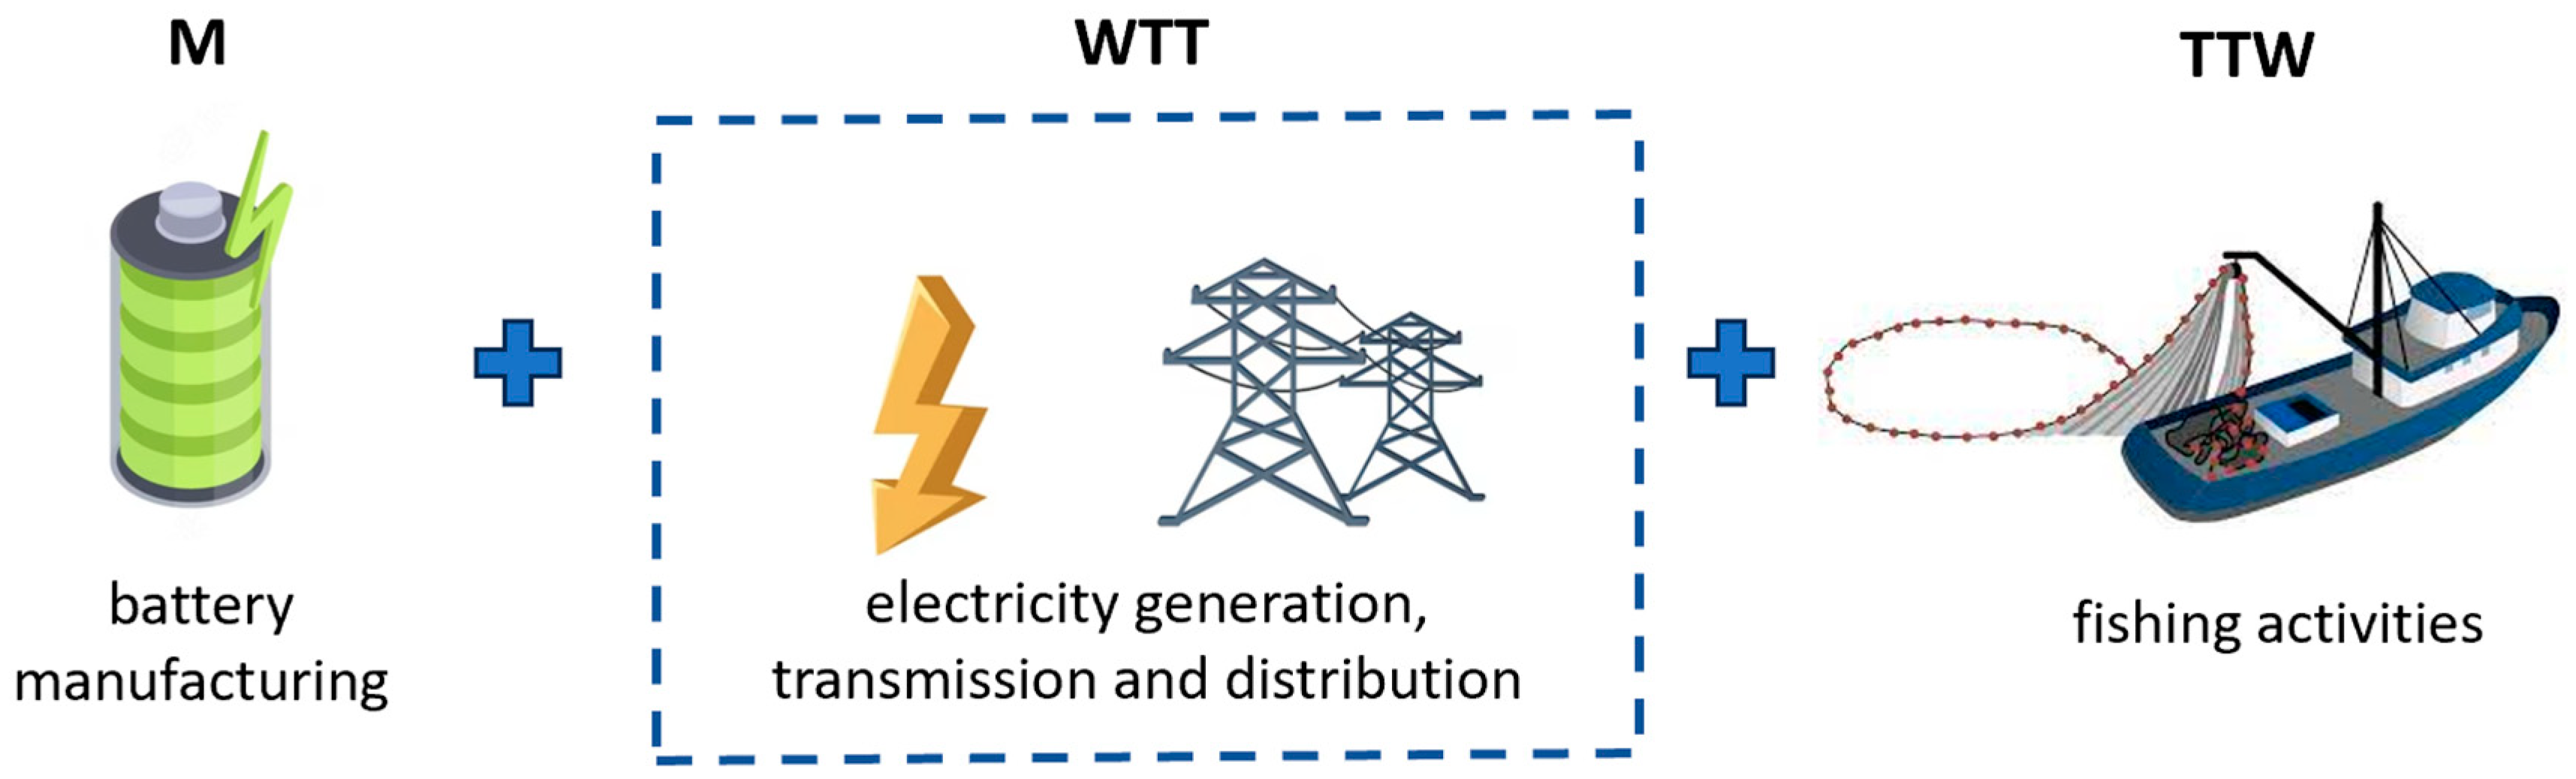
3.2.10. The LCA of an All-Electric Ship

All-electric ships operate solely on battery. There are different types of batteries, but currently, the Li-ion battery stands out with the best performance, low emissions, and high energy density compared to other types [47]. Although fully electrified ships are attractive alternatives due to zero emissions during their operation, their application highly depends on battery capacity and trip range [44].
It is assumed that battery capacity needs to be sufficient to power the ship for the whole fishing trip. Therefore, battery capacity BC (kWh) corresponds to daily energy consumption, and it is calculated by the following equation:
B C = 1.5   ·   P M E , a v e   ·   t M E + P A E , a v e   ·   t A E .
Battery capacity is increased by 50% due to safety, battery degradation, and maintaining state of charge.
The processes included in the LCA of an all-electric ship are battery manufacturing and the WTT phase of electricity (Figure 17), while TTW emissions are equal to zero.
The M phase refers to the manufacturing of the Li-ion battery. By dividing the required BC and battery energy density, which for Li-ion battery with nickel manganese cobalt oxide chemistry is 0.22 kWh/kg [102], battery weight is calculated. The battery needs to be replaced after 9000 cycles of charging and discharging. The WTT phase of electricity refers to its generation, transmission, and distribution. The emissions released during electricity production depend on the electricity mix, i.e., sources of energy used. In this paper, the European electricity mix from the GREET 2022 database is used.

3.3. LCCA Models for Different Power Systems

The main cost of a ship’s power system is fuel cost. Due to fuel price fluctuations, the minimum and maximum prices in the literature are investigated and then used to calculate the average price of a particular fuel (Table 5). Lifetime fuel costs are then calculated by multiplying annual fuel consumption by the fuel price in a particular scenario, LHV, or energy consumption (for electricity) and the lifetime of a ship, i.e., 20 years.

3.3.1. The LCCA of a Diesel-Powered Ship

Investment cost refers to the purchase of a new engine, which is assumed to be EUR 180/kW, while annual maintenance costs are EUR 0.014/kWh [107]. Fuel cost is calculated by multiplying fuel consumption by the fuel price in Table 5, while the carbon tax is calculated as described in Section 2.2.

3.3.2. The LCCA of an LNG-Powered Ship

The investment cost of an LNG-powered ship is EUR 1290/kW, and it refers to the retrofitting of an existing ship with a dual-fuel engine for LNG and pilot fuel (diesel), all additional equipment, and an LNG storage tank [42]. The maintenance cost of the considered power system is equal to EUR 0.015/kWh [107]. Fuel cost is calculated by multiplying fuel consumption by fuel prices from Table 5, while the carbon tax is calculated as described in Section 2.2.

3.3.3. The LCCA of an LPG-Powered Ship

Retrofitting an existing ship with an LPG power system costs around EUR 750/kW and includes a new engine, storage tanks, and other additional equipment [108]. The maintenance cost of an LPG-powered ship is assumed to be the same as for LNG-powered ship. Fuel cost is calculated by multiplying fuel consumptions by fuel prices from Table 5, while the carbon tax is calculated as described in Section 2.2.

3.3.4. The LCCA of a Methanol-Powered Ship

The investment cost for the conversion of a diesel power system to a methanol-powered system is EUR 750/kW, which includes the purchase of a dual-fuel engine and the required equipment [109]. The maintenance cost of a methanol-powered ship is assumed to be the same as that of a diesel-powered ship. Fuel cost is calculated by multiplying fuel consumptions by fuel prices from Table 5, while the carbon tax is calculated as described in Section 2.2.

3.3.5. The LCCA of a DME-Powered Ship

Since DME is dehydrated methanol, its fuel price in EUR/kg is the same as that of methanol, while investment and maintenance costs of a methanol-powered ship are increased by 10% due to differences in storage. Fuel cost is calculated by multiplying fuel consumptions by the fuel price from Table 5, while the carbon tax is calculated as described in Section 2.2.

3.3.6. The LCCA of a Biodiesel-Powered Ship

The investment and maintenance costs of a biodiesel-powered ship correspond to the ones of a diesel-powered ship. Fuel cost is calculated by multiplying fuel consumption by fuel prices from Table 5.

3.3.7. The LCCA of an LBG-Powered Ship

LBG and LNG are interchangeable fuels. Therefore, LBG use as an alternative marine fuel results in investment and maintenance costs equal to the ones of an LNG-powered ship. Fuel cost is calculated by multiplying fuel consumption by fuel prices from Table 5.

3.3.8. The LCCA of a Hydrogen-Powered Ship

The investment costs of a fuel cell system fuelled with hydrogen correspond to the price of a SOFC (EUR 2200/kW). However, this cost is increased by 20% due to additional equipment. Lifetime maintenance refers to 10% of investment costs. During the ship’s lifetime, the fuel cell is replaced twice, while its price declines by 25% [86]. Fuel cost is calculated by multiplying fuel consumption (hydrogen as fuel for the fuel cell and electricity required for heating the fuel cell system) by fuel prices from Table 5.

3.3.9. The LCCA of an Ammonia-Powered Ship

The investment, maintenance, and equipment replacement costs of an ammonia-powered ship with a fuel cell correspond to the costs of a hydrogen-powered ship with a fuel cell as detailed in Section 3.3.8. Fuel cost is calculated by multiplying fuel consumption (ammonia as fuel for the fuel cell and electricity required for heating the fuel cell system) by fuel prices from Table 5.
Besides in a fuel cell, ammonia is investigated as a fuel for ICEs, used in a dual-fuel engine with diesel as the pilot fuel. Investment costs related to the purchase of a new ammonia engine with additional gear and tanks are calculated by multiplying average ship power by a conversion factor of EUR 1330/kW [108]. Annual maintenance cost is equal to 1.5% of the investment cost [101]. Fuel cost is calculated by multiplying fuel consumption by fuel prices from Table 5, while the carbon tax is calculated as described in Section 2.2.

3.3.10. The LCCA of an All-Electric Ship

The battery represents the main element of a fully electrified ship. Its cost is calculated by multiplying the required battery capacity by a battery price of EUR 250/kW [36]. The investment cost of an all-electric ship constitutes 45% of the battery cost, while the remaining 55% is spent on on additional equipment [70]. The battery is replaced once in a ship’s lifetime, and its price declines by 25%. Maintenance represents 5% of the investment cost, while electricity cost is calculated by multiplying energy consumption by electricity prices from Table 5.

3.4. Limitations and Assumptions

The limitations and approximations of this paper are as follows:
  • The system boundary of the assessments is placed on the ship, where only the power system is investigated. The other units of a ship (e.g., hull, additional equipment, crew, port operations, etc.) are not considered. However, this approach sufficiently identifies alternative power systems to reduce emissions at a reasonable cost, compared to the configuration of a conventional diesel power system.
  • Since the considered purse seiner does not operate on a fixed route and its operative profile varies, an average load of 56% is taken for the calculation of energy needs.
  • One of the assumptions in this paper is the simplification of fuel transportation processes. However, stationary processes are a major contributor to emissions from the WTT phase, so this assumption does not have a major impact on total emissions from the WTT phase.
  • Storage tank dimensions for a particular fuel (LNG, LBG, hydrogen, etc.) are not considered, which is a limitation for their use onboard small fishing vessels. Such fuel tanks occupy additional space on ships that can be used for different purposes (e.g., for similar energy content, an LNG tank occupies 3–4 times greater a space than an MGO tank) [110]. Nevertheless, environmental and economic analyses performed within the study successfully identified the most appropriate power system configuration that satisfies both criteria.
  • Biofuels are assumed to be climate-neutral, and their combustion does not result in CO2 emissions.
  • The environmental impact of dual-fuel engines is assumed to be the same as for diesel engines. Since manufacturing emissions from engine manufacturing are rather small compared to batteries and fuel cells and their share in overall life-cycle emissions is small, this approach does not result in a great change in the final results.
  • When the ship is powered by a dual-fuel engine, it is assumed that it is always operating in dual-fuel mode, and the pilot fuel share is 5% for each power system configuration that includes a dual-fuel engine.
  • Despite recent fuel price fluctuations, fuel costs within the LCCA are calculated with average fuel prices obtained from the literature. Sensitivity analysis regarding an increase in fuel price is not considered.
  • Another limitation regarding the LCCA is that the costs are investigated without analysing the net present value. However, the LCCA still identifies the most cost-efficient option.
  • The use of ammonia in ICEs is still in the development phase, and commercial engines should be available in 2024. It can be assumed that the implementation phase of such a power system would yield different emissions and overall costs than what is obtained in this study. The LCA and LCCA of this power system configuration should be repeated when their technology readiness is higher.

4. Results and Discussion

In the below results, D denotes diesel, MeOH is methanol, AES denotes all-electric ship, A-FC and A-ICE refer to the use of ammonia in the fuel cell and ICE, and H-FC denotes the use of hydrogen in the fuel cell, where hydrogen can be grey or green. Other fuel abbreviations are already explained with the first mention in the paper (LNG, LPG, DME, LBG, B100, B20).
The LCA investigated life-cycle emissions related to ship power systems. The impact categories of climate change, human toxicity, and acidification were selected for analysis, and the results are presented in Figure 18, Figure 19 and Figure 20.
According to Figure 18, fossil fuels (diesel and low-carbon fuels) greatly contribute to climate change with a high amount of released GHGs. A major part of these emissions are emissions from TTW (a result of fuel combustion in marine engines). The LCA highlighted green hydrogen, B100, methanol, and electricity as potential alternative fuels whose use instead of diesel would reduce the carbon footprint of the investigated ship. The alternatives that resulted in the highest GHGs are LNG, ammonia (used in fuel cells and ICE) and grey hydrogen (used in a fuel cell).
Regarding acidification (Figure 19), the diesel-powered ship is a major contributor due to the high sulphur content compared to investigated alternatives. Biodiesel–diesel blend (B20) and B100 have similar AP values as the diesel-powered ship, while green hydrogen and LPG have the lowest impact. Similar results are presented in Figure 20, where life-cycle emissions are used to calculate the impact on human toxicity. Diesel, B100, and B20 are the greatest contributors, while green hydrogen and LPG result in the lowest emissions.
To gain an insight into their cost-effectiveness, alternative fuels are investigated through LCCA, in which costs related to ship power systems are summed. Besides investment, fuel, and maintenance costs, the carbon tax is considered, taking the NZES from Figure 3. The LCCA results are compared in Figure 21.
The diesel-powered ship represents a baseline scenario, in which 60% of total costs refers to fuel cost. The most cost-efficient alternatives to replace diesel are DME, methanol, and ammonia used in dual-fuel engines. The most expensive alternatives are powering options that offer zero-emission shipping. High fuel costs and high costs related to the purchase of the main element of the system are the reasons why these alternative solutions are not currently profitable.
The LCA and LCCA comparison highlighted particular fuels as the most appropriate alternatives. They are presented in Table 6, where their reduction/increase in emissions and costs compared to the diesel-powered ship is indicated.
According to the results presented in Table 6, green hydrogen in a fuel cell significantly reduces the environmental impact of the ship, but it increases its lifetime costs by 30%. Moreover, by omitting the carbon tax, the costs increase by 53%. Further development of fuel cell technology would lead to decreasing their costs, which would make fuel-cell-powered purse seiners a feasible powering solution. The LCCA highlighted the use of ammonia in ICE as the most cost-efficient option among those investigated, but the LCA comparison showed that this power system configuration increases the impact on climate change while reducing the impact on acidification and human toxicity.
Although battery power systems onboard Croatian ferries represent the most environmentally and economically appropriate alternative to conventional marine fuel, the full electrification of the Croatian purse seiner would result in higher costs than the existing powering option. The main reason for this is trip duration. Ferries operate frequently, follow schedules on fixed routes, and the onboard battery can be charged with shore power while passengers and vehicles are boarding. However, purse seiners cruise to the open sea and do not cruise back until the fishing trip is over, which can last over 10 h. Due to that, battery capacity needs to be enough to support the purse seiner in each fishing activity. The battery capacity of the considered ship is 4.8 MWh (weighted 22 tons), which results in major investment costs that make up 64% of the total costs. The all-electric ship results in a 40.2% lower carbon footprint than the existing ship. However, high investment and maintenance costs are limitations for the widespread use of fully electrified purse seiners.
The alternative solutions that satisfy both the environmental and economic criteria of the alternative fuel comparison are the LPG-powered ship and methanol-powered ship. Their use onboard reduces the environmental impact of the ship at a reasonable price. However, the use of LPG as marine fuel needs to be further developed and methanol is a more suitable alternative. The technology behind its use onboard is familiar and commercially available, and it has been implemented in many ship types. Although methanol use onboard cannot reach a GHG reduction of 50%, a hybrid power system with methanol in a dual-fuel engine and a battery can achieve the required reduction at reasonable costs.
In order to highlight the uncertainty regarding fuel prices, a sensitivity analysis was conducted, in which fuel prices varied by ±30% with an increment of 10%. The analysis was performed for several fuels and the results are presented in Figure 22.
The results presented in Figure 22 show that fuel price fluctuations can influence the total cost of a ship’s power system. Among the investigated fuels, LBG is sensitive to fuel price fluctuations, since more than 80% of the total costs related to ship power systems is fuel cost (due to great fuel consumption and high fuel price).

5. Conclusions

This paper considered the implementation of different alternative fuels onboard a Croatian purse seiner. The LCA investigated the environmental impact of fuel on three impact categories (climate change, acidification, and human toxicity), while the LCCA included investment, fuel, and maintenance costs, but also the carbon tax, which relates only to ship power systems with tailpipe emissions. The main findings of the research can be summarised as follows:
  • The LCA indicated that the most environmentally friendly option is green hydrogen used in a fuel cell, while the second alternative with the lowest emissions compared to the diesel-powered ship is B100. On the other hand, the power systems with the highest released GHGs are LNG in a dual-fuel engine (due to methane slip), ammonia (in fuel cells and ICE), and the use of grey hydrogen in a fuel cell system.
  • The LCAs that investigated the impact of alternative fuels on acidification and human toxicity indicated that the most environmentally friendly options are LPG and a fully electrified ship, while the greatest contributor is diesel, due to its high sulphur content.
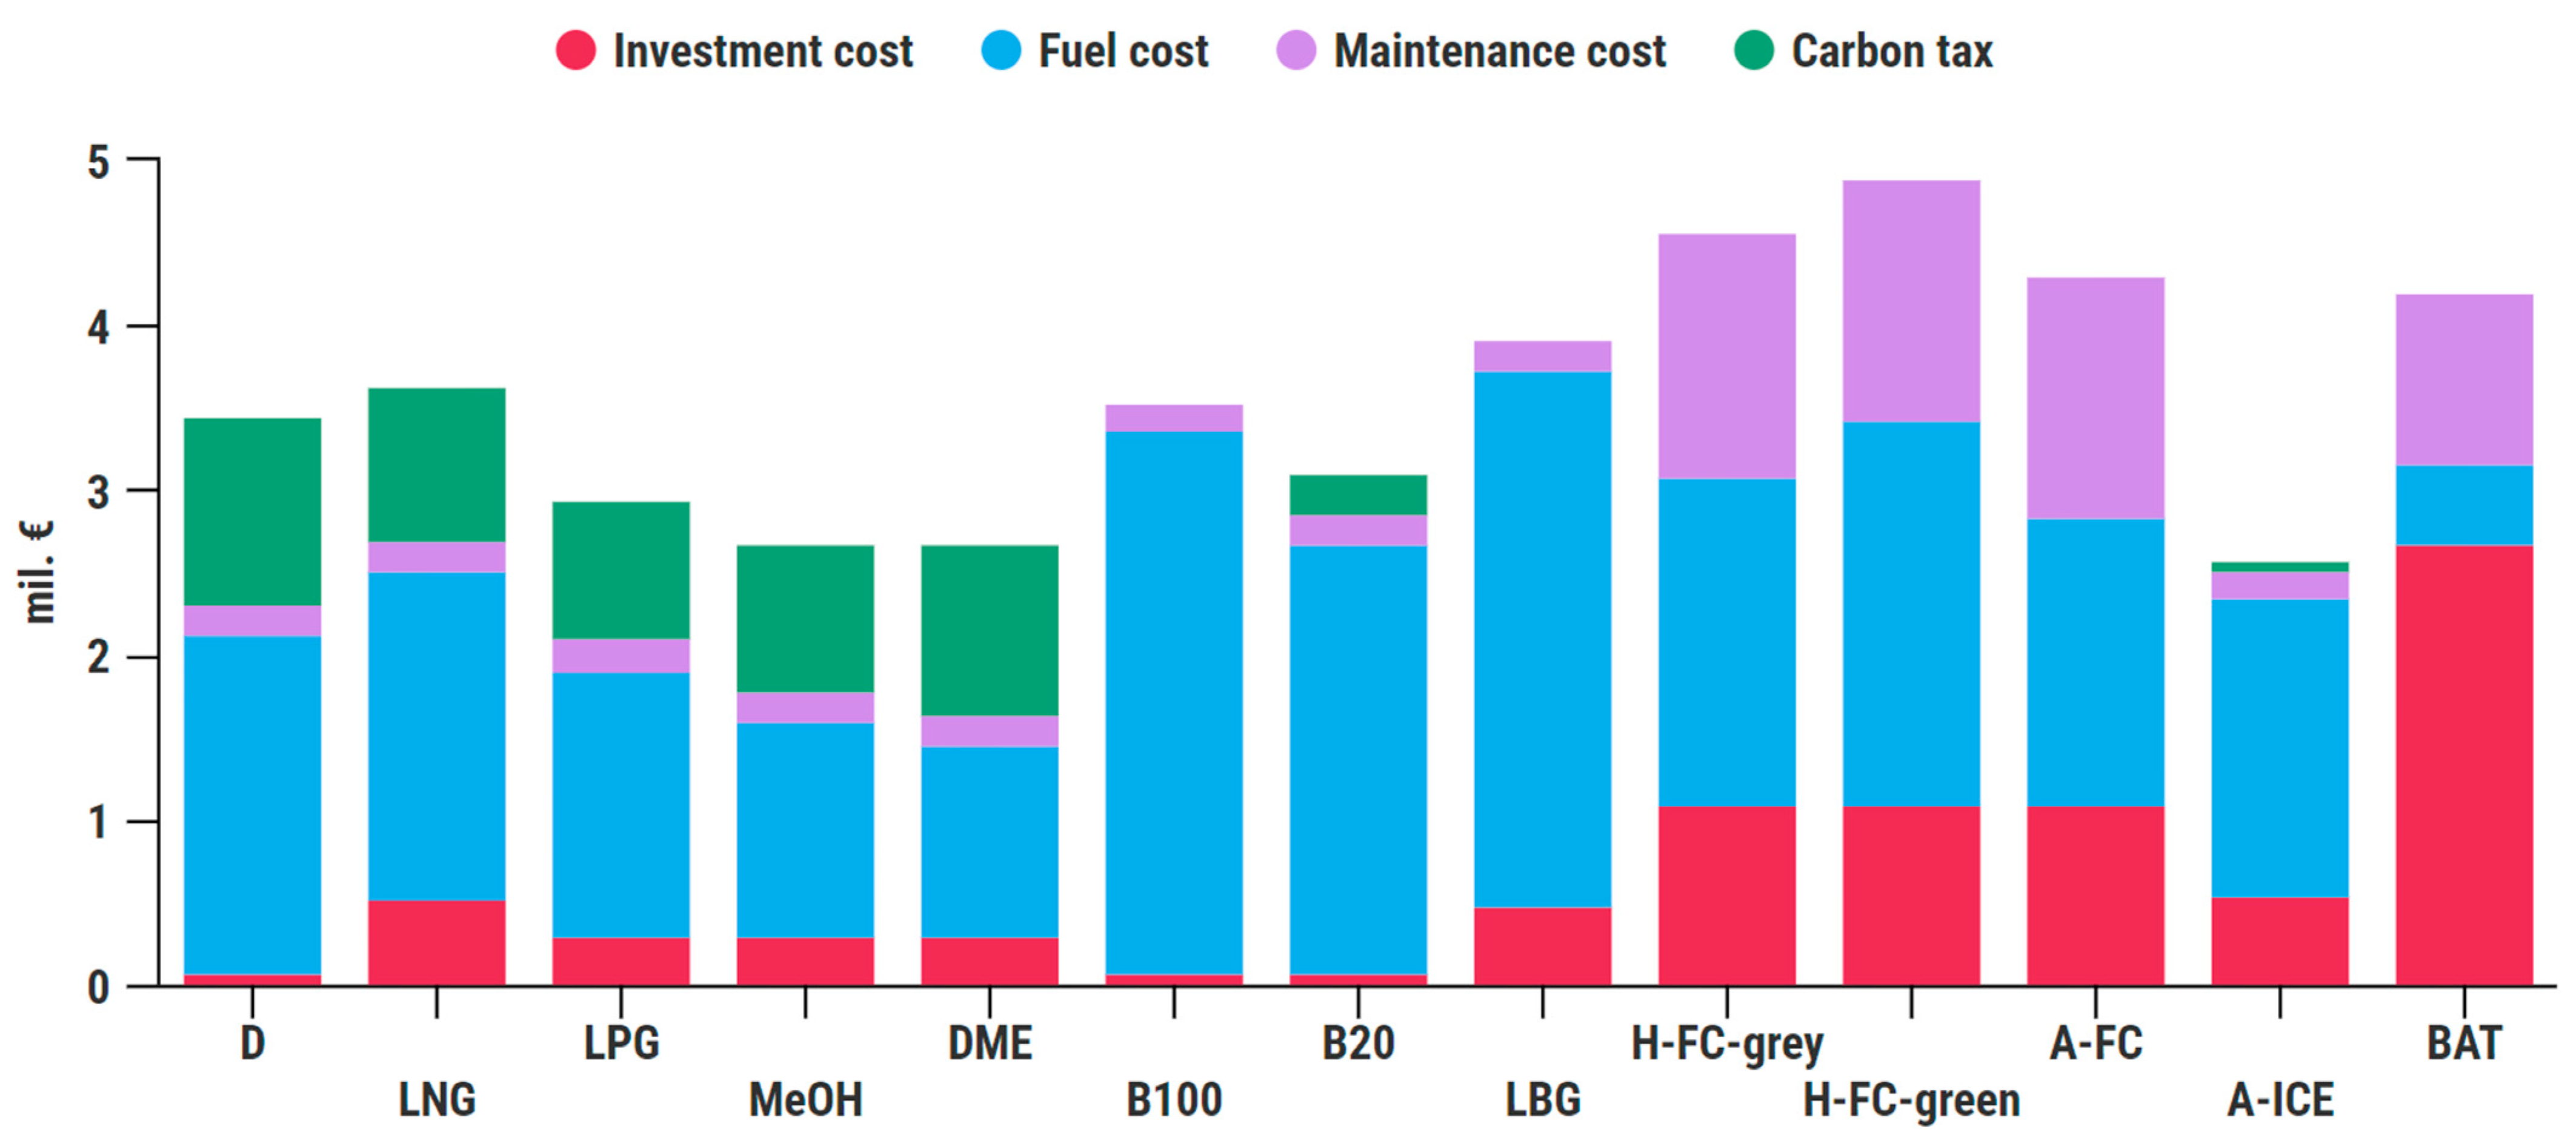
  • Although the LCA indicated that the use of green hydrogen results in the lowest emissions, the LCCA showed that its use in a fuel cell has the highest costs. The power system configurations that are cost-effective are ammonia in ICE, methanol, and DME.
  • Methanol and LPG used in a dual-fuel engine were highlighted as the most appropriate fuels that satisfy environmental and economic criteria, i.e., their implementation achieves a reduction in emissions and cost compared to diesel-powered ships. A methanol power system results in a reduction in GHG and costs of 23.3% and 22.4%. Although LPG showed a higher reduction in GHG emissions (15.0%) at a reduced cost (24.4%), methanol is a more appropriate fuel for purse seiners. It has been thoroughly investigated as a marine fuel, and it is used in many types of ships.

Author Contributions

Conceptualisation, M.P. and N.V.; methodology, M.P. and N.V.; software, M.P.; validation, N.V. and T.H.; formal analysis, M.P.; investigation, M.P. and N.V.; resources, M.P.; data curation, M.P.; writing—original draft preparation, M.P., M.K. and I.J.; writing—review and editing, N.V. and T.H.; visualisation, M.P., M.K. and I.J.; supervision, N.V.; project administration, N.V.; funding acquisition, N.V. All authors have read and agreed to the published version of the manuscript.

Funding

This research has been co-funded by the European Maritime and Fisheries Fund of the European Union within the project “Hybrid Energy Systems for fishing vessels (HENSUS)”, granted by the Ministry of Agriculture, Directorate of Fisheries, Republic of Croatia (Award No. 324-01/21-01/2273).

Institutional Review Board Statement

Not applicable.

Informed Consent Statement

Not applicable.

Data Availability Statement

The data presented in this study are available on request from the corresponding author. The data are not publicly available due to non-disclosure agreements between ship owners and UNIZAG FSB.

Conflicts of Interest

The authors declare no conflict of interest.

Nomenclature

Variables
AFPaerosol formation potential (t PM 2.5 -eq)
APacidification potential (t SO2-eq)
BCbattery capacity (kWh)
CAcarbon allowance (EUR/t CO2)
Eemission (t)
ECenergy consumption (kWh)
EFemission factor (g emission/kg)
EHenergy for heating of fuel cell system (kWh)
FCfuel consumption (kg)
GWPglobal warming potential (t CO2-eq)
LHVlower heating value (MJ/kg)
mweight of an engine/t)
Ppower (kW)
SFCspecific fuel consumption (kg/kWh)
ttime (h)
xshare (%)
Subscripts
Aannual
AEauxiliary engine
aveaverage
ffuel
MEmain engine
p-fpilot fuel
Greek letters
ηefficiency (-)
Abbreviations
AESAll-Electric Ship
A-FCAmmonia in a Fuel Cell
A-ICEAmmonia in an Internal Combustion Engine
APSAnnounced Pledges Scenario
CIICarbon Intensity Indicator
CNG Compressed Natural Gas
DDiesel
DMEDimethyl-ether
ECAEmission Control Area
EEDIEnergy Efficiency Design Index
EEXIEnergy Efficiency Existing Ship Index
ETSEmission Trading System
FAOFood and Agriculture Organisation
FUFunctional Unit
GHGGreenhouse Gas
GTGross tonnage
H-FCHydrogen in fuel cell
HFOHeavy Fuel Oil
ICEInternal Combustion Engine
IESIsolated Energy System
IMOInternational Maritime Organisation
LBGLiquefied Biogas
LCALife-Cycle Assessment
LCCALife-Cycle Cost Assessment
LNGLiquefied Natural Gas
LPGLiquefied Petroleum Gas
LSFOLow-Sulphur Fuel Oil
MManufacturing
MDOMarine Diesel Oil
MeOHMethanol
NZESNet Zero Emissions Scenario
PEMFCProton Exchange Membrane Fuel Cell
PMParticulate Matter
RESRenewable Energy Source
SEEMPShip Energy Efficiency Management Plan
SOFCSolid Oxide Fuel Cell
SPSStated Policies Scenario
TTWTank-to-Wake
WTTWell-to-Tank

References

  1. United Nations Framework Convention Climate Change (UNFCCC). Climate Change Information Kit. Available online: https://unfccc.int/resource/iuckit/cckit2001en.pdf (accessed on 14 January 2021).
  2. UNFCCC. The Glasgow Climate Pact. Available online: https://unfccc.int/process-and-meetings/the-paris-agreement/the-glasgow-climate-pact-key-outcomes-from-cop26 (accessed on 5 April 2022).
  3. UNFCCC. The Paris Agreement. Available online: https://unfccc.int/process-and-meetings/the-paris-agreement/the-paris-agreement (accessed on 3 November 2021).
  4. International Maritime Organization. Fourth IMO GHG Study 2020; International Maritime Organization: London, UK, 2020. [Google Scholar]
  5. IMO. Initial IMO GHG Study. Available online: https://www.imo.org/en/MediaCentre/HotTopics/pages/reducing-greenhouse-gas-emissions-from-ships.aspx (accessed on 21 July 2023).
  6. DNV. Achieving the IMO Decarbonization Goals. Available online: https://www.dnv.com/expert-story/maritime-impact/How-newbuilds-can-comply-with-IMOs-2030-CO2-reduction-targets.html (accessed on 24 June 2021).
  7. Czermański, E.; Oniszczuk-Jastrząbek, A.; Spangenberg, E.F.; Kozłowski, Ł.; Adamowicz, M.; Jankiewicz, J.; Cirella, G.T. Implementation of the Energy Efficiency Existing Ship Index: An Important but Costly Step towards Ocean Protection. Mar. Policy 2022, 145, 105259. [Google Scholar] [CrossRef]
  8. Perčić, M.; Vladimir, N.; Fan, A.; Jovanović, I. Holistic Energy Efficiency and Environmental Friendliness Model for Short-Sea Vessels with Alternative Power Systems Considering Realistic Fuel Pathways and Workloads. J. Mar. Sci. Eng. 2022, 10, 613. [Google Scholar] [CrossRef]
  9. DNV. EU ETS: Preliminary Agreement to Include Shipping in the EU’s Emission Trading System from 2024; DNV: Oslo, Norway, 2024. [Google Scholar]
  10. DNV. Alternative Fuel Uptake in the World Fleet in 2022. Available online: https://www.dnv.com/expert-story/maritime-impact/Collaboration-is-key-to-scale-up-fuel-availability-in-time.html (accessed on 26 July 2023).
  11. Solakivi, T.; Paimander, A.; Ojala, L. Cost Competitiveness of Alternative Maritime Fuels in the New Regulatory Framework. Transp. Res. Part D Transp. Environ. 2022, 113, 103500. [Google Scholar] [CrossRef]
  12. Wan, C.; Yan, X.; Zhang, D.; Yang, Z. A Novel Policy Making Aid Model for the Development of LNG Fuelled Ships. Transp. Res. Part A Policy Pract. 2019, 119, 29–44. [Google Scholar] [CrossRef]
  13. Lee, H.-J.; Yoo, S.-H.; Huh, S.-Y. Economic Benefits of Introducing LNG-Fuelled Ships for Imported Flour in South Korea. Transp. Res. Part D Transp. Environ. 2020, 78, 102220. [Google Scholar] [CrossRef]
  14. Kumar, S.; Kwon, H.T.; Choi, K.H.; Lim, W.; Cho, J.H.; Tak, K.; Moon, I. LNG: An Eco-Friendly Cryogenic Fuel for Sustainable Development. Appl. Energy 2011, 88, 4264–4273. [Google Scholar] [CrossRef]
  15. Ekanem Attah, E.; Bucknall, R. An Analysis of the Energy Efficiency of LNG Ships Powering Options Using the EEDI. Ocean Eng. 2015, 110, 62–74. [Google Scholar] [CrossRef]
  16. Wärtsilä Dual-Fuel Engines. Available online: https://www.wartsila.com/encyclopedia/term/dual--fuel-engines-from-w%C3%A4rtsil%C3%A4 (accessed on 8 February 2021).
  17. Schinas, O.; Butler, M. Feasibility and Commercial Considerations of LNG-Fueled Ships. Ocean Eng. 2016, 122, 84–96. [Google Scholar] [CrossRef]
  18. Taghavifar, H.; Perera, L.P. Life Cycle Emission and Cost Assessment for LNG-Retrofitted Vessels: The Risk and Sensitivity Analyses under Fuel Property and Load Variations. Ocean Eng. 2023, 282, 114940. [Google Scholar] [CrossRef]
  19. Butarbutar, R.; Gurning, R.O.S. Semin Prospect of LNG as Marine Fuel in Indonesia: An Economic Review for a Case Study of 600 TEU Container Vessel. Appl. Sci. 2023, 13, 2760. [Google Scholar] [CrossRef]
  20. Kim, J.K.; Jeong, B.; Choi, J.-H.; Lee, W.-J. Life Cycle Assessment of LPG Engines for Small Fishing Vessels and the Applications of Bio LPG Fuel in Korea. J. Mar. Sci. Eng. 2023, 11, 1488. [Google Scholar] [CrossRef]
  21. Yeo, S.-J.; Kim, J.; Lee, W.-J. Potential Economic and Environmental Advantages of Liquid Petroleum Gas as a Marine Fuel through Analysis of Registered Ships in South Korea. J. Clean. Prod. 2022, 330, 129955. [Google Scholar] [CrossRef]
  22. Ha, S.; Jeong, B.; Jang, H.; Park, C.; Ku, B. A Framework for Determining the Life Cycle GHG Emissions of Fossil Marine Fuels in Countries Reliant on Imported Energy through Maritime Transportation: A Case Study of South Korea. Sci. Total Environ. 2023, 897, 165366. [Google Scholar] [CrossRef]
  23. Ammar, N.R. An Environmental and Economic Analysis of Methanol Fuel for a Cellular Container Ship. Transp. Res. Part D Transp. Environ. 2019, 69, 66–76. [Google Scholar] [CrossRef]
  24. Dierickx, J.; Verbiest, J.; Janvier, T.; Peeters, J.; Sileghem, L.; Verhelst, S. Retrofitting a High-Speed Marine Engine to Dual-Fuel Methanol-Diesel Operation: A Comparison of Multiple and Single Point Methanol Port Injection. Fuel Commun. 2021, 7, 100010. [Google Scholar] [CrossRef]
  25. International Maritime Organization (IMO). Methanol as Marine Fuel: Environmental Benefits, Technology Readiness, and Economic Feasibility; International Maritime Organization: London, UK, 2016. [Google Scholar]
  26. Strazza, C.; Del Borghi, A.; Costamagna, P.; Traverso, A.; Santin, M. Comparative LCA of Methanol-Fuelled SOFCs as Auxiliary Power Systems on-Board Ships. Appl. Energy 2010, 87, 1670–1678. [Google Scholar] [CrossRef]
  27. Svanberg, M.; Ellis, J.; Lundgren, J.; Landälv, I. Renewable Methanol as a Fuel for the Shipping Industry. Renew. Sustain. Energy Rev. 2018, 94, 1217–1228. [Google Scholar] [CrossRef]
  28. Bayraktar, M.; Yuksel, O.; Pamik, M. An Evaluation of Methanol Engine Utilization Regarding Economic and Upcoming Regulatory Requirements for a Container Ship. Sustain. Prod. Consum. 2023, 39, 345–356. [Google Scholar] [CrossRef]
  29. Oloruntobi, O.; Chuah, L.F.; Mokhtar, K.; Gohari, A.; Onigbara, V.; Chung, J.X.; Mubashir, M.; Asif, S.; Show, P.L.; Han, N. Assessing Methanol Potential as a Cleaner Marine Fuel: An Analysis of Its Implications on Emissions and Regulation Compliance. Clean. Eng. Technol. 2023, 14, 100639. [Google Scholar] [CrossRef]
  30. Moirangthem, K.; Baxter, D. Alternative Fuels for Marine and Inland Waterways 2016; EU Publications: Luxembourg, 2016. [Google Scholar]
  31. Pham, V.C.; Rho, B.-S.; Kim, J.-S.; Lee, W.-J.; Choi, J.-H. Effects of Various Fuels on Combustion and Emission Characteristics of a Four-Stroke Dual-Fuel Marine Engine. J. Mar. Sci. Eng. 2021, 9, 1072. [Google Scholar] [CrossRef]
  32. Bilgili, L. Comparative Assessment of Alternative Marine Fuels in Life Cycle Perspective. Renew. Sustain. Energy Rev. 2021, 144, 110985. [Google Scholar] [CrossRef]
  33. Hammond, G.P.; Seth, S.M. Carbon and Environmental Footprinting of Global Biofuel Production. Appl. Energy 2013, 112, 547–559. [Google Scholar] [CrossRef]
  34. Mahapatra, S.; Kumar, D.; Singh, B.; Sachan, P.K. Biofuels and Their Sources of Production: A Review on Cleaner Sustainable Alternative against Conventional Fuel, in the Framework of the Food and Energy Nexus. Energy Nexus 2021, 4, 100036. [Google Scholar] [CrossRef]
  35. Gilbert, P.; Walsh, C.; Traut, M.; Kesieme, U.; Pazouki, K.; Murphy, A. Assessment of Full Life-Cycle Air Emissions of Alternative Shipping Fuels. J. Clean. Prod. 2018, 172, 855–866. [Google Scholar] [CrossRef]
  36. Korberg, A.D.; Brynolf, S.; Grahn, M.; Skov, I.R. Techno-Economic Assessment of Advanced Fuels and Propulsion Systems in Future Fossil-Free Ships. Renew. Sustain. Energy Rev. 2021, 142, 110861. [Google Scholar] [CrossRef]
  37. Gabrielii, C.H.; Jafarzadeh, S. Alternative Fuels and Propulsion Systems for Fishing Vessels; SINTEF Energi AS: Trondheim, Norway, 2020. [Google Scholar]
  38. Wu, G.; Li, J.; Guo, H.; Wang, X.; Jiang, G. Numerical Method for Predicting Emissions from Biodiesel Blend Fuels in Diesel Engines of Inland Waterway Vessels. J. Mar. Sci. Eng. 2023, 11, 86. [Google Scholar] [CrossRef]
  39. Wang, Z.; Paulauskiene, T.; Uebe, J.; Bucas, M. Characterization of Biomethanol–Biodiesel–Diesel Blends as Alternative Fuel for Marine Applications. J. Mar. Sci. Eng. 2020, 8, 730. [Google Scholar] [CrossRef]
  40. Hazrat, M.A.; Rasul, M.G.; Mofijur, M.; Khan, M.M.K.; Djavanroodi, F.; Azad, A.K.; Bhuiya, M.M.K.; Silitonga, A.S. A Mini Review on the Cold Flow Properties of Biodiesel and Its Blends. Front. Energy Res. 2020, 8, 598651. [Google Scholar] [CrossRef]
  41. Christensen, E.; McCormick, R.L. Long-Term Storage Stability of Biodiesel and Biodiesel Blends. Fuel Process. Technol. 2014, 128, 339–348. [Google Scholar] [CrossRef]
  42. Lindstad, E.; Lagemann, B.; Rialland, A.; Gamlem, G.M.; Valland, A. Reduction of Maritime GHG Emissions and the Potential Role of E-Fuels. Transp. Res. Part D Transp. Environ. 2021, 101, 103075. [Google Scholar] [CrossRef]
  43. Sterling PlanB Energy Solutions (SPBES). Electrification of Ships. Available online: https://spbes.com/ (accessed on 13 January 2021).
  44. Gagatsi, E.; Estrup, T.; Halatsis, A. Exploring the Potentials of Electrical Waterborne Transport in Europe: The E-Ferry Concept. In Transportation Research Procedia; Elsevier B.V.: Amsterdam, The Netherlands, 2016; Volume 14, pp. 1571–1580. [Google Scholar]
  45. Nuchturee, C.; Li, T.; Xia, H. Energy Efficiency of Integrated Electric Propulsion for Ships—A Review. Renew. Sustain. Energy Rev. 2020, 134, 110145. [Google Scholar] [CrossRef]
  46. Lindstad, H.E.; Eskeland, G.S.; Rialland, A. Batteries in Offshore Support Vessels—Pollution, Climate Impact and Economics. Transp. Res. Part D Transp. Environ. 2017, 50, 409–417. [Google Scholar] [CrossRef]
  47. Perčić, M.; Frković, L.; Pukšec, T.; Ćosić, B.; Li, O.L.; Vladimir, N. Life-Cycle Assessment and Life-Cycle Cost Assessment of Power Batteries for All-Electric Vessels for Short-Sea Navigation. Energy 2022, 251, 123895. [Google Scholar] [CrossRef]
  48. Wang, L.; Hu, J.; Yu, Y.; Huang, K.; Hu, Y. Lithium-Air, Lithium-Sulfur, and Sodium-Ion, Which Secondary Battery Category Is More Environmentally Friendly and Promising Based on Footprint Family Indicators? J. Clean. Prod. 2020, 276, 124244. [Google Scholar] [CrossRef]
  49. Arcos, J.M.M.; Santos, D.M.F. The Hydrogen Color Spectrum: Techno-Economic Analysis of the Available Technologies for Hydrogen Production. Gases 2023, 3, 25–46. [Google Scholar] [CrossRef]
  50. Morales-Ospino, R.; Celzard, A.; Fierro, V. Strategies to Recover and Minimize Boil-off Losses during Liquid Hydrogen Storage. Renew. Sustain. Energy Rev. 2023, 182, 113360. [Google Scholar] [CrossRef]
  51. De-Troya, J.J.; Álvarez, C.; Fernández-Garrido, C.; Carral, L. Analysing the Possibilities of Using Fuel Cells in Ships. Int. J. Hydrogen Energy 2016, 41, 2853–2866. [Google Scholar] [CrossRef]
  52. Sapra, H.; Stam, J.; Reurings, J.; van Biert, L.; van Sluijs, W.; de Vos, P.; Visser, K.; Vellayani, A.P.; Hopman, H. Integration of Solid Oxide Fuel Cell and Internal Combustion Engine for Maritime Applications. Appl. Energy 2021, 281, 115854. [Google Scholar] [CrossRef]
  53. Ahn, J.; Park, S.H.; Noh, Y.; Choi, B.I.; Ryu, J.; Chang, D.; Brendstrup, K.L.M. Performance and Availability of a Marine Generator-Solid Oxide Fuel Cell-Gas Turbine Hybrid System in a Very Large Ethane Carrier. J. Power Sources 2018, 399, 199–206. [Google Scholar] [CrossRef]
  54. Offshore Energy MF Hydra Starts World’s First Voyage on Emission-Free Liquid Hydrogen. Available online: https://www.offshore-energy.biz/watch-mf-hydra-starts-worlds-first-voyage-on-emission-free-liquid-hydrogen/#:~:text=MF%20Hydra%2C%20the%20world’s%20first,from%20the%20Norwegian%20Maritime%20Authority (accessed on 21 September 2023).
  55. Shahpouri, S.; Gordon, D.; Hayduk, C.; Rezaei, R.; Koch, C.R.; Shahbakhti, M. Hybrid Emission and Combustion Modeling of Hydrogen Fueled Engines. Int. J. Hydrogen Energy 2023, 48, 24037–24053. [Google Scholar] [CrossRef]
  56. Mallouppas, G.; Yfantis, E.A. Decarbonization in Shipping Industry: A Review of Research, Technology Development, and Innovation Proposals. J. Mar. Sci. Eng. 2021, 9, 415. [Google Scholar] [CrossRef]
  57. International Transport Forum. The Potential of E-Fuels to Decarbonise Ships and Aircraft. In International Transport Forum Policy Papers; OECD Publishing: Paris, France, 2023. [Google Scholar]
  58. Methanol Institute. Methanol as a Marine Fuel Report; Methanol Institute: Alexandria, VA, USA, 2015. [Google Scholar]
  59. Deniz, C.; Zincir, B. Environmental and Economical Assessment of Alternative Marine Fuels. J. Clean. Prod. 2016, 113, 438–449. [Google Scholar] [CrossRef]
  60. Park, J.; Choi, I.; Oh, J.; Lee, C. Preliminary Numerical Study on Exhaust Emission Characteristics of Particulate Matters and Nitrogen Oxide in a Marine Engine for Marine Diesel Oil and Dimethyl Ether Fuel. J. Mar. Sci. Eng. 2020, 8, 316. [Google Scholar] [CrossRef]
  61. Machaj, K.; Kupecki, J.; Malecha, Z.; Morawski, A.W.; Skrzypkiewicz, M.; Stanclik, M.; Chorowski, M. Ammonia as a Potential Marine Fuel: A Review. Energy Strategy Rev. 2022, 44, 100926. [Google Scholar] [CrossRef]
  62. Perčić, M.; Vladimir, N.; Fan, A. Life-Cycle Cost Assessment of Alternative Marine Fuels to Reduce the Carbon Footprint in Short-Sea Shipping: A Case Study of Croatia. Appl. Energy 2020, 279, 115848. [Google Scholar] [CrossRef]
  63. Spoof-Tuomi, K.; Niemi, S. Environmental and Economic Evaluation of Fuel Choices for Short Sea Shipping. Clean. Technol. 2020, 2, 34–52. [Google Scholar] [CrossRef]
  64. Jeong, H.; Yun, H. A Stochastic Approach for Economic Valuation of Alternative Fuels: The Case of Container Ship Investments. J. Clean. Prod. 2023, 418, 138182. [Google Scholar] [CrossRef]
  65. Chen, Z.S.; Lam, J.S.L. Life Cycle Assessment of Diesel and Hydrogen Power Systems in Tugboats. Transp. Res. Part D Transp. Environ. 2022, 103, 103192. [Google Scholar] [CrossRef]
  66. Huang, J.; Fan, H.; Xu, X.; Liu, Z. Life Cycle Greenhouse Gas Emission Assessment for Using Alternative Marine Fuels: A Very Large Crude Carrier (VLCC) Case Study. J. Mar. Sci. Eng. 2022, 10, 1969. [Google Scholar] [CrossRef]
  67. Lee, G.N.; Kim, J.M.; Jung, K.H.; Park, H.; Jang, H.S.; Lee, C.S.; Lee, J.W. Environmental Life-Cycle Assessment of Eco-Friendly Alternative Ship Fuels (MGO, LNG, and Hydrogen) for 170 GT Nearshore Ferry. J. Mar. Sci. Eng. 2022, 10, 755. [Google Scholar] [CrossRef]
  68. Koričan, M.; Perčić, M.; Vladimir, N.; Alujević, N.; Fan, A. Alternative Power Options for Improvement of the Environmental Friendliness of Fishing Trawlers. J. Mar. Sci. Eng. 2022, 10, 1882. [Google Scholar] [CrossRef]
  69. Fan, A.; Wang, J.; He, Y.; Perčić, M.; Vladimir, N.; Yang, L. Decarbonising Inland Ship Power System: Alternative Solution and Assessment Method. Energy 2021, 226, 120266. [Google Scholar] [CrossRef]
  70. Perčić, M.; Vladimir, N.; Fan, A. Techno-Economic Assessment of Alternative Marine Fuels for Inland Shipping in Croatia. Renew. Sustain. Energy Rev. 2021, 148, 111363. [Google Scholar] [CrossRef]
  71. Hwang, S.S.; Gil, S.J.; Lee, G.N.; Lee, J.W.; Park, H.; Jung, K.H.; Suh, S.B. Life Cycle Assessment of Alternative Ship Fuels for Coastal Ferry Operating in Republic of Korea. J. Mar. Sci. Eng. 2020, 8, 660. [Google Scholar] [CrossRef]
  72. Food and Agriculture Organization of the United Nations. Fisheries and Aquaculture. Available online: https://www.fao.org/fishery/en (accessed on 17 August 2023).
  73. Food and Agriculture Organization of the United Nations. Review of the Techno-Economic Performance of the Main Global Fishing Fleets; Food and Agriculture Organization of the United Nations: Rome, Italy, 2021. [Google Scholar]
  74. Gilman, E.; Humberstone, J.; Wilson, J.R.; Chassot, E.; Jackson, A.; Suuronen, P. Matching Fishery-Specific Drivers of Abandoned, Lost and Discarded Fishing Gear to Relevant Interventions. Mar. Policy 2022, 141, 105097. [Google Scholar] [CrossRef]
  75. Yalcin, E.; Suner, M. The Changing Role of Diesel Oil-Gasoil-LPG and Hydrogen Based Fuels in Human Health Risk: A Numerical Investigation in Ferry Ship Operations. Int. J. Hydrogen Energy 2020, 45, 3660–3669. [Google Scholar] [CrossRef]
  76. Avadí, A.; Fréon, P. Life Cycle Assessment of Fisheries: A Review for Fisheries Scientists and Managers. Fish. Res. 2013, 143, 21–38. [Google Scholar] [CrossRef]
  77. Monteiro, A.; Russo, M.; Gama, C.; Borrego, C. How Important Are Maritime Emissions for the Air Quality: At European and National Scale. Environ. Pollut. 2018, 242, 565–575. [Google Scholar] [CrossRef]
  78. Basurko, O.C.; Gabiña, G.; Quincoces, I. Fuel Consumption Monitoring in Fishing Vessels and Its Potential for Different Stakeholders. Available online: https://conferences.ncl.ac.uk/media/sites/conferencewebsites/scc2016/1.1.2.pdf (accessed on 26 August 2023).
  79. Koričan, M.; Frković, L.; Vladimir, N. Electrification of Fishing Vessels and Their Integration into Isolated Energy Systems with a High Share of Renewables. J. Clean. Prod. 2023, 425, 138997. [Google Scholar] [CrossRef]
  80. European Commission European Platform on LCA. Available online: https://eplca.jrc.ec.europa.eu/lifecycleassessment.html (accessed on 27 September 2023).
  81. ISO 14040; International Organization for Standardization (ISO). Available online: https://www.iso.org/standard/37456.html (accessed on 12 December 2020).
  82. GREET 2022 LCA Software. Available online: https://greet.es.anl.gov/index.php (accessed on 27 September 2023).
  83. Jovanović, I.; Vladimir, N.; Perčić, M.; Koričan, M. The Feasibility of Autonomous Low-Emission Ro-Ro Passenger Shipping in the Adriatic Sea. Ocean Eng. 2022, 247, 110712. [Google Scholar] [CrossRef]
  84. Karvounis, P.; Dantas, J.L.D.; Tsoumpris, C.; Theotokatos, G. Ship Power Plant Decarbonisation Using Hybrid Systems and Ammonia Fuel—A Techno-Economic–Environmental Analysis. J. Mar. Sci. Eng. 2022, 10, 1675. [Google Scholar] [CrossRef]
  85. Zero Carbon Shipping Managing Emissions from Ammonia-Fueled Vessels. Available online: https://cms.zerocarbonshipping.com/media/uploads/documents/Ammonia-emissions-reduction-position-paper_v4.pdf (accessed on 24 November 2023).
  86. Perčić, M.; Vladimir, N.; Jovanović, I.; Koričan, M. Application of Fuel Cells with Zero-Carbon Fuels in Short-Sea Shipping. Appl. Energy 2022, 309, 118463. [Google Scholar] [CrossRef]
  87. International Energy Agency. Global Energy and Climate Model—Macro Drivers. Available online: https://www.iea.org/reports/global-energy-and-climate-model/macro-drivers (accessed on 10 October 2023).
  88. International Energy Agency. World Energy Outlook 2022. Available online: https://iea.blob.core.windows.net/assets/830fe099-5530-48f2-a7c1-11f35d510983/WorldEnergyOutlook2022.pdf (accessed on 27 September 2023).
  89. Ministry of Agriculture of Republic of Croatia, 2023. Directory of Fisheries Fishing Vessel Particulars. Available online: https://ribarstvo.mps.hr/default.aspx?id=13 (accessed on 29 August 2023).
  90. General Fisheries Commission for the Mediterranean Authorized Vessel List. Available online: https://www.fao.org/gfcm/data/fleet/avl/en/ (accessed on 29 August 2023).
  91. Kurniawati, V.R. Sustainable Development of Fishing Operations: A Case Study Focusing on Small Vessels in Palabuhanratu, Indonesia. Ph.D. Thesis, Newcastle University, Tyne, UK, 2019. [Google Scholar]
  92. MAPON Fleet Management & Asset Tracking Platform. Available online: https://www.mapon.com/en (accessed on 14 September 2023).
  93. Koričan, M.; Vladimir, N.; Fan, A. Investigation of the Energy Efficiency of Fishing Vessels: Case Study of the Fishing Fleet in the Adriatic Sea. Ocean Eng. 2023, 286, 115734. [Google Scholar] [CrossRef]
  94. International Maritime Organization (IMO). Fourth IMO GHG Study-Final Report. Available online: https://safety4sea.com/wp-content/uploads/2020/08/MEPC-75-7-15-Fourth-IMO-GHG-Study-2020-Final-report-Secretariat.pdf (accessed on 14 January 2021).
  95. Pavlenko, N.; Comer, B.; Zhou, Y.; Clark, N.; Rutherford, D. The Climate Implications of Using LNG as a Marine Fuel; Swedish Environmental Protection Agency: Stockholm, Sweden, 2020. [Google Scholar]
  96. MAN MAN B&W ME-LGIP Propulsion. Available online: https://www.maritimeinformed.com/datasheets/man-energy-solutions-man-b-w-me-lgip-prime-mover/co-1624023192-ga/man-b-w-me-lgip.pdf (accessed on 7 September 2023).
  97. MAN ME-LGIM Engine. Available online: https://man-es.com/applications/projectguides/2stroke/content/printed/G95ME-C10_5-LGIM.pdf (accessed on 21 November 2023).
  98. Mohammadzadeh, A.; Naghib Zadeh, S.K.; Saidi, M.H.; Sharifzadeh, M. Mechanical Engineering of Solid Oxide Fuel Cell Systems: Geometric Design, Mechanical Configuration, and Thermal Analysis. In Design and Operation of Solid Oxide Fuel Cells: The Systems Engineering Vision for Industrial Application; Elsevier: Amsterdam, The Netherlands, 2019; pp. 85–130. ISBN 9780128152539. [Google Scholar]
  99. Quach, T.-Q.; Giap, V.-T.; Keun Lee, D.; Pineda Israel, T.; Young Ahn, K. High-Efficiency Ammonia-Fed Solid Oxide Fuel Cell Systems for Distributed Power Generation. Appl. Energy 2022, 324, 119718. [Google Scholar] [CrossRef]
  100. DNV Ammonia-Fuelled Engines for Carbon Free Shipping. Available online: https://www.dnv.com/research/review-2021/featured-projects/ammonia-fuelled-engines.html (accessed on 23 September 2023).
  101. European Maritime Safety Agency (EMSA). Potential of Ammonia as Fuel in Shipping; European Maritime Safety Agency: Lisbon, Portugal, 2022. [Google Scholar]
  102. Gandoman, F.H.; Jaguemont, J.; Goutam, S.; Gopalakrishnan, R.; Firouz, Y.; Kalogiannis, T.; Omar, N.; Van Mierlo, J. Concept of Reliability and Safety Assessment of Lithium-Ion Batteries in Electric Vehicles: Basics, Progress, and Challenges. Appl. Energy 2019, 251, 113343. [Google Scholar] [CrossRef]
  103. International Energy Agency. Biodiesel and Diesel Prices, 2019 to April 2022. Available online: https://www.iea.org/data-and-statistics/charts/biodiesel-and-diesel-prices-2019-to-april-2022 (accessed on 28 September 2023).
  104. Global Petrol Prices LPG Prices. Available online: https://www.globalpetrolprices.com/lpg_prices/#:~:text=LPG%20prices%2C%2025%2DSep%2D,in%20these%20prices%20among%20countries (accessed on 29 September 2023).
  105. Trading Economics Methanol Price. Available online: https://tradingeconomics.com/commodity/methanol (accessed on 28 September 2023).
  106. Statista Projected Low and High Prices for Marine Fuels in 2050. Available online: https://www.statista.com/statistics/1367303/forecasted-low-and-high-prices-for-marine-fuels/ (accessed on 28 September 2023).
  107. Iannaccone, T.; Landucci, G.; Tugnoli, A.; Salzano, E.; Cozzani, V. Sustainability of Cruise Ship Fuel Systems: Comparison among LNG and Diesel Technologies. J. Clean. Prod. 2020, 260, 121069. [Google Scholar] [CrossRef]
  108. Lagemann, B.; Lindstad, E.; Fagerholt, K.; Rialland, A.; Ove Erikstad, S. Optimal Ship Lifetime Fuel and Power System Selection. Transp. Res. Part D Transp. Environ. 2022, 102, 103145. [Google Scholar] [CrossRef]
  109. Ellis, J.; Tanneberger, K. Study on the Use of Ethyl and Methyl Alcohol as Alternative Fuels in Shipping; European Maritime Safety Agency: Lisbon, Portugal, 2015. [Google Scholar]
  110. Jafarzadeh, S.; Paltrinieri, N.; Utne, I.B.; Ellingsen, H. LNG-Fuelled Fishing Vessels: A Systems Engineering Approach. Transp. Res. Part D Transp. Environ. 2017, 50, 202–222. [Google Scholar] [CrossRef]
Figure 1. Alternative marine fuel uptake in 2022 [10] (reproduced from [10] with permission of DNV, 2022).
Applsci 13 13068 g001
Figure 2. Fuels for maritime purposes.
Applsci 13 13068 g002
Figure 3. Carbon taxation scenarios.
Applsci 13 13068 g003
Figure 4. Typical operating profile of a purse seiner.
Applsci 13 13068 g004
Figure 5. Load profile of a purse seiner on a random fishing trip.
Applsci 13 13068 g005
Figure 6. Processes included in the LCA of a diesel-powered ship.
Applsci 13 13068 g006
Figure 7. Processes included in the LCA of an LNG-powered ship.
Applsci 13 13068 g007
Figure 8. Processes included in the LCA of an LPG-powered ship.
Applsci 13 13068 g008
Figure 9. Processes included in the LCA of a methanol-powered ship.
Applsci 13 13068 g009
Figure 10. Processes included in the LCA of a DME-powered ship.
Applsci 13 13068 g010
Figure 11. Processes included in the LCA of a B20-powered ship.
Applsci 13 13068 g011
Figure 12. Processes included in the LCA of a B100-powered ship.
Applsci 13 13068 g012
Figure 13. Processes included in the LCA of an LBG-powered ship.
Applsci 13 13068 g013
Figure 14. Processes included in the LCA of a hydrogen-powered ship (FC-H).
Applsci 13 13068 g014
Figure 15. Processes included in the LCA of an ammonia-powered ship (FC-A).
Applsci 13 13068 g015
Figure 16. Processes included in the LCA of an ammonia-powered ship (ICE-A).
Applsci 13 13068 g016
Figure 17. Processes included in the LCA of an all-electric ship.
Applsci 13 13068 g017
Figure 18. LCA comparison of different power systems (impact category: climate change).
Applsci 13 13068 g018
Figure 19. LCA comparison of different power systems (impact category: acidification).
Applsci 13 13068 g019
Figure 20. LCA comparison of different power systems (impact category: human toxicity).
Applsci 13 13068 g020
Figure 21. LCCA results.
Applsci 13 13068 g021
Figure 22. Sensitivity analysis.
Applsci 13 13068 g022
Table 1. Comparison of different marine fuels [58,59,60,61].
DieselLNGLPGMethanolDMEHydrogenAmmonia
LHV (MJ/kg)42.546–50.246.32028.812018.6
Density (kg/m3)833–881450500.57986670.0838682.3
Carbon content (%)>857582.6385200
Flashpoint (°C)52–96−13647011235-132
Boiling point (°C)163–399−160−4264.5−25−253−33
Cetane rating>400-<5<55--
Table 2. Recent studies on alternative fuels in the shipping sector.
YearStudiesCoverageScope
FuelsTest Case
2023Jeong and Yun [64]LSFO; LNG; ammoniacontainer shipEconomic analysis
Kim et al. [20]Diesel; gasoline; LPG; bio-LPGsmall fishing vesselLCA
Ha et al. [22]HFO; LNG; LPG; methanolbulk carrierLCA
2022Chen and Lam [65]Diesel; hydrogentugboatLCA
Huang et al. [66]MGO; LNG; methanol; ammoniavery large crude carrierLCA
Lee et al. [67]MGO; LNG; hydrogenferryLCA
Solakivi et al. [11]MDO; LSMGO; LNG; methanol; biodiesel; e-fuels (hydrogen, ammonia)ro-ro shipEconomic analysis
Koričan et al. [68]Diesel; electricity; methanol; LNG; ammonia; B20; hydrogenfishing vessel (trawler)LCA; LCCA
2021Fan et al. [69]Diesel; LNG; electricitycontainer ship; bulk carrierLCA; LCCA
Perčić et al. [70]Diesel; electricity; methanol; LNG; hydrogen; ammonia; B20inland navigation ships (tanker; small passenger ship; dredger)LCA; LCCA
Korberg et al. [36]Biofuels, bio-e-fuels, and e-fuels (methanol; DME; diesel; liquefied methane gas; LBG; ammonia); hydrotreated vegetable oil; MGO; hydrogenro-ro passenger ship; general cargo ship, bulk carrier; container shipEconomic analysis
2020Perčić et al. [62]Diesel; electricity; methanol; DME; CNG; LNG; hydrogen; ammonia; B20ferryLCA; LCCA
Spoof-Tuomi and Niemi [63]MDO; LNG; LBGferryLCA
Hwang et al. [71]MGO; LNG; hydrogenferryLCA
Table 3. Emission factors, EF (g/kg) for different fuels [22,62,83,84,85].
EF (g/kg)
MDOLNGLPGMethanolDMELBGBiodieselAmmonia
CO232062750301513751927---
CH40.0651.60.006--51.60.06-
N2O0.150.110.025--0.110.150.0003
NOX61.217.833.1887.8361.210.003
SOX2.640.020.03--0.022.640
PM1.020.180.12--0.181.020
Table 4. Main particulars of considered purse seiner [89].
Length overall, (m)32.28
Breadth, m7.40
Draught, m2.88
GT182
Main engine power, PME (kW)480
Installed auxiliary power, PAE (kW)370
Table 5. Fuel prices.
Fuel Price (EUR/GJ)
Diesel22.8 [103]
LNG17.5 [18,63]
LPG18.6 [42,104]
Methanol15.3 [105]
DME10.7 [105]
Biodiesel34.4 [103]
LBG25.9 [106]
Hydrogen (grey)25.8 [42,86]
Hydrogen (green)30.2 [42]
Ammonia20.8 [42,86]
Electricity10.3 [42]
Table 6. Results of the replacement of the diesel-power system with highlighted alternatives.
GWPAPAFPCosts
H-FC-green−88.4%−84.5%−90.5%+29.7
A-ICE+27.1%−79.5%−80.1%−25.2%
DME−2.3%−79.3%−79.3%−22.0%
AES−33.1%−87.2%−92.0%+18.2%
B100−87.1%−0.3%−0.6%+2.8%
LPG−24.4%−90.7%−90.7%−15.0%
MeOH−23.3%−73.8%−73.4%−22.4%
Disclaimer/Publisher’s Note: The statements, opinions and data contained in all publications are solely those of the individual author(s) and contributor(s) and not of MDPI and/or the editor(s). MDPI and/or the editor(s) disclaim responsibility for any injury to people or property resulting from any ideas, methods, instructions or products referred to in the content.

