Article

Comparative Study Assessing the Relative Contributions of Ship Resistance Factors Based on Data Analysis

1
Fishery Machinery and Instrument Research Institute, Chinese Academy of Fishery Sciences, Shanghai 200092, China
2
Joint Research Laboratory for Deep Blue Fishery Engineering Equipment Technology, Pilot National Laboratory for Marine Science and Technology (Qingdao), Qingdao 266237, China
3
College of Ocean Science and Engineering, Shanghai Maritime University, Shanghai 201306, China
*
Author to whom correspondence should be addressed.
Appl. Sci. 2023, 13(24), 13073; https://doi.org/10.3390/app132413073
Submission received: 29 August 2023 / Revised: 6 November 2023 / Accepted: 6 December 2023 / Published: 7 December 2023

Abstract

:
Ship resistance has a very important value in the determination of ship power and the design of emission standards. In this paper, a ship resistance model with different displacement, speed, and attachment under the condition of a fixed scale ratio is tested by means of experimental research, which is used to analyze the change law of ship resistance under the condition of a single factor. The coupling effects of multiple factors on the actual ship power are studied after the establishment of a mathematical relationship between the actual ship power and resistance on the basis of the response surface method. The research results show that: (1) there is an obvious positive correlation between ship resistance and speed, which matches the change law of the exponential equation. Compared with ship appendages, displacement and speed have the greatest influence on resistance. (2) According to the correlation analysis, the maximum correlation coefficient between ship speed/resistance and power is 0.99, and the correlation coefficients between displacement/resistance and power are 0.93 and 0.88, respectively. However, the correlation coefficients between ship appendages and resistance and power are only 0.23 and 0.14, respectively. (3) The actual ship power and speed, displacement, and appendages form a quadratic polynomial relationship. The multi-factor interaction analysis results show that speed and displacement have the greatest influence on the actual ship power. The research results have a certain guiding significance for ship design.

1. Introduction

Among the many indexes to evaluate ship performance, ship resistance is one of the most important parameters, and it determines the selection of ship machinery [1]. From the perspective of economic benefits, lower ship resistance will improve the shipping efficiency of ships, reduce transportation costs, and promote economic development. From the perspective of environmental benefits, an increase in ship resistance will increase fuel consumption and increase pollutant emissions [2,3]. The Sixth Assessment Report of the Intergovernmental Panel on Climate Change (IPCC) highlights the role of the shipping industry in contributing to climate change and the need for urgent action to reduce emissions [4,5]. Therefore, the study of ship resistance has important practical significance for optimizing ship design, improving fuel efficiency, and reducing pollutant emissions.
External environment, ship shape, material characteristics, navigation attitude, and water molecular characteristics have a great influence on the calculation or prediction of ship resistance [6,7]. In order to accurately predict the influence of heterogeneous hull roughness on ship resistance, Roberto et al. [8] conducted a series of CFD simulations on the hull model of a KRISO container ship (KSC) based on the improved wall function. Song et al. [9] proposed a new prediction method for added resistance due to heterogeneous hull roughness after incorporating the similarity law scaling and the roughness impact factor to consider the relative impacts of hull roughness in different regions, which showed better prediction performance compared to the conventional method after it was assessed through experimental fluid dynamics (EFD) and computational fluid dynamics (CFD) results. Song et al. [10] studied the combined effects of shallow water and roughness on ship resistance through an unsteady Reynolds mean Navier–Stokes model to verify the hypothesis that ship resistance in shallow water was quite different from that in deep water. Momchil et al. [11] used computational fluid dynamics to explore and demonstrate the scale effect of ship resistance components, and the results show that the scale effect is more obvious in wave resistance, while the free surface effect was displayed in friction resistance. Liu et al. [12] proposed an explicit and easy-to-use mathematical expression by analyzing the resistance of ships with extreme size ratios using the optimized semi-empirical SNNM(SHOPERA-NTUA-NTU-MARIC) method, which proved that the improved formula has a higher correlation coefficient and a smaller average percentage error through resistance verification experiments of the 11 different types of ships with extreme size ratios. Levent [13] established an artificial neural network model to calculate the weight of each external environmental condition on ship resistance with nine external environmental conditions, such as speed, navigation direction, surge height, surge direction, wave direction, effective wave height, wind Angle, and wind speed, as the input and ship resistance as the output. Malte et al. [14] used machine learning methods, such as random forest, extreme gradient enhancer, and multi-layer perceptron, to analyze the additional wave resistance of a ship in head to beam waves of 18 hulls and demonstrated that the established prediction technology had a good generalization effect based on Bayesian optimization of hyperparameters. Le et al. [15] used the unsteady RANSE method in combination with the towing cabin test to study the influence of ship trim degree on ship resistance under three different influent and two Froude numbers. Ruaraidh et al. [16] used computational fluid dynamics to study the effects of increased trim and draft on ship resistance in shallow and confined waters. The research results show that trim can compensate for increased drag caused by hull draft, but the increased drag is more sensitive to ship speed.
Marine biological pollution will not only cause great harm to ship machinery and the coating system but also affect ship resistance. Zou et al. [17] studied the effect of marine biological pollutants on ship resistance based on the modified k-ε model, which showed that the additional resistance caused by the height, shape, hardness, and density of biological fillers accounted for about 80% of the total resistance under the condition of heavy pollution. Farkas et al. [18] used a computational fluid dynamics method based on the roughness function model of hard dirt to study the resistance variation law of a contaminated plate. The simulation results were consistent with the experimental results. Then, it was applied to the analysis of the full-scale resistance characteristics of two merchant ships. An open-source software, with an integrated rough wall function model was used by Sergio et al. [19] to study friction and total resistance under smooth surface conditions to predict ship friction resistance with different degrees of slime and dirt.
In addition to studying the resistance of ships in ordinary waters, the researchers further analyzed the ice resistance of ships sailing in extremely cold waters. Jeong et al. [20] proposed a semi-empirical model of ship resistance prediction in horizontal ice based on the Lindqvist model, which analyzed the role of the contact coefficient in ice resistance prediction and could be used for ship total resistance prediction. Guo et al. [21] proposed a virtual mass method based on the combination of CFD and DEM, which realized the prediction of the total resistance of ships sailing in the floating ice area. Yang et al. [22] established a numerical model based on the non-smooth discrete element method to study the influence of floating ice shape on ship resistance when the ice sheet was composed of relatively small and unbreakable floating ice under the condition of low concentration of broken ice. Huang et al. [23] believe that ship resistance is strongly correlated with ship beam, hip Angle, waterline Angle, ship speed, ice concentration, ice thickness, floe ice diameter, and other factors, so an empirical equation is established, which has great practical significance for predicting ship fuel consumption and improving navigation safety.
Although researchers have conducted a lot of research on ship resistance under different conditions, most of the research results cannot meet the requirements of efficient, simple, and convenient application. Therefore, the ship resistance of a ship model with a fixed scale ratio under different displacements, speeds, and attachments was tested to analyze the change law of ship resistance under the condition of a single factor by means of experimental research in this paper. Thus, the mathematical relationship between the influence factors of real ship power and resistance was established to study the coupling effects of multiple factors on real ship power. The research results have certain guiding significance for ship design.

2. Materials and Methods

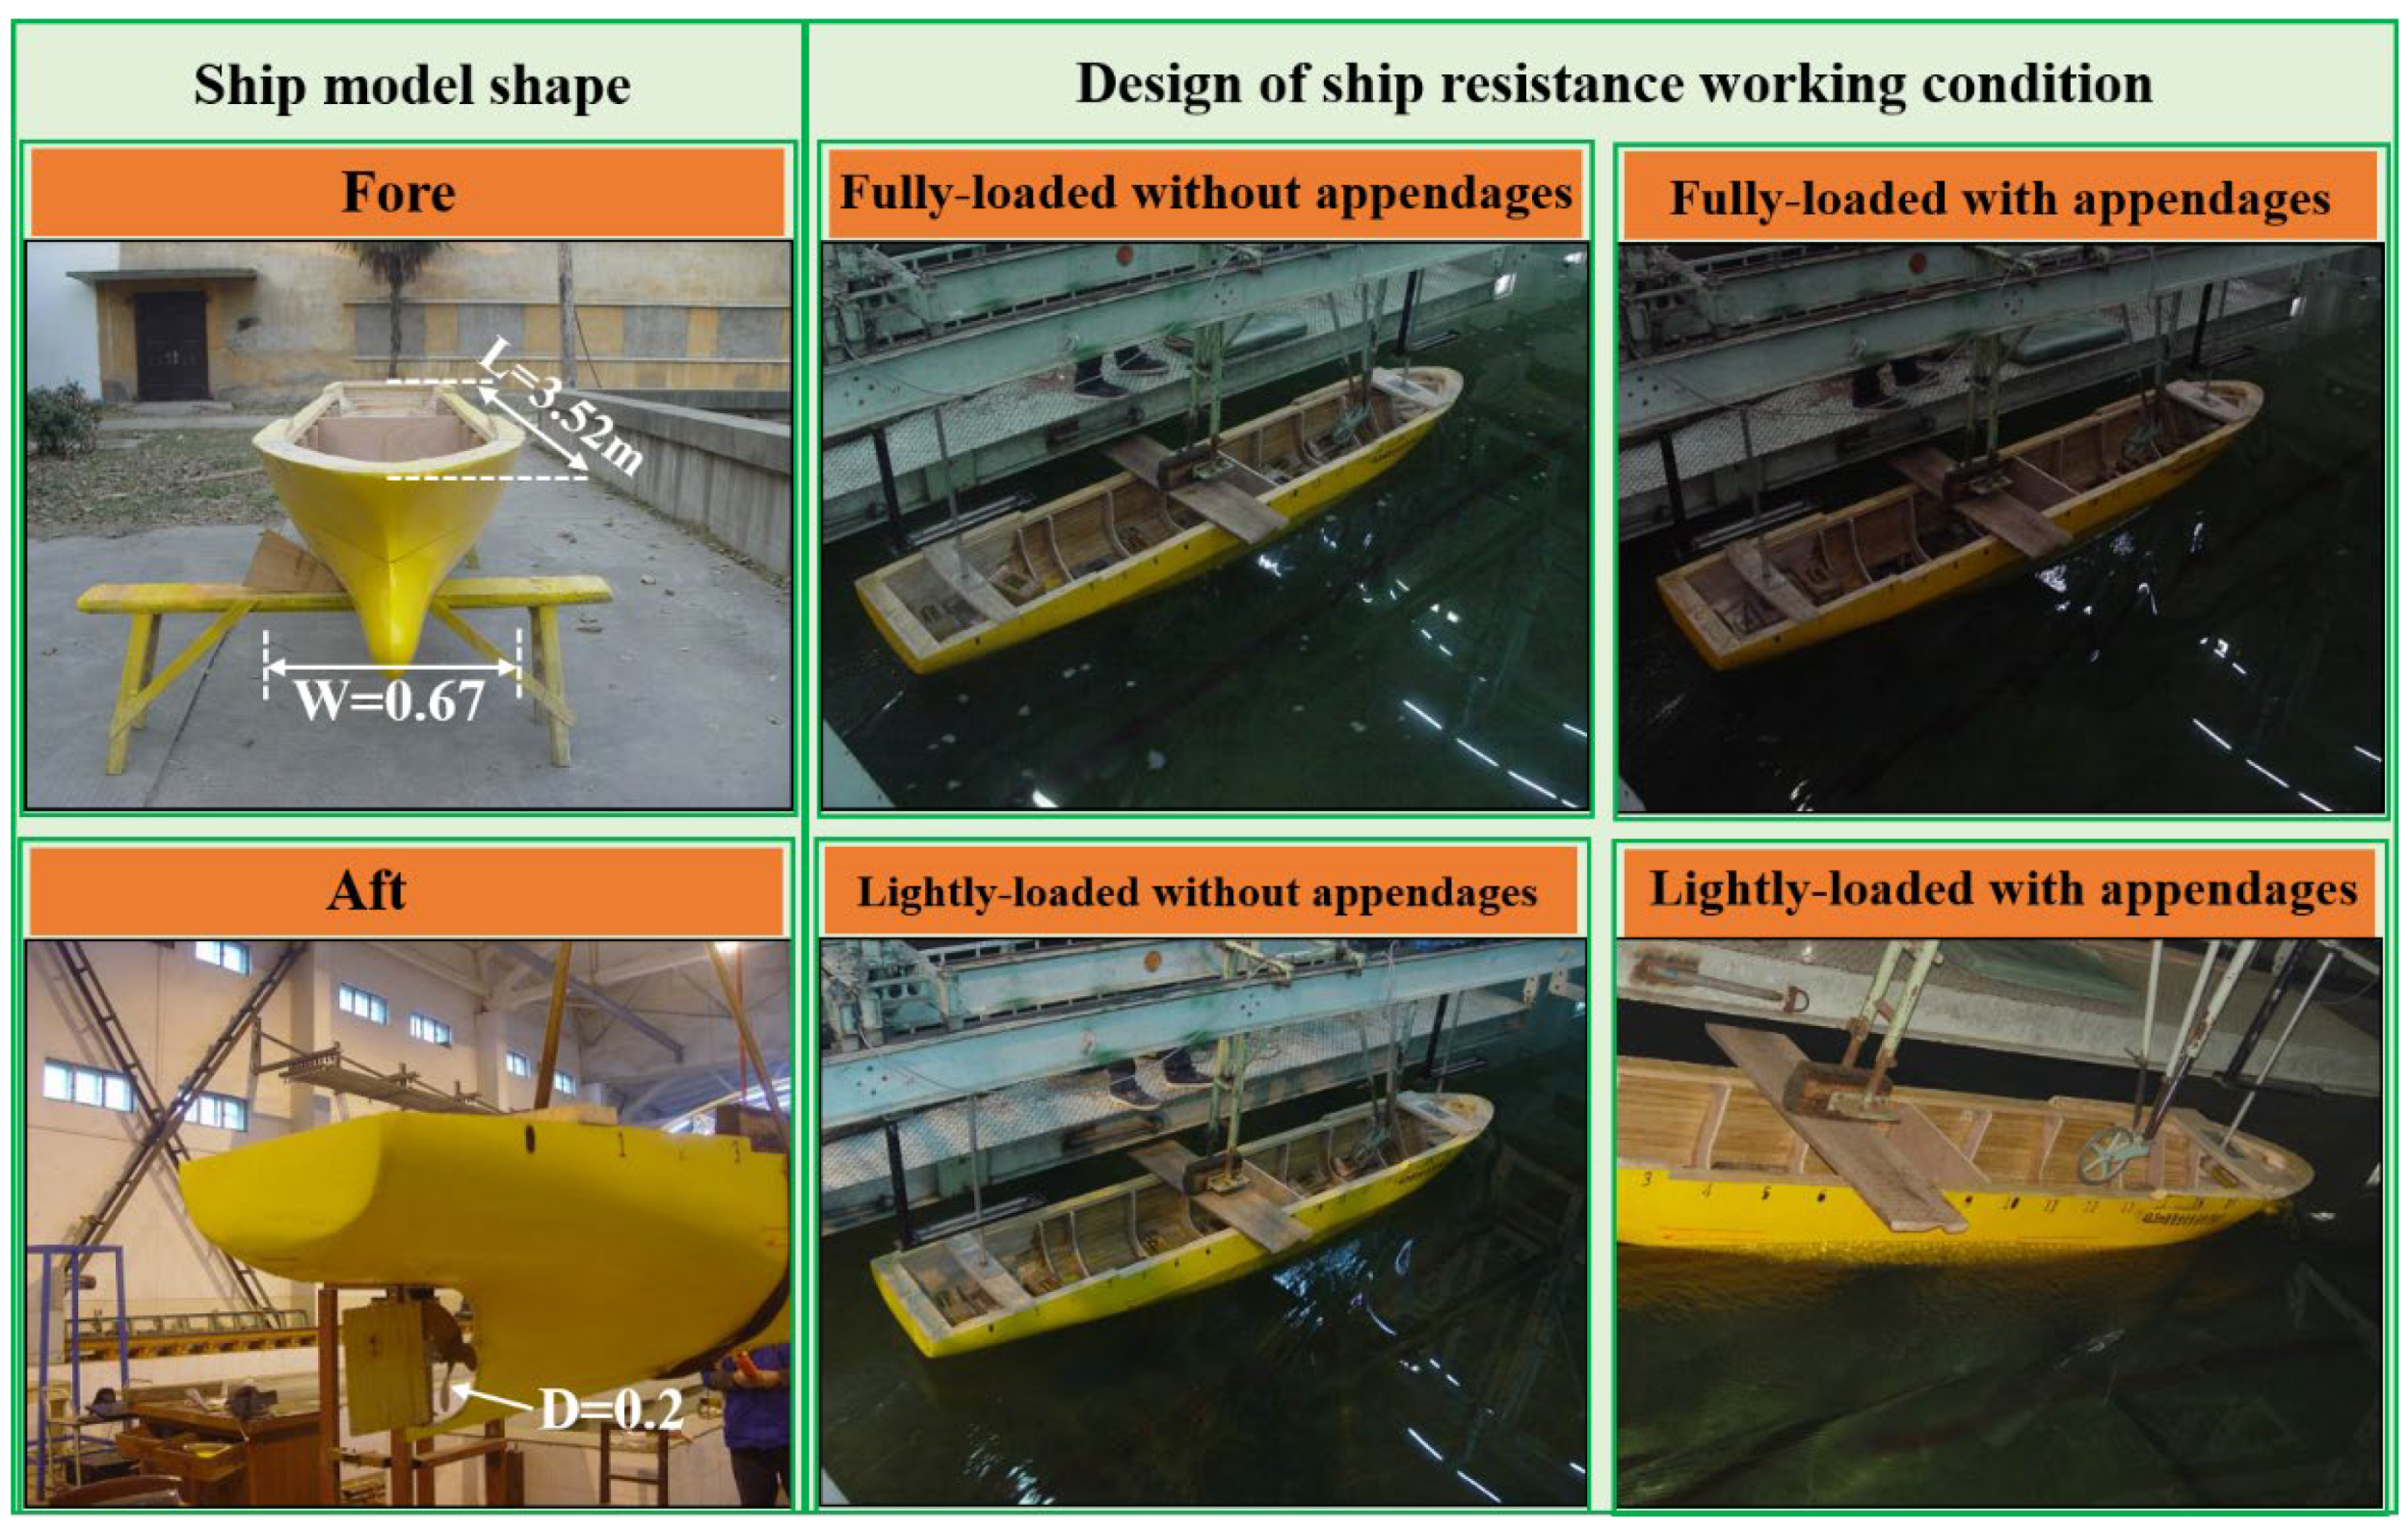
2.1. Experimental Conditions

In a ship resistance test, it is very important to ensure that the mechanics of the model ship and the real ship are similar so that the real ship performance can be predicted according to the test results. Therefore, the selection of the ship model size, ship model surface state, test environment, test condition design, etc. should be guided by the similarity theory and meet certain hydrodynamic similarity conditions and principles. The principal scales corresponding to the ship model and the real ship should satisfy the same constant of scale, denoted as follows:
L s L m = B s B m = D s D m = λ
where L is the design water line length; B is the width; D is the depth design draft; s represents the actual ship; and m represents the ship model.
In the ship model resistance test, the test process needs to satisfy a certain ship resistance similarity law in order to ensure the accuracy and reliability of the extrapolation of the test data to the actual ship performance (namely, Reynolds law and Froude law). However, it is actually difficult to achieve the full similarity condition such that both the ship model and the actual ship satisfy the equality of Re and F r . If the ship model and the actual ship are required to satisfy Fr equality, then the equation is satisfied as follows:
F r s = F r m , V s g L s = V m g L m
where V s is the velocity of the actual ship and V s is the velocity of the model ship.
If the ship model and the actual ship are required to satisfy Re equality, then the equation is satisfied as follows:
V s L s υ s = V m L m υ m
If Re and F r are equal, the length and kinematic viscosity coefficient of the real ship and the ship model should satisfy the following formula:
υ m = υ s ( L m L s ) 3 2
The scale ratio of the main dimensions of the ship model is 12.22 in the ship resistance test experiment conducted this time. It is obviously difficult to ensure that the viscosity of the medium in the experiment is 1 / 42 that of the medium in the actual ship voyage. Therefore, F r equality is chosen for the ship model experiments.
The main dimensions and main elements of the actual ship and the ship model are shown in Table 1, which mainly shows the corresponding relationship between the size of the ship model and the actual ship under fully loaded and lightly loaded conditions. The length of the model is 3.52 m and the width is 0.67 m. The propeller diameter of the real ship is 2.5 m and the power of the main engine is 900 kW. The spare propeller diameter is 204.55 mm, the number of blades is 4 blades, the disk ratio is 0.55, the pitch ratio is 1.0, and the propeller mold material is duralumin. The speed range of resistance test is shown in Table 2. The shape and working conditions of the ship model are shown in Figure 1 below. In the experimental tests, the speed range of the ship model is 0.44 to 2.06 m/s, which corresponds to the speed range of the real ship from 3 to 14 kn. The four types of working conditions are fully loaded without appendages, fully loaded with appendages, lightly loaded without appendages, and lightly loaded with appendages.

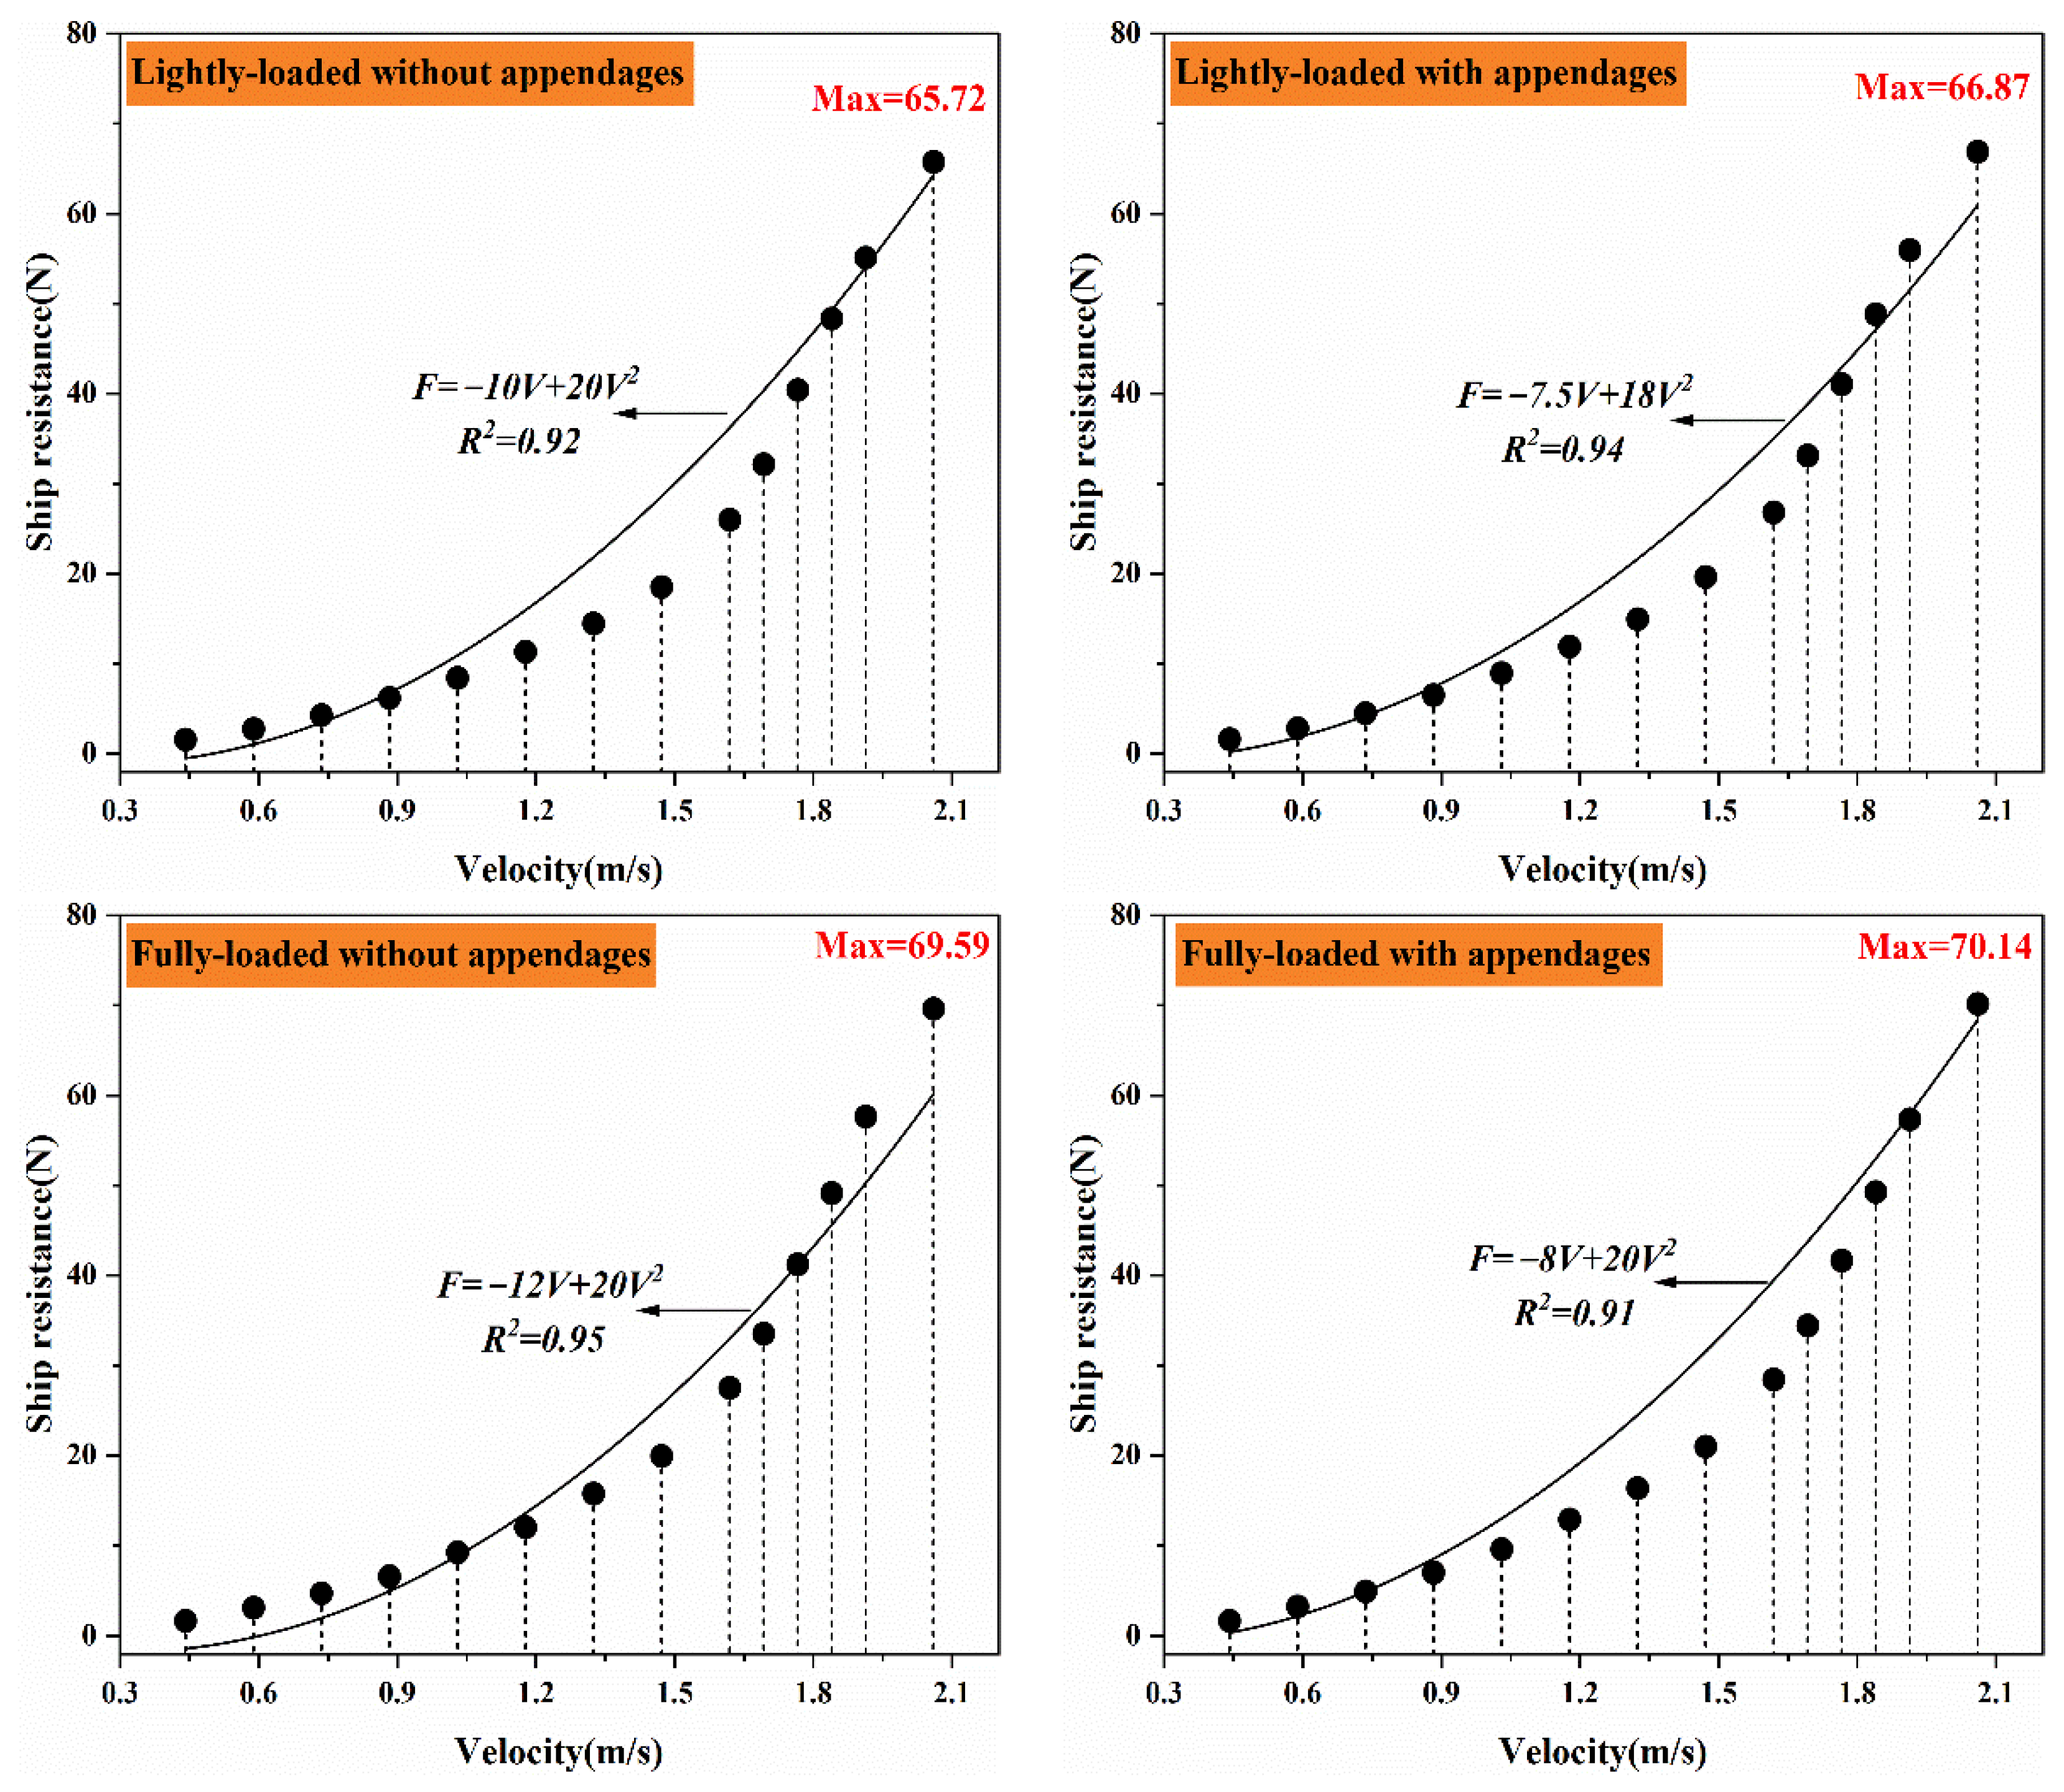
2.2. Single Factor Influence Analysis of Ship Resistance

Ship resistance is one of the main factors affecting the marine navigation state, which has a great impact on the ship’s power type selection, the overall hull design, route adjustment, ship attitude correction, and cargo loading, so it is very necessary to study the ship’s navigation resistance. Based on this, the resistance test of the ship model under four working conditions was carried out to analyze the law of the change in ship resistance by means of experimental research in this paper. Figure 2 shows the relationship between ship resistance and speed under four working conditions, respectively. According to the preliminary analysis of the data, the change rule of the data is in accordance with the exponential function. The data fitting method based on exponential function is as follows:
y = a e b x
where y is the dependent variable, x is the independent variable, and a and b are the coefficients. Taking the logarithm of both sides, Equation (6) becomes as follows:
ln y = ln a + b x
Equation (7) is transformed into the following:
Y = A + b x
Equation (8) is calculated as follows:
{ b = x Y n t ¯ Y ¯ t 2 n t ¯ 2 A = Y ¯ b t ¯
The fitting coefficients R2 are calculated as follows
R 2 = ( y ^ i y ¯ i ) 2 ( y i y ¯ i ) 2
where y ^ i is the predicted value of the fitted function and y i is the experimental true value. According to the results of the resistance test, there is an obvious positive correlation between the ship resistance and its speed. With the increase in speed, the resistance of the ship increases continuously, which conforms to the change law of the exponential equation. According to the change trend of resistance, it can be seen that the increase degree in ship resistance also gradually increases with the increase in speed, which indicates that the speed has a great influence on the ship’s resistance. The data analysis results also show that the ship resistance corresponding to the condition of being fully loaded is the greatest and the ship resistance corresponding to the condition of being lightly loaded is the lowest when the speed is constant.
In the process of this experimental test, the maximum resistances corresponding to the four working conditions of lightly loaded without appendages, lightly loaded with appendages, fully loaded without appendages, and fully loaded with appendages are 65.72 N, 66.87 N, 69.59 N, and 70.14 N, respectively, when the ship model speed is at its maximum (2.06 m/s). As shown in Figure 3, the resistance of ships increases by 0.8% from fully loaded without appendages to fully loaded with appendages, and it increases by 1.8% from lightly loaded without appendages to lightly loaded with appendages. Therefore, it can be inferred that the influence of appendages on the resistance of ships under the condition of being fully loaded is less than that under the condition of being lightly loaded. According to the above analysis results, it can be seen that the ship speed, displacement, and appendages can all have an impact on the ship’s resistance, among which speed is the most important factor, and the displacement has a greater impact than the ship appendages.

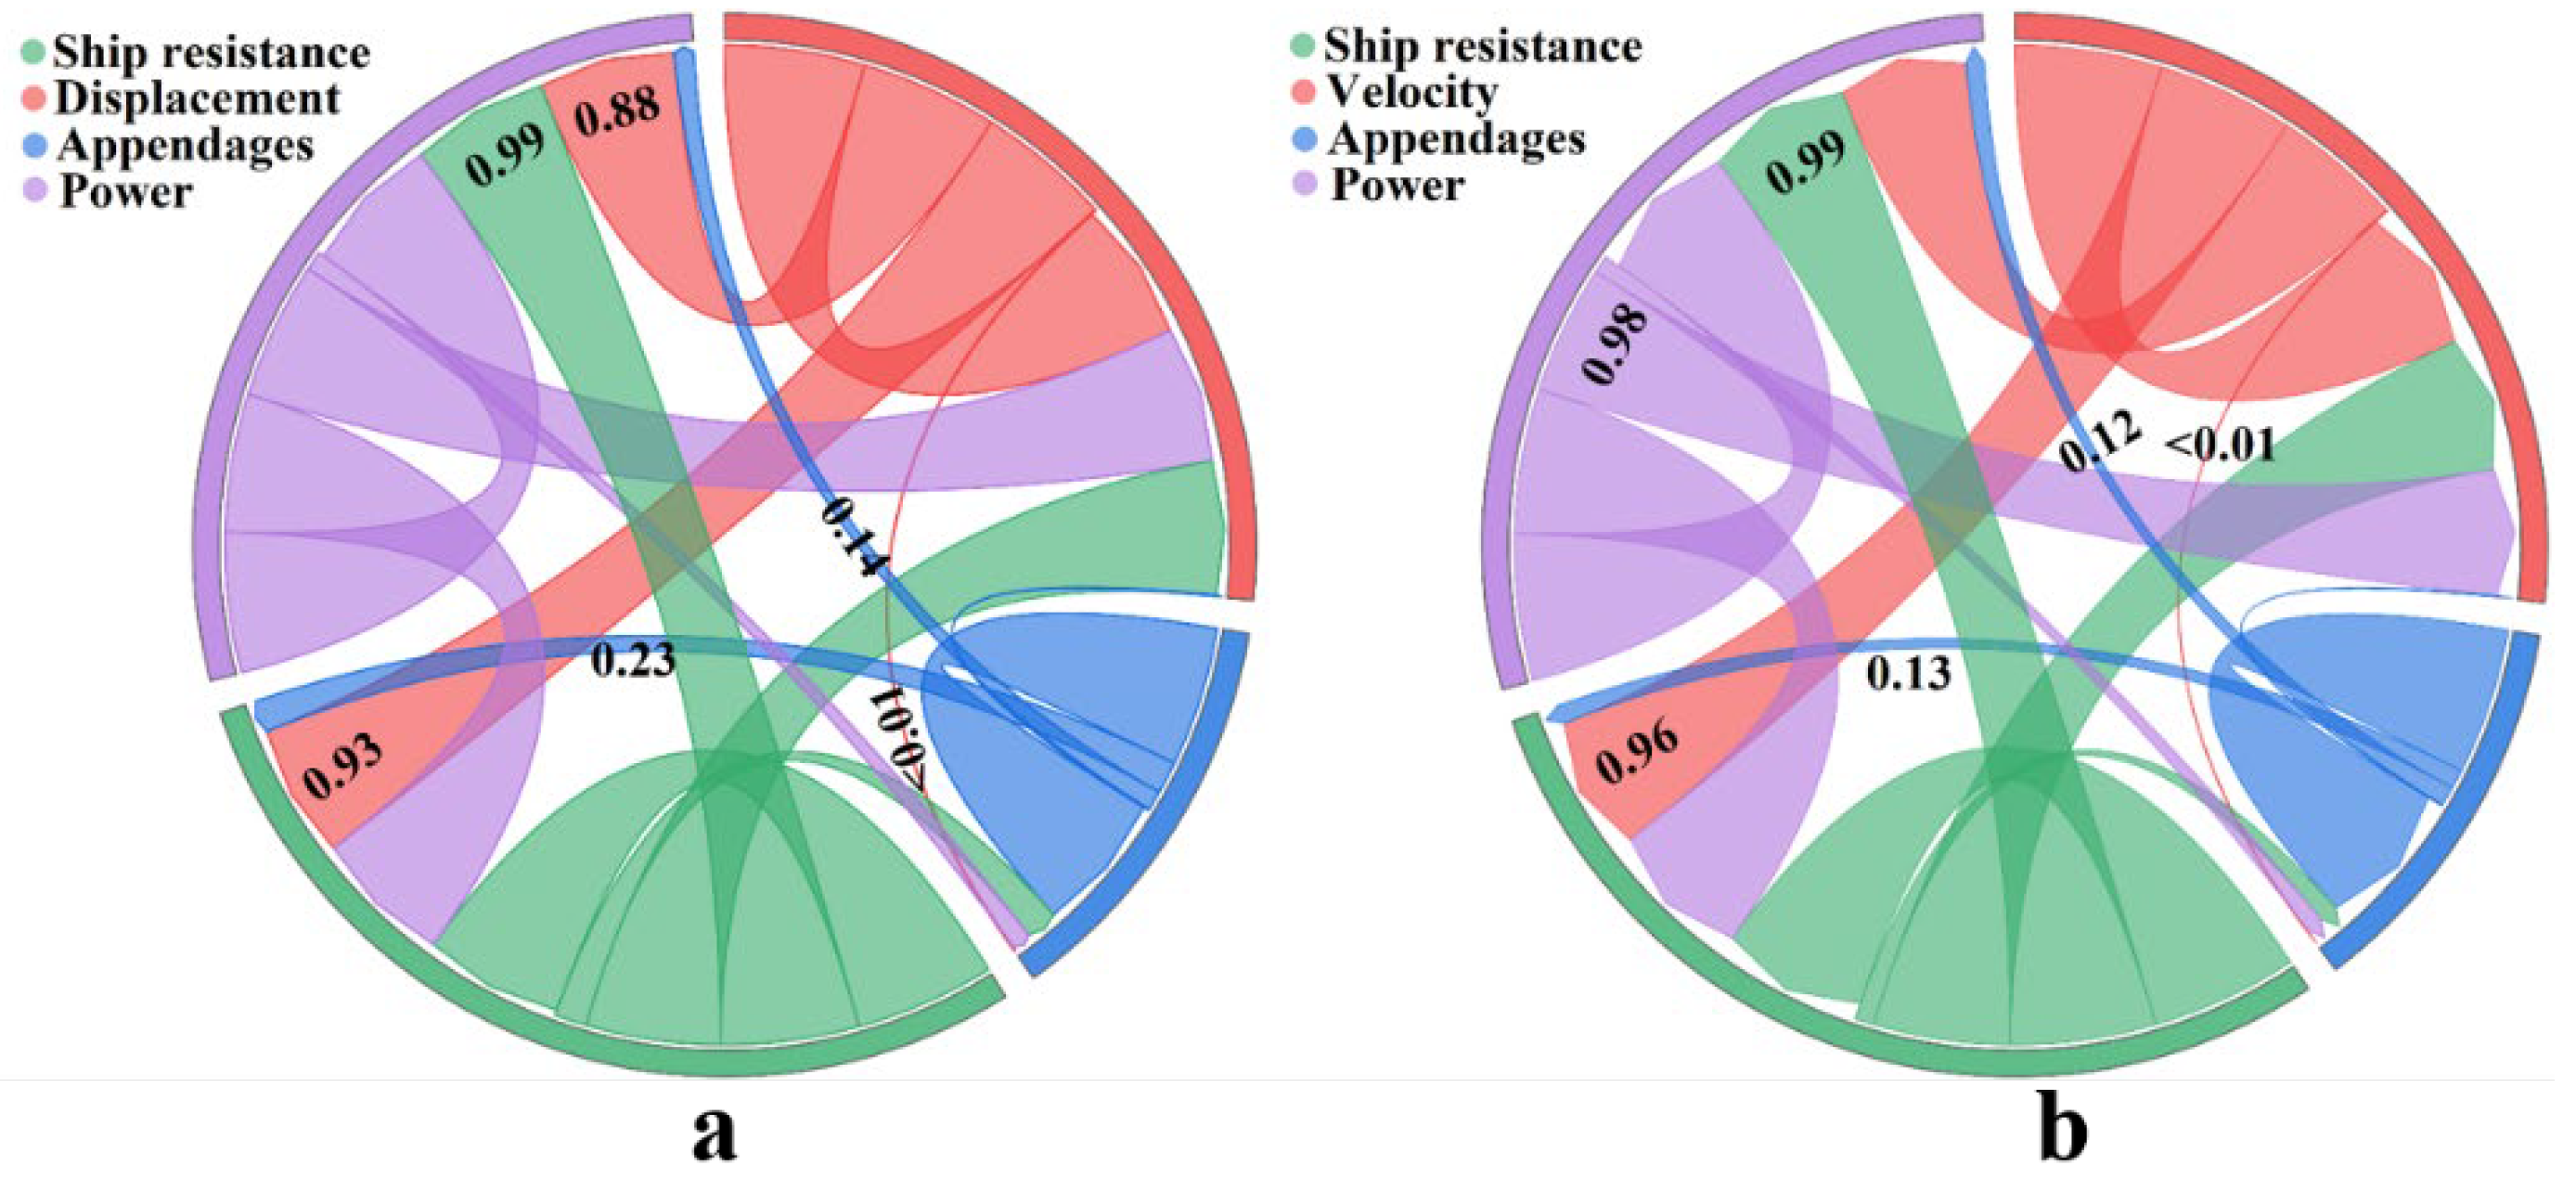
2.3. Correlation Analysis of Multiple Factors of Ship Resistance

According to the experimental test results, in addition to the significant direct influence of ship speed on resistance, there is a large difference in ship displacement under the condition of being fully loaded and the condition of being lightly loaded, which will also affect the navigation resistance of the ship. There are also some differences in the corresponding resistances of ships with and without appendages. Therefore, the factors affecting the resistance of the ship model can be synchronized to the actual ship, which can affect the power determination of the power system for the actual ship. Based on the above analysis, the control variable method is adopted in this paper to conduct correlation analysis of ship model resistance, sailing speed, displacement, ship appendages, and actual ship power. The specific results are shown in Figure 4 below. The different colors represent the different calculated objects, and the width of the ribbon represents the magnitude of the correlation coefficient in Figure 4. When the ship model’s speed is constant (Figure 4a), the correlation coefficients between the ship model’s resistance and the real ship’s power and the displacement are 0.93 and 0.88, respectively, which further proves that the speed has a significant influence on the ship’s navigation resistance. The correlation coefficient between ship appendages and ship resistance is only 0.23, indicating that the influence of the ship appendages on the resistance is relatively small, although there is a positive correlation between the two. Meanwhile, the correlation coefficient between ship appendages and actual ship power is only 0.14. The correlation between ship appendages and displacement is the lowest. Figure 4b shows that the high correlation between ship model resistance and real ship power is stable when the displacement of the ship model is constant, while the correlation coefficients between ship model speed and ship resistance or real ship power are 0.96 or 0.99. Obviously, the influence of speed on the two is very great. Ship appendages have less of an effect on ship resistance and actual power. To sum up, the correlation analysis also shows that the degree of influence on ship resistance and actual power is shaped by speed, displacement, and ship appendages, which further proves the research results of the above part. The results of the correlation analysis have important reference value for ship design and resistance prediction.

3. Results and Discussion

3.1. Response Surface Method

The main purpose of the ship resistance experiment is to provide a decision basis for the selection of the actual ship’s power equipment because the ship resistance is directly related to the power of the ship’s power device. Based on the results of the analysis of drag factors, the response surface method was chosen to further study the effects of ship speed, displacement and appendages on actual ship power.
Response surface methodology is an optimization method that combines experimental design and statistics, including many experimental and statistical techniques, such as experimental design, mathematical model building, model testing, and combinatorial condition optimization [24,25,26]. Through the regression fitting of the process and the drawing of the response surface and the contour line, the response value of each factor can be analyzed intuitively and conveniently. The data processing software Design-Expert version 12 was used to analyze the relationship between the actual ship’s power and the ship speed, displacement, and appendages. A comprehensive, visual model and optimization results can be given by the professional analysis of experimental data using the software.
The range of values for each variable needs to be determined before the analysis. According to the above experimental description, it can be seen that the speed of the ship model ranges from 0.44 m/s to 2.06 m/s. The displacement of the ship model is determined to be 0.36 t to 0.41 t. The value is 1 if the ship model is equipped with all appendages, because ship appendages cannot be quantified effectively. The value is 0 without appendages. The value ranges from 0 to 1 if the ship is configured with several appendages. Therefore, the test scheme based on the Design Expert software is shown in Table 3.
According to the experimental data, the polynomial model is fitted using Design Expert software, and the response equation can be expressed as follows:
P = 390.4 115.1 x + 2088.4 y 18.9 z + 132 x y + 1.2 x z + 65 y z + 94 x 2 2702 y 2 5.9 z 2
where P is the power of the actual ship, kw; x is the speed, m/s; y is the displacement of the ship model, t; and z stands for appendages. From the response equation, it can be seen that the influence of ship speed, displacement, and appendages on the actual ship power constitutes a quadratic polynomial model in mathematics.

3.2. Analysis of Variance

The purpose of ANOVA is to determine whether the resulting polynomial model can explain the experimental data within a 95% confidence interval. The quadratic model variance regression analysis of actual power is shown in Table 4. As can be seen from Table 4, the “Prob > F” value of the regression model is less than 0.0001, indicating that the model is significant. In this analysis, only xz, yz, and z2 have high p values, and all other terms are extremely significant model terms, which also indicates the correctness of the quadratic polynomial equation of actual power.
In the response surface analysis method, “Adequate Precision” is used to measure the signal-to-noise ratio. Its value is 42.177, which is greater than 4, indicating the reliability of the model. Meanwhile, the coefficient of determination R2 is 0.9819, which further proves the accuracy of the fitting effect. The values of R2adj (0.9494) and R2pred (0.9159) also have a good agreement. The values of these parameters show that the actual ship power has a good correspondence with the ship speed, displacement, and appendages in the ship resistance test experiment, which conforms to the quadratic polynomial variation law. Figure 5a shows the relationship between normal percentage probability and the studentized residual. The linear correlation shows that there is no obvious problem with normality. In order to further analyze the corresponding relationship between the measured values and the predicted values of the fitting model, a comparison graph is drawn between them. It can be clearly seen from Figure 5b that there is a high degree of coincidence between the tested value and the predicted value. The difference between the tested value and the predicted value is very small, indicating the correctness of the model under this experimental condition. All of the above results show that the response surface analysis method can be effectively used to analyze the relationship between actual ship power and ship speed, displacement, and appendages, and the obtained results have high reliability.

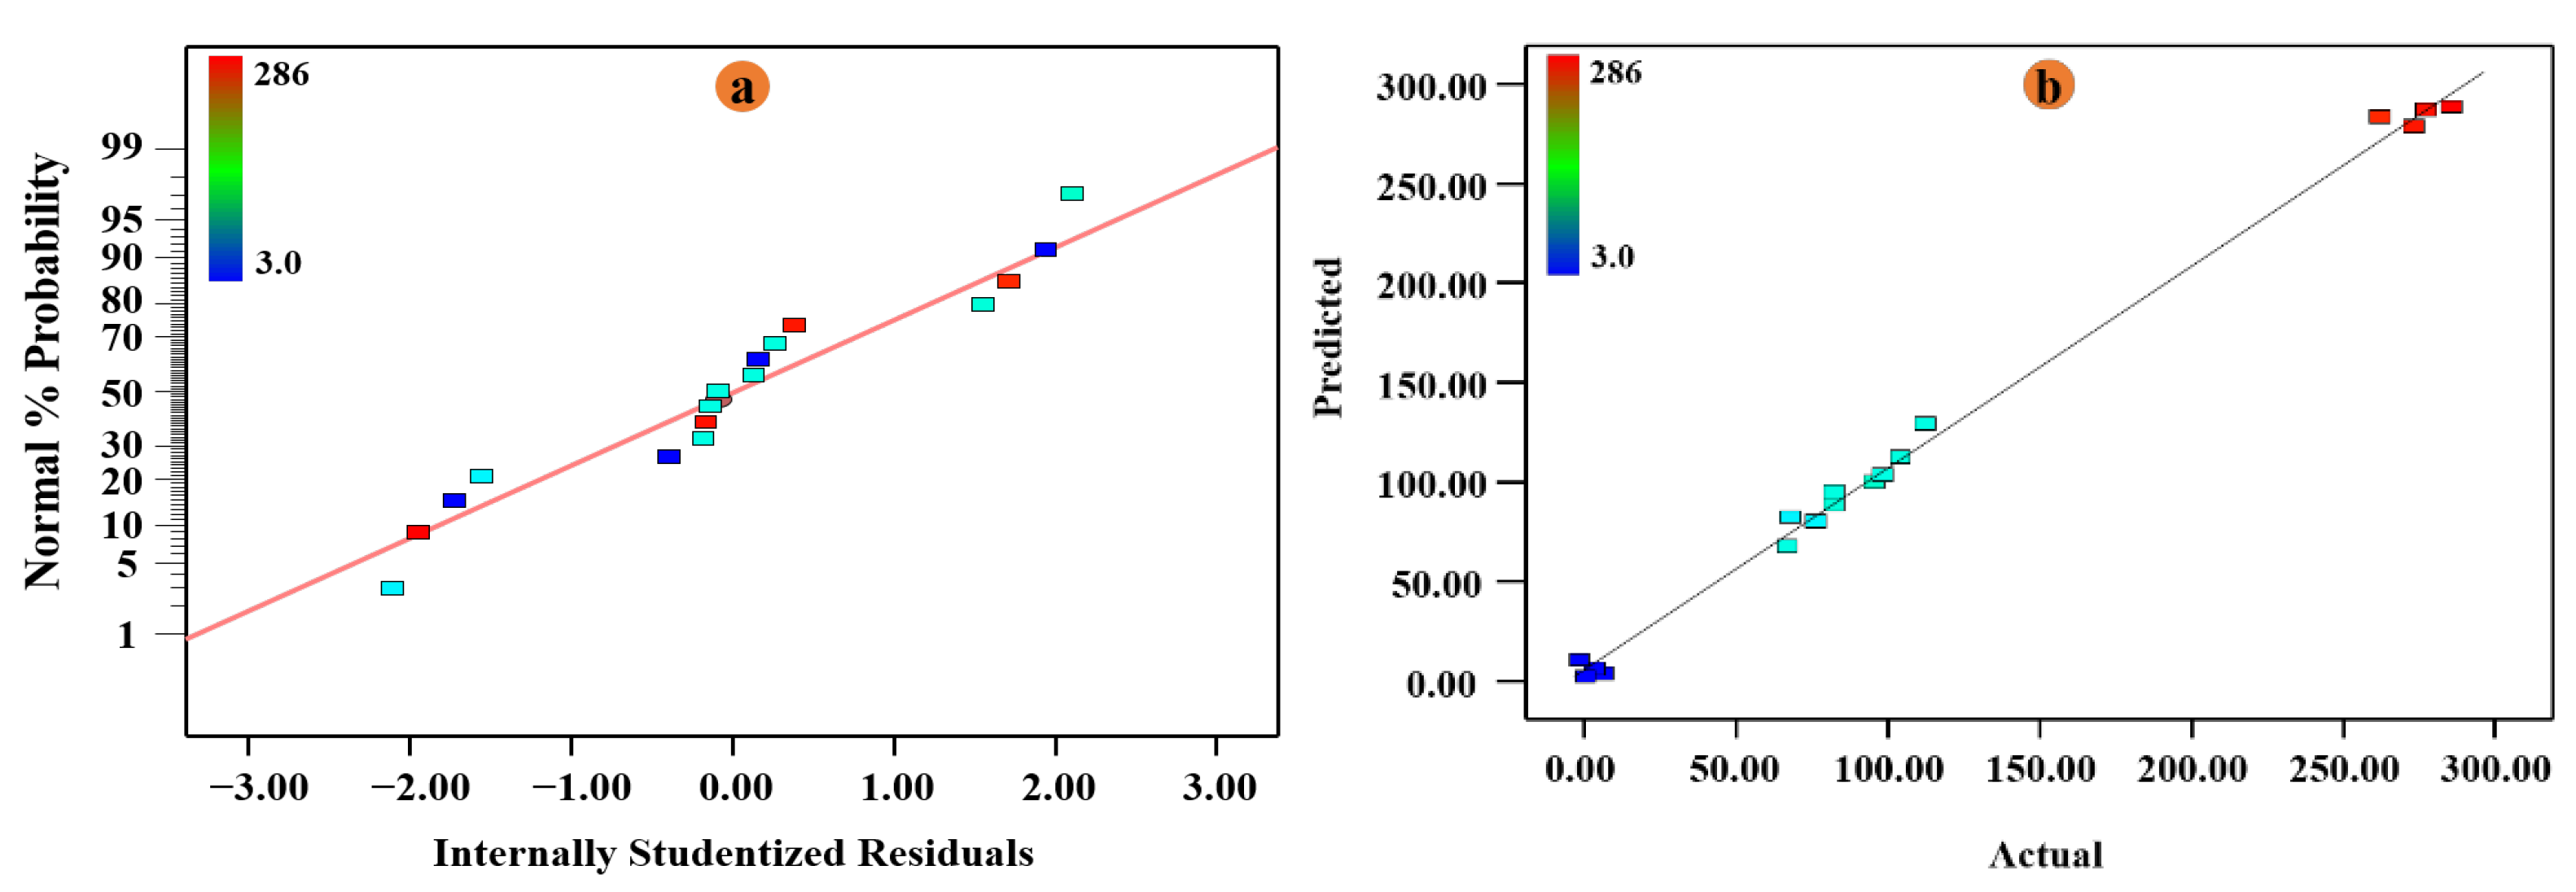
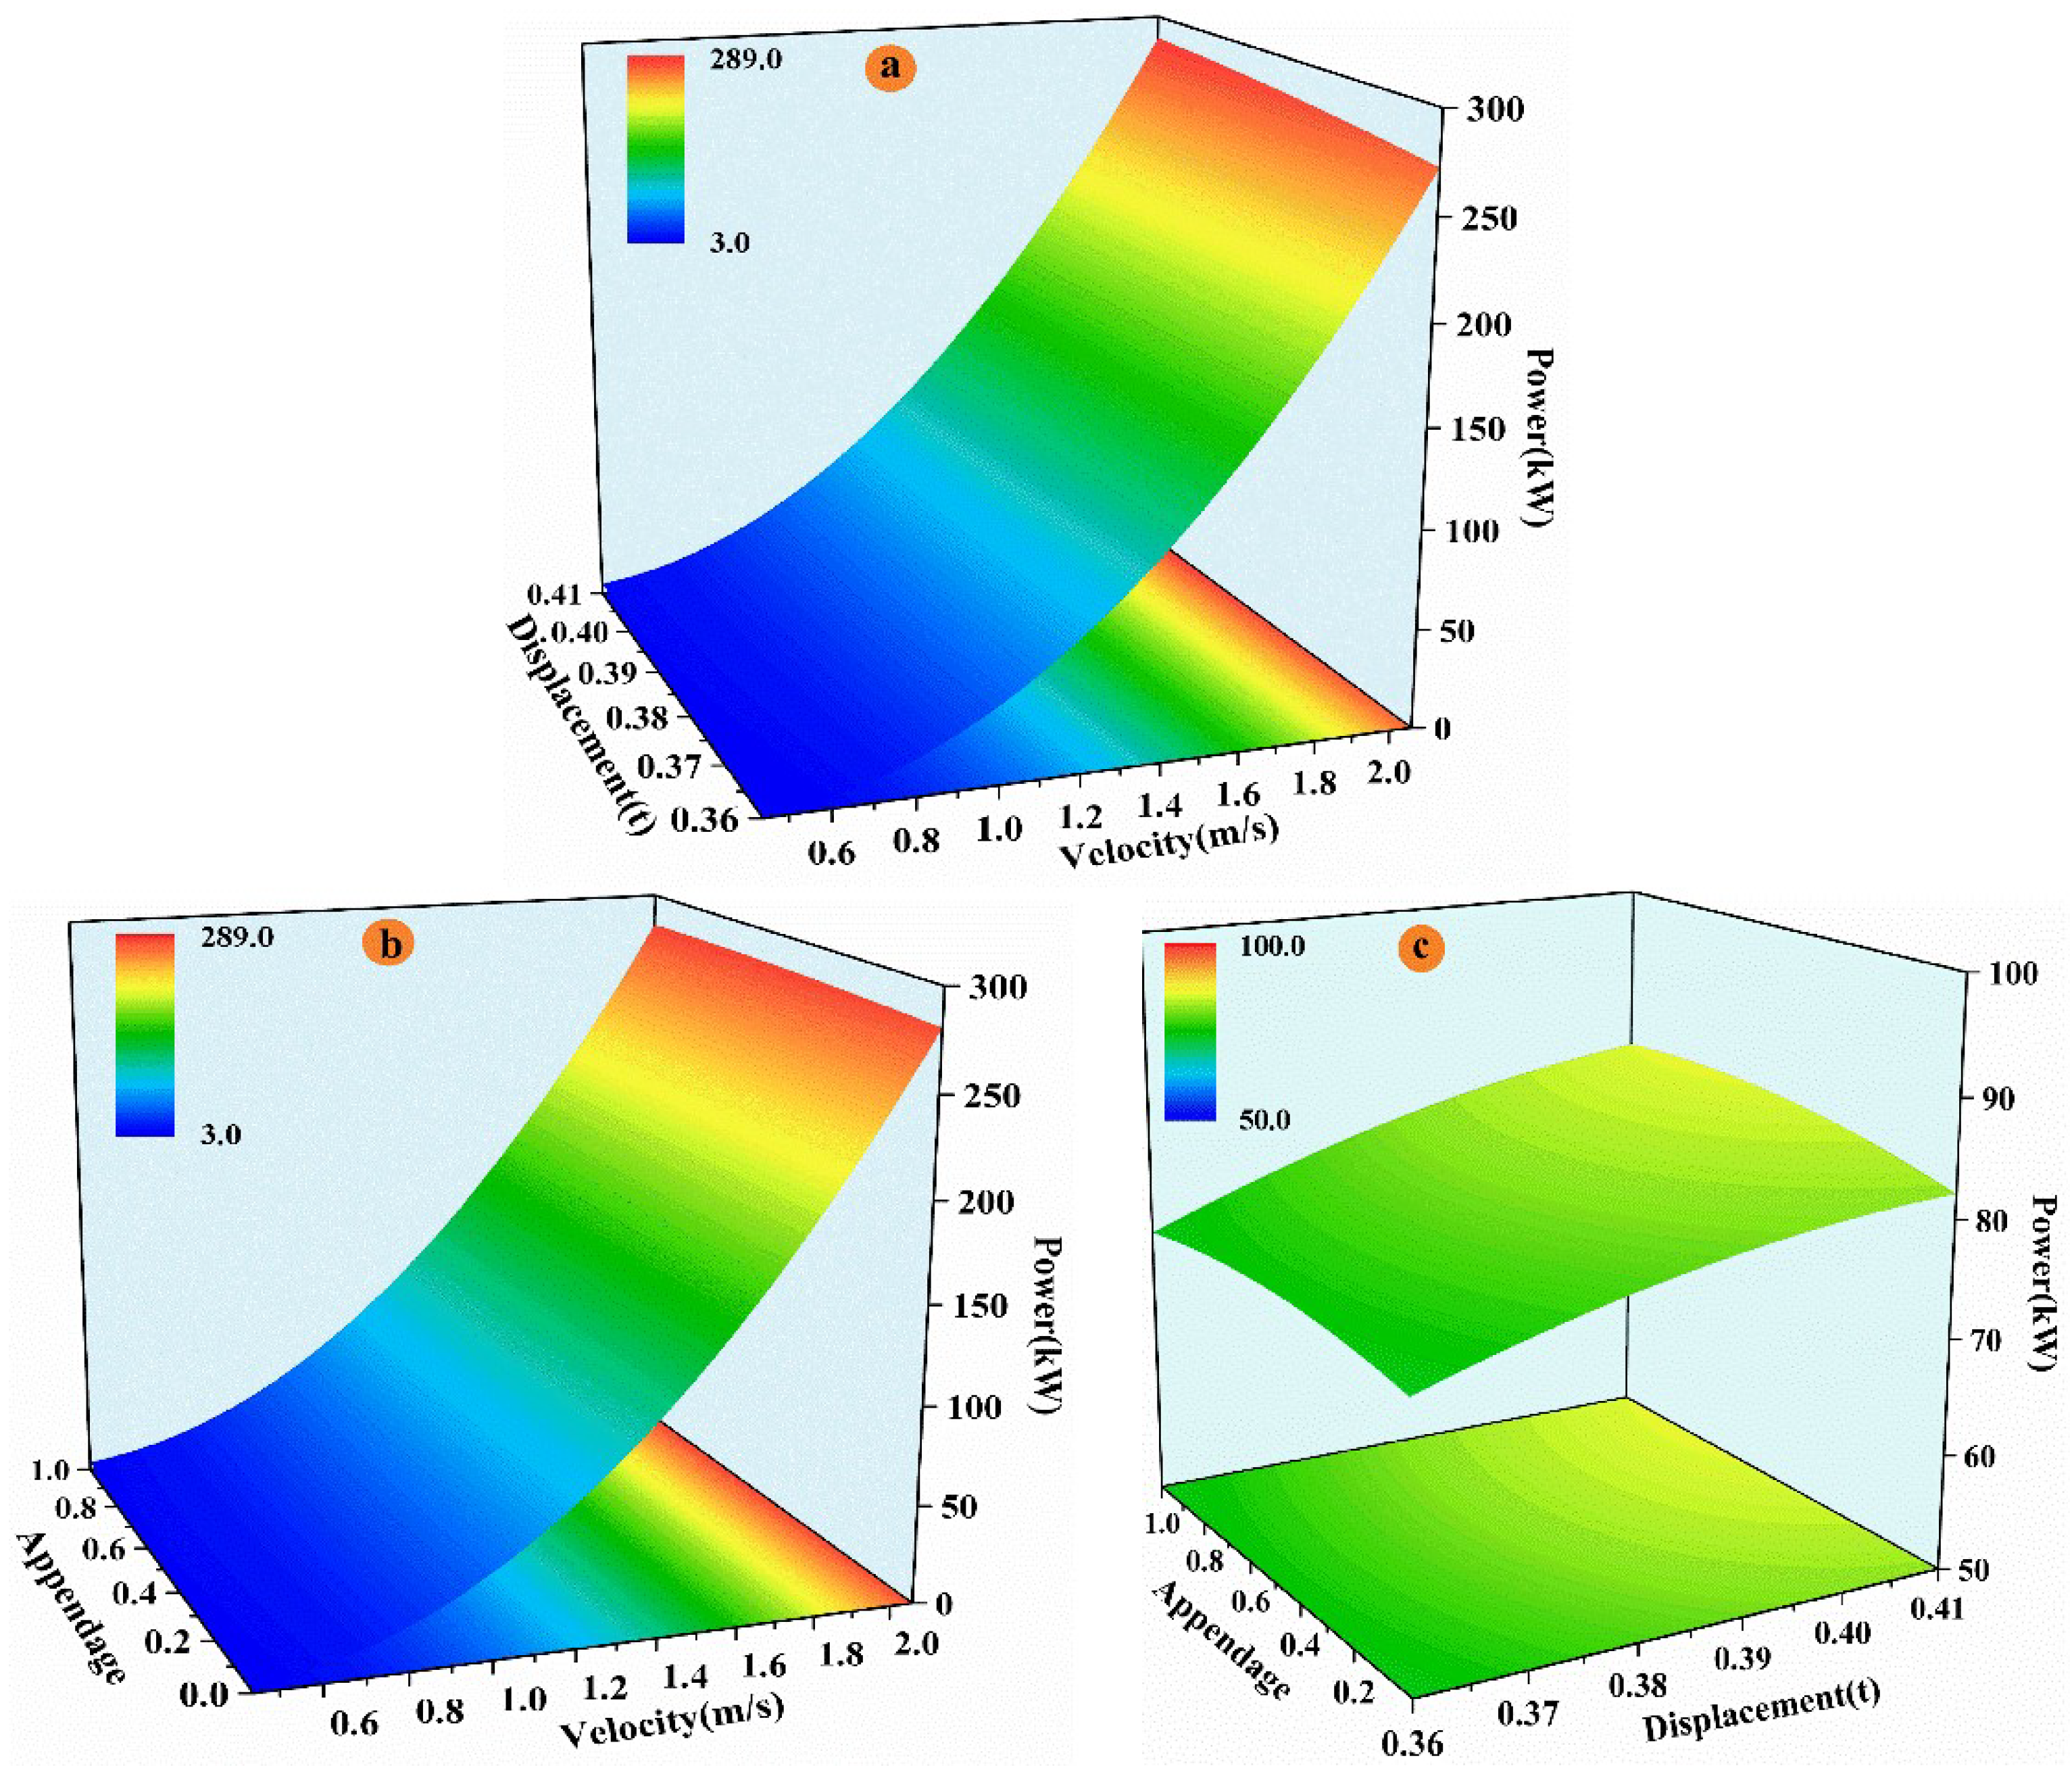
3.3. Response Surface Results Analysis

To further analyze how each factor affects the real ship power, the response graph based on two independent factors is shown in Figure 6 below. Figure 6a shows the response surface of the actual ship power when the ship model speed and displacement interact if the ship attachment value is 0.5. When the initial displacement is 0.36 t, the corresponding real ship power increases from 3.12 kW to 272.3 kW if the ship model speed increases from 0.44 m/s to 2.06 m/s. When the displacement is 0.41 t, the actual ship power increases from 5.56 kW to 288.42 kW. It can be seen that the increase in displacement will lead to the increase in real ship power under the same speed condition. When the speed is 0.44 m/s, the real ship power increases from 3.12 kW to 5.56 kW with the increase in displacement (from 0.36 t to 0.41 t). The corresponding real ship power is increased from 272.3 kW to 288.42 kW when the model speed is 2.06 m/s. The data analysis results show that the speed has a more obvious impact on the real ship power compared with the displacement. The higher the speed, the more obvious the increase in the actual ship power, which means the higher the power requirements of the ship. But, the change in displacement has no significant impact on the real ship power.
Figure 6b shows the coupling effects of ship appendages and speed on actual ship power when the displacement is 0.385 t. When the vessel is not equipped with appendages, the increase in ship model speed from 0.44 m/s to 2.06 m/s results in an increase in actual ship power from 3.2 kW to 280.81 kW. When the ship is equipped with all of the appendages, the corresponding actual ship power increases from 4.28 kW to 283.83 kW. When the speed is 0.44 m/s, the ship is equipped with no appendages to all appendages, which increases the actual ship power from 3.2 kW to 4.28 kW. When the speed is 2.06 m/s, the corresponding actual ship power increases from 280.81 kW to 283.83 kW. It can be seen from the data results that the speed is significantly greater than the ship appendages in terms of the influence degree on the actual ship power. In the selection of ship power equipment, speed is still a very important reference factor. In contrast, changes in ship appendages do not cause large fluctuations in actual ship power.
Figure 6c shows the coupling effects of ship appendages and displacement on actual ship power when the ship model speed is 1.25 m/s. When the vessel is not equipped with an appendage, an increase in displacement from 0.36 t to 0.41 t results in an increase in actual ship power from 73.52 kW to 82.17 kW. When the ship is equipped with full appendages, the corresponding actual ship power increases from 73.63 kW to 85.52 kW. If the displacement is 0.36 t, the ship is equipped with no appendages to all appendages, which increases the actual ship power from 73.52 kW to 73.63 kW. If the displacement is 0.41 t, the corresponding actual ship power increases from 82.17 kW to 85.52 kW. The analysis of the data results shows that the increase in ship appendages and the change in displacement do not lead to a large fluctuation in the actual ship power. With the increase of the two, the real ship power shows a slow change trend. The conclusion shows that appendages and displacement are the secondary factors of power equipment selection. But, the influence of displacement on the power weight of an actual ship is greater than that of appendages.

4. Conclusions

The ship resistance test plays a very important role in ship design, which mainly involves the selection of the ship’s power equipment. Therefore, it is of great significance to determine the size of ship resistance and its influencing factors and then analyze the change in actual ship power. Based on the standard ship resistance experimental test data, the influence of various factors on ship resistance and the effect of multiple factors on the power data of a real ship under the condition of coexistence are studied in the paper. The conclusions are as follows:
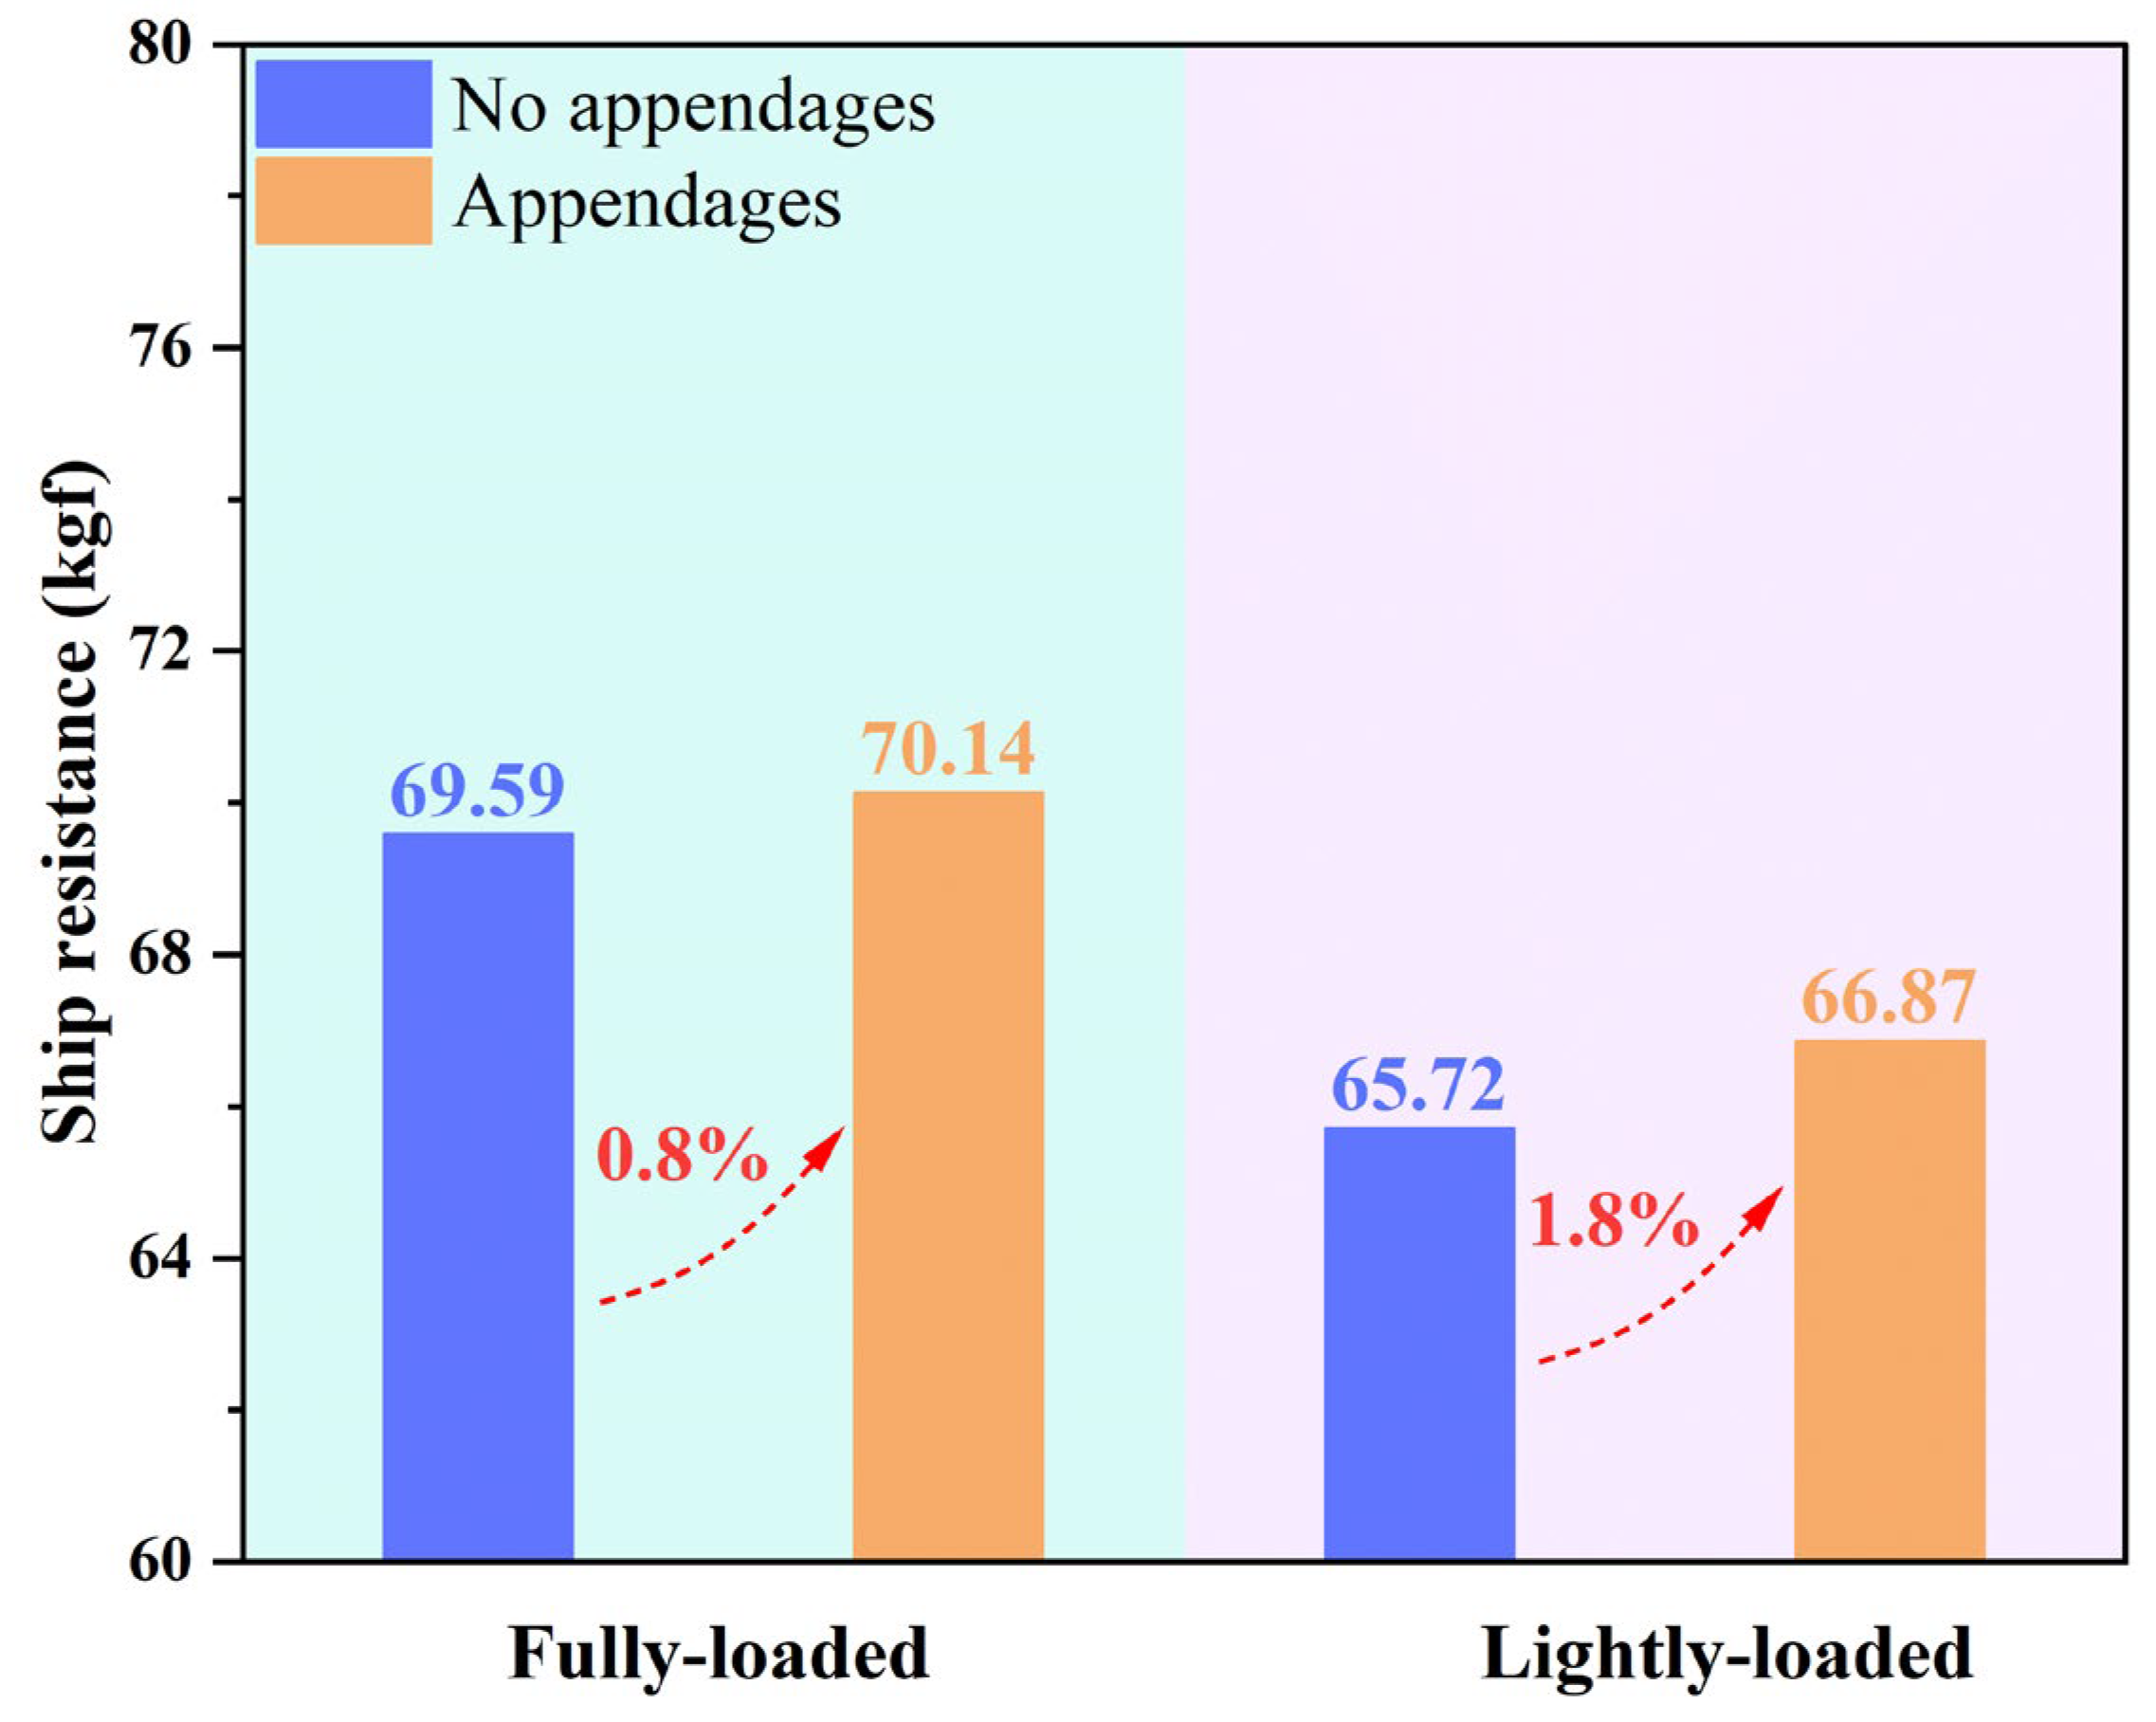
  • There is a significant positive correlation between ship resistance and speed, which conforms to the exponential equation change law. The ship resistance also gradually increases with increasing speed. Ship speed, displacement, and appendages can all have impacts on ship resistance, in which speed is the most important factor, and displacement has a greater impact than ship appendages.
  • According to the correlation analysis, the maximum correlation coefficient between ship speed and resistance or power is 0.99. The correlation between displacement and ship resistance or power is much greater than that of appendages. The correlation analysis further proves the degree of influence of each factor on ship resistance.
  • Actual ship power and speed, displacement, and appendage form a quadratic polynomial relationship. The multi-factor interaction analysis results show that speed and displacement have the greatest influence on actual ship power. The main reference factors in the selection of marine power equipment are speed and displacement.

Author Contributions

Conceptualization, X.Z. and X.L.; methodology, X.Z.; software, N.L.; validation, X.L.; formal analysis, X.L.; investigation, X.Z.; resources, X.Z.; data curation, N.L.; writing—original draft preparation, X.Z.; writing—review and editing, B.Z.; visualization, N.L.; supervision, X.L.; project administration, X.Z.; funding acquisition, X.Z. All authors have read and agreed to the published version of the manuscript.

Funding

This research was funded by the Qingdao Marine Science and Technology Center, grant number 2022QNLM030002-2.

Institutional Review Board Statement

Not applicable.

Informed Consent Statement

Not applicable.

Data Availability Statement

The research data have been presented in the current paper.

Acknowledgments

All authors would like to express sincere thanks to the editor and reviewers for their valuable comments.

Conflicts of Interest

The authors declare no conflict of interest.

References

  1. Yu, J.; Kim, S.; Jeong, W.; Kim, Y.; Choi, J.; Lee, N. Prediction of resistance and propulsion performances using calm-water and resistance tests in regular head waves of a 1800 TEU container ship. Int. J. Nav. Archit. Ocean Eng. 2022, 14, 100458. [Google Scholar] [CrossRef]
  2. IMO. Strategy on Reduction of GHG Emissions from Ships; MEPC.304(72); IMO: London, UK, 2018. [Google Scholar]
  3. IMO. Guidelines on the Method of Calculation of the Attained Energy Efficiency Existing Ship Index (EEXI); MEPC.333(76); IMO: London, UK, 2021. [Google Scholar]
  4. IPCC. Climate Change 2022: Mitigation of Climate Change; Contribution of Working Group III to the Sixth Assessment Report of the Intergovernmental Panel on Climate Change; Cambridge University Press: Cambridge, UK; New York, NY, USA, 2022. [Google Scholar]
  5. Kim, Y.; Steen, S.; Kramel, D.; Muri, H.; Strømman, A. Modelling of ship resistance and power consumption for the global fleet: The MariTEAM model. Ocean Eng. 2023, 281, 114758. [Google Scholar] [CrossRef]
  6. Samuel; Trimulyono, A.; Manik, P.; Chrismianto, D. A Numerical Study of Spray Strips Analysis on Fridsma Hull Form. Fluids 2021, 6, 420. [Google Scholar] [CrossRef]
  7. Trimulyono, A.; Hakim, M.L.; Ardhan, C.; Ahmad, S.T.P.; Tuswan, T.; Santosa, A.W.B. Analysis of the double steps position effect on planing hull performances. Brodogradnja 2023, 74, 41–72. [Google Scholar] [CrossRef]
  8. Ravenna, R.; Song, S.; Shi, W.; Sant, T.; Muscat-Fenech, C.; Tezdogan, T.; Demirel, Y. CFD analysis of the effect of heterogeneous hull roughness on ship resistance. Ocean Eng. 2022, 258, 111733. [Google Scholar] [CrossRef]
  9. Song, S.; Kim, D.; Demirel, Y.; Yang, J. An advanced prediction method of ship resistance with heterogeneous hull roughness. Ocean Eng. 2023, 279, 114602. [Google Scholar] [CrossRef]
  10. Song, S.; Terziev, M.; Tezdogan, T.; Demirel, Y.; Muscat-Fenech, C.; Incecik, A. Investigating roughness effects on ship resistance in shallow waters. Ocean Eng. 2023, 270, 113643. [Google Scholar] [CrossRef]
  11. Terziev, M.; Tezdogan, T.; Incecik, A. A geosim analysis of ship resistance decomposition and scale effects with the aid of CFD. Appl. Ocean Res. 2019, 92, 101930. [Google Scholar] [CrossRef]
  12. Liu, S.; Papanikolaou, A. Improvement of the prediction of the added resistance in waves of ships with extreme main dimensional ratios through numerical experiments. Ocean Eng. 2023, 273, 113963. [Google Scholar] [CrossRef]
  13. Bilgili, L. Determination of the weights of external conditions for ship resistance. Ocean Eng. 2023, 276, 114141. [Google Scholar] [CrossRef]
  14. Mittendorf, M.; Nielsen, U.; Bingham, H. Data-driven prediction of added-wave resistance on ships in oblique waves—A comparison between tree-based ensemble methods and artificial neural networks. Appl. Ocean Res. 2022, 118, 102964. [Google Scholar] [CrossRef]
  15. Le, T.; Vu, M.; Bich, V.; Phuong, N.; Ha, N.; Chuan, T.; Tu, T. Numerical investigation on the effect of trim on ship resistance by RANSE method. Appl. Ocean Res. 2021, 111, 102642. [Google Scholar] [CrossRef]
  16. Campbell, R.; Terziev, M.; Tezdogan, T.; Incecik, A. Computational fluid dynamics predictions of draught and trim variations on ship resistance in confined waters. Appl. Ocean Res. 2022, 126, 103301. [Google Scholar] [CrossRef]
  17. Zou, Y.; Zhou, X.; Chen, L.; Xi, X. Impacts of different characteristics of marine biofouling on ship resistance. Ocean Eng. 2023, 278, 114415. [Google Scholar] [CrossRef]
  18. Farkas, A.; Degiuli, N.; Martić, I. An investigation into the effect of hard fouling on the ship resistance using CFD. Appl. Ocean Res. 2020, 100, 102205. [Google Scholar] [CrossRef]
  19. García, S.; Trueba, A.; Boullosa-Falces, D.; Islam, H.; Soares, C. Predicting ship frictional resistance due to biofouling using Reynolds-averaged Navier-Stokes simulations. Appl. Ocean Res. 2020, 101, 102203. [Google Scholar] [CrossRef]
  20. Jeong, S.; Choi, K.; Kang, K.; Ha, J. Prediction of ship resistance in level ice based on empirical approach. Int. J. Nav. Archit. Ocean Eng. 2017, 9, 613–623. [Google Scholar] [CrossRef]
  21. Guo, W.; Zhao, Q.; Tian, Y.; Zhang, W. Research on total resistance of ice-going ship for different floe ice distributions based on virtual mass method. Int. J. Nav. Archit. Ocean Eng. 2020, 12, 957–966. [Google Scholar] [CrossRef]
  22. Yang, B.; Sun, Z.; Zhang, G.; Wang, Q.; Zong, Z.; Li, Z. Numerical estimation of ship resistance in broken ice and investigation on the effect of floe geometry. Mar. Struct. 2021, 75, 102867. [Google Scholar] [CrossRef]
  23. Huang, L.; Li, Z.; Ryan, C.; Ringsberg, J.; Pena, B.; Li, M.; Ding, L.; Thomas, G. Ship resistance when operating in floating ice floes: Derivation, validation, and application of an empirical equation. Mar. Struct. 2021, 79, 103057. [Google Scholar] [CrossRef]
  24. Liu, T.; Lin, B.; Zhen, C.; Zou, Q.; Zhu, C.; Yan, F. Influence of coupled effect among flaw parameters on strength characteristic of precracked specimen: Application of response surface methodology and fractal method. J. Nat. Gas Sci. Eng. 2015, 26, 857–866. [Google Scholar] [CrossRef]
  25. Sodeifian, G.; Azizi, J.; Ghoreishi, S. Response surface optimization of Smyrnium cordifolium Boiss (SCB) oil extraction via supercritical carbon dioxide. J. Supercrit. Fluids 2014, 95, 1–7. [Google Scholar] [CrossRef]
  26. Kirmizakis, P.; Tsamoutsoglou, C.; Kayan, B.; Kalderis, D. Subcritical water treatment of landfill leachate: Application of response surface methodology. J. Environ. Manag. 2014, 146, 9–15. [Google Scholar] [CrossRef]
Figure 1. Diagram of ship resistance test equipment.
Applsci 13 13073 g001
Figure 2. The variation trend between speed and ship resistance under four working conditions.
Applsci 13 13073 g002
Figure 3. Comparison of ship resistance between fully loaded and lightly loaded at maximum speed.
Applsci 13 13073 g003
Figure 4. Correlation analysis of influential factors for ship resistance (a) When the ship model’s speed is constant, the correlation coefficients between the other four factors; (b) When the displacement of the ship model is constant, the correlation coefficients between the other four factors.
Applsci 13 13073 g004
Figure 5. (a) Analysis of normality. (b) Comparison of predicted and measured values.
Applsci 13 13073 g005
Figure 6. Actual ship power response surface under two-factor condition. (a) Coupled effects of displacement and ship speed on power (b) Coupled effects of appendage and ship speed on power (c) Coupled effects of displacement and appendage on power.
Applsci 13 13073 g006
Table 1. The main dimensions and main elements of the actual ship and the ship model.
ParameterUnitLightly LoadedFully Loaded
Model ShipActual ShipModel ShipActual Ship
Waterline lengthm3.7435 45.75 3.7571 45.92
Length between perpendicularsm3.5182 43.00 3.5182 43.00
Waterline breadthm0.6709 8.20 0.6709 8.20
Draftm0.2250 2.75 0.2536 3.10
Displacementt0.3687 694.20 0.4150 781.25
Surface block coefficient--0.6949 0.6949 0.6937 0.6937
Propeller diameterm0.20462.50.20462.5
Scale ratiom12.2222
Power of the main enginekW900
Speed of rotationrpm232
Table 2. The speed range of the test.
Speed of Actual Ship
(Kn)
Speed of Ship Model
(m/s)
ReSpeed of Actual Ship
(Kn)
Speed of Ship Model
(m/s)
Re
3.00.44151.34 × 10610.01.47154.48 × 106
4.00.58861.79 × 10611.01.61874.93 × 106
5.00.73582.24 × 10611.51.69225.15 × 106
6.00.88292.67 × 10612.01.76585.37 × 106
7.01.03013.13 × 10612.51.83945.6 × 106
8.01.17723.58 × 10613.01.91305.82 × 106
9.01.32444.03 × 10614.02.06016.27 × 106
Table 3. Coded levels and range of independent variables.
LevelVelocity
(m/s) (x)
Displacement (t)
(y)
Appendage
(z)
−10.440.360
01.250.3850.5
12.060.411
Table 4. Analysis of variance of the regression model.
SourceDegrees of FreedomF Valuep Value Prob > F
Model998.53<0.0001
x1242.97<0.0001
y133.250.0007
z119.40.003
xy14.510.031
xz1150.0047
yz142<0.0001
x2125.260.001
y2118.90.0043
z219.150.034
R2 = 0.9819, R2adj = 0.9494, R2pred = 0.9159, Adequate Precision = 94.03
Disclaimer/Publisher’s Note: The statements, opinions and data contained in all publications are solely those of the individual author(s) and contributor(s) and not of MDPI and/or the editor(s). MDPI and/or the editor(s) disclaim responsibility for any injury to people or property resulting from any ideas, methods, instructions or products referred to in the content.

