
A New Disruptive Technology for Zero-Brine Discharge: Towards a Paradigm Shift


Abstract
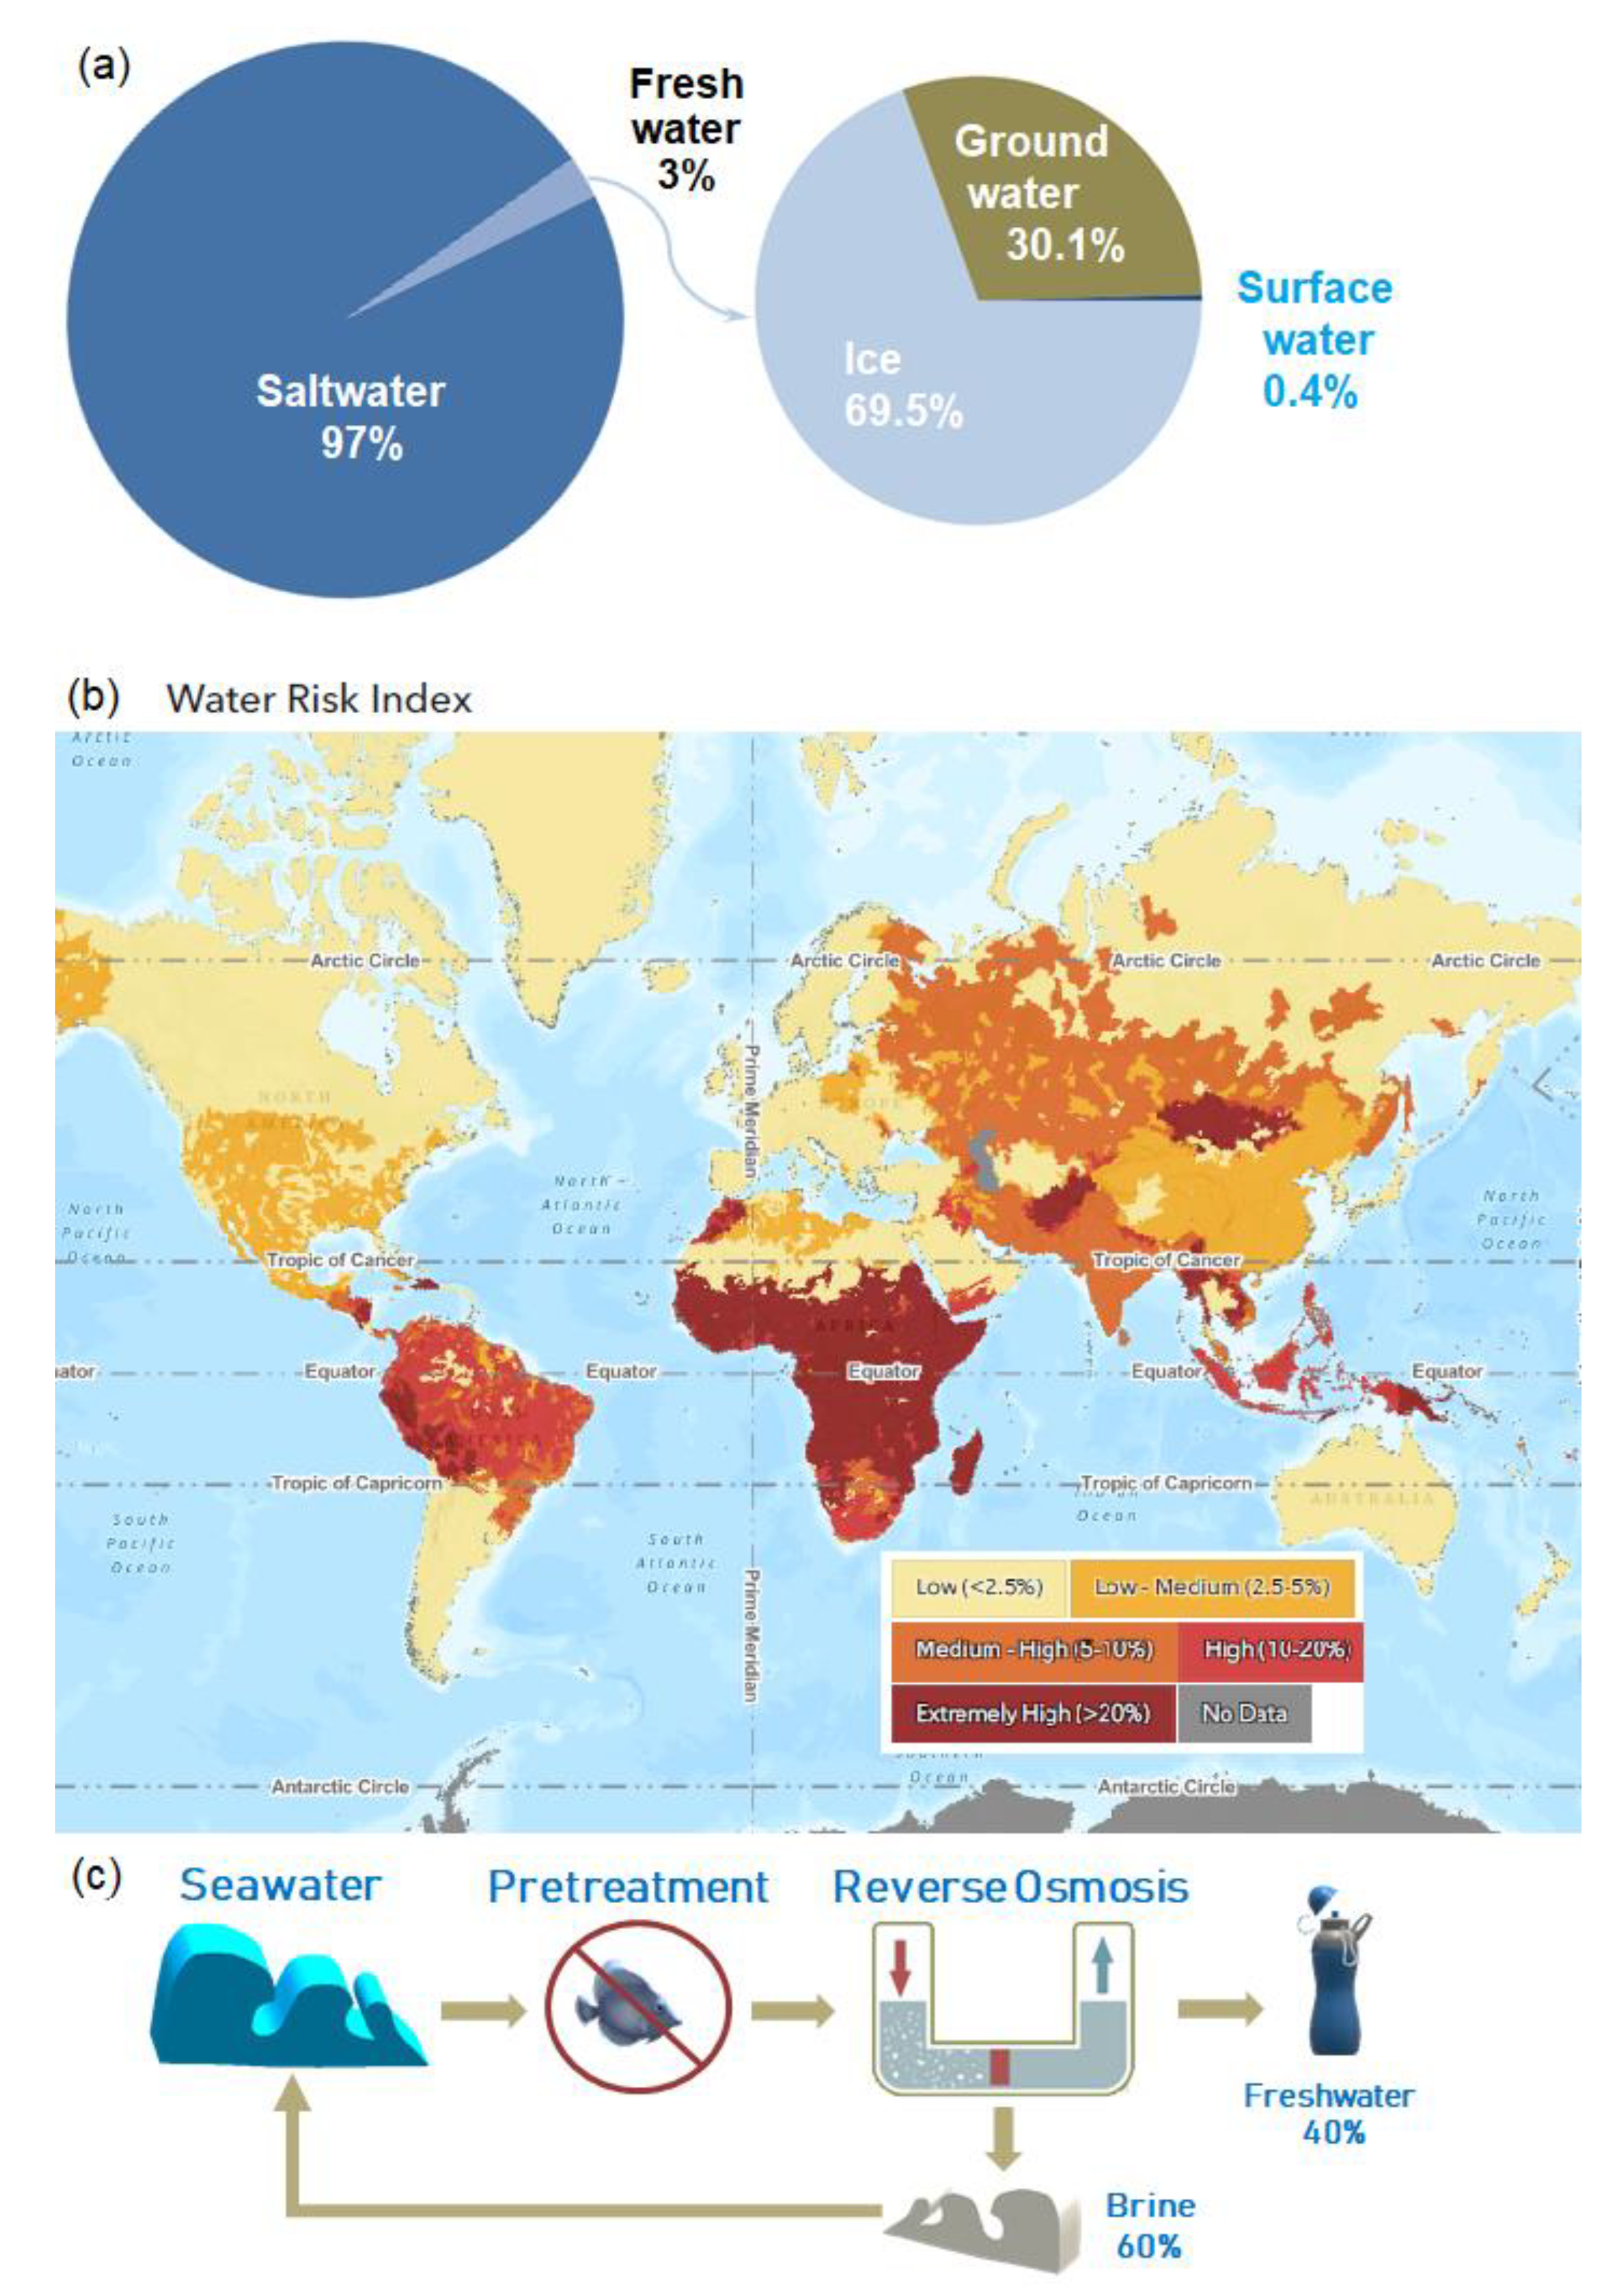
:1. Introduction
2. Materials and Methods
2.1. ASE&C Technology
2.2. Seawater Treatment
2.3. Analytical Procedures
3. Results and Discussion
3.1. Seawater Treatment Results
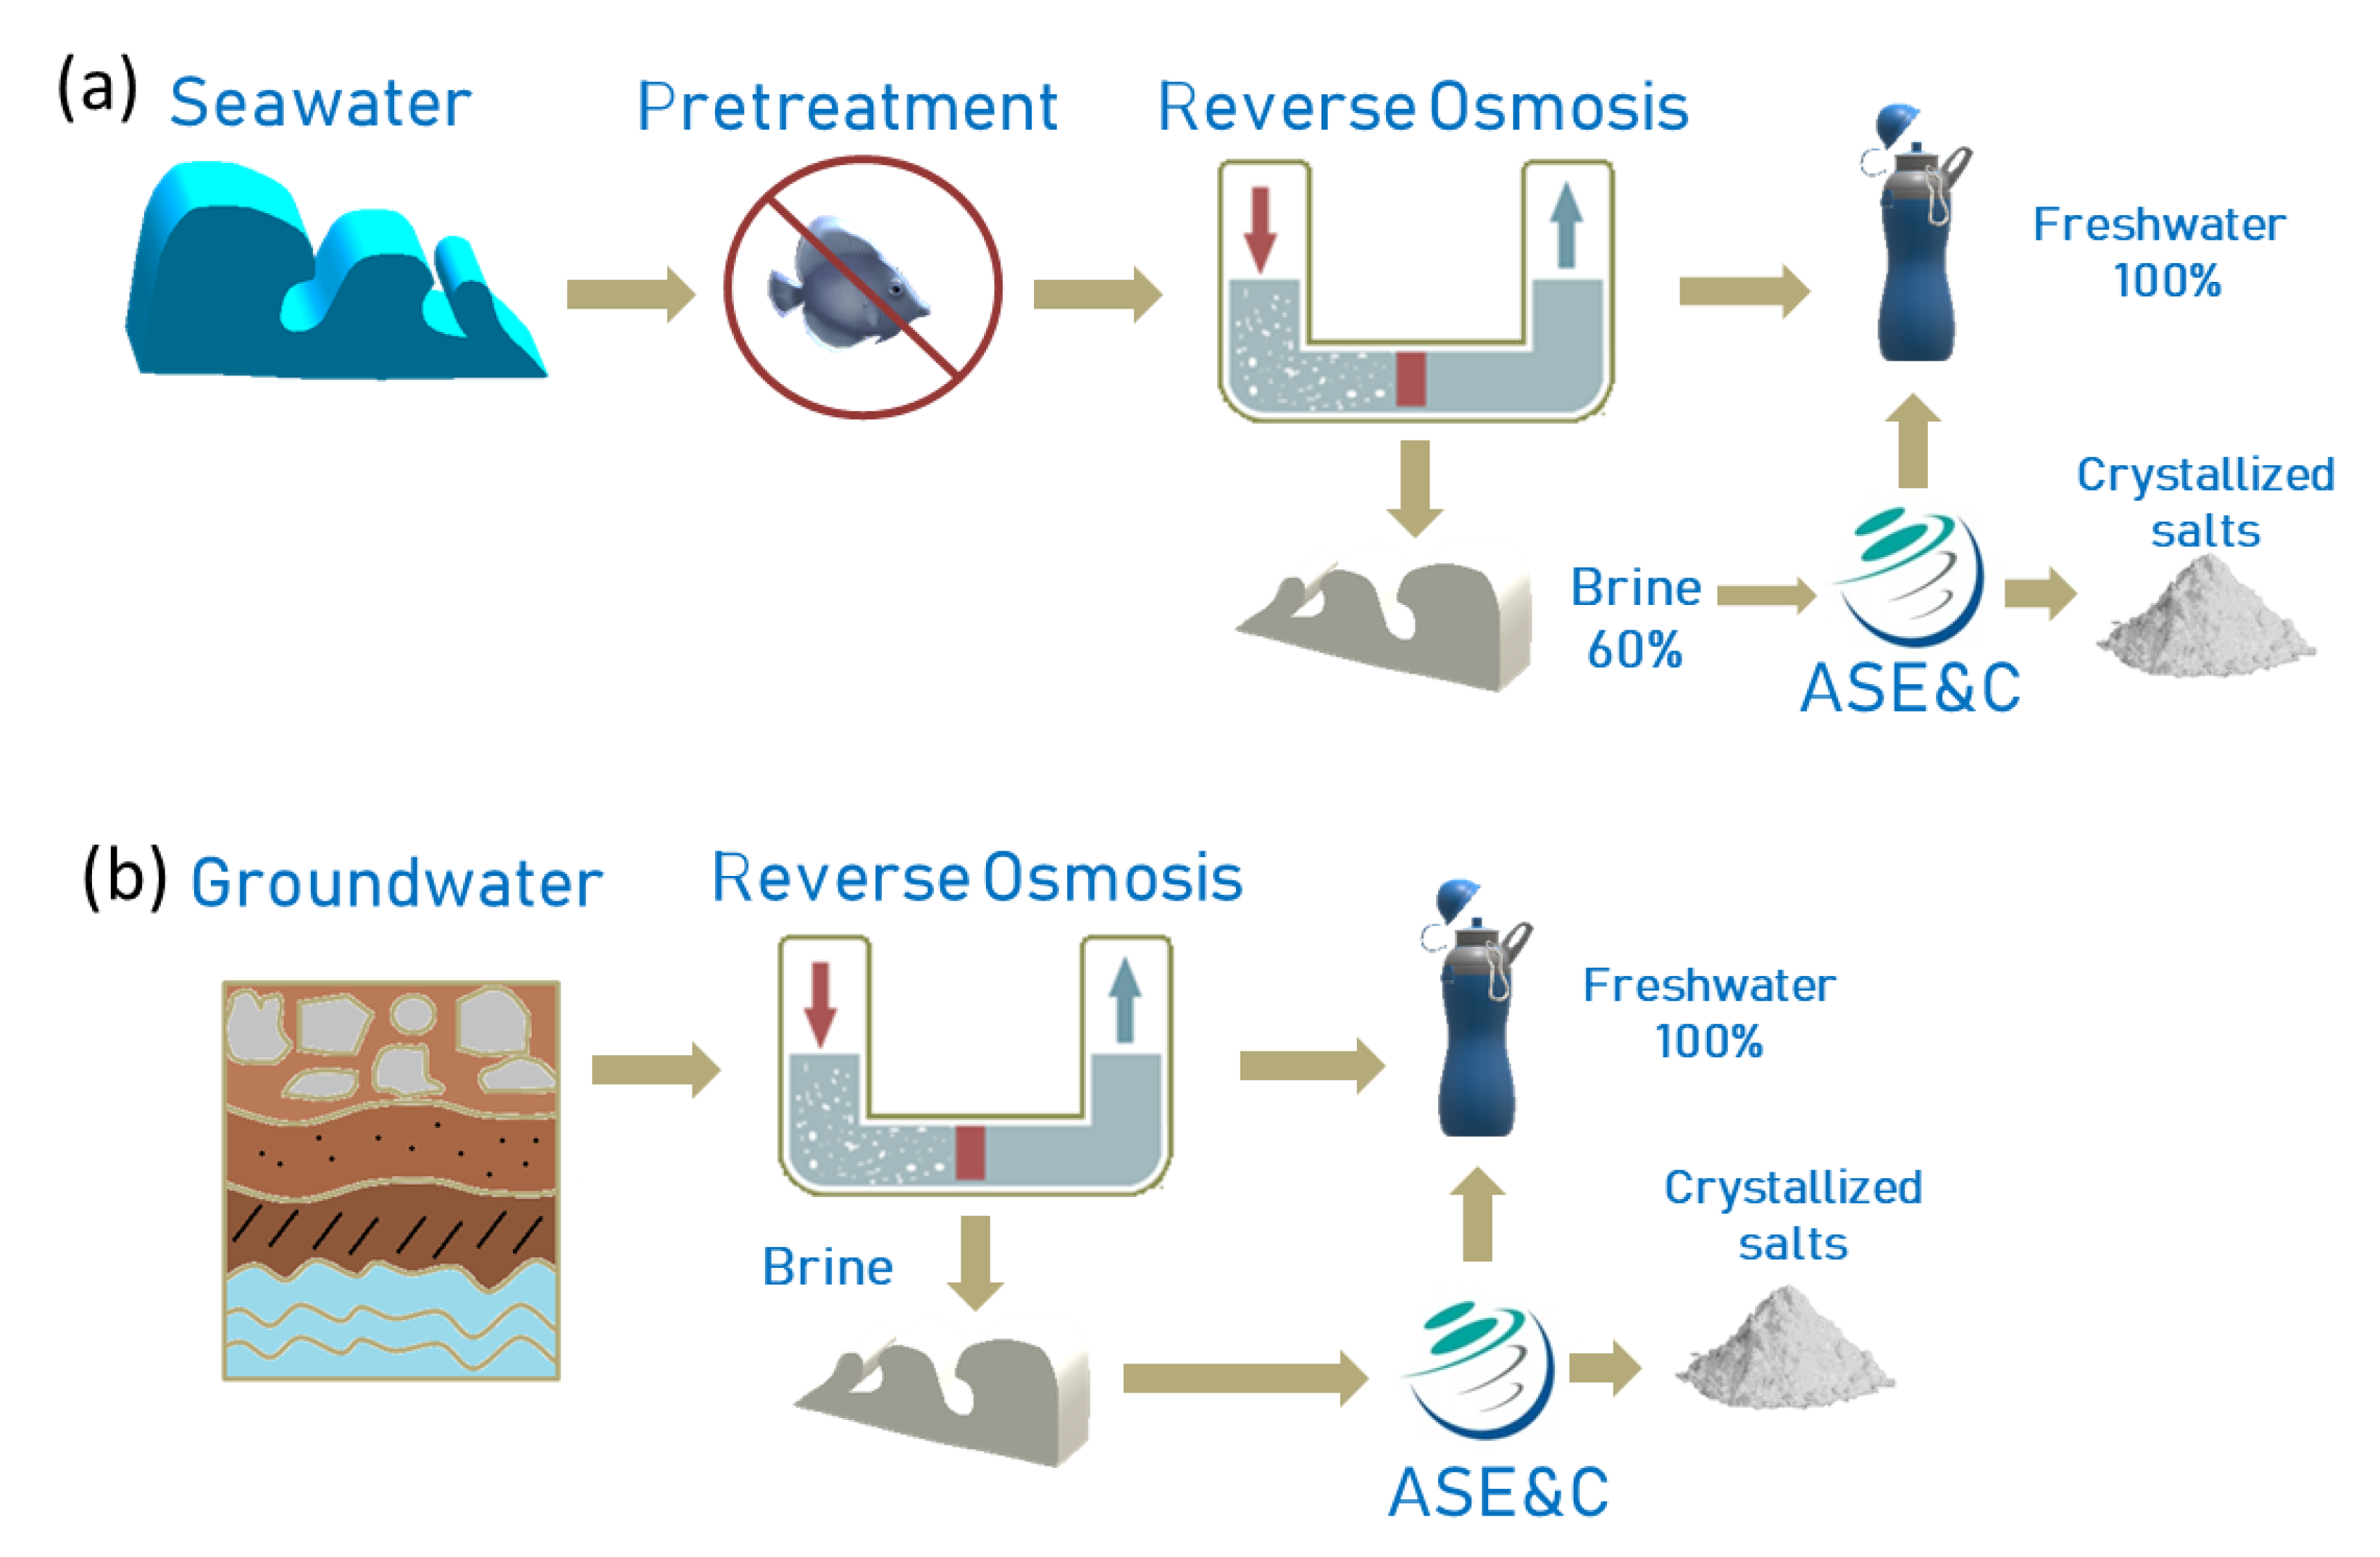
3.2. ASE&C Technology Coupled with RO
3.3. ASE&C Technology Competitive Advantages
- (i)
- (ii)
- It is an energetically versatile low-cost technology (0–20 kWh/ m3) when coupled to solar thermal energy, photovoltaic, residual heat, biomass, etc., considering that it requires electricity or heat for the operation.
- (iii)
- The final two potential commercial byproducts (clean freshwater and commercial crystallized salts) could offset operational costs as a promising secondary source. It has been demonstrated that 100% distilled water can be produced from contaminated effluents. Volumes of 100 m3 per day were treated and tested under controlled conditions for several weeks, demonstrating the production of 100 m3/d distilled water (pilot plant). This is also scalable up to the treatment of 600 m3/d to recover the same amount of water (a 40-foot plant); however, it is scalable to higher volumes, as replicates of this approach will not have limits in their design. Regarding the production of dry conglomerates, it obtains 95–99% of the total solutes included in the original input fluid.
- (iv)
- The CO2 footprint of the ASEC&C technology is estimated at 0.2 tons (for production of 600 m3/d and 5 kWh/m3), so these emissions would be approximately null if using photovoltaic and thermo-solar panels as a source of energy. Thus, considering a consumption of 5 kWh of electric energy, it would emit 0.5 kg/CO2 eq m3.
- (v)
- This technology can be adapted to other fluid characteristics for a properly efficient process, and indeed has already been tested on some of them [16]. ASE&C is a portable module occupying 40 feet of container space and may be placed anywhere, but could also be designed as a full plant for higher volumes of fluid treatments.
- (vi)
- It complies with the legislation of the EU Water Framework Directive [31,32,33] and the UN Sustainable Development Goals (SDGs) to achieve good ecological status of water bodies. The ASE&C effluent produces distilled water that can be reused for different purposes, such as industrial processes and human consumption; it might be injected in wells to fill and purify aquifers; after remineralization, it is suitable for drinking; it is suitable for irrigation after mixture with aquifer water; and it could also be dumped in superficial water, achieving good ecological status.
4. Conclusions
Author Contributions
Funding
Institutional Review Board Statement
Informed Consent Statement
Data Availability Statement
Acknowledgments
Conflicts of Interest
References
- United Stated Geological Survey (USGS). The Distribution of Water on, in, and above the Earth. Water Science School. 2019. Available online: https://www.usgs.gov/media/images/distribution-water-and-above-earth#:~:text=About%2071%20percent%20of%20the,in%20you%20and%20your%20dog (accessed on 28 November 2022).
- UNESCO. “Water for People, Water for Life” United Nations World Water Development Report, Part II: A Look at the World’s Freshwater Resources; 2003; UNESDOC Digital Library, Call Number: hnd 551.48 UNE2003; 576p, ISBN 978-92-3-103881-5. ISSN1 92-3-103881-8. ISSN2 1-57181-628-3. Available online: www.unesco.org (accessed on 27 November 2023).
- Mekonnen, M.M.; Hoekstra, A.Y. Four billion people facing severe water scarcity. Sci. Adv. 2016, 2, e1500323. [Google Scholar] [CrossRef]
- Vörösmarty, C.; McIntyre, P.; Gessner, M.; Dudgeon, D.; Prusevich, A.; Green, P.; Glidden, S.; Bunn, S.E.; Sullivan, C.A.; Liermann, C.R.; et al. Global threats to human water security and river biodiversity. Nature 2010, 467, 555–561. [Google Scholar] [CrossRef]
- NASA/PennState. Earth in Future. Distribution of Water on the Earth´s Surface. Available online: https://www.e-education.psu.edu/earth103/node/701#:~:text=The%20distribution%20of%20water%20on,lakes%2C%20rivers%2C%20and%20swamps (accessed on 27 November 2023).
- National Geographic, MapMaker, Water Risk Index. 2023. Available online: https://www.arcgis.com/apps/instant/atlas/index.html?appid=0cd1cdee853c413a84bfe4b9a6931f0d&webmap=3871d636011b4101abfcbc75bef46802 (accessed on 27 November 2023).
- Hofste, R.; Kuzma, S.; Walker, S.; Sutanudjaja, E.H.; Bierkens, M.F.; Kuijper, M.J.; Sanchez, M.F.; Van Beek, R.; Wada, Y.; Rodríguez, S.G.; et al. Aqueduct 3.0: Updated Decision-Relevant Global Water Risk Indicators; Technical Note; World Resources Institute: Washington, DC, USA, 2019; Available online: https://www.wri.org/publication/aqueduct-30 (accessed on 27 November 2023).
- UNWWD. United Nations World Water Development Report. Valuing Water. 2021. Available online: https://unesdoc.unesco.org/ark:/48223/pf0000375751 (accessed on 28 November 2022).
- Jones, E.; Qadir, M.; van Vliet, M.T.H.; Smakhtin, V.; Kang, S.-M. The State of desalination and brine production: A global outlook. Sci. Total Environ. 2021, 657, 1343–1356. [Google Scholar] [CrossRef]
- Liyanaarachchi, S.; Shu, L.; Muthukumaran, S.; Jegatheesan, V.; Baskaran, K. Problems in seawater industrial desalination processes and potential sustainable solutions: A review. Rev. Environ. Sci. Biotechnol. 2014, 13, 203–214. [Google Scholar] [CrossRef]
- Cambridge, M.L.; Zavala-Perez, A.; Cawthray, G.R.; Statton, J.; Mondon, J.; Kendrick, G.A. Effects of desalination brine and seawater with the same elevated salinity on growth, physiology and seedling development of the seagrass Posidonia australis. Mar. Pollut. Bull. 2019, 140, 462–471. [Google Scholar] [CrossRef]
- Zapata-Sierra, A.; Cascajares, M.; Alcayde, A.; Manzano-Agugliaro, F. Worldwide research trends on desalination. Desalination 2021, 519, 115305. [Google Scholar] [CrossRef]
- Ihsanullah, I.; Atieh, M.A.; Sajid, M.; Nazal, M.K. Desalination and environment: A critical analysis of impacts, mitigation strategies, and greener desalination technologies. Sci. Total Environ. 2021, 780, 146585. [Google Scholar] [CrossRef]
- Person, M.A.; Sazeed, N. Continental Brackish Groundwater Resources. In Unconventional Water Resources; Qadir, M., Smakhtin, V., Koo-Oshima, S., Guenther, E., Eds.; Springer: Cham, Switzerland, 2022. [Google Scholar] [CrossRef]
- Aparicio, J.; Candela, L.; Alfranca, O.; García-Aróstegui, J.L. Economic evaluation of small desalination plants from brackish aquifers. Application to Campo de Cartagena (SE Spain). Desalination 2017, 411, 38–44. [Google Scholar] [CrossRef]
- Bonnail, E.; Vera, S.; Blasco, J.; Conradi, M.; DelValls, T.Á. Metal pollution and mining in the Iberian Pyrite Belt: New remediation technologies to improve the ecosystem services of the river basins. Water 2023, 15, 1302. [Google Scholar] [CrossRef]
- Bonnail, E.; Vera, S.; Blasco, J.; DelValls, T.Á. Towards a cleaner textile industry: The liquid residue treatment challenge. Water 2023. under review. [Google Scholar]
- ICMAN/CSIC. Scientific Report on ASEC Efficiency in the Purification of Contaminated Mining Waters; Technical Report; ICMAN/CSIC: Cádiz, Spain, 2022. [Google Scholar]
- ICMAN/CSIC. Scientific Report on ASEC Efficiency in the Purification of Swine Slurries; Technical Report; ICMAN/CSIC: Cádiz, Spain, 2022. [Google Scholar]
- ICMAN/CSIC. Scientific Report on ASEC Efficiency in the Purification of Contaminated Waters from Textile Industry; Technical Report; ICMAN/CSIC: Cádiz, Spain, 2022. [Google Scholar]
- Del Villar, A.; Melgarejo, J.; García-López, M.; Fernández-Aracil, P. The economic value of the extracted elements from brine concentrates of Spanish desalination plants. Desalination 2023, 560, 116678. [Google Scholar] [CrossRef]
- Mavukkanfy, M.; Chabib, C.M.; Mustafa, I.; Al Ghaferi, A. Brine management in desalination industry: From waste to resources generation. Desalination 2019, 472, 114187. [Google Scholar] [CrossRef]
- Panagopoulos, A.; Haralambous, K.-J.; Loizidou, M. Desalination brine disposal methods and treatment technologies—A review. Sci. Total Environ. 2019, 693, 133545. [Google Scholar] [CrossRef]
- Thys, A. Sustainability and impact aspects of exploitation of marine salt, magnesium and bromine. J. Coast. Res. 2003, 19, 912–918. [Google Scholar]
- Shahmansouri, A.; Min, J.; Jin, L.; Bellona, C. Feasibility of extracting valuable minerals from desalination concentrate: A comprehensive literature review. J. Clean. Prod. 2015, 100, 4–16. [Google Scholar] [CrossRef]
- DuChanois, R.M.; Cooper, N.J.; Lee, B.; Patel, S.K.; Mazurowski, L.; Graedel, T.E.; Elimelech, M. Prospects of metal recovery from wastewater and brine. Nat. Water 2023, 1, 37–46. [Google Scholar] [CrossRef]
- Sharma, S.K.; Truong, D.Q.; Guo, J.; An, A.K.; Naidu, G.; Deka, B.J. Recovery of rubidium from brine sources utilizing diverse separation technologies. Desalination 2023, 556, 116578. [Google Scholar] [CrossRef]
- Chen, W.-S.; Lee, C.-H.; Chung, Y.-F.; Tien, K.-W.; Chen, Y.-J.; Chen, Y.-A. Recovery of rubidium and cesium resources from brine of desalination through t-BAMBP Extraction. Metals 2020, 10, 607. [Google Scholar] [CrossRef]
- Xing, P.; Wang, C.; Chen, Y.; Ma, B. Rubidium extraction from mineral and brine resources: A review. Hydrometallurgy 2021, 203, 105644. [Google Scholar] [CrossRef]
- Zhao, X.; Yang, H.; Wang, Y.; Sha, Z. Review on the electrochemical extraction of lithium from seawater/brine. J. Electroanal. Chem. 2019, 850, 113389. [Google Scholar] [CrossRef]
- Directive 2000/60/EC of the European Parliament and of the Council of 23 October 2000 Establishing a Framework for Community Action in the Field of Water Policy. Available online: https://www.fao.org/faolex/results/details/en/c/LEX-FAOC023005/#:~:text=The%20purpose%20of%20this%20Directive,based%20on%20a%20long%2Dterm (accessed on 27 November 2023).
- Directive 2008/105/EC of the European Parliament and of the Council of 16 December 2008 on Environmental Quality Standards in the Field of Water Policy, Amending and Subsequently Repealing Council Directives 82/176/EEC, 83/513/EEC, 84/156/EEC, 84/491/EEC, 86/280/EEC and amending Directive 2000/60/EC of the European Parliament and of the Council. Available online: https://eur-lex.europa.eu/legal-content/EN/TXT/PDF/?uri=CELEX:02008L0105-20130913&from=PT (accessed on 27 November 2023).
- Directive 2013/39/EU of the European Parliament and the Council of 12 August 2013 Amending Directives 2000/60/EC and 2008/105/EC as Regards Priority Substances in the Field of Water Policy. Available online: https://eur-lex.europa.eu/LexUriServ/LexUriServ.do?uri=OJ:L:2013:226:0001:0017:en:PDF (accessed on 27 November 2023).
- SAMCOTECH. 2023. Available online: https://samcotech.com/how-is-brine-mining-used-for-lithium-recovery/ (accessed on 27 November 2023).
- Vera, M.L.; Torres, W.R.; Galli, C.I.; Chagnes, A.; Flexer, V. Environmental impact of direct lithium extraction from brines. Nat. Rev. Earth Environ. 2023, 4, 149–165. [Google Scholar] [CrossRef]
- Song, W.; Li, N.; Ding, S.; Wang, X.; Li, H.; Zhang, Y.; Feng, X.; Lu, J.; Ding, J. Nanofiltration desalination of reverse osmosis concentrate pretreated by advanced oxidation with ultrafiltration: Response surface optimization and exploration of membrane fouling. J. Environ. Chem. Eng. 2021, 9, 106340. [Google Scholar] [CrossRef]
- Cappelle, M.; Walker, W.S.; Davis, T.A. Improving desalination recovery using zero discharge desalination (ZDD): A process model for evaluating technical feasibility. Ind. Eng. Chem. Res. 2017, 56, 10448–10460. [Google Scholar] [CrossRef]


| Parameter | Input Sample (Seawater) | Output Sample (Distilled Water) | |
|---|---|---|---|
| Langelier Index | 0.79 | −5.85 | |
| EC | µS/cm | 53,327 | 142 |
| pH | 7.9 | 5.2 | |
| SS | mg/L | 10 | <3.0 |
| COD | mg/L | 1.1 | 0.6 |
| Bicarbonates | mg/L | 144.0 | <5.0 |
| Carbonates | mg/L | <0.2 | <0.2 |
| Nitrates | mg/L | <0.2 | <0.2 |
| Sulfates | mg/L | 2524 | <5.0 |
| K | mg/L | 403.7 | <2.0 |
| F | mg/L | 1.4 | <1.0 |
| Br | mg/L | <0.1 | <0.1 |
| Ca | mg/L | 421.2 | <2.0 |
| Mg | mg/L | 1318.4 | 3.1 |
| Na | mg/L | 11,009.8 | 16.9 |
| Cl | mg/L | 18,200 | 30.9 |
| B | mg/L | 5.03 | 0.55 |
| Microbiological Analysis | ||
| Clostridium perfringens | absence/25 g | n.d. |
| Listeria monocytogenes | c.f.u./g | <20 |
| Total coliforms | absence/g | n.d. |
| Intestinal enterococcus | absence/g | n.d. |
| Escherichia coli | absence/g | n.d. |
| Staphylococcus coagulase positives | absence/g | n.d |
| Mesophile aerobic microorganisms | c.f.u./g | <10 |
| Mold and leaven (25 °C) | c.f.u./g | <10 |
| Chemical analysis | ||
| Fe | mg/kg | 3.79 |
| Ca | % | 0.43 |
| Humidity | % | <1 |
| Insoluble residue | % | 1.0 |
| Sulfates | % | 4.80 |
| NaCl (over dried matter) | % | 85 |
| Mg (MgO) | % | 5.54 |
| B | mg/L | 81.2 |
| As | µg/kg | <25 |
| Cd | µg/kg | <10 |
| Zn | µg/kg | 10,178 |
| Co | µg/kg | <10 |
| Cu | µg/kg | 477 |
| Mn | µg/kg | 679 |
| Hg | µg/kg | <5 |
| Pb | µg/kg | 132 |
| K | mg/kg | 8187 |
| Brine A | Brine B | Brine C | ||||
|---|---|---|---|---|---|---|
| I | O | I | O | I | O | |
| EC (mS/cm) | 122,000 | 89 | 70,000 | 91 | 28,000 | 52 |
| Eh (mV) | 296 | 653 | 301 | 660 | 298 | 651 |
| TDS (mg/L) | 78,080 | 56 | 44,830 | 57 | 17,930 | 32 |
| Sulfates (mg/L) | 76,670 | <5 | 4860 | <5 | 3870 | <5 |
| Chlorides (mg/L) | 67,060 | <10 | 38,550 | <10 | 14,569 | <10 |
| Na (mg/L) | 35,990 | <10 | 20,650 | <10 | 6458 | <10 |
| Ca (mg/L) | 1830 | <10 | 1050 | <10 | 986 | <10 |
| Mg (mg/L) | 4880 | <10 | 2810 | <10 | 1860 | <10 |
| K (mg/L) | 1463 | <5 | 843 | <5 | 453 | <5 |
| Bicarbonates (mg/L) | 611 | <5 | 351 | <5 | 654 | <5 |
| Br (mg/L) | 416 | <0.1 | 240 | <0.1 | 44.8 | <0.1 |
| Ga (mg/L) | 650 | <0.01 | 589 | <0.01 | <0.01 | |
| Sr (mg/L) | 52 | <0.01 | 29 | <0.01 | 14.4 | <0.01 |
| Li (mg/L) | 2.7 | <0.01 | 1.6 | <0.01 | <0.01 | |
| B (mg/L) | 17 | <0.05 | 9.8 | <0.05 | <0.05 | |
| Rb (mg/L) | 0.52 | <0.01 | 0.28 | <0.01 | <0.01 | |
| Seawater | Brine A | Brine B | Brine C | |
|---|---|---|---|---|
| Na | 2692–8117 | 24.11–72.7 | 13.8–41.7 | 4.33–13.0 |
| Ca | 66–291 | 0.79–3.46 | 0.5–2.0 | 0.43–1.9 |
| Mg | 148 | 15.03 | 8.7 | 5.7 |
| Ga | 1104–11,340 | 1000–10,275 | ||
| Sr | 0.52–2.94 | 0.29–1.64 | 0.14–0.82 | |
| Li | 703–755 | 1.03–1.11 | 0.61–0.66 | |
| B | 22–28 | 0.013–0.02 | 7–9 | |
| Rb | 4.91–6.31 | 2642–3396 | ||
| Total (thousands of EUR) | 3631–9338 | 1150–11,441 | 1026–10,333 | 10.62–21.45 |
| Feature | RO | Evaporation | Crystallization | Evap + Cryst 2 Steps | ASEC |
|---|---|---|---|---|---|
| Water/solid separation | 45% | 80% | 80–100% | 90–100% | 100% |
| Energy consumption (kWh/m3) | 3–5 | 80 | 250–500 | 130–230 | 0–20 * |
| Use of chemicals | Yes | Yes | Yes | Yes | No |
| CAPEX (€/m3) | 700–2000 | 15,000 | 20,000–40,000 | 30,000 | 5000–15,000 |
| Environmental concerns | Brine discharges | Brine discharges | High CO2 emissions | Brine discharges | ZLD Low CO2-missions |
Disclaimer/Publisher’s Note: The statements, opinions and data contained in all publications are solely those of the individual author(s) and contributor(s) and not of MDPI and/or the editor(s). MDPI and/or the editor(s) disclaim responsibility for any injury to people or property resulting from any ideas, methods, instructions or products referred to in the content. |
© 2023 by the authors. Licensee MDPI, Basel, Switzerland. This article is an open access article distributed under the terms and conditions of the Creative Commons Attribution (CC BY) license (https://creativecommons.org/licenses/by/4.0/).
Share and Cite
Bonnail, E.; Vera, S.; DelValls, T.Á. A New Disruptive Technology for Zero-Brine Discharge: Towards a Paradigm Shift. Appl. Sci. 2023, 13, 13092. https://doi.org/10.3390/app132413092
Bonnail E, Vera S, DelValls TÁ. A New Disruptive Technology for Zero-Brine Discharge: Towards a Paradigm Shift. Applied Sciences. 2023; 13(24):13092. https://doi.org/10.3390/app132413092
Chicago/Turabian StyleBonnail, Estefanía, Sebastián Vera, and T. Ángel DelValls. 2023. "A New Disruptive Technology for Zero-Brine Discharge: Towards a Paradigm Shift" Applied Sciences 13, no. 24: 13092. https://doi.org/10.3390/app132413092
APA StyleBonnail, E., Vera, S., & DelValls, T. Á. (2023). A New Disruptive Technology for Zero-Brine Discharge: Towards a Paradigm Shift. Applied Sciences, 13(24), 13092. https://doi.org/10.3390/app132413092