Article

Radiometric, Mechanical and Agronomic Characterization of Four Commercial Polymeric Films for Greenhouse Applications

by
John Eloy Franco
1,
Jesus Antonio Rodríguez-Arroyo
2,
Rafael Jiménez-Lao
3,
Eduardo Garzón
3 and
María Teresa Lao
2,*
1
Faculty of Technical Education for Development, Catholic University of Santiago de Guayaquil, Av. C. J. Arosemena Km. 1.5, Guayaquil 09014671, Ecuador
2
Agronomy Department, Research Center for Mediterranean Intensive Agrosystems and Agri-Food Biotechnology CIAMBITAL, Agrifood Campus of International Excellence ceiA3, University of Almeria, 04120 Almeria, Spain
3
Department of Engineering, University of Almería, La Cañada de San Urbano s/n, 04120 Almeria, Spain
*
Author to whom correspondence should be addressed.
Appl. Sci. 2023, 13(24), 13098; https://doi.org/10.3390/app132413098
Submission received: 2 November 2023 / Revised: 30 November 2023 / Accepted: 4 December 2023 / Published: 8 December 2023
(This article belongs to the Special Issue Construction Materials: Characterization, Structure and Durability)

Abstract

:
The objective of this work was the study of four experimental plastic covers (EPCs) to assess the improvement in microclimatic conditions inside a greenhouse. This experiment was based on the comparison of four trilayer plastics: blue, grey, yellow and colorless ECPs. Radiometric and mechanical properties were studied along with the films’ behavior under semi-field conditions through their microclimate parameters. The results show that the addition of the blue pigment causes a considerable reduction in transmission (32.04%) with a reduction in the maximum temperature (+9.8 °C) compared to the other films (14% for grey, 52% for yellow and 46% for colorless). The anti-thermal additive used in the grey EPC did not achieve the desired effect, since it reduced both the photosynthetic active radiation (PAR) (62.33%) and near-infrared radiation (NIR) (62.83%) transmission equally. None of the EPCs achieved a PAR/NIR ratio greater than 1 (0.52 for blue, 0.99 for grey, 0.98 for yellow and 0.99 for colorless). Hindered amine light stabilizers (HALSs) photo-stabilizing additives block UV-A radiation (36.85 for grey) more efficiently compared to nickel quenchers (38.64 for yellow), as they allow earlier PAR transmission. The tensile test showed that all the EPCs manifested a linear relationship between stress and deformation, which defines Young’s modulus.

1. Introduction

Greenhouse covers constitute one of the main climate modifiers to improve the environments for crops, adjusting such things as solar radiation, temperature and humidity [1]. Nowadays, a large part of intensive agriculture models has been developed within the so-called “agriculture under plastic”, which has allowed a significant increase in the productive yield and quality of horticultural and ornamental crops [2], especially those located in tropical and subtropical regions and those located in regions characterized by mild climates, such as southern Europe. Nevertheless, the diversity of climates throughout the world and the specific requirements of each crop [3] has meant that the plastics industry has had to develop a multitude of different covers that meet the required needs [4]. An advantage associated with the use of high-tech plastics is the saving of water and energy used in cooling systems, therefore generating a more sustainable production model.
The diversity of materials used in the composition of a plastic cover modifies its spectral properties, such as the transmittance patterns along the electromagnetic spectrum [5], which have an impact on agronomic behavior [6]. Examples include: (a) a reduction in the temperature inside a greenhouse due to the natural heating produced by solar radiation, which is caused by blocking near-infrared radiation (NIR); (b) blocking part of the ultraviolet (UV) radiation, which limits the activity of insects that are harmful to plants, as well as avoiding burning in certain ornamental crops and, finally, (c) an improvement in the “greenhouse effect” due to blocking the transmission of long-wave thermal radiation to the outside during the night. In addition, the composition impacts the mechanical properties of greenhouse covers, such as their durability and the useful life of the product [7].
Polyethylene is mainly used due to its low density and high molecular weight and comes in the following forms: (a) Low-density polyethylene (LDPE), whose structure presents many branches (2–8 carbon atoms) linked to the main chain, which confers low resistance to tensile stress but good impact resistance [8]. (b) Linear low-density polyethylene (LLDPE), which has short branches without interconnections with neighboring chains. This is very flexible, and it has great stretchability and chemical resistance [8]. (c) Metallocene linear low-density polyethylene (mLLDPE), which is related to metallocene catalysts and presents a homogeneous distribution of the polymeric molecular chains. This has greater transparency, elasticity, processing speed and recyclability [8]. Finally, (d) ethylene-vinyl acetate (EVA) and ethylene butyl acrylate (EBA), which are co-polymers with excellent processability, impact resistance, flexibility and a high compatibility with other polymers, additives, and fillers [8].
Additives are mixed with these polymers in order to give the plastic covers specific agronomic, radiometric and mechanical characteristics. These include: (a) nickel/benzophenone-type UV stabilizers that absorb UV radiation and protect from photodegradation [9]. In addition, this material confers resistance to phytosanitary products but causes a reduction in light transmission [10]; (b) HALS-type UV stabilizers (hindered amine light stabilizers), which are photoprotectors that capture the free radicals caused by photodegradation but allow greater light transmission [11]; (c) additive diffusers, which make the incident light more evenly distributed [11]; (d) thermal additives, which help to retain infrared radiation inside the greenhouse [12]; (e) anti-thermal additives, which prevent the passage of short-wave radiation, thus achieving a drop in temperature [1]; (f) photoselective additives, which select and transform certain wavelengths into others [13,14]; and (g) anti-drip additives, which prevent water condensation on the inside of the roof [11].
Related to plastic covers, the incident solar radiation may be transmitted, absorbed and/or reflected [15]. Transmittance is the property that some materials have that allows radiation to pass through them; this is calculated as the ratio between the intensity of the radiation existing before and after having passed through the material [1]. Reflectance occurs when solar radiation returns from a body after impacting its surface [15]. Absorbance occurs when part of the radiation interacts with the particles of the object or material reached. Moreover, plastic covers can change the direction of the sun’s rays, homogenizing light onto the entire area of the crop [1], and this is related to the design of the polymeric structure or the additives applied [16].
Thermicity is the capacity of a plastic film to retain long-wave (infrared) radiation under it [17]. According to the Spanish norm of the Spanish standardization association related to thermoplastic films for covers used in agriculture and horticulture, a thermal plastic cover is one which does not transmit more than 25% of the far infrared radiation (FIR) to the outside. This depends on the nature of the polymers and the use of additives as well as the thickness [13].
The tensile strength of a cover is determined by tensile tests: ductility, toughness and Young’s modulus [18]. This property is especially useful in order to know the resistance and the percentage of elongation of the plastic, as this is related to the ease of handling and the placement of the plastic on greenhouse structures [19].
Impact resistance is the resistance offered by a roof to dynamic loads [11]. This property is directly related to the toughness, which shows the ability of different polymers to absorb mechanical energy [1].
Around 99% of the solar radiation that reaches the Earth’s surface is between 300 nm and 2500 nm, where approximately 5% corresponds to UV radiation, 45% corresponds to photosynthetic active radiation (PAR), and 50% corresponds to NIR [15]. According to González [1], the rate at which solar radiation is received by a surface per unit area is called irradiation, which is expressed in power units per surface unit (Wm−2).
Cover materials cause a change in the intensity of radiation as well as a selection and change in its spectral distribution, thus influencing the microclimate and the energy balance generated inside a greenhouse, directly affecting the response of the crops [4].
According to Ordaz [13], the following photoselective covers have been developed with a multitude of different features: (a) Anti-pest covers that alter the transmission of ultraviolet radiation between 280 nm and 400 nm, thus achieving greater protection against herbivorous insects and disease-transmission due to insects [20,21]. Nevertheless, this modification can equally affect pollinating insects [22]. (b) Anti-blackening covers that block ultraviolet radiation, thus avoiding damage and blackening on the flowers of certain ornamental crops, especially red roses [7]. (c) Colored covers that absorb and/or reflect part of the visible-spectrum-modified morphogenetic active radiation (MAR) received by the crops [23]. (d) Anti-thermal covers that block the entry of NIR (780–2500 nm) and produce a reduction in air temperature [24]. (e) Thermal covers that block the passage of medium infrared radiation (MIR) and far infrared radiation (FIR) between 2.5 µm and 1000 µm to the outside, thus producing the “greenhouse effect” [25]. Finally, (f) fluorescent covers that absorb wavelengths that are not very useful for crops (ultraviolet C and green) and emit them in others that are more usable for photosynthesis (blue and red), resulting in a subsequent improvement in the production and quality of the crops [1].
The main spectral regions from an agronomic point of view are as follows:
PAR (400–700 nm), which is the region absorbed by chlorophylls, carotenes and anthocyanin pigments in plants to produce photosynthesis [26].
Morphogenetic active radiation (MAR), which is absorbed by different photoreceptors: phytochromes in the red (R) (600–700 nm) and far red (FR) regions (700–800 nm) [27] and cryptochromes in the blue region (400–500 nm), thus generating morphogenetics changes in the plant.
In addition, the radiation that reaches the interior of greenhouses is transformed into heat, increasing the temperature of the environment and the objects present [28].
Plastic covers act as a shelter that creates an environment confine and as a radiation filter [29]. During the night, the phenomenon known as “thermal inversion” occurs, which causes the internal temperature of the greenhouse to be lower than the external one [30]. On the other hand, temperature control is limited to natural ventilation [31]. In hot areas due to high irradiance, natural ventilation is not enough to extract excess heat [32]. For this reason, thermal screens, shading meshes, or whitewashing are used [33]. Whitewashing can deteriorate the additives of plastic covers, modifying their radiometric and mechanical properties [34].
Improvements in the microclimatic conditions inside a greenhouse suppose saving energy and water and cause an increase in the yield. Plastic covers are fundamental tools for achieving passive control of greenhouses in mild and warm climates. Currently, there are few studies that relate the composition of materials, the properties of materials and their behavior as greenhouse covers for horticultural and ornamental production. Based on the above, the objective of this work is the study of four experimental plastic covers (EPCs) conducted through the evaluation of their mechanical and radiometric properties and their climatic behavior in experimental units as a basis to improve the microclimatic conditions inside a greenhouse.

2. Materials and Methods

This experiment was based on the comparison of 4 tri-layer plastics, manufactured by Plastimer-Macresur S.L. La Mojonera, Spain The plastics were as follows:
Blue EPC: Theoretical thickness: 200 µm. Real average thickness: 219 µ (876 gg). Color: blue. Composition and distribution of materials between layers: external layer: 35% mLLDPE + 57.5% LDPE + 7.5% HALS-type UV additive; intermediate layer: 35% mLLDPE + 55.5% LDPE + 7.5% HALS-type UV additive + 2% blue pigment additive and inner layer: 96% LDPE + 4% FR thermal additive. Currently, this plastic is not used very frequently.
Grey EPC: Theoretical thickness: 200 µ (800 gg). Real average thickness: 213 µ (852 gg). Color: silver grey. Composition and distribution of materials between layers: outer layer: 35% mLLDPE + 57.5% LDPE + 7.5% HALS-type UV additive; intermediate layer: 35% mLLDPE + 50.5% LDPE + 7.5% HALS-type UV additive + 7% NIR anti-thermal additive and inner layer: 96% LDPE + 4% FR thermal additive. Used in central America.
Yellow EPC: Theoretical thickness: 180 µ (720 gg). Actual mean thickness: 187 µ (748 gg). Color: yellow-green. Composition and distribution of materials between layers: external layer: 32.5% mLLDPE + 60% LDPE + 7.5% nickel quencher UV additive; intermediate layer: 32.5% mLLDPE + 60% LDPE + 7.5% nickel quencher UV additive and inner layer: 100% LDPE. Used in southern Europe and Israel.
Colorless EPC: Theoretical thickness: 200 µ (800 gg). Real average thickness: 204 µ (816 gg). Color: colorless. Composition and distribution of materials between layers: outer layer: 30% mLLDPE + 62.5% LDPE + 7.5% HALS-type UV additive; intermediate layer: 30% mLLDPE + 62.5% LDPE + 7.5% HALS-type UV additive and inner layer: 100% LDPE. Used in southern Europe and Israel.

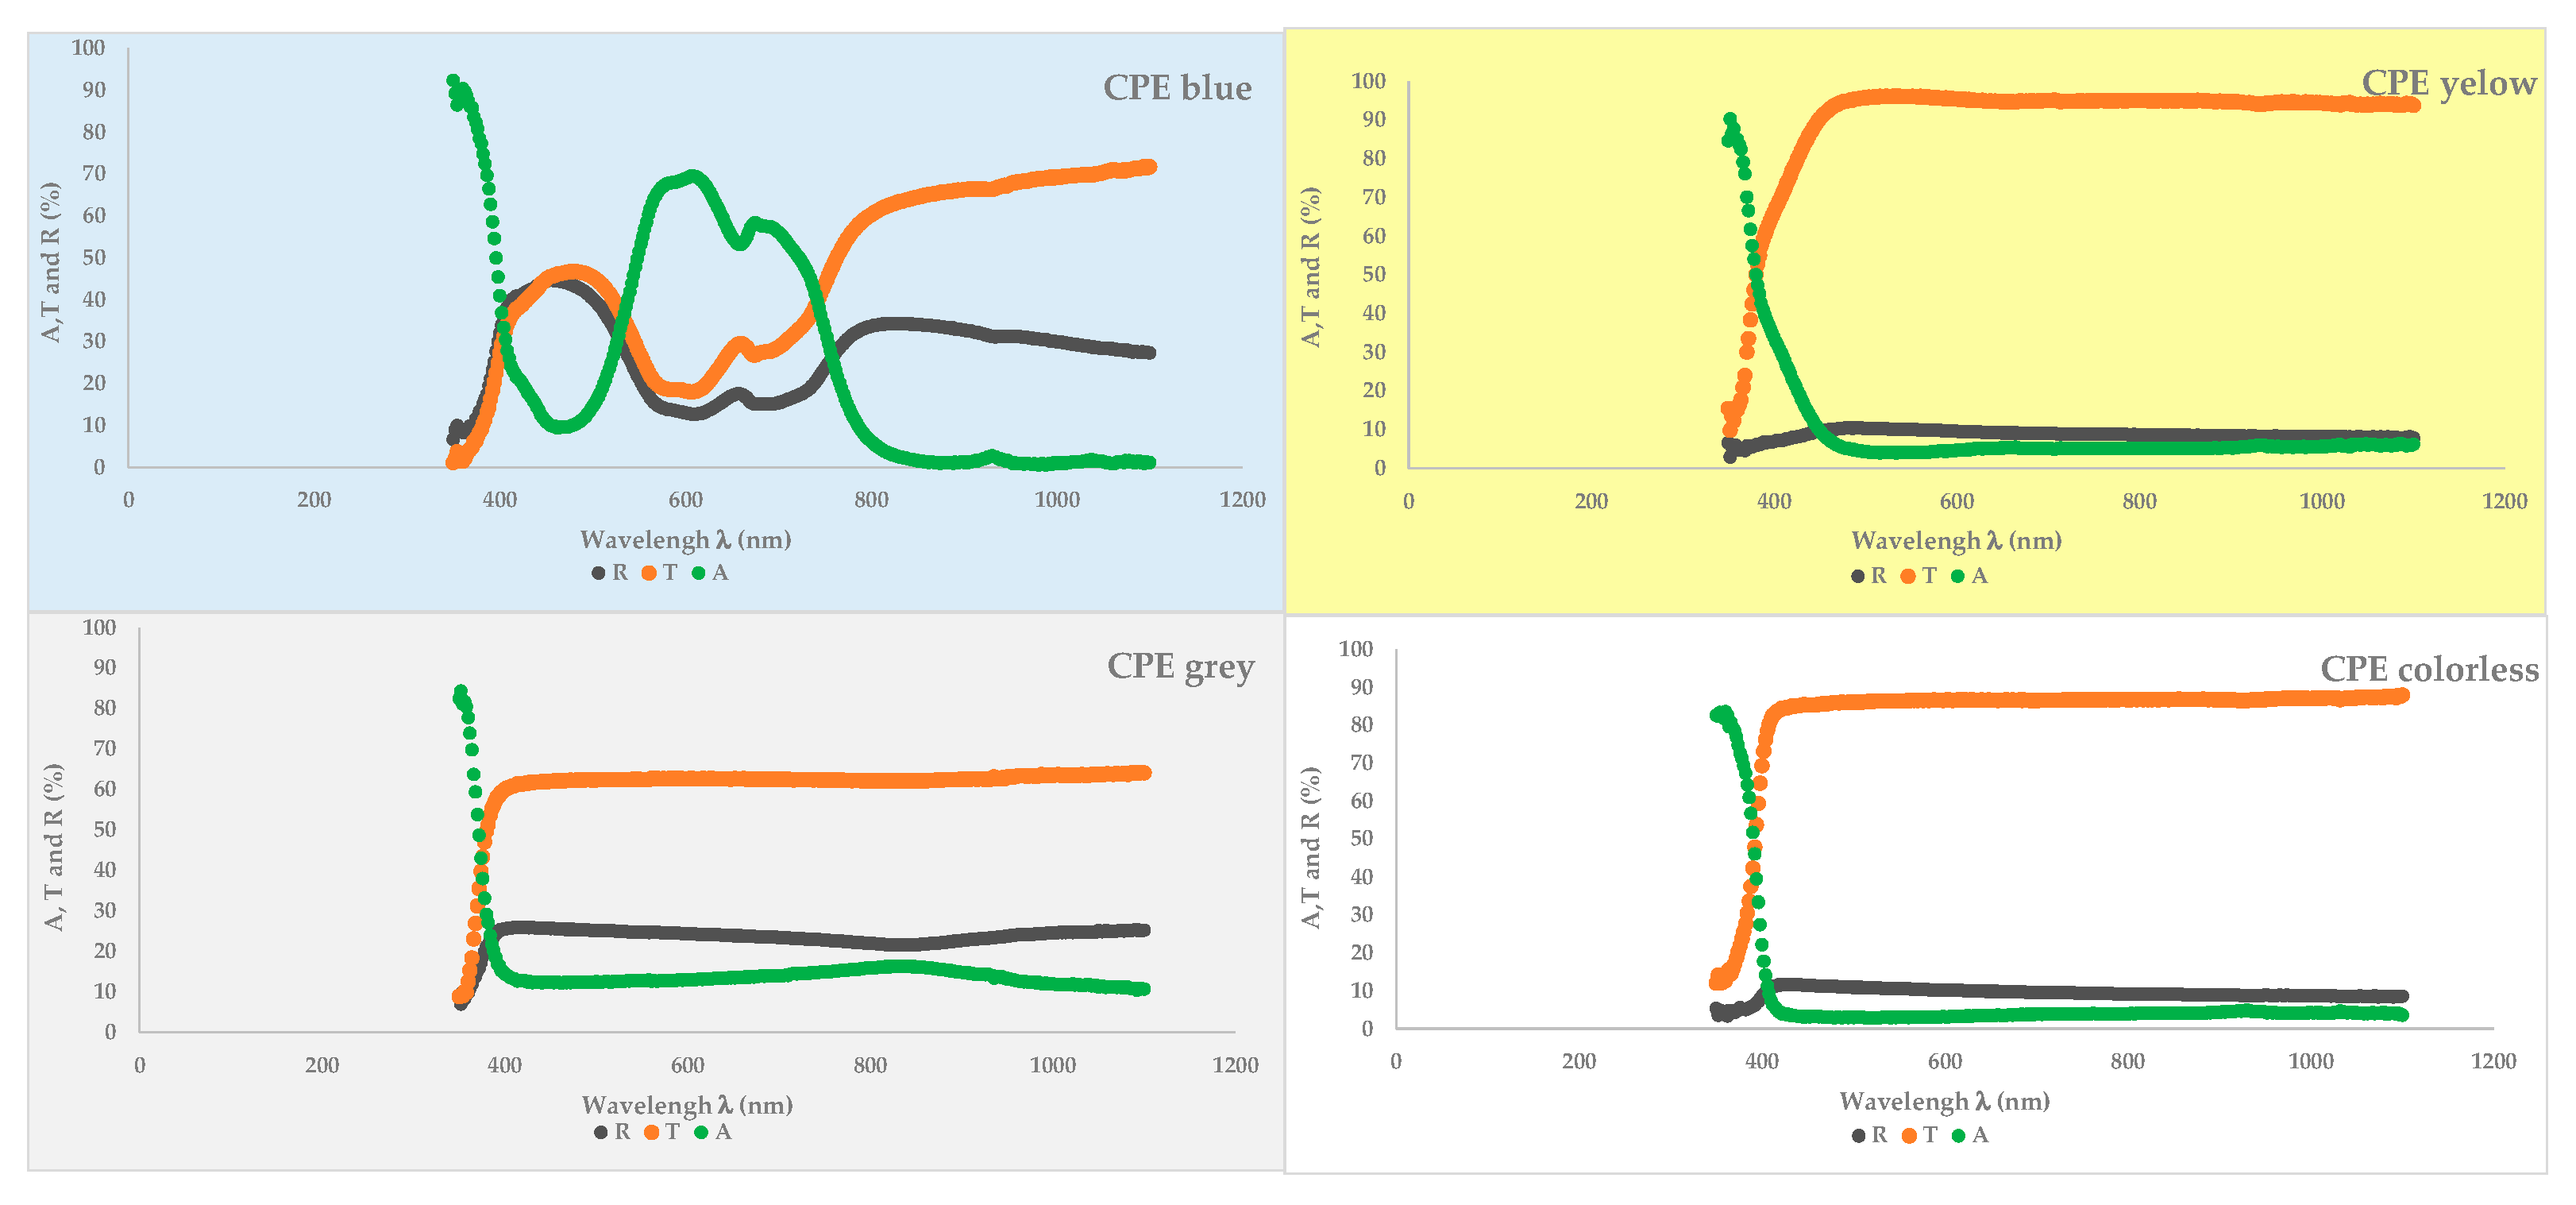
2.1. Radiometric Properties

The radiometric determination of the transmittance (%T) and reflectance (%R) of each polymeric film was measured by an integrating sphere using a calibrated spectroradiometer (LI-COR 1800, Lincoln, NE, USA) in the range of 300–1100 nm in the Applied Physics laboratory of the University of Almería (36°4900 N, 2°2400 W). The lamps used were 200 W quartz tungsten halogen lamps that were operated at 3150 K. The measurements were made on both sides.
The absorbance (A) was calculated as:
%A (λ) = 100 − (%T(λ) + %R(λ))
The average value of the R, A and T parameters was calculated for the different spectral regions of interest for protected cultivation, as defined by Pérez-Saiz et al. [35]: ultraviolet (UVA) (300–400 nm), photosynthetically active radiation (PAR) (400–700 nm), near infrared (NIR) (700–1100 nm) and total (300–1100 nm) regions. The agronomic characterization of these polymeric films was carried out with respect to the values of R, A and T in % in the different spectral regions, presenting the maximum, average and minimum of the set of plastics studied. The correlation between them was investigated.

2.2. Mechanical Properties

To proceed with the tensile test, we used a die with the shape of the type 5 specimen established by the standard [36,37] and Hounsfield equipment to carry out the test, which was located in the laboratories of the University of Almería.
The parameters used in the test were as follows: 5000 N maximum on the force scale and a test speed of 100 mm/min. For each type of polymeric film, the thickness (in mm and gauges), surface area (mm2), Young’s modulus (MPa), yield stress (MPa), elastic strain, maximum stress (MPa), maximum strain, ultimate stress (MPa), ultimate strain, tear strength (N) and impact strength (g) were recorded.
For the tear resistance test, we used TEARING equipment and the necessary test standard [38]. The dart impact test was carried out with the standard [39]. The equipment was a CEAST device.

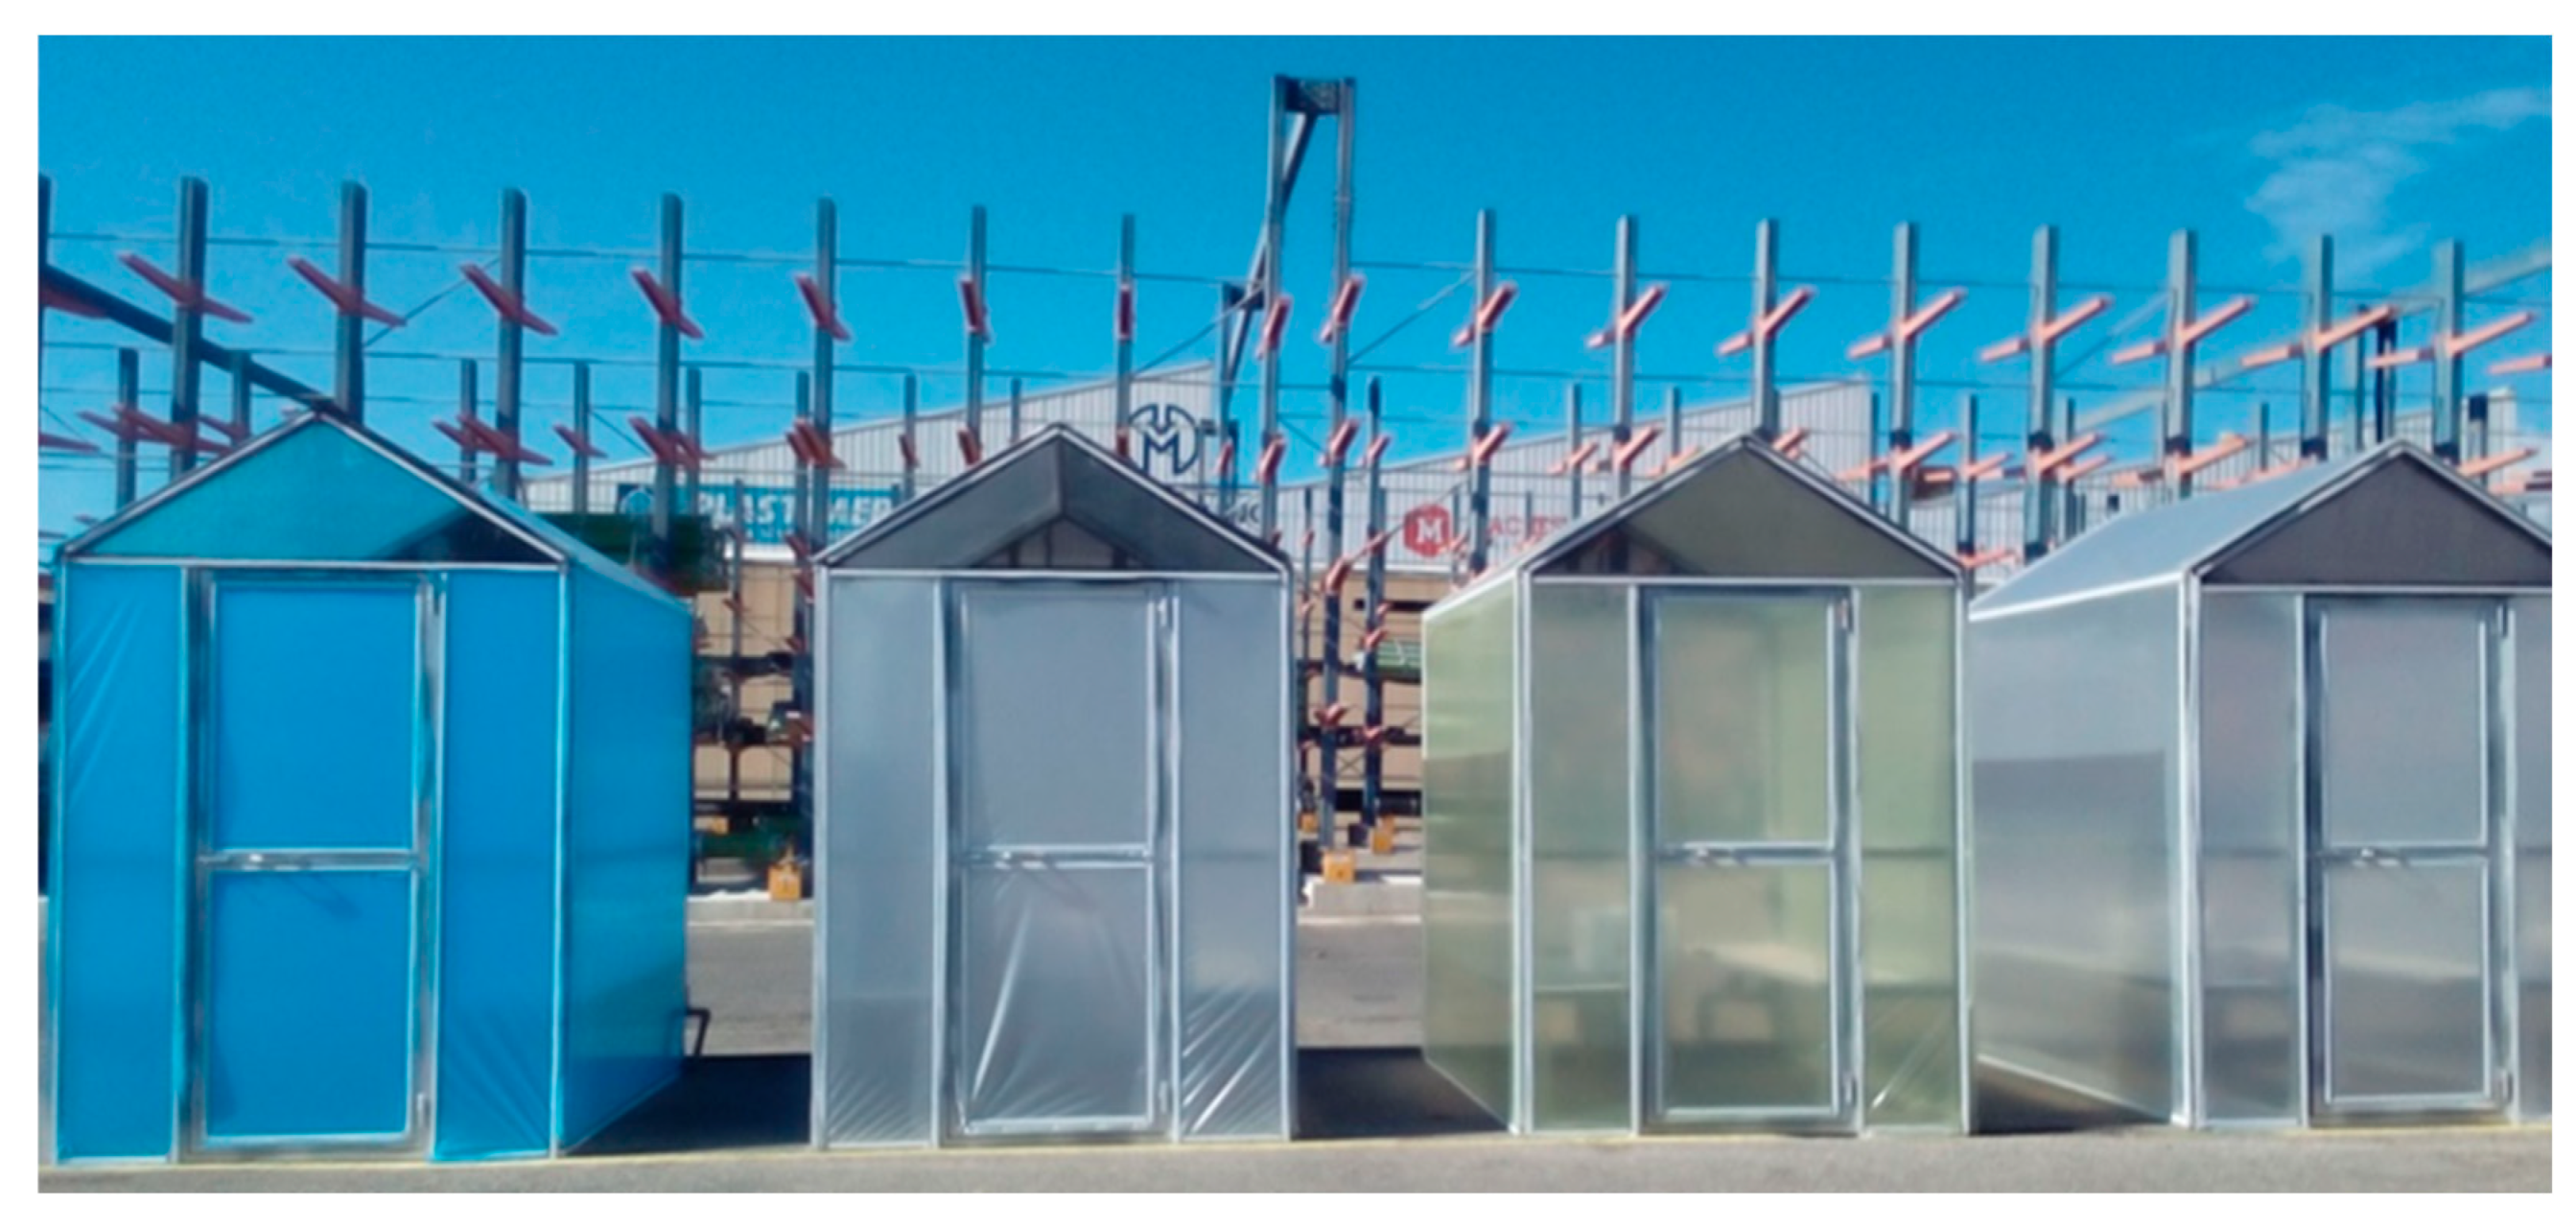
2.3. Film Behavior under Semi-Field Conditions

Four analogue chapel-type pilot greenhouses with symmetrical slopes of 45° and a metallic structure, each with a surface area of 3 m2 (1.5 m wide × 2.0 m long) and a ridge height of 2.5 m, all facing east–west, were employed. These did not have lateral ventilation but had small natural ventilation in the front and rear, between the transversal side member and the upper ridge, where a 16 × 10 threads cm−2 protection mesh with a porosity of 55% was placed. These greenhouses were located in the Plastimer-Macresur S.L. industrial factory, located in La Venta del Viso (Almería) at an altitude of 194 m at 36°47′55.2″ north latitude and 2°41′54.1″ west longitude (Figure 1). The experimental period lasted 66 days (from September to November 2019), which included variable conditions from warm (September) to medium (October) and cold (November). During this period, both inside and outside of the pilot greenhouses, the air temperature and relative humidity were monitored on an hourly basis with an Onset HOBO LCD data logger (model H8 RH/Temp/External H08-004-02, Onset Computers). In addition, photosynthetically active radiation (PAR) (µmol m−2 s−1) was measured hourly and daily at 12.00 solar hour using a pyranometer (model DELTA OHM).

2.4. Statistical Analysis

The recording and calculation of the different parameters assessed was carried out using MS Excel. Regression analyses to study the tendencies between the parameters were conducted using Statgraphics Centurion XVI.II (Statpoint Technologies, Inc., Warrenton, VA, USA).

3. Results

3.1. Radiometric Properties

Figure 2 shows the percentage of the transmittance, reflectance and absorbance for each of the films assessed (blue, grey, yellow and colorless EPCs). Table 1 shows the average percentage values of the transmittance in the UV-A, PAR and NIR spectral regions of the polymers studied. Table 2 shows the average percentage values of the transmittance in the blue, red and far-red spectral regions of the polymers studied, and Table 3 shows the average percentage values of the ratios between the transmittance of the PAR/NIR, R/FR and B/R regions of the polymers studied.
The patterns of the blue EPC, shown in the visible spectral region, were as expected due to the blue color of the cover, the maximum transmission and the reflectance in the respective color (400–500 nm). Subsequently, this decreased from 500 nm to 600 nm and increased again from 600 nm to 700 nm. In the UV-A region, the low transmission of the blue EPC (9.45%) could be due to its high real thickness (876 gg) and the blue pigment used in its composition.
The patterns of the grey, yellow and colorless EPCs were similar for the reflectance, transmittance and absorbance. It is necessary to note that the anti-thermic additive used in the grey EPC affected all the spectral regions equally.
The external transmittance of the yellow EPC increased linearly from 400 nm to 450 nm, while the absorbance decreased proportionally to this, until reaching 500 nm, at which point they behaved uniformly throughout the entire spectrum shown.
The colorless EPC produced a higher transmission throughout the spectrum than the yellow EPC. On the other hand, the colorless EPC did not reach transmission values as high as those of the yellow EPC.
The PAR transmission in the blue EPC was 32.04%, in the grey EPC it was 62.33%, while in the colorless EPC and yellow EPC it was 85.77% and 92.34%, respectively.
This characteristic of HALS-type photostabilizers can also be seen in the grey EPC, where the transmission pattern at the beginning of the PAR region was practically identical, although at lower percentages, due to the “anti-thermal” additive. The blue EPC also had these additives incorporated into it, but due to the added blue pigment, its behavior was somewhat distorted and not as obvious. The comparison between the films studied shows that the blue EPC presented the lowest transmissivity in all the spectral regions analyzed (Figure 2 and Table 1).
The grey EPC was the one that attained the highest percentage of diffusion, which was probably due to the aluminized particles used in its composition to reflect NIR (Table 4). The diffusion percentage of the rest of the plastic films was due to the nature of the polymers and additives used.
Figure 3 shows the relationship of the transmittance on both sides of each plastic film to study the symmetry of the film. The blue, grey and colorless EPCs presented a high symmetry in the transmittance between their sides. However, the yellow EPC demonstrated asymmetry between the sides, with the transmission of the external side being lower than that of the internal side from 300 nm to 500 nm, which represents a 9% transmittance. From 500 nm, it also showed a high symmetry. This aspect must be taken into account when installing the plastic film.

3.2. Mechanical Properties
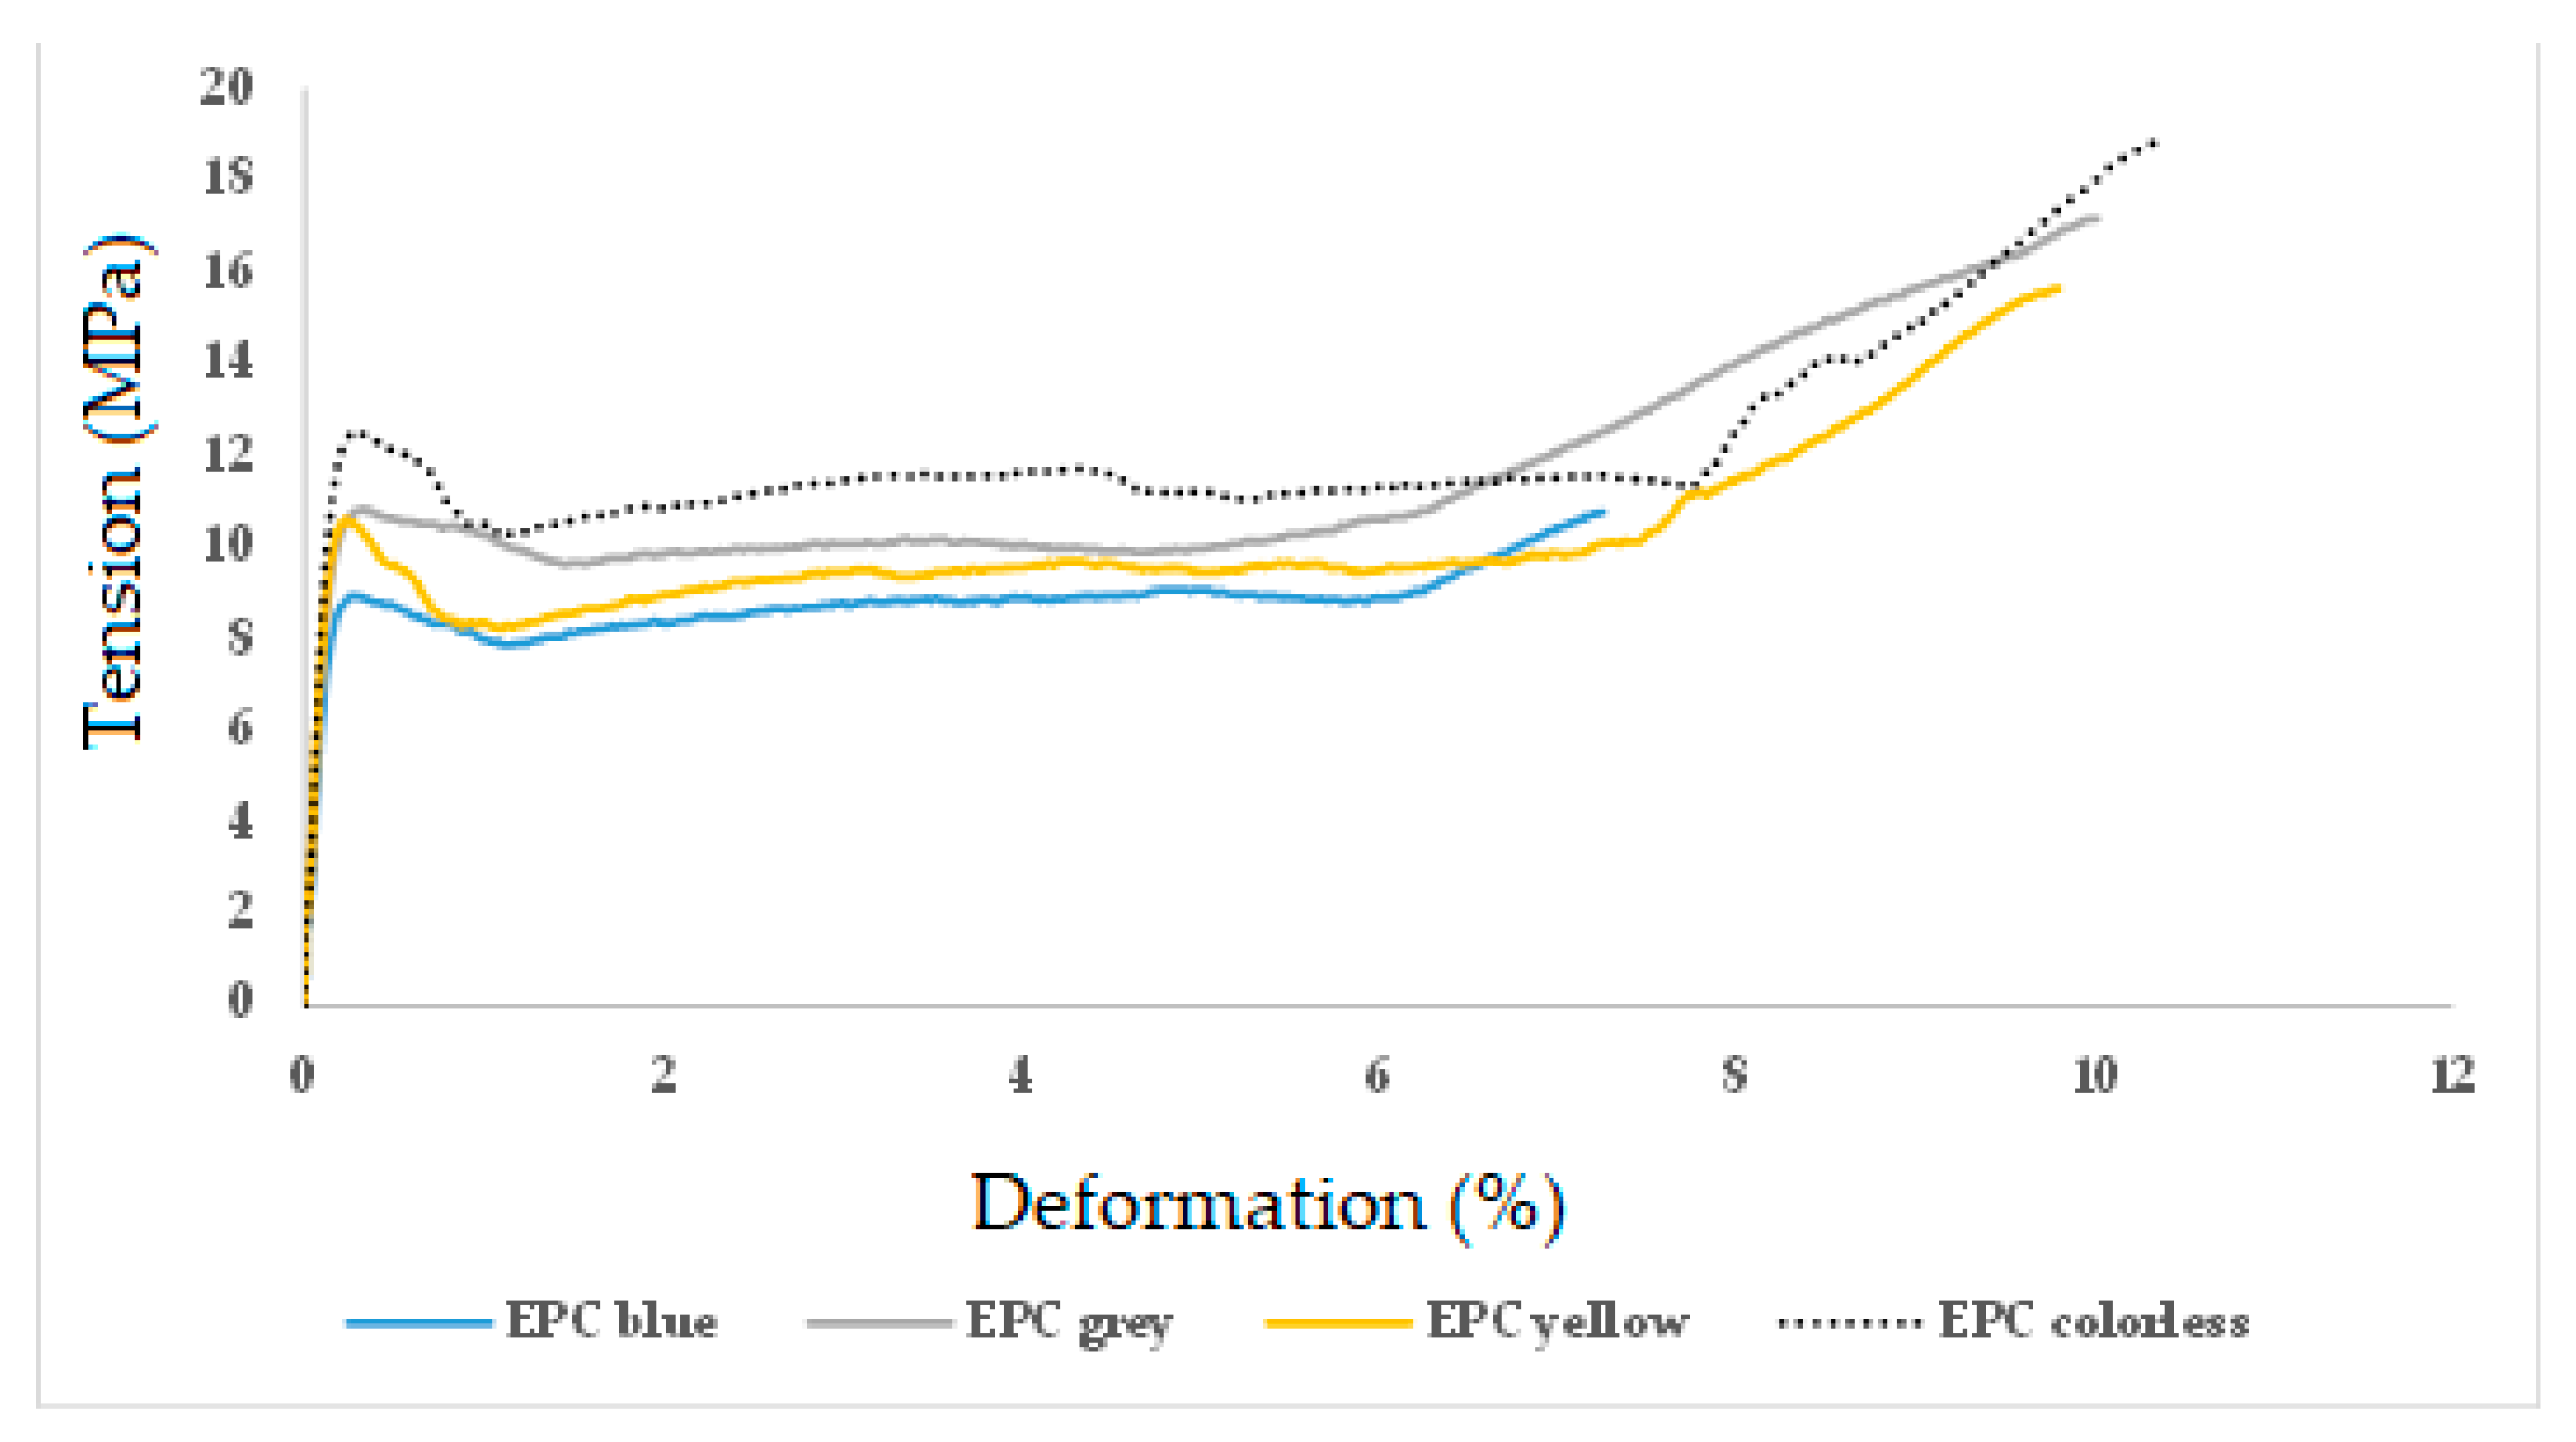
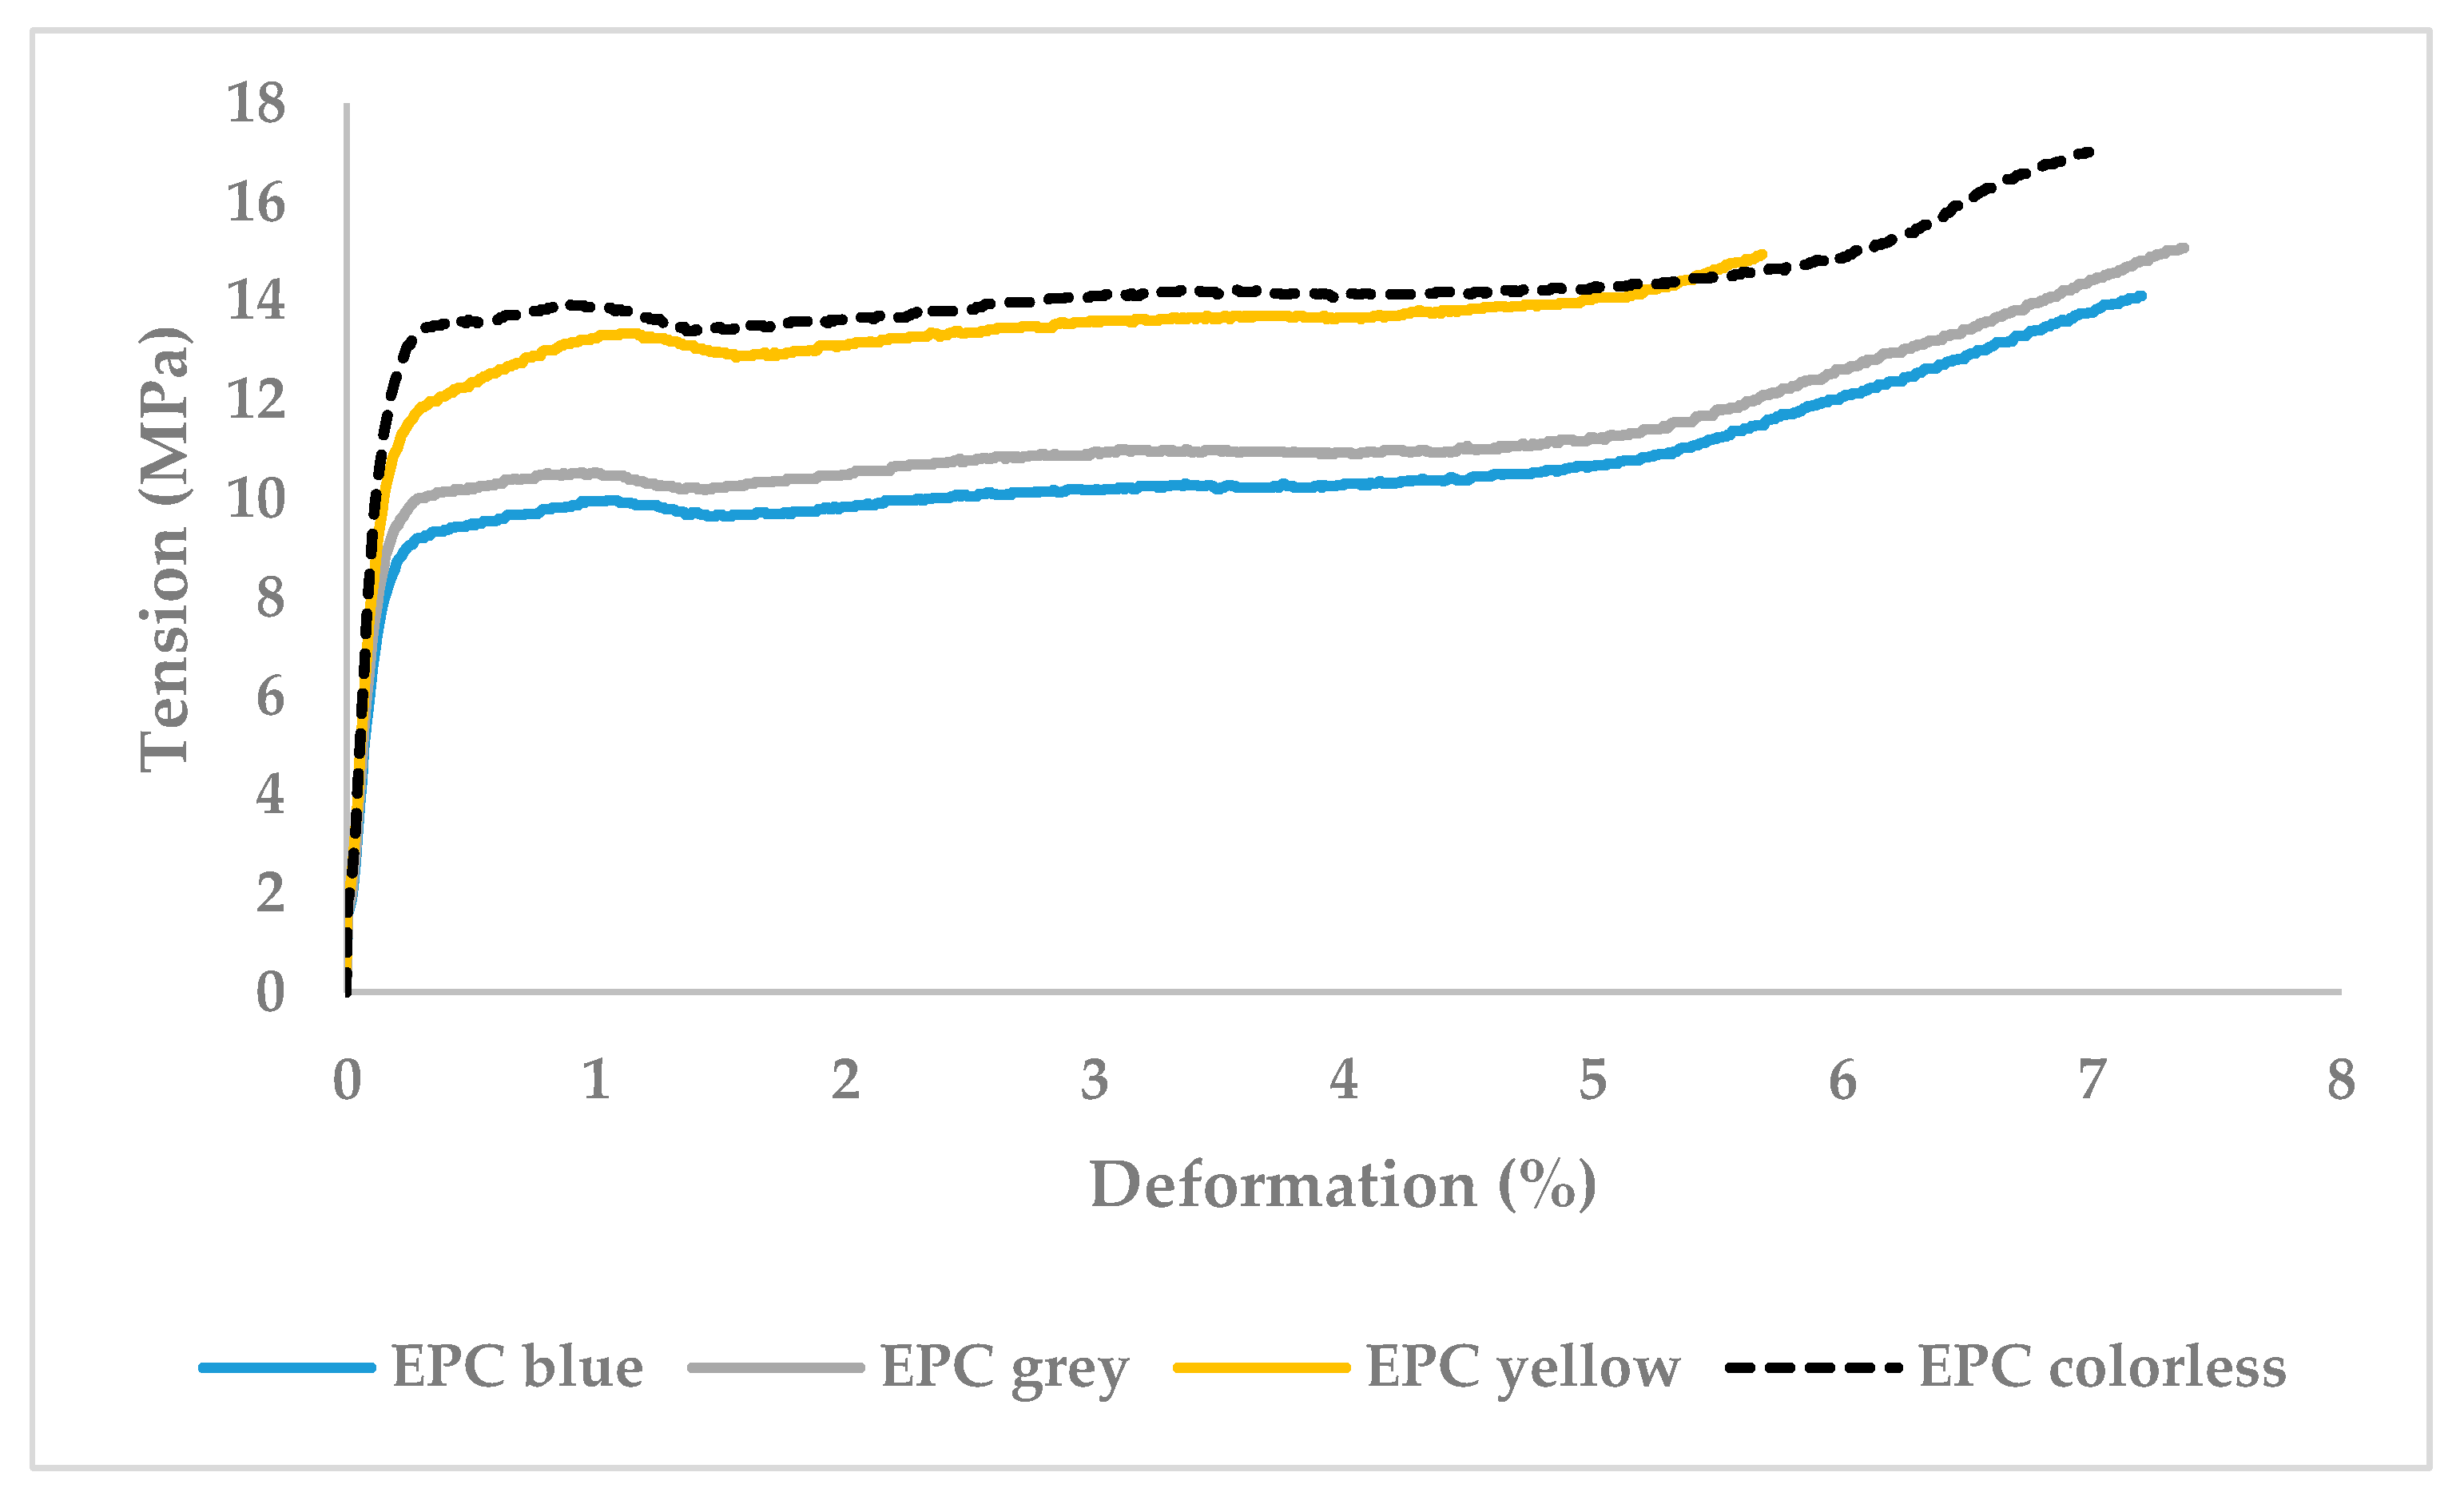
3.2.1. Tensile Test

Observing the stress–strain curves in Figure 4 and Figure 5, the behavior of the four EPCs in both directions (T.D. and L.D.) as soft and tenacious materials can be verified. Therefore, the figures are representative only for the values shown in Table 5 and Table 6. The actual values of the maximum and ultimate stresses and strains are given in Table 7 and Table 8.

3.2.2. Dart Impact Test

Both the blue EPC and grey EPC tests ended at 895 g without producing ≥10 impacts with breakage; it was not possible to continue increasing the weights since there were no more approved weights that could be added to the dart. The EPC that showed the best response to breakage was the blue EPC, followed by the grey EPC, the colorless EPC and the yellow EPC (Table 9).

3.3. Evaluation of Environmental Factors in the Field

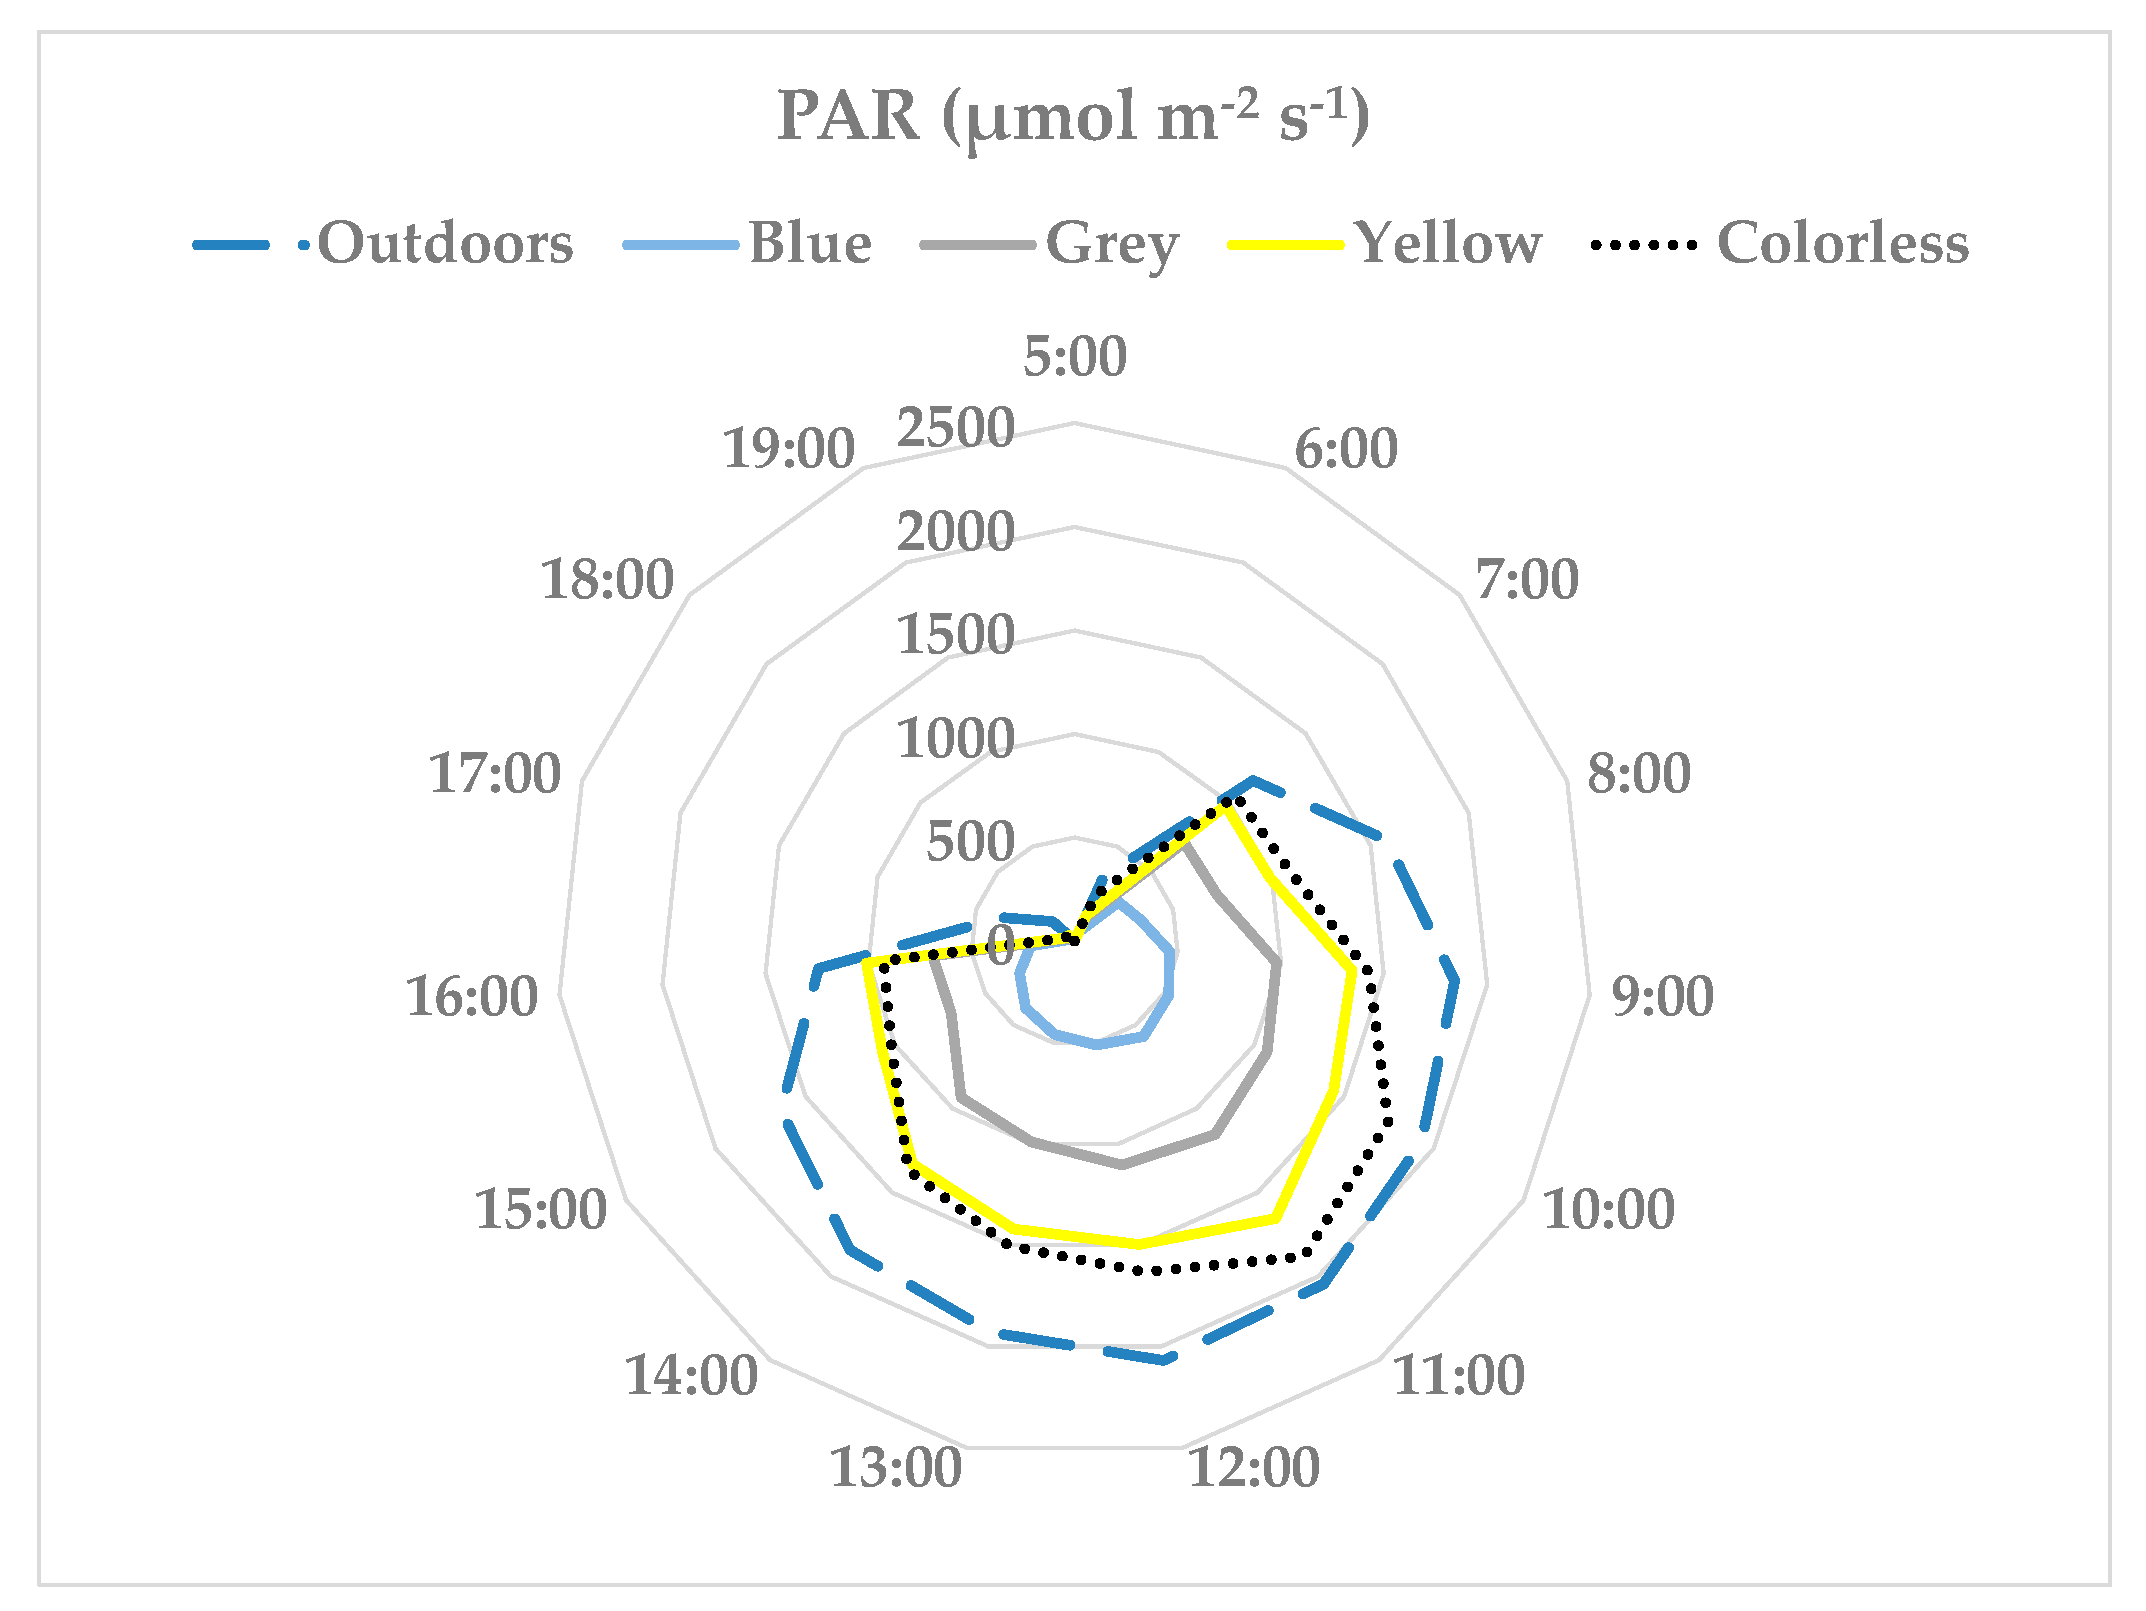
3.3.1. Photosynthetically Active Radiation (PAR)
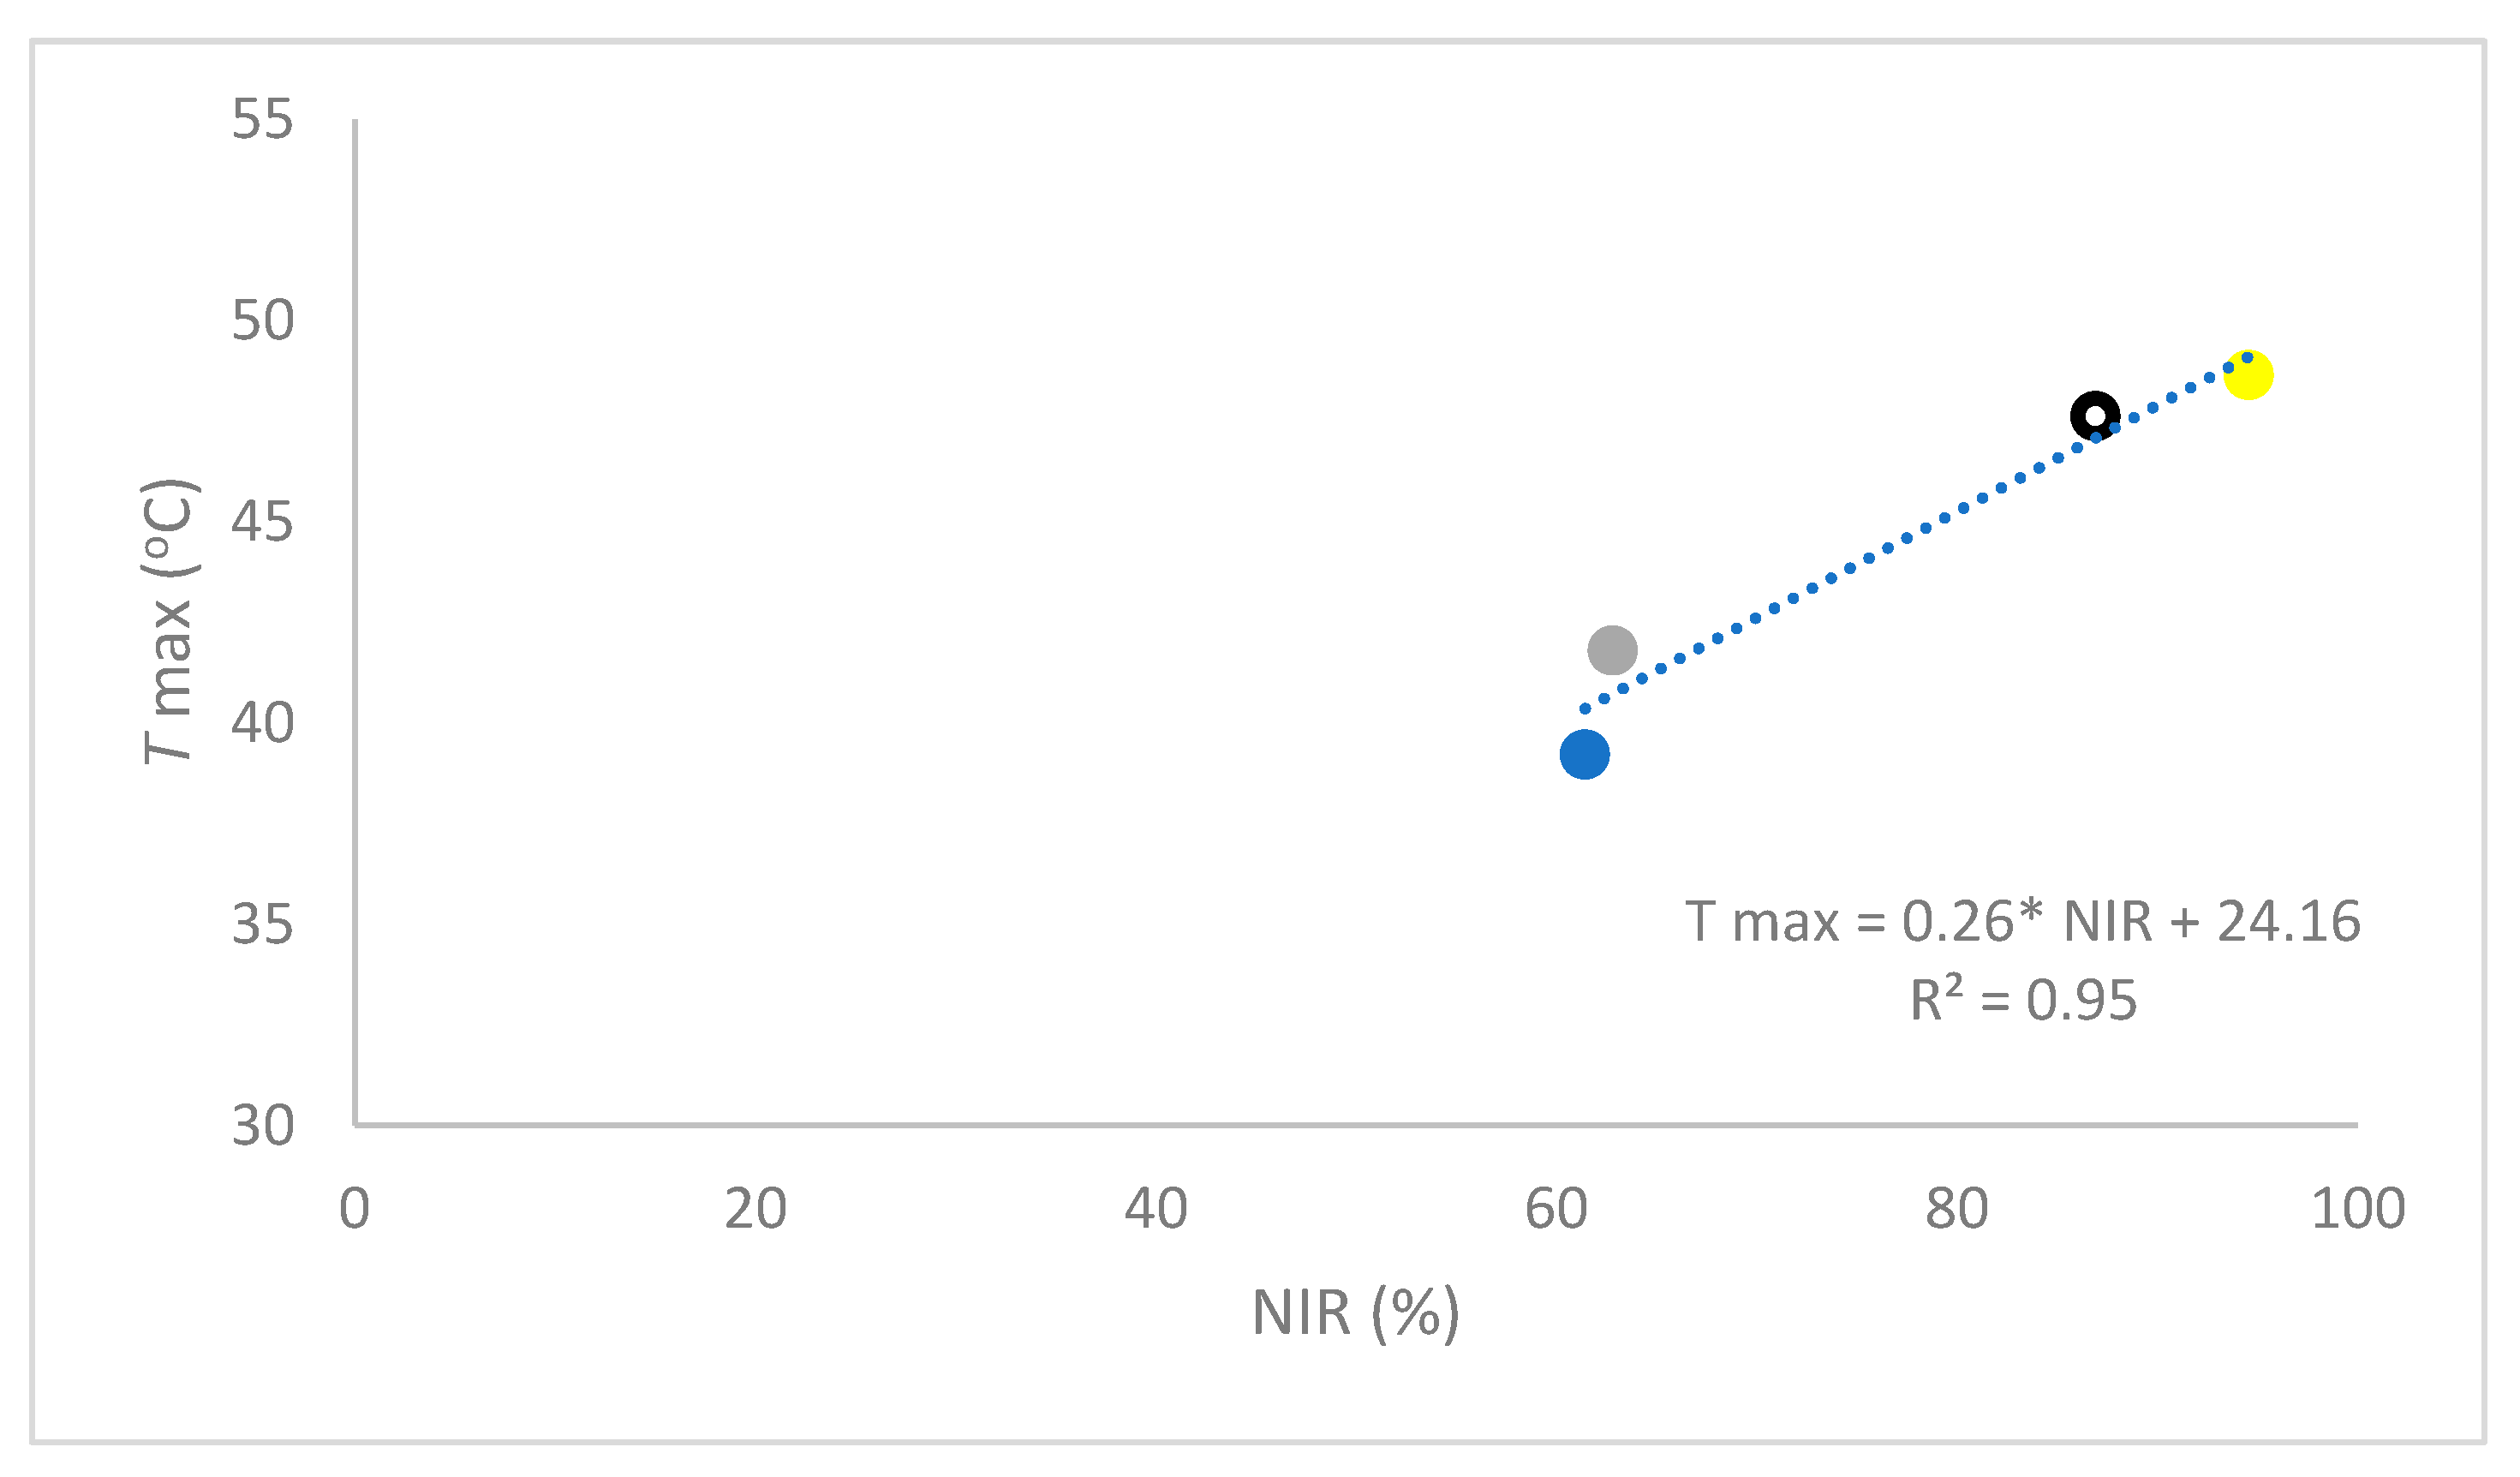
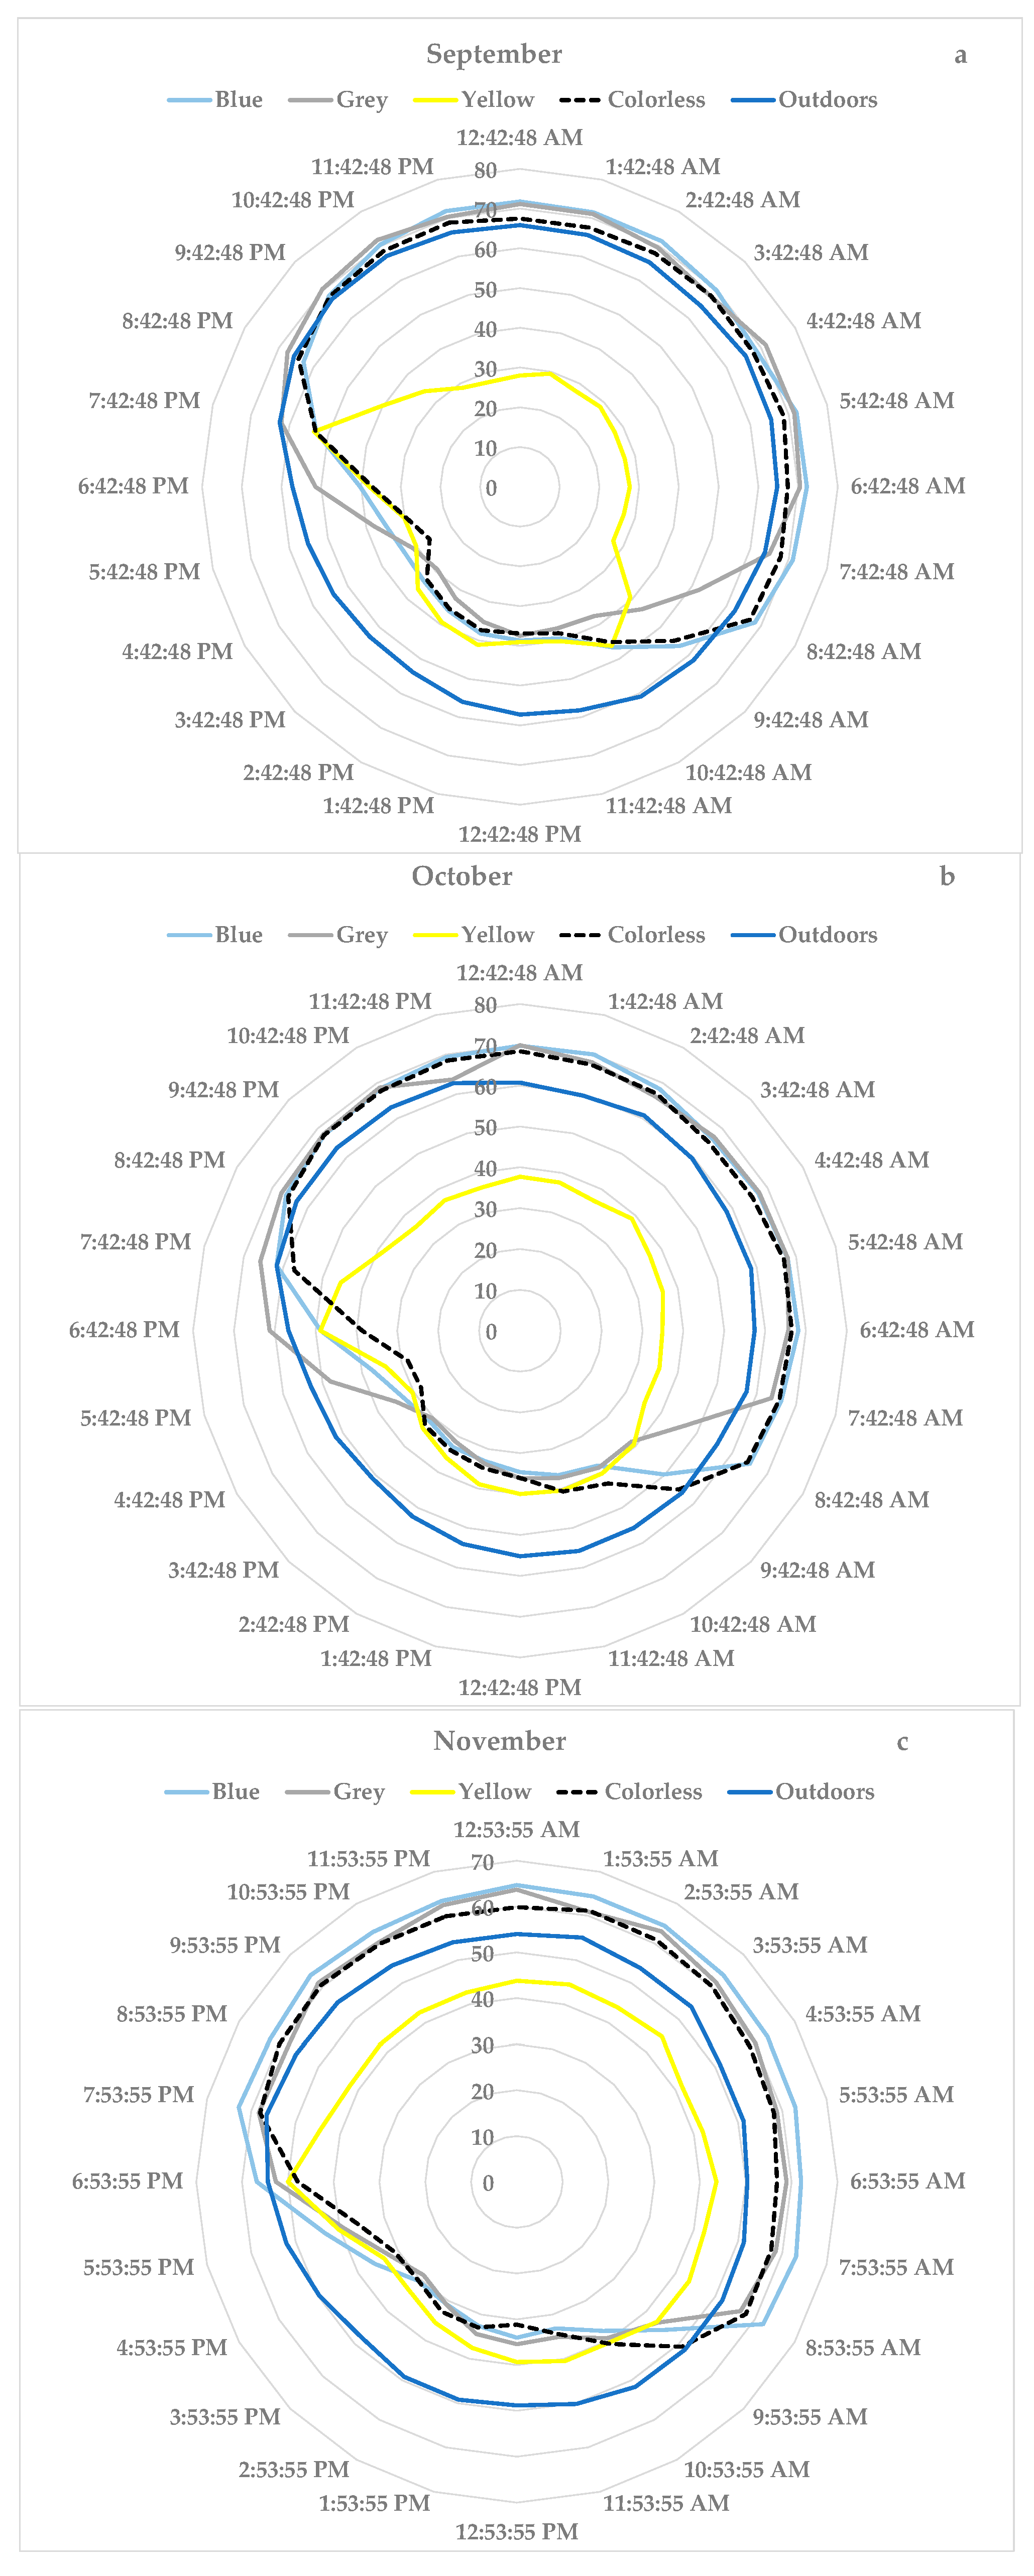
Figure 6 shows the amount of outdoor PAR radiation hour by hour as well as the transmission pattern of the EPCs on 25 September 2019, where the highest PAR radiation was between 10:00 and 13:00 solar time. Table 10 presents the Integral daily PAR radiation transmitted, Table 11 presents the PAR transmitted through the EPCs installed in the pilot greenhouses and their percentage ratio to the incident PAR radiation from outdoors.

3.3.2. Temperature

Figure 7 shows the average horary temperature recorded inside each greenhouse and outside for September, October and November.
Considering the poor ventilation, low air volume and lack of humidity in the greenhouses, very high maximum temperatures were reached. The blue EPC and grey EPC were the ones that registered much smaller differences in terms of the maximum temperatures, which was due to their lower PAR and NIR transmission percentages compared to the yellow and colorless EPCs.
During the night, the temperatures in the pilot greenhouses were around 3 °C higher than the outdoor temperatures in September and October. Nevertheless, in November, a thermal inversion phenomenon was observed from 11:00 p.m. to 7:00 a.m. for the pilot greenhouses with the yellow EPC and colorless EPC. In the grey EPC, it rose above this temperature starting at 8.00 a.m.; however, the blue, yellow and colorless EPCs rose above this temperature starting at 10.00 a.m. The blue EPC roses 10 °C from 1.00 to 5.00 p.m., and the grey EPC rose to 15 °C during the same period. However, the yellow and colorless EPCs increased above the outdoor temperature up to 20 °C in the same period.
Table 12 shows the difference in the average, minimum and maximum temperatures (°C) recorded inside each greenhouse with respect to outside. The average temperatures reached inside the pilot greenhouses were in the range of from 3.5 to 4.5 °C higher than those outside. The minimum temperatures were similar to those outside (±1 °C), with a thermal inversion effect being observed in the yellow and colorless EPCs in November. In relation to the maximum temperatures, the best performance was found in the blue EPC with an average increase of 10 °C, an intermediate performance was found in the grey EPC with an increase of 12 °C and an inadequate and excessive performance was found for the yellow and colorless EPCs.
Figure 8 shows the correlation between the NIR (%) and maximum temperature (°C) inside the pilot greenhouses. In the trial conditions, a strong correlation between the NIR received inside the pilot greenhouses and the maximum temperatures reached was observed.

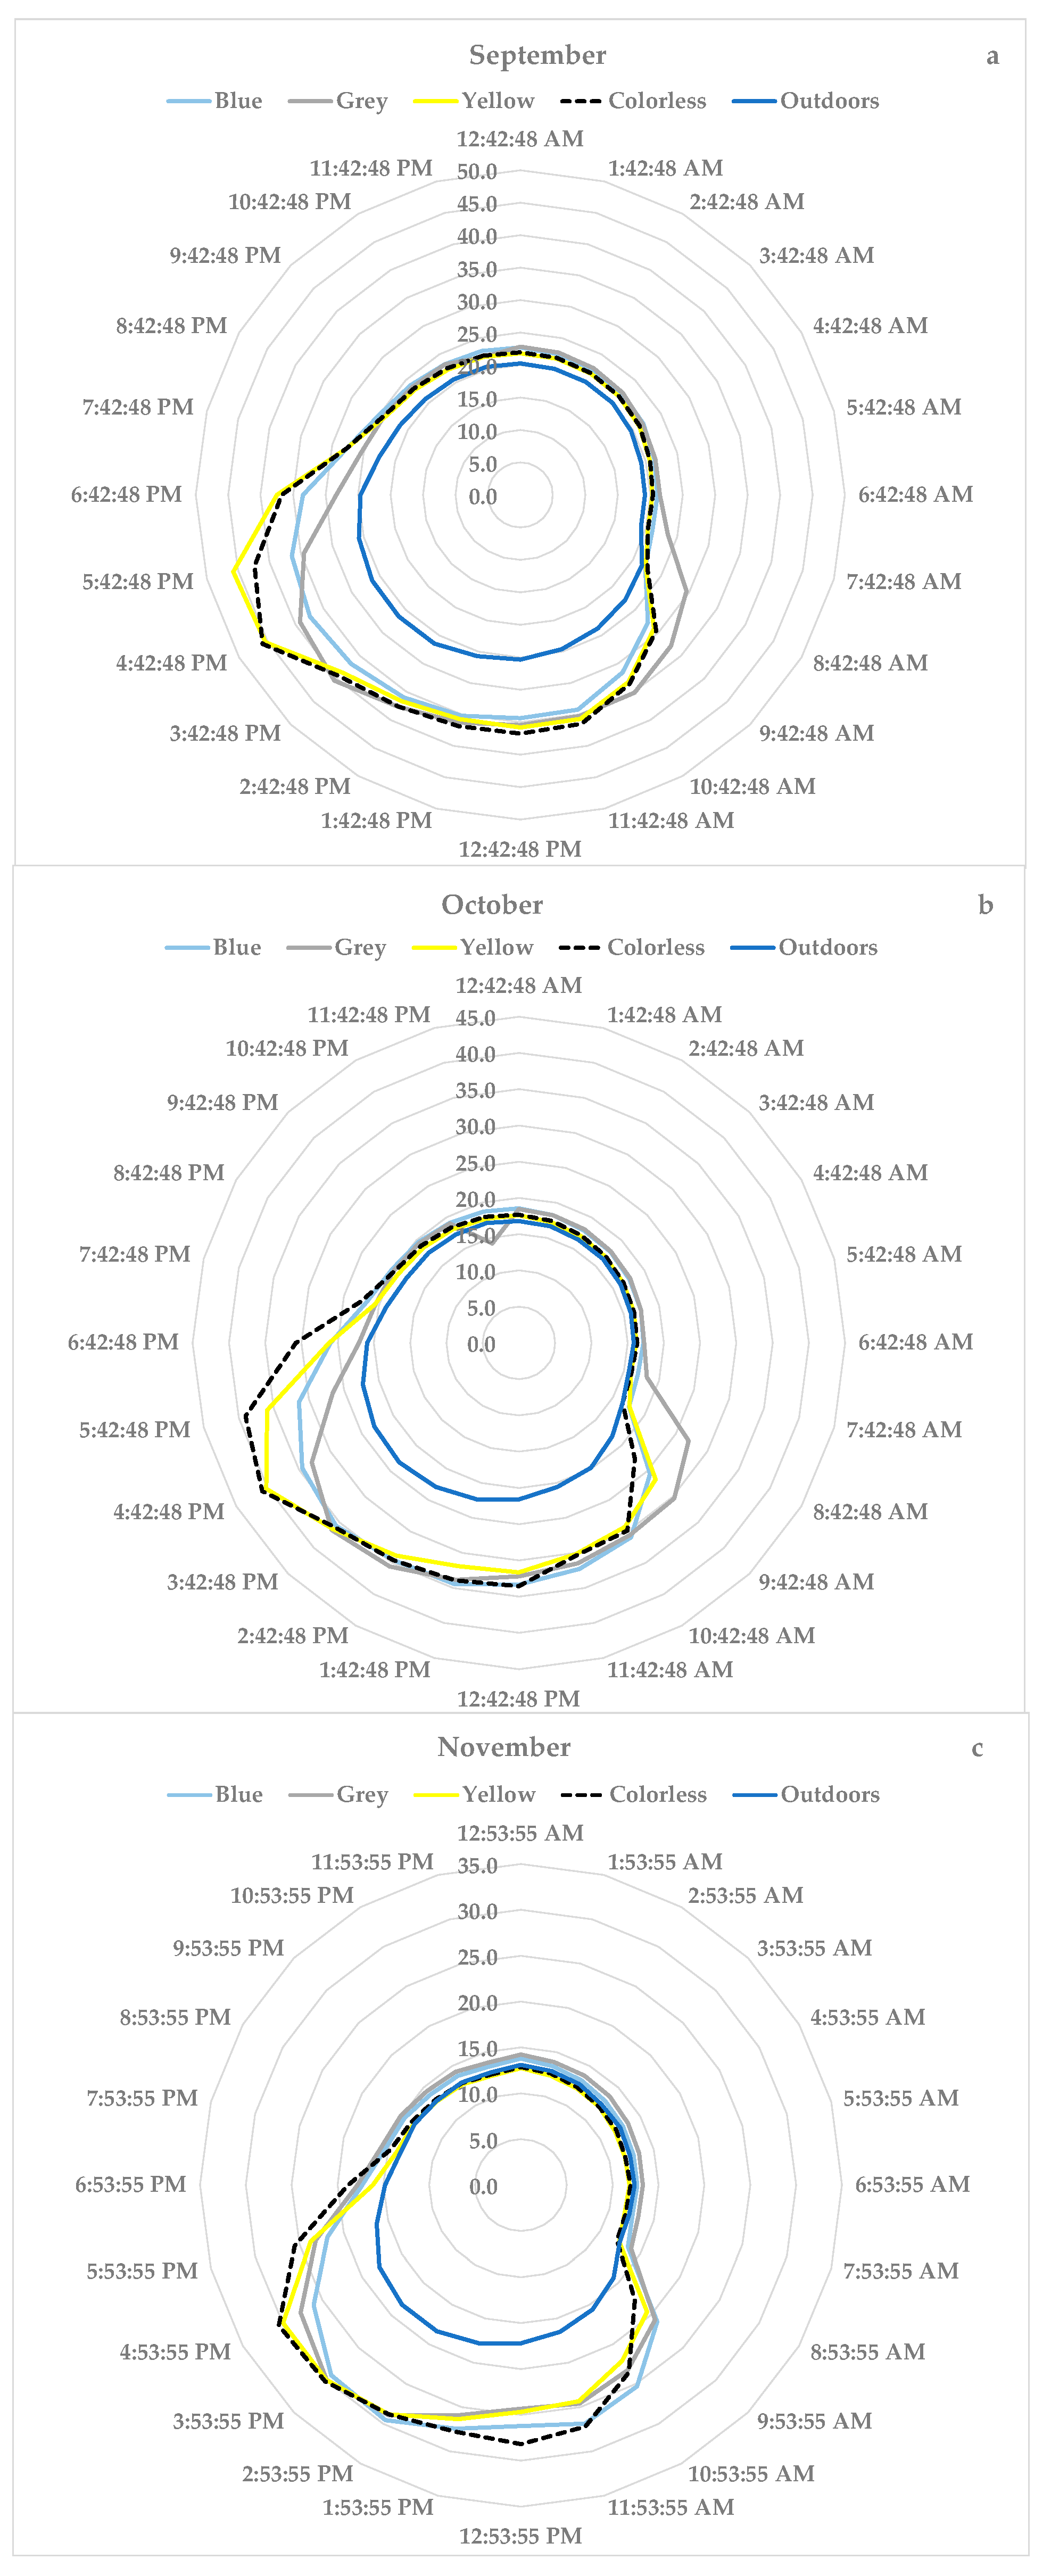
3.3.3. Relative Humidity

In general, the average RH was lower inside the pilot greenhouses compared to outside. However, the maximum values were higher than those outside, and the minimum values were much lower at around 20%.
As expected, the lowest percentage of relative humidity was found in the yellow and colorless EPCs (Table 13), which were also those where the highest temperatures were recorded; on the other hand, the blue and grey EPCs, which were those with the lowest temperatures, showed the highest percentages of relative humidity.
Regarding evolution throughout the day (Figure 9), between 9.00 a.m. and 8.00 p.m., the RH was higher outside. However, from 8.00 p.m., it was higher inside the pilot greenhouses except in the yellow EPC, which remained lower because the volume of air inside was smaller and the air renewal was scarce, since the capacity for natural ventilation was very limited.

4. Discussion

4.1. Radiometric Properties

Related to the radiometric properties, the behavior of the absorbance was inversely proportional to the transmittance and reflectance [5]. The behavior of the transmittance of the blue EPC was similar to that described by Larsen et al. [39].
The grey, yellow and colorless EPCs presented a low transmittance in the UV region due to their photostabilizer additives. The behavior of the yellow EPC was due to the use of nickel quencher photostabilizer additives, which, by absorbing UV radiation and preventing degradation, also absorbed part of the PAR band [9]. The use of HALS-type photostabilizers in the grey and colorless EPCs was more efficient when it comes to the starting transmission in the PAR region compared to using the nickel-quencher-type additive [11] because they allowed a higher percentage of radiation to pass through. A low transmission of UV-A radiation can help to control insects, although it can also influence the behavior of bees and bumblebees in the same way [22,40]. Soler [41] mentions that an anti-insect plastic cover must be able to block between 80% and 100% of UV radiation, and that the additives used must not influence its photoselective qualities throughout its useful life.
The lowest PAR radiation transmission was presented by the blue EPC. Ilić et al. [42] reported how a blue shading mesh transmitted 46.5% of the incident PAR, and the blue EPC presented a value of 32.04% in this study. This difference may be due to the fact that a mesh is porous while plastic is not, in addition to other factors such as the thickness and the quantity and quality of the additives. Regarding the greater PAR transmission by the yellow EPC compared to the colorless EPC, this may be due to the fact that the latter had a greater thickness in addition to the nature of the photostabilizers [9,43].
A low transmission of PAR radiation has a direct impact on crops according to different studies carried out in greenhouses by Sandri et al. [44], which show that a low incidence of PAR on tomato crops (Solanum lycopersicum) produces a clear reduction in productive yields. Bagdonavičienė et al. [45] demonstrated that both in tomato and cucumber (Cucumis sativus), there is less CO2 assimilation when the level of PAR radiation is lower. Although it is certain that the photosynthesis rate increases as the amount of PAR radiation increases and vice versa, whether this occurs to a greater or lesser extent will depend on each crop [46]. Nevertheless, it should be considered that the blue EPC presented high transmissivity values in the blue and red spectral regions, in which the efficiency of the use of spectral energy by plant pigments (chlorophyll a and b and carotenoids) generates high rates of bioassimilates and therefore higher yields [47].
As the PAR and NIR spectra are consecutive, when trying to reduce the latter, it is possible to also avoid reducing the former [48]. In this sense, Abdel et al. [49] suggest that covers with additives that reflect NIR radiation, in order to be considered anti-thermal, must provide a high transmission of PAR radiation and a high reflection of NIR radiation. Other authors, such as Schwart et al. [50], mention that anti-thermal films must present transmissions of less than 25% in terms of NIR.
As regards the transmission of NIR radiation, the blue EPC showed heterogeneous behavior throughout the spectrum due to its blue coloration, which was similar to a test carried out by Larsen et al. [39], where a blue cellophane sheet showed the same pattern, although at lower percentages, as it was less thick. The grey EPC yielded very similar values to the blue EPC (Table 1), although, in this case, the behavior pattern was highly homogeneous throughout the entire band. The same occurred in the yellow and colorless EPCs, where, despite presenting high transmission percentages (Table 9), their behavior was highly homogeneous throughout the entire spectral region of NIR. The difference between the first and the last two was due to the use of additives in the grey EPC to prevent the passage of NIR radiation.
Regarding reflectance, it can be seen in Figure 1 that the blue EPC presented the highest value in the NIR region (around 30%), the grey EPC had an intermediate value (around 20%) and for the yellow and colorless EPCs, the value was lower than 10%. Both the blue and grey EPCs can be considered NIR reflectors and are therefore adequate for warm climates [48]. Lopez-Marin et al. [51] compared a conventional control plastic (similar to the colorless EPC) with a plastic with pigments that reflected NIR, showing a 15% reduction in the PAR of the former compared to the latter.
Regarding the PAR/NIR ratio (Table 3), values above 1 would indicate that the plastic film is able to transmit more PAR than NIR, which would be ideal in hot climates where very high temperatures are reached during the summer [52]. In our case, the grey, yellow and colorless EPCs showed values close to 1, i.e., they transmitted the same amount of PAR as NIR. The worst in this respect was the blue EPC (0.52), which transmitted considerably less PAR relative to NIR.
Regarding the R/FR ratio, the values of the grey, yellow and colorless EPCs were all 1, while the blue EPC showed a ratio of 0.56. The R/FR ratio is of vital importance for phytochrome response [53]. Low values of this ratio can cause a priori fewer desirable characteristics such as stem elongation, an enhancement of apical dominance, a reduction in branching and an inhibition of flowering [54].
Looking at the B/R ratio (Table 3), our results showed values close to 1 for the grey, yellow and colorless EPCs, while the blue EPC showed a high value (1.71). Lin [55] found that high radiation levels within the blue spectrum relative to those in the red spectrum have various morphological effects. Oliviera et al. [56] observed how for a crop of Melissa officinalis L., high values of this ratio caused increases in the plant height, leaf area and chlorophyll content.
After analyzing the behavior of diffuse radiation (Table 4), it was found that none of them exceeded 50% diffusion, which is the minimum value that must be reached to confirm that a plastic film has special additives in its composition for this purpose and can be considered as highly diffuse [7].
Despite presenting values below 50%, according to ASTM D1003, it is sufficient to have a percentage >30% in order to be considered a diffusing coating, and all the EPCs analyzed in this study can be considered as such.
The yellow EPC demonstrated asymmetry between its sides. This fact could be due to the nickel-quencher-type photostabilizer additive used in the composition of the yellow EPC in the external layer of the film, which, by absorbing UV radiation to prevent degradation, also absorbed part of the PAR region [9].

4.2. Mechanical Properties

The four EPCs behaved in both directions as soft and tenacious materials, where a yield point was appreciated. That is, they presented an elastic limit from which, if this point is exceeded, the material cannot recover its original state again (if the forces exerted on it are removed), with the deformations being permanent [57]. All the stress–strain curves analyzed showed a linear region at low stresses at the beginning and a tangent line to that portion of curve, which marks the proportionality limit. According to the UNE-EN ISO 527-1 standard [36], these curves are classified as Type b, which are those corresponding to ductile materials with a yield point.
As shown in Table 5 and Table 6, there were significant differences between the values obtained in the samples analyzed in the transverse direction (T.D) and those obtained in the longitudinal direction (L.D). This was due to the fact that the internal structure of polyethylene and its behavior varies depending on the orientation of the ethylene chains that compose it [56].
This fact not only influenced the values already seen but also affected the tensile strength (Table 7 and Table 8). Tests carried out by Godoy [9], where several decks with different characteristics were analyzed, showed that in all of them, the rupture strength in the transverse direction was slightly higher than that in the longitudinal direction. In our case, the same occurred except for the colorless EPC, where the tensile strength was higher in the longitudinal direction.
The tensile strength expressed in MPa of each of the EPCs in both directions (T.D and L.D) is shown in Table 7 and Table 8. This corresponds to the ultimate stress, which is the maximum stress that a material can withstand before its cross-section shrinks significantly. This is why both were identical, as were their respective strains [54,55,56,57,58].
The data shown in this test for the deformation at break in both directions exceeded the value of 500% given by Matallana and Montero [59] and those provided by Briassoulis et al. [60], which range between 375–600% for PELD roofs and between 500–700% for PE-IR. The high value obtained in our case may be due to the fact that the polymers and additives currently used have improved substantially with respect to those available at the time of their studies. It was also observed that the strain at break was higher in the transverse direction (TD) than in the longitudinal direction (LD).
We know that the mechanical properties of all plastic covers depend directly on the type of raw material which they are made from and specifically on the type of polyethylene used, as well as the processing conditions under which they are produced [61]. As our EPCs, in spite of having different additives, were manufactured with similar percentages and types of polyethylene, we can intuit that the behavior against impact breakage may be related to the thickness of the EPCs. According to the values in Table 9, it can be seen that the greater the average thickness, the greater the weight supported and vice versa.
In all the breaks produced, the mark left had a circumferential shape, a symptom of the preservation of the elastic properties; if the mark left was in the shape of an “L”, it would denote a deterioration in these properties [9].

4.3. Evaluation of Environmental Factors in the Field

A similar PAR behavior to that observed during the day of our trial was found by Del Ángel-Hernández et al. [5] in Nuevo León (Mexico). The differences in the PAR transmittance between the pilot greenhouses (Table 10 and Table 11) and those obtained by a spectroradiometer in the laboratory (Table 1) may be due to the degradation and accumulation of dust on the covers and the deck angle [62], since when the analyses of the optical properties were performed with the spectroradiometer, the samples were cleaned before the analysis, while once placed in the greenhouses for field evaluation, they were fully exposed to degradation and dirt. According to Sangpradit [63], the accumulation of dust and dirt is one of the main sources of solar transmission loss in greenhouses. It can reduce it by up to 40%.
The thermal inversion effect observed in November (Figure 7) under the yellow and colorless EPCs may be related to the higher transmissivity in the NIR region (94.55% and 86.93%, respectively) compared to the blue and grey EPCs (61.45% and 62.83%, respectively), which presented more opacity. Nevertheless, in Figure 8, it can be seen that there was a high relationship (R2 = 0.95) between the % of NIR transmission and the maximum temperatures. Specifically, the improvement in the use of the blue and grey EPCs with respect to the decrease in the maximum temperatures was in the range of 6–9 °C. Related to the temperature inside the greenhouse, García et al. [64] carried out a trial in the region of Murcia with anti-thermal covers, where they obtained a reduction in the maximum temperatures of 4.5 °C compared to a conventional colorless cover with similar characteristics to the colorless EPC used in this study. These differences may be because we worked in pilot greenhouses that did not contain any crops, and therefore the effect of the plastic films was more evident.

5. Conclusions

The grey, yellow and colorless EPCs presented a similar pattern of transmittance, reflectance and absorbance from 400 nm (grey and colorless) and 450 nm (yellow). Nevertheless, the blue EPC behaved differently.
The addition of the blue pigment in the composition of the blue EPC caused a considerable reduction in the transmission of all spectra, which was clearly manifested in a reduction in the maximum temperatures with respect to the other coatings, which was related to the good correlation between the % of NIR transmitted and the maximum temperatures registered and the % of NIR reflected.
The anti-thermal additive used in the grey EPC did not achieve the desired effect, since it reduced both the PAR and NIR transmission equally.
No EPCs achieved a PAR/NIR ratio greater than 1.
The HALS-type photostabilizing additives blocked UV-A radiation more efficiently compared to the nickel-quencher-type additives, as they allowed for earlier PAR transmission.
The EPCs presented relatively acceptable light scattering percentages, since none of them had a specific additive for this purpose in their composition.
The tensile test showed that all the EPCs behaved as a soft and tough materials in both the longitudinal and transverse directions, manifesting within the elastic limit of proportionality, a linear relationship between stress and deformation that defines Young’s modulus. It was also shown how the orientation of the polymer chains influenced the ultimate strength and deformation, as well as other parameters recorded. The greater the thickness of the plastic film, the greater the weight required to produce an impact rupture.
As a general conclusion, we can say that the commercial yellow and colorless EPCs did not prevent heat losses during the night, nor, therefore, thermal inversion due to their high transmissivity of NIR radiation. The yellow EPC presented asymmetry between 300–400 nm between its faces, which is why it requires care in its placement; it was the least thick of all the plastics tested, and it was less resistant to the dart impact test. On the other hand, the experimental grey and blue EPCs presented interesting characteristics such as greater diffusion (grey) and greater reflectance of NIR radiation (blue), both showing a lower % of NIR transmittance, which improves the climate of a greenhouse under warm conditions. Nevertheless, the grey and blue EPCs also showed a low transmittance of PAR radiation, which can reduce production. These characteristics are very promising for developing EPCs for warm regions, thus improving the design of EPCs by adding smaller amounts of additives that allow for an increase in PAR transmissivity without losing their other properties.

Author Contributions

Conceptualization, M.T.L. and E.G.; methodology, M.T.L. and E.G.; software, J.E.F. and R.J.-L.; validation, R.J.-L., M.T.L. and E.G.; formal analysis, J.A.R.-A.; investigation, J.E.F.; resources, M.T.L. and E.G. data curation, R.J.-L.; writing—original draft preparation, J.A.R.-A. and J.E.F.; writing—review and editing, M.T.L. and E.G.; visualization, R.J.-L.; supervision, M.T.L. and E.G.; project administration, M.T.L. and E.G.; funding acquisition, M.T.L. and E.G. All authors have read and agreed to the published version of the manuscript.

Funding

This research was funded by TRANSFIER E, grant number TRFE-I-2018/010.

Data Availability Statement

The data presented in this study are available in the Article.

Conflicts of Interest

The authors declare no conflict of interest.

References

  1. González Argandar, C. Evaluación Agronómica de Películas para Invernadero Formuladas con Nanoparticulas de Óxido de Zinc. Ph.D. Thesis, Centro de Investigación en Química Aplicada, Saltillo, Mexico, 2010. [Google Scholar]
  2. Orden, S.; Goldberg, M.; Quartino, R.; Mascarini, L.; Landini, A.; Malleville, H.; Bottini, L. Estudio comparativo entre ensayos de exposición natural y envejecimiento acelerado de films de polietilenos para invernaderos. Agric. Téc. 2000, 60, 295–304. [Google Scholar] [CrossRef]
  3. Franco, J.E.; Rodríguez-Arroyo, J.A.; Ortiz, I.M.; Sánchez-Soto, P.J.; Garzón, E.; Lao, M.T. Chemical, Radiometric and Mechanical Characterization of Commercial Polymeric Films for Greenhouse Applications. Materials 2022, 15, 5532. [Google Scholar] [CrossRef] [PubMed]
  4. Palma Pérez, A. Evaluación de las Propiedades Ópticas y Mecánicas de Diferentes Cubiertas Plásticas de Invernadero. Ph.D. Thesis, Universidad Autónoma Agraria Antonio Narro, Saltillo, Mexico, 2009. [Google Scholar]
  5. Del Ángel-Hernandez, M.; Zermeño-Gonzalez, A.; Melendres-Alvarez, A.; Campos-Magaña, S.; Cadena-Zapata, M.; Bosque-Villareal, G. Características de la cubierta de un túnel efecto en radiación, clorofila y rendimiento de calabacita. Rev. Mex. Cienc. Agrícolas 2017, 8, 1127–1142. [Google Scholar]
  6. Waaijenberg, D. Design, construction and maintenance of greenhouse structures. Acta Hortic. 2006, 710, 31–42. [Google Scholar] [CrossRef]
  7. Díaz Serrano, T. Plásticos, cubiertas a medida para invernaderos. Rev. Hortic. 2000, 1, 138–143. [Google Scholar]
  8. Escrig Rondan, C. Extrusión de Film Soplado; AIMPLAS Instituto Tecnológico del Plástico: Valencia, Spain, 2018. [Google Scholar]
  9. Godoy Arias, D.H. Análisis de Películas Utilizadas en Invernadero. Ph.D. Thesis, Escuela Politécnica Superior del Litoral, Guayaquil, Ecuador, 2007. [Google Scholar]
  10. Ruiz, P.; Sanders, B.; Vulic, I.; Zenner, J. Estabilización ultravioleta de películas de invernadero, experiencia de un proveedor de aditivos. In Proceedings of the V Congreso Iberoamericano para el Desarrollo y Aplicación de Plásticos en la Agricultura (CIDAPA 2004), Bogota, Colombia, 8–10 November 2004; pp. 55–62. [Google Scholar]
  11. Martínez Ramírez, J.N. Uso de Diferentes Cubiertas Plásticas en Invernadero para Mejorar los Efectos de Radiación, Temperatura y Humedad Relativa. Ph.D. Thesis, Centro de Investigación en Química Aplicada, Saltillo, Mexico, 2008. [Google Scholar]
  12. Espí, E.; Salmeron, A.; Garcia, Y.; Catalina, F. Pigmentos de inferencia como modificadores del espectro de transmisión de filmes agrícolas. Rev. Plásticos Mod. 2002, 83, 50–56. [Google Scholar]
  13. Ordaz Baldera, J.F. Estudio Sobre Películas Plásticas para Invernadero. Ph.D. Thesis, Centro de Investigación en Química Aplicada, Saltillo, Mexico, 2007. [Google Scholar]
  14. Ventura González, M. Transformación de Materiales Plásticos por Extrusión; AIMPLAS Instituto Tecnológico del Plástico: Valencia, Spain, 2002. [Google Scholar]
  15. Pillajo Sinailin, J.P. Evaluación de la Incorporación de un Masterbatch con Efecto Antitérmico en las Propiedades de Películas Sopladas de Polietileno de baja Densidad. Ph.D. Thesis, Escuela Politécnica Nacional, Quito, Ecuador, 2017. [Google Scholar]
  16. Hemming, S. Materiales difusos para cubiertas de invernadero no solamente para climas cálidos. Rev. Plast. 2008, 127, 25–39. [Google Scholar]
  17. Guzmán, P.M. Respuesta Fisiológica y Control Ambiental; Instituto Nacional de Capacitación para la Productividad Agrícola (INCAPA, S.C): Guadalajara, Mexico, 2000. [Google Scholar]
  18. Serope, K.; Steven, R.S. Manufacturing, Engineering and Technology, 4th ed.; Prentice-Hall Inc.: Upper Saddle River, NJ, USA, 2002. [Google Scholar]
  19. Shackelford, J.F. Introduction Materials Science for Engineers, 7th ed.; Library of Congress Cataloging Publication: Washington, DC, USA, 2009. [Google Scholar]
  20. Antignus, Y.; Mor, N.; Joseph, R.B.; Lapidot, M.; Cohen, S. Ultraviolet-absorbing plastic sheets protect crops from insect pests and from virus diseases vectored by insects. Environ. Entomo. 1996, 25, 919–924. [Google Scholar] [CrossRef]
  21. Orzolek, M. A Guide to the Manufacture, Performance and Potencial of Plastics in Agriculture; Elsevier: Oxford, UK, 2017. [Google Scholar]
  22. Soler, A.; Van Der Blom, J.; Cabello, T. Efectos de cubiertas de invernadero UV absorbentes en el comportamiento de polinizadores (Bombus terrestris y Apis mellifera: Hymenoptera, Apidae) en condiciones de bio-ensayo. In Proceedings of the Actas IV Congreso Nacional de Entomología Aplicada, Bragança, Portugal, 17–21 October 2005; p. 93. [Google Scholar]
  23. Pérez, M.; Teixeira da Silva, J.A.; Lao, M.T. Light management in ornamental crops. Floric. Ornam. Plant Biotechnol. 2006, 4, 683–695. [Google Scholar]
  24. Meca Abad, D.E. Evaluación de un Plástico Fotoselectivo NIR como Material de Cubierta de Invernadero. Ph.D. Thesis, Universidad de Almería, Almería, Spain, 2012. [Google Scholar]
  25. Bernat, C.J.; Martinez, J.; Vitoria, A. Invernaderos: Construcción, Manejo y Rentabilidad; Aedos: Barcelona, Spain, 1990. [Google Scholar]
  26. Jones, G.H. Plants and Microclimate. A Quantitative Approach to Environmental Plant Physiology, 2nd ed.; Cambridge University Press: Cambridge, UK, 1992; p. 428. [Google Scholar]
  27. Smith, H. Phytochromes and light signal perception by plants an emerging synthesis. Nature 2000, 407, 585–591. [Google Scholar] [CrossRef]
  28. Bastida, T.A.; Ramirez, J.A. Invernaderos en México: Diseño, Construcción y Manejo; Serie de publicaciones Agribot; UACH: Chapingo, Mexico, 2002; p. 163. [Google Scholar]
  29. Arbolí, M.I. Los plásticos como cubierta de invernaderos y túneles. Rev. Plast. 2000, 119, 15–25. [Google Scholar]
  30. Ibarra, J.L. Acolchado de Suelos. Ph.D. Thesis, Universidad Autónoma Agraria Antonio Narro, Saltillo, Mexico, 1997. [Google Scholar]
  31. Abreu, P.E.; Meneses, J.F. Climatic characterization of two plastic covered greenhouses under different natural ventilation methods, with a cold season tomato crop. Acta Hortic. 1994, 366, 195–200. [Google Scholar] [CrossRef]
  32. Baille, A. Greenhouse structure and equipment for improving crop production in mild winter climates. Acta Hortic. 1999, 491, 31–47. [Google Scholar] [CrossRef]
  33. Gálvez, A.; López-Marín, J.; Benavente-García, A. Uso de Cubiertas en Invernaderos con Materiales Plásticos Fotoselectivos para Variar la Temperatura Interior; Instituto Murciano de Investigación y Desarrollo Agrario y Alimentario (IMIDA): La Alberca, Spain, 2007. [Google Scholar]
  34. Samaniego, C.E.; Quezada, M.R.; De la Rosa, I.M.; Munguia, L.J.; Benavides, M.A.; Ibarra, J.L. Tomato and bell pepper seedlings production under reflecting polyethylene covers to decrease temperature in greenhouse. Rev. Agrociencia 2002, 36, 305–318. [Google Scholar]
  35. Pérez-Saiz, M.; Barbero-Francisco, F.J.; Lao-Arenas, M.T. Spectral distribution of light under different structures and cover materials employed in Mediterranean greenhouses. Acta Hortic. 2017, 1170, 905–914. [Google Scholar] [CrossRef]
  36. UNE-EN ISO 527-1; Plásticos. Determinación de las Propiedades en Tracción. Parte 1: Principios Generales. AENOR: Madrid, Spain, 2019.
  37. UNE-EN ISO 527-3; Plásticos. Determinación de las Propiedades en Tracción. Parte 3: Condiciones de Ensayo para Películas y hojas. AENOR: Madrid, Spain, 2019.
  38. UNE-EN ISO 6383-2; Plastics—Film and Sheeting—Determination of Tear Resistance—Part 2: Elmendorf Method. AENOR: Madrid, Spain, 2005.
  39. UNE-EN ISO 7765-1; Plastics Film and Sheeting—Determination of Impact Resistance by the Free-Falling Dart Method—Part 1: Staircase Methods. AENOR: Madrid, Spain, 2005.
  40. Larsen, S.; Hernández, A.; Lesino, G. Transmitancia de materiales fotoselectivos para cubiertas de invernaderos. Rev. Av. Energías Renov. Medio Ambiente 2003, 7, 49–54. [Google Scholar]
  41. Soler, A. Aplicación de los plásticos antiplagas en los invernaderos hortícolas. Horticom News, 22 November 2010. [Google Scholar]
  42. Ilić, Z.; Milenković, L.; Šunić, L.; Barać, S.; Mastilović, J.; Kevrešan, Ž.; Fallik, E. Effect of shading by coloured nets on yield and fruit quality of sweet pepper. Žemdirbystė (Agriculture) 2017, 104, 53–62. [Google Scholar] [CrossRef]
  43. Orden, S.; Mascarini, L.; Goldberg, M.; Sierra, E. Luz transmitida y dispersada por materiales para coberturas de invernaderos. Rev. Fac. Agron. UBA 1997, 17, 177–180. [Google Scholar]
  44. Sandri, M.; Andriolo, J.L.; Witter, M.; Dal Ross, T. Effect os shading on tomato plants grow under greenhouse. Hortic. Bras. 2003, 21, 642–645. [Google Scholar] [CrossRef]
  45. Bagdonavičienė, A.; Brazaitytė, A.; Jankauskienė, J.; Vaštakaitė, V.; Duchovskis, P. Effect of the photosynthetic photon flux density of industrial light-emitting diode lamps on assimilative índices in salad and vegetable transplants. Žemes Ukio Mokslai. 2015, 22, 173–180. [Google Scholar]
  46. Moens, F. The use of surface active additives as anti-fogagents in agricultural films. In Proceedings of the National Agricultural Plastics Congress; American Society for Plasticulture: Mobile, AL, USA, 1991; pp. 188–195. [Google Scholar]
  47. García-Caparros, P.; Almansa, E.M.; Barbero, F.J.; Chica, R.M.; Lao, M.T. Fittonia verschaffeltii response to artificial light treatments: Biomass, nutrient concentrations and physiological changes. Agronomy 2020, 10, 126. [Google Scholar] [CrossRef]
  48. Hemming, S.; Kempkes, F.; Van der Braak, N.; Dueck, T.; Marissen, N. Greenhouse cooling by NIR-reflection. Acta Hortic. 2006, 719, 97–105. [Google Scholar] [CrossRef]
  49. Abdel-Ghany, A.M.; Al-Helal, I.M.; Alzahrani, S.M.; Alsadon, A.A.; Ali, I.M.; Elleithy, R.M. Covering materials incorporating radiation-preventing techniques to meet greenhouse cooling challenges in arid regions: A review. Sci. World J. 2012, 2012, 906360. [Google Scholar] [CrossRef] [PubMed]
  50. Schwartz, H.; Shachar, A.; Kafrit, I. Absorbentes IR para films agrícolas. In Proceedings of the IV European of Additives & Color Europe, Aquisgrán, Germany, 16–17 March 2005. [Google Scholar]
  51. López-Marín, J.; González, A.; García Alonso, Y. Use of cool plastic films for greenhouse covering in Southern Spain. Acta Hortic. 2008, 801, 181–186. [Google Scholar] [CrossRef]
  52. Kittas, C.; Boulard, T.; Mermier, M.; Papadakis, G. Wind induced air exchange rates in a greenhouse tunnel with continuous side opening. J. Agric. Eng. Res. 1996, 65, 37–49. [Google Scholar] [CrossRef]
  53. Batschauer, A. Photoreceptors of higher plants. Planta 1998, 206, 479–492. [Google Scholar] [CrossRef] [PubMed]
  54. Smith, H.; Whitelam, G. The shade avoidance síndrome: Multiple responses mediated by multiple phytochromes. Plant Cell Environ. 1997, 20, 840–844. [Google Scholar] [CrossRef]
  55. Lin, C. Plant blue-light receptors. Trends Plant Sci. 2000, 5, 337–342. [Google Scholar] [CrossRef]
  56. Oliveira, C.; Vierira, L.; Bertolli, C.; Pacheco, C. Photosynthetic behavior, growth and essential oil production of Melissa officinalis L. cultivated under colored shade nets. Chil. J. Agric. Res. 2016, 76, 123–128. [Google Scholar] [CrossRef]
  57. Garzón, E.; Ortiz, M.; Castillo, J.; Rojano, A.; Sánchez, P. Modelización del proceso de envejecimiento natural de un material polimérico utilizable como cubierta de invernaderos. Rev. Latin. Am. Metal. Mat. 2017, 37, 60–82. [Google Scholar]
  58. Degarmo, E.; Black, J.; Kohser, R. Materials and Processes in Manufacturing, 9th ed.; John Wiley & Sons: New York, NY, USA, 2003. [Google Scholar]
  59. Matallana, A.; Montero, J.I. Invernaderos. Diseño, Construcción y Ambientación; Mundi-Prensa: Madrid, Spain, 1995. [Google Scholar]
  60. Briassoulis, D.; Waaijenberg, D.; Gratraud, J.; Von Elsner, B. Mechanical properties of covering materials for greenhouse. Part 2: Quality assessment. J. Agric. Eng. 1997, 67, 171–217. [Google Scholar] [CrossRef]
  61. Waldo, M. Tecnología en aditivos para películas de invernadero: De la estabilización UV a la funcionalización de propiedades plásticas. In Proceedings of the Tercer Simposio Internacional de Producción de Cultivos en Invernadero, Monterey, Mexico, 2005. [Google Scholar]
  62. Stoffers, J.A. Light transmission of zigzag-shaped multispan greenhouses. Acta Hortic. 1998, 456, 383–390. [Google Scholar] [CrossRef]
  63. Sangpradit, K. Study of the solar transmissivity of plastic cladding materials and influence of dust and dirt on greenhouse cultivations. Energy Procedia 2014, 56, 566–573. [Google Scholar] [CrossRef]
  64. Garcia, A.; Gónzalez, A.; López, J. New cool plastic films for green house covering in tropical and subtropical áreas. Acta Hortic. 2006, 719, 131–137. [Google Scholar] [CrossRef]
Figure 1. Pilot greenhouses with different covers from left to right blue, grey, yellow and colorless EPCs.
Applsci 13 13098 g001
Figure 2. Absorbance, transmittance and reflectance across the spectrum of the polymers studied.
Applsci 13 13098 g002
Figure 3. Relationship between transmittance of both sides of the EPCs Blue, Yellow, Grey and Colorless. The red circle highlights the asymmetry zone of the EPC Yellow for values lower than 60% transmittance.
Applsci 13 13098 g003
Figure 4. Comparative stress–strain curves of the EPCs (T.D.). Obtained from the average of the five samples analyzed per plastic film.
Applsci 13 13098 g004
Figure 5. Comparative stress–strain curves of the EPCs (L.D.). Obtained from the average of the five samples analyzed per plastic film.
Applsci 13 13098 g005
Figure 6. Incident PAR radiation in µmol m−2 s−1 from the outdoor side and that transmitted through the EPCs, as measured on 25 September 2019 between 6:00 h and 18:00 h (solar time).
Applsci 13 13098 g006
Figure 7. Average horary temperature recorded inside each greenhouse and outside for (a) September, (b) October and (c) November.
Applsci 13 13098 g007
Figure 8. Correlation between NIR (%) and maximum temperature (°C) inside the pilot greenhouses for EPCs: Yellow (Yellow dot), Colorless (black-white dot), Grey (Grey dot) and Blue (Blue dot).
Applsci 13 13098 g008
Figure 9. Average horary relative humidity recorded inside each greenhouse and outside for (a) September, (b) October and (c) November.
Applsci 13 13098 g009
Table 1. Average percentage values of transmittance in the UV-A, PAR and NIR spectral regions of polymers studied.
EPCSpectral Region (nm)
UV-A
(350–400)
PAR
(400–700)
NIR
(700–1100)
Blue9.4532.0461.45
Grey36.8562.3362.83
Yellow38.6492.3494.55
Colorless28.1185.7786.93
Table 2. Average percentage values of transmittance in the blue, red and far-red spectral regions of the polymers studied.
EPCSpectral Region (nm)
Blue
(400–500)
Red
(600–700)
Far Red
(700–800)
Blue42.2024.6644.06
Grey61.8462.6162.34
Yellow86.4294.9194.88
Colorless84.2686.6386.33
Table 3. Average percentage values of ratios between transmittance of spectral regions of the polymers studied.
EPCSpectral Regions
PAR/NIRR/FRB/R
Blue0.520.561.71
Grey0.991.000.99
Yellow0.981.000.91
Colorless0.991.000.97
Table 4. Average percentage values of light diffusion.
EPCSpectral Region (380–780 nm)
Diffusion (%)
Blue31
Grey40
Yellow27
Colorless34
Table 5. Values obtained from the stress–strain curves of the EPCs (T.D). Obtained from the average of the five samples analyzed per plastic film.
EPCYield Stress (MPa)Creep Limit Deformation (%)Tension in Proportionality Limit (MPa)Proportionality Limit Deformation (%)
Blue8.9626.37.5913.3
Grey10.8231.48.2711.5
Yellow10.6122.67.318.8
Colorless12.5327.99.5911.4
Table 6. Values obtained from the stress–strain curves of the EPCs (L.D). Obtained from the average of the five samples analyzed per plastic film.
EPCYield Stress
(MPa)
Creep Limit Deformation (%)Tension in Proportionality Limit
(MPa)
Proportionality Limit Deformation (%)
Blue9.97104.67.9415.1
Grey10.5499.78.8415.7
Yellow13.34110.011.4423.9
Colorless13.9489.212.3919.3
Table 7. Actual values of maximum and ultimate stresses and strains in the EPCs (T.D.). Obtained from the average of the five samples analyzed per plastic film.
EPCMaximum Stress
(MPa)
Maximum Deformation (%)Breaking Strain
(MPa)
Breakage Deformation (%)
Blue16.461058.5916.461058.59
Grey20.081162.4320.081162.43
Yellow17.561099.1117.561099.11
Colorless20.5891133.3720.591133.37
Table 8. Actual values of maximum and ultimate stresses and strains in the EPCs (L.D.). Obtained from the average of the five samples analyzed per plastic film.
EPCMaximum Stress
(MPa)
Maximum Deformation (%)Breaking Strain (Mpa)Breakage Deformation
(%)
Blue15.96846.9415.96846.94
Grey17.06872.1317.06872.13
Yellow17.56715.4417.56715.44
Colorless21.84943.0821.84943.08
Table 9. Actual average thickness and impact resistance of EPCs.
EPCActual Average Thickness (µm)Maximum Weight Supported without Breakage (g)Maximum Weight Reached at the End of the Test (g)
Blue219760895
Grey213745895
Yellow187445490
Colorless204490610
Table 10. Integral daily PAR radiation transmitted through the EPCs installed in the pilot greenhouses and its percentage related to outdoor PAR (1394.56 µmol m−2 s−1). Measurements on 25 September 2019 between 6:00 h and 18:00 h (solar time).
EPCPAR (µmol m−2 s−1)Transmittance
(%)
Blue319.5122.91
Grey710.2850.93
Yellow997.0871.50
Colorless1075.677.13
Table 11. PAR transmitted through the EPCs installed in the pilot greenhouses and their percentage ratio to the incident PAR radiation from outdoors (1671.09 µmol m−2 s−1) at 12 solar hours. Cumulative measurements over a 48-day period from 2 September 2019 to 15 November 2019.
EPCPAR (µmol m−2 s−1)Transmittance (%)
Blue469.4428.09
Grey941.4856.34
Yellow1352.3880.93
Colorless1387.883.05
Table 12. Differences in average, minimum and maximum temperatures (°C) recorded inside each greenhouse with respect to outside.
EPCAverage Temperature (°C)Minimum Temperature (°C)Maximum Temperature (°C)
Blue+3.47+0.23+9.8
Grey+4.09+0.57+12.39
Yellow+4.48−0.39+19.23
Colorless+4.36−0.61+18.21
Table 13. Difference in average relative humidity (%) recorded inside each greenhouse with respect to outside.
EPCAverage H.R (%)Minimum H.R (%)Maximum H.R (%)
Blue−5.53−19.32+7.78
Grey−6.92−22.23+7.87
Yellow−7.43−25.65+2.72
Colorless−6.92−24.83+2.88
Disclaimer/Publisher’s Note: The statements, opinions and data contained in all publications are solely those of the individual author(s) and contributor(s) and not of MDPI and/or the editor(s). MDPI and/or the editor(s) disclaim responsibility for any injury to people or property resulting from any ideas, methods, instructions or products referred to in the content.

