Abstract
Micro- and nano-scale pores develop in shale reservoirs, and the associated pore structure controls the occurrence state, gas content, seepage capacity, and micro-migration and accumulation mechanisms of shale gas. For this study, we mainly conducted tests, using field emission-scanning electron microscopy, of the isothermal methane adsorption of powder-sized samples under high temperatures (60–130 °C) and pressures (0–45 MPa), along with methane-saturated nuclear magnetic resonance tests of plug-sized samples under different temperatures (60–100 °C) and pressures (0–35 MPa). These samples were from Longmaxi shale cores from strata at different burial depths from the Zhaotong, Weiyuan, and Luzhou areas. As the burial depth increases, organic pores transform from complex networks to relatively isolated and circular pore-like structures, and the proportion of organic matter-hosted pores increases from 25.0% to 61.2%. The pore size is influenced by the pressure difference inside and outside the pores, as well as the surface tension of organic matter in situ. As the burial depth increases to 4200 m, the main peak of the pore size first increases from 5–30 nm to 200–400 nm and then decreases to 50–200 nm. This work establishes an NMR method of saturated methane on plug-sized samples to test the free gas content and develop a prediction model of shale reservoirs at different burial depths. The gas content of a shale reservoir is influenced by both burial depths and pore structure. When the burial depth of the shale gas reservoir is less than 2000 m, inorganic pores and microfractures develop, and the self-sealing ability of the reservoir in terms of retaining shale gas is weak, resulting in low gas content. However, due to the small pore size of organic pores and the low formation temperature, the content of adsorbed gas increases, accounting for up to 60%. As the burial depth increases, the free gas and total gas content increase; at 4500 m, the total gas content of shale reservoirs is 18.9 m3/t, and the proportion of free gas can be as high as 80%. The total gas content predicted by our method is consistent with the results of the pressure-holding coring technique, which is about twice our original understanding of gas content, greatly enhancing our confidence in the possibility of accelerating the exploration and development of deep shale gas.
1. Introduction
Due to the rapid growth in energy demand and progress in exploration technologies, shale reservoirs have become a valuable target for the production of natural gas and oil around the world [1,2,3]. The matrix of shale reservoirs is tight, with extremely low porosity and permeability, and a large number of nanopores are developed [4,5]. These nanopores (especially organic matter-associated pores) are the main storage spaces of shale gas [6,7]. Currently, the burial depth of the commercially developed shale gas reservoirs of the Sichuan Basin (China) is between 500 m and 5000 m, mainly concentrated in areas such as Zhaotong, Weiyuan, Fuling, Luzhou, and Yuxi [8]. After the hydraulic fracturing development of shale gas, a large amount of fracturing fluids will remain in the shale reservoir, causing changes to the pore structure of the shale reservoir and affecting shale gas seepage and development [9,10,11]. Therefore, it is of great significance to clarify the pore structure and gas-bearing characteristics of shale reservoirs at different burial depths to understand the occurrence mechanism, flow behavior, and exploitation after the fracturing of shale gas areas.
The rapid development of technologies for enhanced petroleum production has led to the continuous need for and improvement of pore structure testing methods for shale reservoirs. Overall, shale pore structure testing methods can be divided into two categories, comprising direct observation methods, such as field emission-scanning electron microscopy (FE-SEM) [12,13], computed tomography (CT) [14,15], broad ion-beam scanning electron microscopy (BIB-SEM), and focused ion-beam SEM (FIB-SEM) techniques to analyze the pore networks [16,17], and fluid introduction techniques such as low-temperature gas (N2 or CO2) physisorption, mercury intrusion porosimetry (MIP) [18,19], nuclear magnetic resonance (NMR) [20], small-angle neutron scattering (SANS) [21,22], and synchrotron-sourced small-angle X-ray scattering (SAXS) [23]. Each characterization method can obtain pore structure information within a specific size of scale, due to differences in its principles or data-interpretation models. For example, MIP can obtain connected pore throats that are larger than 3 nm, but the elastic compression of the minerals and organic matter reduces the reliability of test results at high intrusion pressures. Low-pressure gas (N2 and CO2) physisorption mainly obtains information regarding microporous (<2 nm in diameter) and mesoporous (2–50 nm) pores but is greatly influenced by data-interpretation models. FE-SEM imaging has a high resolution but is greatly affected by sample heterogeneity and experimental operators [24]. To obtain objective pore structure characteristics, a splicing technique employing FE-SEM images is gradually being developed, which not only allows for intuitive observations of pore morphology but also combines image-processing techniques to ascertain the porosity and pore size distribution of different pore types [25,26].
Shale gas has typical in-situ reservoir characteristics and mainly exists in organic-rich matrix pores and fractures, appearing in the form of adsorbed gas and free gas [27]. Gas content is an important indicator for reservoir evaluation and the selection of favorable areas for shale gas exploration, in which the ratio of free gas to adsorbed gas directly affects the productivity, cumulative production, and lifespan of a single gas well [28,29]. The accurate measurement of free gas and adsorbed gas in shale gas reservoirs is of great significance for the cost-effective exploration and development of shale gas.
Nowadays, the mainstream measurement methods for shale gas content can be divided into two categories. The first type is laboratory testing, including isothermal methane adsorption experiments [30] and saturated methane with low temperature (<60 °C) and pressure (<15 MPa) NMR experiments [31,32]. Isothermal methane adsorption experiments can be divided into volumetric and gravimetric methods. After extensive research and comparison by scholars, it has been found that the accuracy of the gravimetric method is much higher than that of the volumetric method [33,34,35]. There are many models for excess adsorption and the absolute adsorption of methane using the gravimetric method, including the Langmuir single-layer adsorption model and multi-layer adsorption model, the modified Brunauer–Emmett–Teller (BET) multi-layer model, the Dubinin–Radushkevich (DR) micropore filling model, the Freundlich model, and others [36,37,38,39]. When comparing the fitting results of different models, it is believed that the Langmuir multi-layer adsorption and DR models are more reliable, with a similarity greater than 90% [40,41,42]. Yang et al. (2022) compared and analyzed the differences in the results between the gravimetric isothermal methane adsorption and NMR methane adsorption methods for testing adsorbed gas [43] and reported that NMR methane adsorption is limited by the lower limit of the equipment’s testing range and so cannot fully characterize the adsorbed gas. Therefore, this study used a Langmuir multi-layer adsorption model to analyze the isothermal methane adsorption data. The samples used for measuring the gas content of shale in the laboratory mostly comprise crushed samples, which may damage the micro-fractures and macrospores, leading to an inability to characterize the free gas, mainly characterizing the adsorbed gas. Therefore, free gas is usually directly calculated using the total porosity and gas saturation of shale rocks [44]. However, in the process of calculating free gas, due to the difficulty in accurately measuring the total porosity [45,46] and correcting the adsorption phase volume [40], there are significant errors in the calculation of free gas. At present, the experimental conditions mostly use a low temperature (room temperature) and a low pressure (<10 MPa) for the saturated methane NMR testing of free gas [43,47]. There are few reports on the experimental measurement of free methane gas in shale under high-temperature and high-pressure conditions, leading to challenges in making an accurate evaluation of gas content in situ.
The second type of shale gas content measurement is on-site desorption, including atmospheric [48,49] and pressure-holding coring measurement [50]. Because the coring time of shale gas wells is generally long, the level of natural gas loss could be large [51,52,53]. This has led to controversy over the results of atmospheric on-site desorption. Using pressure-holding coring on-site desorption measurements to determine the gas volume during the pressure drop process is a relatively direct and accurate method. However, although this method can accurately measure the total gas content, it is difficult to measure the free gas content and the cost is very expensive, meaning that it is difficult to make it widely applicable.
The purpose of this study is to determine the gas content characteristics of shale gas reservoirs in situ at different burial depths more efficiently and accurately and to identify the controlling factors. The pore structures of shale reservoirs with different burial depths were characterized using FE-SEM, followed by image splicing and processing techniques. The pressure-holding coring for the on-site desorption results was used as an accurate way to determine the total gas content of shale reservoirs. In response to the lack of experimental testing for the total gas content of shale reservoirs in situ, especially for free gas testing, a combined characterization of free gas and adsorbed gas in shale reservoirs was established, using saturated NMR for the plug-sized samples and isothermal methane adsorption for the crushed samples, under high-temperature and high-pressure conditions. On this basis, a geological extrapolation model was established to predict the gas-bearing characteristics and controlling factors of shale reservoirs at different burial depths. The results will provide useful guidance for evaluating the mechanism and mode of gas enrichment for deep shale gas reservoirs in China.
2. Materials and Methods
2.1. Geological Background
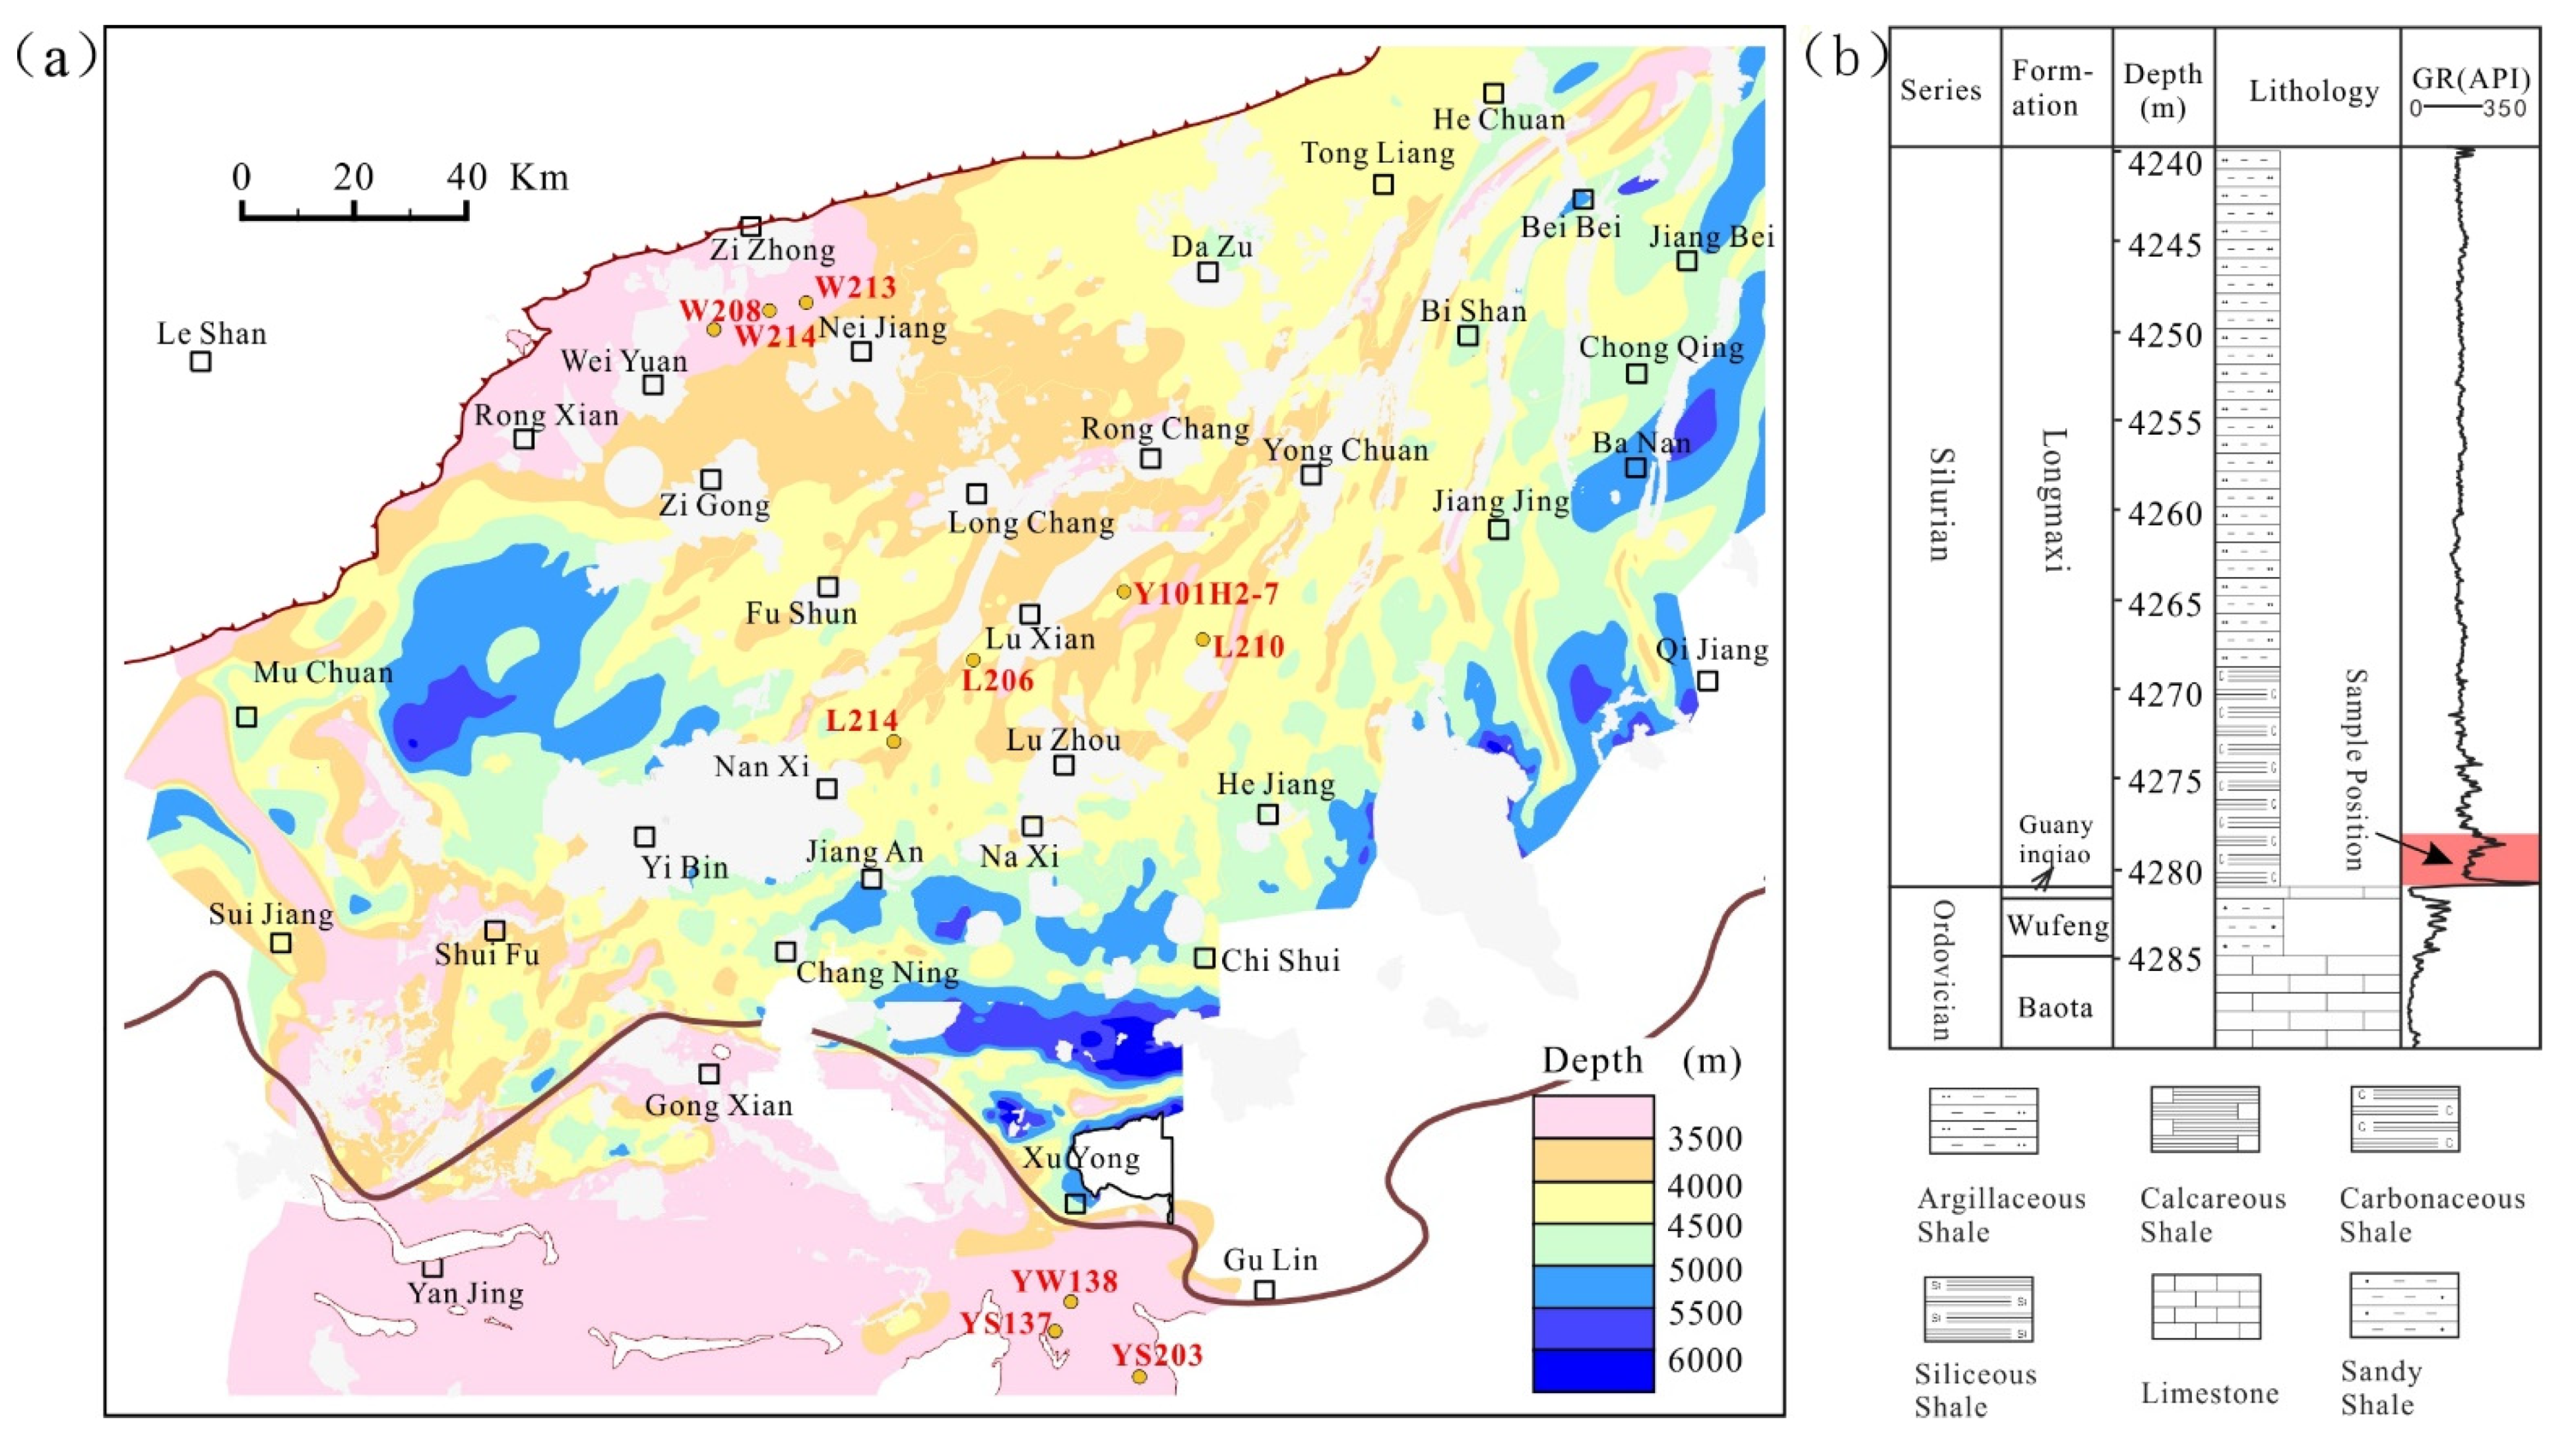
The studied shale samples are from the bottom of the Longmaxi Formation, which is located in the Zhaotong, Weiyuan, and Luzhou areas of the Sichuan Basin, which is currently the main target interval for shale gas exploration and development [54]. In an area affected by different tectonic processes, there are many differences in the burial depths of Longmaxi Formation shale in the three regions of Zhaotong (<2000 m), Weiyuan (2000–3500 m), and Luzhou (>3500 m) [55]. Due to the significant impact of tectonic action on the pore structure of shale reservoirs [56], the studied shale cores were selected from the synclinal areas that are far from the faults (Figure 1a). In order to eliminate the influence of lithofacies on pore structure, the selected shale cores in the study were all taken from the high gamma-ray value sections at the bottom of the Longmaxi Formation (Figure 1b). This set of Longmaxi Formation strata was deposited on the deep-water continental shelf, with black shale as the main lithology, and a large number of graptolites developed. The organic matter content of the strata is high, and the type is mainly I-type kerogen [8].
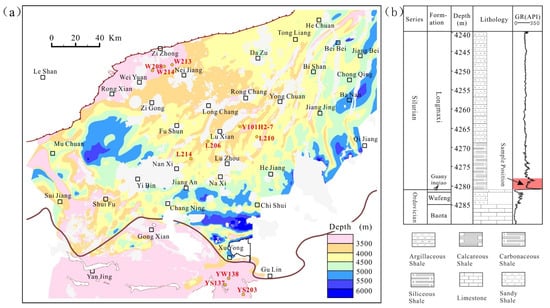
Figure 1.
(a) Burial depth map of shale reservoirs in the Longmaxi Formation, south Sichuan; (b) comprehensive histogram of the typical well strata.
2.2. Basic Property Measurements
The basic properties of shale required for this study include the total organic carbon (TOC) content, mineral composition, and porosity. The samples were crushed and sieved to <100-mesh particle size, using about 3 g for the TOC content test. TOC content was determined using a Var10EL-III elemental analyzer with a high-precision electronic balance. The mineralogy content of each sample was determined from an X-ray diffractometer equipped with Co Kα-radiation produced at 40 kV and 30 mA, following the testing standard of SY/T5163-2010 in China [57]. The porosity test was conducted using the water immersion porosity (WIP) method [46].
2.3. Pressure-Holding Coring Technique
Pressure-holding coring is an important technique for measuring the desorbed gas of conventional shale reservoirs in situ, but it is rarely used when evaluating the in situ gas-bearing properties of deeply buried shale because of its high cost. Therefore, there is still no complete measurement device, operating standard, or accepted process for pressure-holding coring. The experimental procedures used in this study after conventional coring followed the Chinese Petroleum and Natural Gas Industry standard SY/T 6940–2013 in China [58]. Compared to traditional on-site desorption methods, the difference lies in the use of liquid nitrogen-freezing during the coring process to prevent the gas escaping from the cores when they are exposed to the air. Therefore, pressure-holding coring can better measure the total gas content in shale cores. After obtaining liquid nitrogen-frozen shale cores, the specific desorption processes for gas content measurement followed the procedure reported in previous studies [50,59,60].
2.4. Field Emission-Scanning Electron Microscopy (FE-SEM)
The pore structure of shale samples at different burial depths was observed at fixed points using the FEI Quanta 650 FEG FE-SEM device produced by FEI in the Czech Republic. The resolution of this equipment, under high vacuum conditions of 30 kV, is 1.0 nm. In order to obtain nanopore images with high precision and a large field of view, this study used image acquisition and stitching to extract parameters such as shale pore composition and pore size distribution. The length of a single FE-SEM image for the experiment is 13.8 μm and the width is 9.9 μm. By concatenating 16 images horizontally and 16 images vertically, a cumulative sampling area of 220.8 μm × 158.4 μm can be obtained. By utilizing Adobe Photoshop to process high-resolution FE-SEM images of the shale, the pore boundaries could be identified automatically, but the pore types were identified manually. The surface porosity of the different pore types was calculated by filling them in using different colors, and the pore diameters were calculated using equivalent circles.
2.5. Saturated Methane NMR of Plug-Sized Shale Samples
Due to the large amount of methane adsorption in shale, the “saturated methane” mentioned in this experiment includes both adsorbed methane and free methane injected into the core pores under certain pressure conditions. A 1H-NMR Rock Core Analyzer manufactured by the Suzhou Niumag Analytical Instrument Corporation in China was employed in this study, which has a magnetic field of 0.3 ± 0.05 T and a frequency of 12 MHz. In order to verify whether the NMR technique can measure adsorbed gas, the original methane intake gas system was improved before this experimental test. A reference chamber with a known volume has been added between the sample chamber and the high-pressure methane cylinder (Figure 2) to record the pressure changes during the experiment and calculate the total methane mass injected into the sample chamber. This study used plug samples (diameter × height: 25.5 mm × 30 mm) that were saturated with methane for the NMR T2 spectrum testing, which has two advantages: one is to maintain the integrity of the micro-scale pore structure of shale reservoirs; the other is to effectively deduct the annular volume between the plug sample and sample chamber, achieving the monitoring of NMR signals for both adsorbed and free gases in the plug sample. Before each experiment, the chamber volume of the experimental equipment was calibrated using methane gas to avoid the impact of temperature changes on the experimental results. The methane in the sample chamber of the NMR system can be divided into three categories: free methane in the shale pores, adsorbed methane in the shale pores, and bulk methane that is free in the void space of the sample chamber and not related to the sample.
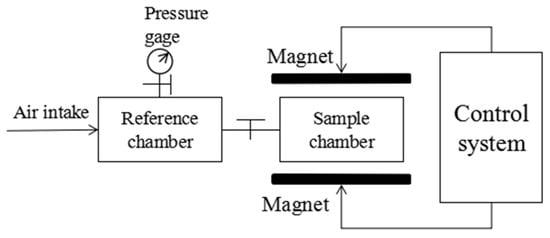
Figure 2.
Schematic of the experimental apparatus used in the NMR measurements.
The specific procedures for methane-saturated NMR T2 spectrum tests are as follows:
(1) Sample pretreatment: the shale samples are dried at 110 °C for 24 h and the mass of the dried core is recorded for gas content calculation.
(2) Test-parameter setting: the echo interval (TE) is set to 0.1 ms, the number of echoes (NECH) is set to 12,000, the cumulative scanning number (NS) is set to 128 times, and the waiting time (TW) is set to 3000 ms.
(3) Calibration between the methane mass and the NMR signal is conducted in an empty sample chamber with different pressures and temperatures: for this work, we tested the NMR T2 spectra at different temperatures (40 °C, 60 °C, 80 °C, and 100 °C) and pressures (2 MPa, 4 MPa, 6 MPa, 8 MPa, 10 MPa, and 12 MPa).
(4) Sample-testing steps: the dried sample is placed in the sample chamber for vacuum extraction and loading the peripheral pressure of the core (approximate formation pressure); the entire testing system is heated to the required temperature; a certain pressure of methane gas is injected into the reference chamber, and the pressure data (P1) are recorded after equilibrium; the valve between the reference chamber and the sample chamber is opened to allow methane gas to expand into the sample chamber; after the system pressure is balanced, the NMR T2 spectrum is tested and the pressure data (P2) are recorded. The criterion for determining the saturated methane equilibrium of shale is to test the NMR T2 spectrum every 1 h after methane adsorption for a set period of time until three consecutive NMR T2 spectra remain unchanged, indicating full saturation of the sample.
(5) Results processing: the saturated methane NMR signal intensity calculation is tested in the above steps. The conversion relationship between methane quality and NMR signal intensity can be expressed as follows [44]:
where m is the STP mass of methane (cm3), T2 is the measured peak area of the NMR T2 spectrum, and a is a parameter that varies with temperature.
m = a × T2
The mass of methane gas at a standard temperature and pressure (STP) can be quantified based on a relationship with respect to the measured gas pressure and a given methane density at the STP [44].
2.6. Gravimetric Adsorption of Crushed Shale
This study used a Rubotherm IsoSORP-HP Static II high-temperature and high-pressure adsorption instrument produced in Germany to conduct the isothermal methane adsorption experiments. The magnetic levitation balance in this equipment has an accuracy of 10 μg. The maximum pressure and temperature for the equipment experiments were 50 MPa and 140 °C. Because the burial depths of the shale reservoirs in this study varied greatly, the temperature and pressure conditions set in the experiment were based on the formation conditions of the selected shale gas well. If the temperature and pressure of the shale gas well are higher than the maximum values of the equipment, it will be selected for conducting isothermal methane adsorption experiments. The experimental procedures and data processing of this study followed the Chinese Energy Industry standard NB/T 10117-2018 [61]. The adsorption capacity (mabs) of the shale sample was calculated as follows [33]:
where Δm is the balance reading, msc is the mass of the sample container, ms is the mass of the sample, Vsc is the volume of the sample container, Vs is the sample volume, and Va is the volume of adsorbed phase. ρg is the density of free methane at a given temperature and pressure. Except for Va, other parameters can be obtained through experiments.
Then, the excess adsorbed mass (mex,) can be calculated as follows:
The corresponding absolute adsorption capacity (mabs) can then be expressed as [58]:
The excess adsorption capacity (mex) can be obtained through experiments. As the Langmuir model is the one most commonly used to fit the adsorption isotherms of methane adsorption in shale, mex can be expressed as:
where PL is the Langmuir pressure, VL represents the maximum absolute adsorption capacity, and P is the equilibrium pressure. We measured the excess adsorption capacity (mex) via experiments, fitted it using Equation (6), and obtained the adsorption phase density (ρa), after which, the adsorption gas capacity (mabs) can be calculated using Equation (5).
3. Results
3.1. Basic Properties
The TOC contents, porosity, and mineral components of the shale samples were characterized as shown in Table 1. The results show that the TOC contents of the selected samples ranged from 4.12% to 5.64%, with an average value of 4.63%. The porosity ranged from 5.10% to 8.45%, with an average value of 6.53%. The mineral composition was mainly of quartz and clay minerals, with an average of 49.4% and 21.4%, respectively. The TOC content and mineral composition of the shale reservoirs at different burial depths were not significantly different, but the porosity of shale reservoirs with shallow burial depths was slightly higher than those with greater burial depths. Although the shale contained the paramagnetic mineral pyrite, the content was less than 5%, yielding little impact on the nuclear magnetic response [62].

Table 1.
TOC content, mineral composition, porosity, and gas content parameters of the shale samples.
3.2. On-Site Desorption Gas Content from Pressure-Holding Coring
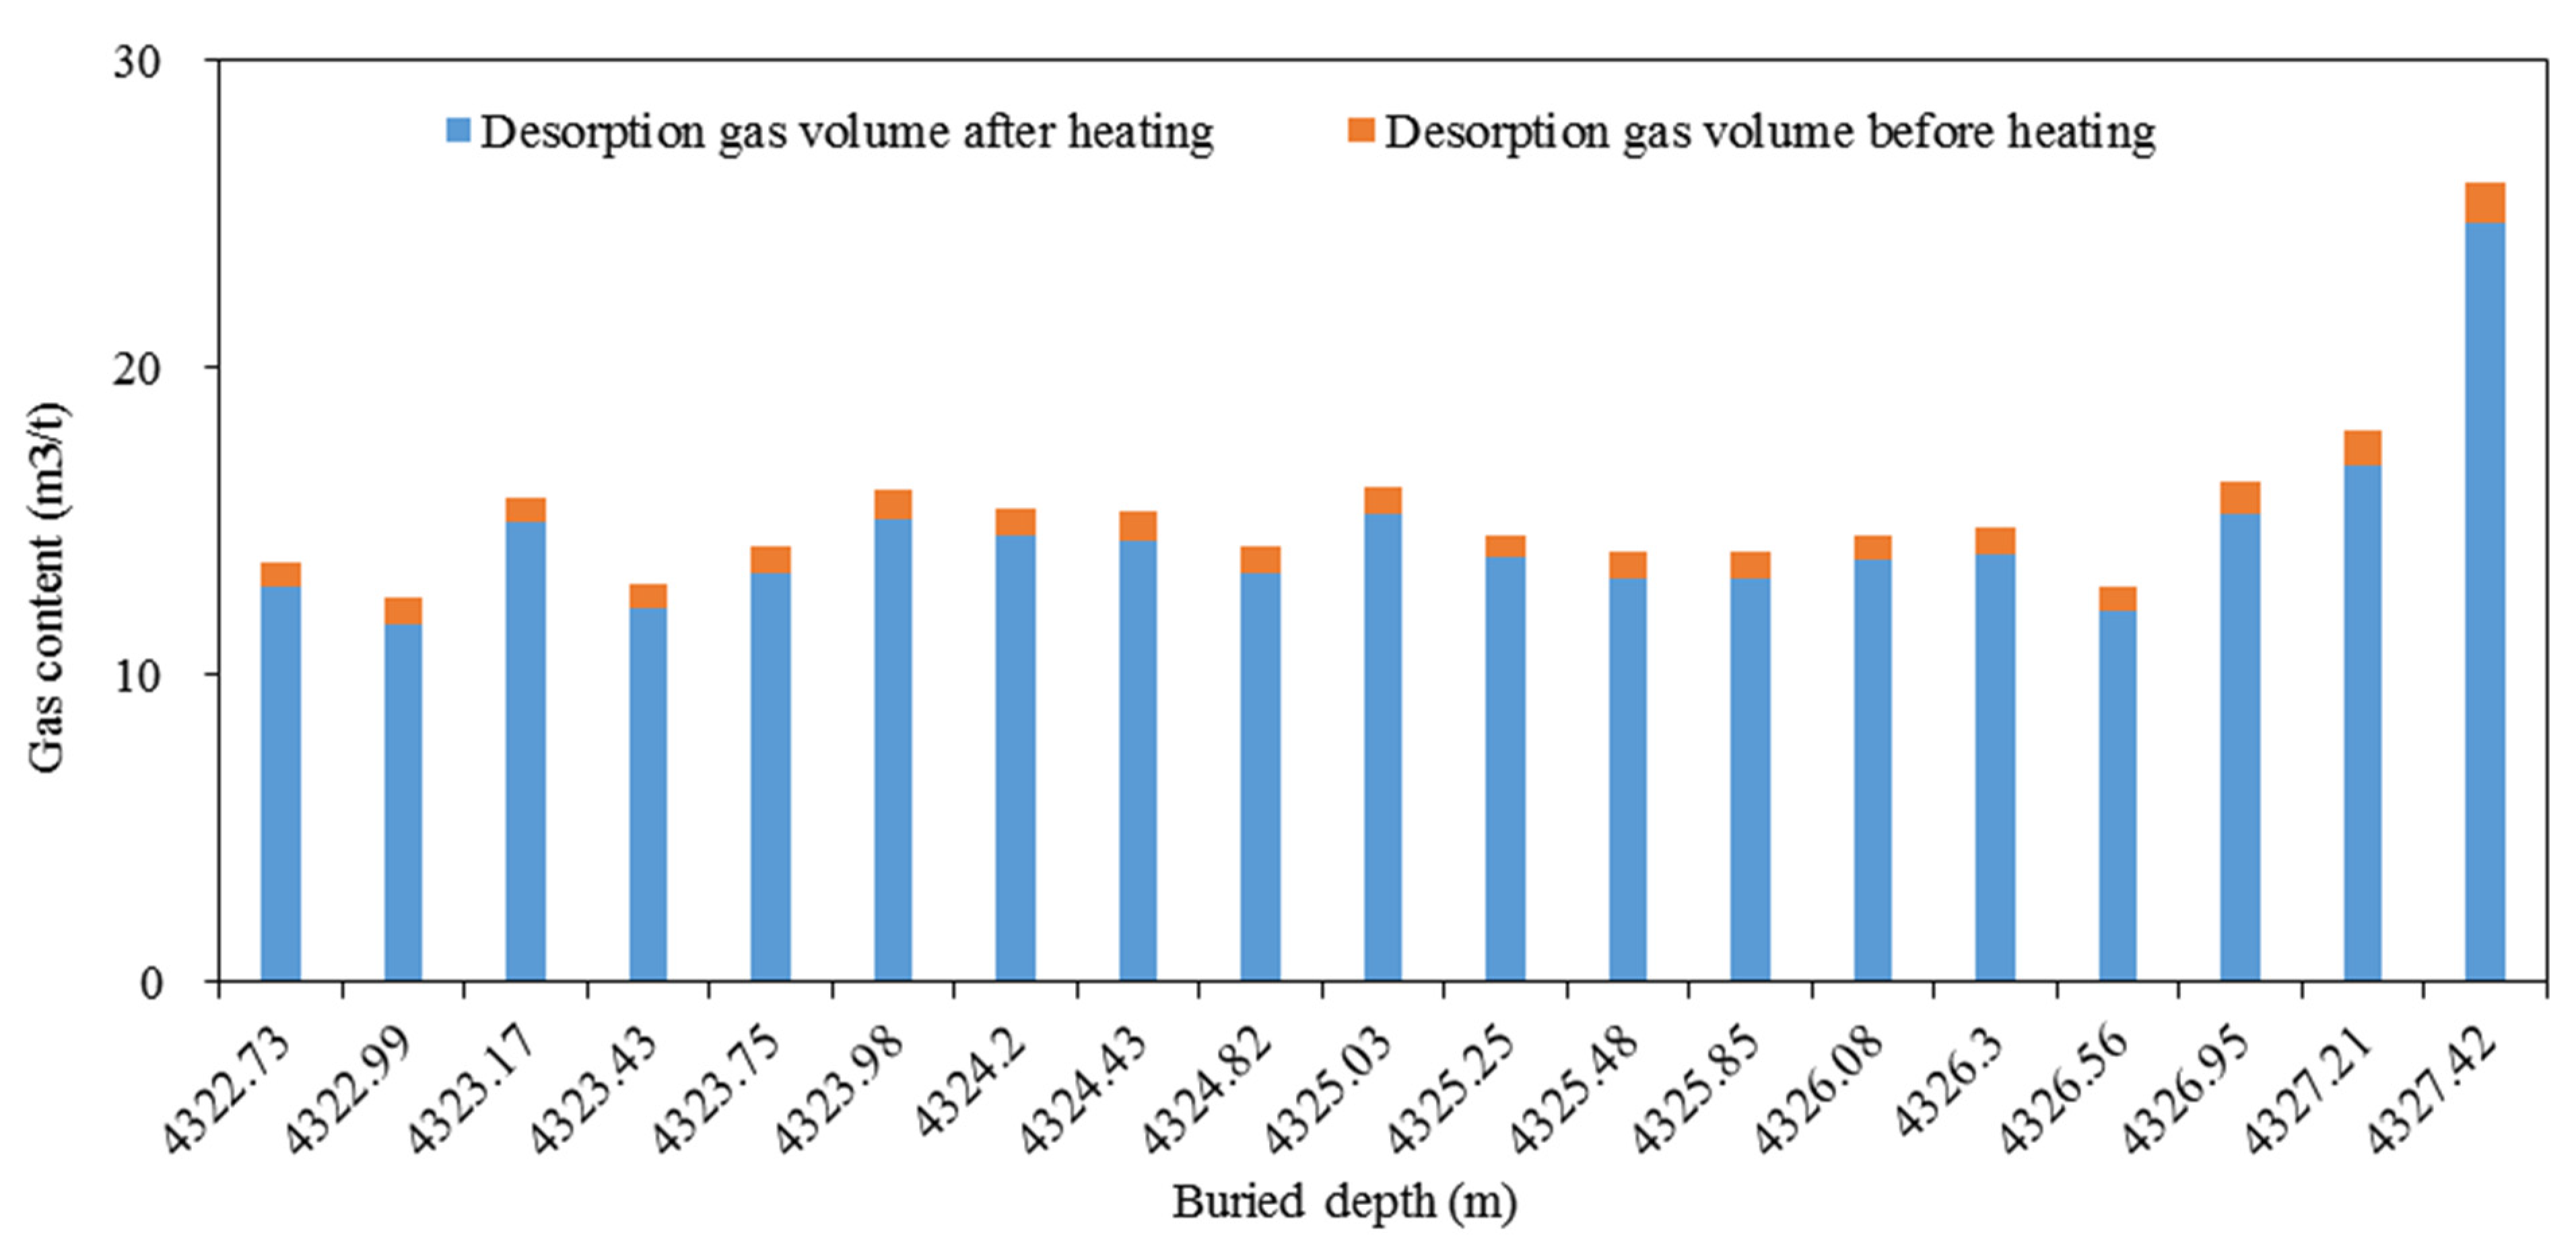
Due to the lack of standardized operating procedures and specifications for the pressure-holding coring technique, as well as the high cost, this study selected the L214 well for pressure-holding coring, to determine the accurate gas content of shale reservoirs and provide reference data for accurate shale gas content measurement. The total gas content of shale mainly consists of two parts, namely, the desorption gas volume before heating and the desorption gas volume after heating. The results of the pressure-holding coring gas content tests show that the desorption gas content before heating accounted for over 95% of the total gas content (Figure 3). The total gas content was between 12.48 and 26.00 m3/t, with an average content of 15.31 m3/t.

Figure 3.
Pressure-holding coring gas content results for high-quality shale in Well L214.
3.3. FE-SEM Characteristics of Shale Reservoirs with Different Burial Depths
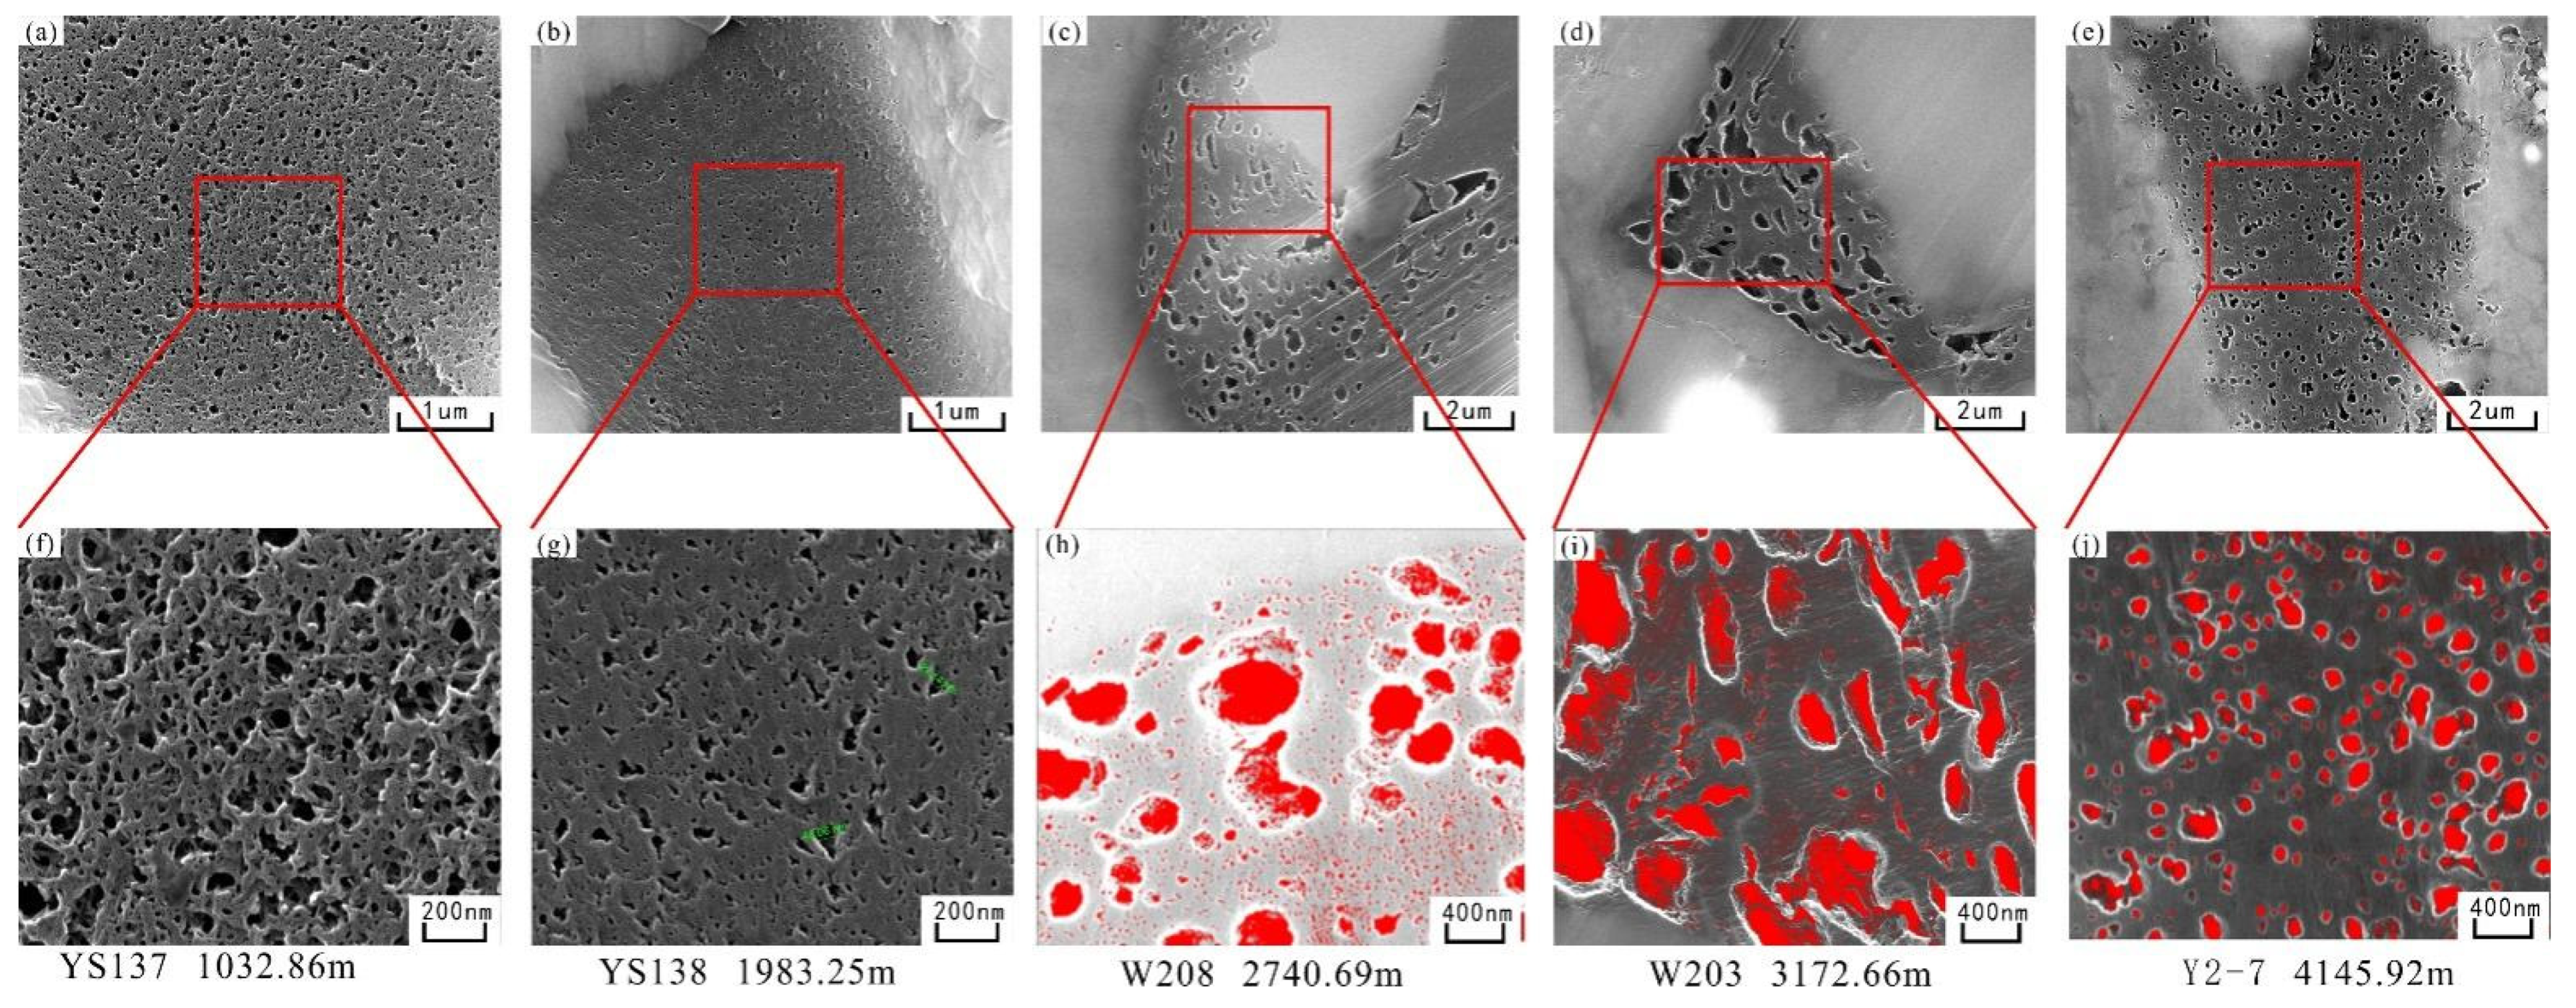
In order to analyze the impact of the burial depth of shale reservoirs on the development of pores and micro-fractures, FE-SEM observations were conducted on shale cores from typical wells in the Zhaotong, Weiyuan, and Luzhou areas with different burial depths but from the same shale layer. The earliest descriptive pore classification scheme for shale reservoirs was proposed by [12]; this shale pore system is divided into three categories: organic matter (OM) pores, intraparticle (IntraP) pores, and interparticle (InterP) pores. The development degree of OM pores is influenced by the TOC content and OM type; the pores mainly develop in bitumen [53,63]. Therefore, this study mainly observes the development characteristics of OM pores in bitumen.
The observation results show that the OM pores of the shale reservoir in the Zhaotong area (YS137 Well and YS138 Well), with a burial depth of less than 2000 m, exhibit a complex network structure with high connectivity, and the pore size of a single OM pore is basically less than 50 nm (Figure 4a,b,f,g).

Figure 4.
FE-SEM photos of OM pores in typical shale gas wells with different burial depths in the Zhaotong, Weiyuan, and Luzhou areas. (a,b) are OM pore photos of shale reservoirs in the Zhaotong area. (f,g) are local magnifications of OM pores in (a,b), respectively. The OM pores are in a network shape. (c,d) are OM pore photos of shale reservoirs in the Weiyuan area. (h,i) are local magnifications of OM pores in (c,d), respectively. The OM pores exhibit a phenomenon of “polarization”. (e) is OM pore photos of shale reservoirs in the Luzhou area. (j) is local magnification of OM pores in (e). The organic pores are circular in shape and relatively uniform in size. The red color in the photos of (h–j) represents the filling of OM pores, making it easy to observe small OM pores.
The OM pores of shale reservoirs in the Weiyuan area (W203 Well and W208 Well), with burial depths ranging from 2000 m to 3500 m, exhibit a phenomenon of “polarization”. Both macropores and needle-shaped pores have developed, and the macropores mingle with each other, with an average pore size that is greater than 200 nm. The needle-shaped pores are evenly distributed between the macropores, with pore sizes of only a few nanometers (Figure 4c,d,h,i).
The deep shale reservoirs in the Luzhou area (Y2-7 Well), with burial depths greater than 3500 m, have relatively uniform OM pores, high pore roundness, and pore sizes that are mainly distributed between 10 nm and 100 nm (Figure 4e,j).
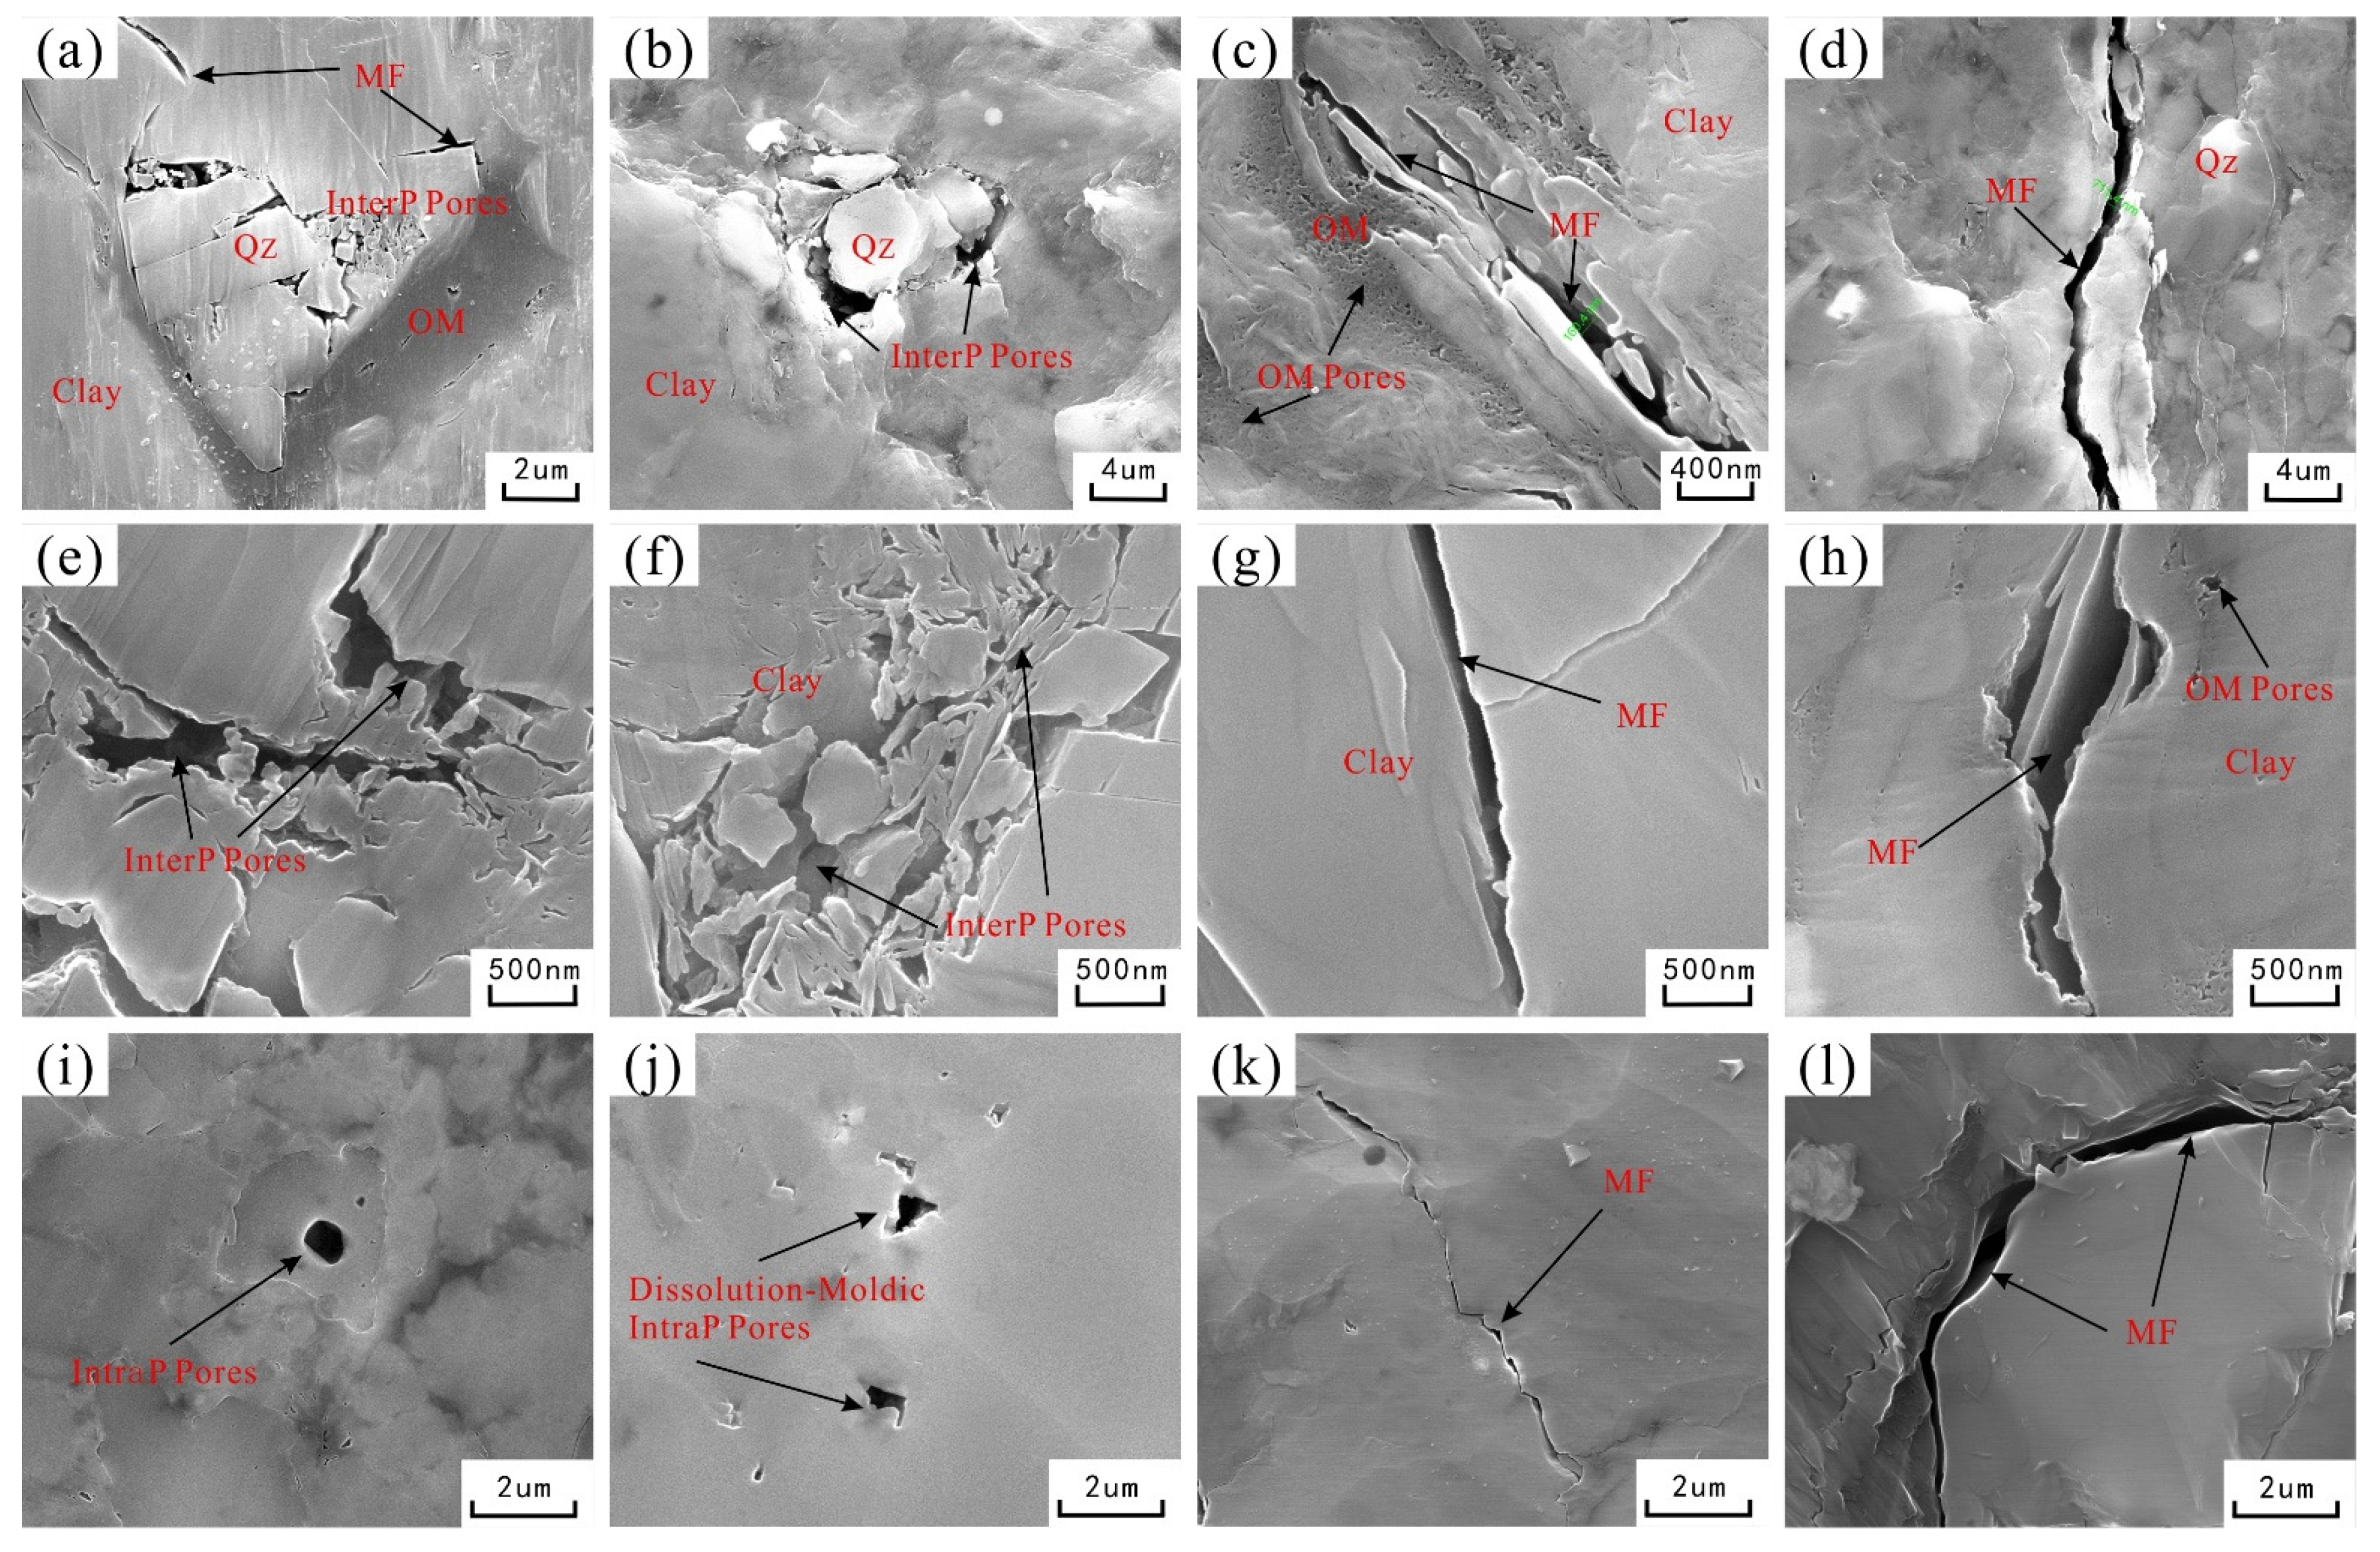
Inorganic pores and micro-fractures (MF) are important components of shale reservoir spaces. Two types of inorganic pores (IntraP pores and InterP pores) and MF of different origins (diagenetic shrinkage MF, tectonic MF, and mineral-edge MF) can be observed through FE-SEM tests.
It is obvious that the inorganic pores of the shale reservoir in the Zhaotong area, with a burial depth of less than 2000 m, are mainly InterP pores with irregular shapes and pore sizes of up to several micrometers (Figure 5a,b). In particular, the pores related to clay deposits are relatively well-developed (Figure 5c). The diagenetic shrinkage of clays and tectonic MF is frequently found (Figure 5c,d), wherein MF widths ranging from 160 nm to 5 μm and of several hundred nanometers are common.
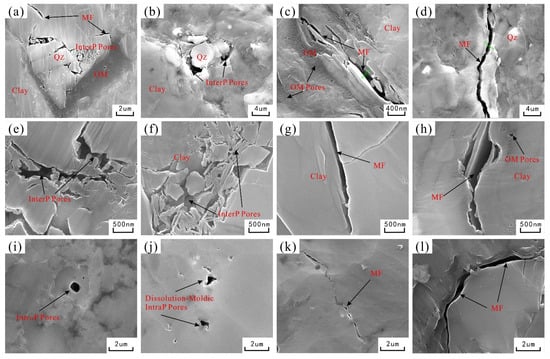
Figure 5.
Inorganic pore and micro-fracture FE-SEM photos of typical shale gas wells with different burial depths in the Zhaotong (a–d), Weiyuan (e–h), and Luzhou (i–l) areas.
The inorganic pores in shale reservoirs with burial depths ranging from 2000 m to 3500 m in the Weiyuan area mainly comprise InterP pores, with irregular pore morphology and pore sizes ranging from 50 to 800 nm (Figure 5e,f). Clay diagenetic shrinkage MF mainly develop with a limited scale and a width of about 500 nm (Figure 5g,h). In addition, tectonic MF are occasionally observed.
The burial depth of shale reservoirs in the Luzhou area is greater than 3500 m. Inorganic pores are mainly composed of IntraP pores, which mostly develop via mineral dissolution and are in the form of circular pores (Figure 5i,j). MF mostly develop at the edges of minerals, surrounding mineral development (Figure 5k,l). The width of the MF is usually less than 500 nm.
3.4. NMR T2 Spectrum with Different Pressures and Temperatures
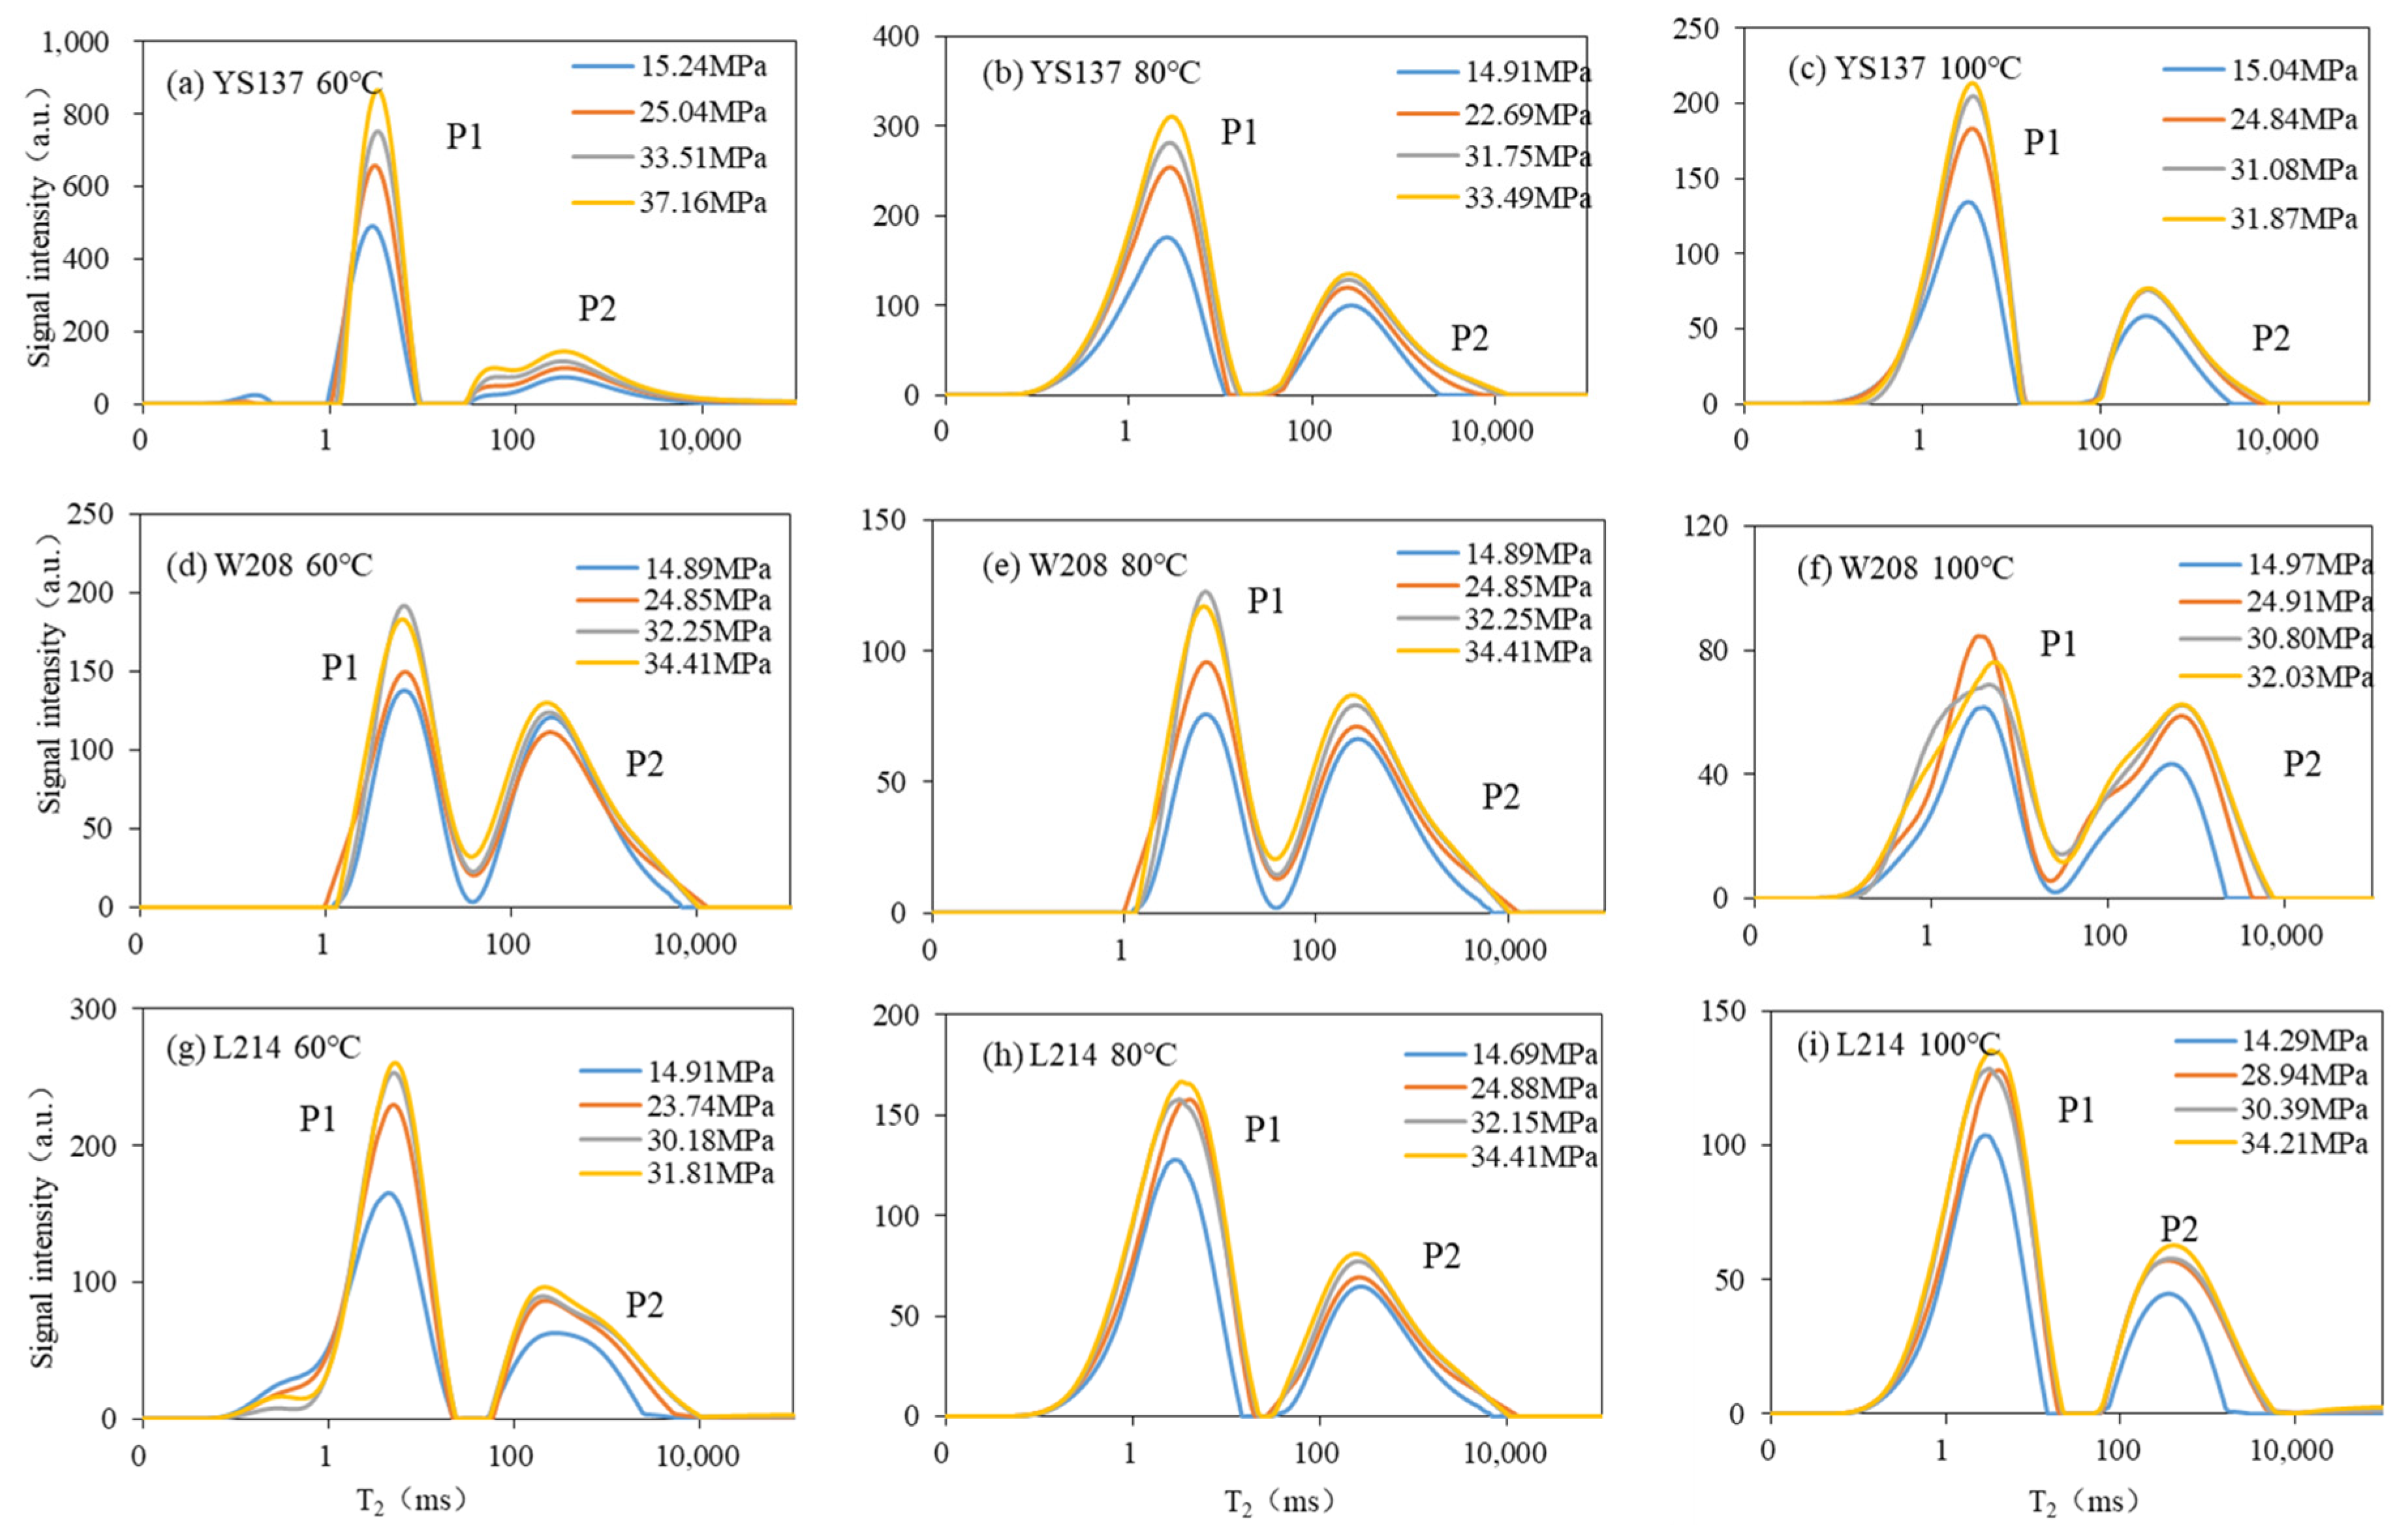
The NMR T2 spectra of saturated methane in cores of shale with different burial depths in the Zhaotong, Weiyuan, and Luzhou areas under different temperature and pressure conditions were taken. As shown in Figure 6, the peak area of the saturated methane NMR T2 spectrum increases with increasing pressure and decreases with increasing temperature. Each sample exhibits a bimodal feature in the saturated methane NMR T2 spectrum, which is different from the multi-peak feature of the crushed sample and plug sample of saturated methane with low pressure and low temperature in the NMR T2 spectrum [31,43]. The T2 times corresponding to the P1 and P2 peaks are 0.1–20 ms and 20–10,000 ms, respectively. Overall, the peak area of the NMR T2 spectrum between 0.1 and 1 ms is relatively small, being less than 5% of the total peak area. Therefore, we mainly analyze the NMR response characteristics of free gases that are greater than 1 ms. The smaller pores relax faster than the larger pores. The 1–20 ms NMR T2 peak (P1) comes from the surface relaxation of free gas in shale pores, while the 20–10,000 ms NMR T2 peak (P2) comes from the bulk relaxation of free gas micro-fractures and larger inorganic pores [17,31].
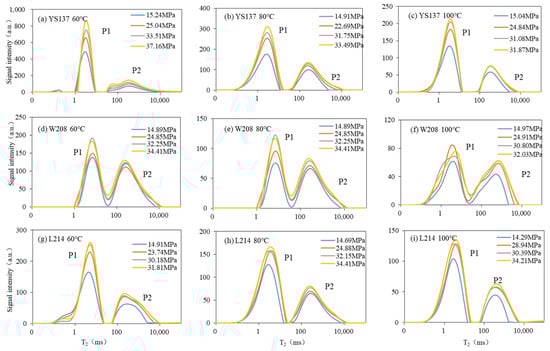
Figure 6.
NMR T2 spectra of typical wells from the Zhaotong, Weiyuan, and Luzhou areas under different temperature (60, 80, 100 °C) and pressure (14–38 MPa) values. P1 represents the left peak of NMR T2 spectrum, and P2 represents the right peak of NMR T2 spectrum.
For sample YS137, the maximum pressure NMR peak areas at 60 °C, 80 °C, and 100 °C were 18,616, 13,707, and 7354 a.u. (absolute unit), respectively, and the peak area of P1 is much larger than that of P2 (Figure 6a–c). As for sample W208, the maximum pressure NMR peak areas at 60 °C, 80 °C, and 100 °C are 9149, 6856, and 5320 a.u., respectively, but the peak area of P1 is basically equal to that of P2 (Figure 6d–f). The NMR T2 spectrum peak areas of the L214 sample at 60 °C, 80 °C, and 100 °C are 8979, 7363, and 5570 a.u., respectively, and the peak area of P1 is slightly larger than that of P2 (Figure 6g–i). Compared to others, the NMR T2 spectrum of sample YS137 in the Zhaotong area, with a burial depth of less than 2000 m, has the largest peak area, probably because of its highest porosity (Table 1).
3.5. Adsorption Capacity in Crushed Shale Core
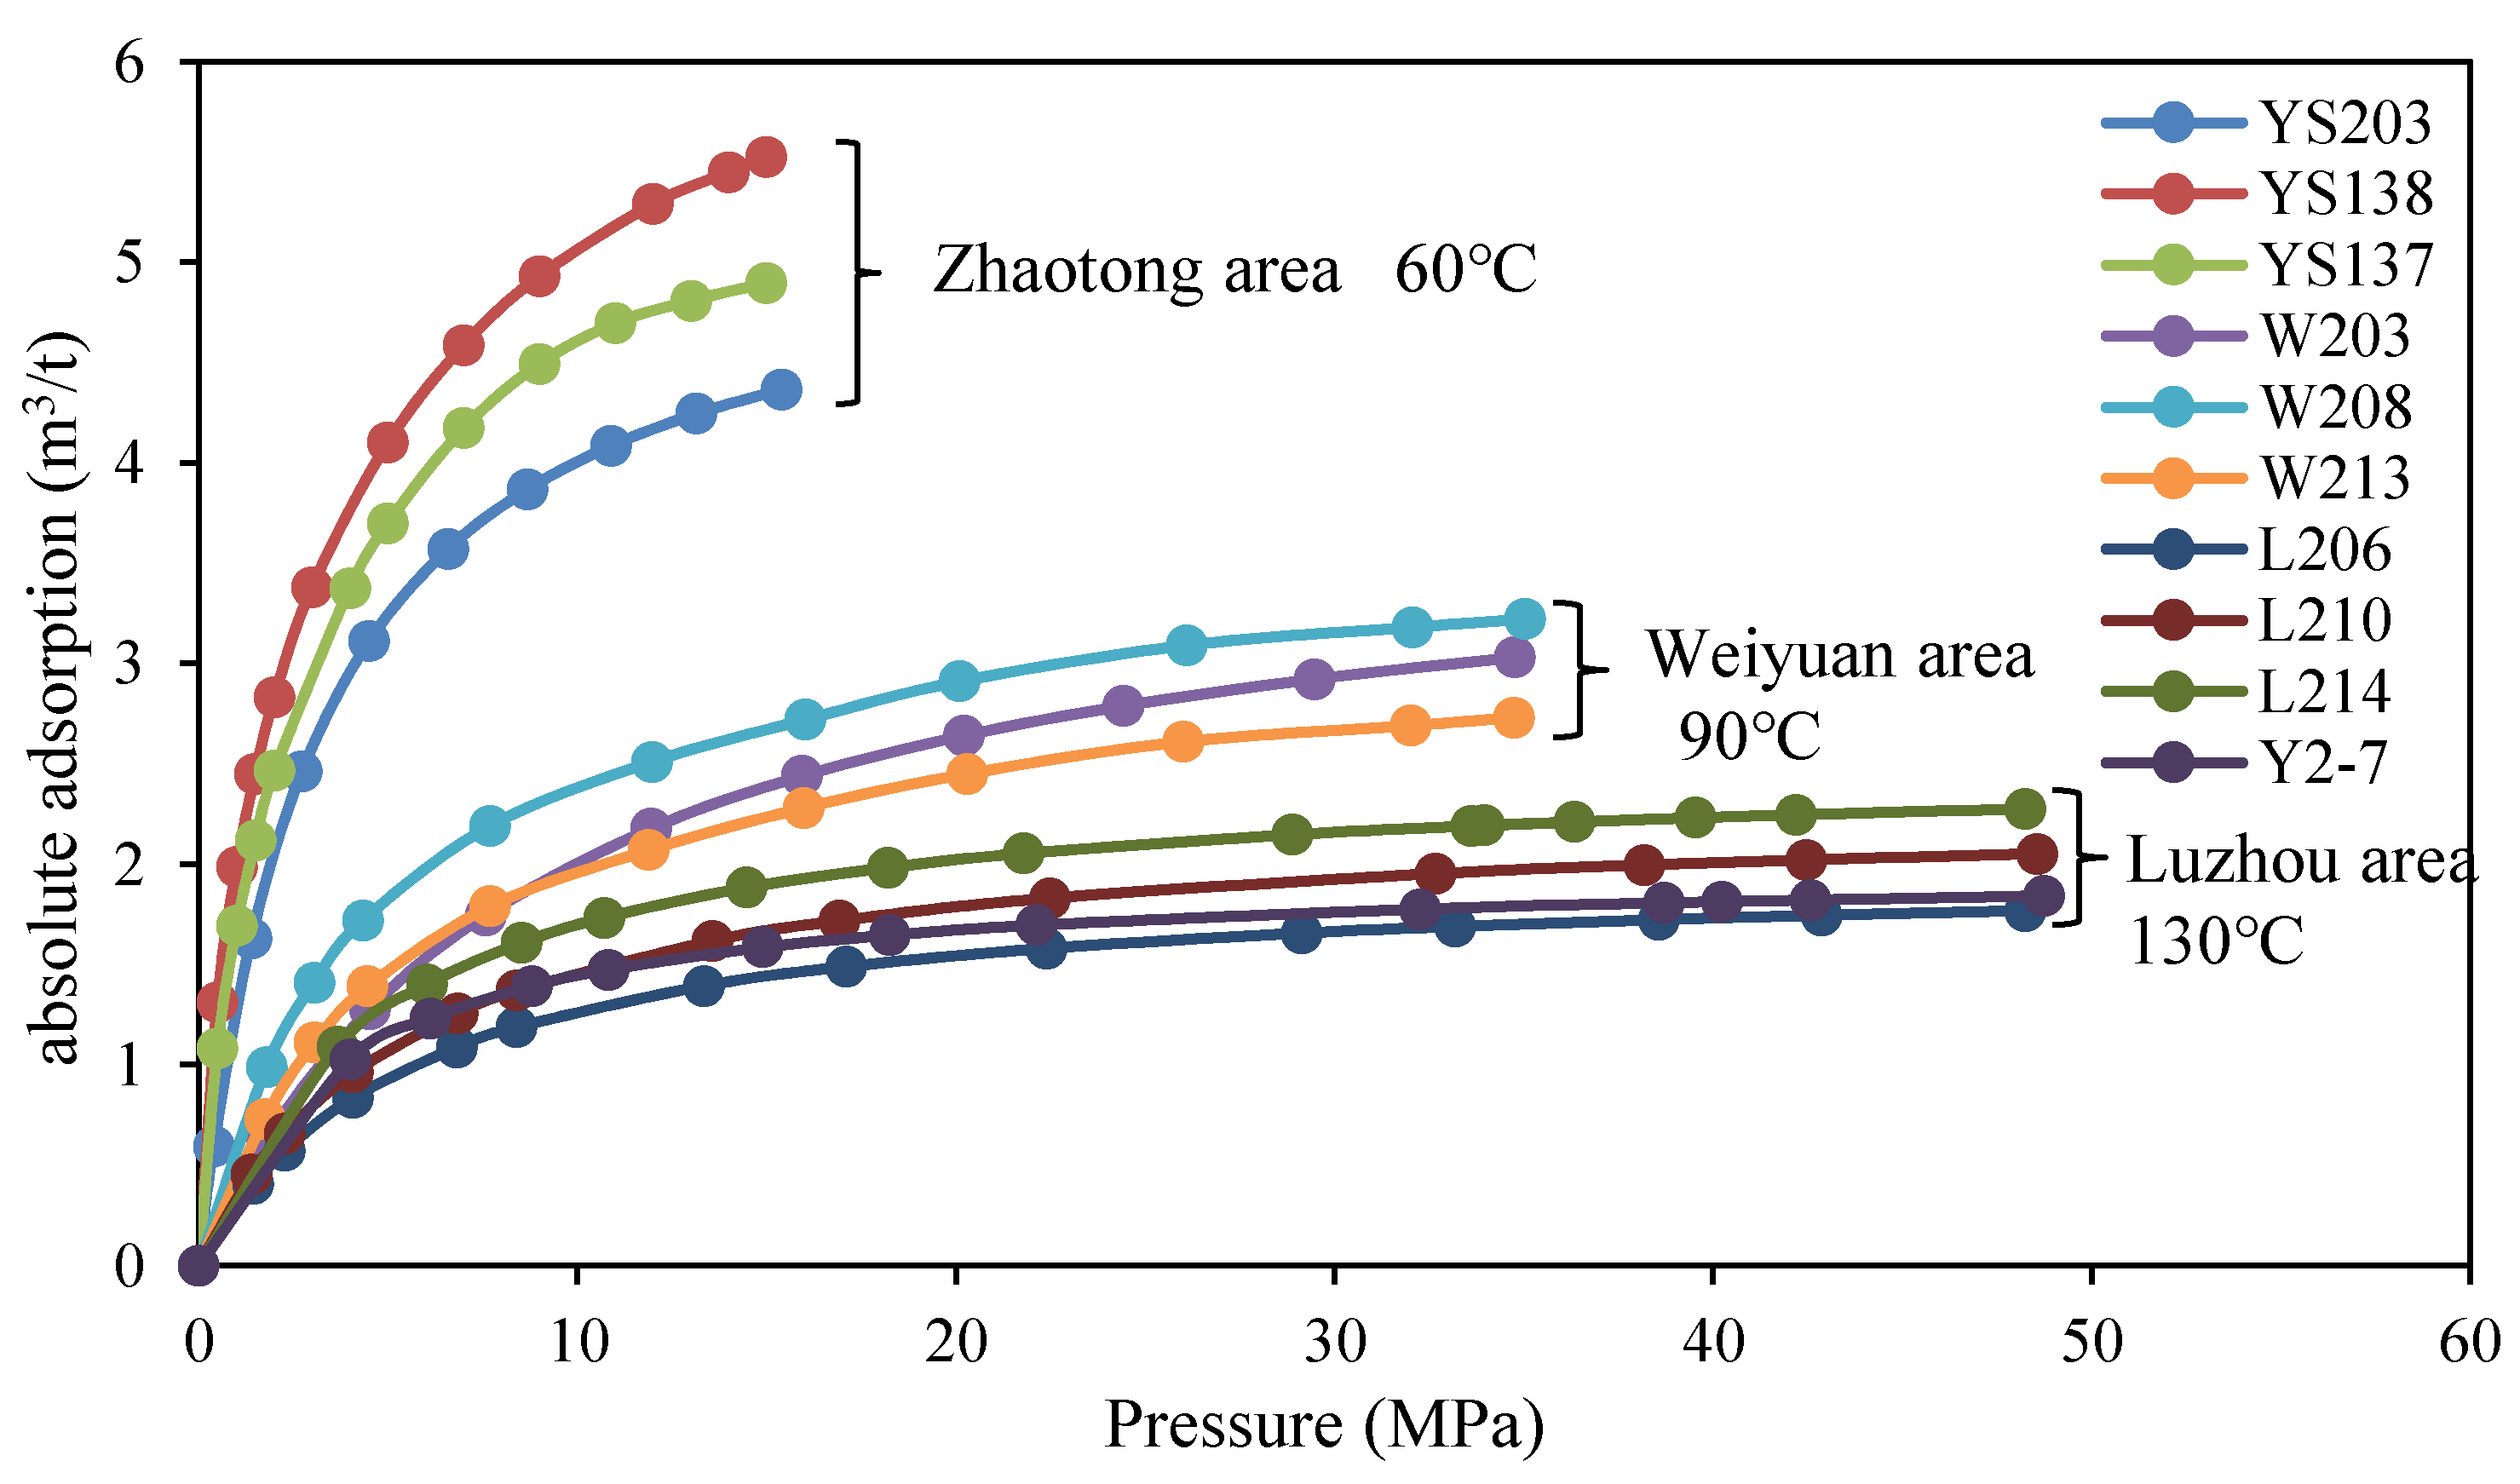
Under ultra-high-pressure conditions, the adsorbed gas capacity will reach saturation and reach its maximum value (Langmuir volume, VL), which can be used to represent the adsorbed gas content of the studied shale samples. In order to obtain the true adsorption capacity of shale reservoirs, the isothermal adsorption data were fitted using Equation (6), and the corresponding parameters (VL, PL, and ρa) were calculated (Table 1). At the same time, the absolute adsorption capacity was corrected through Equation (5) and is shown in Figure 7. As we can see, the adsorption capacity of shale reservoirs in the Zhaotong area is greater than those in the Weiyuan area and is greater than that in the Luzhou area. To simplify the comparison, we will consider VL as the maximum adsorption capacity. The average maximum adsorption capacity (VL) of shale reservoirs in the Zhaotong, Weiyuan, and Luzhou areas are 5.49 m3/t, 3.45 m3/t, and 2.19 m3/t, respectively; the specific reasons for this phenomenon will be discussed in Section 4.
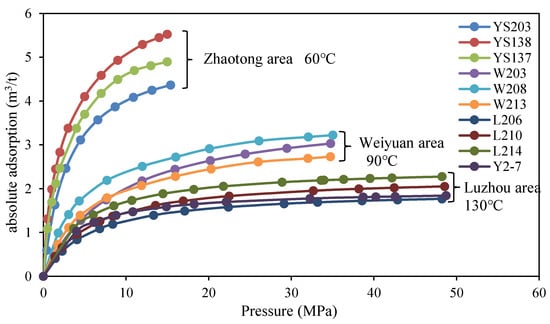
Figure 7.
Absolute adsorption curves of the shale samples from the Zhaotong, Weiyuan, and Luzhou areas.
4. Discussion
4.1. Comparison of the Total Gas Content Tests Using Different Methods
4.1.1. Traditional Method
For highly over-mature shale reservoirs, shale gas mainly consists of adsorbed gas and free gas. The adsorbed gas is usually characterized via methane isothermal adsorption experiments at formation temperature and pressure conditions. However, free gas in shale reservoirs is calculated through the parameters of porosity, bulk density, water saturation, formation temperature, and pressure of shale reservoirs; we call this method the traditional method. The specific calculation formula can be expressed as below [52]:
where Sg is the gas saturation, %; Tsc is the ground standard temperature, 298.15 K; Z is the gas compressibility factor; φ is the porosity, %; Psc is the ground standard pressure, 0.101 MPa; ρr is the density of gas-bearing rocks, in g/cm3; T is the formation temperature, K; P is the formation pressure, MPa.
The free gas content of the L214 shale sample under formation conditions was calculated to be 9.82 m3/t using traditional methods, and its adsorption capacity was 2.50 m3/t. Therefore, the total gas content of the L214 shale sample was 11.82 m3/t.
4.1.2. NMR Method
This study used plug sample nuclear magnetic resonance technology to test the free gas in shale reservoirs. Calculating the total gas content by the NMR method includes measuring the adsorption gas volume using an isothermal adsorption experiment and measuring the free gas volume using NMR. The temperature and pressure of the shale reservoirs in the Zhaotong and Weiyuan areas are 60 °C and 15 MPa, as well as 90 °C and 35 MPa, respectively. The free gas contents of shale reservoirs can be directly measured through NMR experiments. Due to the burial depth of the shale reservoirs in the Luzhou area exceeding 4000 m and the experimental pressure and temperature reaching 60 MPa and 130 °C, respectively, nuclear magnetic resonance equipment cannot meet the experimental requirements of formation conditions. Therefore, it is necessary to establish corresponding geological models for extrapolation. The method of extrapolation will be explained in detail in the following paragraphs.
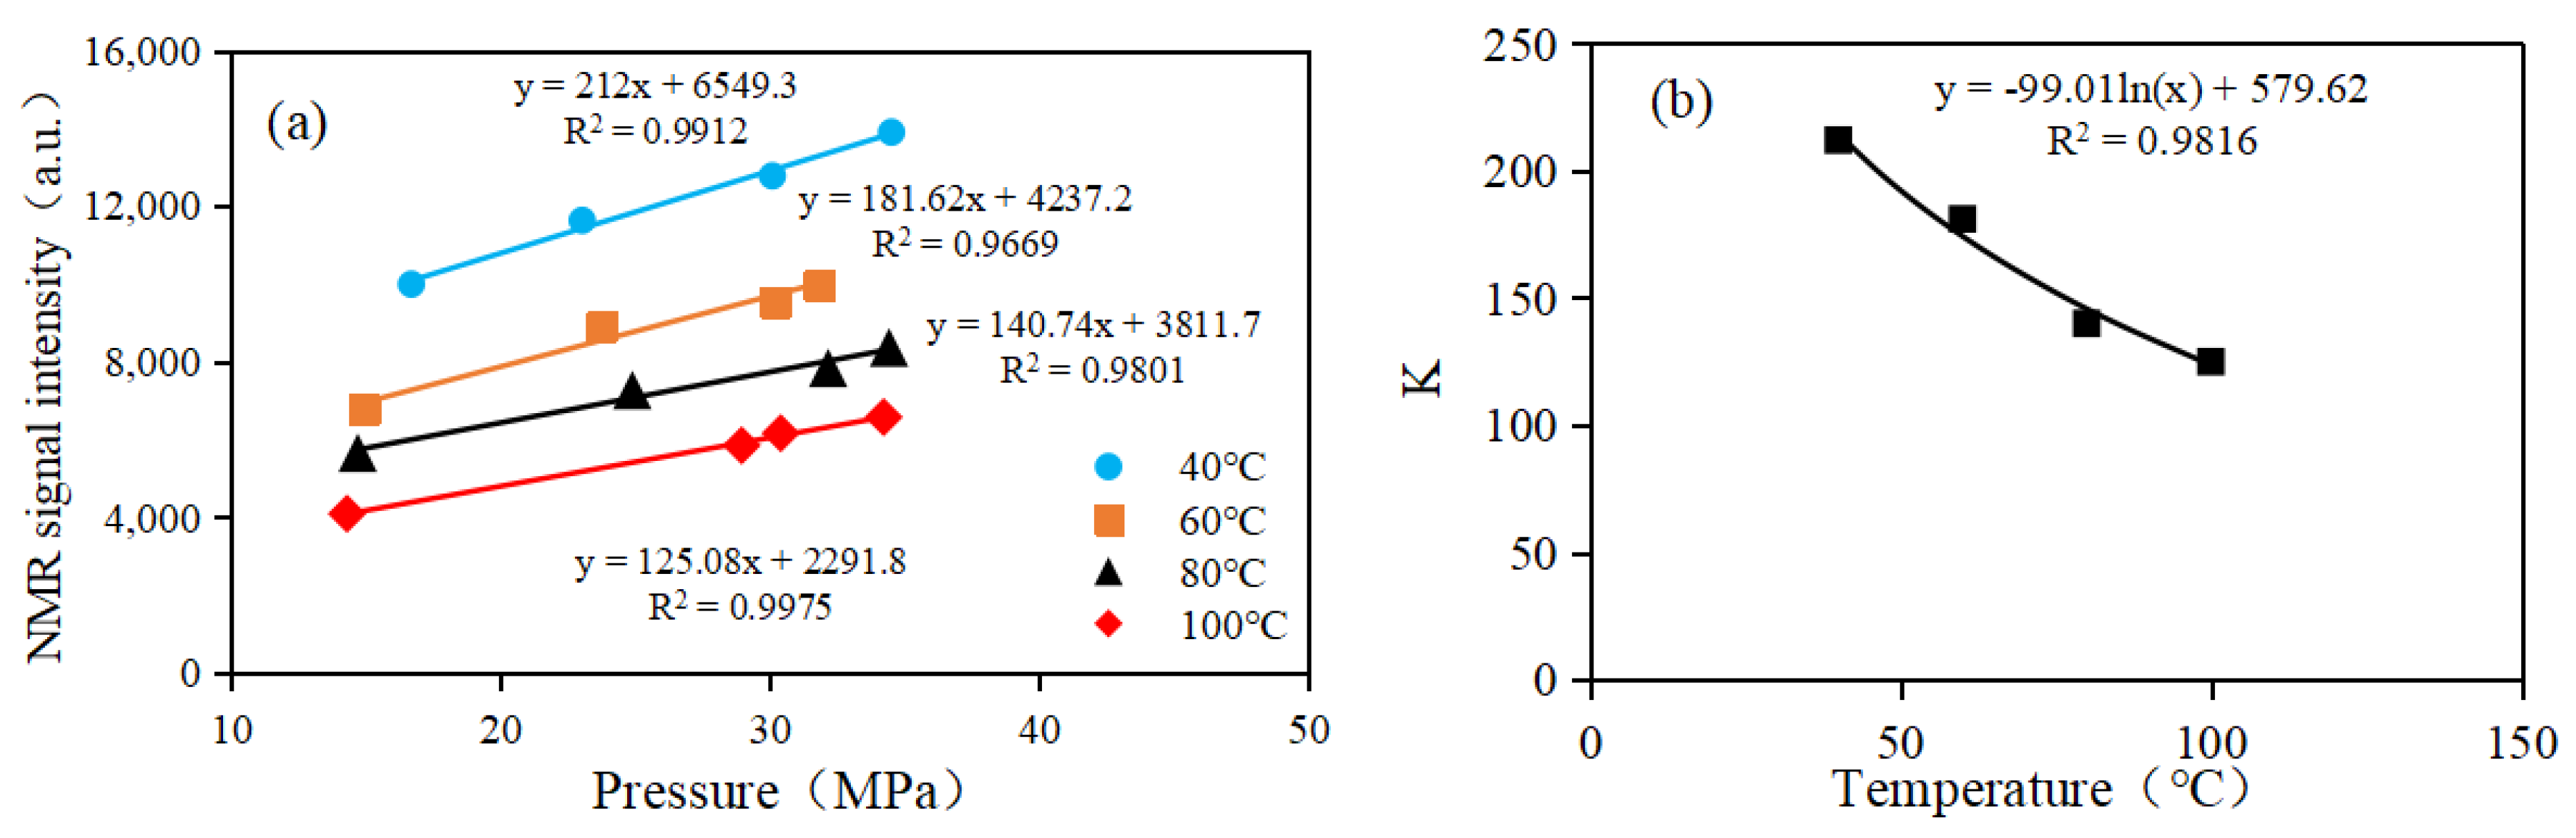
The saturated methane NMR signal intensity of the L214 samples under different temperature and pressure conditions was tested and plotted into the corresponding plates (Figure 8a). We can see that there is a good linear relationship between the NMR signal intensity and pressure under the same temperature conditions, which also indicates that the methane in shale cores exists in the form of free gas. Meanwhile, it should be pointed out that the NMR response characteristics of all samples under different temperature and pressure conditions are consistent with those of the L214 sample. These will not be explained individually in this work. The slope (K) of the straight line varies at different temperatures and decreases in a negative logarithmic form as the temperature increases (Figure 8b). Whether it is in the form of free methane in the shale pores or bulk relaxation methane in the MF and sample cells, the NMR signal intensity will decrease with increasing temperature. As temperature mainly affects the K value on the basis of pressure linearity, Equation (1) can be rewritten as:
where a and b are constants. T is the experimental temperature, in °C. The NMR signal intensity of actual shale samples at different temperatures and pressures can be fitted using multivariate nonlinear regression, based on the experimental results and the correlation in Figure 8. The specific expression is as follows:
where A, B, and C are constants; T is the experimental temperature, in °C.
T2free = [A × LN(T) + B] × P + C
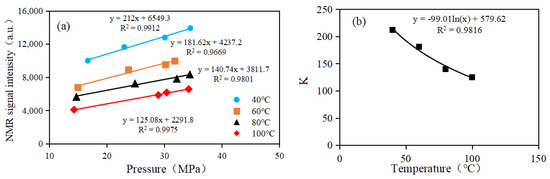
Figure 8.
(a) The relationship between NMR signal intensity and pressure in the L214 shale samples at different temperatures; (b) the relationship between the linear slope (K: between pressure and signal intensity at different temperatures) and temperature.
We organized the NMR signal intensity of the same sample, tested it under different temperature and pressure conditions, recorded it in Microsoft Excel, and imported it into the Origin function analysis software. We then used Equation (9) in tens of thousands of iterations to ensure the convergence and strong correlation of the function. After fitting the actual experimental data, the values of A, B, and C were 3.57, 3.20, and 4552, respectively. The square of the correlation coefficient was 0.86. Then, the NMR signal intensity of the L214 sample at 130 °C and 60 MPa was calculated to be 5787 a.u. Therefore, the free gas content at STP was 16.38 m3/t and the total gas content was 18.88 m3/t.
4.1.3. Results Comparison
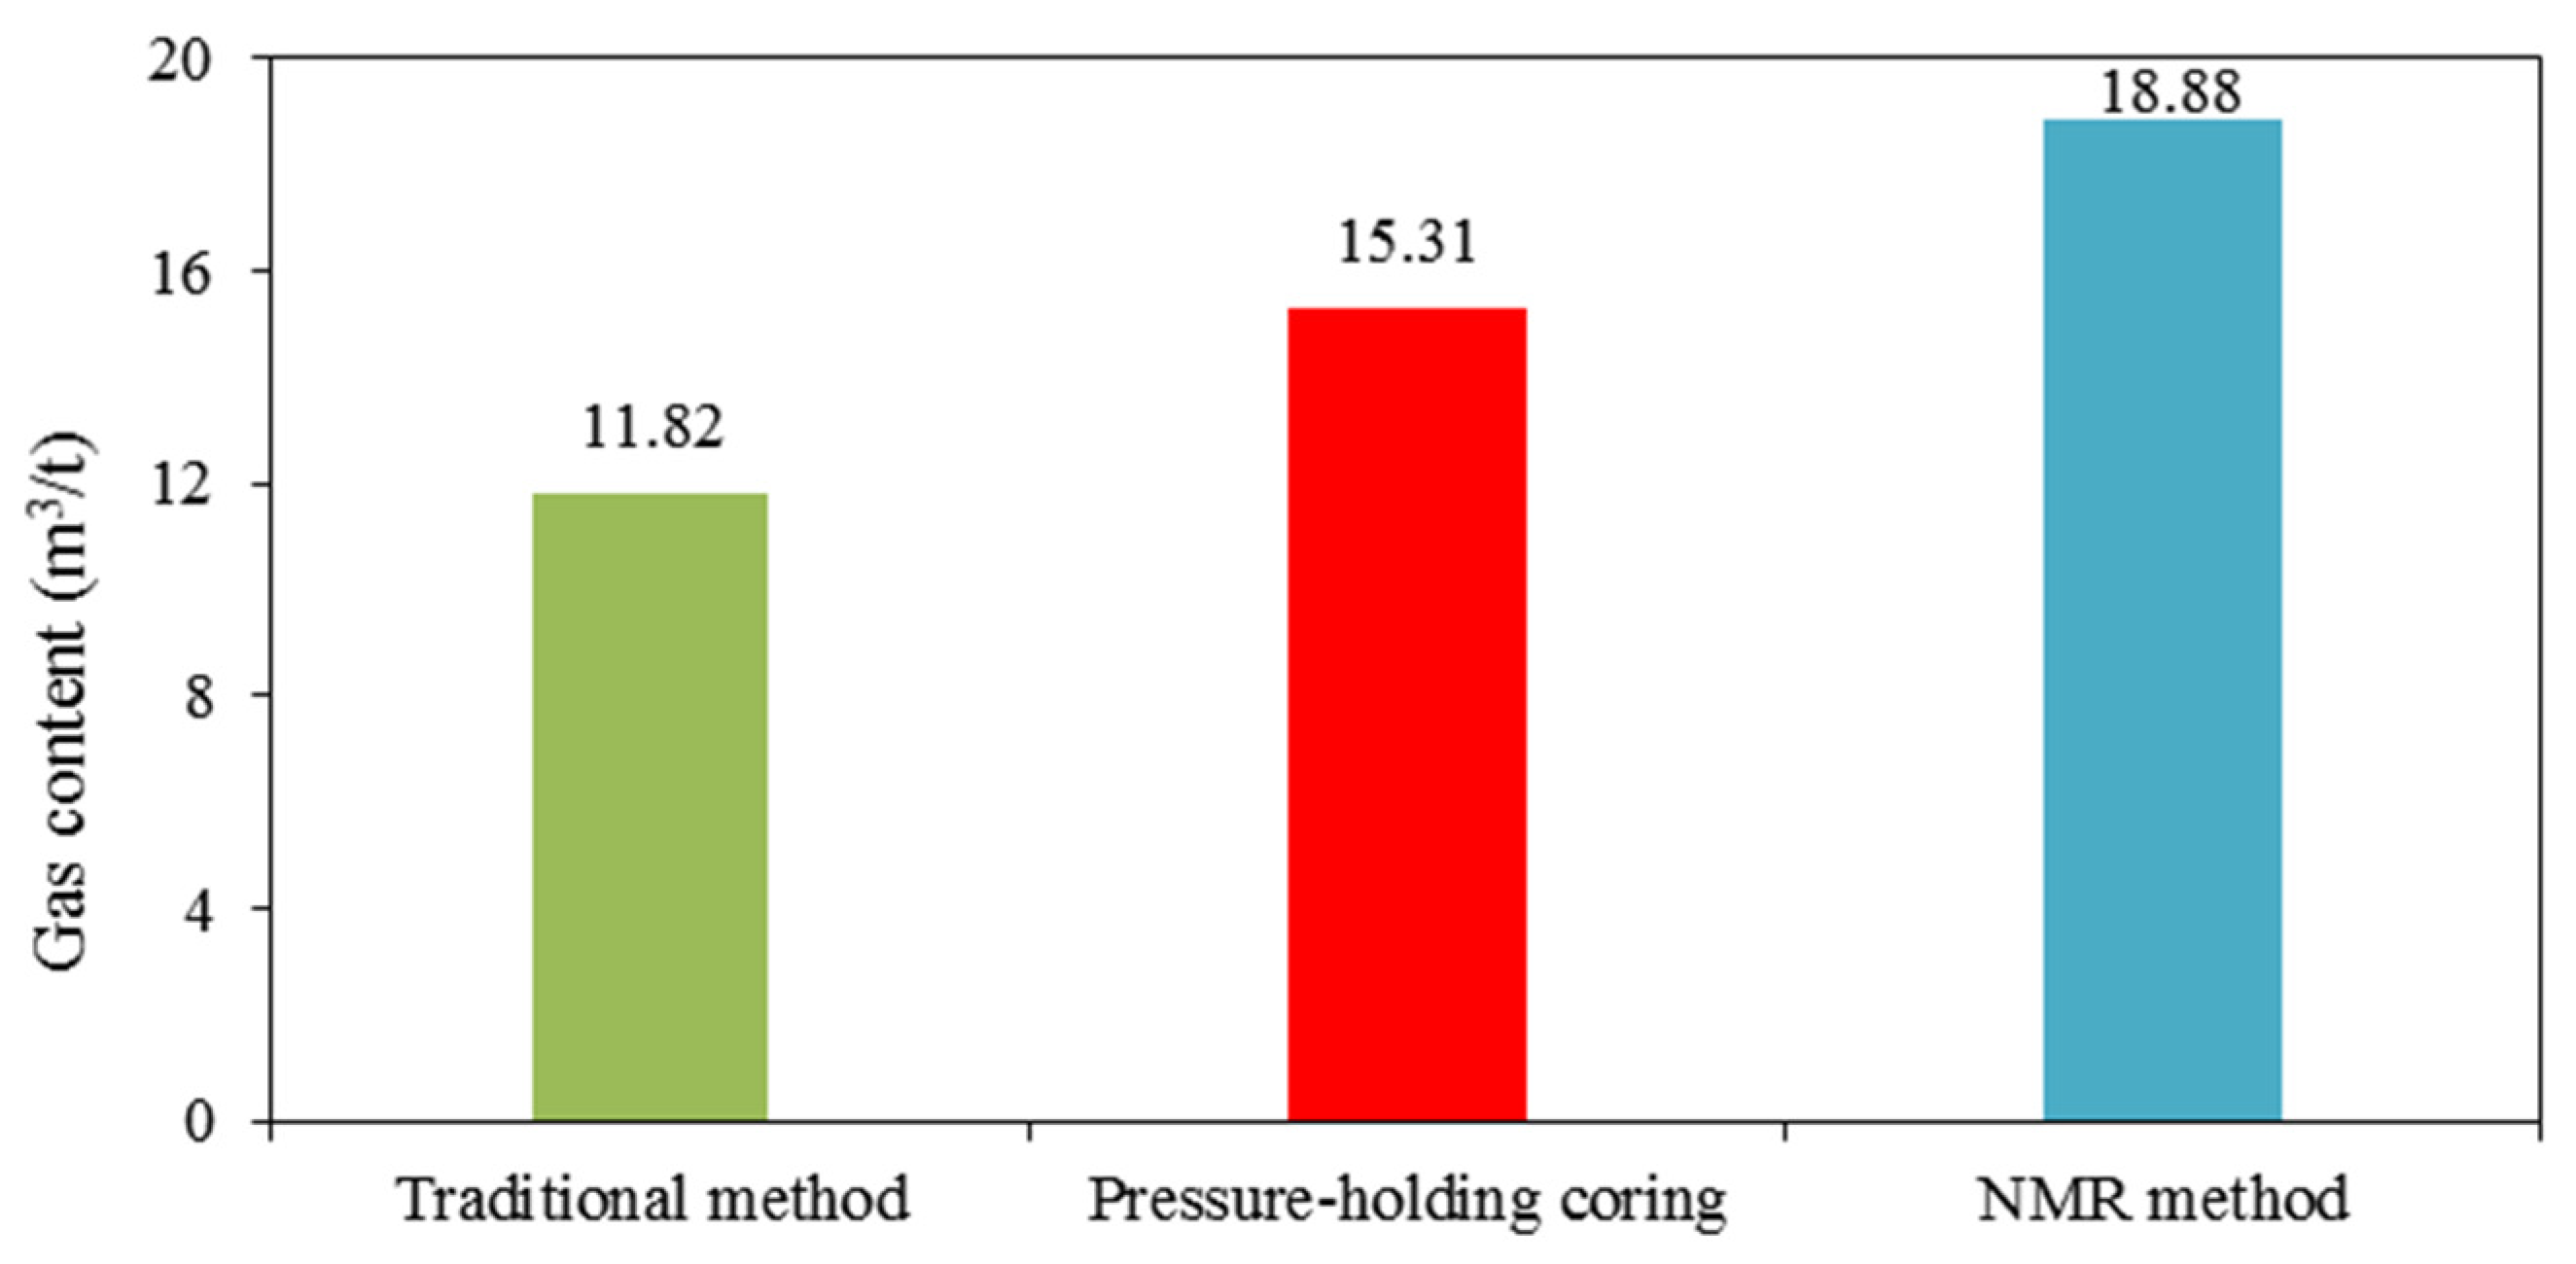
At present, among all the gas content-testing techniques, it is believed that the pressure-holding coring technique is the most accurate method for characterizing gas content in situ [50]. The total gas content characterization results from the different methods were compared and analyzed (Figure 9). The results showed that the traditional method measured the lowest total gas content at 11.82 m3/t, the total gas content via pressure-holding coring was 15.31 m3/t, and the total gas content tested via the NMR method was 18.88 m3/t.

Figure 9.
Comparison of the gas content test results using the different methods.
The following two factors contribute to the low gas content measured via traditional methods. Firstly, there is still significant controversy over the accuracy of shale porosity testing results [45,46]. Inaccurate porosity measurement can lead to deviations in gas saturation, which affects the calculation results for free gas content. Secondly, in a confined space, the volume of methane under high temperature and pressure may no longer satisfy the ideal gas state law. As the temperature increases, the original adsorbed gas will then transform into free gas [40,52]. Therefore, we believe that the total gas contents under high-temperature and high-pressure conditions measured using traditional methods are smaller and have greater errors.
However, the dried plug L214 sample tested via the NMR method was measured at 18.88 m3/t, which is greater than the pressure-holding coring test result of 15.31 m3/t. This is because the object of the pressure-holding coring experiment is the underground core, which has a certain water saturation of about 15%. When the water saturation is about 10-20%, the adsorption capacity of shale decreases by 20–40% [51,64]. Therefore, the adsorbed gas under in situ geological conditions is 0.7 times the amount of adsorbed gas in the dried sample, which was calculated to be 1.75 m3/t. The free gas in situ was directly calculated based on gas saturation and was found to be 13.92 m3/t. The total gas content under in situ geological conditions was 15.67 m3/t, which is very close to the result yielded by pressure-holding coring. This also confirms the reliability of the method established in our studies.
4.2. Influence of Burial Depth on the Development of Pore Structure
4.2.1. Pore Proportion and OM Pore Size Distribution
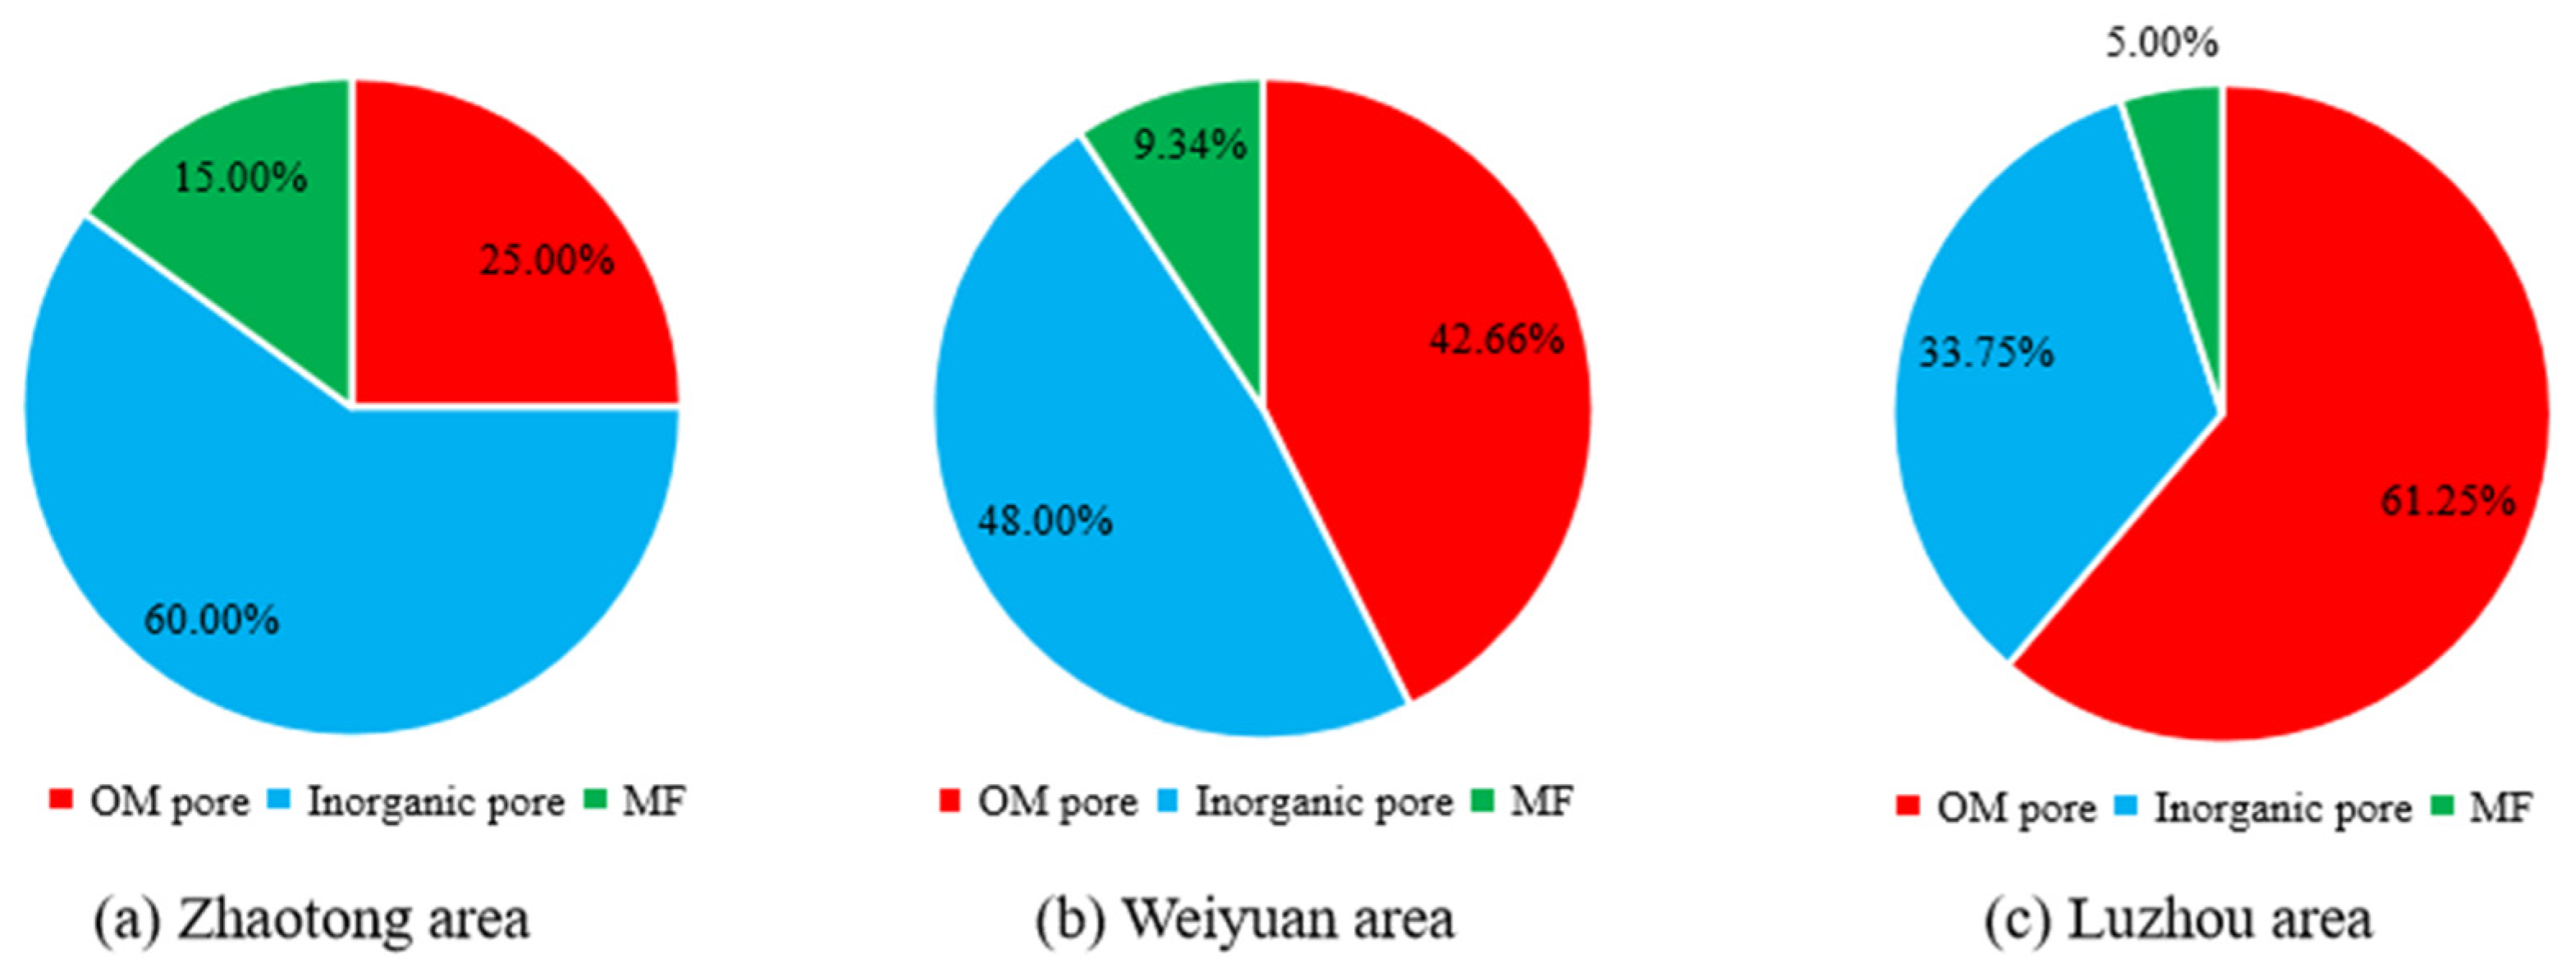
Shale reservoirs develop with a large number of OM pores, inorganic pores, and MF, which represent important places for shale gas storage. Clarifying the proportion of different reservoir space types is conducive to understanding the occurrence, location, and state of shale gas. This study uses image stitching and processing techniques to extract the different types of pores. The specific operation process has been detailed in previous studies [25,26,27,28]. On this basis, we calculated the average values of the different types of pores and MF in shale reservoirs in the different areas. The OM pores account for about 25%, while the inorganic pores account for 60%, and MF account for about 15% of shale reservoirs in the Zhaotong area with a burial depth of less than 2000 m (Figure 10a). In the Weiyuan area, the shale reservoirs have a burial depth ranging from 2000 m to 4000 m, and the proportion of OM pores, inorganic pores, and MF is 42.66%, 48.00%, and 9.34%, respectively (Figure 10b). In the Luzhou area, in shale reservoirs with a burial depth greater than 4000 m, the proportion of OM pores, inorganic pores, and MF is 61.25%, 33.75%, and 5.00%, respectively (Figure 10c).

Figure 10.
Pore proportion of typical shale gas wells with different burial depths in the Zhaotong, Weiyuan, and Luzhou areas.
It can be seen that as the burial depth increases, the proportion of OM pores gradually increases, while the proportion of inorganic pores and MF gradually decreases. This is because the burial depth is small in the Zhaotong area, the overlying formation pressure of the shale reservoirs is low; the Inter P pores are more fully developed, and the width and length of the MF are larger (Figure 5a–d), ultimately forming shale reservoirs with higher porosity (Table 1). Due to the similar TOC contents in shale reservoirs with different burial depths (Table 1) and the small pore size of the OM pores (Figure 4f–g), the contribution rate of organic pores to pore volume is not high. In the end, with higher porosity, the proportion of OM pores is 25% (Figure 10). As the burial depth increases, the pressure of the overlying strata increases, and the inorganic pores and MF are gradually compressed or even closed, especially the InterP pores. Due to the compression resistance of minerals and the overpressure of the shale gas, the OM pores in the OM between minerals are well-preserved [65]. This results in the shale reservoirs of the Luzhou area, which have burial depths greater than 4000 m, being dominated by OM pores, the proportion of which can be up to 60%.
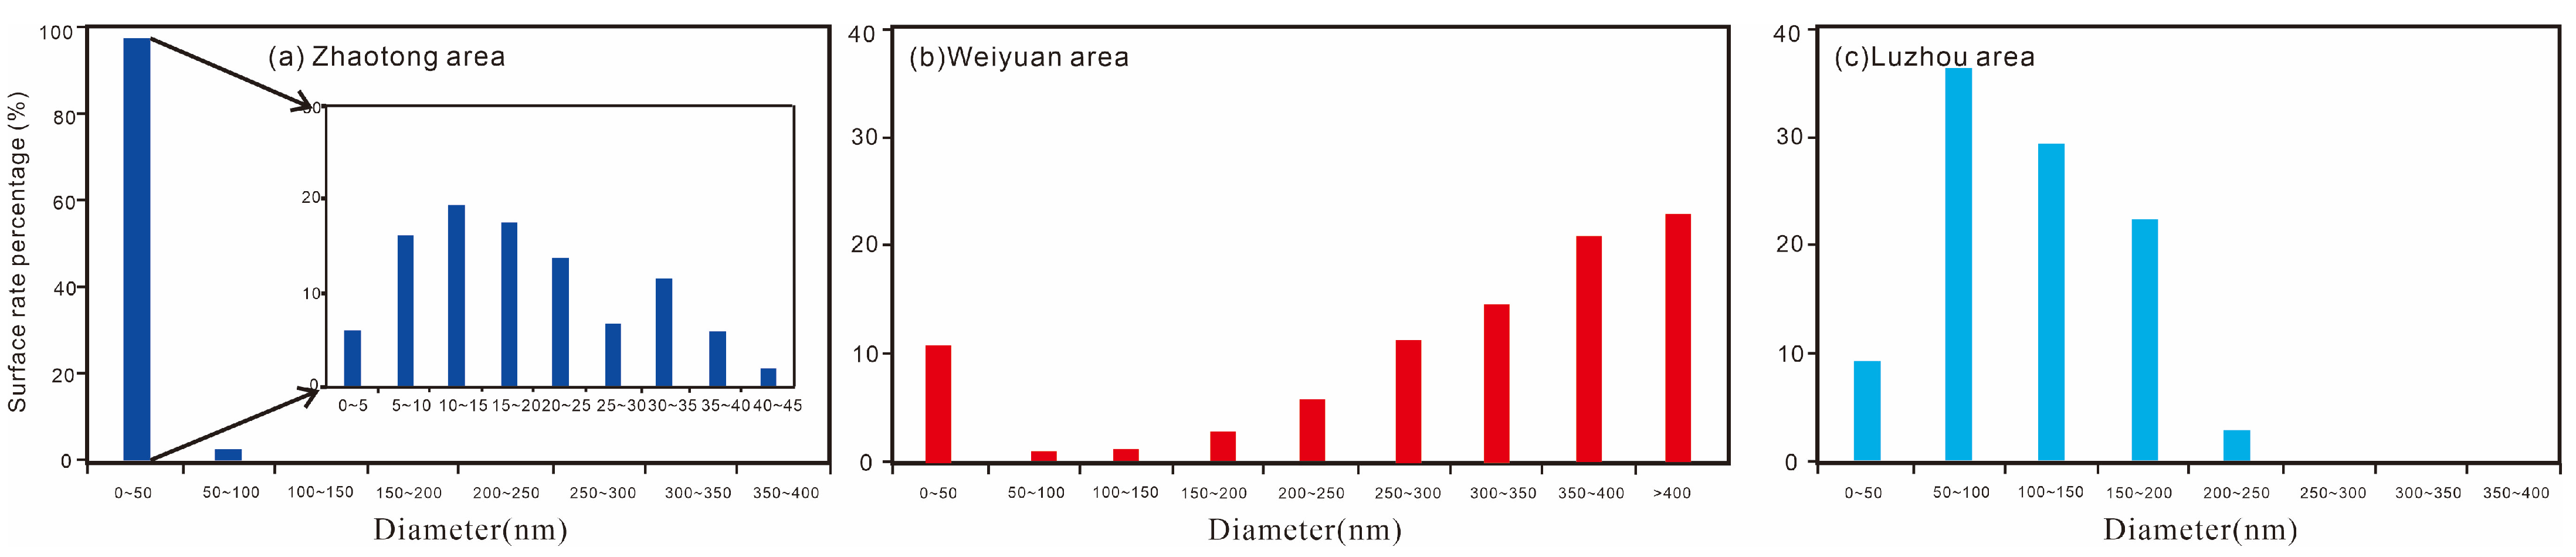
OM pores are an important occurrence place for shale gas, and the size of OM pores is crucial to the occurrence state of shale gas. Histograms of the pore size distribution of OM pores in shale reservoirs with different burial depths were obtained through FE-SEM and image processing techniques (Figure 11). The OM pore size in the Zhaotong area is basically less than 50 nm. The pore size distribution shows two main peaks, namely, 10–15 nm and 30–35 nm (Figure 11a). The organic surface rate of the shale reservoirs in the Weiyuan area, which is less than 5 nm, has reached 10%, but the organic surface rate, which is greater than 200 nm, is still the main contributor (Figure 11b). For shale reservoirs in the Luzhou area with greater burial depths, the distribution of organic pore size is relatively concentrated and is mainly distributed at 50–200 nm, with a pore surface area ratio of over 35% at 50–100 nm (Figure 11c). Overall, the organic pore size of shale reservoirs in the Zhaotong area is less than 50 nm, while shale reservoirs in the Weiyuan area mainly develop organic pores with pore sizes of <5 nm and 200–500 nm. The organic pore size of shale reservoirs in the Luzhou area is mainly distributed between 50 and 200 nm.

Figure 11.
OM pore size distribution of typical shale gas wells with different burial depths in the Zhaotong, Weiyuan, and Luzhou areas.
4.2.2. Controlling the Mechanism of Burial Depth and the Development of Pores
The evolution of OM pores in shale reservoirs is affected by hydrocarbon generation, diagenesis, and tectonism [66], resulting in the different development of OM pores in shale reservoirs with different burial depths. Organic pores have been observed to create “bubble” shapes during geological history, and, as the bitumen solidifies, these “bubbles” no longer grow and instead solidify into pores of various scales according to certain burial depths, as observed today. From this pattern, we can consider each organic matter particle as a micro-scale gas reservoir. When organic matter undergoes thermal evolution to form liquid hydrocarbons, the generated shale gas will be dissolved in the liquid hydrocarbons, but this process will not form pores. With the continuous generation of shale gas, the crude oil will appear to be supersaturated. The actual dissolved gas in the crude oil is higher than the dissolved gas in the thermodynamic balance. Supersaturation is a necessary condition for bubble nucleation. When ignoring the influence of impurities and the adjacent pores, crude oil saturated with gas belongs to a single homogeneous system [67], which can be expressed as follows [68]:
where ΔG represents free energy, J; r represents the radius of the bubble pore, m; ΔP is the pressure difference inside and outside the bubble pore, MPa; σbp is the surface tension of the bubble (the surface tension of liquid OM under geological conditions), in N/m.
∆G = −4/3πr3∆P + 4πr2σbp
The thermal evolution degree of the Longmaxi Formation shale reservoirs in the Zhaotong, Weiyuan, and Luzhou areas is in an over-mature stage; they all experienced the maximum ancient burial depth and were then uplifted to the current burial depth [55]. Due to different tectonic processes, the degrees of strata uplift are different in the studied regions, resulting in differences in the current burial depth. Due to the high degree of thermal evolution of the shale reservoirs, at the maximum burial depth, the organic matter has experienced or is currently at a peak of gas generation, and the formation is in an overpressure state [65]. As the burial depth of the formation decreases, the reduction in overlying formation pressure will disrupt the formation balance under overpressure, forming a new pressure balance, thereby affecting the development and maintenance of the pores [5]. From Equation (10), it can be seen that the free energy of the gas in the OM pores of shale is jointly controlled by r, ΔP, and σbp. The σbp is influenced by the pressure of the overlying strata, resulting in differences in the characteristics of organic pores in the shale at different burial depths. Since shale gas reservoirs in the southern Sichuan Basin have experienced the maximum ancient burial depth, these shale reservoirs are mostly overpressured, and the formation pressure coefficient increases with the burial depth increase [65]. Based on the mechanism of bubble pore formation, taking the characteristics of OM pores in shale with burial depths larger than 4000 m as a reference, the changes in OM pores during the process of decreasing burial depths were analyzed. In the Luzhou area, the pressure coefficient of the shale reservoirs is greater than 1.8. Due to the large burial depth and high overlying formation pressure, the OM pore size is mainly distributed at 50–200 nm (Figure 11c). With a burial depth decrease to 2000 m, the overlying formation pressure decreases, the overpressured gas-containing OM pores expand, and adjacent OM pores merge with each other to form new organic pores with pore sizes greater than 200 nm (Figure 11b). New OM pores are formed under these burial conditions because of the shale gas’s continuous generation of organic matter. Under the action of the overlying strata, the pore size is relatively small, generally being less than 5 nm (Figure 4h). After the strata formation is lifted to 1000 m, the pressure of the overlying strata further decreases, and the pores continue to expand. The expansion force in pores with a pore size greater than 200 nm exceeds σbp, leading to fracture, ultimately forming a complex network-like structure with small pores (Figure 4f).
After experiencing the maximum burial depth, the greater the degree of uplift of shale reservoirs, the lower the pressure exerted by the overlying strata. After the overpressure state is removed, this will stimulate the formation of more MF or inorganic pores [65]. Therefore, the shale reservoirs in the Zhaotong area, which are currently shallowly buried, have well-developed interP pores and MF (Figure 5a–d). As the burial depth increases, the inorganic pores are continuously compressed, while the OM pores are preserved due to fluid overpressure [65,69,70]. Therefore, we can observe that as the burial depth increases, the inorganic pore size gradually decreases. Overall, when the burial depth is less than 2000 m, the OM pore porosity is smaller than that of inorganic pores, and the OM pores exhibit complex network characteristics with pore sizes of less than 50 nm. When the burial depth is at 2000–4000 m, the porosity of the organic and inorganic pores is equivalent, and the heterogeneity of the OM pores is extremely strong, mainly developing into micropores smaller than 5 nm and macropores larger than 200 nm. When the burial depth is greater than 4000 m, the porosity of the organic pores is greater than that of the inorganic pores. OM pores are more isolated and exhibit a more uniform pore size distribution, being concentrated at 50–200 nm.
4.3. Characteristics and Influencing Factors of Free Gas and Adsorbed Gas in Shale Reservoirs at Different Burial Depths
4.3.1. Gas Contents of Shale Reservoirs at Different Burial Depths
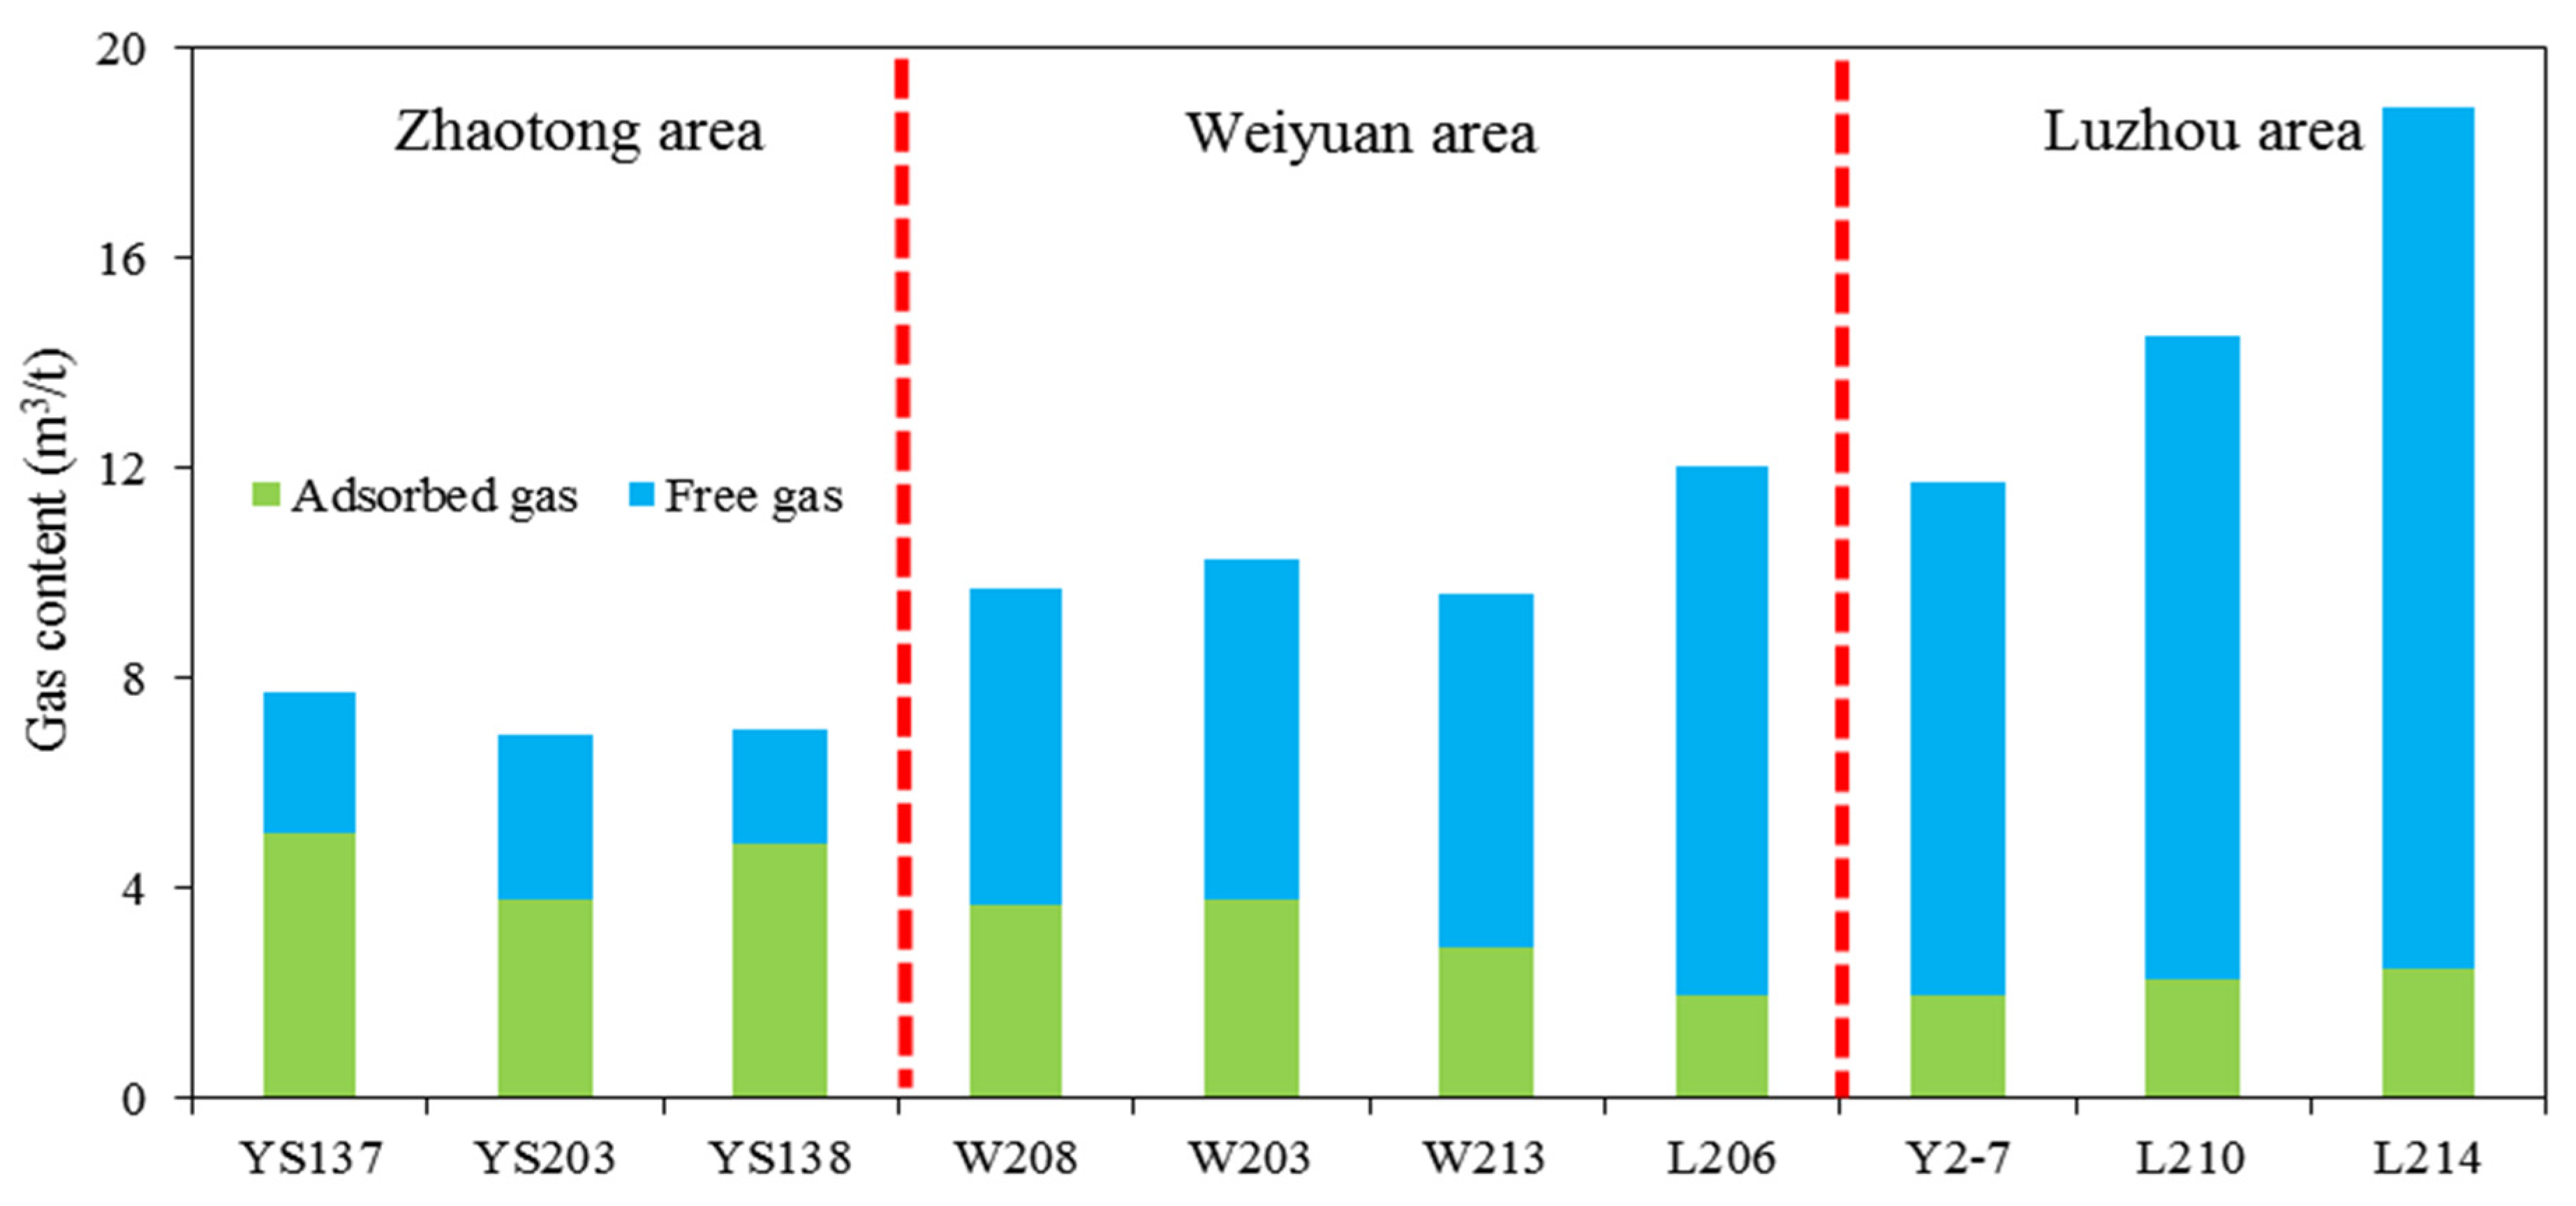
In this study, the adsorption gas contents were measured via methane isothermal adsorption experiments, and free gas contents were measured via saturated methane NMR experiments. Due to the limited temperature and pressure ranges of NMR equipment, the free gas content in the Luzhou area cannot be directly tested; therefore, it was calculated via Equations (8) and (9). Thus, the total gas contents of shale reservoirs in the Zhaotong, Weiyuan, and Luzhou areas were obtained (Figure 12). The total gas content of the shale reservoir in the Zhaotong area ranged from 6.91 m3/t to 7.93 m3/t, with a high proportion of adsorbed gas of up to 60%. The total gas content of the shale reservoir in the Weiyuan area ranged from 9.59 m3/t to 10.28 m3/t, with an average value of 9.86 m3/t. The proportion of free gas was approximately 65.05%. The total gas content of the shale reservoir in the Luzhou area ranged from 11.76 m3/t to 18.88 m3/t, with an average value of 14.31 m3/t, with free gas accounting for 84.47%. It can be seen that as the burial depth increases, both the total gas content and the proportion of free gas increase.
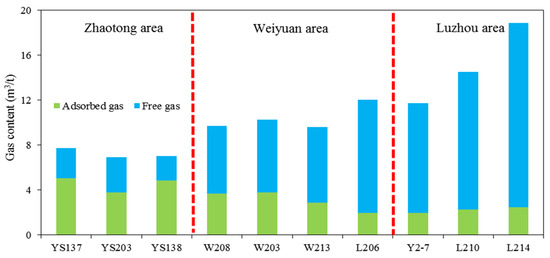
Figure 12.
Gas content of the studied shale samples from the Zhaotong, Weiyuan, and Luzhou areas.
There are many factors that affect the gas content of shale reservoirs, including burial depth (temperature and pressure) and reservoir properties (such as porosity, TOC content, mineral composition, and pore structure) [34,44]. The differences in TOC content and mineral composition of the selected samples in this study are not significant. The following section mainly discusses the influence of burial depths (temperature and pressure conditions) and pore structure on gas content.
The impact of burial depth on gas-bearing capacity has a dual impact. As the strata rise, the development degree of inorganic pores and MF in the shale reservoirs increases, especially the scale of the MF, providing channels for the migration of shale gas and reducing the self-sealing ability of shale reservoirs [71]. In the Zhaotong area, the width of MF in shale reservoirs can reach several micrometers (Figure 5d,e), leading to a decrease in the self-sealing ability of the shale reservoir. Therefore, at a burial depth of 1000–2000 m, free gas in the Zhaotong area may escape, resulting in low total gas and free gas contents, as well as a low pressure coefficient of 1.0–1.2 [55]. However, in the Luzhou area, which has a burial depth of more than 4000 m, the reservoir has a strong self-sealing ability and a high pressure coefficient of 1.8–2.2 [55], and the free gas content and total gas content of the reservoir are high (Figure 12).
In addition, adsorbed gas mainly exists in the OM pores of shale reservoirs, especially OM pores with a pore size of less than 10 nm and some inorganic pores and MF that are related to clay [72,73]. Although the porosity of organic pores in the Zhaotong shale reservoir is small, the complex network of shaped small OM pores is extremely well-developed and has a large specific surface area, providing a large number of adsorption sites for shale gas [73]. The adsorbed gas decreases with increasing temperature, and after reaching a certain pressure, the amount of adsorbed gas does not change greatly [74]. The burial depth of the Zhaotong shale reservoir is less than 2000 m, with a formation temperature of about 60 °C, which is more conducive to adsorption and is much lower than the formation temperature of 130 °C in the Luzhou area. The shale reservoirs in the Zhaotong area, with a relatively low burial depth, provide a large number of adsorption sites and suitable adsorption temperatures for the storage of adsorbed gas. Therefore, the shale reservoirs in the Zhaotong area have the highest adsorbed gas content.
The porosity of inorganic pores in the Luzhou area is smaller than that of OM pores, and OM pores with a pore size of 50–200 nm are in the form of relatively isolated circular pores with fewer adsorption sites. On the other hand, the high formation temperature in the Luzhou area is not conducive to adsorption. At the same time, the self-sealing ability of shale reservoirs is strong, and the formation pressure is as high as about 60 MPa, allowing it to store more free gas within its limited pores. The above factors explain the reasons for the low amount of adsorbed gas and the high amount of free gas in shale reservoirs at greater burial depths.
4.3.2. Gas-in-Place Estimation
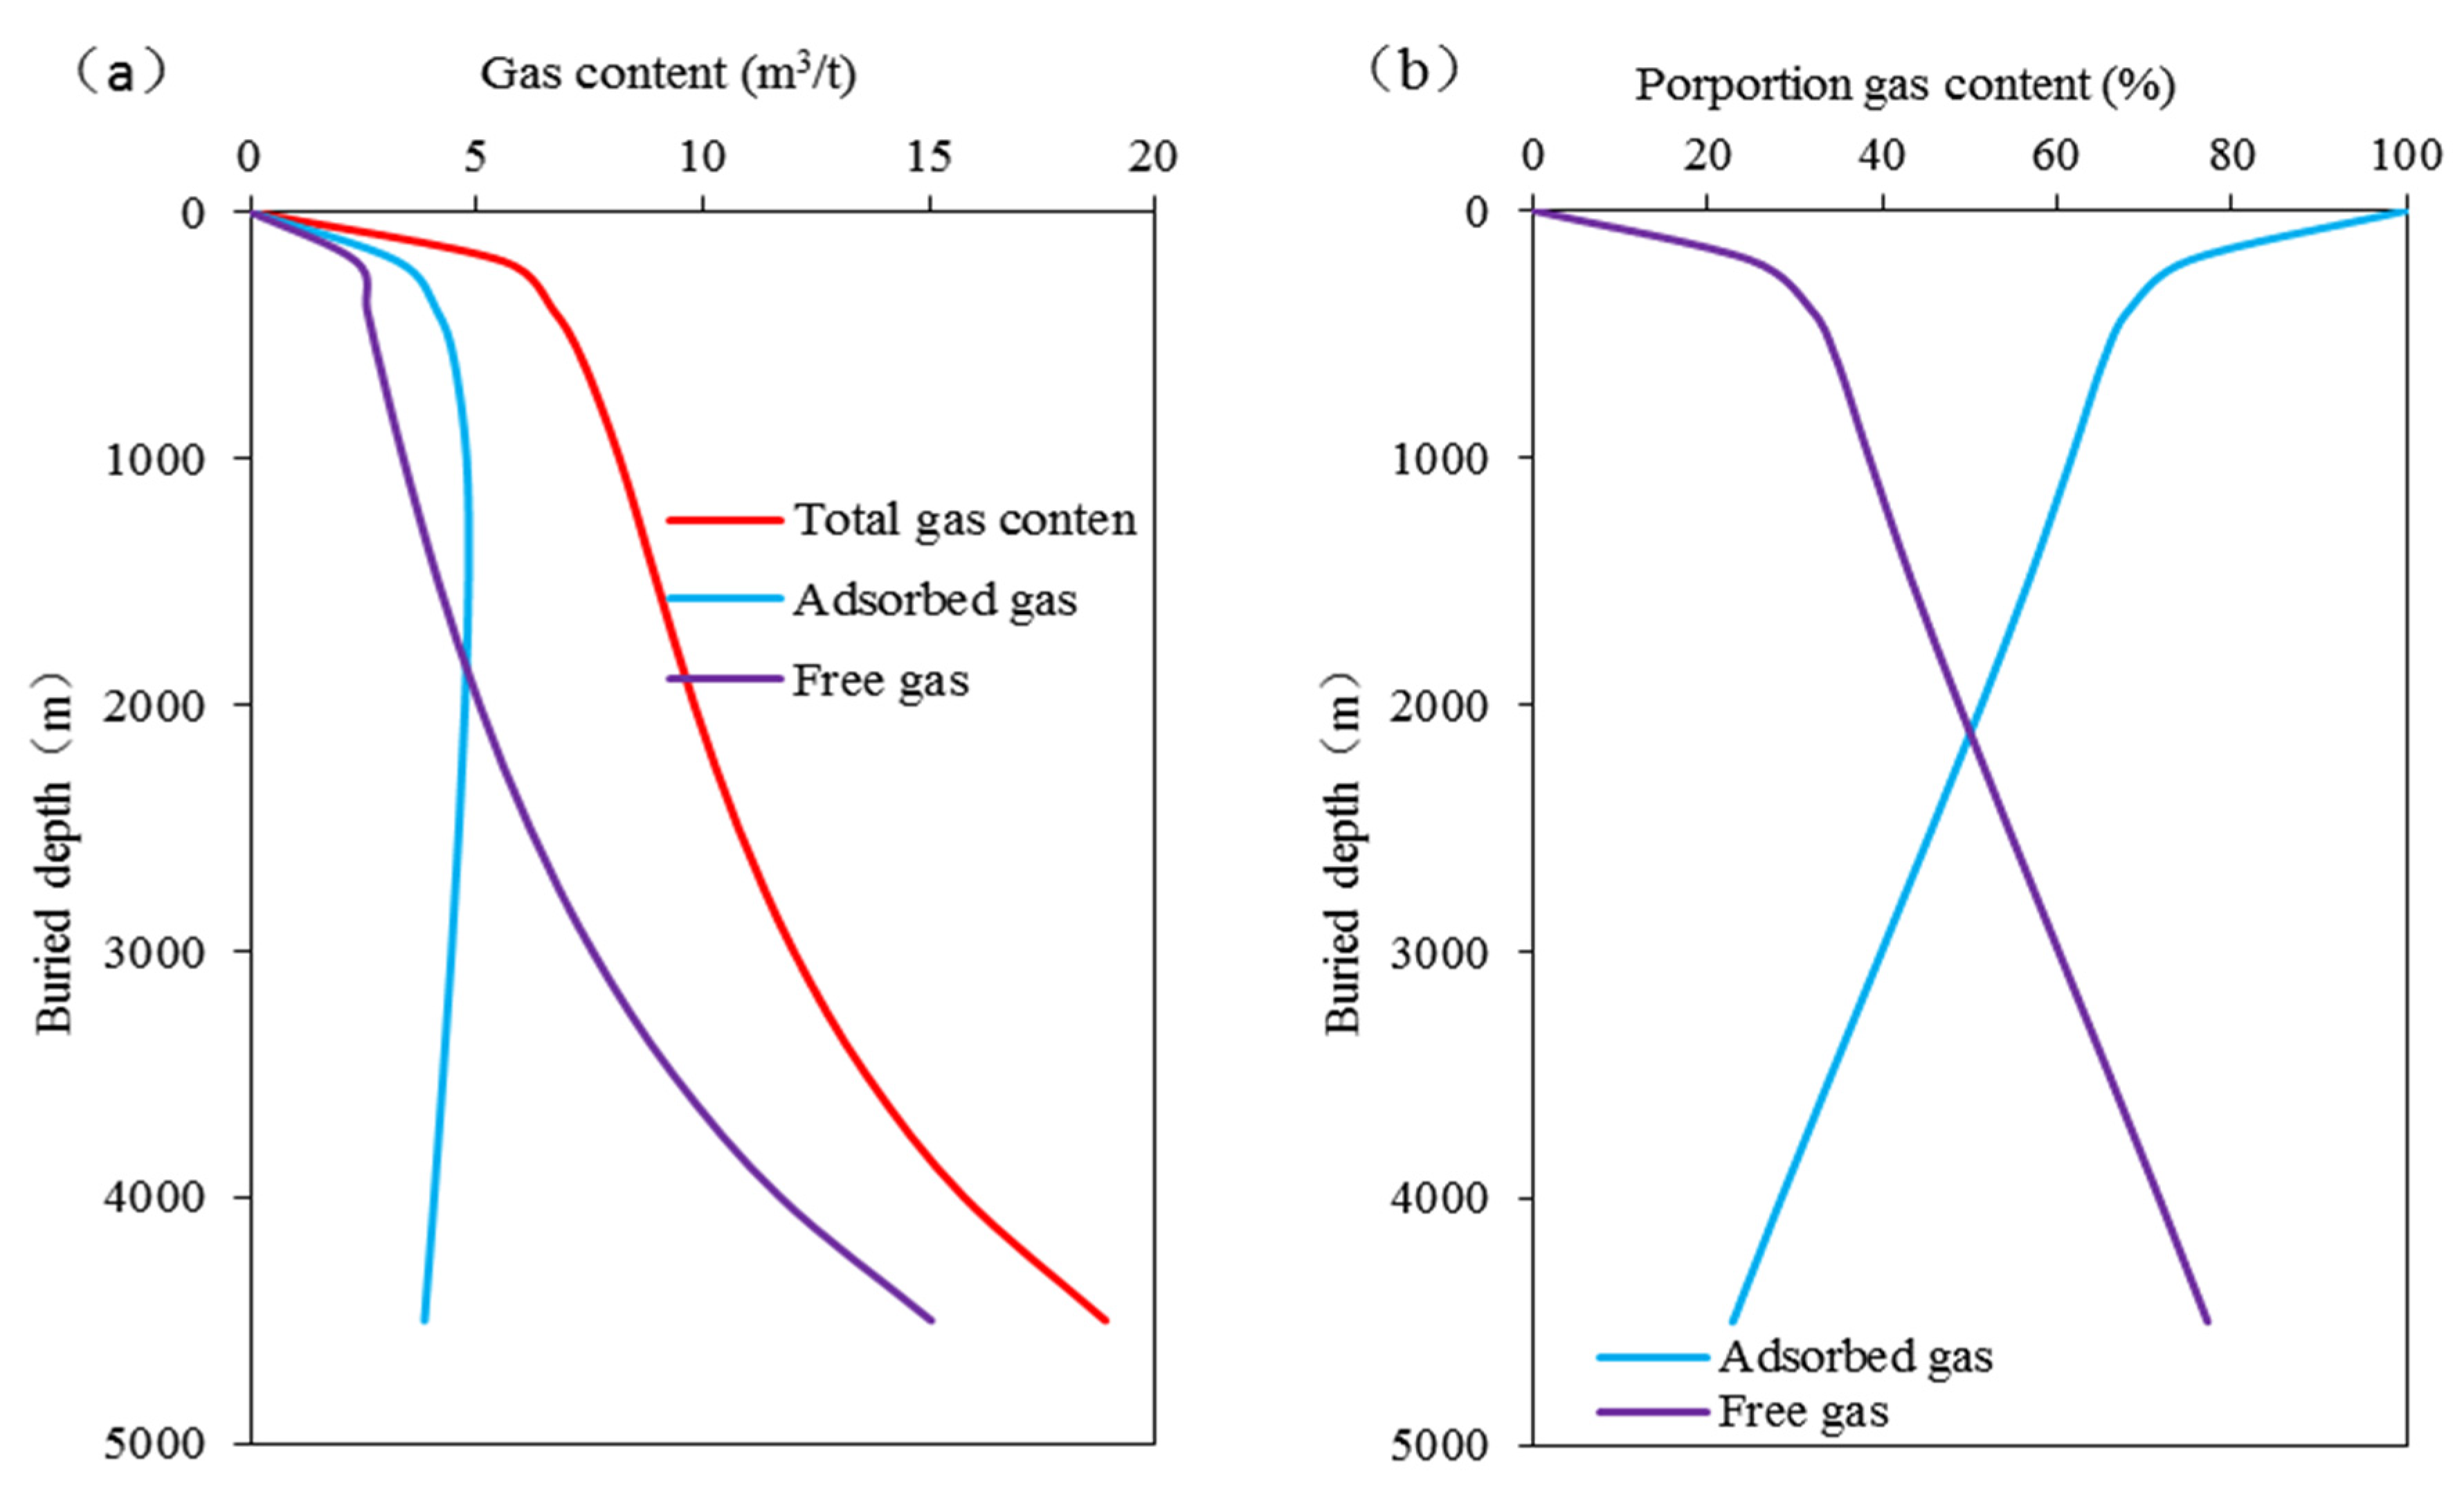
Combining the results of methane adsorption and saturated methane NMR experiments on sample L214 with the adsorbed gas content prediction model [35] and the free gas content prediction model (Equation (8)) will yield the in situ shale reservoir’s adsorbed and free gas content. The average reservoir pressure gradient, surface temperature, and temperature gradient in the Luzhou area are set at 15 MPa/km, 20 °C, and 25 °C/km, respectively. In addition, the reservoir porosity, rock density, and water saturation are set at 6.00%, 2.55 g/cm3, and 0%, respectively; these parameters do not change with burial depth.
The absolute adsorbed gas content rapidly increases with the increase in burial depth, and then slowly decreases due to the main influence of shallow burial depth pressure on shale methane adsorption. The increase in pressure leads to a sharp increase in adsorption, as shown in Figure 13a. However, in places with deeper burial depths, the effect of pressure is weaker, and the adsorption capacity is significantly affected by temperature. The adsorbed gas content will slowly decrease as the temperature increases. Free gas content and total gas content both increase with increasing burial depth, increasing slowly at shallow depths (<3500 m) and rapidly at deeper depths (>3500 m). At 4500 m, the free gas and total gas contents increased to 15.05 m3/t and 18.89 m3/t, respectively. The adsorbed gas dominates in the shallow layer, accounting for over 70% of the total gas content. Then, as the burial depth increases, the proportion of adsorbed gas and free gas is equal (at about 2000 m), while free gas dominates at deeper burial depths, accounting for about 80% at 4500 m, as shown in Figure 13b.
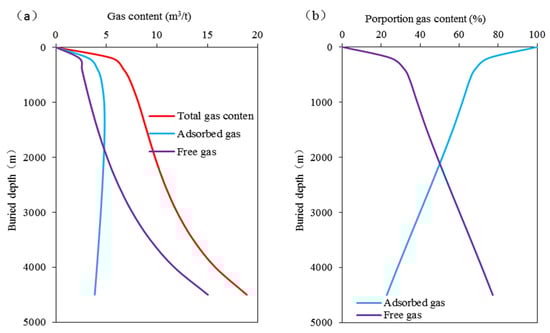
Figure 13.
(a) In situ shale reservoir gas contents according to burial depth; (b) proportion of gas contents with burial depth.
If we use traditional free gas prediction models (Equation (7)), a shale reservoir with a porosity of 6% has a free gas and total gas content of 8.14 m3/t and 9.21 m3/t at a depth of 4500 m, respectively [35]. This result is significantly inconsistent with the results (15.31 m3/t) of pressure-holding coring in a deep shale gas reservoir with 15% water saturation, as in the L214 well.
For our predicted free gas results, there is a differentiation from traditional methods in shale reservoirs at depths of approximately 3500 m. The reason why shale reservoirs with greater burial depths have such high gas content may be due to the confinement effect of shale reservoir porosity and permeability [75,76], especially under high-temperature and high-pressure conditions, the details of which are still unclear. Secondly, under deep-burial conditions, the organic matter of shale reservoirs can continuously generate shale gas and will have good self-sealing properties [71], enabling better storage of shale gas if there are no faults.
5. Conclusions
Integrated tests of FE-SEM imaging, isothermal methane adsorption at different temperatures and pressures, and NMR experiments of saturated methane at different temperatures and pressures were conducted on the shale cores at the same layers but at different burial depths in the southern Sichuan Basin in China.
After reaching the maximum burial depth, the shale reservoir gradually uplifts to its current burial depth as a result of different tectonic processes, and the pore structure and gas content evolve accordingly. As the shale reservoir rises upwards, the pressure of the overlying strata gradually decreases, and a large number of inorganic pores and microfractures are formed and expand during the pressure-release process. However, under the influence of the pressure difference between the regions inside and outside the OM pores, as well as the surface tension of OM, the OM pores first expand from 50–200 nm to 200–500 nm. After the pressure difference between the regions inside and outside the pores exceeds the surface tension of the OM, OM pores with large pore sizes rupture and then fuse with pinholes to form a network-like feature with pore sizes smaller than 50 nm.
A method of isothermal methane adsorption onto powder-sized samples was used to test the adsorbed gas content, along with an NMR method employing saturated methane on plug-sized samples to test the free gas content. As the burial depth of the shale reservoirs decreased from 4200 m to 1000 m, the total gas content decreased from 18.88 m3/t to 6.91 m3/t, and the proportion of free gas decreased from 84.47% to 36.82%. The reason for this is that during the process of shale reservoir uplift, the inorganic pores and microfractures expand, resulting in the weakening of the self-sealing ability of shale reservoirs and the escape of free gas, leading to a decrease in total gas content. At the same time, an increase in the complexity of the organic pores provides more adsorption sites for methane molecules, leading to shale gas mainly being present in an adsorption state, accounting for about 60% under low formation temperature (60 °C) conditions.
According to the new methods that we have established, the prediction results indicate that free gas dominates at deeper burial depths in shale reservoirs with a porosity of 6%, accounting for about 80% at 4500 m; in addition, the total gas content is 18.89 m3/t, which is much larger than the values yielded by traditional prediction models (9.21 m3/t). The high gas content in deep shale reservoirs may be attributed to confinement effects and the sustained generation of organic-matter hydrocarbons. However, the temperature (<100 °C) and pressure (30 MPa) for studying the confinement effect are relatively low, far lower than the formation temperature (140 °C) and pressure (65 MPa) of deep shale reservoirs. Therefore, the confinement effect and methane phase state under high-temperature and high-pressure conditions represent important research directions in the future. At the same time, there is a lack of research on time compensation for the sustained hydrocarbon generation of shale organic matter under deep burial conditions. Therefore, our research results not only strengthen belief in the high yield of deep shale gas but also provide a direction for the geological development research of deep shale gas.
Author Contributions
Conceptualization, Y.F. and Y.G.; methodology, R.Z.; validation, Y.J.; formal analysis, Y.F.; investigation, X.F. and Y.G.; data curation, Y.F.; writing—original draft preparation, Y.F. and Y.G.; writing—review and editing, Y.F. and R.Z.; visualization, Y.F.; supervision, Y.J.; project administration, Y.J. All authors have read and agreed to the published version of the manuscript.
Funding
The research was supported by the National Natural Science Foundation of China (No. 42272171), the Science and Technology Cooperation Program of CNPC−SWPU Innovation Alliance (No. 2020CX020104), and the Subject Innovation and Talent Introduction Program in Colleges and Universities (111 Project) (No. D18016).
Institutional Review Board Statement
Not applicable.
Informed Consent Statement
Not applicable.
Data Availability Statement
Data is contained within the article or supplementary material.
Conflicts of Interest
The authors declare that they have no known competing financial interest or personal relationships that might have influenced the work presented in this article.
References
- Kerr, R.A. Natural gas from shale bursts onto the scene. Science 2010, 328, 1624–1626. [Google Scholar] [CrossRef] [PubMed]
- Milliken, K.L.; Rudnicki, M.; Awwiller, D.N.; Zhang, T. Organic matter-hosted pore system, Marcellus Formatior (Devonian), Pennsylvania. AAPG Bull. 2013, 97, 177–200. [Google Scholar] [CrossRef]
- Zhao, D.; Guo, Y.; Wang, G.; Zhou, X.; Zhou, Y.; Zhang, J.; Ren, G. Organic matter enrichment mechanism of Youganwo Formation oil shale in the Maoming Basin. Heliyon 2023, 9, e13173. [Google Scholar] [CrossRef] [PubMed]
- Pommer, M.; Milliken, K. Pore types and pore-size distributions across thermal maturity, Eagle Ford Formation, Southern Texas. AAPG Bull. 2015, 99, 1713–1744. [Google Scholar] [CrossRef]
- Zhang, K.; Song, Y.; Jia, C.; Jiang, Z.; Han, F.; Wang, P.; Yuan, X.; Yang, Y.; Zeng, Y.; Li, Y.; et al. Formation mechanism of the sealing capacity of the roof and floor strata of marine organic-rich shale and shale itself, and its influence on the characteristics of shale gas and organic matter pore development. Mar. Pet. Geol. 2022, 140, 105647. [Google Scholar] [CrossRef]
- Rani, S.; Prusty, B.K.; Pal, S.K. Methane adsorption and pore characterization of Indian shale samples. J. Unconv. Oil Gas Resour. 2015, 11, 1–10. [Google Scholar] [CrossRef]
- Clarkson, C.R.; Solano, N.; Bustin, R.M.; Bustin, A.M.M.; Chalmers, G.R.L.; He, L.; Melnichenko, Y.B.; Radliński, A.P.; Blach, T.P. Pore structure characterization of North American Shale gas reservoirs using USANS/SANS, gas adsorption, and mercury intrusion. Fuel 2013, 103, 606–616. [Google Scholar] [CrossRef]
- Ma, X.H.; Xie, J.; Yong, R.; Zhu, Y.Q. Geological characteristics and high production control factors of shale gas reservoirs in Silurian Longmaxi Formation, southern Sichuan Basin, SW China. Petro. Explor. Dev. 2020, 47, 841–855. [Google Scholar] [CrossRef]
- Zhou, J.P.; Yang, K.; Tian, S.F.; Zhou, L.; Xian, X.F.; Jiang, Y.D.; Liu, M.H.; Cai, J.C. CO2-water-shale interaction induced shale microstructural alteration. Fuel 2020, 263, 116642. [Google Scholar] [CrossRef]
- Luo, X.R.; Ren, X.J.; Wang, S.Z. Supercritical CO2-water-shale interactions and their effects on element mobilization and shale pore structure during stimulation. Int. J. Coal Geol. 2019, 202, 109–127. [Google Scholar] [CrossRef]
- Dai, X.G.; Wang, M.; Wei, C.T.; Zhang, J.J.; Wang, X.Q.; Zou, M.J. Factors affecting shale microscopic pore structure variation during interaction with supercritical CO2. J. CO2 Util. 2020, 38, 194–211. [Google Scholar] [CrossRef]
- Loucks, R.G.; Reed, R.M.; Ruppel, S.C.; Hammes, U. Spectrum of pore types and networks in mudrocks and a descriptive classification for matrix-related mudrock pores. AAPG Bull. 2012, 96, 1071–1098. [Google Scholar] [CrossRef]
- Zhao, D.; Guo, Y.; Wang, G.; Guan, X.; Zhou, X.; Liu, J. Fractal Analysis and Classification of Pore Structures of High-Rank Coal in Qinshui Basin, China. Energies 2022, 15, 6766. [Google Scholar] [CrossRef]
- Gupta, N.; Mishra, B. Experimental investigation of the influence of bedding planes and differential stress on microcrack propagation in shale using X-Ray CT scan. Geotech. Geol. Eng. 2021, 39, 213–236. [Google Scholar] [CrossRef]
- Garum, M.; Glover, P.W.J.; Lorinczi, P.; Drummond-Brydson, R.; Hassanpour, A. Micro- and nano-scale pore structure in gas shale using Xμ-CT and FIB-SEM Techniques. Energy Fuels 2020, 34, 12340–12353. [Google Scholar] [CrossRef]
- Klaver, J.; Desbois, G.; Littke, R.; Urai, J.L. BIB-SEM pore characterization of mature and post mature Posidonia Shale samples from the Hils area, Germany. Int. J. Coal Geol. 2016, 158, 78–89. [Google Scholar] [CrossRef]
- Klaver, J.; Desbois, G.; Urai, J.L.; Littke, R. BIB-SEM study of the pore space morphology in early mature Posidonia Shale from the Hils area, Germany. Int. J. Coal Geol. 2012, 103, 12–25. [Google Scholar] [CrossRef]
- Rezaee, R.; Saeedi, A.; Clennell, B. Tight gas sands permeability estimation from mercury injection capillary pressure and nuclear magnetic resonance data. J. Pet. Sci. Eng. 2012, 88–89, 92–99. [Google Scholar] [CrossRef]
- Klaver, J.; Desbois, G.; Littke, R.; Urai, J.L. BIB-SEM characterization of pore space morphology and distribution in postmature to overmature samples from the Haynesville and Bossier Shales. Mar. Petrol. Geol. 2015, 59, 451–466. [Google Scholar] [CrossRef]
- Strange, J.H.; Rahman, M.R.; Smith, E.G. Characterization of porous solids by NMR. Phys. Rev. Lett. 1993, 71, 3589–3591. [Google Scholar] [CrossRef]
- Blach, T.; Radlinski, A.P.; Vu, P.; Ji, Y.; Campo, L.D.; Gilbert, E.P.; Regenauer-Lieb, K.; Mastalerz, M. Accessibility of pores to methane in New Albany shale samples of varying maturity determined using SANS and USANS. Energies 2021, 14, 8438. [Google Scholar] [CrossRef]
- Neil, C.W.; Hjelm, R.P.; Hawley, M.E.; Watkins, E.B.; Cockreham, C.; Wu, D.; Mao, Y.; Fischer, T.B.; Stokes, M.R.; Xu, H. Small-angle neutron scattering (SANS) characterization of clay- and carbonate-rich shale at elevated pressures. Energy Fuels 2020, 34, 8178–8185. [Google Scholar] [CrossRef]
- Bahadur, J.; Chandra, D.; Das, A.; Vishal, V.; Agrawal, A.K.; Sen, D. Pore anisotropy in shale and its dependence on thermal maturity and organic carbon content: A scanning SAXS study. Int. J. Coal Geol. 2023, 273, 104268. [Google Scholar] [CrossRef]
- Löhr, S.C.; Baruch, E.T.; Hall, P.A.; Kennedy, M.J. Is organic pore development in gas shales influenced by the primary porosity and structure of thermally immature organic matter? Org. Geochem. 2015, 87, 119–132. [Google Scholar] [CrossRef]
- Fu, Y.; Jiang, Y.; Dong, D.; Hu, Q.; Lei, Z.; Peng, H.; Gu, Y.; Ma, S.; Wang, Z.; Yin, X. Microscopic pore-fracture configuration and gas-filled mechanism of shale reservoirs in the western Chongqing area, Sichuan Basin, China. Pet. Explor. Dev. 2021, 48, 1063–1076. [Google Scholar] [CrossRef]
- Shi, Z.; Dong, D.; Wang, H.; Sun, S.; Wu, J. Reservoir characteristics and genetic mechanisms of gas-bearing shales with different laminae and laminae combinations: A case study of Member 1 of the Lower Silurian Longmaxi shale in Sichuan Basin, SW China. Pet. Explor. Dev. 2020, 47, 829–840. [Google Scholar] [CrossRef]
- Michael, B.; Xia, W.W.; John, S. Shale gas play screening and evaluation criteria. China Pet. Explor. 2009, 14, 51–64. (In Chinese) [Google Scholar]
- Pan, Z.J.; Connell, L.D. Reservoir simulation of free and adsorbed gas production from shale. J. Nat. Gas Sci. Eng. 2015, 22, 359–370. [Google Scholar] [CrossRef]
- Wu, Y.H.; Cheng, L.S.; Huang, S.J.; Jia, P.; Zhang, J.; Lan, X.; Huang, H.L. A practical method for production data analysis from multistage fractured horizontal wells in shale gas reservoirs. Fuel 2016, 186, 821–829. [Google Scholar] [CrossRef]
- Sakurovs, R.; Day, S.; Weir, S.; Duffy, G. Application of a modified Dubinin-Radushkevich equation to adsorption of gases by coals under supercritical conditions. Energy Fuels 2007, 21, 992–997. [Google Scholar] [CrossRef]
- Yao, Y.; Liu, J.; Liu, D.; Chen, J.; Pan, Z. A new application of NMR in characterization of multiphase methane and adsorption capacity of shale. Int. J. Coal Geol. 2019, 201, 76–85. [Google Scholar] [CrossRef]
- O’Neill, K.T.; Birt, B.; Hopper, T. Borehole measurements of adsorbed gas content in coals using stimulated diffusion nuclear magnetic resonance. Int. J. Coal Geol. 2021, 247, 103845. [Google Scholar] [CrossRef]
- Zhou, S.; Xue, H.; Ning, Y.; Guo, W.; Zhang, Q. Experimental study of supercritical methane adsorption in Longmaxi shale: Insights into the density of adsorbed methane. Fuel 2018, 211, 140–148. [Google Scholar] [CrossRef]
- Memon, A.; Li, A.; Memon, B.; Muther, T.; Han, W.; Kashif, M.; Tahir, M.; Akbar, I. Gas adsorption and controlling factors of shale: Review, application, comparison and challenges. Nat. Resour. Res. 2021, 30, 827–848. [Google Scholar] [CrossRef]
- Qian, C.; Li, X.; Zhang, Q.; Shen, W.; Guo, W.; Lin, W.; Han, L.; Cui, Y.; Huang, Y.; Pei, X.; et al. Reservoir characteristics of different shale lithofacies and their effects on the gas content of Wufeng-Longmaxi Formation, southern Sichuan Basin, China. Geoenergy Sci. Eng. 2023, 225, 2117017. [Google Scholar] [CrossRef]
- Gasparik, M.; Gensterblum, Y.; Ghanizadeh, A.; Weniger, P. High-pressure/high-temperature methane-sorption measurements on carbonaceous shales by the manometric method: Experimental and data-evaluation considerations for improved accuracy. SPE J. 2015, 20, 790–809. [Google Scholar] [CrossRef]
- Tian, H.; Li, T.; Zhang, T.; Xiao, X. Characterization of methane adsorption on overmature Lower Silurian–Upper Ordovician shales in Sichuan Basin, southwest China: Experimental results and geological implications. Int. J. Coal Geo. 2016, 156, 36–49. [Google Scholar] [CrossRef]
- Zhou, S.; Zhang, D.; Wang, H.; Li, X. A modified BET equation to investigate supercritical methane adsorption mechanisms in shale. Mar. Petrol. Geol. 2019, 105, 284–292. [Google Scholar] [CrossRef]
- Duan, S.; Gu, M.; Tao, M.; Xian, X. Adsorption of methane on shale: Statistical physics model and site energy distribution studies. Energy Fuels 2020, 34, 304–318. [Google Scholar] [CrossRef]
- Feng, G.; Zhu, Y.; Chen, S.; Wang, Y.; Ju, W.; Hu, Y.; You, Z.; Wang, G. Supercritical methane adsorption on shale over wide pressure and temperature ranges: Implications for gas-in-place estimation. Energy Fuels 2020, 34, 3121–3134. [Google Scholar] [CrossRef]
- Xiong, J.; Liu, X.; Liang, L.; Zeng, Q. Methane adsorption on carbon models of the organic matter of organic-rich shales. Energy Fuels 2017, 31, 1489–1501. [Google Scholar] [CrossRef]
- Hu, Q.; Lan, R.; He, L.; Liu, H.; Pei, X. A critical review of adsorption isotherm models for aqueous contaminants: Curve characteristics, site energy distribution and common controversies. J. Environ. Manag. 2023, 329, 117104. [Google Scholar] [CrossRef] [PubMed]
- Yang, K.; Conolly, P.; Liu, L.; Yang, X.; Robinson, N.; Li, M.; Mahmoud, M.; EI-Husseiny, A.; Verrall, M.; May, E.; et al. Quantitative characterization of methane adsorption in shale using low-field NMR. J. Nat. Gas Sci. Eng. 2022, 108, 104847. [Google Scholar] [CrossRef]
- Zhou, S.; Zhang, D. Adsorbed and free gas occurrence characteristics and controlling factors of deep shales in the southern Sichuan Basin, China. Pet. Sci. 2023, 20, 1301–1311. [Google Scholar] [CrossRef]
- Glorioso, J.C.; Rattia, A.J. Unconventional reservoirs: Basic petrophysical concepts for shale gas. In Proceedings of the SPE/EAGE European Unconventional Resources Conference and Exhibition from Potential to Production, Vienna, Austria, 20–22 March 2012. [Google Scholar]
- Kuila, U.; McCarty, D.K.; Derkowski, A.; Fischer, T.B.; Prasad, M. Total porosity measurement in gas shales by the water immersion porosimetry (WIP) method. Fuel 2014, 117, 1115–1129. [Google Scholar] [CrossRef]
- Yao, Y.; Liu, D.; Xie, S. Quantitative characterization of methane adsorption on coal using a low-field NMR relaxation method. Int. J. Coal Geol. 2014, 131, 32–40. [Google Scholar] [CrossRef]
- Smith, D.M.; Williams, F.L. Direct method of determining the methane content of coal-a modification. Fuel 1984, 63, 425–427. [Google Scholar] [CrossRef]
- Yee, D.; Seidle, J.P.; Hanson, W.B. Gas sorption on coal and measurement of gas content. AAPG Stud Geol. 1993, 38, 203–218. [Google Scholar]
- Li, W.; Li, X.; Zhao, S.; Li, J.; Lu, S.; Liu, Y.; Huang, S.; Wang, Z.; Wang, J. Evaluation on carbon isotope fractionation and gas-in-place content based on pressure-holding coring technique. Fuel 2022, 315, 123243. [Google Scholar] [CrossRef]
- Han, W.; Li, A.; Memon, A.; Ma, M. Synergetic effect of water, temperature, and pressure on methane adsorption in shale gas reservoirs. ACS Omega 2021, 6, 2215–2229. [Google Scholar] [CrossRef]
- Huang, H.; Li, R.; Jiang, Z.; Li, J.; Chen, L. Investigation of variation in shale gas adsorption capacity with burial depth: Insights from the adsorption potential theory. J. Nat. Gas Sci. Eng. 2020, 73, 103043. [Google Scholar] [CrossRef]
- Hui, S.; Pang, X.; Chen, Z.; Hu, T.; Shi, K.; Di, G.; Li, M.; Mei, S.; Li, M. Quantifying the relative contribution and evolution of pore types to shale reservoir space: Constraints from over-mature marine shale in the Sichuan Basin, SW China. J. Asian. Earth Sci. 2023, 249, 105625. [Google Scholar] [CrossRef]
- Zhao, D.; Yin, S.; Guo, Y.; Ren, C.; Wang, R.; Ding, W.; Liu, J. Investigation of pore structure characteristics of marine organic-rich shales using low-pressure N2 adsorption experiments and fractal theory. Interpretation 2019, 7, 671–685. [Google Scholar] [CrossRef]
- Zou, C.; Dong, D.; Wang, Y.; Li, X.; Huang, J.; Wang, S.; Guan, Q.; Zhang, C.; Wang, H.; Liu, H.; et al. Shale gas in China:characteristics, challenges and prospects (II). Pet. Explor. Dev. 2016, 43, 166–178. [Google Scholar] [CrossRef]
- Sun, W.; Zou, Y.; Lin, Z.; Wu, Z.; Liu, H.; Lin, J.; Chen, B.; Chen, Q.; Pan, C.; Lan, B.; et al. Impact of tectonic deformation on shale pore structure using adsorption experiments and 3D digital core observation: A case study of the Niutitang Formation in Northern Guizhou. Energy 2023, 278, 127724. [Google Scholar] [CrossRef]
- SY/T5163-2010; Analysis Method for Clay Minerals and Ordinary Non-Clay Minerals in Sedimentary Rocks by the X-ray Diffraction. National Energy Administration: Beijing, China, 2010.
- SY/T 6940–2013; Measurement Method of Shale Gas Content. National Energy Administration: Beijing, China, 2013.
- Chen, Y.; Zhang, B.; Qin, Y.; Li, Z.; Yang, Z.; Wu, C.; Cao, C. Differences in CH4 and C2H6 carbon isotopic compositions from open and closed pores in coal: Implications for understanding the two-stage δ13C shift during canister desorption. Int. J. Coal. Geol. 2020, 230, 103586. [Google Scholar] [CrossRef]
- NB/T 10117-2018; Determination Methods of Methane Isothermal Adsorption Determination Methods of Methane Isothermal Adsorption. National Energy Administration: Beijing, China, 2018.
- Rexer, T.F.; Benham, M.J.; Aplin, A.C.; Thomas, K.M. Methane adsorption on shale under simulated geological temperature and pressure conditions. Energy Fuels 2013, 27, 3099–3109. [Google Scholar] [CrossRef]
- Livo, K.; Saidian, M.; Prasad, M. Effect of paramagnetic mineral content and distribution on nuclear magnetic resonance surface relaxivity in organic-rich Niobrara and Haynesville shales. Fuel 2020, 269, 117417. [Google Scholar] [CrossRef]
- Katz, B.J.; Arango, I. Organic porosity: A geochemist’s view of the current state of understanding. Org. Geochem. 2018, 123, 1–16. [Google Scholar] [CrossRef]
- Ren, W.; Guo, J.; Zeng, F.; Wang, T. Modeling of high-pressure methane adsorption on wet shales. Energy Fuels 2019, 33, 7043–7051. [Google Scholar] [CrossRef]
- Fang, X.; Cai, Y.; Hu, Q.; Gao, P.; Liu, D.; Qian, Y. Effect of formation pressure on pore structure evolution and hydrocarbon expulsion in organic-rich marine shale. Processes 2023, 11, 1007. [Google Scholar] [CrossRef]
- Hu, H.; Hao, F.; Lin, J.; Lu, Y.; Ma, Y.; Li, Q. Organic matter-hosted pore system in the Wufeng-Longmaxi (O3w-S11) shale, Jiaoshiba area, Eastern Sichuan Basin, China. Int. J. Coal. Geol. 2017, 173, 40–50. [Google Scholar] [CrossRef]
- Ju, J.; Jang, J.; Choi, M.; Beak, J. Effects of cavitation on performance of automotive torque converter. Adv. Mech. Eng. 2016, 8, 1687814016654045. [Google Scholar] [CrossRef]
- Brennen, C.E. Cavitation and Bubble Dynamics; Oxford University Press: Oxford, UK, 1995. [Google Scholar]
- Hamid, S.; Syed, M.M.; Maqsood, A.; Reza, R. Use of outcrop as substitute for subsurface shale: Current understanding of similarities, discrepancies, and associated challenges. Energy Fuels 2021, 35, 9151–9164. [Google Scholar]
- Ross, D.; Bustin, R.M. The importance of shale composition and pore structure upon gas storage potential of shale gas reservoirs. Mar. Pet. Geol. 2009, 26, 916–927. [Google Scholar] [CrossRef]
- Zhang, K.; Jia, C.; Song, Y.; Jiang, S.; Jiang, Z.; Wen, M.; Huang, Y.; Liu, X.; Jiang, T.; Peng, J.; et al. Analysis of Lower Cambrian shale gas composition, source and accumulation pattern in different tectonic backgrounds: A case study of Weiyuan Block in the Upper Yangtze region and Xiuwu Basin in the Lower Yangtze region. Fuel 2019, 263, 115978. [Google Scholar] [CrossRef]
- Wang, Y.; Zhu, Y.; Liu, S.; Zhang, R. Pore characterization and its impact on methane adsorption capacity for organic-rich marine shales. Fuel 2016, 181, 227–237. [Google Scholar] [CrossRef]
- Qu, Z.; Yin, Y.; Wang, H.; Zhang, J. Pore-scale investigation on coupled diffusion mechanisms of free and adsorbed gases in nanoporous organic matter. Fuel 2020, 260, 116423. [Google Scholar] [CrossRef]
- Zou, J.; Rezaee, R.; Xie, Q.; You, L. Characterization of the combined effect of high temperature and moisture on methane adsorption in shale gas reservoirs. J. Pet. Sci. Eng. 2019, 182, 106353. [Google Scholar] [CrossRef]
- Goral, J.; Panja, P.; Deo, M.; Andrew, M.; Linden, S.; Schwarz, J.; Wiegmann, A. Confinement effect on porosity and permeability of shales. Sci. Rep. 2020, 10, 49. [Google Scholar] [CrossRef]
- Ko, L.T.; Ruppel, S.C.; Loucks, R.G.; Hackley, P.C.; Zhang, T.W.; Shao, D.Y. Pore-types and pore-network evolution in Upper Devonian-Lower Mississippian Woodford and Mississippian Barnett mudstones: Insights from laboratory thermal maturation and organic petrology. Int. J. Coal Geol. 2018, 190, 3–28. [Google Scholar] [CrossRef]

Disclaimer/Publisher’s Note: The statements, opinions and data contained in all publications are solely those of the individual author(s) and contributor(s) and not of MDPI and/or the editor(s). MDPI and/or the editor(s) disclaim responsibility for any injury to people or property resulting from any ideas, methods, instructions or products referred to in the content. |
© 2023 by the authors. Licensee MDPI, Basel, Switzerland. This article is an open access article distributed under the terms and conditions of the Creative Commons Attribution (CC BY) license (https://creativecommons.org/licenses/by/4.0/).