
Compression Sportswear Improves Speed, Endurance, and Functional Motor Performances: A Meta-Analysis


Abstract
:1. Introduction
2. Materials and Methods
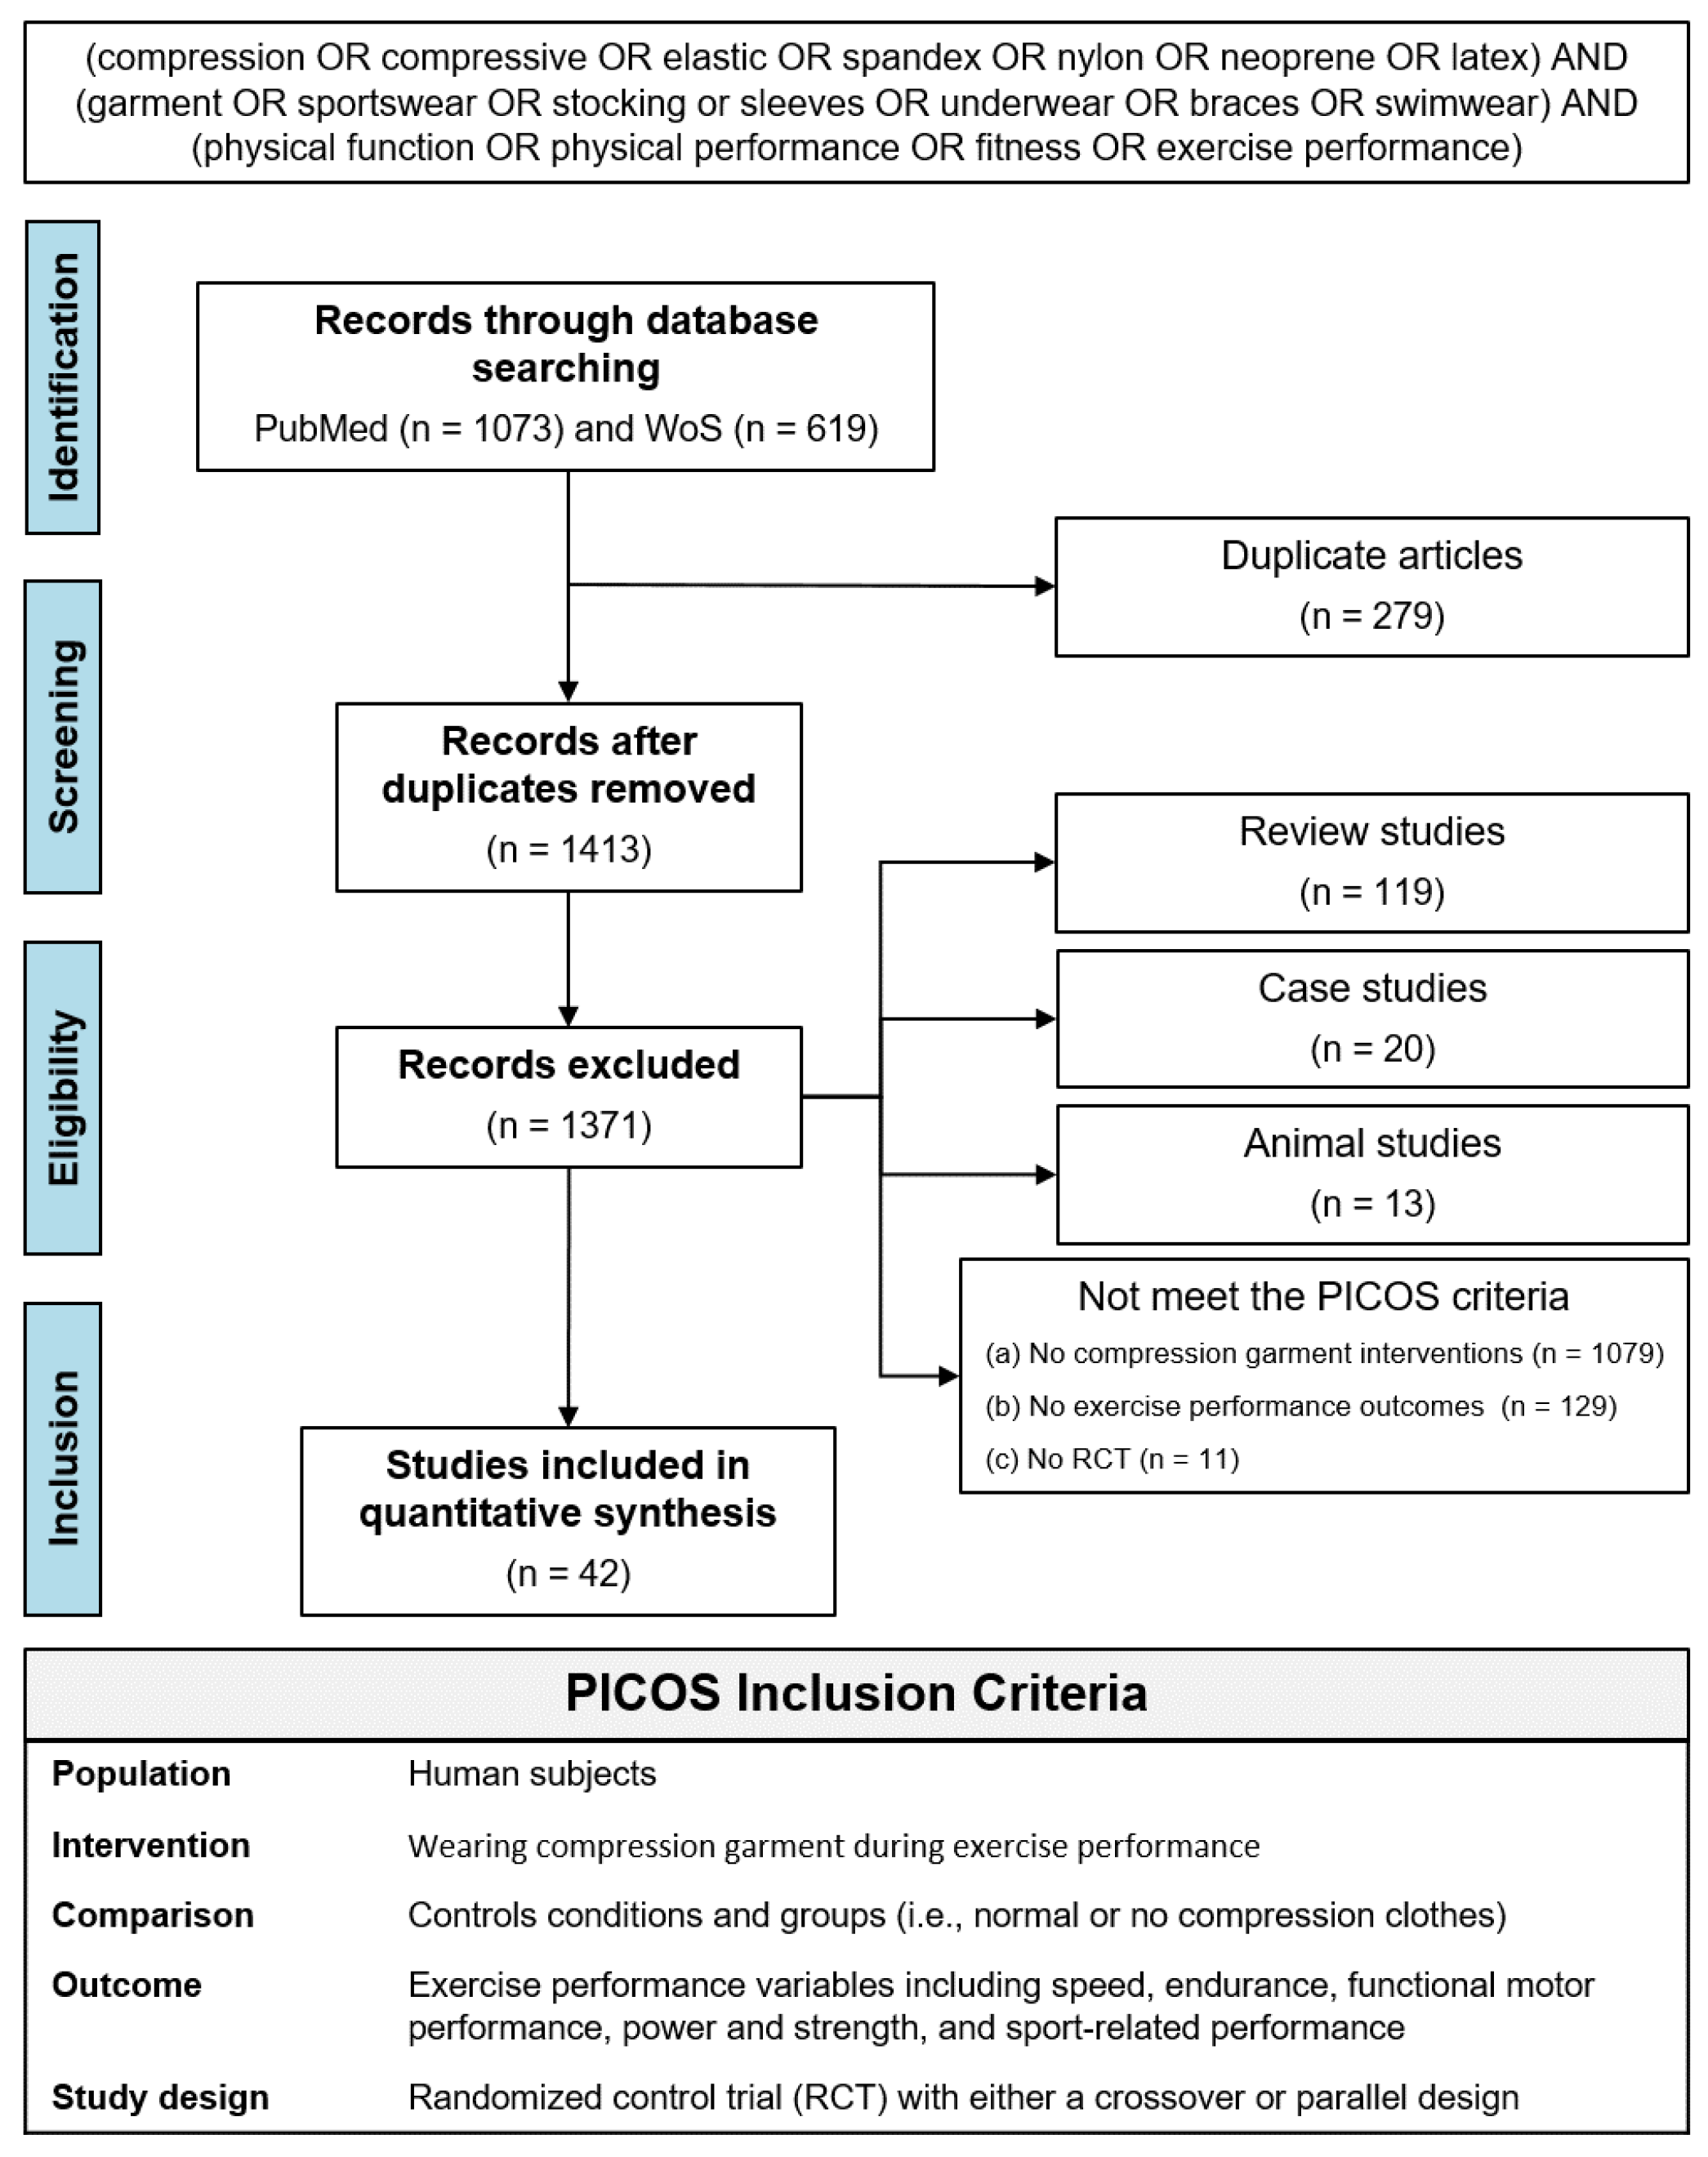
2.1. Study Identification
2.2. Data Synthesis Procedures for Meta-Analysis
2.3. Methodological Quality Estimation
3. Results
3.1. Participant Characteristic
3.2. Exercise Performance and Compression Sportswear
3.3. Methodological Quality Estimation
3.4. Meta-Analytic Findings
3.4.1. Compression Garment on Exercise Performances
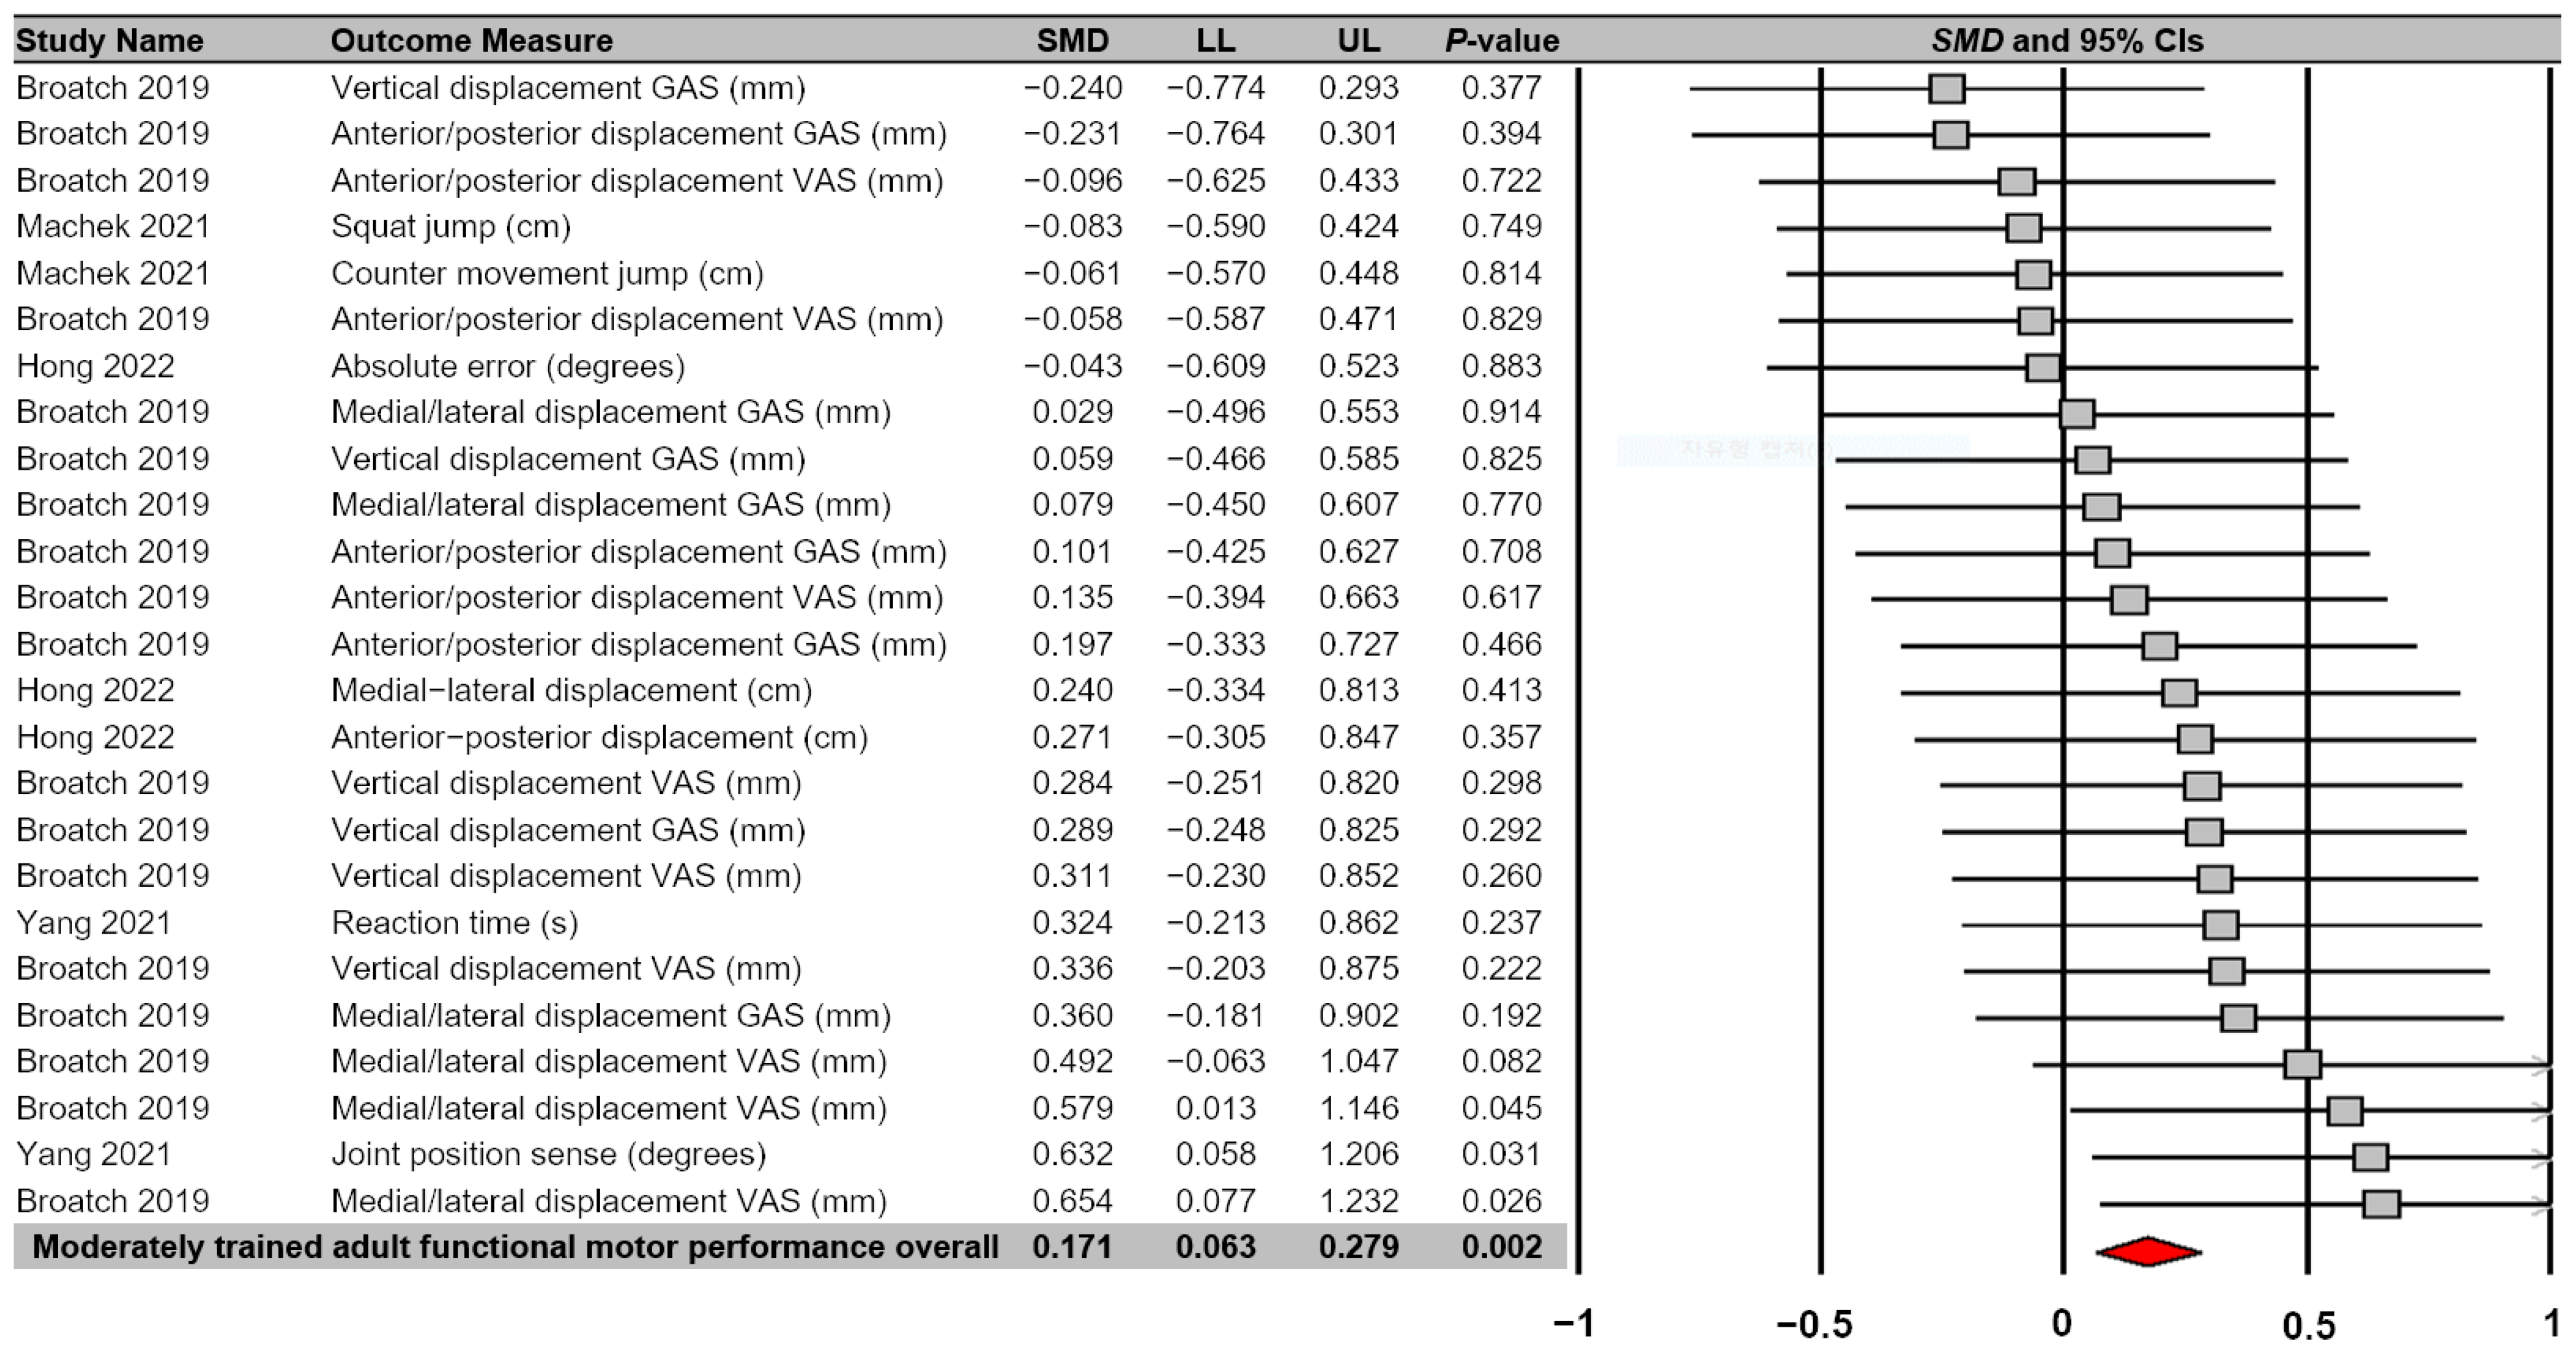
3.4.2. Moderator Variable Analysis on Participant Type
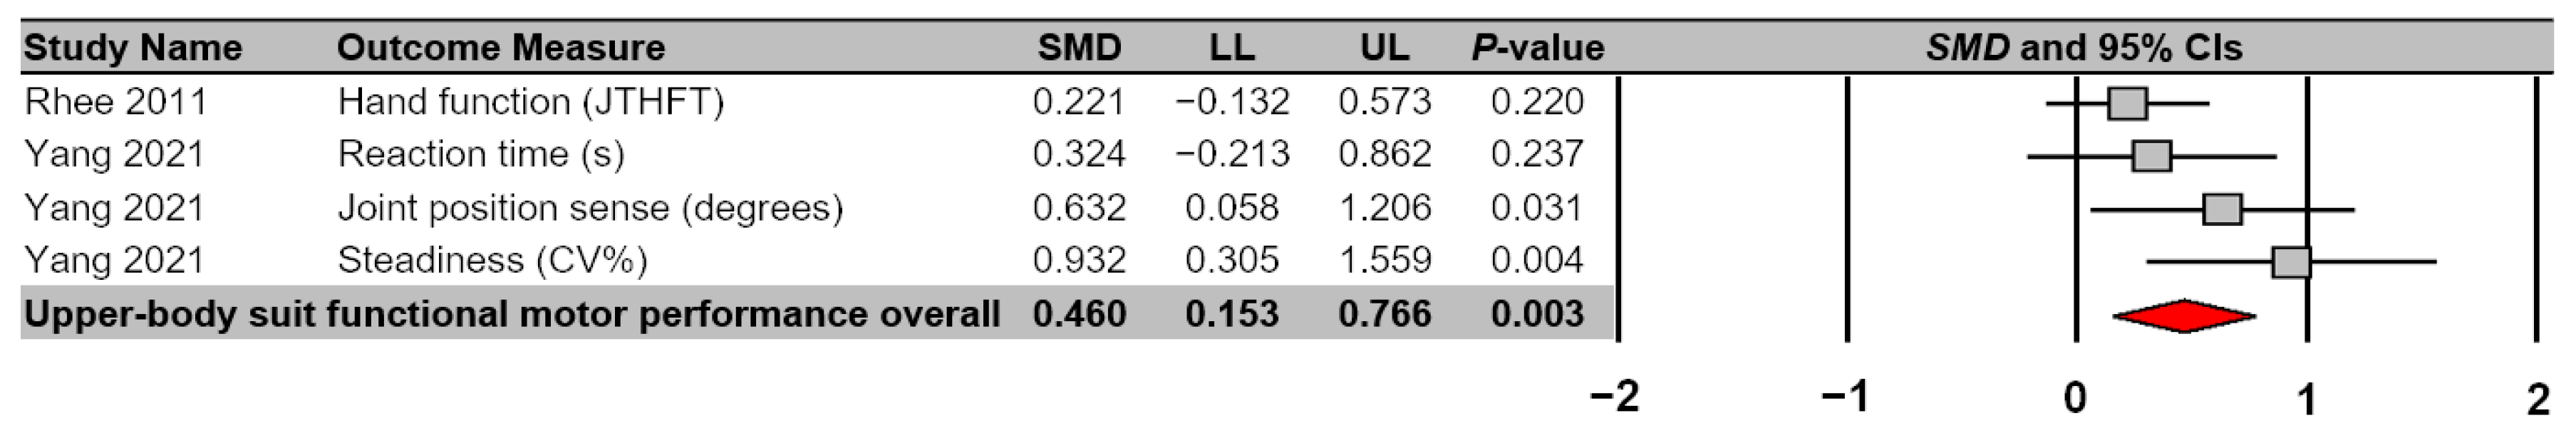
3.4.3. Moderator Variable Analysis on Garment Type
4. Discussion
Supplementary Materials
Author Contributions
Funding
Institutional Review Board Statement
Informed Consent Statement
Data Availability Statement
Conflicts of Interest
References
- Franke, T.P.C.; Backx, F.J.G.; Huisstede, B.M.A. Lower extremity compression garments use by athletes: Why, how often, and perceived benefit. BMC Sports Sci. Med. Rehabil. 2021, 13, 31. [Google Scholar] [CrossRef] [PubMed]
- Bovenschen, H.J.; Booij, M.T.; van der Vleuten, C.J. Graduated compression stockings for runners: Friend, foe, or fake? J. Athl. Train. 2013, 48, 226–232. [Google Scholar] [CrossRef] [PubMed]
- Gladfelter, J. Compression garments 101. Plast. Surg. Nurs. 2007, 27, 73–77. [Google Scholar] [CrossRef] [PubMed]
- Weakley, J.; Broatch, J.; O’Riordan, S.; Morrison, M.; Maniar, N.; Halson, S.L. Putting the squeeze on compression garments: Current evidence and recommendations for future research: A systematic scoping review. Sports Med. 2022, 52, 1141–1160. [Google Scholar] [CrossRef] [PubMed]
- Lee, D.C.W.; Ali, A.; Sheridan, S.; Chan, D.K.C.; Wong, S.H.S. Wearing compression garment enhances central hemodynamics? A systematic review and meta-analysis. J. Strength Cond. Res. 2022, 36, 2349–2359. [Google Scholar] [CrossRef]
- Rider, B.C.; Coughlin, A.M.; Hew-Butler, T.D.; Goslin, B.R. Effect of compression stockings on physiological responses and running performance in division III collegiate cross-country runners during a maximal treadmill test. J. Strength Cond. Res. 2014, 28, 1732–1738. [Google Scholar] [CrossRef]
- Dascombe, B.J.; Hoare, T.K.; Sear, J.A.; Reaburn, P.R.; Scanlan, A.T. The effects of wearing undersized lower-body compression garments on endurance running performance. Int. J. Sports Physiol. Perform. 2011, 6, 160–173. [Google Scholar] [CrossRef]
- O’Riordan, S.F.; Bishop, D.J.; Halson, S.L.; Broatch, J.R. Do sports compression garments alter measures of peripheral blood flow? A systematic review with meta-analysis. Sports Med. 2023, 53, 481–501. [Google Scholar] [CrossRef]
- Doan, B.K.; Kwon, Y.H.; Newton, R.U.; Shim, J.; Popper, E.M.; Rogers, R.A.; Bolt, L.R.; Robertson, M.; Kraemer, W.J. Evaluation of a lower-body compression garment. J. Sports Sci. 2003, 21, 601–610. [Google Scholar] [CrossRef]
- Deng, L.; Yang, Y.; Yang, C.; Fang, Y.; Zhang, X.; Liu, L.; Fu, W. Compression garments reduce soft tissue vibrations and muscle activations during drop jumps: An accelerometry evaluation. Sensors 2021, 21, 5644. [Google Scholar] [CrossRef]
- Broatch, J.R.; Brophy-Williams, N.; Phillips, E.J.; O’Bryan, S.J.; Halson, S.L.; Barnes, S.; Bishop, D.J. Compression garments reduce muscle movement and activation during submaximal running. Med. Sci. Sports Exerc. 2020, 52, 685–695. [Google Scholar] [CrossRef] [PubMed]
- Engel, F.A.; Holmberg, H.C.; Sperlich, B. Is there evidence that runners can benefit from wearing compression clothing? Sports Med. 2016, 46, 1939–1952. [Google Scholar] [CrossRef] [PubMed]
- Hill, J.; Howatson, G.; van Someren, K.; Leeder, J.; Pedlar, C. Compression garments and recovery from exercise-induced muscle damage: A meta-analysis. Br. J. Sports Med. 2014, 48, 1340–1346. [Google Scholar] [CrossRef] [PubMed]
- Marques-Jimenez, D.; Calleja-Gonzalez, J.; Arratibel, I.; Delextrat, A.; Terrados, N. Are compression garments effective for the recovery of exercise-induced muscle damage? A systematic review with meta-analysis. Physiol. Behav. 2016, 153, 133–148. [Google Scholar] [CrossRef] [PubMed]
- Brown, F.; Gissane, C.; Howatson, G.; van Someren, K.; Pedlar, C.; Hill, J. Compression garments and recovery from exercise: A meta-analysis. Sports Med. 2017, 47, 2245–2267. [Google Scholar] [CrossRef] [PubMed]
- Dupuy, O.; Douzi, W.; Theurot, D.; Bosquet, L.; Dugue, B. An evidence-based approach for choosing post-exercise recovery techniques to reduce markers of muscle damage, soreness, fatigue, and inflammation: A systematic review with meta-analysis. Front. Physiol. 2018, 9, 403. [Google Scholar] [CrossRef]
- Higgins, T.; Naughton, G.A.; Burgess, D. Effects of wearing compression garments on physiological and performance measures in a simulated game-specific circuit for netball. J. Sci. Med. Sport. 2009, 12, 223–226. [Google Scholar] [CrossRef]
- Birmingham, T.B.; Kramer, J.F.; Inglis, J.T.; Mooney, C.A.; Murray, L.J.; Fowler, P.J.; Kirkley, S. Effect of a neoprene sleeve on knee joint position sense during sitting open kinetic chain and supine closed kinetic chain tests. Am. J. Sports Med. 1998, 26, 562–566. [Google Scholar] [CrossRef]
- Yang, W.W.; Pan, L.L.H.; Chen, C.S.; Wei, S.H.; Liu, C.; Chou, L.-W. Compression sleeve changes corticomuscular connectivity and sensorimotor function. J. Med. Biol. Eng. 2021, 41, 108–114. [Google Scholar] [CrossRef]
- Leabeater, A.J.; James, L.P.; Driller, M.W. Tight margins: Compression garment use during exercise and recovery—A systematic review. Textiles 2022, 2, 395–421. [Google Scholar] [CrossRef]
- Hong, W.H.; Lo, S.F.; Wu, H.C.; Chiu, M.C. Effects of compression garment on muscular efficacy, proprioception, and recovery after exercise-induced muscle fatigue onset for people who exercise regularly. PLoS ONE 2022, 17, e0264569. [Google Scholar] [CrossRef] [PubMed]
- Ballmann, C.; Hotchkiss, H.; Marshall, M.; Rogers, R. The effect of wearing a lower body compression garment on anaerobic exercise performance in division I NCAA basketball players. sports. Sports 2019, 7, 144. [Google Scholar] [CrossRef] [PubMed]
- Hooper, D.R.; Dulkis, L.L.; Secola, P.J.; Holtzum, G.; Harper, S.P.; Kalkowski, R.J.; Comstock, B.A.; Szivak, T.K.; Flanagan, S.D.; Looney, D.P.; et al. Roles of an upper-body compression garment on athletic performances. J. Strength Cond. Res. 2015, 29, 2655–2660. [Google Scholar] [CrossRef] [PubMed]
- Miyamoto, N.; Kawakami, Y. Effect of pressure intensity of compression short-tight on fatigue of thigh muscles. Med. Sci. Sports Exerc. 2014, 46, 2168–2174. [Google Scholar] [CrossRef] [PubMed]
- Mizuno, S.; Arai, M.; Todoko, F.; Yamada, E.; Goto, K. Wearing lower-body compression garment with medium pressure impaired exercise-induced performance decrement during prolonged running. PLoS ONE 2017, 12, e0178620. [Google Scholar] [CrossRef] [PubMed]
- Liberati, A.; Altman, D.G.; Tetzlaff, J.; Mulrow, C.; Gotzsche, P.C.; Loannidis, J.P.; Clarke, M.; Devereaux, P.J.; Kleijnen, J. The PRISMA statement for reporting systematic reviews and meta-analyses of studies that evaluate health care interventions: Explanation and elaboration. PLoS Med. 2009, 6, e1000100. [Google Scholar] [CrossRef] [PubMed]
- Moher, D.; Liberati, A.; Tetzlaff, J.; Altman, D.G. Preferred reporting items for systematic reviews and meta-analyses: The PRISMA statement. Int. J. Surg. 2010, 8, 336–341. [Google Scholar] [CrossRef] [PubMed]
- Richardson, W.S.; Wilson, M.C.; Nishikawa, J.; Hayward, R.S. The well-built clinical question: A key to evidence-based decisions. ACP J. Club 1995, 123, A12–A13. [Google Scholar] [CrossRef]
- Bodendorfer, B.M.; Arnold, N.R.; Shu, H.T.; Leary, E.V.; Cook, J.L.; Gray, A.D.; Guess, T.M.; Sherman, S.L. Do neoprene sleeves and prophylactic knee braces affect neuromuscular control and cutting agility? Phys. Ther. Sport 2019, 39, 23–31. [Google Scholar] [CrossRef]
- Lee, D.C.; Sheridan, S.; Ali, A.; Sutanto, D.; Wong, S.H. Wearing compression tights post-exercise enhances recovery hemodynamics and subsequent cycling performance. Eur. J. Appl. Physiol. 2021, 121, 2091–2100. [Google Scholar] [CrossRef]
- Burden, R.J.; Glaister, M. The effects of ionized and nonionized compression garments on sprint and endurance cycling. J. Strength. Cond. Res. 2012, 26, 2837–2843. [Google Scholar] [CrossRef] [PubMed]
- Ali, A.; Caine, M.; Snow, B. Graduated compression stockings: Physiological and perceptual responses during and after exercise. J. Sports Sci. 2007, 25, 413–419. [Google Scholar] [CrossRef] [PubMed]
- Machek, S.B.; Cardaci, T.D.; Wilburn, D.T.; Cholewinski, M.C.; Latt, S.L.; Harris, D.R.; Willoughby, D.S. Neoprene knee sleeves of varying tightness augment barbell squat one repetition maximum performance without improving other indices of muscular strength, power, or endurance. J. Strength. Cond. Res. 2021, 35, S6–S15. [Google Scholar] [CrossRef] [PubMed]
- Broatch, J.R.; Bishop, D.J.; Halson, S. Lower limb sports compression garments improve muscle blood flow and exercise performance during repeated-sprint cycling. Int. J. Sports Physiol. Perform. 2018, 13, 882–890. [Google Scholar] [CrossRef] [PubMed]
- Gimenes, S.V.; Marocolo, M.; Pavin, L.N.; Spigolon, L.M.P.; Barbosa Neto, O.; da Silva, B.V.C.; Duffield, R.; da Mota, G.R. Compression stockings used during two soccer matches improve perceived muscle soreness and high-intensity performance. J. Strength. Cond. Res. 2021, 35, 2010–2017. [Google Scholar] [CrossRef] [PubMed]
- Mortaza, N.; Ebrahimi, I.; Jamshidi, A.A.; Abdollah, V.; Kamali, M.; Abas, W.A.; Osman, N.A. The effects of a prophylactic knee brace and two neoprene knee sleeves on the performance of healthy athletes: A crossover randomized controlled trial. PLoS ONE 2012, 7, e50110. [Google Scholar] [CrossRef]
- MacRae, B.A.; Laing, R.M.; Niven, B.E.; Cotter, J.D. Pressure and coverage effects of sporting compression garments on cardiovascular function, thermoregulatory function, and exercise performance. Eur. J. Appl. Physiol. 2012, 112, 1783–1795. [Google Scholar] [CrossRef]
- Stickford, A.S.; Chapman, R.F.; Johnston, J.D.; Stager, J.M. Lower-leg compression, running mechanics, and economy in trained distance runners. Int. J. Sports Physiol. Perform. 2015, 10, 76–83. [Google Scholar] [CrossRef]
- Geldenhuys, A.G.; Swart, J.; Bosch, A. Investigation of the impact of below-knee compression garments on markers of exercise-induced muscle damage and performance in endurance runners: A prospective randomized controlled trial. Sports Health 2019, 11, 254–264. [Google Scholar] [CrossRef]
- Barwood, M.J.; Corbett, J.; Feeney, J.; Hannaford, P.; Henderson, D.; Jones, I.; Kirke, J. Compression garments: No enhancement of high-intensity exercise in hot radiant conditions. Int. J. Sports Physiol. Perform. 2013, 8, 527–535. [Google Scholar] [CrossRef]
- Sperlich, B.; Haegele, M.; Achtzehn, S.; Linville, J.; Holmberg, H.C.; Mester, J. Different types of compression clothing do not increase sub-maximal and maximal endurance performance in well-trained athletes. J. Sports Sci. 2010, 28, 609–614. [Google Scholar] [CrossRef] [PubMed]
- Del Coso, J.; Areces, F.; Salinero, J.J.; González-Millán, C.; Abián-Vicén, J.; Soriano, L.; Ruiz, D.; Gallo, C.; Lara, B.; Calleja-Gonzalez, J. Compression stockings do not improve muscular performance during a half-ironman triathlon race. Eur. J. Appl. Physiol. 2014, 114, 587–595. [Google Scholar] [CrossRef] [PubMed]
- Faulkner, J.A.; Gleadon, D.; McLaren, J.; Jakeman, J.R. Effect of lower-body compression clothing on 400-m sprint performance. J. Strength. Cond. Res. 2013, 27, 669–676. [Google Scholar] [CrossRef]
- Duffield, R.; Portus, M. Comparison of three types of full-body compression garments on throwing and repeat-sprint performance in cricket players. Br. J. Sports Med. 2007, 41, 409–414. [Google Scholar] [CrossRef] [PubMed]
- Ali, A.; Creasy, R.H.; Edge, J.A. The effect of graduated compression stockings on running performance. J. Strength. Cond. Res. 2011, 25, 1385–1392. [Google Scholar] [CrossRef] [PubMed]
- Tsuruike, M.; Ellenbecker, T.S. Effects of a compression garment on shoulder external rotation force outputs during isotonic contractions. J. Strength. Cond. Res. 2013, 27, 519–525. [Google Scholar] [CrossRef] [PubMed]
- Sear, J.A.; Hoare, T.K.; Scanlan, A.T.; Abt, G.A.; Dascombe, B.J. The effects of whole-body compression garments on prolonged high-intensity intermittent exercise. J. Strength Cond. Res. 2010, 24, 1901–1910. [Google Scholar] [CrossRef]
- De Glanville, K.M.; Hamlin, M.J. Positive effect of lower body compression garments on subsequent 40-kM cycling time trial performance. J. Strength Cond. Res. 2012, 26, 480–486. [Google Scholar] [CrossRef]
- Driller, M.W.; Halson, S.L. The effects of wearing lower body compression garments during a cycling performance test. Int. J. Sports Physiol. Perform. 2013, 8, 300–306. [Google Scholar] [CrossRef]
- Kemmler, W.; von Stengel, S.; Köckritz, C.; Mayhew, J.; Wassermann, A.; Zapf, J. Effect of compression stockings on running performance in men runners. J. Strength Cond. Res. 2009, 23, 101–105. [Google Scholar] [CrossRef]
- Cheng, L.; Xiong, C. The effects of compression stockings on the energetics and biomechanics during walking. Eur. J. Appl. Physiol. 2019, 119, 2701–2710. [Google Scholar] [CrossRef] [PubMed]
- Born, D.P.; Holmberg, H.C.; Goernert, F.; Sperlich, B. A novel compression garment with adhesive silicone stripes improves repeated sprint performance—A multi-experimental approach on the underlying mechanisms. BMC. Sports Sci. Med. Rehabil. 2014, 6, 21. [Google Scholar] [CrossRef] [PubMed]
- Zhang, L.Y.; Négyesi, J.; Okuyama, T.; Tanaka, M.; Hortobágyi, T.; Nagatomi, R. Position of compression garment around the knee affects healthy adults’ knee joint position sense acuity. Hum. Mov. Sci. 2019, 67, 102519. [Google Scholar] [CrossRef] [PubMed]
- Ganzit, G.; Moretti, M.; Milani, M.; Arpaia, G. Effect of knee-length elastic graduated compression stockings on aerobic performance in athletes. Med. Dello Sport 2007, 60, 567. [Google Scholar]
- Pereira, M.C.; Bottaro, M.; Brown, L.E.; Rocha-Junior, V.A.; Martorelli, S.S.; Neumann, M.; Carmo, J. The effects of graduated compression sleeves on muscle performance: A randomised controlled trial. Int. J. Sports Sci. Coach. 2014, 9, 985–992. [Google Scholar] [CrossRef]
- Michael, J.S.; Dogramaci, S.N.; Steel, K.A.; Graham, K.S. What is the effect of compression garments on a balance task in female athletes? Gait. Posture 2014, 39, 804–809. [Google Scholar] [CrossRef] [PubMed]
- Limmer, M.; de Marées, M.; Roth, R. Effects of forearm compression sleeves on muscle hemodynamics and muscular strength and endurance parameters in sports climbing: A randomized, controlled crossover trial. Front. Physiol. 2022, 13, 888860. [Google Scholar] [CrossRef]
- Song, S.J.; Beard, C.A.; Ustinova, K.I. The effects of wearing a compression top on trunk and golf club motions during golf swing. Cloth. Text. Res. J. 2016, 34, 48–60. [Google Scholar] [CrossRef]
- Rhee, H.; Yu, J.; Kim, S. Influence of compression types on hand function: A preliminary investigation. J. Phys. Ther. Sci. 2011, 23, 477–480. [Google Scholar] [CrossRef]
- Zhang, S.; Fu, W.; Xia, R.; Wang, X. Compression apparel does not have an acute effect on quadriceps strength but is associated with changes in muscle activation patterns. Isokinet. Exer. Sci. 2016, 24, 59–65. [Google Scholar] [CrossRef]
- McManus, C.; Cooper, C.E.; Sandercock, G. The influence of compression tights on running economy varies by relative intensity. Int. J. Sports Sci. Coach. 2023, 18, 793–800. [Google Scholar] [CrossRef]
- Chang, L.; Fu, S.; Li, J.; Wu, S.; Adams, R.; Han, J.; Han, C. Effects of compression running pants and treadmill running stages on knee proprioception and fatigue-related physiological responses in half-marathon runners. Front. Physiol. 2022, 13, 1035424. [Google Scholar] [CrossRef] [PubMed]
- Borenstein, M.; Hedges, L.V.; Higgins, J.P.T.; Rothstein, H.R. Introduction to Meta-Analysis; John Wiley & Sons: Chichester, UK, 2021. [Google Scholar]
- Miller, J.R.; Van Hooren, B.; Bishop, C.; Bukley, J.D.; Willy, R.W.; Fuller, J.T. A systematic review and meta-analysis of crossover studies comparing physiological, perceptual and performance measures between treadmill and overground running. Sports Med. 2019, 49, 763–782. [Google Scholar] [CrossRef] [PubMed]
- Nasser, M. New standards for systematic reviews incorporate population health sciences. Am. J. Public Health 2020, 110, 753. [Google Scholar] [CrossRef]
- Stedman, M.R.; Curtin, F.; Elbourne, D.R.; Kesselheim, A.S.; Brookhart, M.A. Meta-analyses involving cross-over trials: Methodological issues. Int. J. Epidemiol. 2011, 40, 1732–1734. [Google Scholar] [CrossRef] [PubMed]
- Borenstein, M.; Hedges, L.V.; Higgins, J.P.; Rothstein, H.R. A basic introduction to fixed-effect and random-effects models for meta-analysis. Res. Synth. Methods 2010, 1, 97–111. [Google Scholar] [CrossRef] [PubMed]
- John, G.H. Robust Decision Trees: Removing Outliers from Databases. KDD 1995, 95, 174–179. [Google Scholar]
- Higgins, J.P.; Thompson, S.G. Quantifying heterogeneity in a meta-analysis. Stat. Med. 2002, 21, 1539–1558. [Google Scholar] [CrossRef]
- Higgins, J.P.; Thompson, S.G.; Deeks, J.J.; Altman, D.G. Measuring inconsistency in meta-analyses. BMJ 2003, 327, 557–560. [Google Scholar] [CrossRef]
- Egger, M.; Smith, G.D.; Schneider, M.; Minder, C. Bias in meta-analysis detected by a simple, graphical test. BMJ 1997, 315, 629–634. [Google Scholar] [CrossRef]
- Johnson, L.J.; Doncaster, G.; Cronin, L.; Williams, C.; Varga, J.; Marchant, D. Well-trained, trained and recreationally trained runners’ cognition during a 5km tempo run: A think aloud study. Int. J. Sport Exerc. Psychol. 2023, 2023, 2207104. [Google Scholar] [CrossRef]
- Ballard, K.D.; Miller, J.J.; Robinson, J.H.; Olive, J.L. Aerobic capacity and postprandial flow mediated dilation. Int. J. Exerc. Sci. 2008, 1, 163–176. [Google Scholar] [PubMed]
- Maher, C.G.; Sherrington, C.; Herbert, R.D.; Moseley, A.M.; Elkins, M. Reliability of the PEDro scale for rating quality of randomized controlled trials. Phys. Ther. 2003, 83, 713–721. [Google Scholar] [CrossRef] [PubMed]
- Bastani, A.; Jaberzadeh, S. Does anodal transcranial direct current stimulation enhance excitability of the motor cortex and motor function in healthy individuals and subjects with stroke: A systematic review and meta-analysis. Clin. Neurophysiol. 2012, 123, 644–657. [Google Scholar] [CrossRef] [PubMed]
- Foley, N.C.; Teasell, R.W.; Bhogal, S.K.; Speechley, M.R. Stroke rehabilitation evidence-based review: Methodology. Top. Stroke Rehabil. 2003, 10, 1–7. [Google Scholar] [CrossRef] [PubMed]
- Da Silva, C.A.; Helal, L.; da Silva, R.P.; Belli, K.C.; Umpierre, D.; Stein, R. Association of lower limb compression garments during high-intensity exercise with performance and physiological responses: A systematic review and meta-analysis. Sports Med. 2018, 48, 1859–1873. [Google Scholar] [CrossRef] [PubMed]
- Born, D.P.; Sperlich, B.; Holmberg, H.C. Bringing light into the dark: Effects of compression clothing on performance and recovery. Int. J. Sports Physiol. Perform. 2013, 8, 4–18. [Google Scholar] [CrossRef]
- Chatard, J.C.; Atlaoui, D.; Farjanel, J.; Louisy, F.; Rastel, D.; Guezennec, C.Y. Elastic stockings, performance and leg pain recovery in 63-year-old sportsmen. Eur. J. Appl. Physiol. 2004, 93, 347–352. [Google Scholar] [CrossRef]
- Hermassi, S.; Chelly, M.S.; Tabka, Z.; Shephard, R.J.; Chamari, K. Effects of 8-week in-season upper and lower limb heavy resistance training on the peak power, throwing velocity, and sprint performance of elite male handball players. J. Strength. Cond. Res. 2011, 25, 2424–2433. [Google Scholar] [CrossRef]
- Bezodis, N.E.; Willwacher, S.; Salo, A.I.T. The biomechanics of the track and field sprint start: A narrative review. Sports Med. 2019, 49, 1345–1364. [Google Scholar] [CrossRef]
- Edgar, D.T.; Beaven, C.M.; Gill, N.D.; Driller, M.W. Under pressure: The chronic effects of lower-body compression garment use during a 6-week military training course. Int. J. Environ. Res. Public Health 2022, 19, 3912. [Google Scholar] [CrossRef] [PubMed]
- Page, M.J.; McKenzie, J.E.; Bossuyt, P.M.; Boutron, I.; Hoffmann, T.C.; Mulrow, C.D.; Shamseer, L.; Tetzlaff, J.M.; Akl, E.A.; Brennan, S.E.; et al. The PRISMA 2020 statement: An updated guideline for reporting systematic reviews. Int. J. Surg. 2021, 88, 105906. [Google Scholar] [CrossRef] [PubMed]


| Study | Study Design | Total (N) | Age (yrs) | Gender (F/M) | Stature (m) | Body Mass (kg) | Population | |
|---|---|---|---|---|---|---|---|---|
| Ali 2007 [32] | Crossover | Exp. 1 | 14 | 22.0 ± 0.4 | 14 M | 1.74 ± 0.01 | 72.9 ± 2.0 | Moderately trained adult |
| Exp. 2 | 14 | 23.0 ± 0.5 | 14 M | 1.76 ± 0.01 | 74.2 ± 2.1 | |||
| Ali 2011 [45] | Crossover | 12 | 33.0 ± 10.0 | 3 F, 9 M | 1.74 ± 0.06 | 68.5 ± 6.2 | Athlete (runner) | |
| Barwood 2014 [40] | Crossover | 8 | 21.0 ± 2.0 | NA | 1.77 ± 0.06 | 72.8 ± 7.1 | Healthy adult | |
| Birmingham 1998 [18] | Crossover | 36 | 24.0 ± 2.1 | 18 F, 18 M | 1.70 ± 0.10 | 66.8 ± 9.6 | Healthy adult | |
| Bodendorfer 2019 [29] | Crossover | 10 | 23.6 ± 1.4 | 5 F, 5 M | 1.76 ± 0.01 | 72.9 ± 16.7 | Healthy adult | |
| Born 2014 [52] | Crossover | Exp. 1 | 12 | 25.0 ± 3.0 | NA | 1.67 ± 0.03 | 61.0 ± 5.0 | Athlete |
| Exp. 2 | 12 | 23.0 ± 2.0 | 1.69 ± 0.03 | 61.0 ± 6.0 | ||||
| Broatch 2017 [34] | Crossover | Male | 9 | 28.0 ± 6.0 | 9 M | 1.81 ± 0.07 | 83.8 ± 9.3 | Moderately trained adult |
| Female | 11 | 25.0 ± 2.0 | 11 F | 1.69 ± 0.06 | 62.6 ± 9.5 | |||
| Broatch 2019 [11] | Crossover | Exp. 1 | 13 | 22.0 ± 3.0 | 13 M | 1.85 ± 0.06 | 84.1 ± 9.4 | Healthy adult |
| Exp. 2 | 14 | 27.0 ± 5.0 | 14 M | 1.81 ± 0.07 | 77.8 ± 8.4 | |||
| Bruden 2012 [31] | Crossover | 10 | 34.6 ± 6.8 | 10 M | 1.80 ± 0.05 | 82.2 ± 10.4 | Athlete (triathletes and cyclist) | |
| Chang 2022 [62] | Crossover | 18 | 35.3 ± 8.5 | 9 F, 9 M | 1.70 ± 0.10 | 60.5 ± 9.8 | Athlete (half-marathon runner) | |
| Cheng 2019 [51] | Crossover | 16 | 22.5 ± 0.9 | 16 M | 1.71 ± 0.05 | 63.5 ± 6.9 | Healthy adult | |
| Dascombe 2011 [7] | Crossover | 11 | 28.4 ± 10.0 | 11 M | 1.77 ± 0.05 | 72.6 ± 8.0 | Athlete (MD-runner and triathletes) | |
| de Glanville 2012 [48] | Crossover | 14 | 33.8 ± 6.8 | 14 M | 1.80 ± 0.10 | 74.6 ± 4.4 | Athlete (multisport) | |
| Del Coso 2013 [42] | Parallel | CG | 19 | 35.0 ± 5.3 | NA | 1.76 ± 0.08 | 73.2 ± 5.2 | Athletes (triathletes) |
| Control | 17 | 35.8 ± 6.3 | 1.76 ± 0.05 | 73.2 ± 6.0 | ||||
| Doan 2003 [9] | Crossover | Male | 10 | 20.0 ± 0.9 | 10 M | 1.79 ± 0.07 | 74.1 ± 8.3 | Athlete (track) |
| Female | 10 | 19.2 ± 1.3 | 10 F | 1.69 ± 0.03 | 60.2 ± 5.2 | |||
| Driller 2013 [49] | Crossover | 12 | 30.0 ± 6.0 | 12 M | 1.80 ± 0.05 | 75.6 ± 5.8 | Athlete (cyclist) | |
| Duffield 2007 [44] | Crossover | 10 | 22.1 ± 1.1 | 10 M | 1.85 ± 0.07 | 84.7 ± 5.9 | Athlete (cricket) | |
| Faulkner 2013 [43] | Crossover | 11 | 23.7 ± 5.7 | 11 M | 1.78 ± 0.08 | 75.3 ± 10.0 | Athlete (runner) | |
| Ganzit 2007 [54] | Crossover | 20 | 29.9 ± 4.3 | NA | 1.78 ± 0.04 | 71.9 ± 4.5 | Athlete (cyclist) | |
| Geldenhuys 2019 [39] | Parallel | CG | 20 | 34.0 ± 4.8 | 6 F, 14 M | 1.70 ± 0.90 | 72.1 ± 10.5 | Highly trained adult |
| Control | 21 | 34.0 ± 6.4 | 6 F, 15 M | 1.80 ± 0.09 | 76.6 ± 9.9 | |||
| Gimenes 2019 [35] | Parallel | CG | 10 | 18.4 ± 0.5 | 10 M | 1.79 ± 0.05 | 67.8 ± 7.2 | Athlete (soccer) |
| Control | 10 | 18.3 ± 0.5 | 10 M | 1.78 ± 0.05 | 73.7 ± 7.1 | |||
| Higgins 2009 [17] | Crossover | 9 | 22.6 ± 4.6 | 9 F | 1.76 ± 0.04 | 67.8 ± 6.6 | Athlete (netball) | |
| Hong 2022 [21] | Crossover | 20 | 22.8 ± 2.2 | 6 F, 6 M | 1.70 ± 0.07 | 67.2 ± 12.7 | Healthy adult | |
| Kemmler 2009 [50] | Crossover | 21 | 39.3 ± 10.9 | 21 M | 1.79 ± 0.05 | 75.4 ± 7.4 | Moderately trained adult | |
| Lee 2021 [30] | Crossover | 13 | 20.9 ± 1.4 | 13 M | 1.73 ± 0.05 | 65.9 ± 7.8 | Healthy adult | |
| Limmer 2022 [57] | Crossover | Male | 12 | 30.0 ± 7.2 | 12 M | 1.81 ± 0.06 | 74.8 ± 10.2 | Moderately trained adult |
| Female | 12 | 28.2 ± 6.2 | 12 F | 1.67 ± 0.06 | 59.4 ± 5.6 | |||
| Machek 2020 [33] | Crossover | 15 | 22.1 ± 4.1 | 15 M | 1.78 ± 0.06 | 87.8 ± 7.8 | Moderately trained adult | |
| Macrae 2012 [37] | Crossover | 12 | 26.0 ± 7.0 | 12 M | 1.80 ± 0.07 | 79.0 ± 9.0 | Moderately trained adult | |
| McManus 2022 [61] | Crossover | 26 | 27.9 ± 7.0 | 26 M | 1.79 ± 0.06 | 76.1 ± 8.4 | Moderately trained adult | |
| Michael 2014 [56] | Crossover | 12 | 24.0 ± 7.2 | 12 F | 1.68 ± 0.06 | 57.8 ± 6.1 | Athlete | |
| Mortaza 2012 [36] | Crossover | 31 | 21.2 ± 1.5 | 31 M | NA | NA | Athlete (football) | |
| Pereira 2014 [55] | Parallel | 24 | 24.1 ± 5.2 | 24 M | 1.76 ± 0.06 | 78.6 ± 9.7 | Moderately trained adult | |
| Rhee 2011 [59] | Crossover | 32 | 45.0 ± 1.1 | 32 F | NA | NA | Healthy adult | |
| Rider 2014 [6] | Crossover | Male | 7 | 21.0 ± 1.3 | 7 M | 1.73 ± 0.04 | 68.7 ± 9.7 | Athlete (cross-country) |
| Female | 3 | 18.7 ± 0.6 | 3 F | 1.63 ± 0.05 | 56.7 ± 3.3 | |||
| Sear 2010 [47] | Crossover | 8 | 20.6 ± 1.2 | 8 M | NA | 72.9 ± 5.9 | Athlete (A-team sports) | |
| Song 2015 [58] | Crossover | 11 | 46.3 ± 16.0 | 11 M | 1.72 ± 0.01 | 86.4 ± 11.8 | Athlete (golf) | |
| Sperlich 2010 [41] | Crossover | 15 | 27.1 ± 4.8 | 15 M | 1.83 ± 0.08 | 76.3 ± 7.6 | Athlete (runner and triathletes) | |
| Stickford 2015 [38] | Crossover | 16 | 22.4 ± 3.0 | 16 M | 1.81 ± 0.05 | 66.4 ± 5.2 | Athlete (PD-runner) | |
| Tsuruike 2013 [46] | Crossover | Tennis | 12 | 19.8 ± 0.9 | 12 M | 1.73 ± 0.06 | 64.4 ± 5.0 | Athlete (tennis and soccer) |
| Soccer | 12 | 19.9 ± 0.3 | 12 M | 1.75 ± 0.06 | 66.5 ± 7.0 | |||
| Yang 2021 [19] | Crossover | 14 | 24.6 ± 3.6 | 8 F, 6 M | 1.67 ± 0.06 | 58.9 ± 5.5 | Healthy adult | |
| Zhang 2016 [60] | Crossover | 12 | 21.2 ± 1.4 | 12 M | 1.78 ± 0.04 | 67.1 ± 6.4 | Athlete (track and field) | |
| Zhang 2019 [53] | Crossover | 16 | 25.5 ± 2.6 | 8 F, 8 M | 1.67 ± 0.10 | 61.1 ± 6.3 | Healthy adult |
| Study | Compression Sportswear Characteristics | Exercise Performance | |||
|---|---|---|---|---|---|
| Extremities | Type | Pressure (mmHg) | Type | Task | |
| Ali 2007 [32] | Lower (ankle length) | GCS | 18–22 | Endurance Endurance | 1. Intermittent running (shuttle running) 2. Continuous running (10 km running) |
| Ali 2011 [45] | Lower (knee-high) | GCS | 12–32 | Endurance Functional motor performance | 1. 10 km running 2. Countermovement jump |
| Barwood 2014 [40] | Lower (calf and thigh) | GCS | Calf: 17–20 Thigh: 10–11 | Endurance | 5 km treadmill running |
| Birmingham 1998 [18] | Lower (knee joint) | NS | NA | Functional motor performance | Open and close kinetic chain test |
| Bodendorfer 2019 [29] | Lower (knee joint) | NS PKB | NA | Speed | Cutting movements |
| Born 2014 [52] | Lower (lower body) | CG | Exp. 1: 17.5–21.7 Exp. 2: 18.2–20.2 | Functional motor performance Speed | 1. Hip flexion angle, step length and frequency 2. 30 m repeated sprints |
| Broatch 2017 [34] | Lower (thigh, calf, and ankle) | CG | Thigh: 11.7 Calf: 26.4 Ankle: 21.5 | Power and Strength | Sprint cycling-peak power and work |
| Broatch 2019 [11] | Lower (thigh and calf) | CT | 2XU: 10.7–21.8 Nike: 9.1–21.5 Under Armor: 7.7–18.9 | Functional motor performance | 9 min treadmill running (lower limb displacements) |
| Bruden 2012 [31] | Lower (thigh and shank) | CG (Ionized and nonionized) | Midthigh: 11–15 Midshank: 16–21 | Endurance Power and Strength | 1. Fatigue rate 2. Sprint and cycling (mean and peak power) |
| Chang 2022 [62] | Lower (thigh and calf) | CRP | Thigh: 12–20 Calf: 15–22 | Endurance Functional motor performance | 1. 21 km treadmill running trials 2. Knee flexion proprioception (lunge squat) |
| Cheng 2019 [51] | Lower (above the ankle to below the tibia) | CS | 30–40 | Power and Strength Functional motor performance | 1. Single joint movement (peak and power output) 2. Walking on the treadmill (step length and frequency) |
| Dascombe 2011 [7] | Lower (lower body) | CG | rLBCG: 13.7–19.2 uLBCG: 15.9–32.7 | Endurance Endurance | 1. Progressive maximal tests 2. Time-to-exhaustion tests |
| de Glanville 2012 [48] | Lower (lower body) | CG | 6.0–11.8 | Power and Strength | Subsequent 40 km cycling time (power output) |
| Del Coso 2013 [42] | Lower (ankle to knee) | GCS | NA | Endurance Speed Speed Speed | 1. Half iron marathon 2. Swimming (m/s) 3. Cycling (m/s) 4. Running (m/s) |
| Doan 2003 [9] | Lower (hip, thigh, and knee) | CG | NA | Functional motor performance Functional motor performance Functional motor performance Functional motor performance | 1. 60 m sprint range of motion test 2. Jump height 3. Squat depth 4. Range of motion (knee) |
| Driller 2013 [49] | Lower (full-length lower body) | CG | NA | Power and Strength | Incremental cycling test (power output) |
| Duffield 2007 [44] | Whole-body | CG | NA | Endurance Sport performance Speed | 1. Total distance 2. Cricket Ball throws 3. 10 and 20 m sprint |
| Faulkner 2013 [43] | Lower (hip to ankle, hip to knee, and ankle to knee) | CG | NA | Sport performance | 40 m sprint |
| Ganzit 2007 [54] | Lower (ankle) | CS | 20 | Endurance Power and strength | 1. Incremental cycling test 2. Maximal workload |
| Geldenhuys 2019 [39] | Lower (below knee) | CG | NA | Endurance | Ultramarathon-race pace (0–42, 42–56 km) |
| Gimenes 2019 [35] | Lower (calf and ankle) | CS | 20–30 | Endurance | 1. Sprints (rep)-match 1 and 2 2. Distance covered (m)-match 1 and 2 |
| Higgins 2009 [17] | Whole-body | Netball CG | NA | Speed Sport performance Sport performance | 1. Netball 20 m sprint time (s) 2. Netball countermovement jumps-flight time (s) 3. Netball Distance traveled |
| Hong 2022 [21] | Lower (lower body) | CG | 16.8–27.3 | Functional motor performance Power and strength | 1. Proprioception (displacements of COP and AE) 2. Countermovement jump |
| Kemmler 2009 [50] | Lower (below knee) | CS | 18–24 | Endurance Power and Strength | 1. Stepwise incremented treadmill test 2. Incremented treadmill (work output) |
| Lee 2021 [30] | Lower (ankle) | CT | 28.6 ± 9.4 | Functional motor performance Power and Strength | 1. Cadence 2. 20 min fatiguing preload cycling power output |
| Limmer 2022 [57] | Upper (forearm) | Sleeve CG | 12.4–22.4 | Endurance Power and Strength | 1. Finger hang and lap climbing 2. Hand grip strength |
| Machek 2020 [33] | Lower (below knee) | NS | NA | Endurance Functional motor performance Power and Strength | 1. One leg extension (total volume) 2. Countermovement jump, barbell, and squat jump 3. One leg extension (1RM-kg) |
| Macrae 2012 [37] | Whole-body | CG | CSG: 11–15 OSG: 8–13 | Power and Strength Speed | 1. 6 km cycling power output 2. 6 km cycling time |
| McManus 2022 [61] | Lower (calf and thigh) | CT | 6.8–8.9 | Speed | Running speed at 60, 62.5, and 65% VO2 max for 15 min |
| Michael 2014 [56] | Lower (lower body) | CG | NA | Functional motor performance | Single-leg balance task |
| Mortaza 2012 [36] | Lower (knee joint) | 1. NS 2. PKB | NA | Functional motor performance Power and Strength | 1. Single-leg vertical jump and Cross-over hop 2. Isokinetic knee flexion and extension (at 60, 180, 300 u/sec) |
| Pereira 2014 [55] | Upper (elbow) | Sleeve CG | NA | Power and Strength | Unilateral maximal isokinetic eccentric/concentric elbow flexion |
| Rhee 2011 [59] | Upper (hand) | Glove CG | 25–32 | Functional motor performance Power and Strength | 1. Hand function test using the JTHFT 2. Hand grip strength |
| Rider 2014 [6] | Lower (below knee) | CS | 15–20 | Endurance | Maximal workload treadmill test |
| Sear 2010 [47] | Whole-body | CG | Upper: 5.3–7.3 Lower: 9.2–17.8 | Speed | Prolonged high-intensity intermittent treadmill exercise |
| Song 2015 [58] | Upper | Sleeve CG | NA | Power and Strength | Modern golf swing |
| Sperlich 2010 [41] | Whole-body | 1. CG (socks) 2. CG (tight) 3. Whole-body CG | 20 | Endurance | Time to exhaustion (on the treadmill) |
| Stickford 2015 [38] | Lower (calf) | CS | 15–20 | Functional motor performance | Walking tests (step length, frequency, swing time, and ground contact time) |
| Tsuruike 2013 [46] | Upper | Sleeve CG | NA | Power and Strength | External rotation of glenohumeral joint with isotonic contraction force output |
| Yang 2021 [19] | Upper (arm, elbow, forearm, wrist, and palm) | Sleeve CG | 10–20 | Functional motor performance Functional motor performance Functional motor performance | 1. Visual tracking motor tasks 2. Reaction time 3. Joint position sense |
| Zhang 2016 [60] | Lower (above the knee) | CG | NA | Endurance Power and Strength | 1. Isokinetic knee extensions at 60 and 300°/s assessing work fatigue 2. Isokinetic knee extensions at 60 and 300°/s on a dynamometer |
| Zhang 2019 [53] | Lower (knee joint) | CS | NA | Functional motor performance | Knee joint position-active target-matching task |
Disclaimer/Publisher’s Note: The statements, opinions and data contained in all publications are solely those of the individual author(s) and contributor(s) and not of MDPI and/or the editor(s). MDPI and/or the editor(s) disclaim responsibility for any injury to people or property resulting from any ideas, methods, instructions or products referred to in the content. |
© 2023 by the authors. Licensee MDPI, Basel, Switzerland. This article is an open access article distributed under the terms and conditions of the Creative Commons Attribution (CC BY) license (https://creativecommons.org/licenses/by/4.0/).
Share and Cite
Lee, H.; Kim, R.-K.; Chae, W.-S.; Kang, N. Compression Sportswear Improves Speed, Endurance, and Functional Motor Performances: A Meta-Analysis. Appl. Sci. 2023, 13, 13198. https://doi.org/10.3390/app132413198
Lee H, Kim R-K, Chae W-S, Kang N. Compression Sportswear Improves Speed, Endurance, and Functional Motor Performances: A Meta-Analysis. Applied Sciences. 2023; 13(24):13198. https://doi.org/10.3390/app132413198
Chicago/Turabian StyleLee, Hanall, Rye-Kyeong Kim, Woen-Sik Chae, and Nyeonju Kang. 2023. "Compression Sportswear Improves Speed, Endurance, and Functional Motor Performances: A Meta-Analysis" Applied Sciences 13, no. 24: 13198. https://doi.org/10.3390/app132413198
APA StyleLee, H., Kim, R.-K., Chae, W.-S., & Kang, N. (2023). Compression Sportswear Improves Speed, Endurance, and Functional Motor Performances: A Meta-Analysis. Applied Sciences, 13(24), 13198. https://doi.org/10.3390/app132413198