1. Introduction
The shale oil and gas revolution in the U.S., with marine shale as the target layer for exploration and development, has achieved great success and changed the world’s energy landscape [
1,
2]. Since 2010, China’s oil and gas industry has drawn on the experience of North America and gradually expanded its exploration target from the traditional confinement to the meridional system and the meridional area, realizing the economic exploitation of China’s marine shale oil and gas, and continental shale oil and gas [
3,
4,
5].
However, shale reservoirs are characterized by low porosity and low permeability, with almost no natural production capacity. To realize the economic development of shale gas resources, it is necessary to modify the reservoirs through volumetric fracturing to form effective flow channels [
6,
7,
8,
9,
10,
11,
12]. Based on hydraulic fracturing technology, the exploitation of marine shale gas has achieved significant success, and three major shale gas fields, including Fuling, Changning, and Weiyuan—in the Wufeng and Longmaxi Formations of the Sichuan Basin of China, which are particularly large marine shale gas-producing areas—have realized the industrialized exploitation of shale gas by using hydraulic fracturing technology [
13,
14,
15]. Compared with marine shale oil and gas reservoirs, continental shale oil and gas reservoirs are characterized by longitudinal lithological interlayers, high viscosity content, and relatively well-developed stratigraphic fractures, which indicates that the relevant technologies applied to marine shale gas development are not fully applicable to continental shale gas development [
16,
17,
18,
19,
20]. Therefore, it is particularly important to study the differences in fracture extension in hydraulic fracturing of marine and continental shales.
For a long time, scholars at home and abroad have carried out a lot of research on the physical and mechanical properties of shale rock, anisotropy, impact on well wall stability and seam formation effect, etc., to provide strong support for shale gas development [
21,
22,
23,
24,
25,
26,
27,
28]. Chong et al. [
29] first defined shale reservoir factorability as the nature of a shale’s ability to be effectively fractured to increase production. Mullen and Enderlin [
30] concluded that the factors affecting the compressibility of shale gas reservoirs mainly include sedimentary formations, stratigraphic properties, mineralogical composition and distribution, and the development of naturally weak surfaces. Geng et al. [
31] investigated the anisotropy of Longmaxi shale brittleness based on triaxial mechanical experiments and showed that the brittleness index is affected by the peripheral pressure and the angle of lamination. Xu et al. [
32] studied the longitudinal wave velocity and acoustic emission characteristics of Longmaxi Formation shale with different laminar inclinations during uniaxial compression, established the functional relationship between longitudinal wave velocity and strain, and compared the differences in the longitudinal wave velocity and acoustic emission characteristics of shale with different laminar inclinations. Mokhtari et al. [
33] showed that the permeability of shale can also exhibit anisotropic characteristics, influenced by the directional distribution of laminae and internal microfractures. Josh et al. [
34] analyzed the microfine view mechanism of anisotropy in layered shale by combining X-ray computed tomography (CT) and scanning electron micrography (SEM) techniques, and concluded that the anisotropic characteristics of shale are both intrinsic to its intrinsic properties and related to stress induction, where stress-induced anisotropy is dependent on the orientation of its internal microstructure with respect to the maximum principal stress.
The abovementioned studies have relatively limited analyses of the geometric characteristics of fractures after hydraulic fracturing, and there has been no assessment of the productivity enhancement effect of fracturing. In the past, the evaluation of the transformation effect on fracture networks was achieved by characterizing the complexity of the fracture network post-hydraulic fracturing. In the early stages, a method involved adding tracers to the fracturing fluid and sectioning specimens to observe the morphological distribution and connectivity of hydraulic fractures [
35]. However, this method could cause damage to rock samples, and the morphology of the fracture surfaces is relatively rough, allowing only for qualitative analysis. Moreover, obtaining a three-dimensional fracture network is particularly challenging. Acoustic emission serves as a non-destructive means to acquire information about fracture networks, but connecting discrete acoustic emission points to form accurate fractures is difficult [
36,
37,
38]. Nowadays, many researchers use CT scanning technology to obtain spatial geometric shapes of fractures and porosity in samples [
39,
40,
41]. However, due to limitations in sample size and the resolution of CT scanning, obtaining satisfactory results for large samples remains a challenge. Therefore, it is necessary to introduce a new quantitative characterization method to study the complexity of three-dimensional fracture networks.
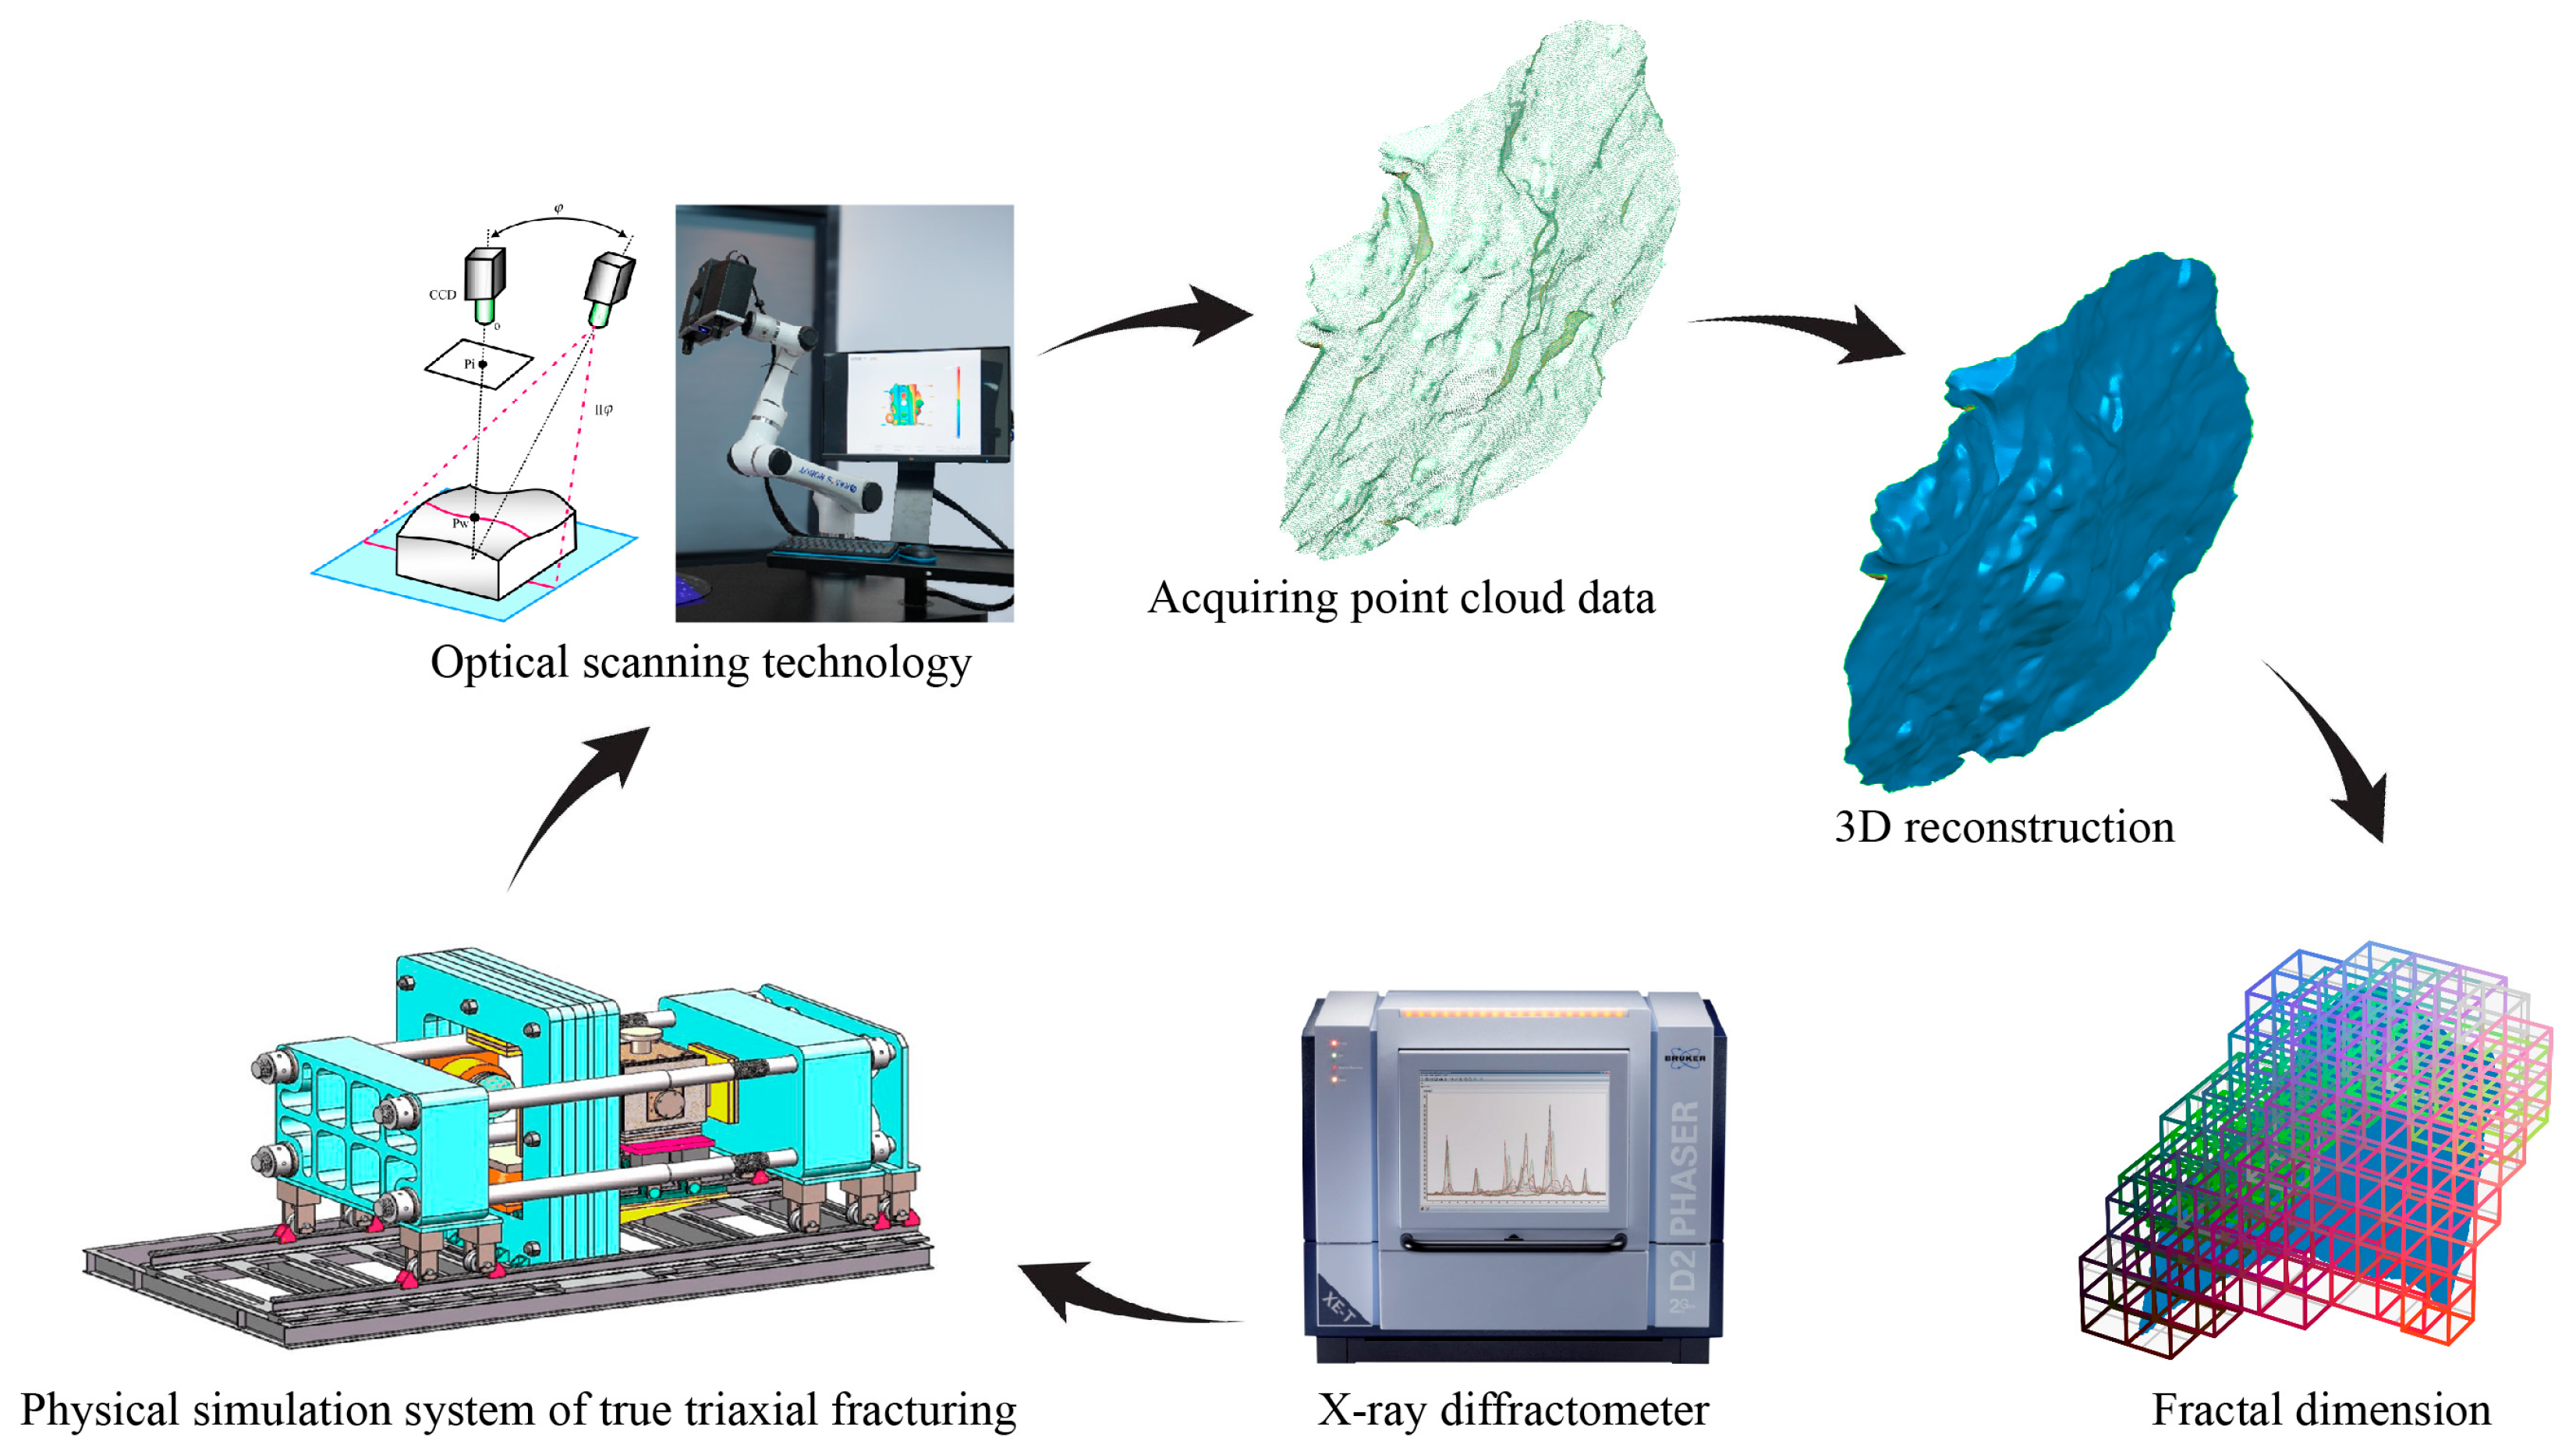
Therefore, this paper proposes a research method for studying the differential expansion of hydraulic fracturing fractures in marine and continental shales based on optical scanning technology (
Figure 1). Using typical marine shale (outcrop of the Longmaxi Formation, Lower Silurian, Sichuan Basin, China) and continental shale (outcrop of the Dongyue Temple Formation, Late Jurassic, Sichuan Basin, China) as research subjects, three-dimensional laser scanning was performed on the samples after hydraulic fracturing experiments. The introduction of fractal dimension was employed for the quantitative characterization of fracture complexity, allowing for an intuitive and quantitative description of the spatial morphology of fractures. This approach facilitates further detailed analysis and aims to provide a more precise model foundation for the quantitative characterization of hydraulic fracturing fracture surface geometry and numerical simulation of fracture surface permeability characteristics.
2. Characterization of Marine and Continental Shale Reservoirs
2.1. Analysis of Shale Mineral Fractions
In this study, the marine shale was sourced from outcrops of the Lower Silurian Longmaxi Formation in Sichuan Basin, China, with an average burial depth of 3000 m. It exhibits a dark coloration, high organic matter content, and a dense structure, contributing to its significant brittleness. On the other hand, the continental shale originated from outcrops of the Dongyue Temple Formation of the Middle Jurassic in the Sichuan Basin, China, with an average burial depth of 2840 m. Formed in a continental lake basin environment, it appears as deep gray to black–gray, featuring relatively lower organic matter content and a comparatively loose structure (
Figure 2). The shale is distinguishable by its nail-indentation capability and exhibits clear bedding structures. Considering the sedimentary and diagenetic environments, the marine shale experiences relatively weaker hydrodynamic conditions, resulting in a higher strength of mineral particle bonding. In contrast, continental shale, influenced by stronger hydrodynamic conditions, primarily undergoes mechanical compaction, leading to a noticeable decrease in the strength of mineral particle bonding compared with marine shale.
Mineral fractions of shale have an influence on its mechanical properties, seepage characteristics, and microscopic pore structure; our experiment used an Empyrean-type multifunctional high-resolution X-ray diffractometer to analyze the mineral fractions. The experimental results are shown below.
Through the analysis of the XRD test results of the marine shale rocks and the XRD test results of the continental shale rocks, it can be seen (as shown in
Figure 3) that the mineral fractions of the marine and continental shale rocks have obvious differences, which are mainly related to the depositional environment. The quartz content of Longmaxi Formation marine shale is 59.55%, calcite content is 4.9%, dolomite content is 64.04%, pyrite content is 0.89%, and the total content of clay minerals is 5.87%. The sample of continental shale from Dongyuemiao Formation has 32.56% quartz, 2.12% sodium feldspar, 13.12% calcite, 4.50% pyrite, 4.50% clay, and a total clay content of 47.70%.
Overall, the clay mineral content of continental shale is higher and the brittle mineral content is relatively low, while the brittle minerals such as quartz are absolutely dominant in marine shale.
2.2. Rock Mechanical Properties of Marine and Continental Shale Reservoirs
Shale develops laminations and natural cracks, which are typical of various anisotropic rocks. In the process of shale fracturing, the initiation and expansion of cracks are closely related to their own mechanical properties; so, it is necessary to determine the rock’s mechanical parameters. In this paper, the experimental samples were selected from the same regional outcrops as the samples used in the hydraulic fracturing experiments. Five sets of identical samples were selected for each mechanical parameter. The specimen was cored in the direction of the bedding surface. The parameters of rock mechanical strength, elastic modulus, and Poisson’s ratio were obtained through indoor rock mechanical experiments. The specific experimental results are summarized in
Table 1.
From the above table, it can be seen that the uniaxial compressive strength of the marine shale is in the range of 57.99–80.60 MPa, while the uniaxial strength of the continental shale is in the range of 30.51–46.23 MPa, which is lower than that of the marine shale by about 20.28–62.15%. After fracturing the specimens, the rupture form of marine shale after damage is relatively singular, which is reflected as a high-angle shear damage surface running through the specimen from top to bottom, showing good brittleness; the continental shale is dominated by localized fragmentation and slip and shear damage, with the intensive formation of numerous fine microcracks crushing next to the main crack, and the specimen fragmentation characteristics are obvious. Moreover, during the test, the marine shale had a crisp, short rupture sound when it reached the peak strength and was destroyed, while the continental shale showed a low muffled sound when it was destroyed, reflecting the difference in the brittleness of the rock. The tensile strength test results show that the tensile strength of marine and continental shales varies greatly, with the tensile strength of marine shale ranging from 15.92 to 18.63 MPa and that of continental shale ranging from 4.58 to 6.54 MPa. This is due to the anisotropy of shale mechanical properties; in order to ensure that the influencing factors are the same, all the shale specimens were subjected to the load in accordance with the direction of the laminae, and the Brazilian splitting experiments obtained indirect results. The tensile strength is essentially the tensile strength of the shale laminae. The fracture toughness results show that the marine shale is twice as strong as the continental shale.
3. Simulation of Fracturing and Fracture Initiation Mechanism in Marine and Continental Shales
Based on the physical simulation system of high-temperature true triaxial fracturing in deep rock, the effects of different parameters on the fracture initiation and extension patterns of marine and continental shales were investigated.
3.1. Experimental Equipment
The deep rock body, high-temperature, true triaxial fracturing physical simulation experiment system mainly consists of a stress loading system, fracturing fluid pumping system, servo pressure control system, and data acquisition system (
Figure 4). The three-way stress loading range is 0~60 MPa, the maximum output pump pressure is 85 MPa, and the displacement range is 0.01~17 mL/min.
3.2. Sample Preparation
In order to simulate the fracturing of shale gas horizontal wells, the simulated wellbores of all shale specimens were all parallel to the bedding plane, while the direction of the minimum ground stress was also parallel to the wellbore direction. In this paper, four blocks of each of the continental shale and the marine shale were selected; the samples were cored, cut, flat ground, and drilled according to the specifications; and the standard fracturing specimens with 100 mm ×100 mm × 100 mm drilled holes were ultimately prepared (
Figure 5).
3.3. Physical Parameter Measurement
When designing laboratory-scale hydraulic fracturing experiments, scaling laws must be adhered to in order to ensure that stable fracture extensions are representative of field conditions. Parks, D. M. [
42] derived a generalized scaling law for planar fracture extensions, which requires that specimens have low fracture toughness and permeability. The fracturing fluid displacements in the field ranged from 5 to 17 m
3/min, which were calculated by equations (after calculations based on the similarity criterion) and converted to 5–17 mL/min in the experiments with a fracturing fluid viscosity of 3 mPa·s. The triaxial stresses chosen for the experiment represent the effective in situ stresses of the actual formation, converted using similarity criteria. The test parameters are shown in
Table 2.
Experimental steps: (1) Place the rock samples in the core chamber and load the three-way stress according to the parameters set in
Table 2. (2) Turn on the pumping system; inject the fracturing fluid into the wellbore; record the change in wellhead pressure and, at the same time, turn on the acoustic emission monitoring system to monitor the number of internal impacts and impact location when the rock rupture occurs—the acoustic emission threshold value is 45 dB, the sampling frequency is 1 Mhz, and the gain of the preamplifier is set to 40 dB. (3) Stop the pump and turn off the data acquisition system when there is an obvious drop in wellhead pressure. (4) Scan the fracture morphology of the specimen after rupture using a high-precision 3D scanner. Geomagic Control software (Geomagic Control 2014.3.0: 64-bit version (2014.3.0.1787)) was used to reconstruct the specimen fracture surface in three dimensions, and the fracture fractal dimension was used to characterize the fracture spatial complexity.
4. Experimental Results
4.1. Shale Fracture Morphology
In this experiment, the effects of differential ground stress, fracturing fluid displacement, and hydration time on the expansion of seam height in marine and continental shales were considered. In order to present the fracture directions on six surfaces at the same time, the method of making specimen crease diagrams was used, as shown in
Figure 6. A comparison of shale fracture morphology under different fracturing conditions is shown in
Figure 7.
As can be seen from
Figure 7, the complexity of hydraulic fractures formed by fracturing in marine shale is significantly greater than that of hydraulic fracturing fractures in continental shale. This is because the brittle minerals in marine shale are predominant, which contribute to the expansion of fractures and the generation of complex fracture networks during the fracturing process, while the clay minerals in continental shale are predominant, which are more likely to form a single fracture.
The S-2 fracture morphology of marine shale shows that under low-displacement fracturing, after hydraulic fractures start from the bottom of the well, they are captured by the laminar facies near the wellbore, and the hydraulic fractures are unable to traverse the laminar facies, with a single fracture morphology. S-3 shows that the fracture morphology of marine shale is more complex after the use of hydrochemicals. The S-4 fracture morphology shows that under the case of a large stress difference, the specimen is prone to form a single longitudinal main fracture through the laminar facies.
The natural laminar joints of continental shale are extremely developed, and the hydraulic fractures are easily captured by the laminae. Y-2 and Y-3 show that, with the use of small-displacement fracturing and fracturing after hydration, a large amount of fracturing fluid percolates into the laminar joints, and the hydraulic fractures are dominated by laminar joints. From the fracture morphology on the surface of the specimens after fracturing in S-1 and S-4, it can be seen that the stress difference has a significant effect on the extension morphology of hydraulic fractures in continental shale; under the condition of stress difference of 5 MPa, the hydraulic fracture is unable to traverse the laminar joints and is captured by laminae at the near wellbore, and the fracture morphology is relatively homogeneous. When the stress difference increases to 10 MPa, the hydraulic fracture turns when it extends vertically to the weak surface of the laminae, and then extends along the laminae through the specimen, with a higher fracture complexity.
4.2. Characterization of Fracture Curves and Analysis of Fracture Expansion Patterns
According to the pump pressure curve (
Figure 8), the whole hydraulic fracturing process can be divided into three stages: (1) wellbore filling zone—the fracturing fluid enters the rock specimen along the wellbore, and the pressure rises slowly at this time due to the fact that the wellbore itself occupies a certain space in the initial stage; (2) pressure-holding zone—as the fracturing fluid fills up the wellbore, the pump pressure rises rapidly, and the fracture starts inside the rock when the injected pressure reaches the rupture strength of the rock; (3) post-slit zone—after the formation of a penetrating fracture inside the rock and complete cracks, the pump pressure decreases drastically and basically stabilizes at the minimum ground stress.
As can be seen from
Figure 8 and
Figure 9, the average fracture starting pressure of the four marine shale specimens is 19.45 MPa, the pumping curve pattern is basically the same, and the post-peak pressure all shows an obvious drop. According to the comparison between S-1 and S-2, the fracturing pressure increased when using large displacement and the total fluid injection volume was lower. From the morphological results, it can be seen that with large displacement fracturing, the fracture is able to penetrate through all the laminae and activate the adjacent laminae; with small displacement fracturing, due to the lower pressure fluid energy at the initial stage, it is easier for the fracturing fluid to activate the laminae connected with the wellbore and form a dominant seam; and with the increase in fracturing fluid energy, the fracture cannot break through the laminae and finally form a laminar seam. Comparing S-1 with S-3, it can be seen that by 2 h after soaking the specimen, the fracture pressure of the marine shale will be increased. Comparing S-1 with S-3, the fracturing pressure of the specimen is reduced after soaking for 2 h and the fracture morphology is more complicated. S-1 and S-4 can be obtained. With fracturing under the condition of large stress difference, the specimen is more likely to form a main fracture without activating a laminar fracture and the fracture morphology is more homogeneous.
Due to the more developed laminar joints, the average fracture initiation pressure of continental shale is 17.875 MPa, which is 8% lower than that of marine shale. The pumping pressure curve of continental shale appears to be maintained at a high-pressure state, and the pumping pressure only decreases significantly after stopping pumping. After profiling the specimens, it was found that hydraulic fractures were mostly activated laminar joints, and it was more difficult to form the main fracture through the laminae.
From the analysis of Y-1, Y-2, and Y-4, it can be seen that under the condition of a small stress difference, increasing the fracturing fluid displacement can effectively increase the fracture complexity of continental shale. For continental shale Y-3 using hydration for 2 h, the fracture pressure decreases significantly but the fracture complexity does not change significantly, which is due to the higher clay mineral content of continental shale; the water-sensitive effect is larger; and it is easier to shear damage along the laminar joints. Therefore, it is necessary to reduce the rupture pressure during the fracturing process of continental shale oil and gas by using the smothering strategy.
5. Characterization of Cracked Surfaces Based on 3D Morphology Scanning
5.1. Fractal Dimension Calculation Method
Fractal theory can quantitatively characterize the complexity and distribution of irregular geometric surfaces and is widely used to characterize the inhomogeneity of rock fracture surfaces. In this section, based on the fractal principle, the original image of 3D topographic scanning results is covered by a certain number of meshes (
Figure 10), and the fractal dimension is calculated based on the counting box dimension method, as shown in the following equations:
where is the number of boxes required to cover the entire 3D crack image,
is the length of the box edges, and
is the fractal dimension of the 3D crack image.
where
is the intercept of the linear fit.
The fractal dimension can be determined from the slope obtained from the linear fit.
The following specific operation process is shown in
Figure 11: (1) The program code reads the point cloud file of the crack surface after laser scanning; if the crack surface point cloud file is read successfully, a prompt will appear in the program interface. (2) The point cloud file is plotted as a 3D point cloud map, and the shape and size of the cloud map are observed in real-time and checked to see if they are correct. (3) The specific location that can be covered by the 3D box-counting method is determined by manual modification. (4) After processing of the 3D box-counting algorithm, the specific shape of the square box is obtained each time after it is covered; then, the length of the square side and the number of boxes are outputted. The potential source of error in this method lies in the empirical calibration of spatial relationships when multiple fracture surfaces are stitched together to form a cohesive whole. Therefore, it is essential to place reference points at the junctions of fracture merging to minimize inaccuracies.
5.2. Fractal Dimension of Shale Fracture Surfaces
Figure 12 shows the fractal dimensions of the hydraulic fracture surfaces of marine and continental shales, and the double logarithm of the box edge length and the number of boxes have a good linear relationship with correlation coefficients greater than 0.99, indicating that the distribution of shale hydraulic fracture surfaces based on the 3D morphology scanning images has good fractal characteristics.
According to fractal theory, the size of the fractal dimension responds to the complexity of the hydraulic fracture surface structure of the rock. The fractal dimension of S-1~S-4 of marine shale ranges from 1.98344 to 2.62865, with an average value of 2.24397, and that of Y-1~Y-4 of continental shale ranges from 1.93041 to 2.33058, with an average value of 2.087065. The fractal dimensions of 3D fracture surfaces of marine shale are higher than those of continental shale, which indicates that the roughness of the fracture in marine shale is greater and the hydraulic fracture structure is more complex.
6. Discussion
In this section, we will delve into the analysis of significant differences in the fracture morphology and mineral composition between marine shale and continental shale, and dissect how these variations may impact geological properties and hydraulic fracturing. We employed advanced QEMSCAN technology, which offers high-resolution determination of mineral composition, providing detailed insights into the microscopic structure of both rock types (
Figure 13).
Through QEMSCAN analysis, we observed that continental shale exhibits a lower quartz content compared with marine shale. This finding aligns with our understanding of the geological background, as continental environments are typically associated with freshwater lakes and river deposits, differing in sedimentary material from marine environments. Marine environments often feature more silicate precipitation, contributing to the formation of quartz-rich rocks. This discovery provides preliminary clues for understanding the behavior of these two types of shale in hydraulic fracturing.
The lower quartz content in continental shale may result in reduced overall rock brittleness. Brittleness refers to a rock’s ability to fracture under external forces, and lower quartz content generally indicates relatively lower brittleness. Simultaneously, we observed a higher occurrence of bedding planes or laminations in continental shale. With lower overall rock brittleness, fractures are more likely to develop along bedding planes, forming laminated fractures. This can significantly influence the spatial distribution and orientation of the fracture network.
Marine shale, on the other hand, exhibits a more complex fracture morphology. This difference can be attributed to the higher quartz content in marine shale, as quartz is a brittle mineral, and its presence may lead to more intricate fracture patterns. The elevated quartz content constrains the development of fractures, resulting in a greater prevalence of intersecting, twisting, and branching fractures. This has important implications for predicting oil and gas migration paths and designing hydraulic fracturing operations.
In conclusion, our study, utilizing QEMSCAN technology, comprehensively analyzed the disparities between marine and continental shale, focusing on their mineral composition and fracture morphology. These findings not only enhance our understanding of the geological characteristics of these shale types but also provide substantive references for the exploration and development of shale oil and gas resources. We anticipate that these research results will offer valuable insights for future studies and exploration efforts, facilitating more effective resource development in the oil and gas industry.
7. Conclusions
Based on indoor hydraulic fracturing simulation experiments and three-dimensional optical scanning, this paper comparatively analyzes the characteristic differences in mineral composition, spatial morphology of hydraulic fractures, fracture area, and roughness parameters between marine and continental shales. The main conclusions are as follows:
Marine shale of the Longmaxi Formation is predominantly composed of brittle minerals such as quartz, accounting for approximately 74.92%, while continental shale of the Dongyue Temple Formation has a higher clay mineral content, reaching 47.7%, with a relatively lower proportion of brittle minerals.
During hydraulic fracturing, the average initiation pressure for marine shale is 19.45 MPa, whereas for continental shale it is 17.875 MPa, which is 8% lower than marine shale. Additionally, marine shale exhibits overall brittleness, leading to more complex hydraulic fractures, whereas continental shale, due to the development of bedding planes, tends to initiate fractures more easily along these planes, resulting in a more uniform fracture morphology.
The average three-dimensional fractal dimension of hydraulic fracture surfaces in marine shale is 2.24397, while in continental shale it is 2.087065. The average complexity of hydraulic fractures in marine shale is 7.52% higher than that of continental shale, indicating greater roughness in marine shale fractures and a more complex structure of hydraulic fractures.
Author Contributions
X.W.: conceptualization, data curation, formal analysis, validation, writing—original draft, and funding acquisition. X.C.: methodology, data curation, formal analysis, validation, writing—original draft, and writing—review and editing. Y.J.: methodology, resources, supervision, and validation. Y.G.: resources, supervision, and validation. K.W.: data curation, funding acquisition, and investigation. All authors have read and agreed to the published version of the manuscript.
Funding
This study was financially supported by the National Natural Science Foundation of China (No. 52104046, No. 52174017).
Institutional Review Board Statement
Not applicable.
Informed Consent Statement
Not applicable.
Data Availability Statement
The data that support the findings of this study are available on request from the corresponding author (
[email protected]). The data are not publicly available due to private concerns.
Conflicts of Interest
Author Yun Jiang was employed by Research Institute of Petroleum Exploration & Development, PetroChina. The remaining authors declare that the research was conducted in the absence of any commercial or financial relation-ships that could be construed as a potential conflict of interest.
References
- Li, Y.; Wang, Z.; Pan, Z.; Niu, X.; Yu, Y.; Meng, S. Pore Structure and Its Fractal Dimensions of Transitional Shale: A Cross-Section from East Margin of the Ordos Basin, China. Fuel 2019, 241, 417–431. [Google Scholar] [CrossRef]
- Barth, J.M. The Economic Impact of Shale Gas Development on State and Local Economies: Benefits, Costs, and Uncertainties. New Solut. 2013, 23, 85–101. [Google Scholar] [CrossRef]
- Ougier-Simonin, A.; Renard, F.; Boehm, C.; Vidal-Gilbert, S. Microfracturing and Microporosity in Shales. Earth-Sci. Rev. 2016, 162, 198–226. [Google Scholar] [CrossRef]
- Zou, C.; Zhu, R.; Chen, Z.Q.; Ogg, J.G.; Wu, S.; Dong, D.; Qiu, Z.; Wang, Y.; Wang, L.; Lin, S.; et al. Organic-Matter-Rich Shales of China. Earth-Sci. Rev. 2019, 189, 51–78. [Google Scholar] [CrossRef]
- Katz, B.J.; Arango, I. Organic Porosity: A Geochemist’s View of the Current State of Understanding. Org. Geochem. 2018, 123, 1–16. [Google Scholar] [CrossRef]
- Zhang, R.; Hou, B.; Han, H.; Fan, M.; Chen, M. Experimental Investigation on Fracture Morphology in Laminated Shale Formation by Hydraulic Fracturing. J. Pet. Sci. Eng. 2019, 177, 442–451. [Google Scholar] [CrossRef]
- Tan, P.; Jin, Y.; Han, K.; Hou, B.; Guo, X.; Gao, J.; Wang, T. Analysis of Hydraulic Fracture Initiation and Vertical Propagation Behavior in Laminated Shale Formation. Fuel 2017, 206, 482–493. [Google Scholar] [CrossRef]
- Guo, W.; Shen, W.; Li, X.; Wang, N.; Liu, X.; Zhang, X.; Zhou, S. Study on Mechanical Characteristics and Damage Mechanism of the Longmaxi Formation Shale in Southern Sichuan Basin, China. Energy Explor. Exploit. 2020, 38, 454–472. [Google Scholar] [CrossRef]
- Han, L.; Li, X.; Liu, Z.; Guo, W.; Cui, Y.; Qian, C.; Huang, Y. Study on Rock Mechanics Characteristics of Deep Shale in Luzhou Block and the Influence on Reservoir Fracturing. Energy Sci. Eng. 2023, 11, 4–21. [Google Scholar] [CrossRef]
- Detournay, E. Slickwater Hydraulic Fracturing of Shales. J. Fluid Mech. 2020, 886, 3–6. [Google Scholar] [CrossRef]
- Tang, H.; Li, S.; Zhang, D. The Effect of Heterogeneity on Hydraulic Fracturing in Shale. J. Pet. Sci. Eng. 2018, 162, 292–308. [Google Scholar] [CrossRef]
- Engelder, T.; Cathles, L.M.; Bryndzia, L.T. The Fate of Residual Treatment Water in Gas Shale. J. Unconv. Oil Gas Resour. 2014, 7, 33–48. [Google Scholar] [CrossRef]
- Haikuan, N.; Zhang, J. Types and Characteristics of Shale Gas Reservoir: A Case Study of Lower Paleozoic in and around Sichuan Basin. Pet. Geol. Exp. 2011, 33, 219–225. [Google Scholar]
- Xiaojin, Z.; Yonggang, D.; Xiaoping, H.; Bo, Z.; Yi, S. Study on Postfrac Softening Mechanism of Deep Marine Shale Reservoir in South Sichuan Basin. Geofluids 2023, 2023, 4433439. [Google Scholar] [CrossRef]
- Wang, L.; Bi, Z.; Zeng, Y.; Yang, G.; Guo, Y.; Yang, H. Experimental Investigation on the Crack Evolution of Marine Shale with Different Soaking Fluids. Front. Earth Sci. 2021, 9, 759538. [Google Scholar] [CrossRef]
- Zhang, Z.; Zhong, A.; Yang, F.; Zhang, L.; Lu, M.; Chai, L.; Li, L. Experimental Study on the Hydraulic Fracture Propagation of Laminar Argillaceous Limestone Continental Shale. Front. Earth Sci. 2023, 11, 1193205. [Google Scholar] [CrossRef]
- Wang, X.; Chen, J.; Ren, D.; Zhu, J. Role of Natural Fractures with Topology Structure for Hydraulic Fracture Propagation in Continental Shale Reservoir. Eng. Fract. Mech. 2023, 284, 109237. [Google Scholar] [CrossRef]
- Zhao, Z.; Li, X.; Wang, Y.; Zheng, B.; Zhang, B. A Laboratory Study of the Effects of Interbeds on Hydraulic Fracture Propagation in Shale Formation. Energies 2016, 9, 556. [Google Scholar] [CrossRef]
- Zou, Y.; Zhang, S.; Ma, X.; Zhang, X.; Zhang, S. Hydraulic Fracture Morphology and Conductivity of Continental Shale under the True-Triaxial Stress Conditions. Fuel 2023, 352, 129056. [Google Scholar] [CrossRef]
- Zhao, J.; Zhang, D. Dynamic Microscale Crack Propagation in Shale. Eng. Fract. Mech. 2020, 228, 106906. [Google Scholar] [CrossRef]
- Dunham, R.J. Classification of Carbonate Rocks according to Depositional Texture1. Classic. Carbonate Rocks—A Symp. 1962, 1, 108–121. [Google Scholar]
- Chandler, M.R.; Meredith, P.G.; Brantut, N.; Crawford, B.R.; Sciences, E.; Urc, E. Journal of Geophysical Research: Solid Earth Fracture Toughness Anisotropy in Shale. J. Geophys. Res. Solid Earth 2016, 121, 1706–1729. [Google Scholar] [CrossRef]
- Yang, Z.; Wang, X.; Ge, H.; Zhu, J.; Wen, Y. Study on Evaluation Method of Fracture Forming Ability of Shale Oil Reservoirs in Fengcheng Formation, Mahu Sag. J. Pet. Sci. Eng. 2022, 215, 110576. [Google Scholar] [CrossRef]
- Wang, L.; Guo, Y.; Zhou, X.; Yang, G.; Yang, C.; Xiao, J. Mechanical Properties of Marine Shale and Its Roof and Floor Considering Reservoir Preservation and Stimulation. J. Pet. Sci. Eng. 2022, 211, 110194. [Google Scholar] [CrossRef]
- Liu, T.; Liu, H.; Meng, Y.; Han, X.; Cui, S.; Yu, A. Multi-Coupling Stress Field and Evaluation of Borehole Stability in Deep Brittle Shale. Arab. J. Geosci. 2020, 13, 1156. [Google Scholar] [CrossRef]
- Qianli, L.; Zhuang, L.; Jianchun, G.; Longqing, Z.; Le, H.; Lei, C. Numerical Investigation of Fracture Interference Effects on Multi-Fractures Propagation in Fractured Shale. Eng. Fract. Mech. 2023, 286, 109322. [Google Scholar] [CrossRef]
- Guo, W.; Guo, Y.; Yang, C.; Wang, L.; Chang, X.; Yang, H.; Bi, Z. Experimental Investigation on the Effects of Heating-Cooling Cycles on the Physical and Mechanical Properties of Shale. J. Nat. Gas Sci. Eng. 2022, 97, 104377. [Google Scholar] [CrossRef]
- Xiong, J.; Liu, K.; Liang, L.; Liu, X.; Zhang, C. Investigation of Influence Factors of the Fracture Toughness of Shale: A Case Study of the Longmaxi Formation Shale in Sichuan Basin, China. Geotech. Geol. Eng. 2019, 37, 2927–2934. [Google Scholar] [CrossRef]
- Chong, K.K.; Grieser, W.V.; Passman, A.; Tamayo, C.H.; Modeland, N.; Burke, B. A Completions Guide Book to Shale-Play Development: A Review of Successful Approaches towards Shale-Play Stimulation in the Last Two Decades. Soc. Pet. Eng.—Can. Unconv. Resour. Int. Pet. Conf. 2010, 1, 68–94. [Google Scholar] [CrossRef]
- Mullen, M.; Christia, T. SPE 1597 Fracabilit Ty Index—More Th Han Just Calculati Ing Rock k Properti Ies. In Proceedings of the SPE Annual Technical Conference & Exhibition, San Antonio, TX, USA, 8–10 October 2012. [Google Scholar]
- Geng, Z.; Chen, M.; Jin, Y.; Yang, S.; Yi, Z.; Fang, X.; Du, X. Experimental Study of Brittleness Anisotropy of Shale in Triaxial Compression. J. Nat. Gas Sci. Eng. 2016, 36, 510–518. [Google Scholar] [CrossRef]
- Xu, F.; Yang, C.; Guo, Y.; Wang, L.; Hou, Z.; Li, H.; Hu, X.; Wang, T. Effect of Bedding Planes on Wave Velocity and AE Characteristics of the Longmaxi Shale in China. Arab. J. Geosci. 2017, 10, 141. [Google Scholar] [CrossRef]
- Mokhtari, M.; Tutuncu, A.N. Characterization of Anisotropy in the Permeability of Organic-Rich Shales. J. Pet. Sci. Eng. 2015, 133, 496–506. [Google Scholar] [CrossRef]
- Josh, M.; Esteban, L.; Piane, C.D.; Sarout, J.; Dewhurst, D.N.; Clennell, M.B. Laboratory Characterisation of Shale Properties. J. Pet. Sci. Eng. 2012, 88–89, 107–124. [Google Scholar] [CrossRef]
- Bohloli, B.; de Pater, C.J. Experimental Study on Hydraulic Fracturing of Soft Rocks: Influence of Fluid Rheology and Confining Stress. J. Pet. Sci. Eng. 2006, 53, 1–12. [Google Scholar] [CrossRef]
- Hampton, J.; Gutierrez, M.; Matzar, L.; Hu, D.; Frash, L. Acoustic Emission Characterization of Microcracking in Laboratory-Scale Hydraulic Fracturing Tests. J. Rock Mech. Geotech. Eng. 2018, 10, 805–817. [Google Scholar] [CrossRef]
- Stewart, L.; Cassell, B.R.; Bol, G.M. Acoustic-Emission Monitoring during Hydraulic Fracturing. SPE Form. Eval. 1992, 7, 139–144. [Google Scholar] [CrossRef]
- Stanchits, S.; Burghardt, J.; Surdi, A. Hydraulic Fracturing of Heterogeneous Rock Monitored by Acoustic Emission. Rock Mech. Rock Eng. 2015, 48, 2513–2527. [Google Scholar] [CrossRef]
- Karpyn, Z.T.; Alajmi, A.; Radaelli, F.; Halleck, P.M.; Grader, A.S. X-ray CT and Hydraulic Evidence for a Relationship between Fracture Conductivity and Adjacent Matrix Porosity. Eng. Geol. 2009, 103, 139–145. [Google Scholar] [CrossRef]
- Kumari, W.G.P.; Ranjith, P.G.; Perera, M.S.A.; Li, X.; Li, L.H.; Chen, B.K.; Isaka, B.L.A.; De Silva, V.R.S. Hydraulic Fracturing under High Temperature and Pressure Conditions with Micro CT Applications: Geothermal Energy from Hot Dry Rocks. Fuel 2018, 230, 138–154. [Google Scholar] [CrossRef]
- Li, S.; Liu, L.; Chai, P.; Li, X.; He, J.; Zhang, Z.; Wei, L. Imaging Hydraulic Fractures of Shale Cores Using Combined Positron Emission Tomography and Computed Tomography (PET-CT) Imaging Technique. J. Pet. Sci. Eng. 2019, 182, 106283. [Google Scholar] [CrossRef]
- Parks, D.M. The Virtual Crack Extension Method for Nonlinear Material Behavior. Comput. Methods Appl. Mech. Eng. 1977, 12, 353–364. [Google Scholar] [CrossRef]
| Disclaimer/Publisher’s Note: The statements, opinions, and data contained in all publications are solely those of the individual author(s) and contributor(s) and not of MDPI and/or the editor(s). MDPI and/or the editor(s) disclaim responsibility for any injury to people or property resulting from any ideas, methods, instructions, or products referred to in the content. |
| Disclaimer/Publisher’s Note: The statements, opinions and data contained in all publications are solely those of the individual author(s) and contributor(s) and not of MDPI and/or the editor(s). MDPI and/or the editor(s) disclaim responsibility for any injury to people or property resulting from any ideas, methods, instructions or products referred to in the content. |
© 2023 by the authors. Licensee MDPI, Basel, Switzerland. This article is an open access article distributed under the terms and conditions of the Creative Commons Attribution (CC BY) license (https://creativecommons.org/licenses/by/4.0/).


