Article

Finite Element Model of Scoliosis Brace with Increased Utility Characteristics

1
Institute of Biomedical Engineering, Doctoral School of Bialystok University of Technology, Wiejska 45A, 15-351 Bialystok, Poland
2
Institute of Biomedical Engineering, Faculty of Mechanical Engineering, Bialystok University of Technology, Wiejska 45C, 15-351 Bialystok, Poland
*
Author to whom correspondence should be addressed.
Appl. Sci. 2023, 13(24), 13273; https://doi.org/10.3390/app132413273
Submission received: 13 October 2023 / Revised: 12 November 2023 / Accepted: 13 December 2023 / Published: 15 December 2023

Abstract

:
Orthoses are of critical importance in the field of medical biomechanics, particularly in the correction of spinal deformities. The objective of the current research was to improve the utility characteristics of the scoliosis brace without compromising its corrective capabilities. The orthotic shell of the Boston brace was used as the basis for this investigation. The finite element method (FEM) was used to evaluate the distribution of corrective forces through the device. The flow of force lines within the orthotic shell was determined by mapping the paths of maximum principal stresses. Areas of the device that had a negligible effect on overall stiffness were identified and material from these areas was eliminated. Minor modifications were then made to the redesigned shell to maintain its corrective stiffness. As a result of these changes, the weight of the braces was reduced without compromising its corrective stiffness. When subjected to corrective forces, the shell’s displacement patterns in the transverse plane showed minimal changes from the original model, confirming that its corrective capacity remained largely intact. This research presents an innovative methodology for orthotic design and demonstrates that structural optimization based on the mapping of maximum principal stress pathways can significantly improve device functionality. The approach outlined here holds promise for future advances in the design of various orthotic devices, thereby contributing to the advancement of the field.

1. Introduction

Idiopathic scoliosis is a complex, three-dimensional deformity of the spine and trunk that affects 1–3% of children, primarily between the ages of 10 and 16. For those with a Cobb angle of 20 to 40 degrees and who are still growing, the standard of care is a custom-made corrective brace used in conjunction with specialized physical therapy [1]. This brace, essentially a trunk brace or corset, is made of thermoplastic materials. The primary goal of such a brace is to halt the progression of spinal curvature while promoting thoracic and trunk symmetry. Typically, the brace is worn until the patient reaches skeletal maturity [2].
Conventional Boston or Cheneau braces designed for the treatment of idiopathic scoliosis have an outer shell that envelops a large portion of the trunk, tailored to the specific type of scoliosis being treated. The shell, typically made of a 4 mm thick polypropylene sheet, is a rigid structure that is custom-fitted to the patient’s torso. This rigid shell has several holes to facilitate checking the pressure exerted on the torso using internal corrective pads. These pads are strategically positioned inside the brace to align with the apex of the spinal curves. Given the complex design of standard braces, it is challenging to determine the specific areas of the shell that are responsible for the corrective action. This requires an understanding of how the rigid shell, tensioned by straps, effectively transfers loads to the internal pads. The focus of the current research builds on previously published work [3] to further elucidate the operational mechanics of a Boston brace shell with proven therapeutic efficacy.
The design intricacies of the orthosis have a significant impact on its utility characteristics. Factors such as heat and gas exchange between the body and the surrounding air through the brace, as well as the weight of the device, can adversely affect patient comfort and compliance [4]. Therefore, the goal of this work is to optimize brace design to use less material while maintaining corrective stiffness, which requires a comprehensive understanding of how corrective forces are distributed through the shell. An additional goal is to improve other important functional parameters of the corset including the patient’s thermal comfort level, the level of gas exchange at the interface between the torso and the inner surface of the corset shell, and the degree of discretion in the use of the orthosis, related to its geometric size and shape.
Finite element modeling (FEM) provides a tool for detailed stress analysis, although few studies have rigorously validated their simulations with empirical data [5,6,7]. Grycuk and Mrozek recently presented an FEM model of the Boston brace that was experimentally verified using electronic speckle pattern interferometry (ESPI) [3]. The ESPI system evaluated surface displacements of the brace under a three-point loading scheme that mimicked corrective forces. The minimal discrepancies between the experimental and FEM results indicated a high level of accuracy in the FEM model [3].
The current study proposes an optimization strategy for brace design using numerical modeling through a previously validated FEM model [3] and a methodology centered on the concept of force flow lines. The result is a brace that maintains its corrective stiffness while significantly reducing its weight, thereby improving patient comfort and compliance, which in turn should improve clinical outcomes. This methodology can be extended to other thoracic–lumbar–sacral orthosis (TLSO) designs.

2. Materials and Methods

2.1. Boston Spinal Bracing System

Designed for the non-invasive treatment of scoliosis, the Boston Spinal Bracing System is particularly effective for spinal curves with apexes between the sixth thoracic and third lumbar vertebrae. Uniquely, the top of this brace is designed to be flexible and sit under the patient’s armpits to provide stability and minimize movement [2,8]. The current research focuses on a Boston brace tailored to treat a leftward curve in the lumbar spine. The shell of this brace was fabricated from a 4 mm thick polypropylene sheet, and the authors focus solely on the analysis of this shell.
The corset in the variant used to treat double curvatures (left lumbar and right thoracic) was chosen for the study because it is the most advanced geometric design among the variants of the Boston system. This variant of the corset can be the subject of the authors’ next work, with a consideration of more applied loads, especially for trochanteric extension and for axillary extension, similar to more complicated designs such as the Cheneau brace, which uses a multipoint system of corrective forces. In this work, the brace uses a simpler three-point force mechanism [9] for a case of left lumbar scoliosis. The variant of corrective forces used can also be effective for additional low right thoracic scoliosis, despite the lack of force applied to the axillary extension. This arrangement of forces corresponds to the Boston Thoraco-Lumbar Brace variant, according to the reference manual. No force was also applied to the trochanteric extension due to the mainly auxiliary, stabilizing role of this part of the corset. The three applied forces are crucial in the correction of the lumbar curvature, while the other parts of the corset have an auxiliary function. The three-force design is a statically determinable system that allows the distribution of forces to be unambiguously determined in both experimental studies and numerical analyses.
Two forces, labeled F1 and R1, exert pressure on the ribs to influence the spine, while a third force, R2, acts on the pelvis (Figure 1). Force F1 serves as the primary corrective element, while forces R1 and R2 provide counterbalancing support.
The goal of this study is to refine orthosis design to improve utility while maintaining the distribution of corrective forces after optimization. This requires maintaining a consistent pressure distribution across the patient’s torso. Although the model used in this study assumes point loads, it is recognized that in real-world applications, these forces would be distributed across the surface of the corrective pads, all while maintaining pressure within safe limits. It is worth noting that modeling brace pressure on the torso is a complex subject that has been the focus of extensive previous research [1,5,6]. However, the primary goal of this research is to optimize the structural and utility aspects of the brace shell, rather than to simulate the pressure exerted by the brace on the torso.

2.2. Modeling Using Finite Element Method

In the current research, the parameters for a brace model were established and a computational model based on the finite element method (FEM) was developed by generating a finite element (FE) mesh. To match the conditions of a previous study [3], this model was configured to replicate the experimental tests, using the same triad of forces through supports R1 and R2, along with a preload force, F1. Two fixed supports were established, and an initial load of 36 N was applied, which is within the range of forces observed in actual braces. This preload was essential to stabilize the position of the brace on the test stand used in previous research [3]. In addition, the gravitational force, G, was included in the model for a more complete representation [10].
An additional F2 force of 0.1 N was then introduced to match the conditions of experimental tests using an Electronic speckle pattern interferometer (ESPI) system [3]. This optical interferometry system measured displacements along the Z axis of the computer model. The introduction of this smaller force was strategically planned to allow the measurement of small displacements within the interferometer’s range while maintaining the linear elastic range of the material. The final simulation output, which calculated the shell displacement differences before and after the introduction of force F2, was then processed for further investigation.
Polypropylene was selected as the shell material for the orthosis because of its known durability and flexibility. It has a Young’s modulus (E) of 1500 MPa and a Poisson’s ratio (v) of 0.3, making it well suited to achieving the desired balance between stiffness and flexibility in an orthosis [11,12].
A 10-node tetrahedral element was used to construct the FEM model. This element type is particularly advantageous for accurately representing complex 3D geometries and provides excellent numerical performance for simulating the elastic behavior of materials such as polypropylene.
An iterative process of mesh refinement was performed until the von Mises stress variation was less than 5% with increasing node density [3]. The final mesh contained 470,978 nodes and 265,348 finite elements with a maximum edge size of 8 mm.
In addition to determining the distribution of von Mises stresses, the study also identified the field of principal stresses in the orthotic shell, represented graphically by a system of vectors for each shell element. The dense array of principal stress vectors allowed for the subsequent plotting of principal stress trajectories in key areas of the orthotic shell. These trajectories were then used to guide structural modifications aimed at improving the functional properties of the orthosis.

3. Results

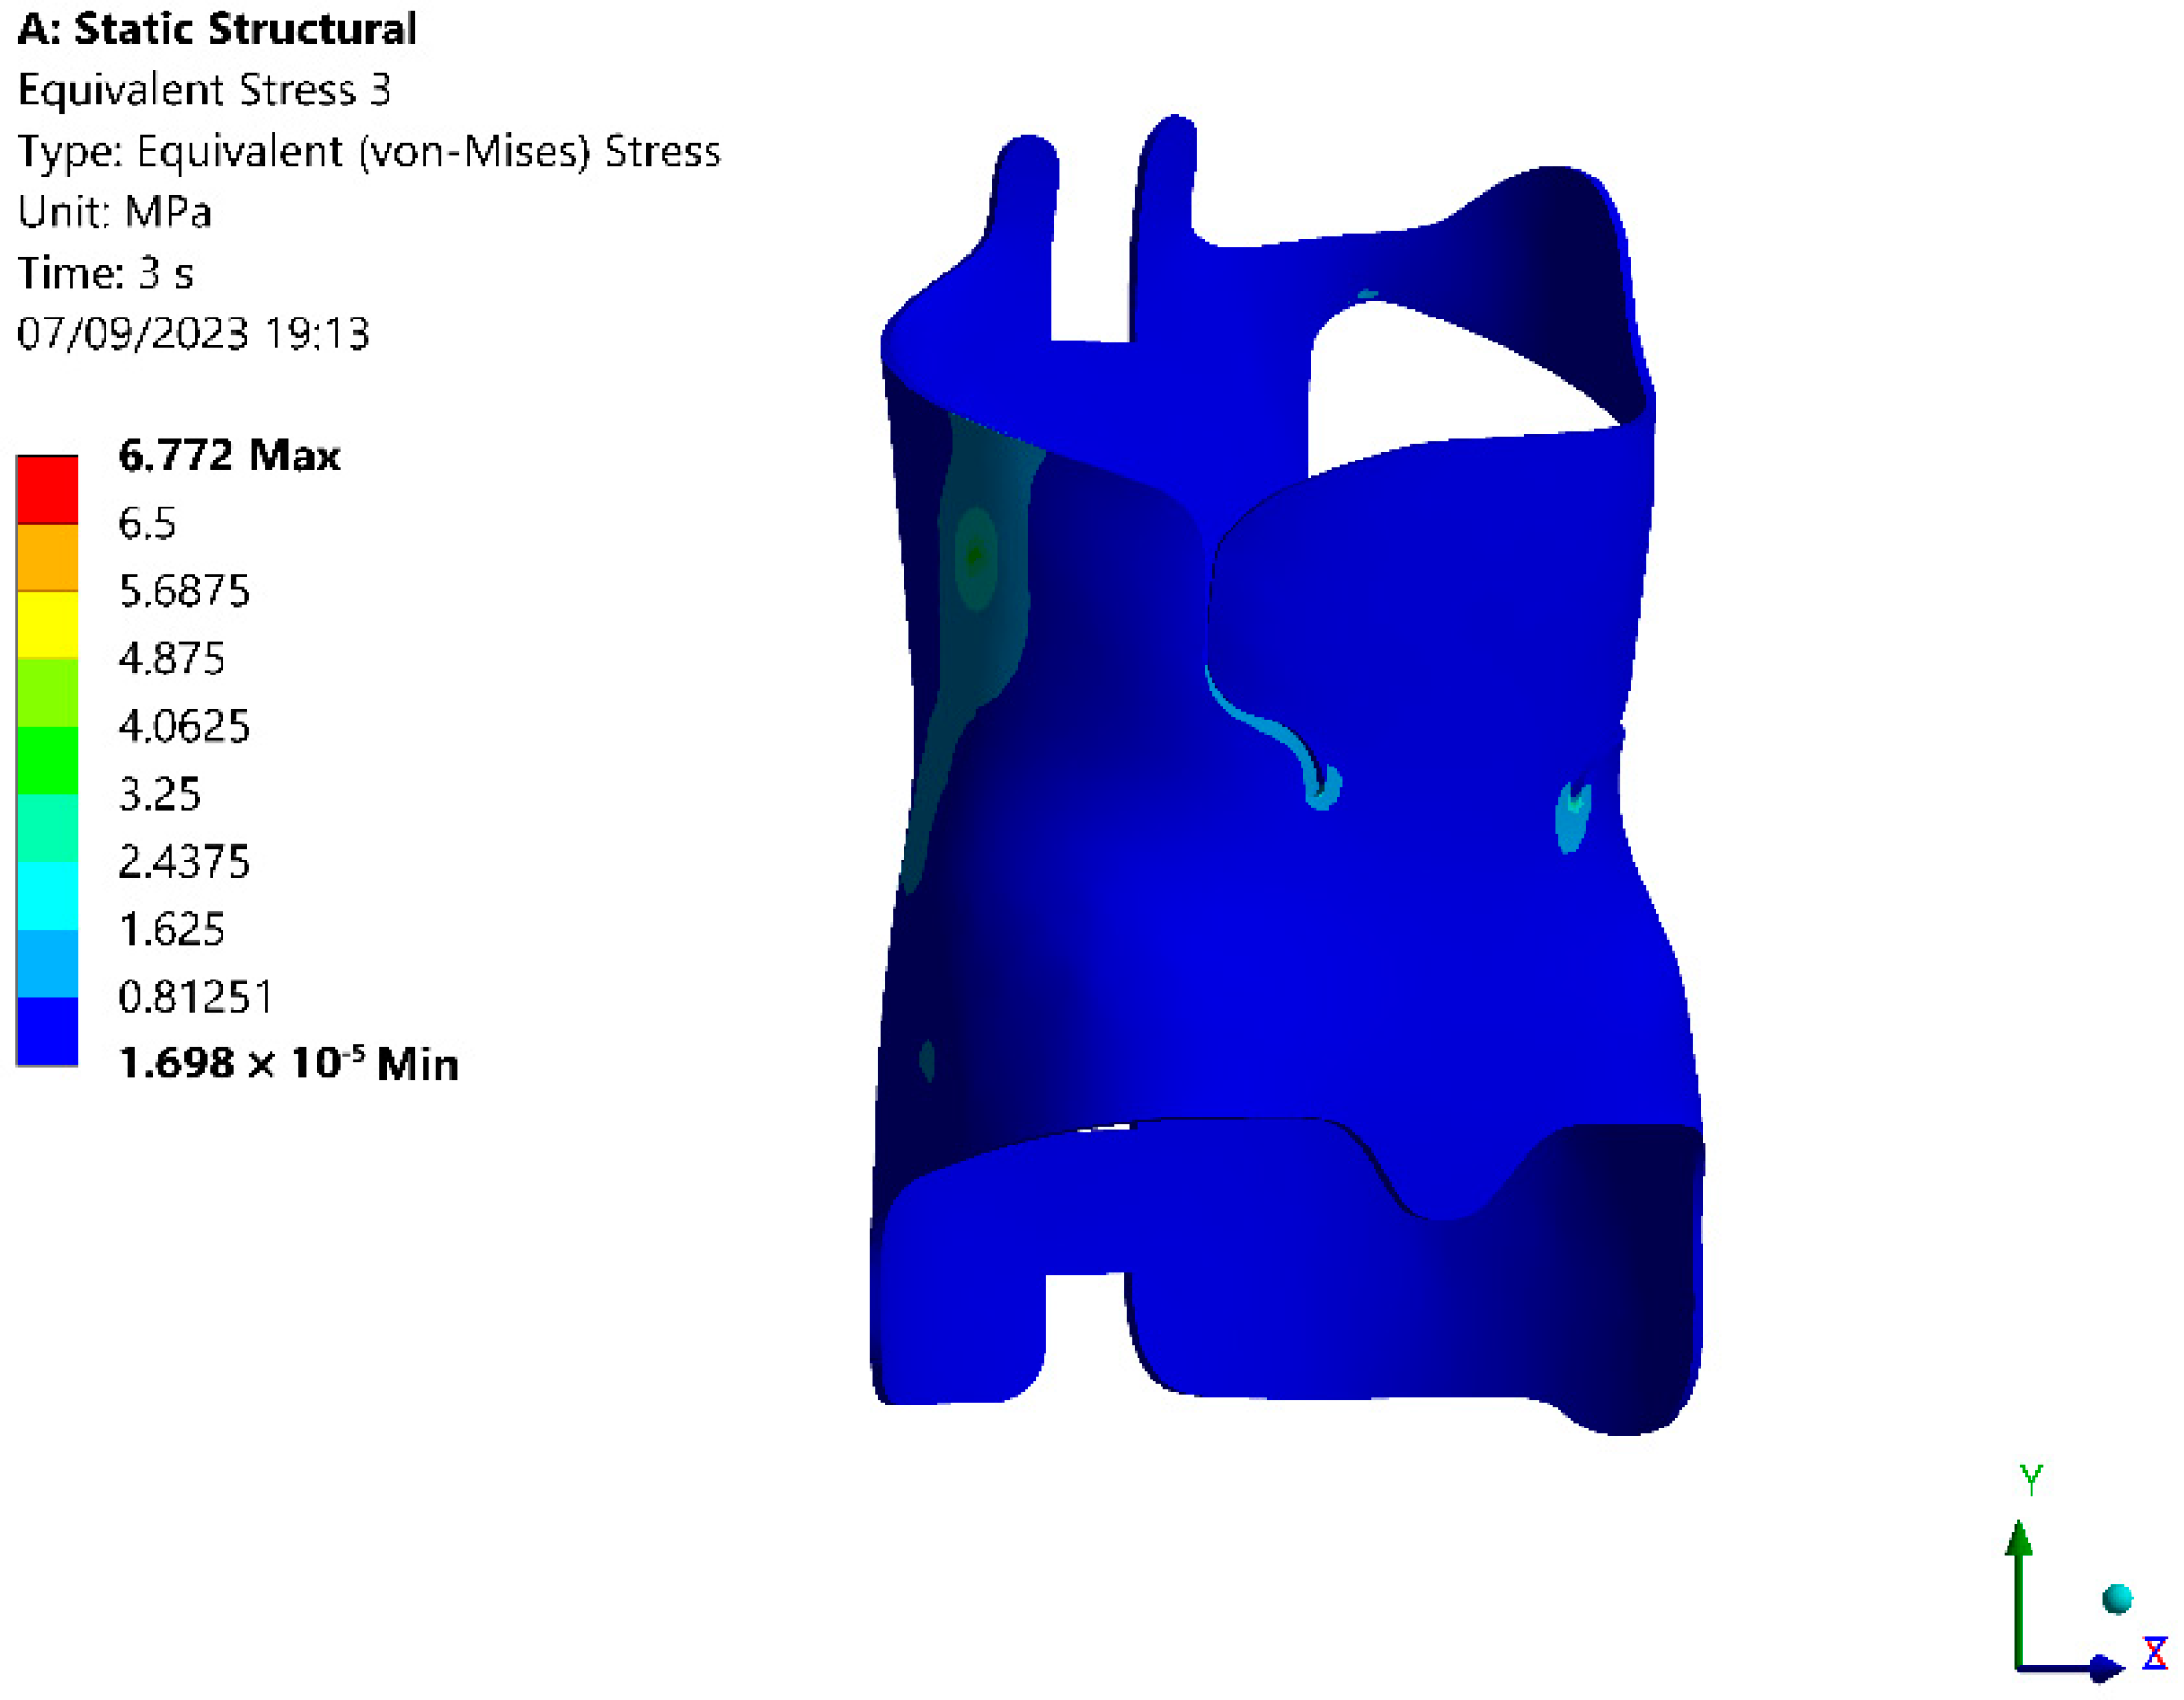
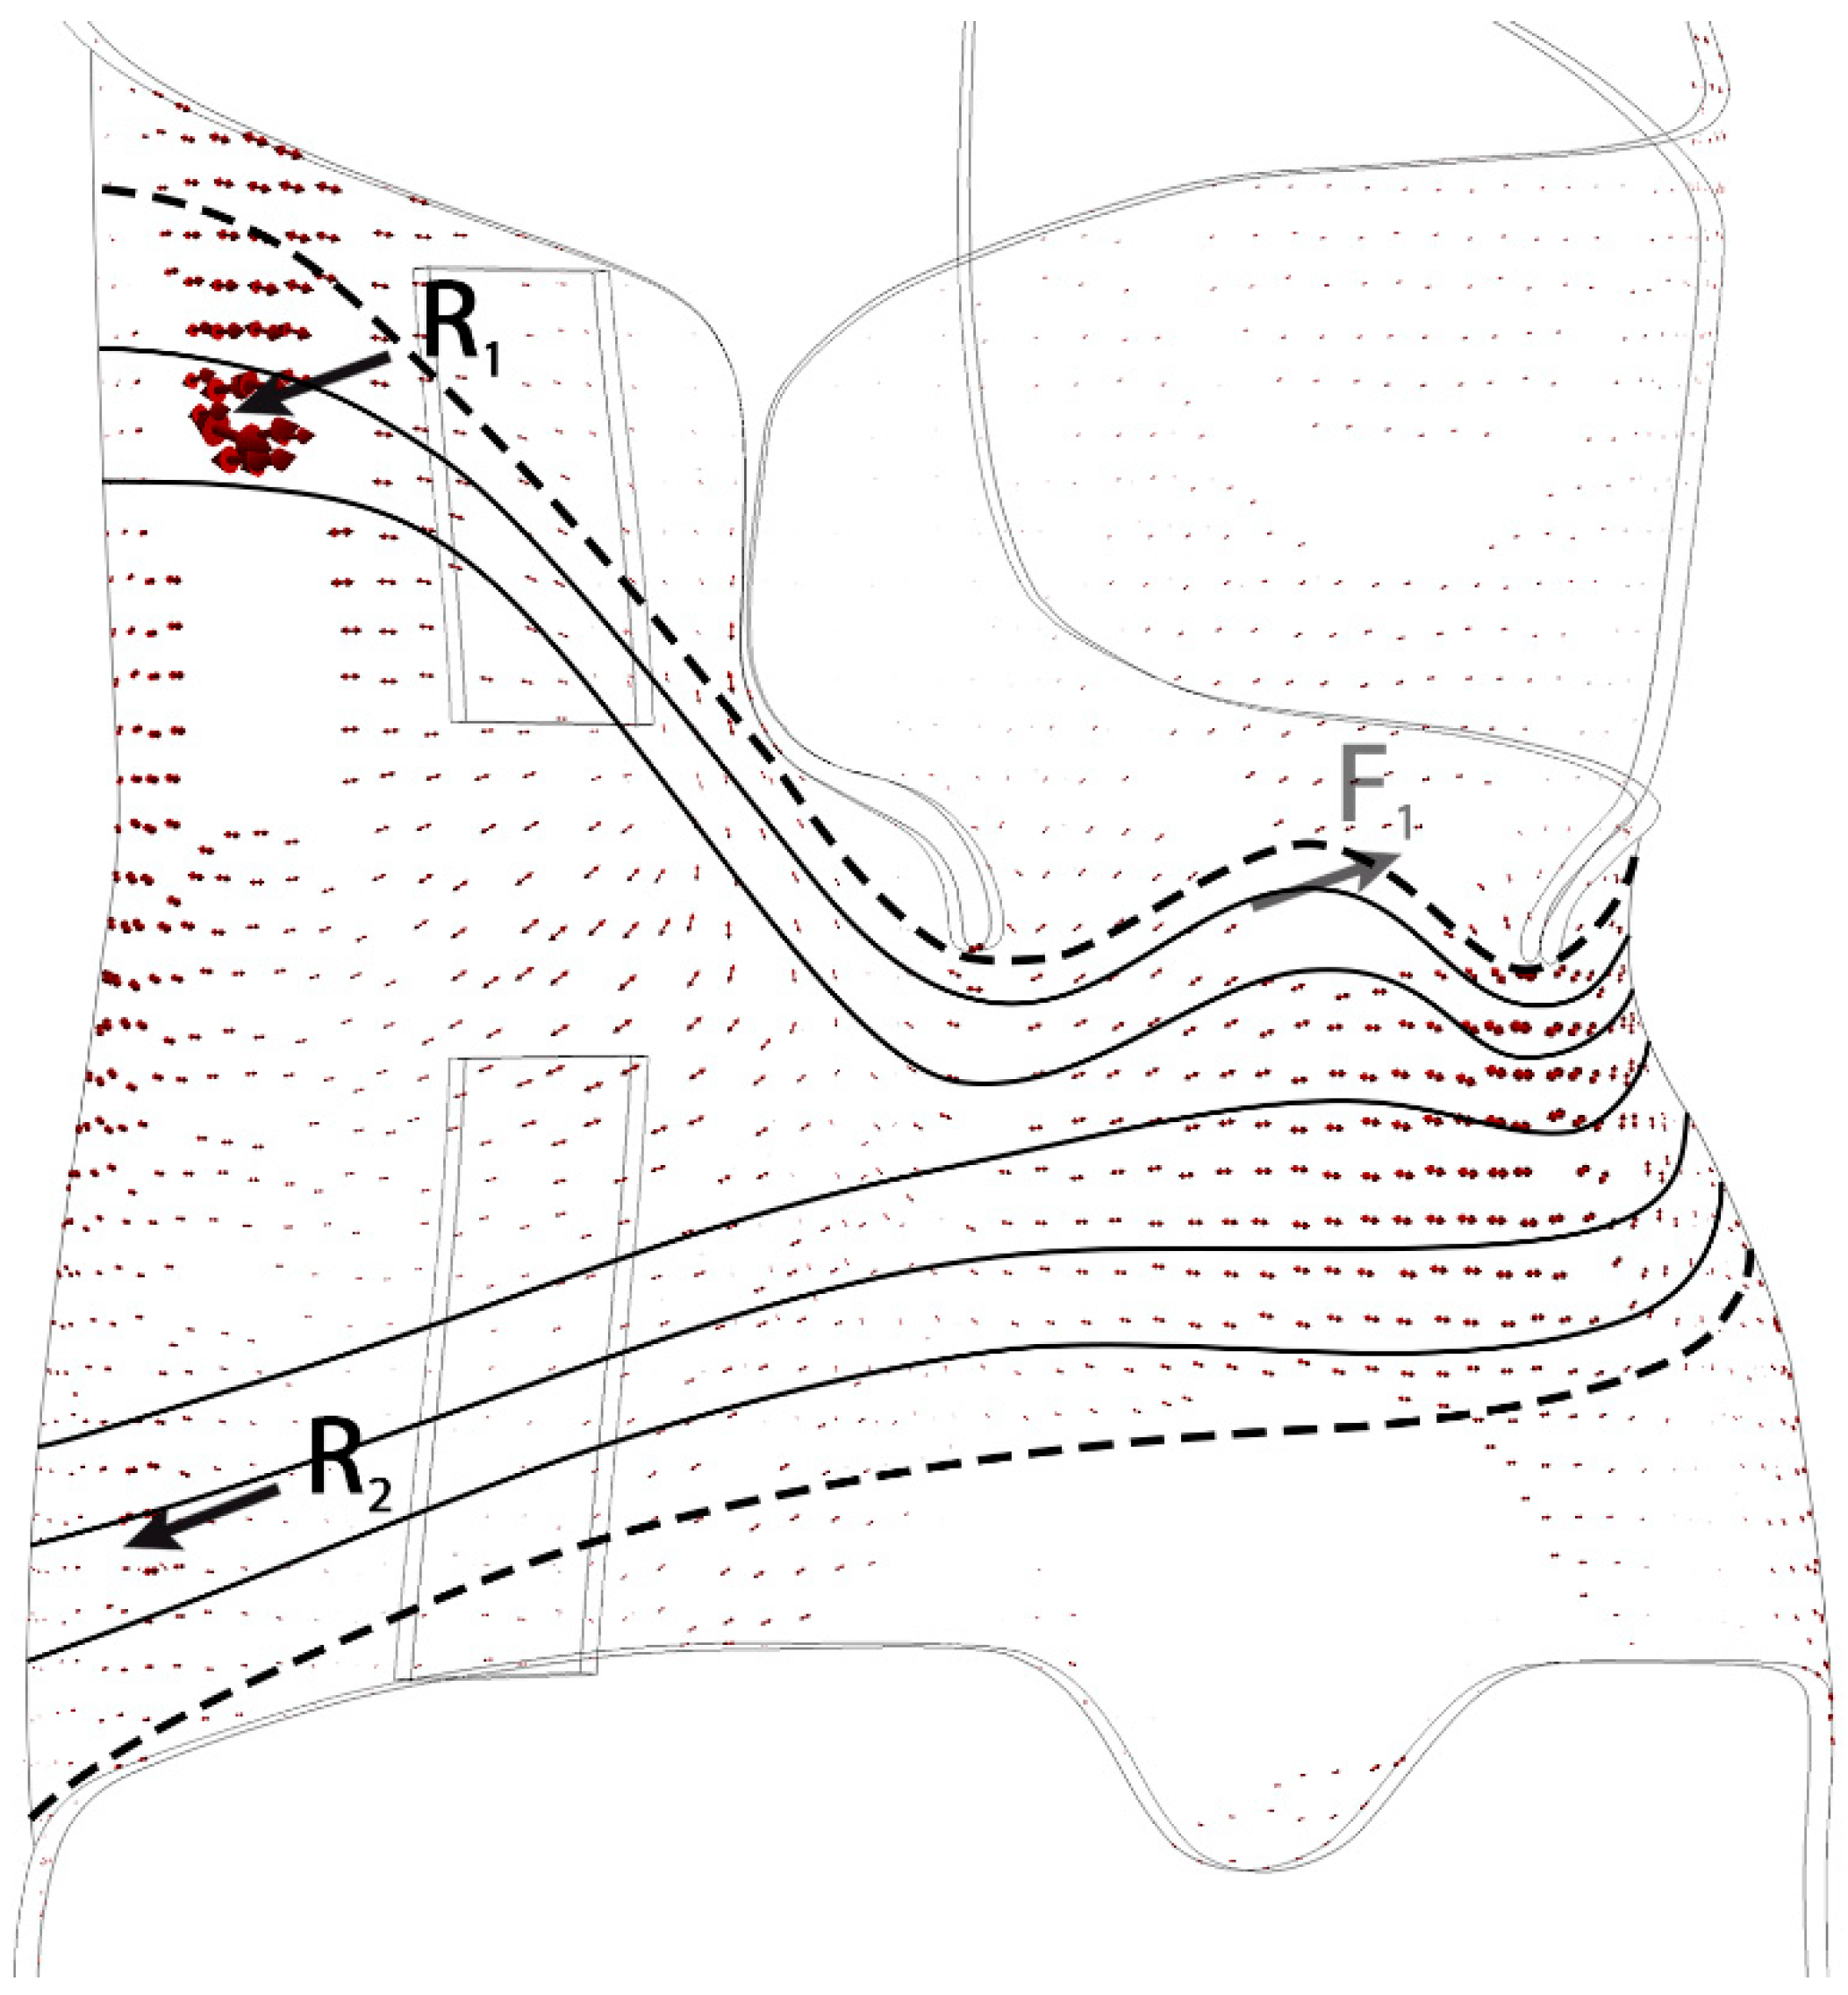
3.1. Computational Examinations of the Original Orthosis

The numerical model was tested with loading conditions similar to those used in previous FEM studies by Grycuk and Mrozek, specifically a 36 N load applied as F1, which is consistent with physiological loading conditions [3]. The numerical model of the original corset was verified experimentally on a test stand using ESPI [3]. In future studies, the modified corset will undergo additional verification tests. The generated results gave the von Mises stress distribution shown in Figure 2. Excluding the minimal surface areas where the load and supports were located, the majority of the orthosis exhibited stress levels below 6.5 MPa (Figure 2). This stress level is consistent with the linear segment of the stress–strain curve for polypropylene [13,14], confirming previous assumptions about the linearity of the model.
Figure 2 shows that simply identifying isolated regions of elevated von Mises stress does not sufficiently elucidate the functional mechanics of the orthotic shell. More informative is the use of the mapped distribution of principal stress vectors, particularly for constructing stress trajectories. Figure 3 illustrates these principal stress vectors, focusing on the maximum tensile stresses, denoted as σ1. This figure plots the paths of these σ1 stresses, with splines drawn to align with the directions of the σ1 vectors, starting and ending near the points where external forces were applied.
Based on the shapes of these principal stress σ1 trajectories derived from numerical analyses, and the shell regions where these trajectories correspond to the highest stress values, it can be hypothesized that these specific regions primarily contribute to the brace’s corrective function. Conversely, other shell regions are likely to play an auxiliary role, such as stabilizing the orthosis relative to the torso, and should not significantly affect the brace’s corrective capabilities. These auxiliary regions could potentially be removed without significantly affecting the stiffness of the shell.
To validate this hypothesis, one could remove those parts of the shell in which the principal stress trajectories correspond to relatively low σ1 stress values and then perform a numerical analysis similar to that performed for the original orthosis. When the mechanical properties, deformation behavior under corrective loading, and stiffness values of the modified brace are close to those of the original structure, the hypothesis would be considered confirmed. Minor adjustments, such as a slight change in the shell thickness in critical areas, may be necessary. These minor modifications would account for the small contributions of the removed areas to the shell’s load capacity, and would require some form of compensating action after their removal.

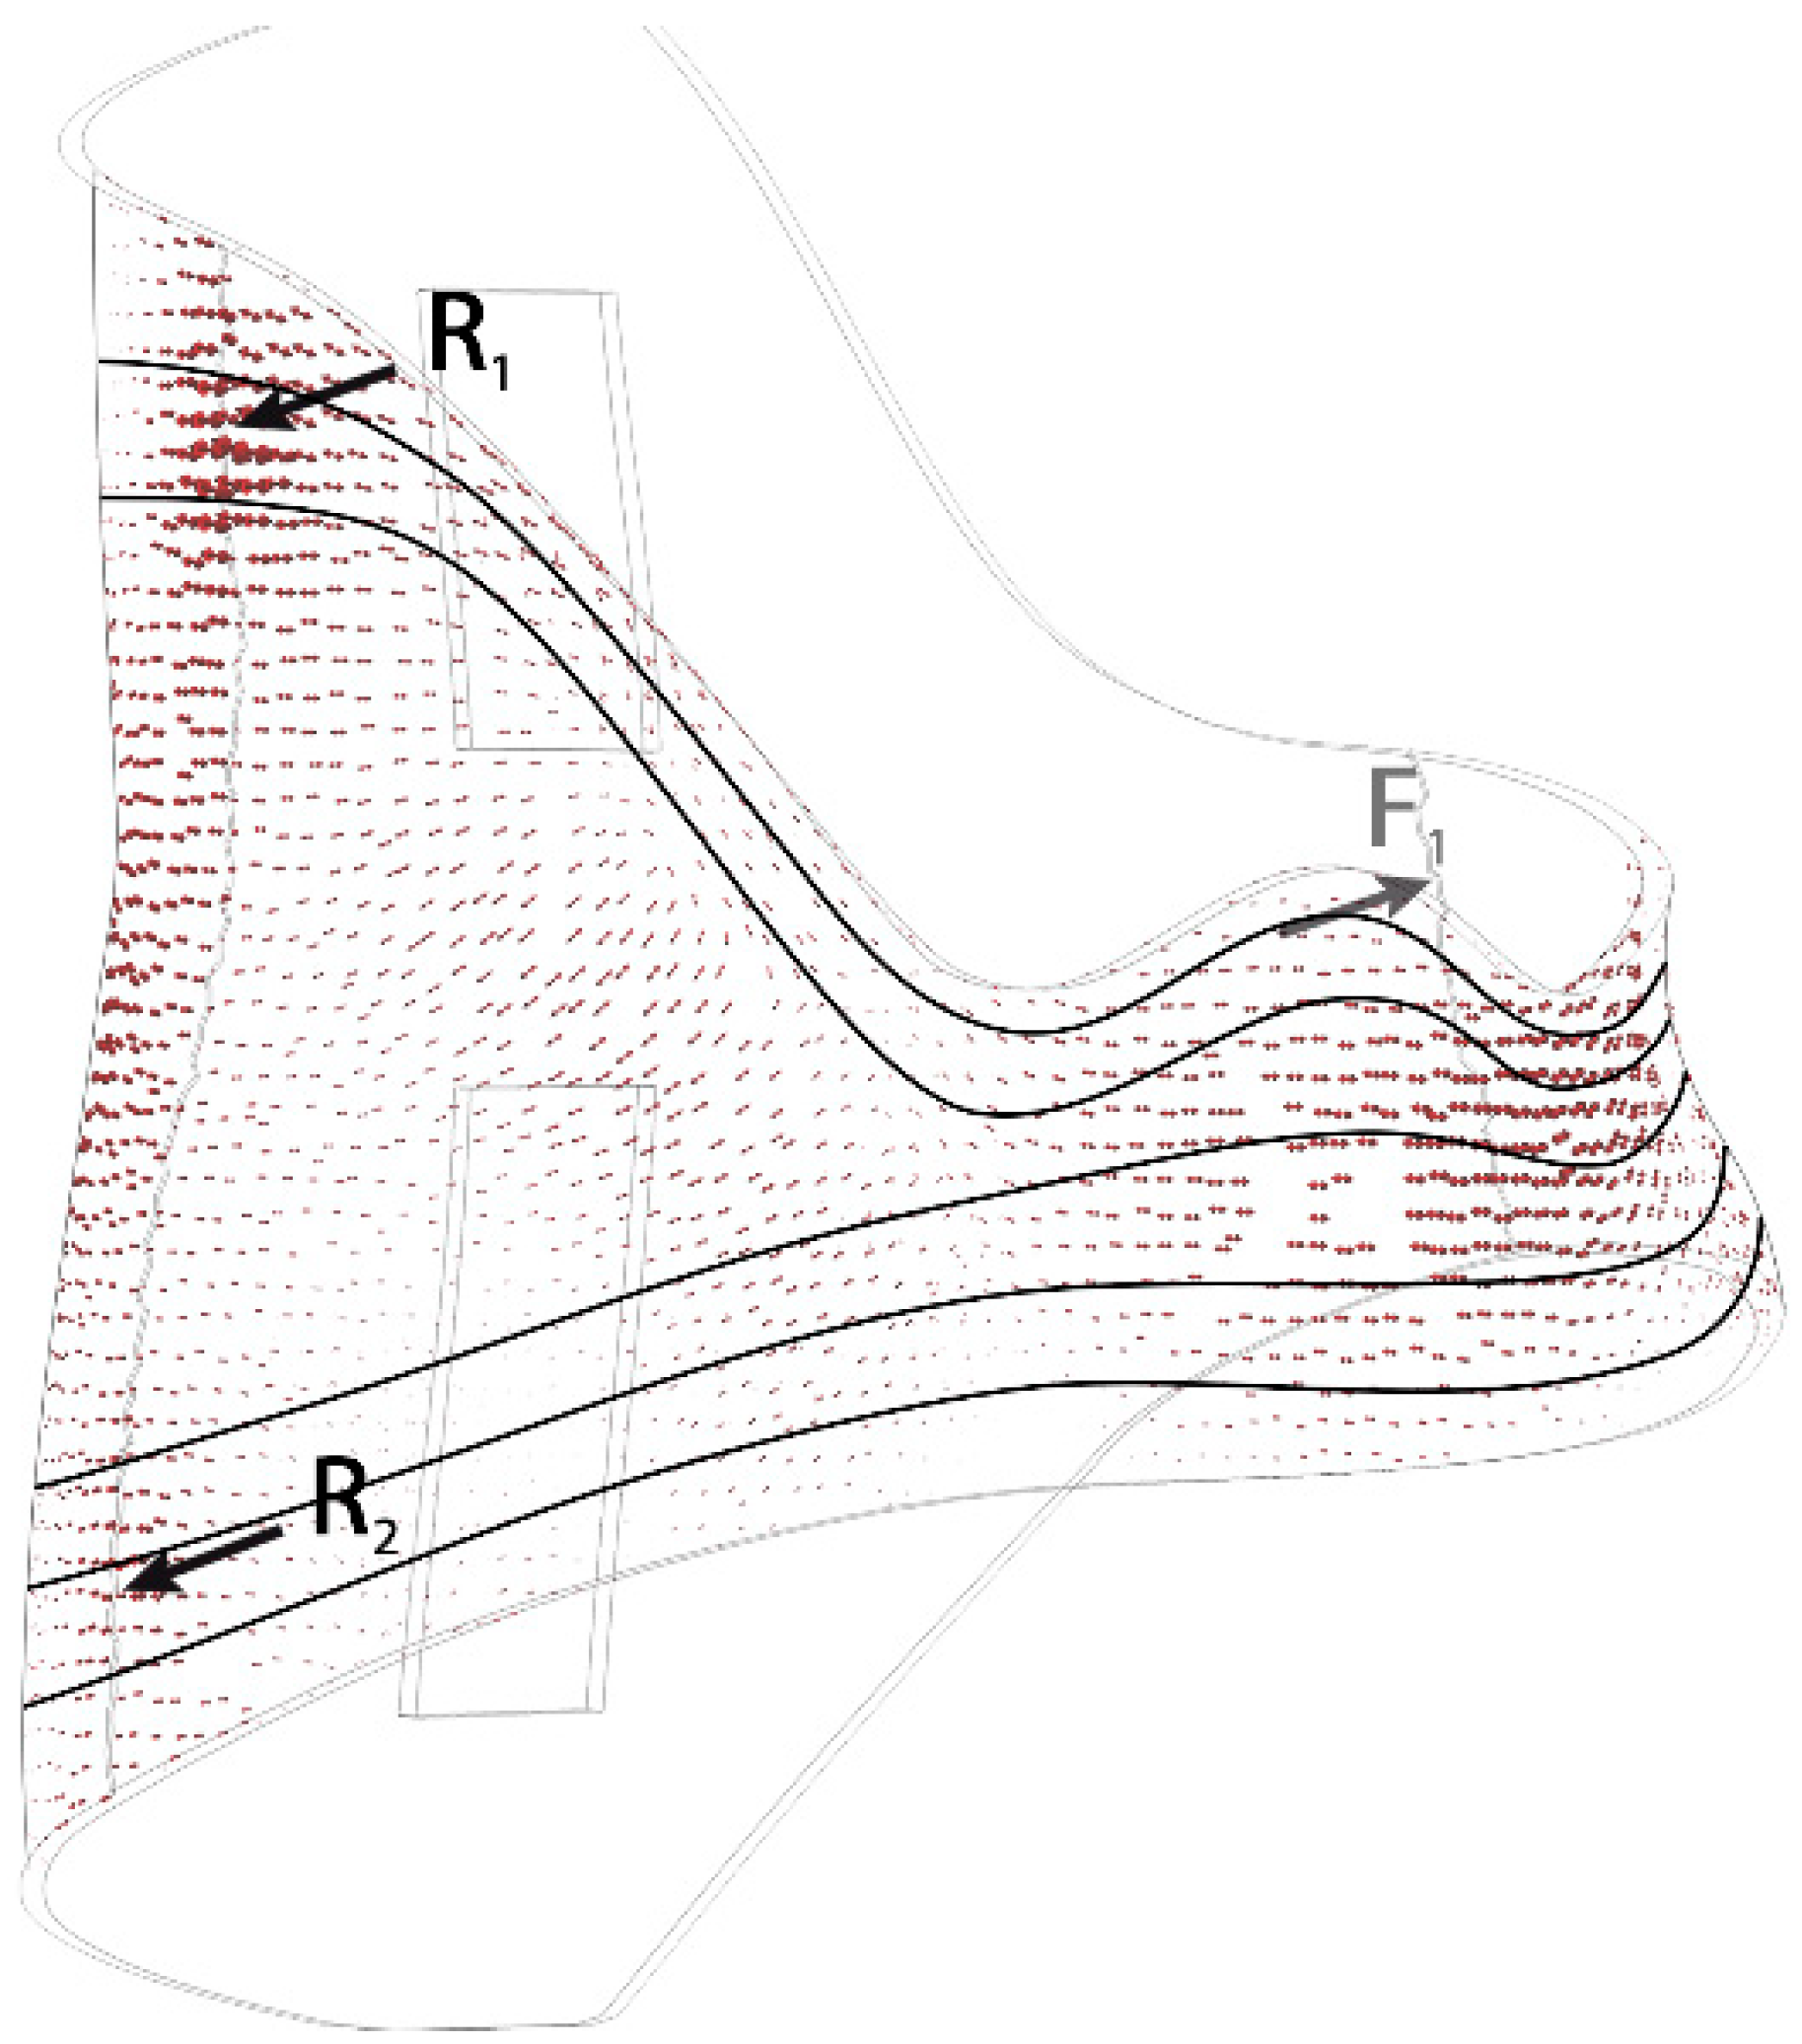
3.2. Computational Examinations of the Modified Orthosis

In order to validate the hypothesis outlined in Section 3.1, modifications were made to the original geometry of the corset shell. A substantial portion of the front wall was removed, leaving only a narrow strip where the principal stress trajectories corresponded to relatively high σ1 stress values, as shown in Figure 3. Smaller sections of the back wall of the corset were also removed, leaving the locations of the tension strap attachments intact. This was carried out in order to maintain areas consistent with the initially identified maximum principal stress trajectories. The front wall of the modified corset was thickened by 0.95 mm to compensate for the minimal load-bearing contributions of the removed shell segments. The modified brace was then subjected to the same forces as the original brace was. Figure 4 shows the modified corset shell, including the distribution of von Mises stresses, while Figure 5 shows the distribution of principal stresses σ1 in the front wall of the corset.
It can be seen that there are minor differences in the distribution of the von Mises stresses of the original (Figure 2) and modified (Figure 4) corsets, which are related to the slight difference in the thickness of the two corsets in the front part of the shell, but nevertheless the most important observations concern the comparison of the distribution of the principal stress trajectories in the two corsets. Comparing Figure 3 and Figure 5, it can be seen that the distribution of these trajectories remained virtually unchanged, from which it can be concluded that the nature of the work of the corset shell subjected to corrective loading was preserved. Similarly, a comparison can be made between the displacement fields of both corsets after the application of corrective forces, as shown in Figure 6. The data suggest that the mechanical properties of the two corsets are largely comparable. A comparison of the numerical displacement values for selected points is presented in Table 1.

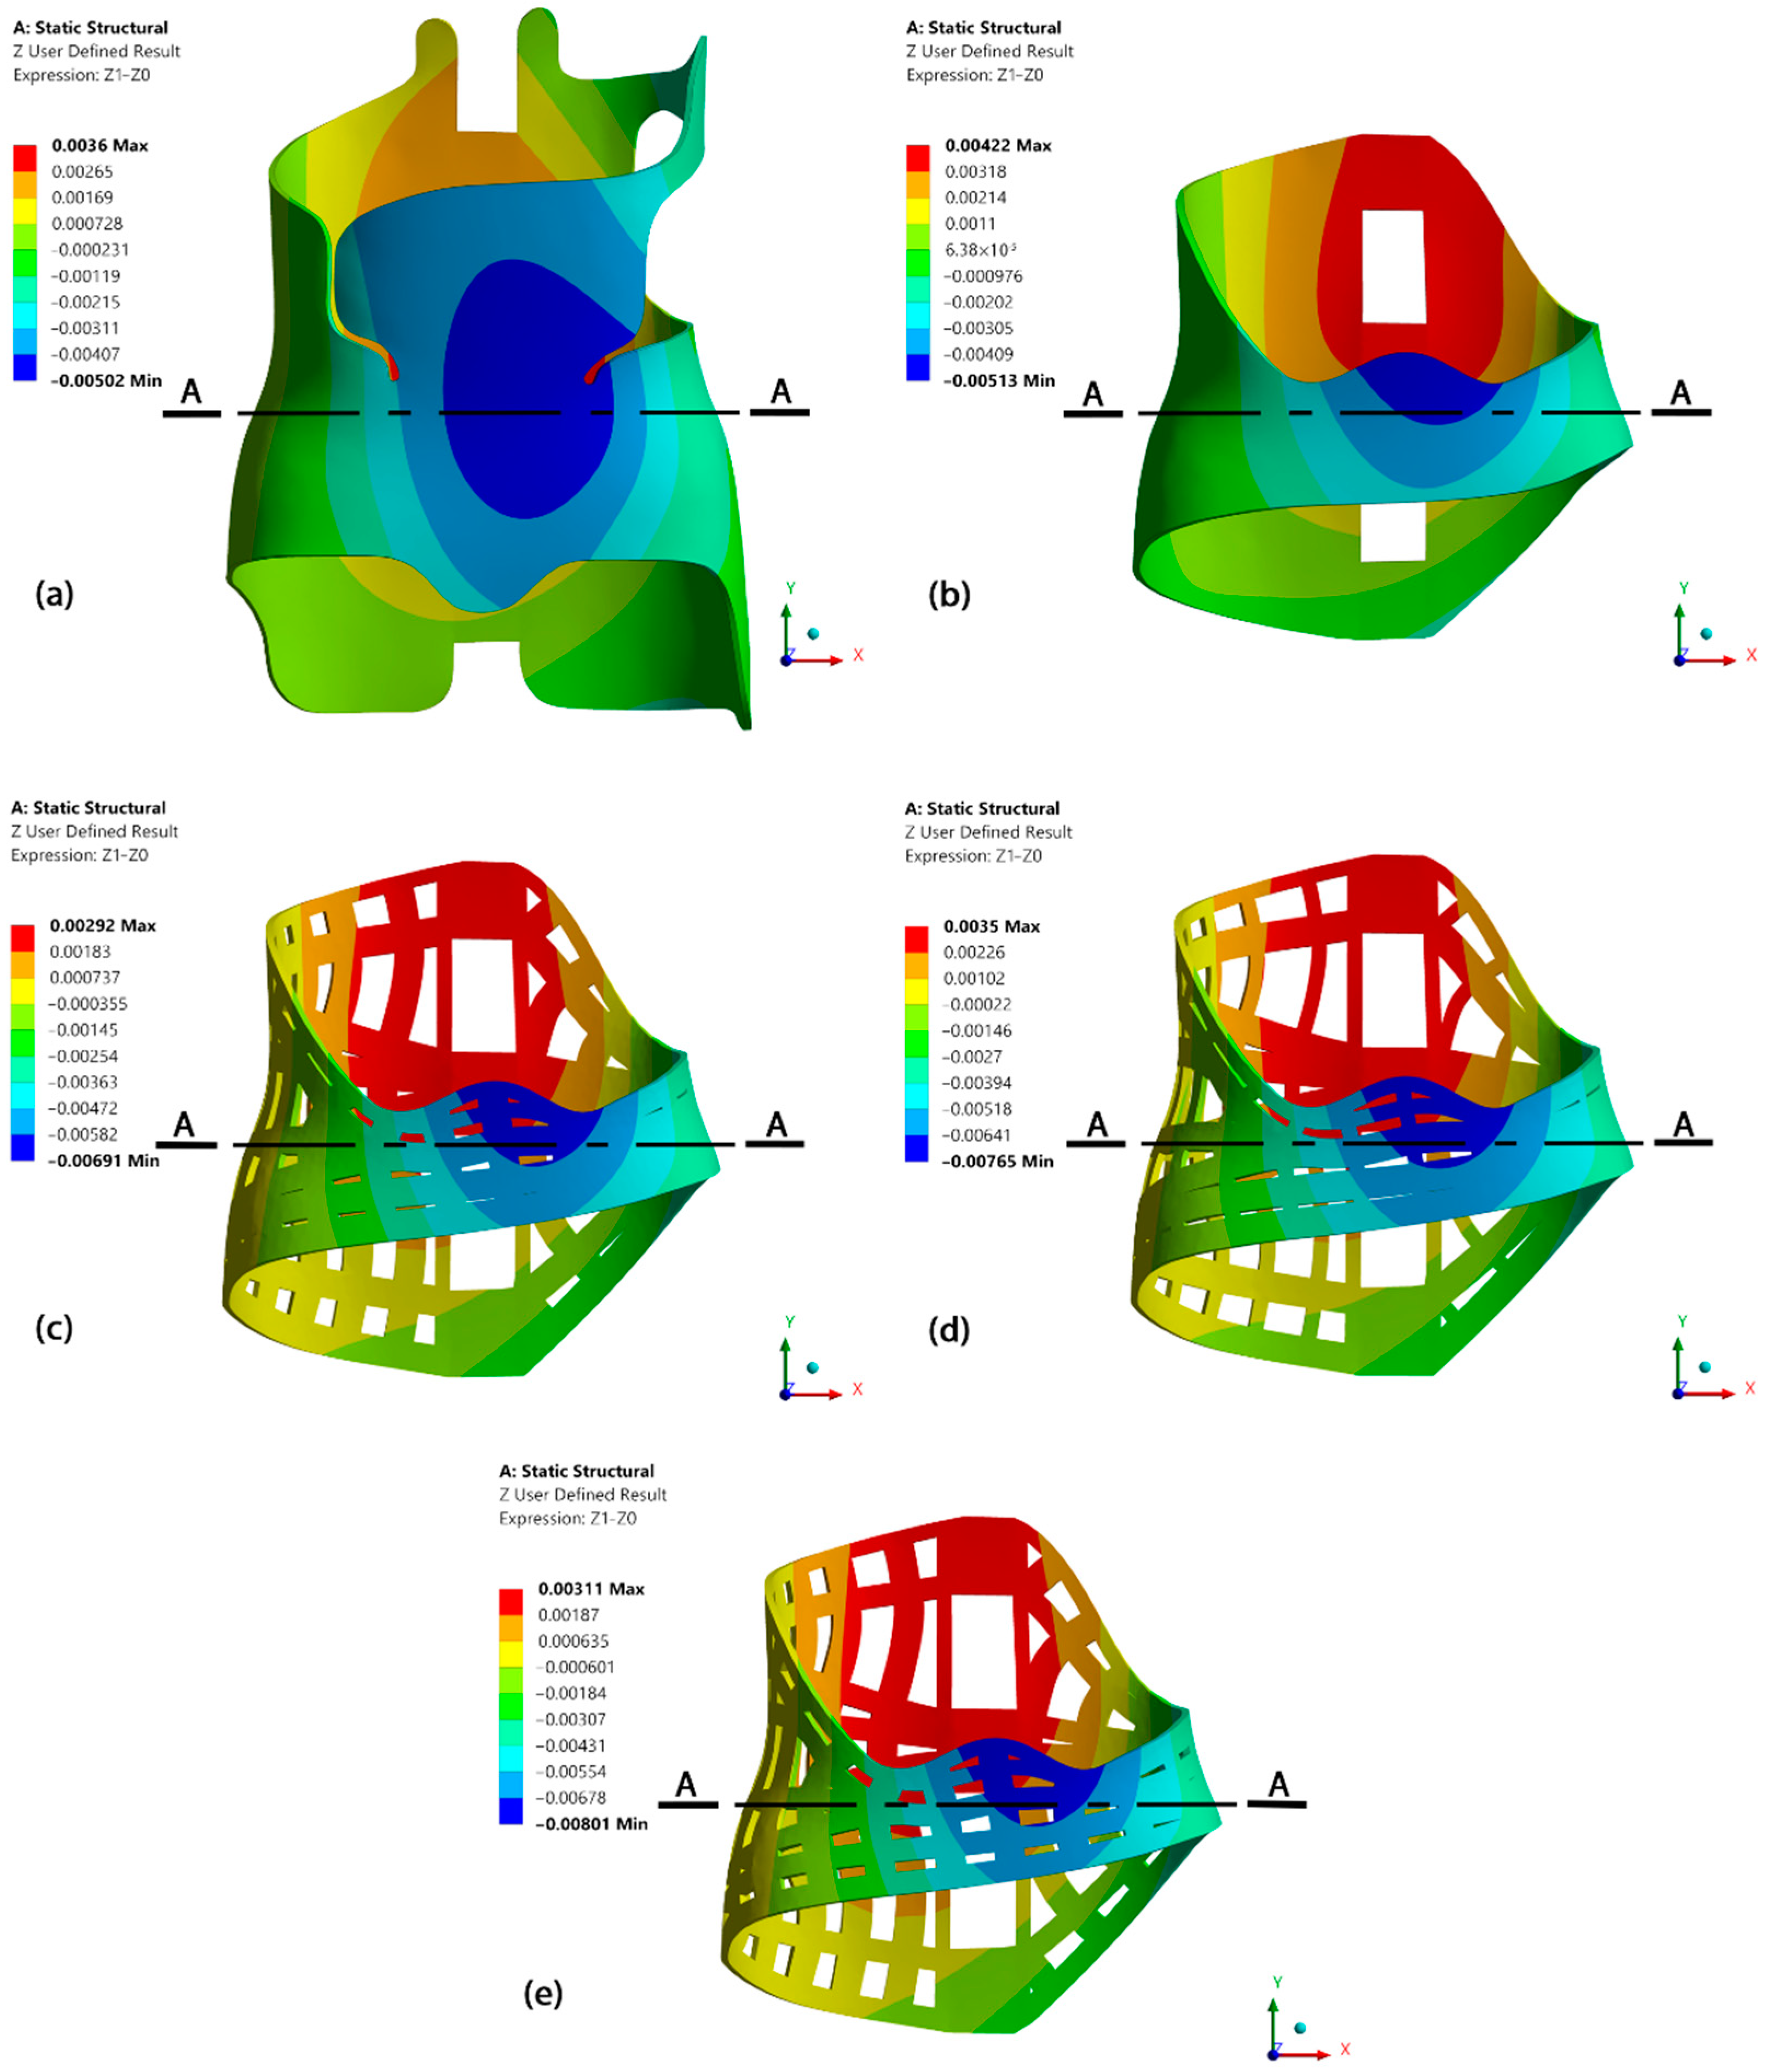
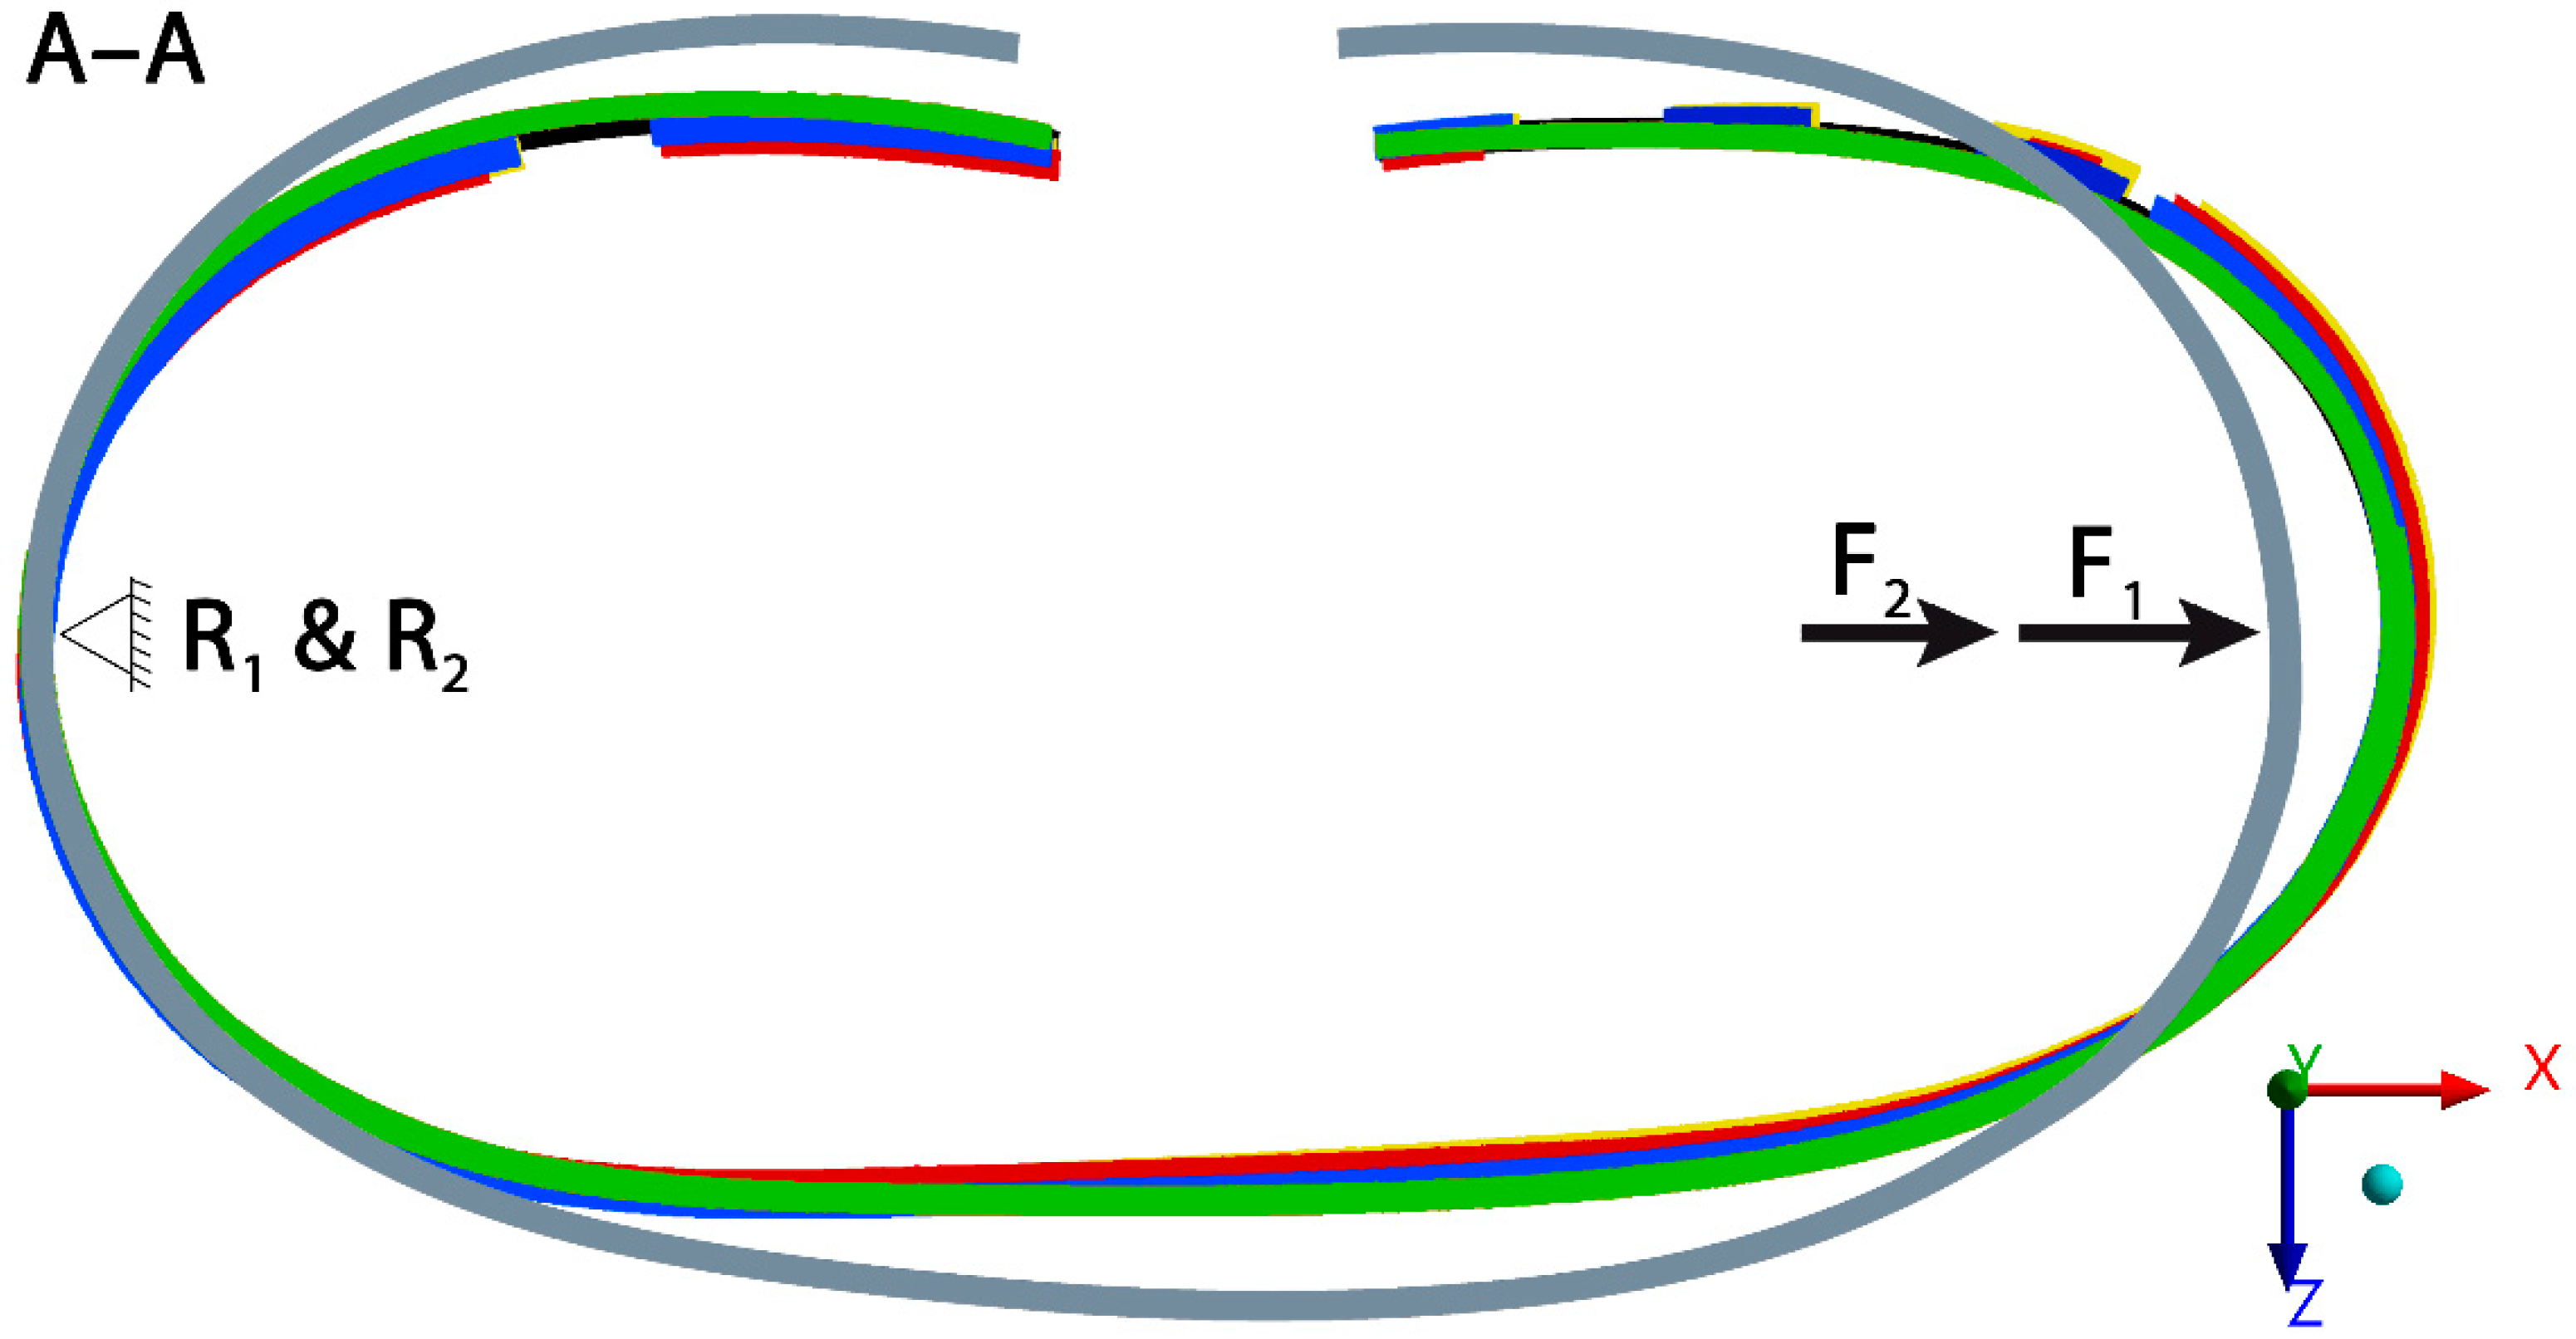
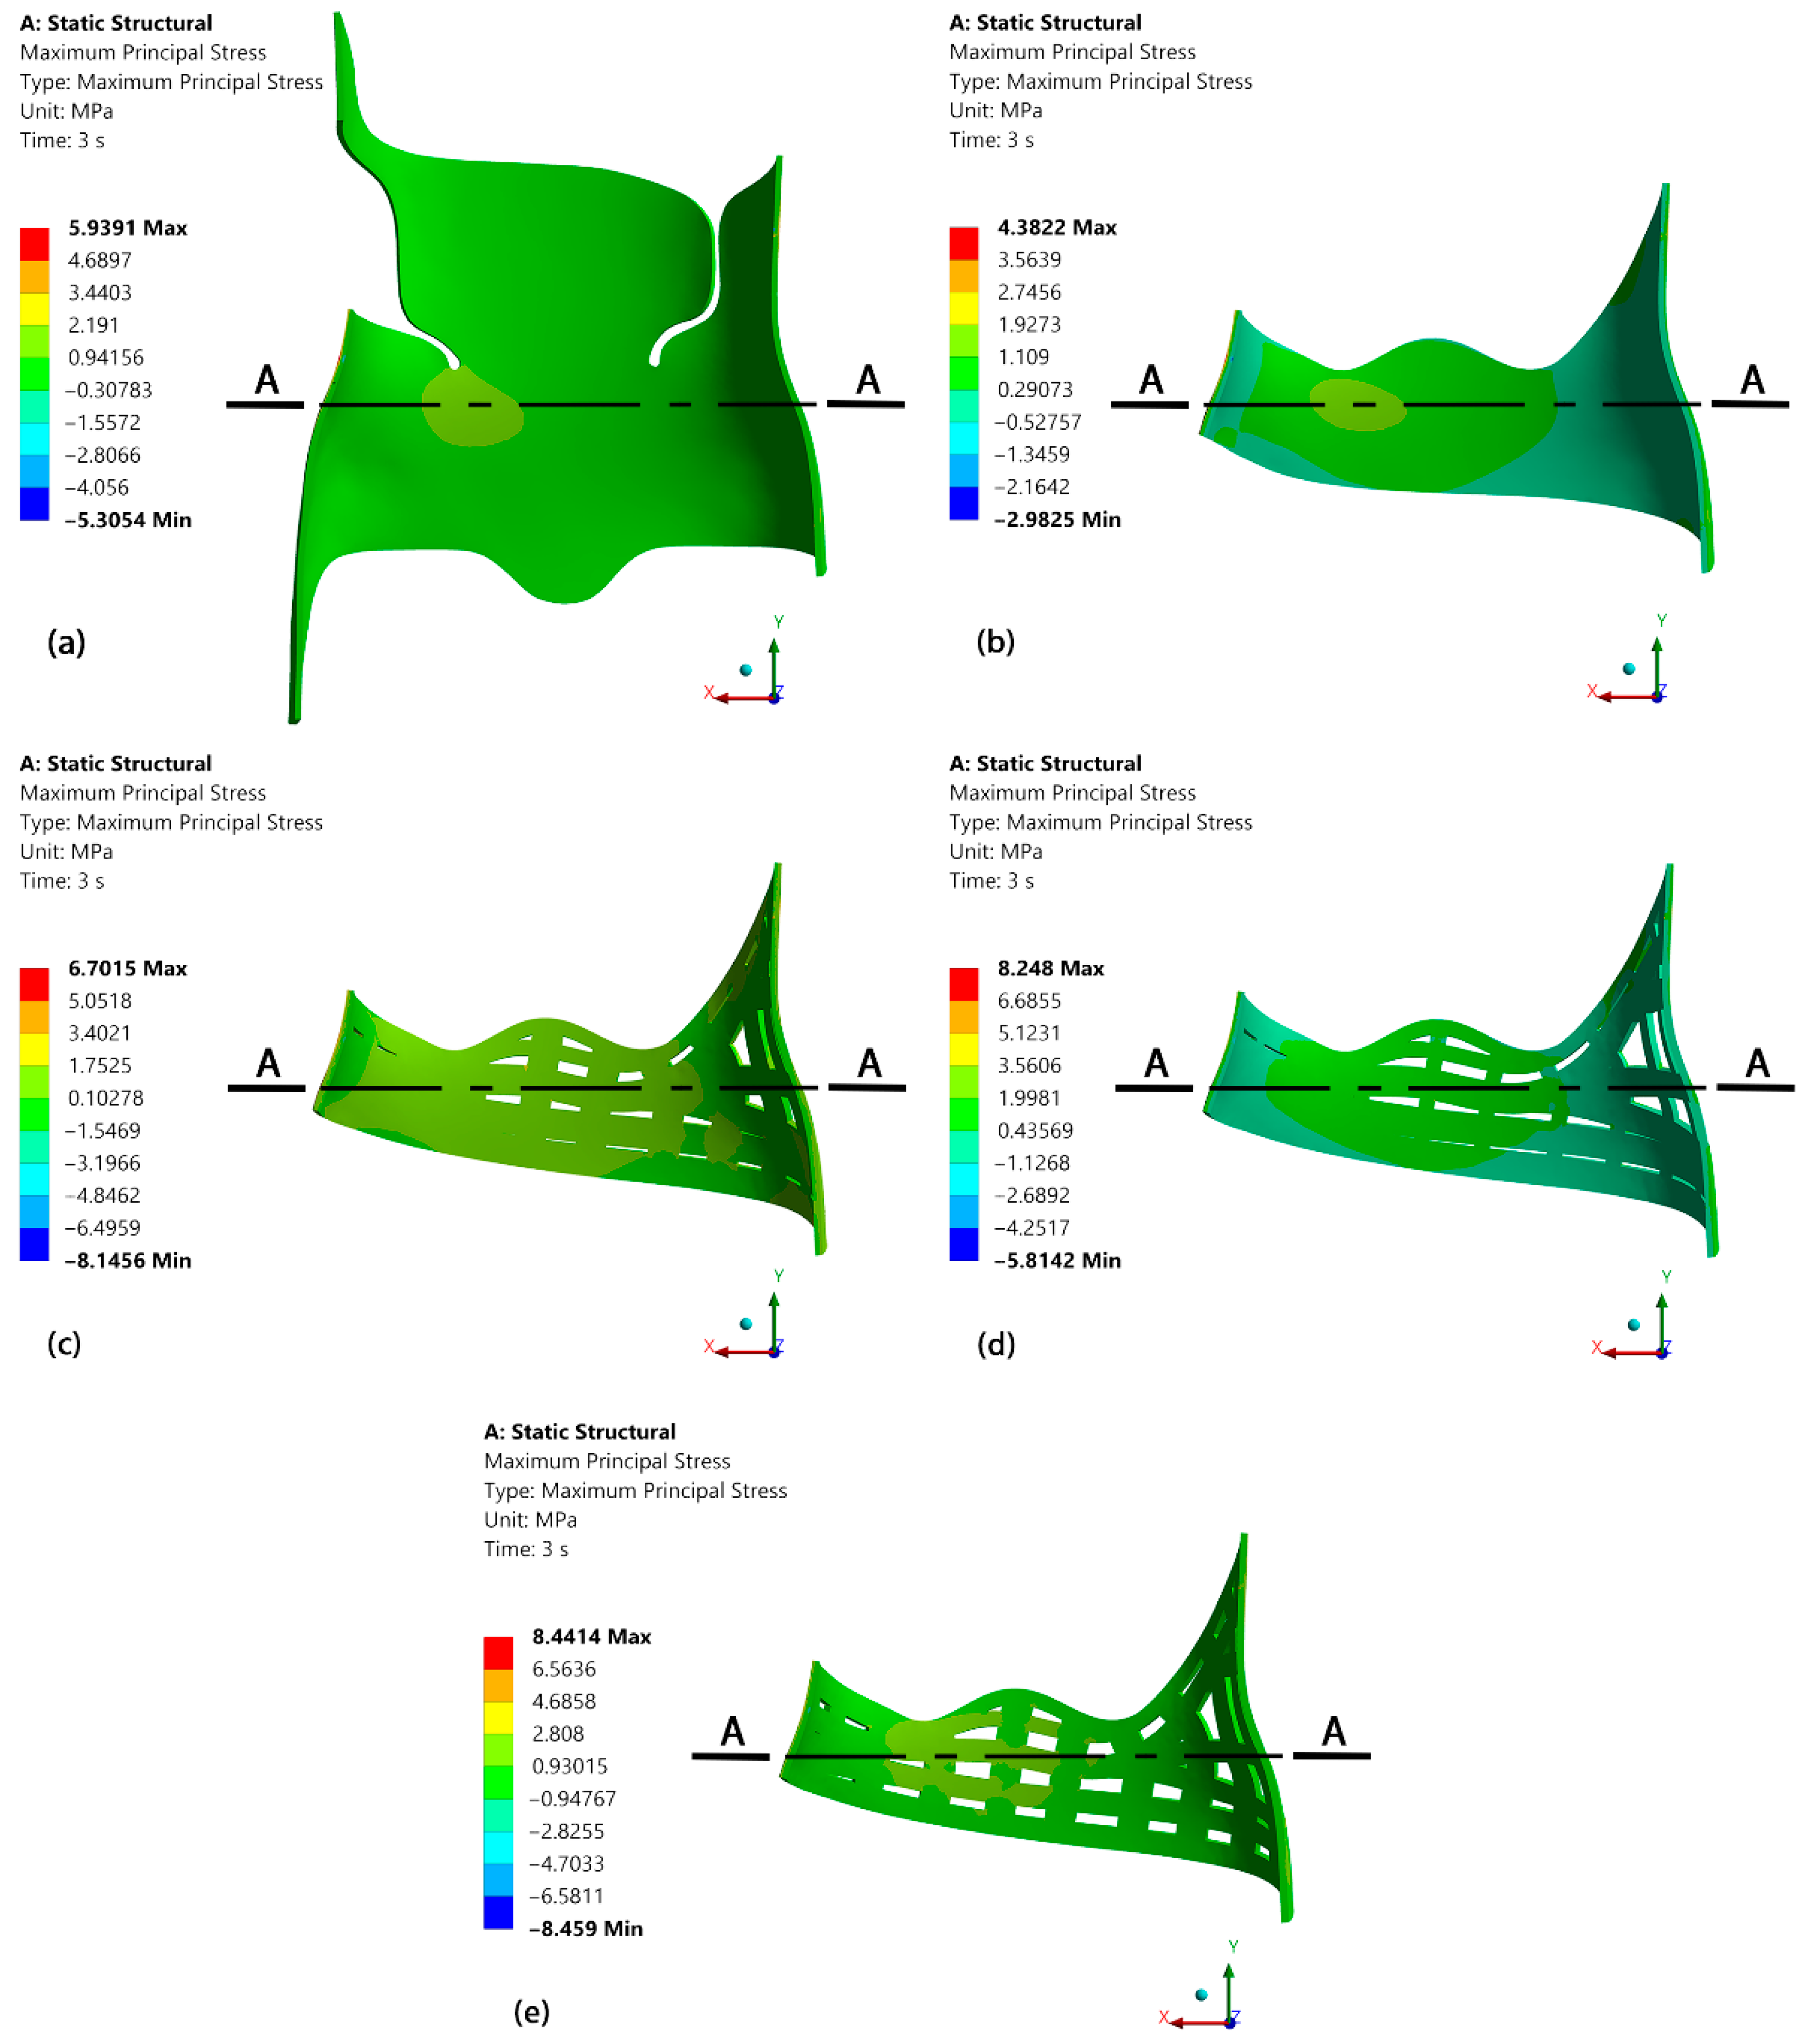
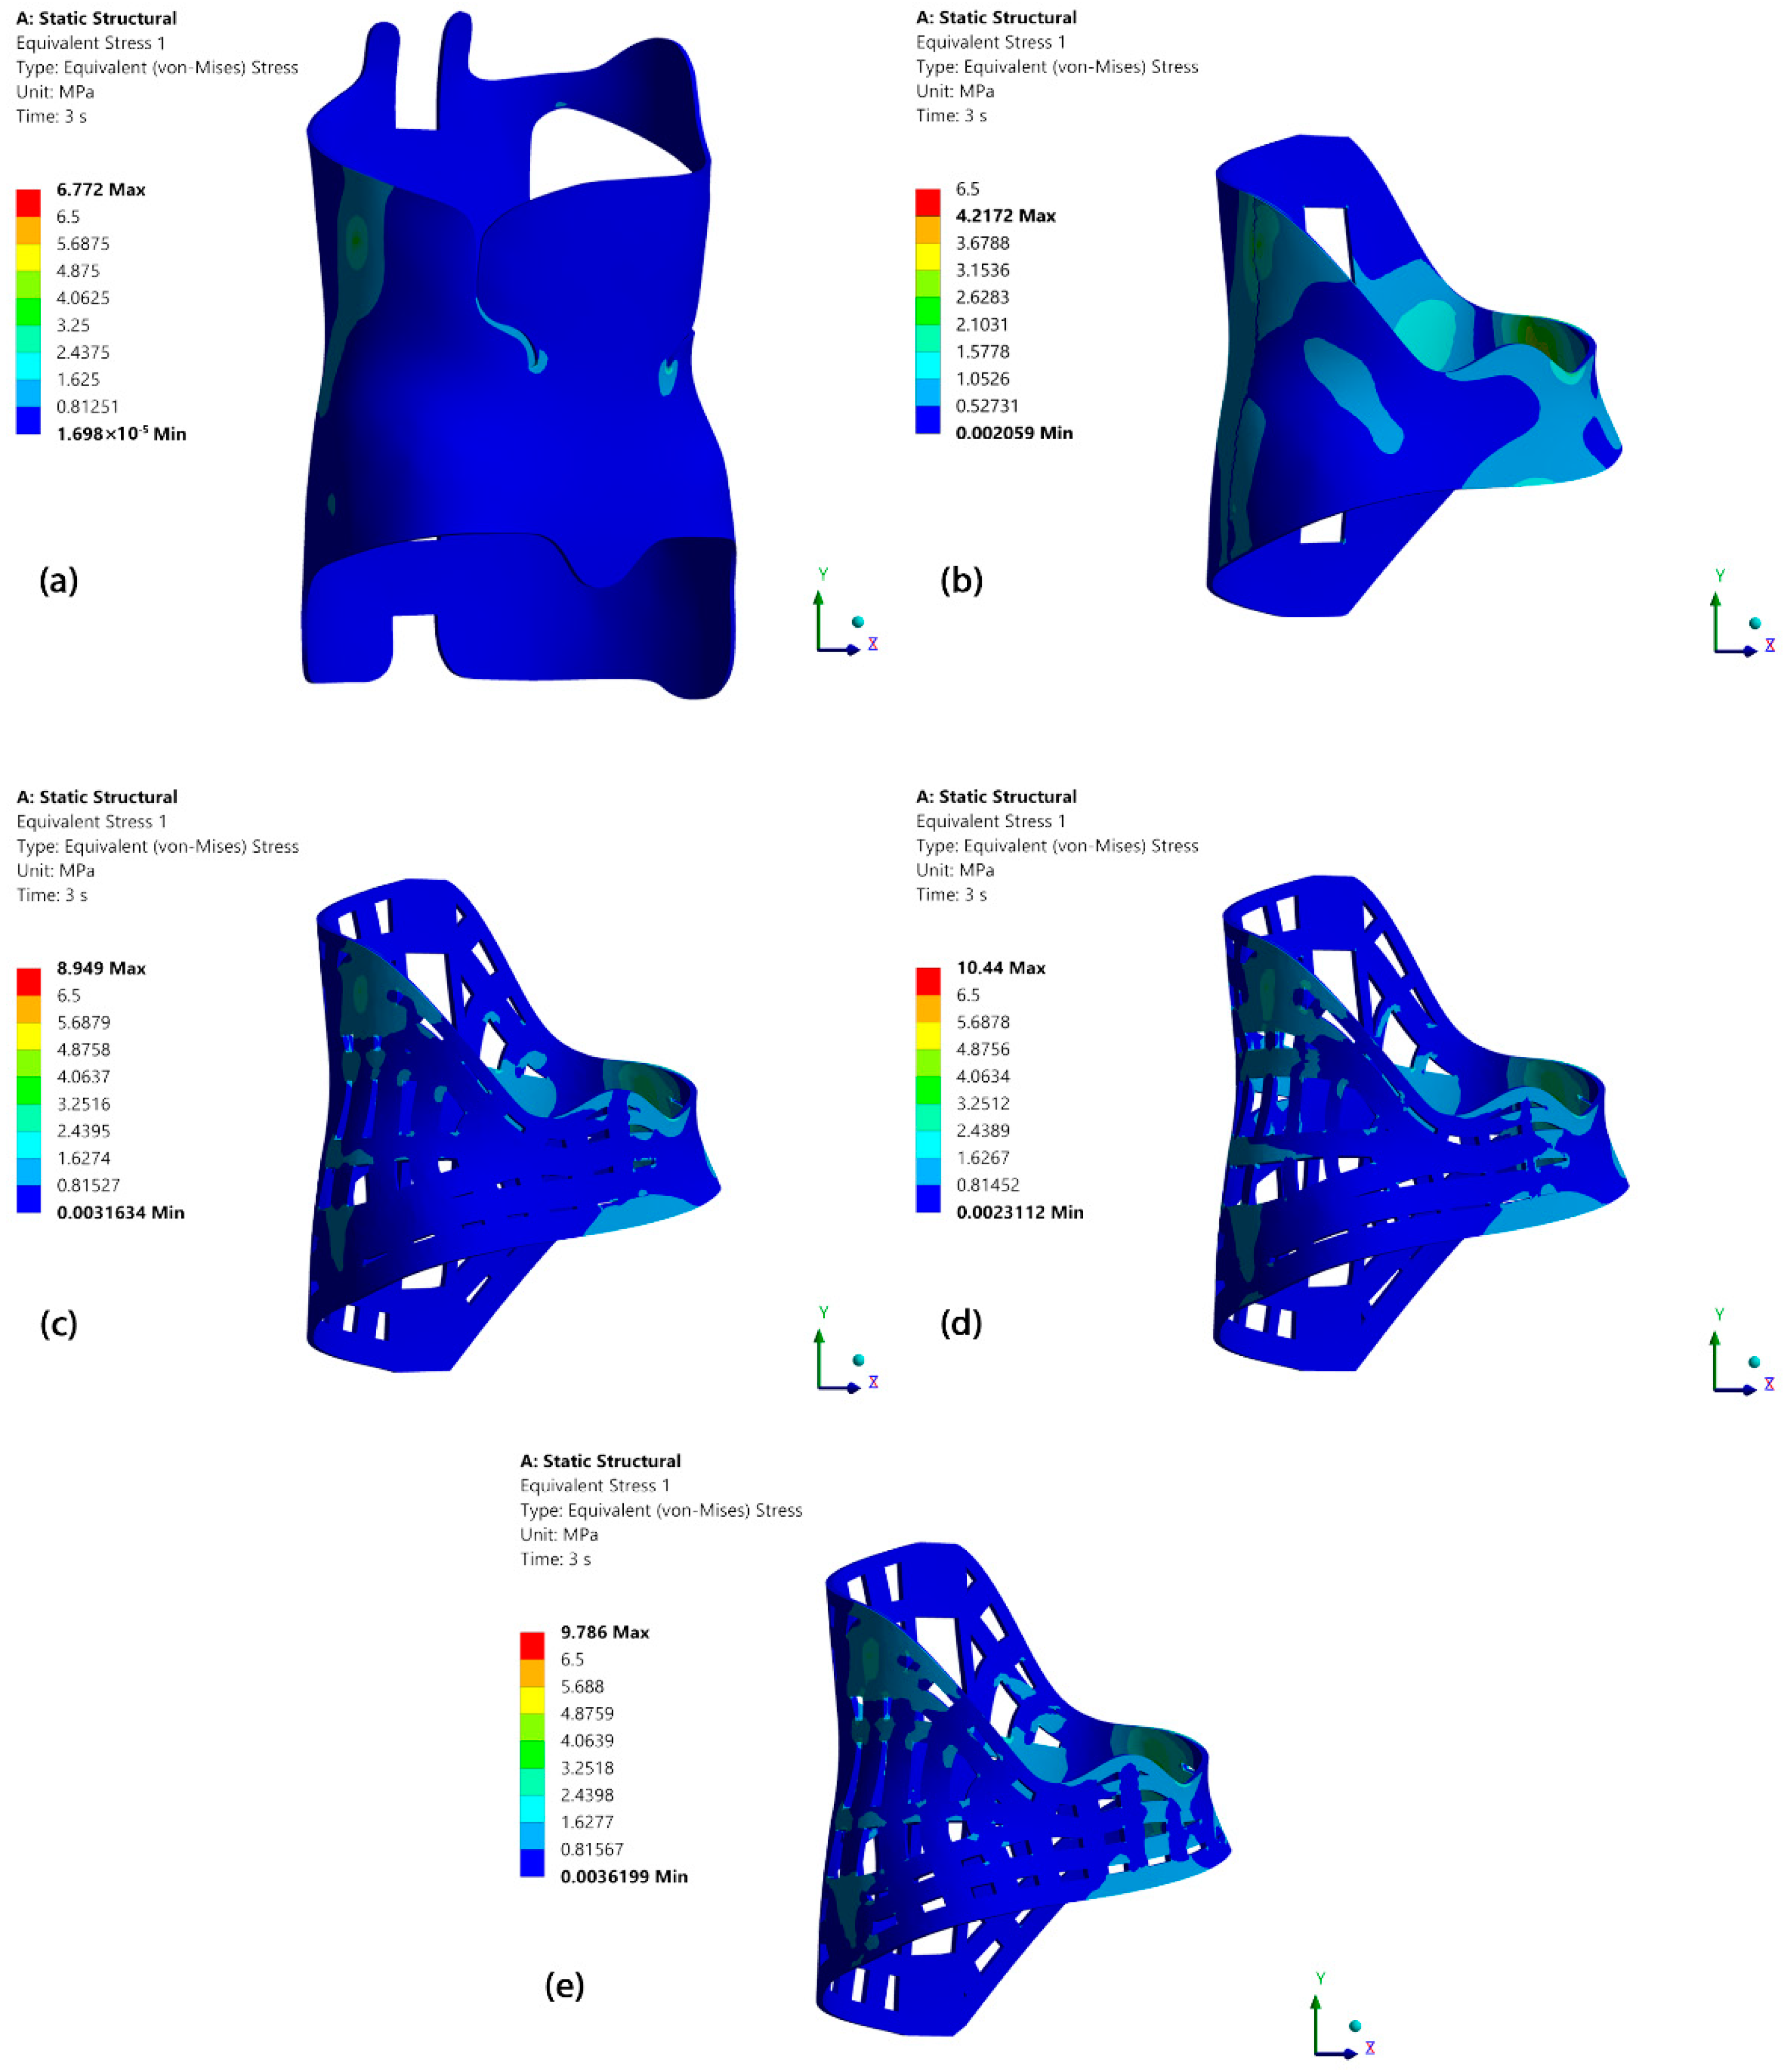
3.3. Numerical Tests of Corsets with Increased Levels of Thermal Comfort and Gas Exchange

Based on the results of the numerical studies conducted in Section 3.2, further modifications of the shell can be proposed to improve the utility properties of the corsets, especially in terms of thermal comfort and gas exchange, which involves the outflow of heated air and water vapor from under the shell and the inflow of ambient air in this place. These modifications are made possible via the introduction of additional slits to facilitate convective air flow in the space between the torso and the inner surface of the corset shell. It seems that the smallest impact is on changes in the mechanical characteristics of the shell, while at the same time the largest surface area of the planned slots can be achieved by designing longitudinal narrow slots evenly distributed on the surface of the shell and arranged along the directions of the principal stress trajectories. This shape of the slots should ensure the “flow of forces” between the points of application of corrective loads in a way that least interferes with the original alignment of the lines of force flow and thus preserves the original corrective function of the shell. Of course, it seems necessary to thicken the shell slightly to compensate for the lack of material removed in the slots in order to preserve the mechanical function of the corset to the greatest extent possible.
Three variants of openwork corsets were created, differing in the width of the longitudinal strips of shell material separated by longitudinal slits, as well as the different widths of crossbars connecting the longitudinal strips. The corset variants, labeled A, B, and C, differed in the width of the longitudinal strips from 15 to 20 mm and in the width of the crossbars from 10 to 20 mm. A view of these variants of the openwork corsets in comparison with the original and modified corsets is shown in Figure 7. The thicknesses of the shells were slightly increased (by 0.8 mm) to compensate for the amount of material removed from the slots. A comparison of the results of Z axis shell displacements under corrective loading for all corset variants is shown in Figure 7.
Figure 8 shows a comparison of the distribution of displacements in the same A–A section for all corsets analyzed. The gray color indicates the original corset without corrective loading, while the other colors indicate the corsets subjected with corrective loading. A 10× displacement scale was used to improve the readability of the figure.
Figure 9 compares the distributions of maximum principal stress values on the inner front surfaces of the corsets’ shells. This is due to the higher stresses resulting from the complex state of tensile and bending stresses [3]. To make the same locations easier to read, the A–A section lines have been retained.
Figure 10 shows the distributions of von Mises stresses on the surfaces of all the corsets. Excluding the load and support areas, most corset variants exhibited stress levels below 6.5 MPa, consistent with the linear stress–strain curve of polypropylene [14], and confirming the assumptions of model linearity. Table 2 compares the weights of the analyzed corsets and their maximum displacements in the X direction after the application of F2.

4. Discussion

To improve the utility parameters of the orthosis, an openwork model was developed based on the modified corset design described in Section 3.2. It was thickened to a degree that would achieve a stiffness similar to that of the modified brace in the correction plane. The results shown in Figure 7 and Figure 8 indicate that the different corset variants deform in a very similar manner under F2 force loading. The results, shown in Figure 9 and Figure 10, indicate that the values of both the maximum principal stresses and the von Mises stresses do not differ significantly between the corset variants. Table 2 compares the masses of all the corset variants (the density of polypropylene was assumed to be 900 kg/m3) and their maximum displacements in the X axis direction under F2 force loading, allowing a direct comparison of the stiffness of the corsets in the X axis direction. The resulting openwork brace A was found to be 1.4% stiffer than the modified version, while its mass increased by approximately 1.5%. Changing the width of the strips along the main stress trajectories from 20 mm to 15 mm (corset B) had a similar effect on the stiffness of the brace as changing the width of the crossbars from 20 mm to 10 mm (corset C) did. Variants B and C of the corset were found to be slightly lighter than variant A, but at the cost of their stiffness, which was slightly reduced. Variant A, whose stiffness was found to be identical to that of the original corset, was 39% lighter than the original.
The results of the study present the possibility of “removing” the auxiliary areas of the corset. This does not mean that their important roles, such as in stabilizing the corset relative to the torso, can be ignored. The auxiliary areas can be made much thinner and/or perforated. Such a change would improve the performance of the corset while keeping its corrective role unchanged.
The results suggest that the use of principal stress trajectories in the design of the orthosis plays a key role in tailoring its mechanical properties and weight. In light of these results, it can be shown that fine tuning the structure of the orthosis, especially along the principal stress trajectories, is critical to optimizing its mechanical properties and patient comfort. The detailed numerical analyses presented in Section 3 provide a new perspective on the potential evolution of brace design for the treatment of idiopathic scoliosis. These results underscore that orthotic design can be significantly altered without sacrificing its core corrective functionality. This revelation not only paves the way for more advanced and adaptable brace designs but also underscores the importance of a holistic, patient-centered approach to orthotic design.
One of the most important aspects of this research is the focus on the weight of the orthotic brace. Weight plays a multifaceted role in the overall effectiveness and patient acceptance of the brace. On a physical level, a lighter brace inherently provides greater comfort and reduces the wearer’s stress during extended periods of use. On a physiological level, the reduced surface area of the shell in direct contact with the torso promotes better gas and heat exchange, allowing that the wearer’s skin to breathe more effectively, reducing discomfort from heat and moisture accumulation. This is especially important for teens, an age group that often struggles with self-image issues. A less obtrusive and more comfortable brace can significantly reduce the psychological burden, leading to better compliance and consequently, more effective treatment results.

5. Conclusions

The numerical simulations of the stress distributions within the orthotic shell allowed the identification of the principal stress trajectories, thereby illuminating the flow of forces in a simple three-point compression orthosis. This led to the identification of shell regions critical for corrective action, allowing design modifications without altering the mechanical properties of the brace. The changes implemented resulted in a significant reduction in the weight of the brace while maintaining its corrective stiffness and reducing discomfort from heat and moisture accumulation. This study presents an innovative methodology for orthotic design and demonstrates that structural optimization based on the mapping of maximum principal stress trajectories can significantly improve orthotic functionality. The approach outlined here holds promise for future advancements in the design of various orthotic devices, thereby contributing to the advancement of the field.

Author Contributions

Conceptualization, S.G. and P.M.; methodology, S.G. and P.M.; software, S.G.; validation, S.G. and P.M.; formal analysis, S.G. and P.M.; investigation, S.G.; resources, S.G. and P.M.; data curation, S.G. and P.M.; writing—original draft preparation, S.G.; writing—review and editing, P.M.; visualization, S.G.; supervision, P.M.; project administration, S.G. and P.M.; funding acquisition, S.G. All authors have read and agreed to the published version of the manuscript.

Funding

ZIREG—Integrated Program of the Bialystok University of Technology for Regional Development (WNK/PR-BRPM/2023/00071).

Institutional Review Board Statement

Not applicable.

Informed Consent Statement

Not applicable.

Data Availability Statement

The data presented in this study are available on reasonable request from the corresponding author. The data are not publicly available due to privacy.

Conflicts of Interest

The authors declare no conflict of interest. The funders had no role in the design of the study; in the collection, analyses, or interpretation of data; in the writing of the manuscript, or in the decision to publish the results.

References

  1. Cobetto, N.; Aubin, C.E.; Parent, S.; Clin, J.; Barchi, S.; Turgeon, I.; Labelle, H. Effectiveness of Braces Designed Using Computer-Aided Design and Manufacturing (CAD/CAM) and Finite Element Simulation Compared to CAD/CAM Only for the Conservative Treatment of Adolescent Idiopathic Scoliosis: A Prospective Randomized Controlled Trial. Eur. Spine J. 2016, 25, 3056–3064. [Google Scholar] [CrossRef] [PubMed]
  2. Sanz-Pena, I.; Arachchi, S.; Halwala-Vithanage, D.; Mallikarachchi, S.; Kirumbara-Liyanage, J.; McGregor, A.; Silva, P.; Newell, N. Characterising the Mould Rectification Process for Designing Scoliosis Braces: Towards Automated Digital Design of 3D-Printed Braces. Appl. Sci. 2021, 11, 4665. [Google Scholar] [CrossRef]
  3. Grycuk, S.; Mrozek, P. Scoliosis Brace Finite Element Model and Preliminary Experimental Testing Using Electronic Speckle Pattern Interferometry. Appl. Sci. 2022, 12, 3876. [Google Scholar] [CrossRef]
  4. Ng, K.J.; Duke, K.; Lou, E. Investigation of Future 3D Printed Brace Design Parameters: Evaluation of Mechanical Properties and Prototype Outcomes. J. 3D Print. Med. 2019, 3, 171–184. [Google Scholar] [CrossRef]
  5. Liao, Y.-C.; Feng, C.-K.; Tsai, M.-W.; Chen, C.-S.; Cheng, C.-K.; Ou, Y.-C. Shape Modification of the Boston Brace Using a Finite-Element Method With Topology Optimization. Spine 2007, 32, 3014–3019. [Google Scholar] [CrossRef] [PubMed]
  6. Weiss, H.-R.; Kleban, A. Development of CAD/CAM Based Brace Models for the Treatment of Patients with Scoliosis-Classification Based Approach versus Finite Element Modelling. Asian Spine J. 2015, 9, 661–668. [Google Scholar] [CrossRef]
  7. Cobetto, N.; Aubin, C.-É.; Parent, S.; Barchi, S.; Turgeon, I.; Labelle, H. 3D Correction of AIS in Braces Designed Using CAD/CAM and FEM: A Randomized Controlled Trial. Scoliosis 2017, 12, 24. [Google Scholar] [CrossRef] [PubMed]
  8. Chung, C.L.; Kelly, D.M.; Steele, J.R.; DiAngelo, D.J. A Mechanical Analog Thoracolumbar Spine Model for the Evaluation of Scoliosis Bracing Technology. J. Rehabil. Assist. Technol. Eng. 2018, 5, 1–9. [Google Scholar] [CrossRef] [PubMed]
  9. Rigo, M.; Jelačić, M. Brace Technology Thematic Series: The 3D Rigo Chêneau-Type Brace. Scoliosis 2017, 12, 10. [Google Scholar] [CrossRef] [PubMed]
  10. Clin, J.; Aubin, C.-É.; Parent, S.; Labelle, H. Biomechanical Modeling of Brace Treatment of Scoliosis: Effects of Gravitational Loads. Med. Biol. Eng. Comput. 2011, 49, 743–753. [Google Scholar] [CrossRef] [PubMed]
  11. Périé, D.; Aubin, C.E.; Lacroix, M.; Lafon, Y.; Labelle, H. Biomechanical Modelling of Orthotic Treatment of the Scoliotic Spine Including a Detailed Representation of the Brace-Torso Interface. Med. Biol. Eng. Comput. 2004, 42, 339–344. [Google Scholar] [CrossRef] [PubMed]
  12. Kajaks, J.; Kalnins, K.; Uzulis, S.; Matvejs, J. Physical and Mechanical Properties of Composites Based on Polypropylene and Timber Industry Waste. Open Eng. 2014, 4, 385–390. [Google Scholar] [CrossRef]
  13. Weiss, H.-R.; Tournavitis, N.; Nan, X.; Borysov, M.; Paul, L. Workflow of CAD/CAM Scoliosis Brace Adjustment in Preparation Using 3D Printing. Open Med. Inform. J. 2017, 11, 44–51. [Google Scholar] [CrossRef] [PubMed]
  14. Khlif, M.; Masmoudi, N.; Bradai, C. Polypropylene Tensile Test under Dynamic Loading. J. KONES 2014, 21, 132–138. [Google Scholar] [CrossRef]
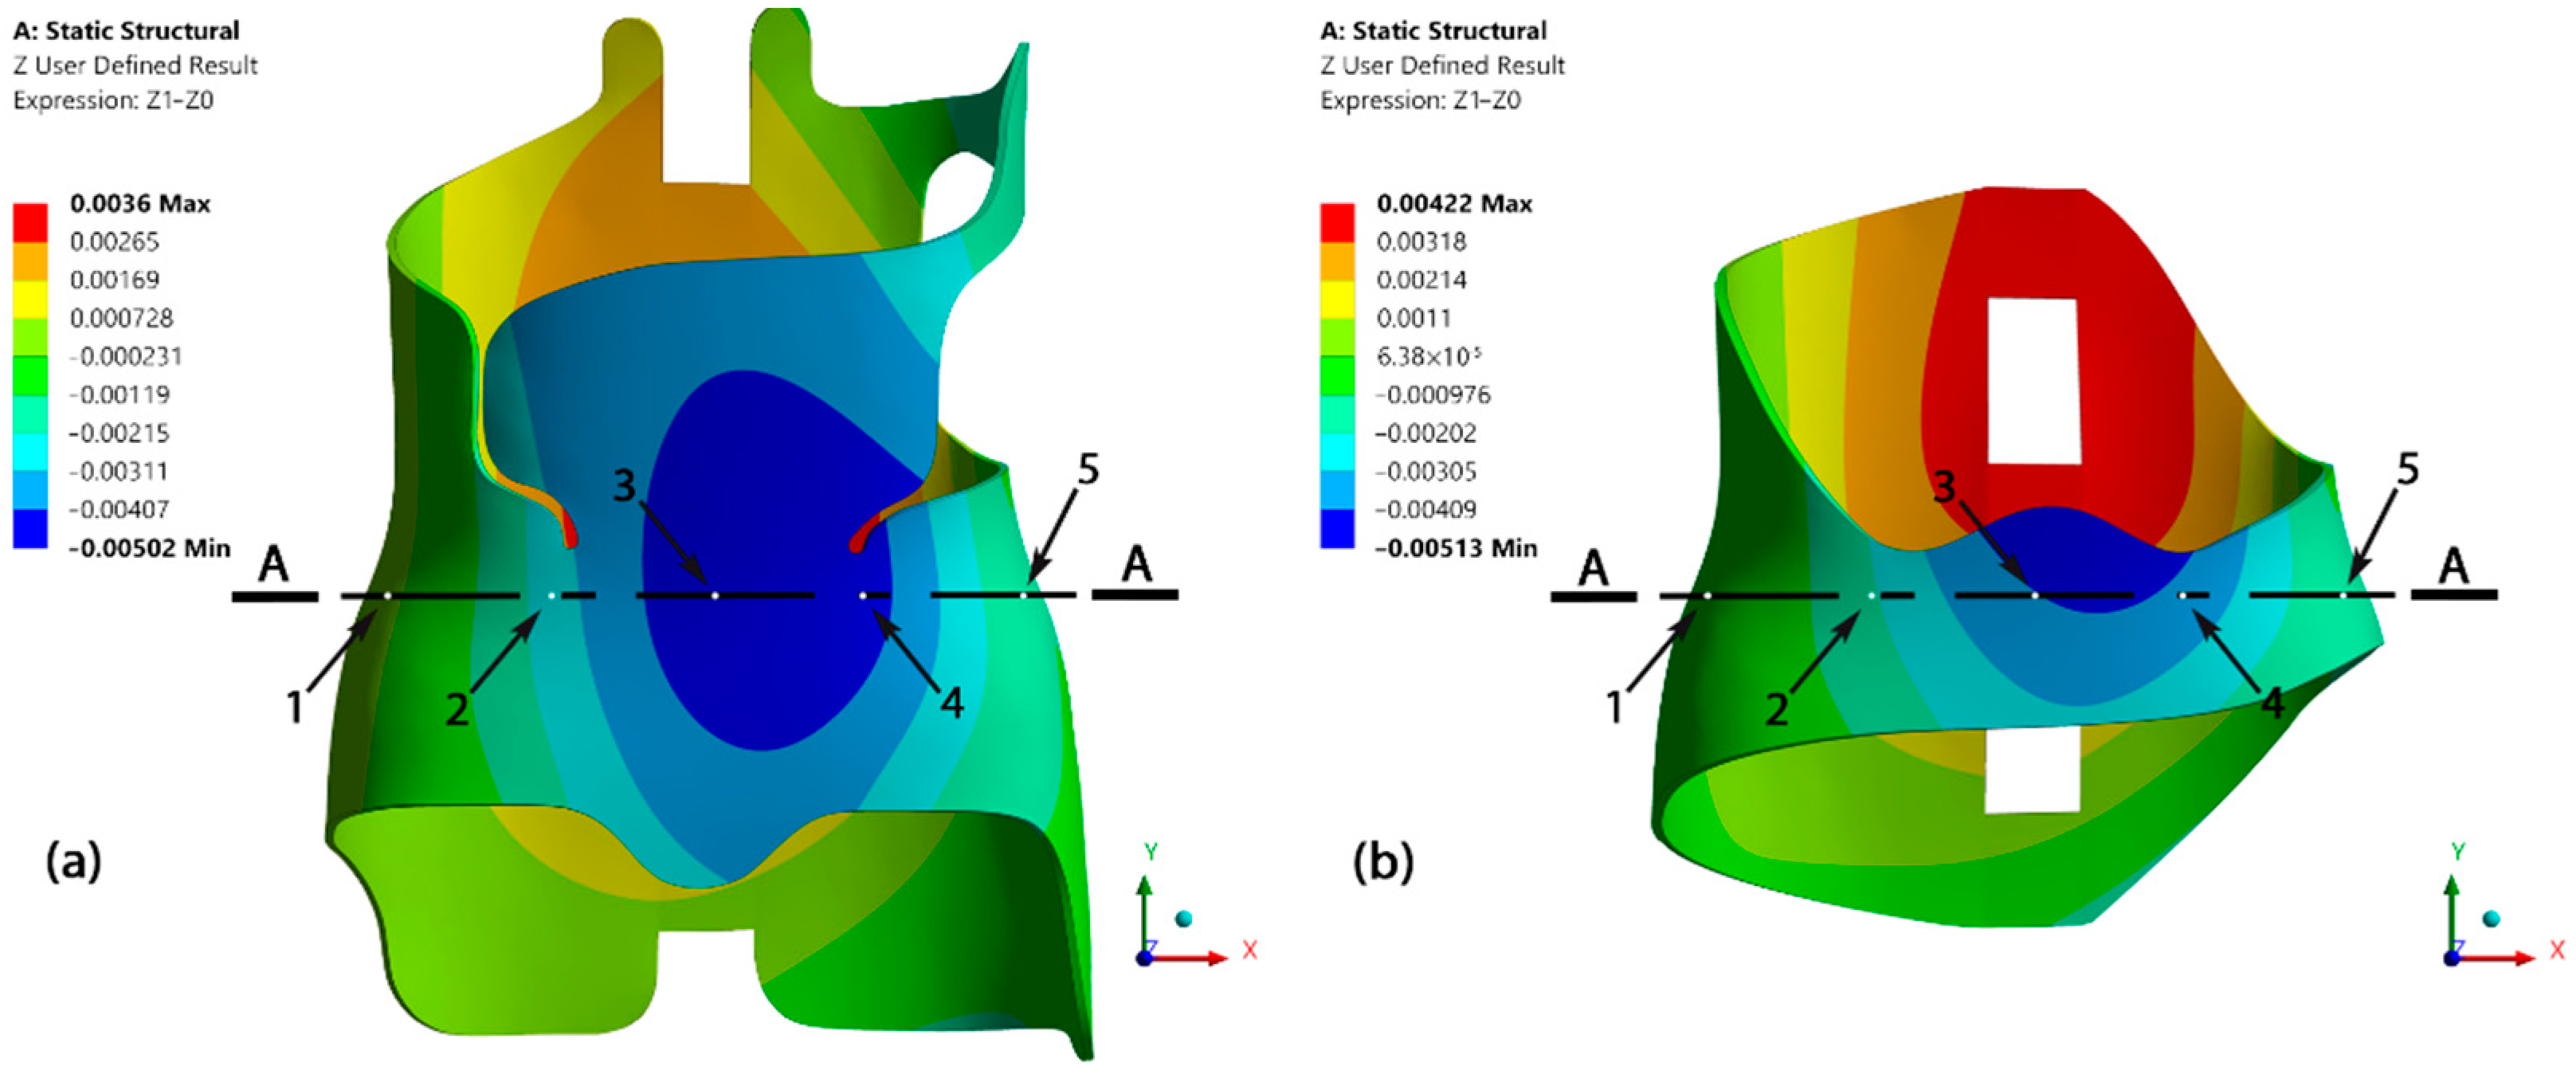
Figure 1. Diagram of the Boston brace for the left lumbar and a right thoracic curve pattern with forces applied.
Applsci 13 13273 g001
Figure 2. von Mises stress distributions in the corset shell under corrective loading.
Applsci 13 13273 g002
Figure 3. Principal stress σ1 trajectories (solid lines) for the corset shown in Figure 2; the outline of the modified corset shell is marked with a dashed line.
Applsci 13 13273 g003
Figure 4. von Mises stress distributions in the modified corset shell under corrective loading.
Applsci 13 13273 g004
Figure 5. Principal stress σ1 trajectories for the modified corset shell.
Applsci 13 13273 g005
Figure 6. Comparison of the distribution of displacements along the Z axis in the (a) original and (b) modified corset. Points 1 to 5 correspond to the measured points in the comparative verification shown in Table 1.
Applsci 13 13273 g006
Figure 7. Distribution of displacements along the Z axis in all corset variants: (a) original, (b) modified corset, (c) openwork corset variant A, (d) openwork corset variant B, and (e) openwork corset variant C. The cross-sectional lines A–A, which correspond to the transverse plane, are plotted in the figures.
Applsci 13 13273 g007
Figure 8. Comparison of displacement distribution at a 10× scale in the same cross-section, A–A, in all corsets: gray line—original corset not subjected to corrective loads. Corsets subjected to corrective loads: black line—original corset; green line—modified corset; blue line—openwork corset variant A; red line—openwork corset variant B; yellow line—openwork corset variant C.
Applsci 13 13273 g008
Figure 9. View of the maximum principal stress distribution of the (a) original corset, (b) modified corset, (c) openwork corset variant A, (d) openwork corset variant B, and (e) openwork corset variant C. The cross-sectional lines A–A, which correspond to the transverse plane, are plotted in the figures.
Applsci 13 13273 g009
Figure 10. View of the von Mises stress distributions on the surfaces of the (a) original corset, (b) modified corset, (c) openwork corset variant A, (d) openwork corset variant B, and (e) openwork corset variant C.
Applsci 13 13273 g010
Table 1. Comparison of displacement distributions along the Z axis for points in the cross-sectional lines A-A shown in Figure 6.
Corset VariantPoint 1 (mm)Point 2 (mm)Point 3 (mm)Point 4 (mm)Point 5 (mm)
Original brace−0.0001−0.0026−0.0044−0.0042−0.0016
Modified brace−0.0003−0.0019−0.0040−0.0037−0.0015
Table 2. Comparison of masses of corset shells and their maximum displacements in the X direction after force F2 has been applied.
Corset VariantMass (g)ΔX Max (µm)
Original brace8957.1
Modified brace5247.0
Openwork corset variant A5327.1
Openwork corset variant B4977.8
Openwork corset variant C4827.8
Disclaimer/Publisher’s Note: The statements, opinions and data contained in all publications are solely those of the individual author(s) and contributor(s) and not of MDPI and/or the editor(s). MDPI and/or the editor(s) disclaim responsibility for any injury to people or property resulting from any ideas, methods, instructions or products referred to in the content.

