
Determination of Critical Moisture Content Facing Walnut Shell Breaking and Optimization of Combined Hot Air and Microwave Vacuum Drying Process

 ,
,
Abstract
:1. Introduction
2. Materials and Methods
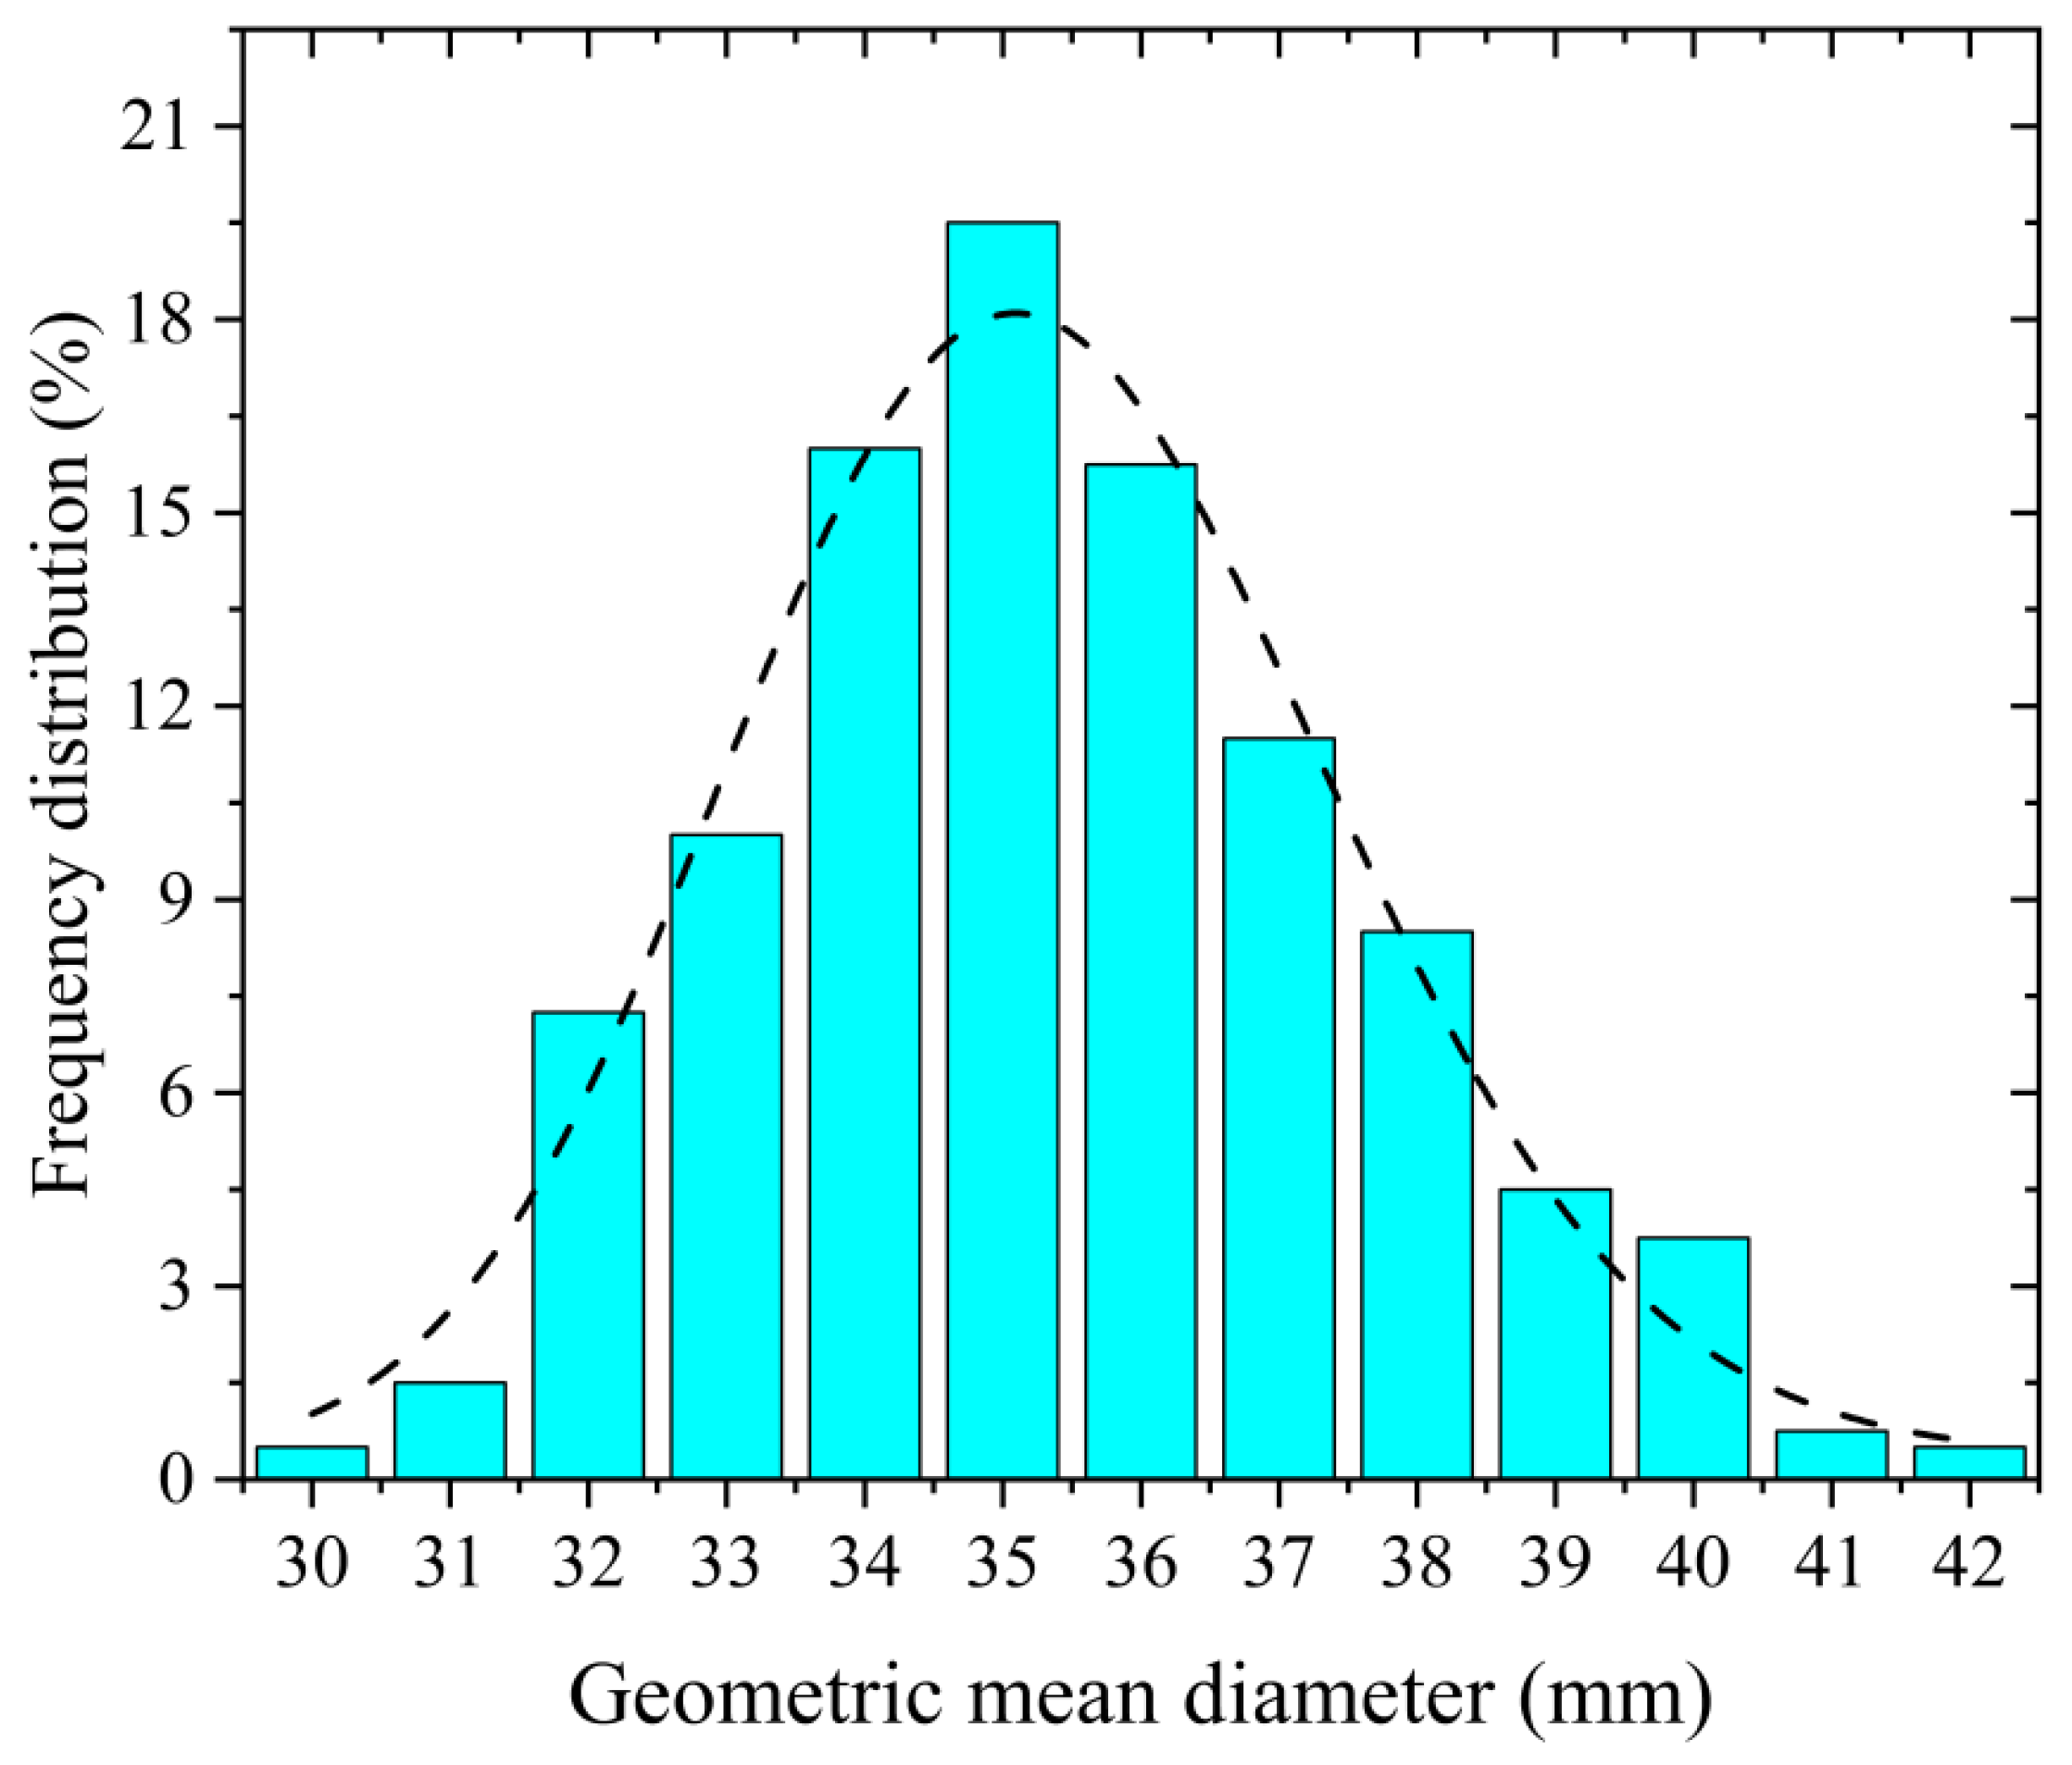
2.1. Sample
2.2. Crushing Experiment
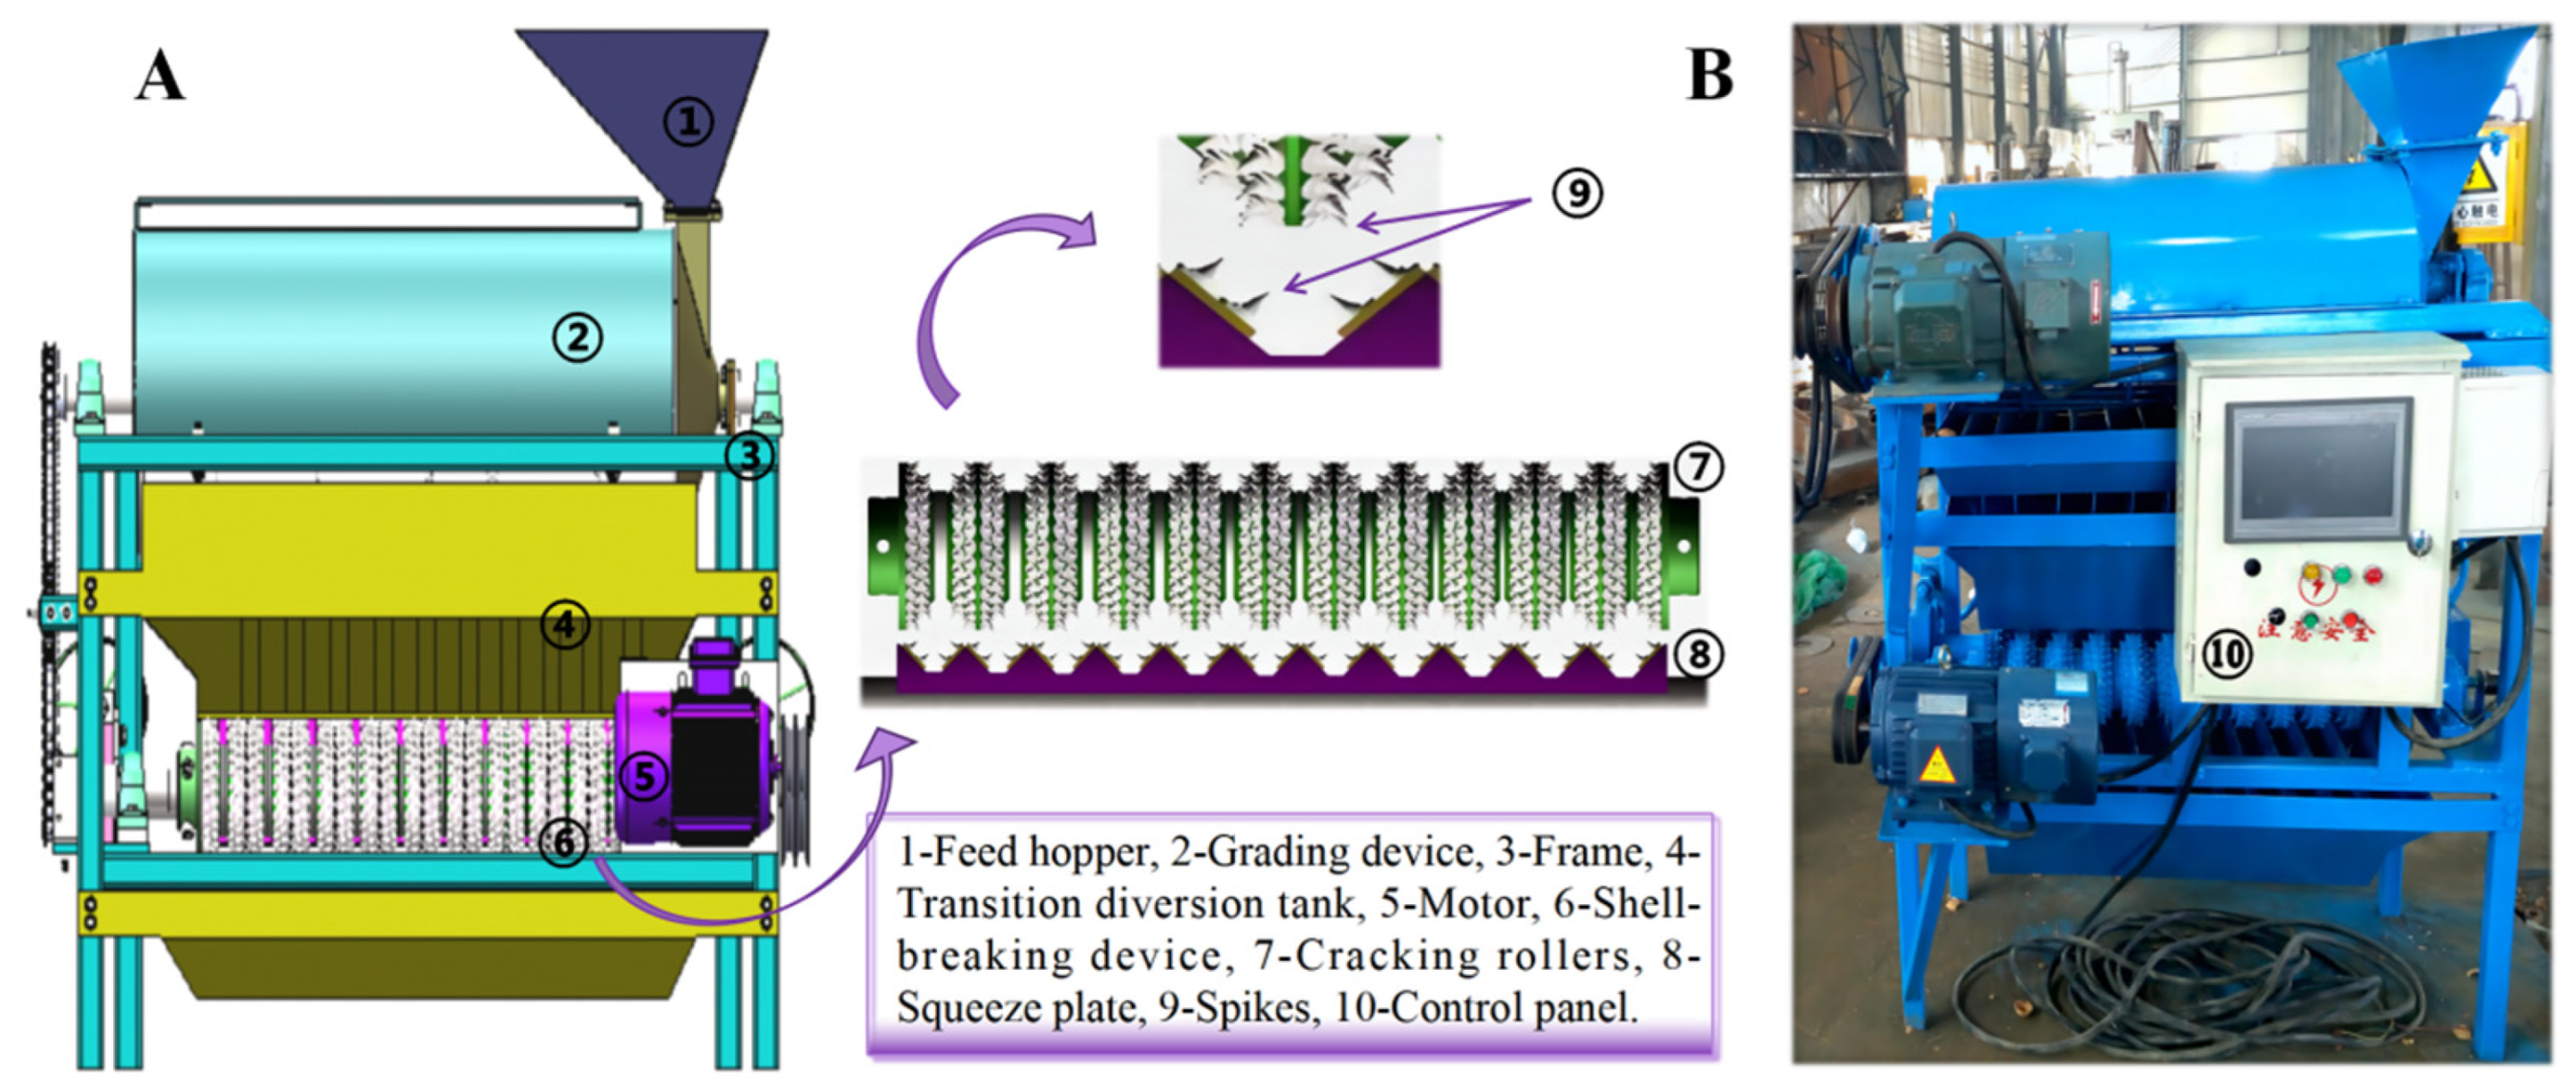
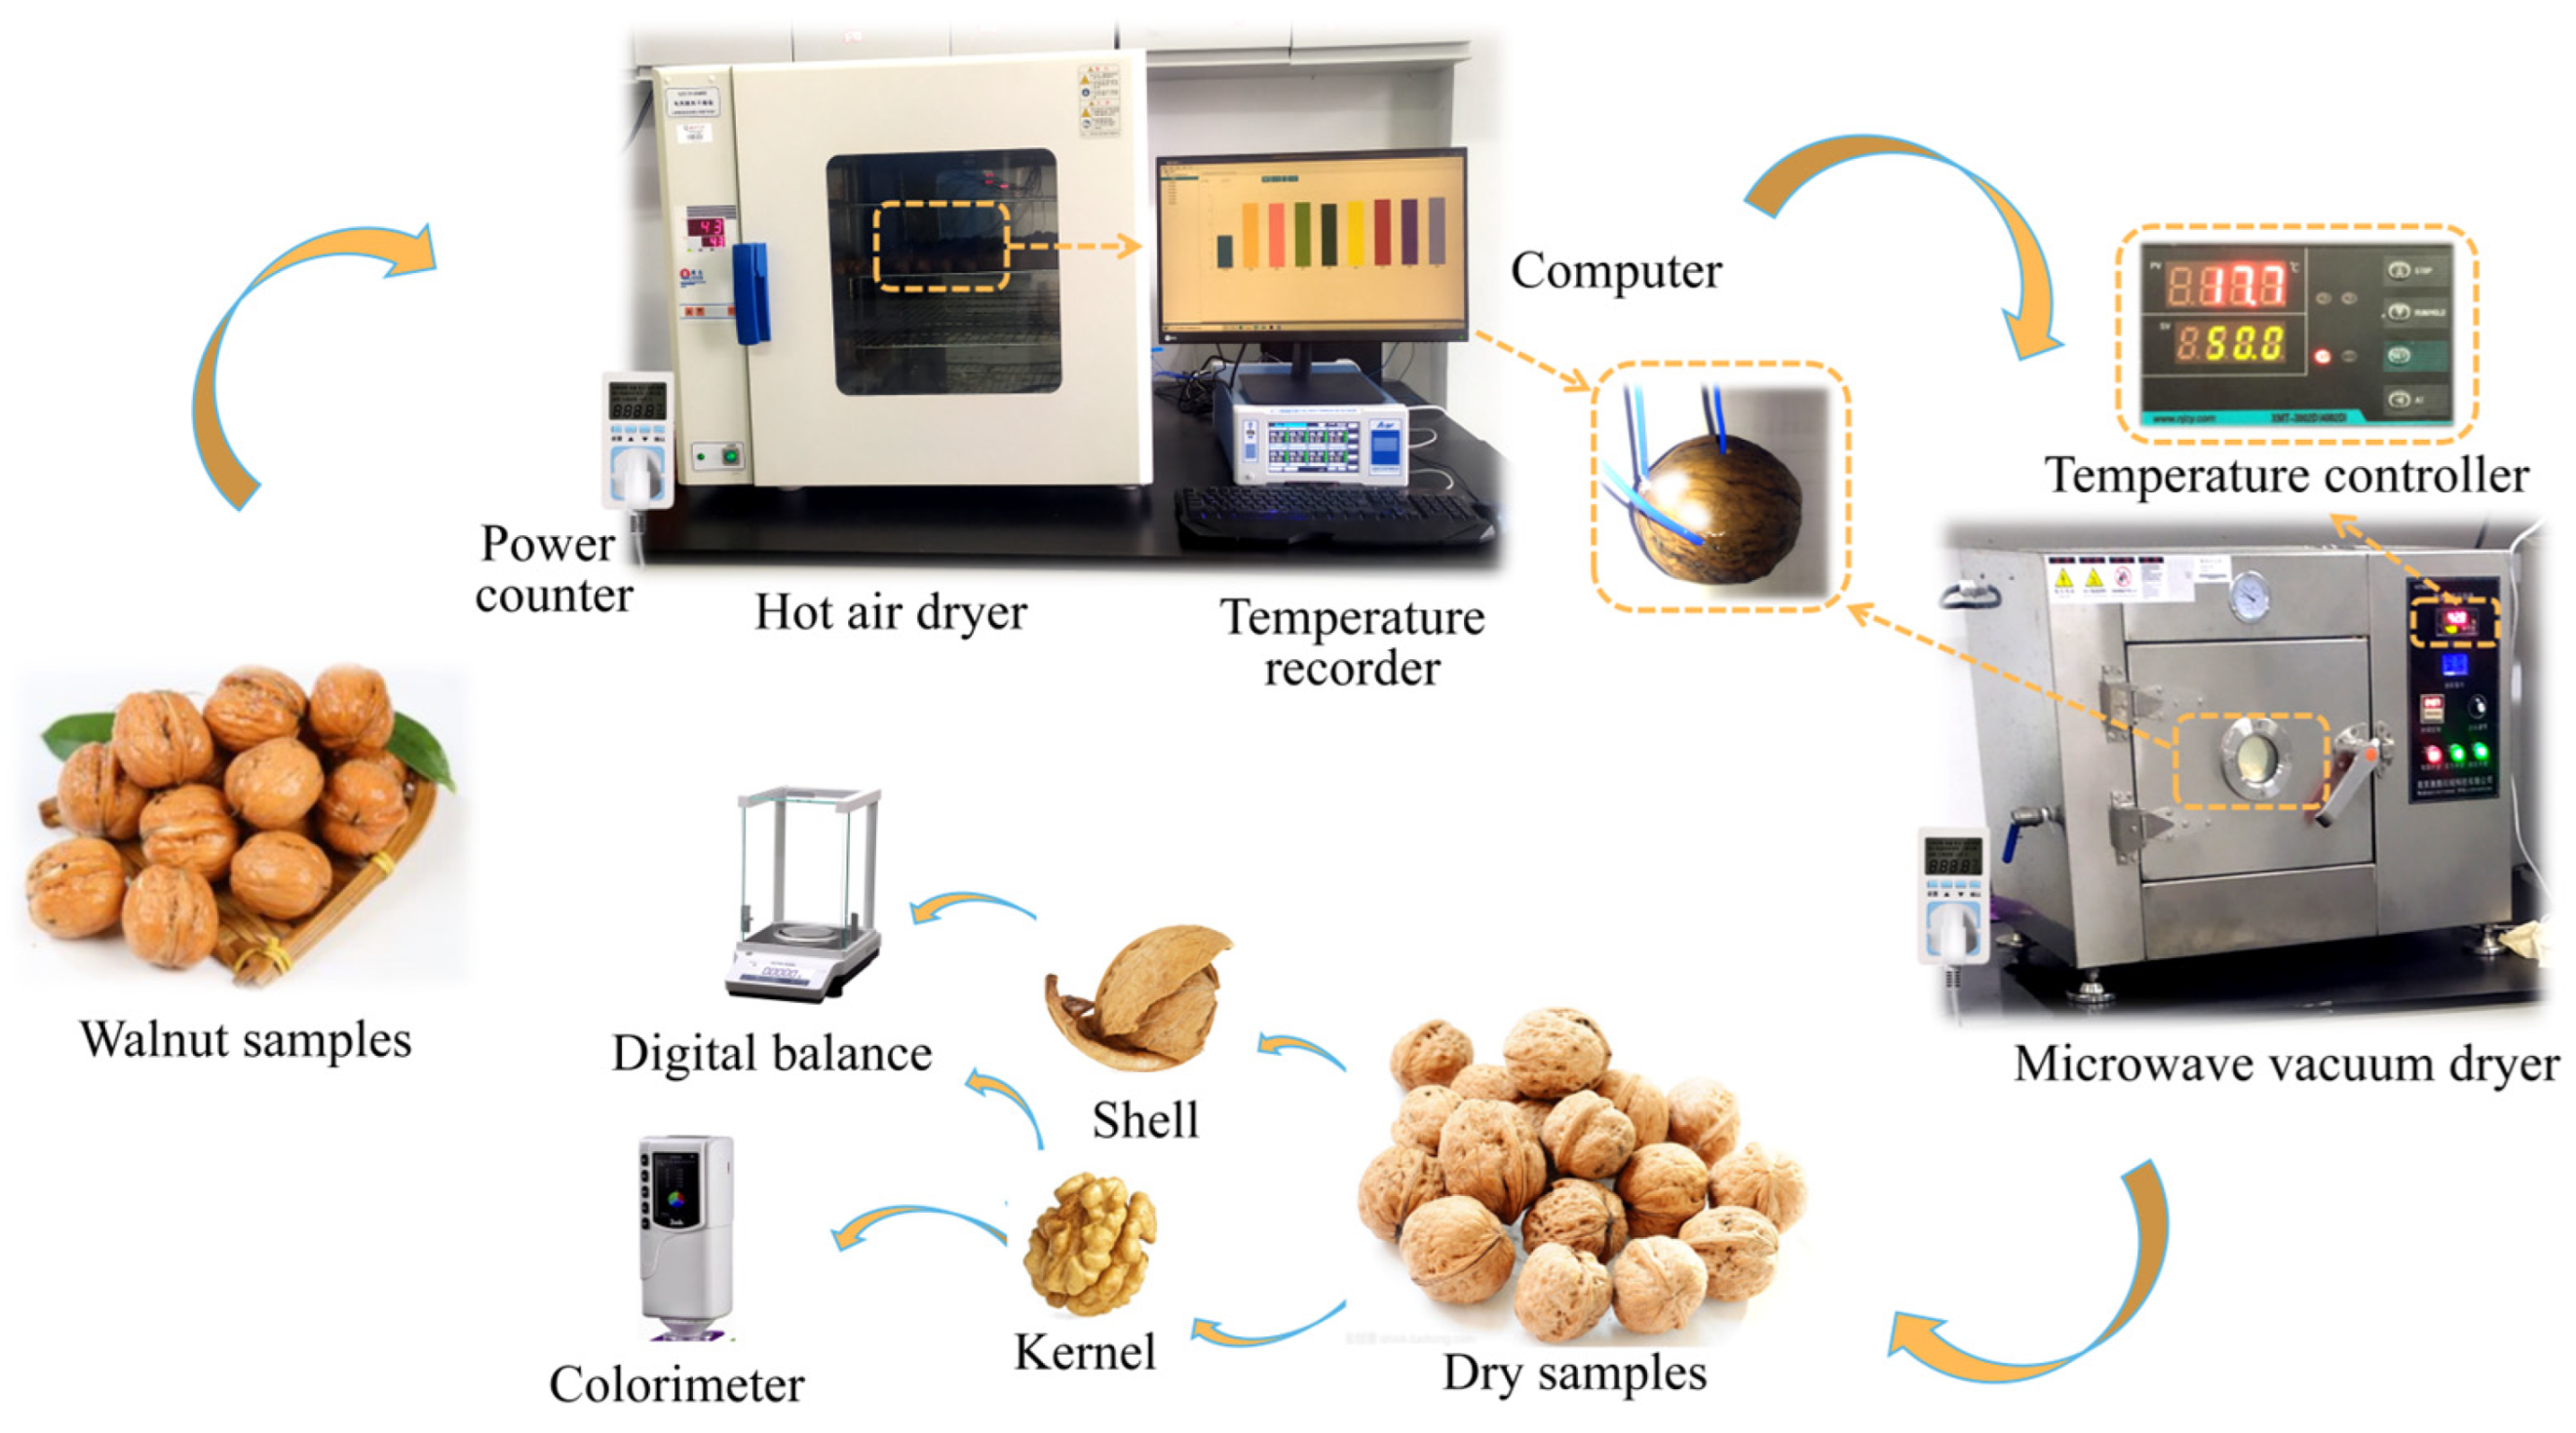
2.2.1. Experimental Equipment and Methods
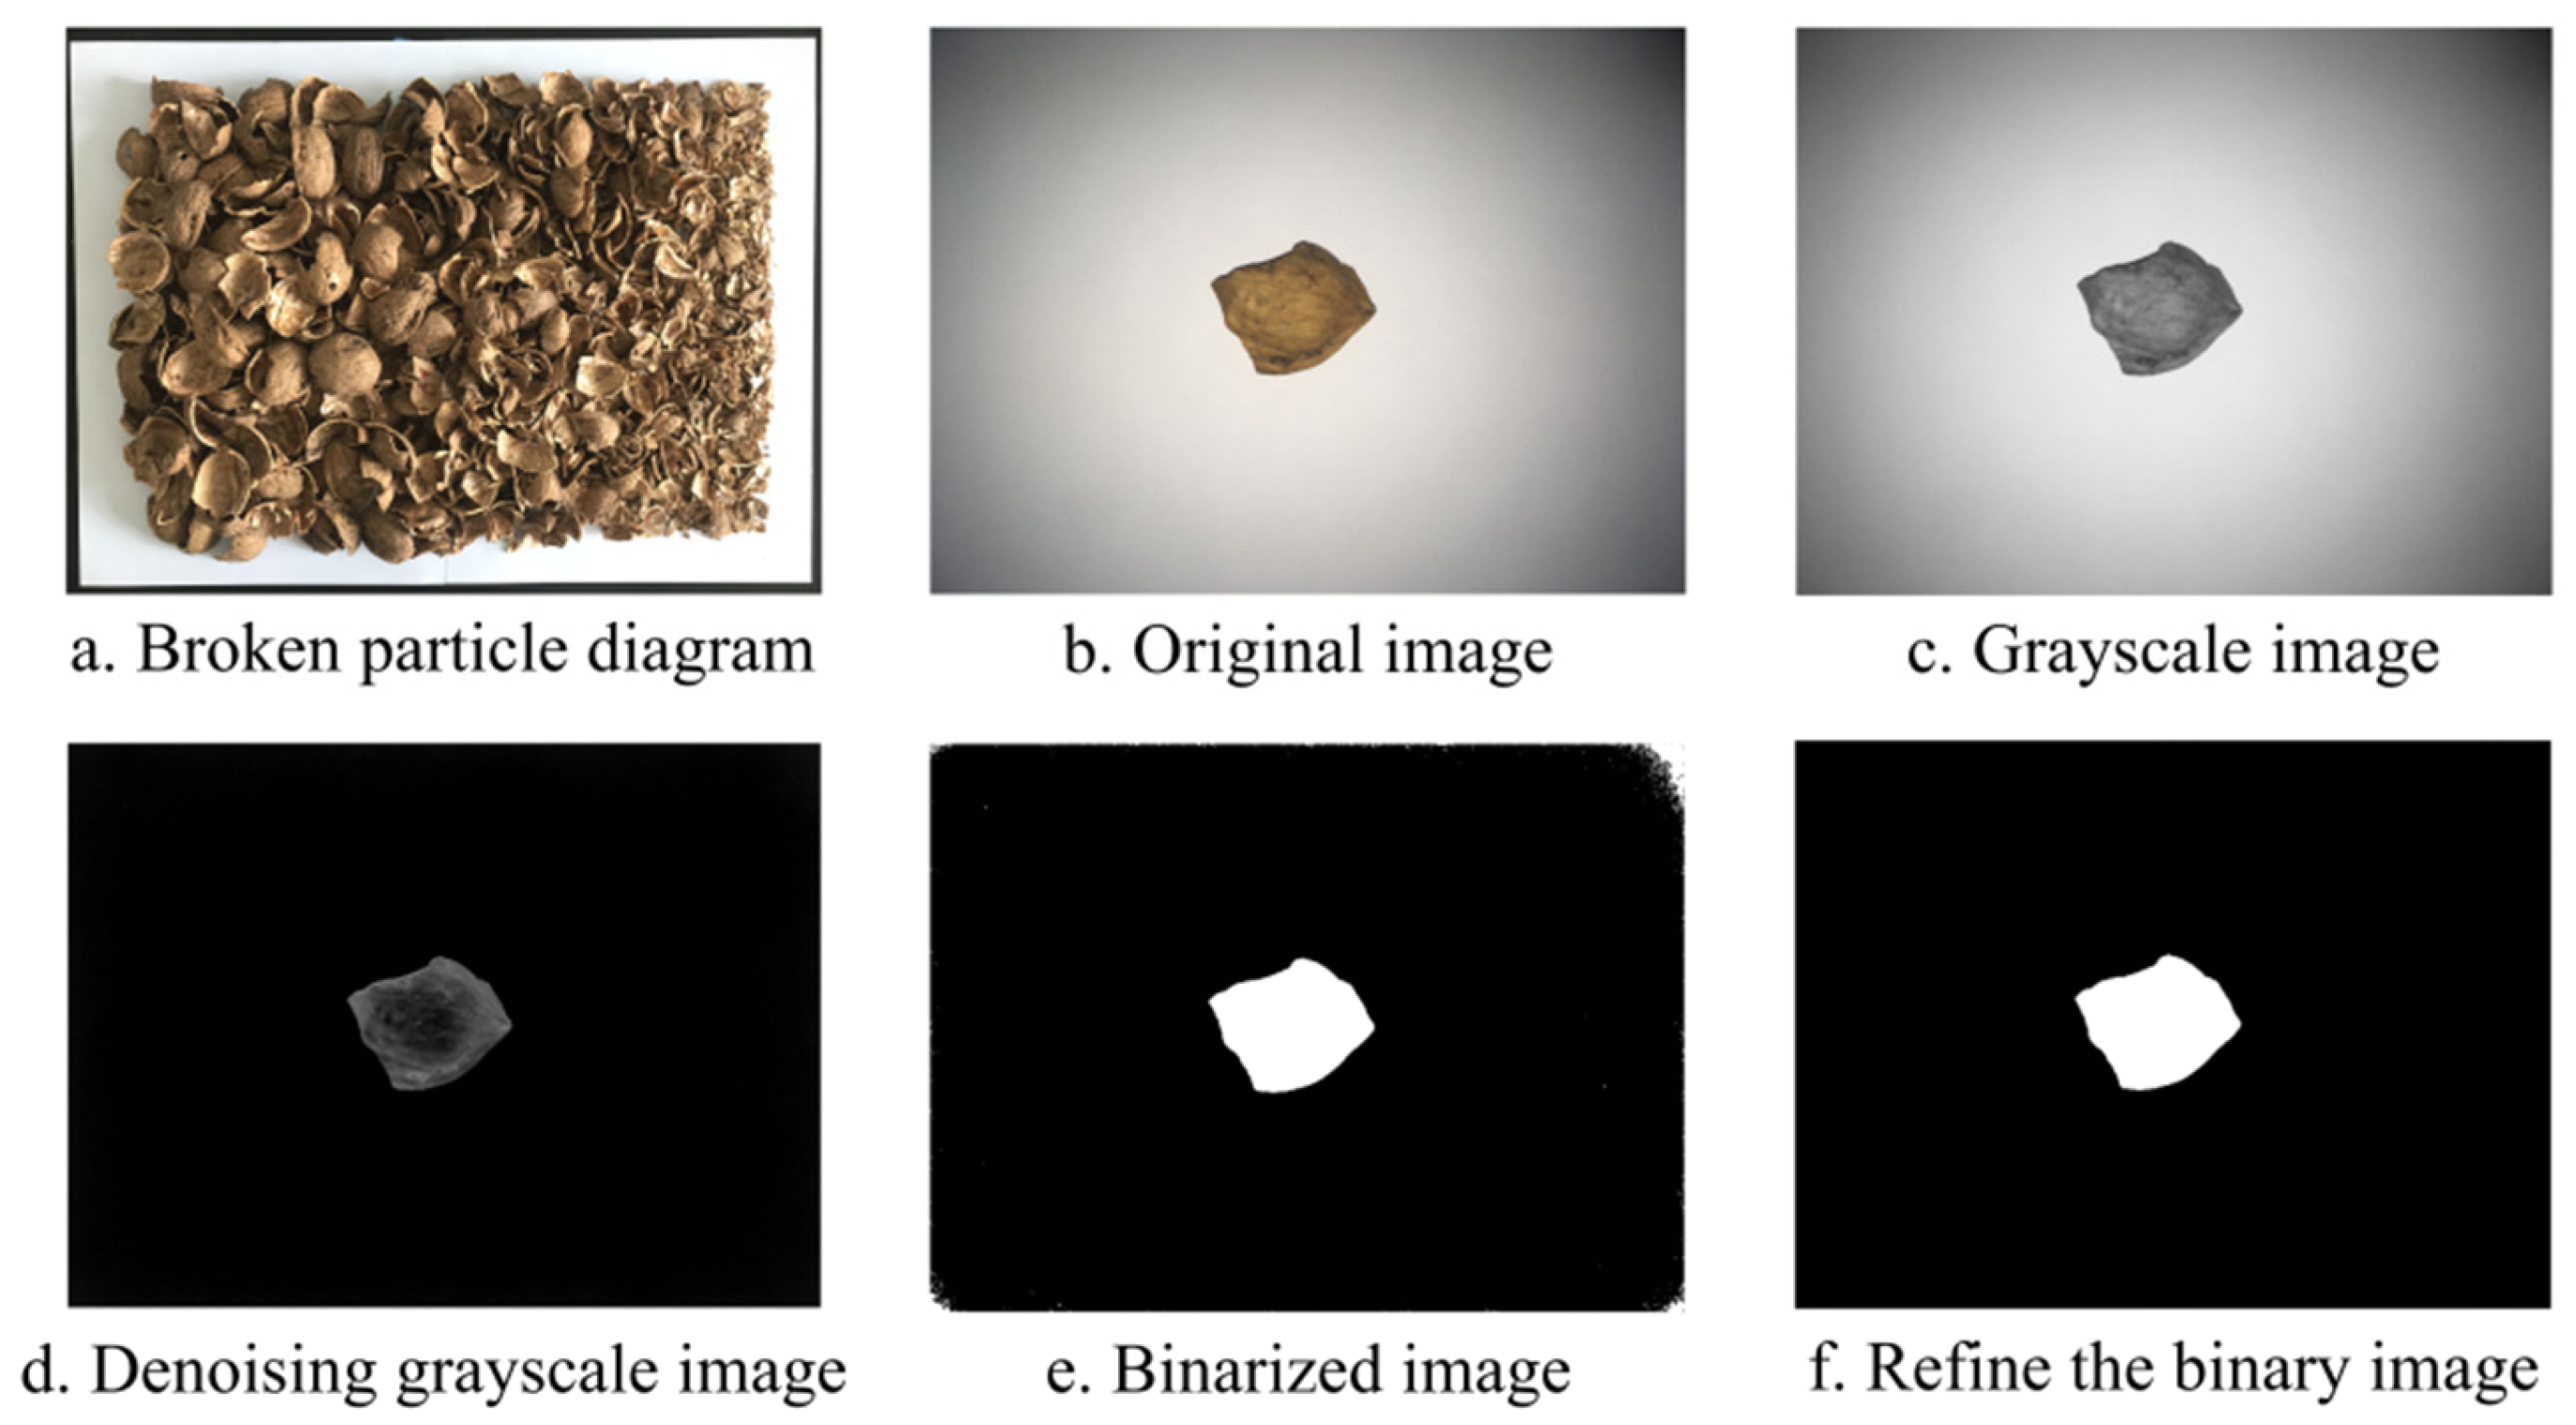
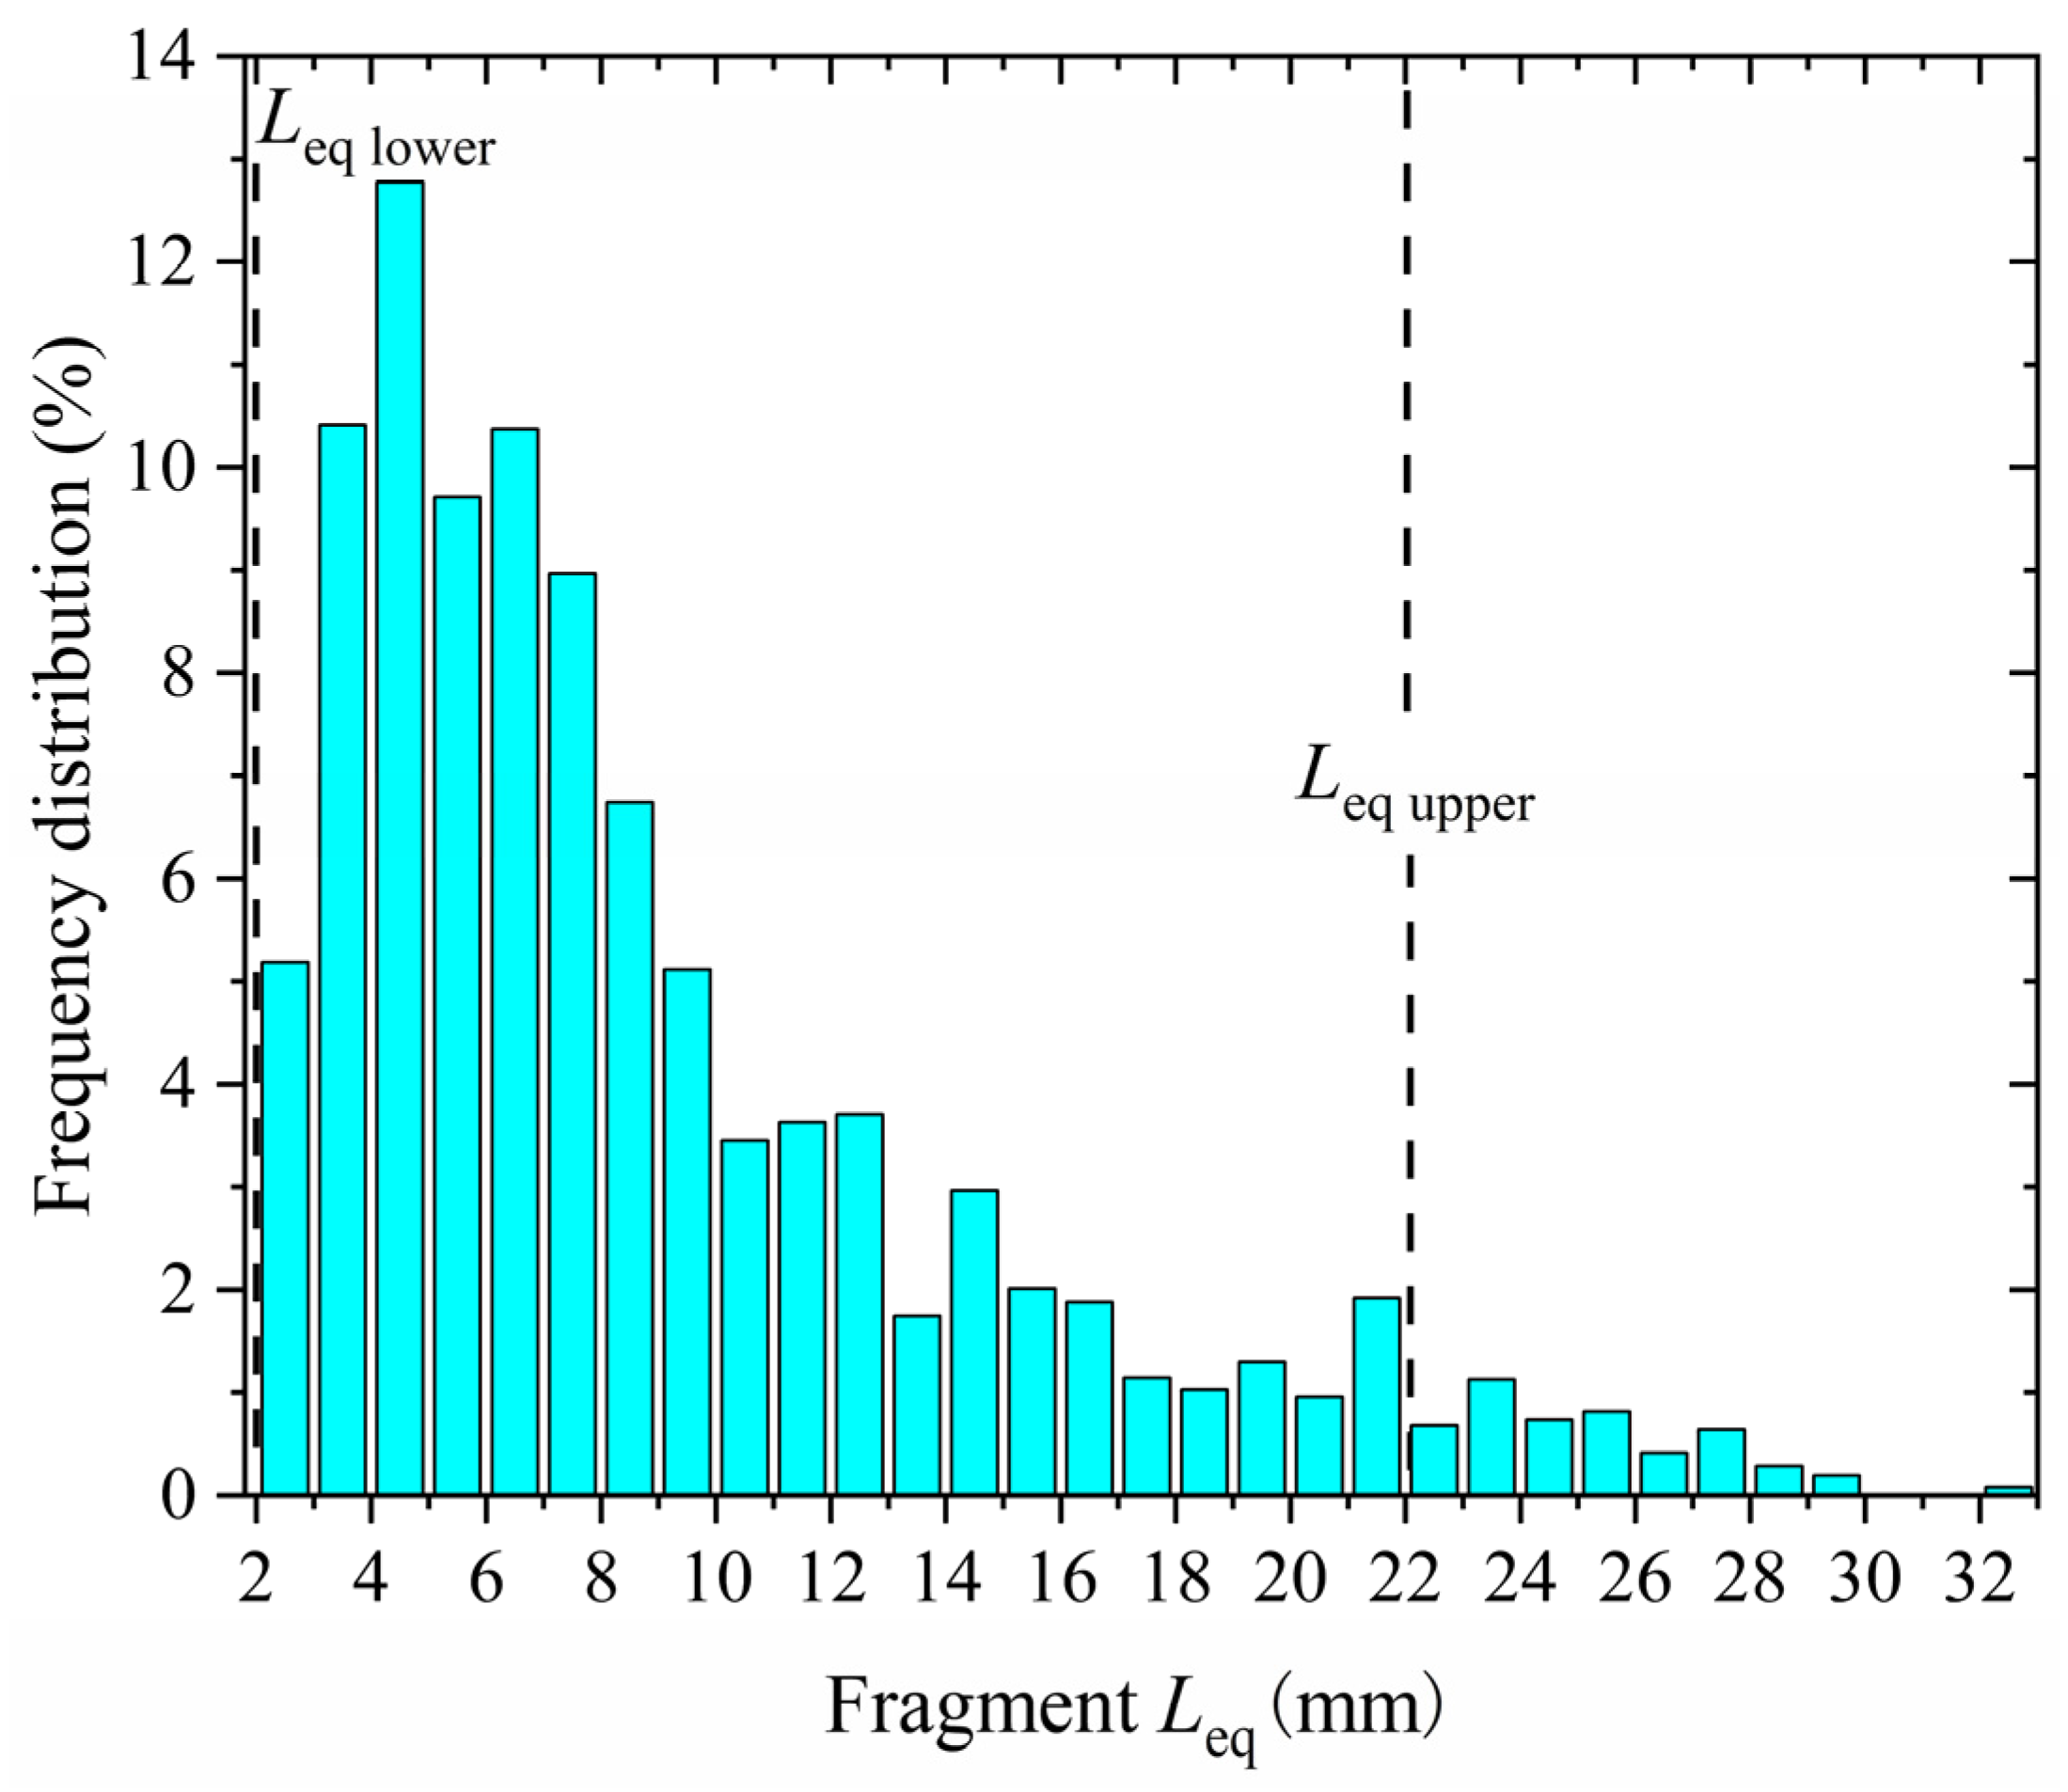
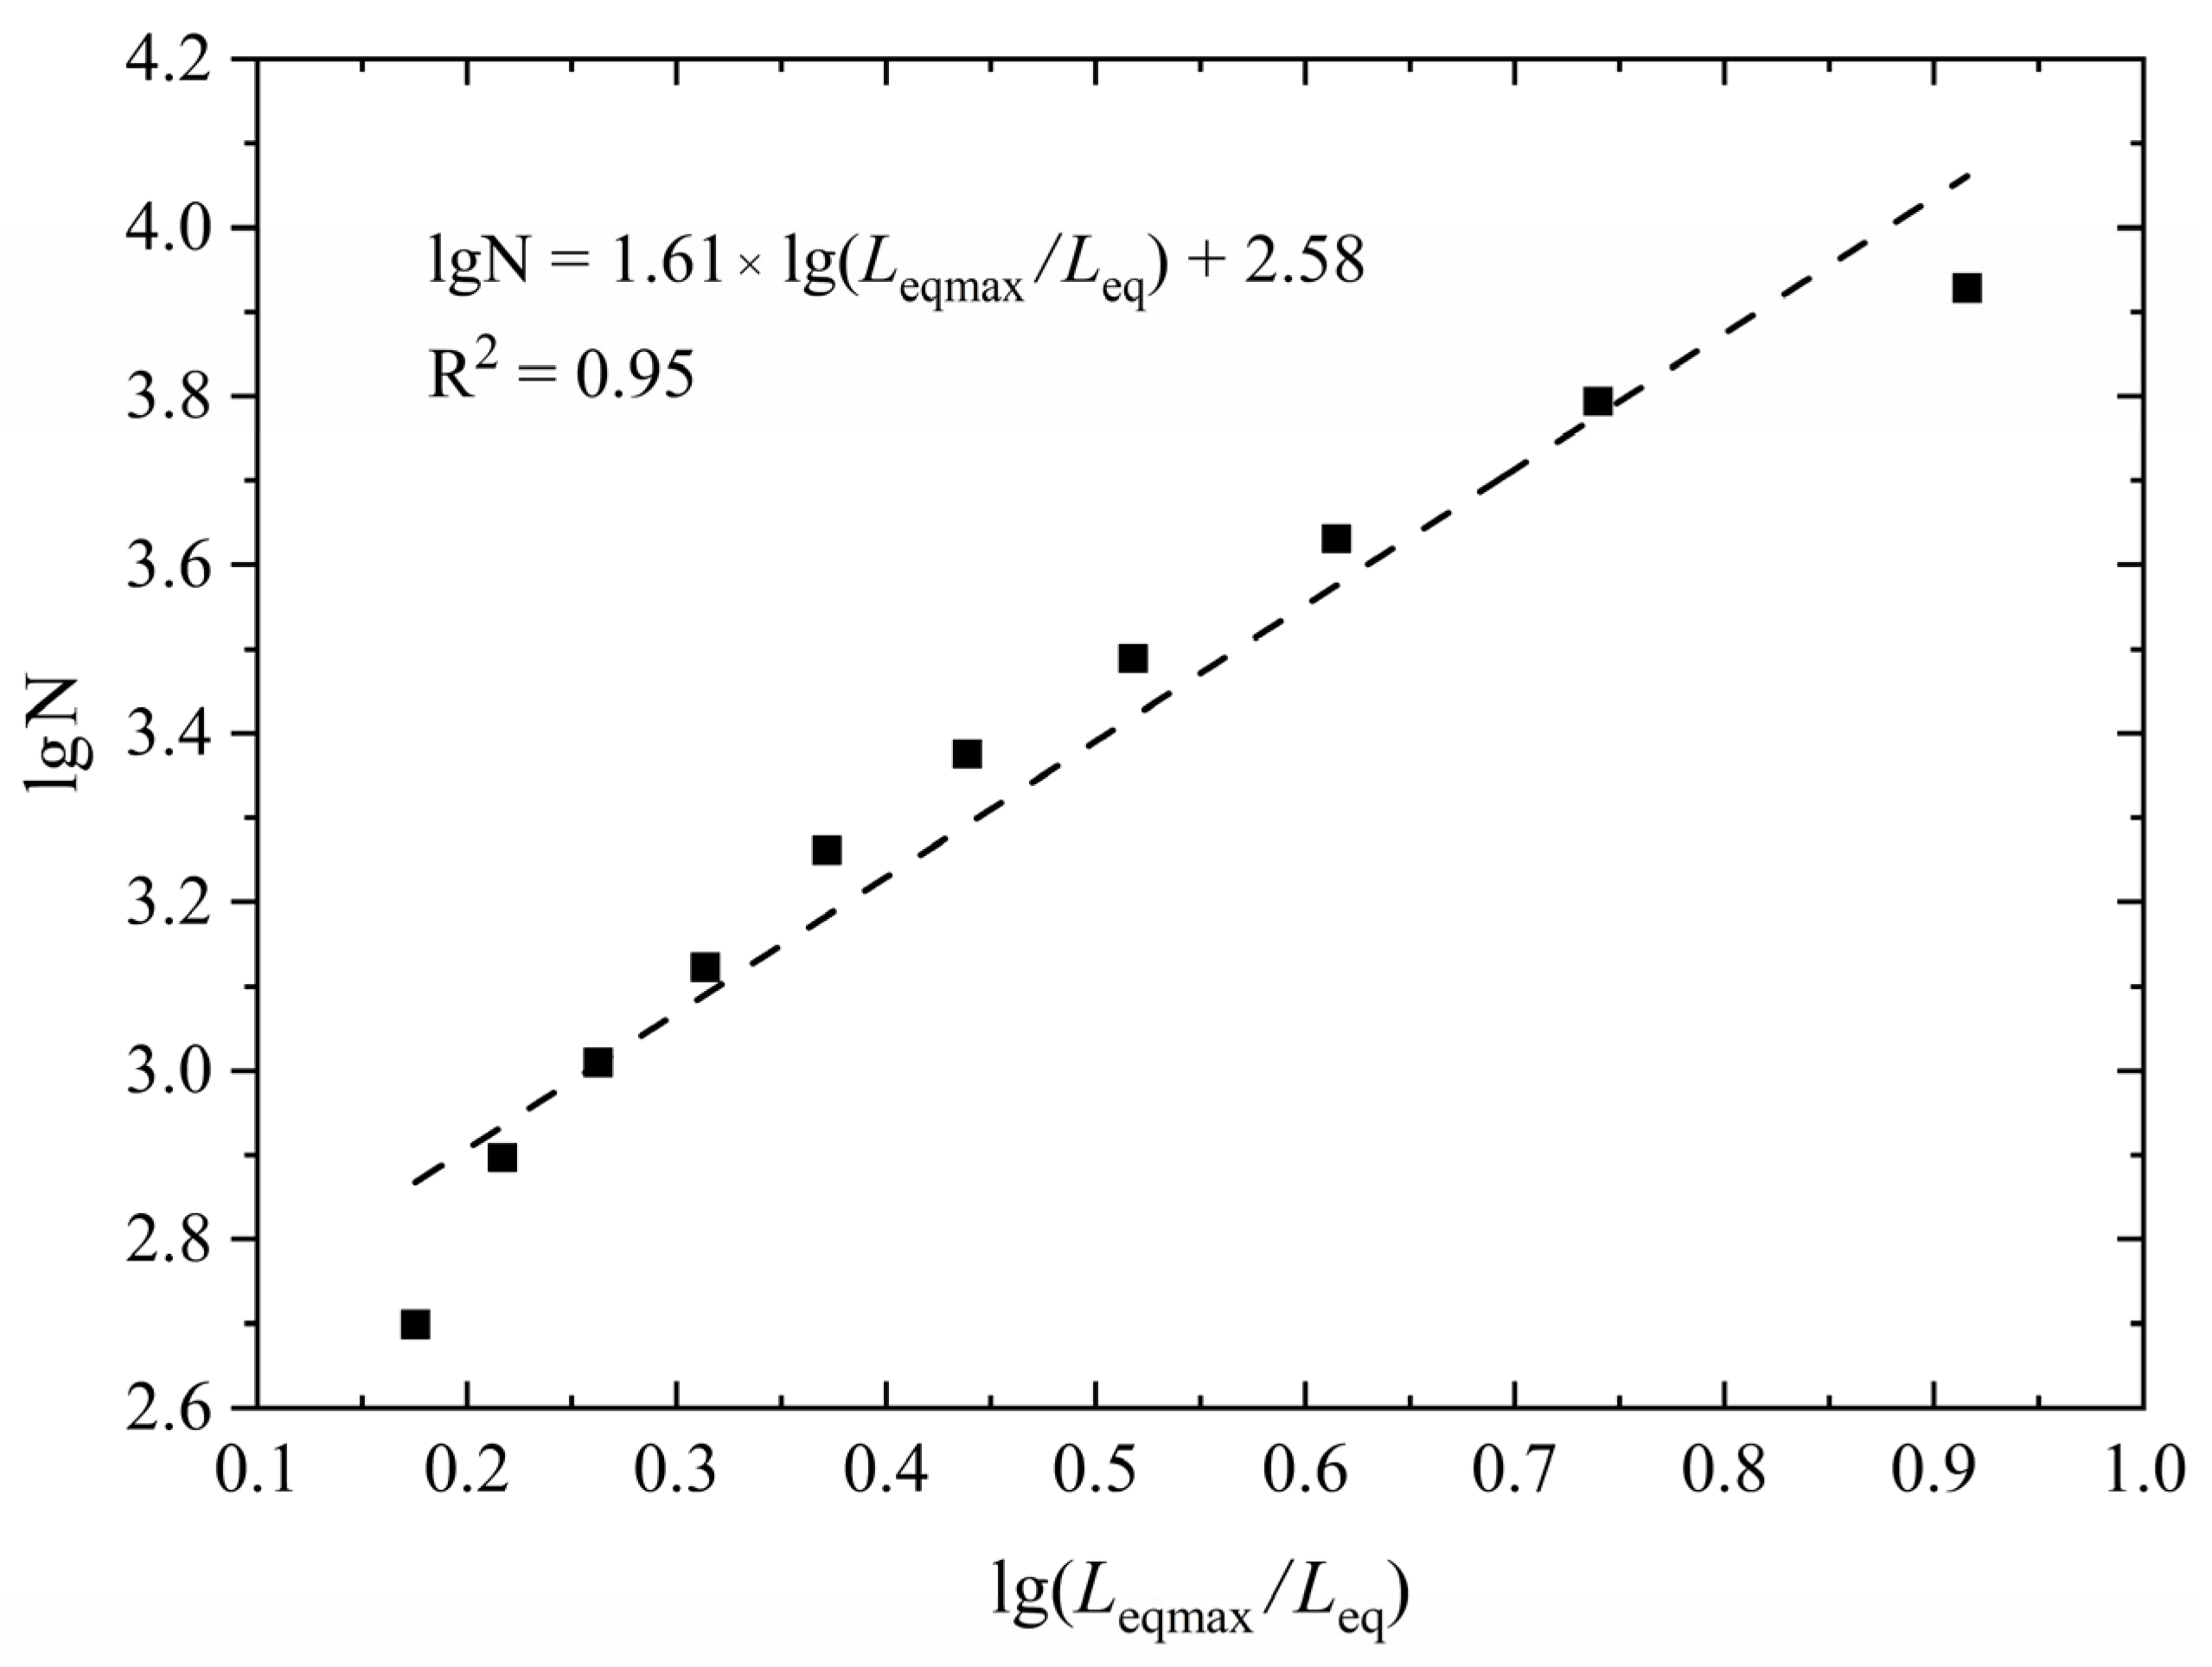
2.2.2. Quantitative Evaluation Indicators for the Degree of Fragmentation
- (1)
- Quantitative evaluation indicators for the degree of shell fragmentation
- (2)
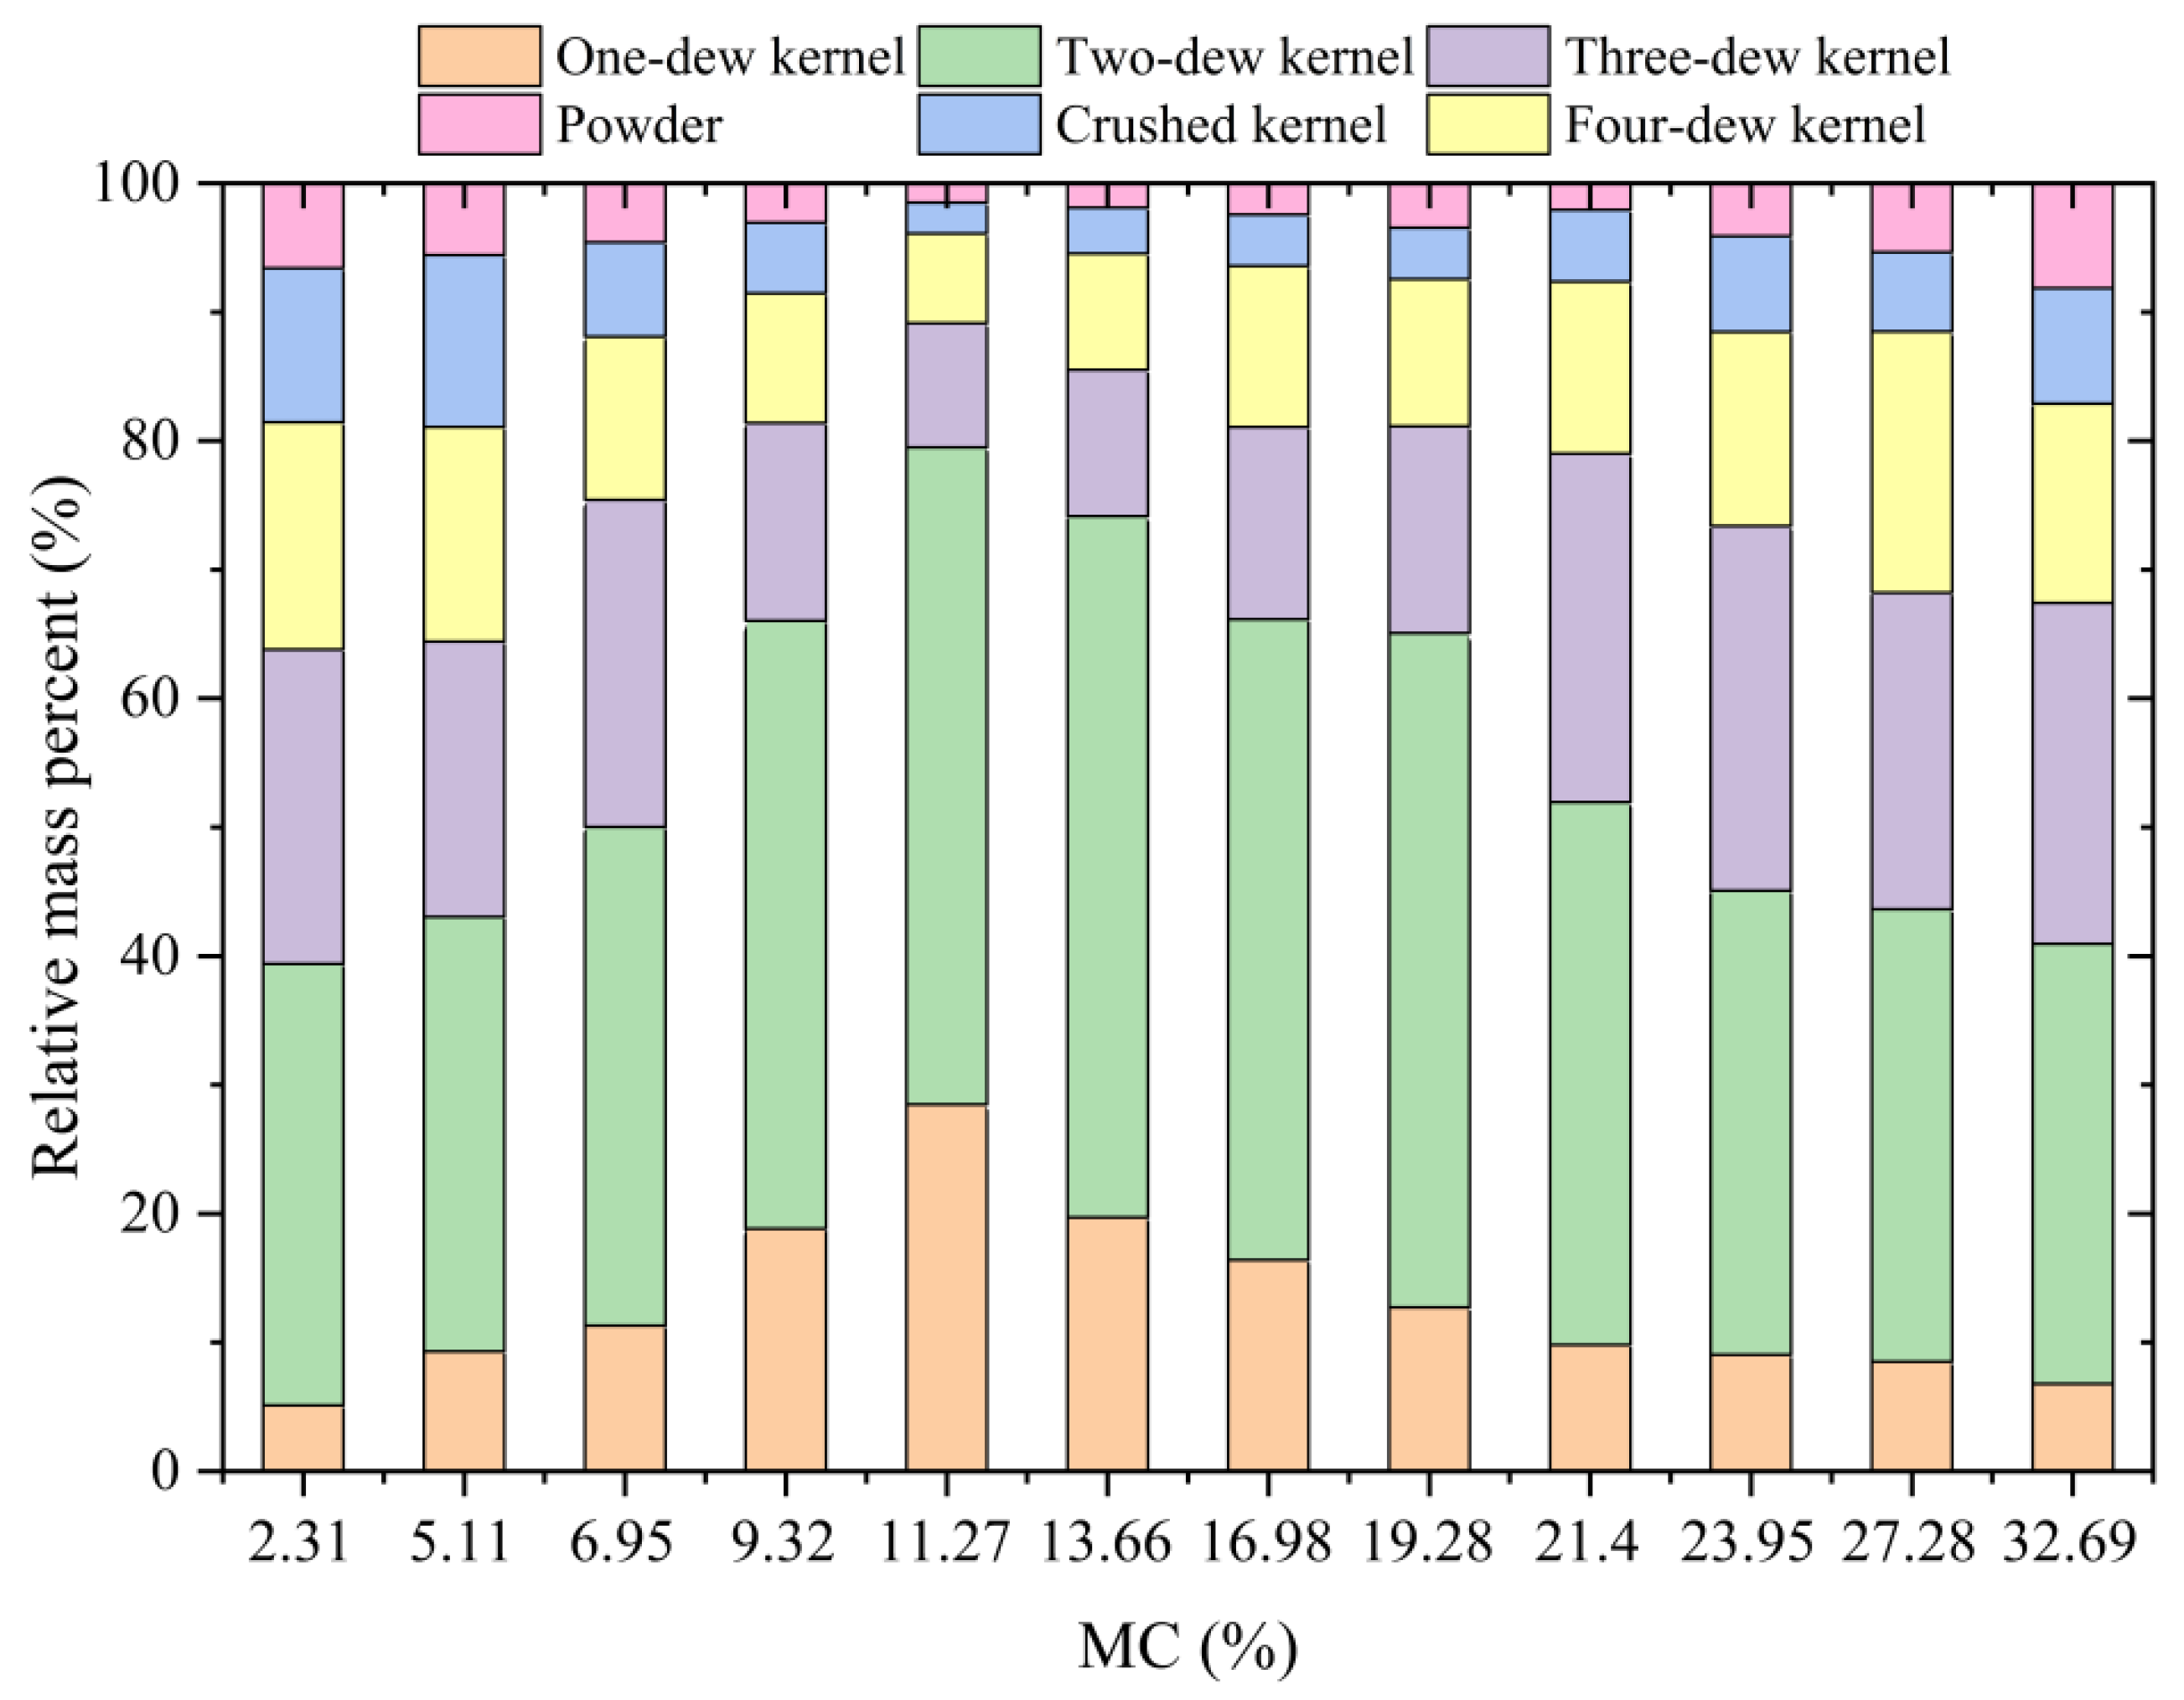
- Quantitative evaluation indicators for the degree of kernel fragmentation
2.3. Drying Process Optimization Test
2.3.1. Experimental Apparatus and Methods
2.3.2. Test Index and Measurement Method
2.3.3. Experimental Design, Statistical Analysis and Optimization
3. Results and Discussion
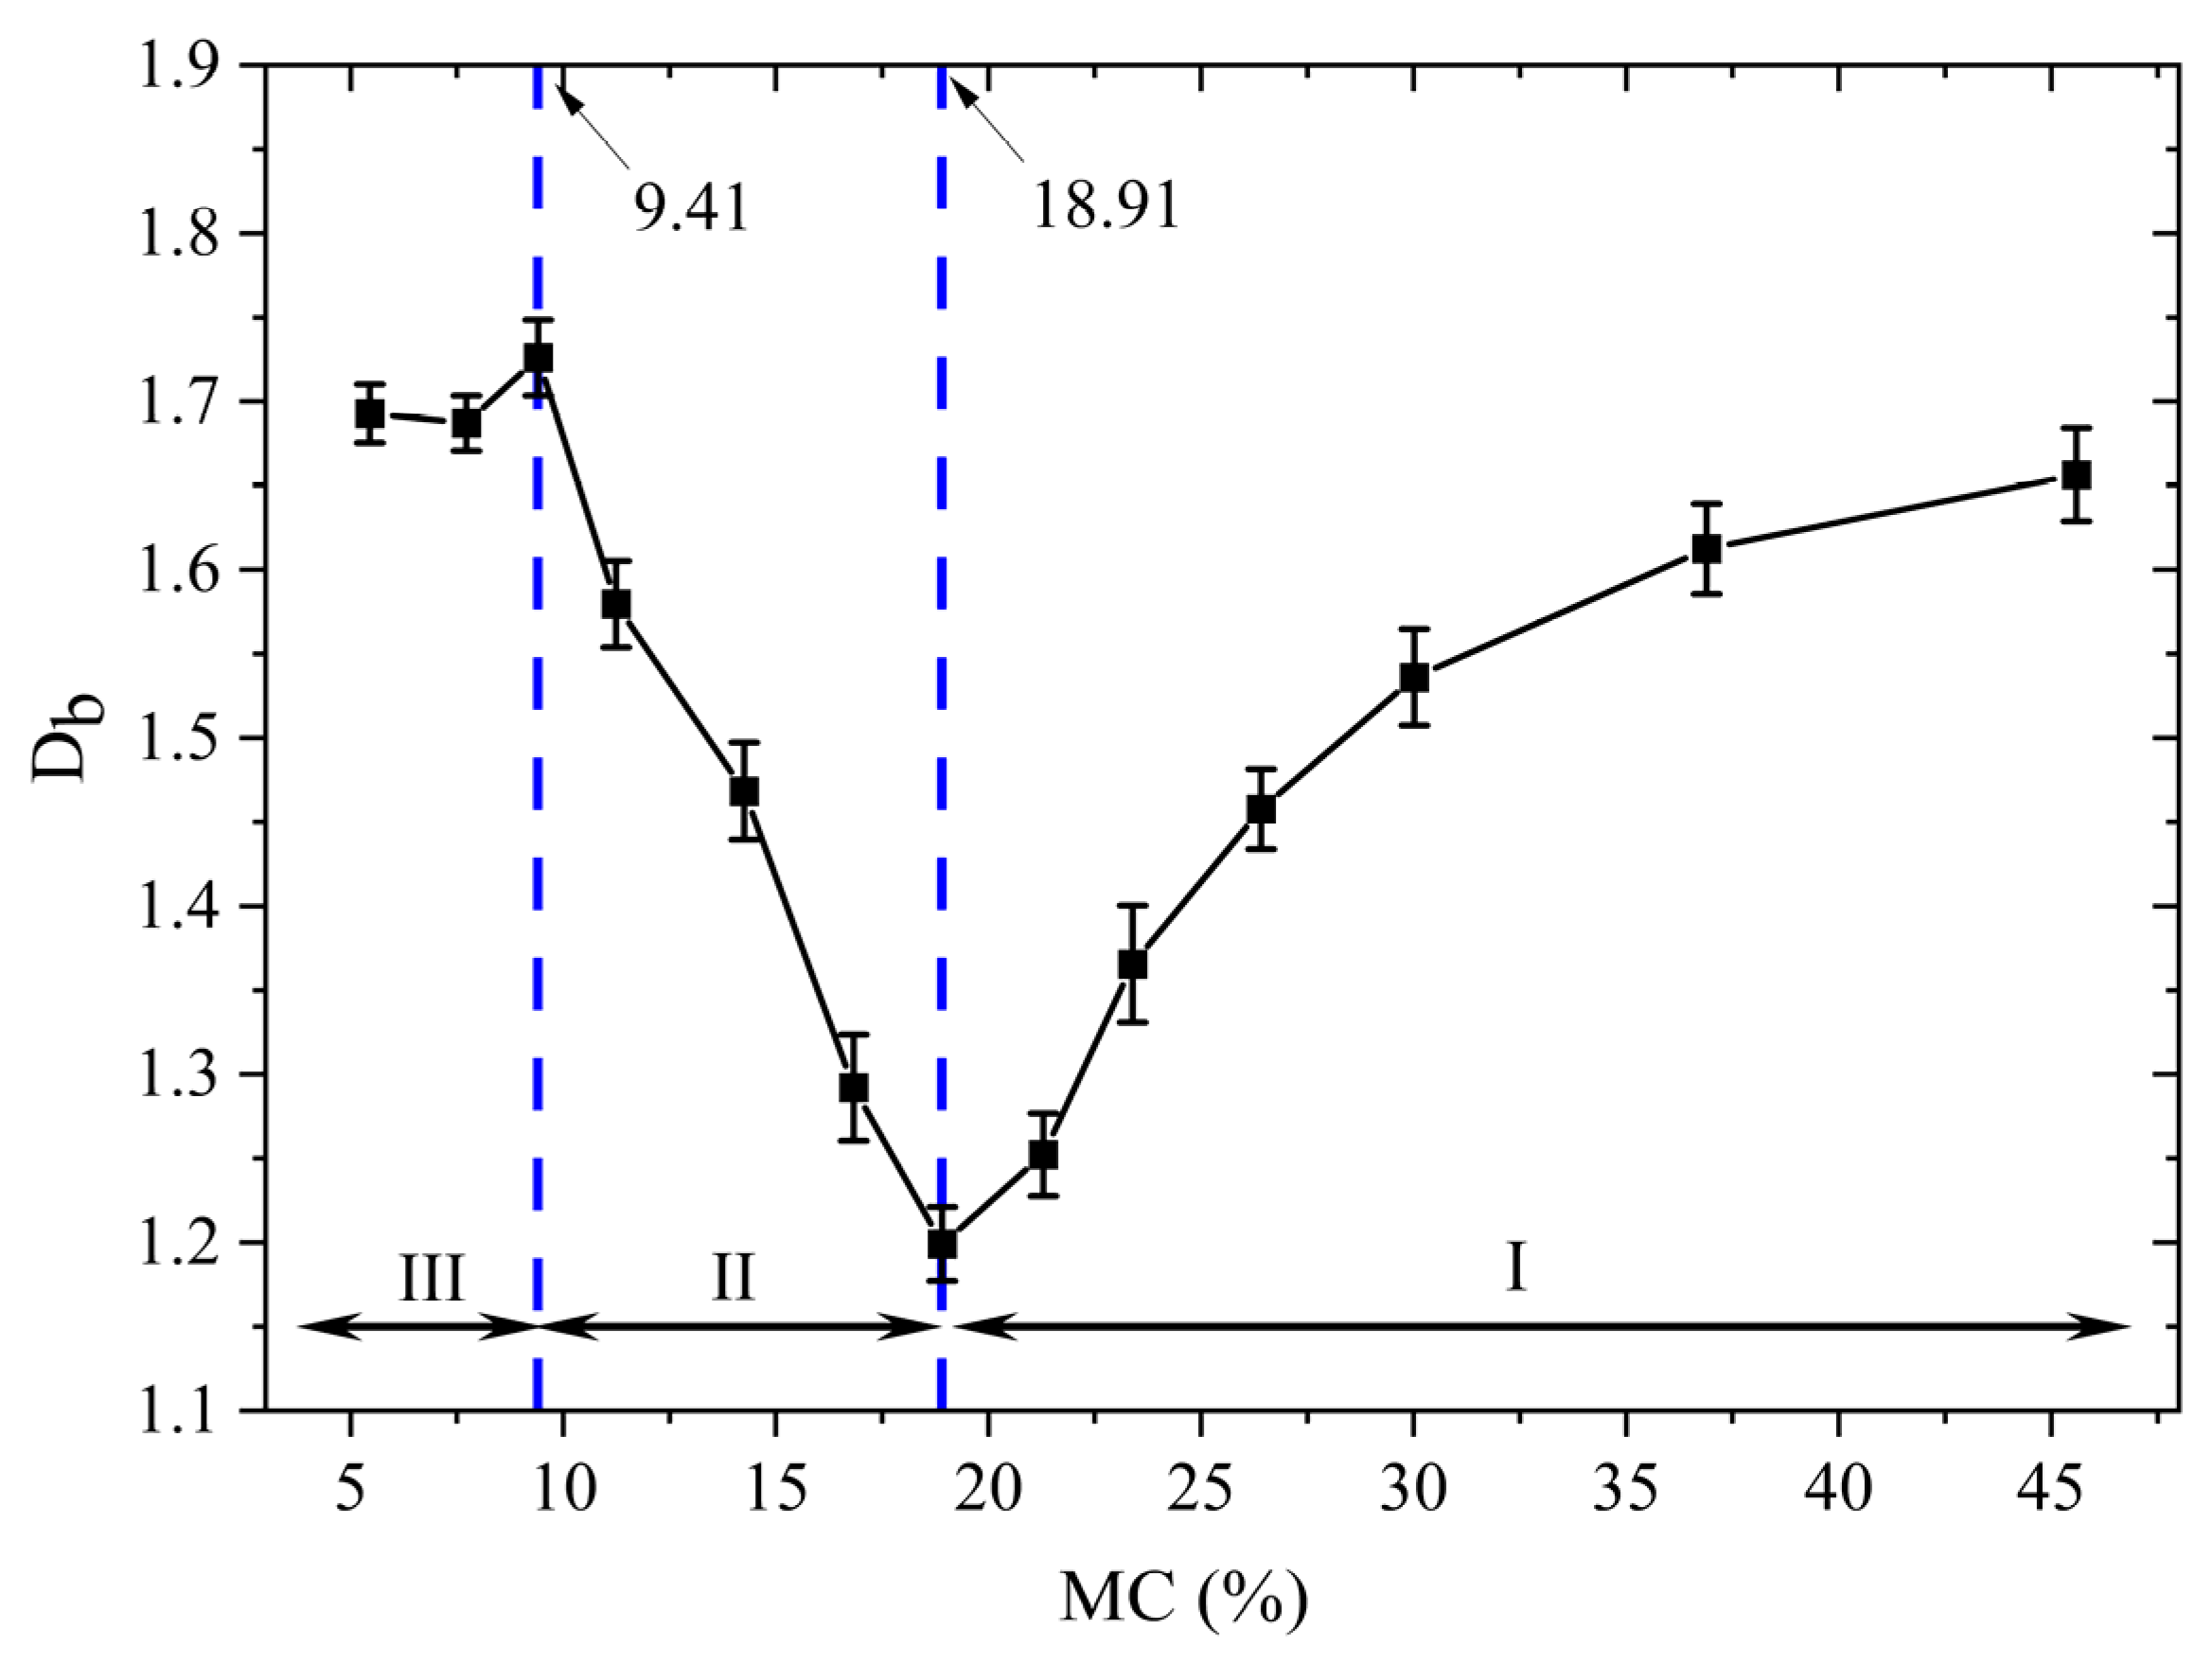
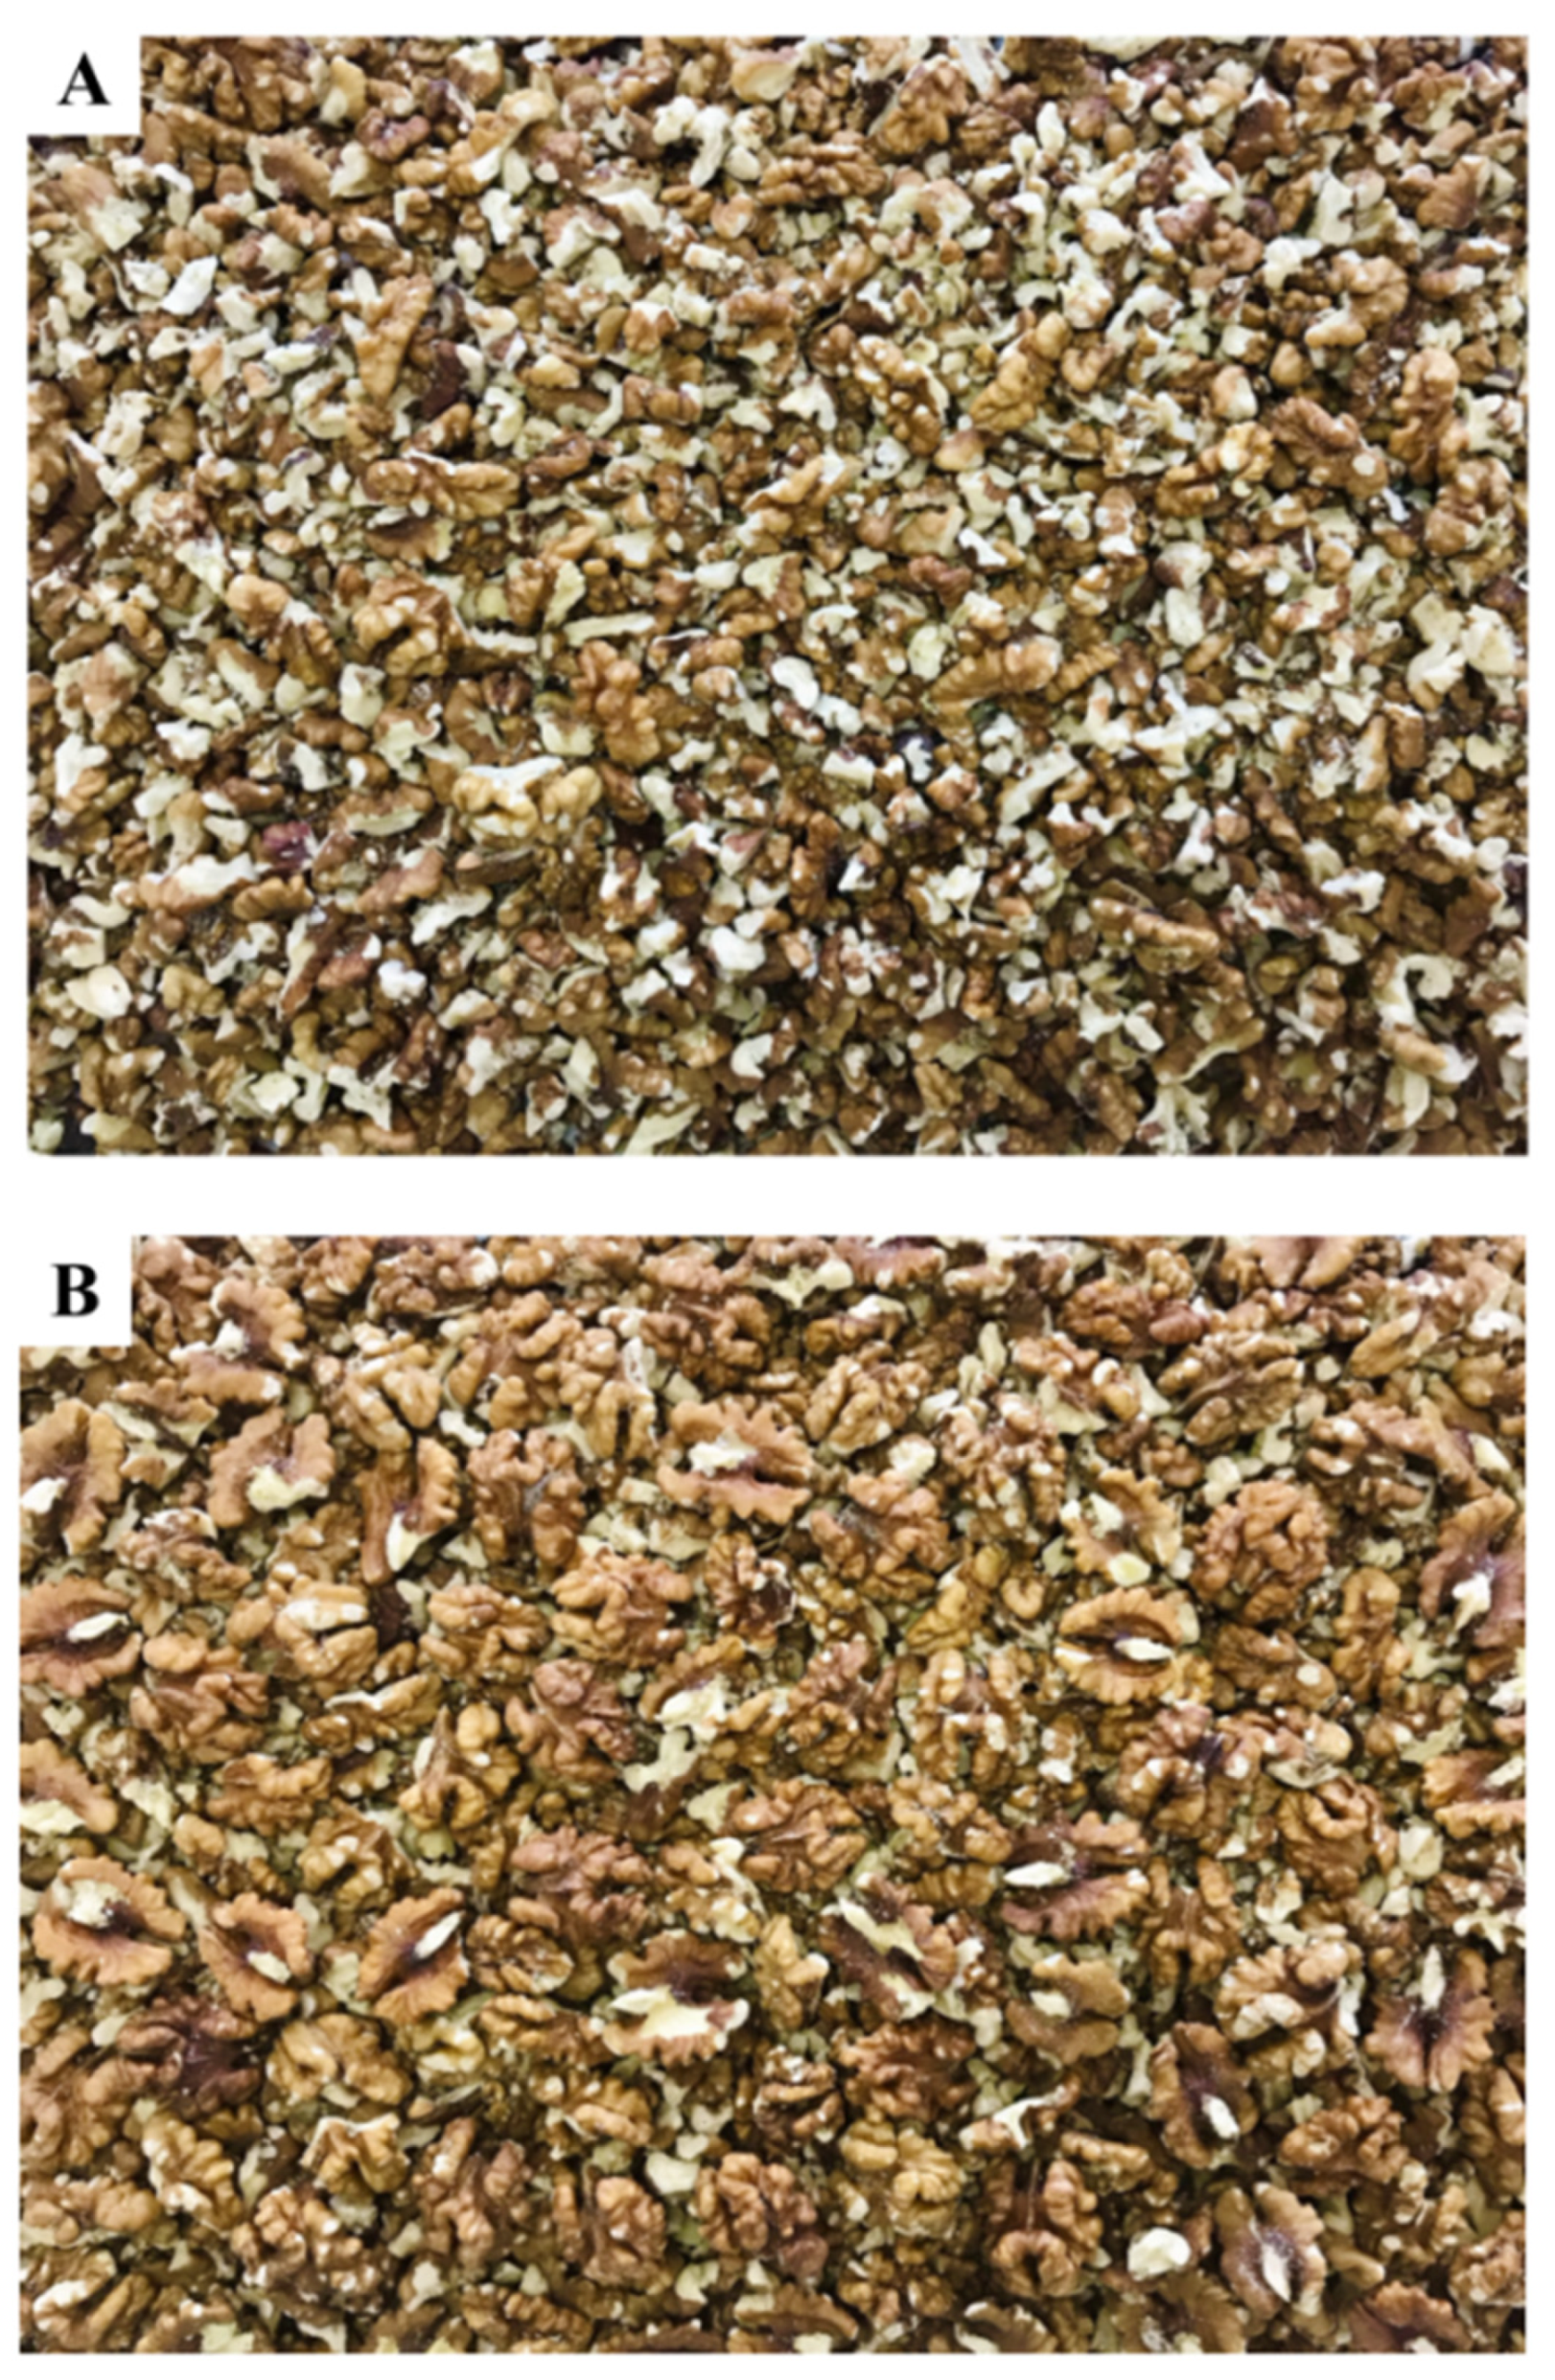
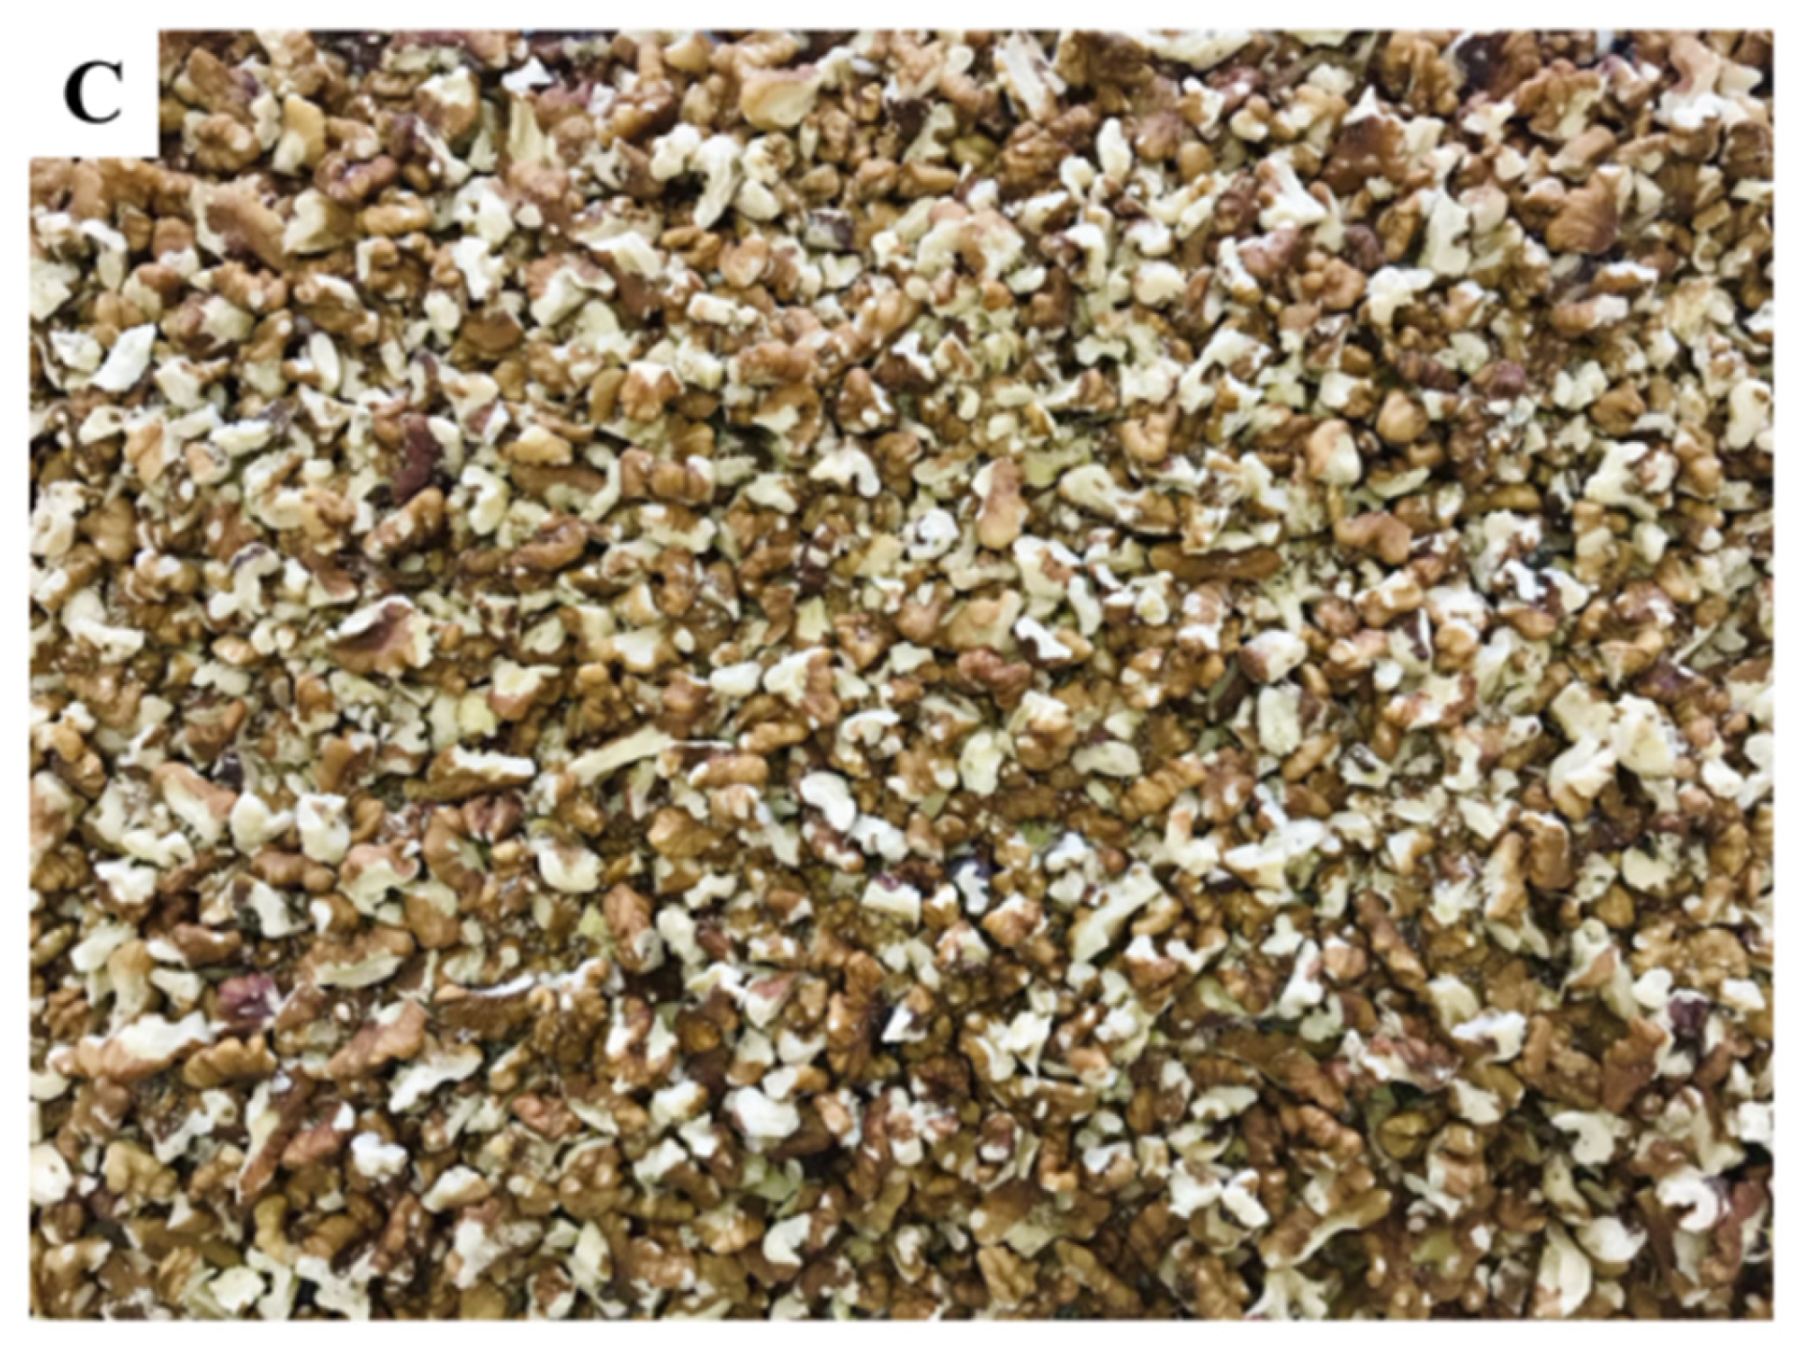
3.1. Determination of CMC of Shell Breaking
3.1.1. Determination of CMC of Shells
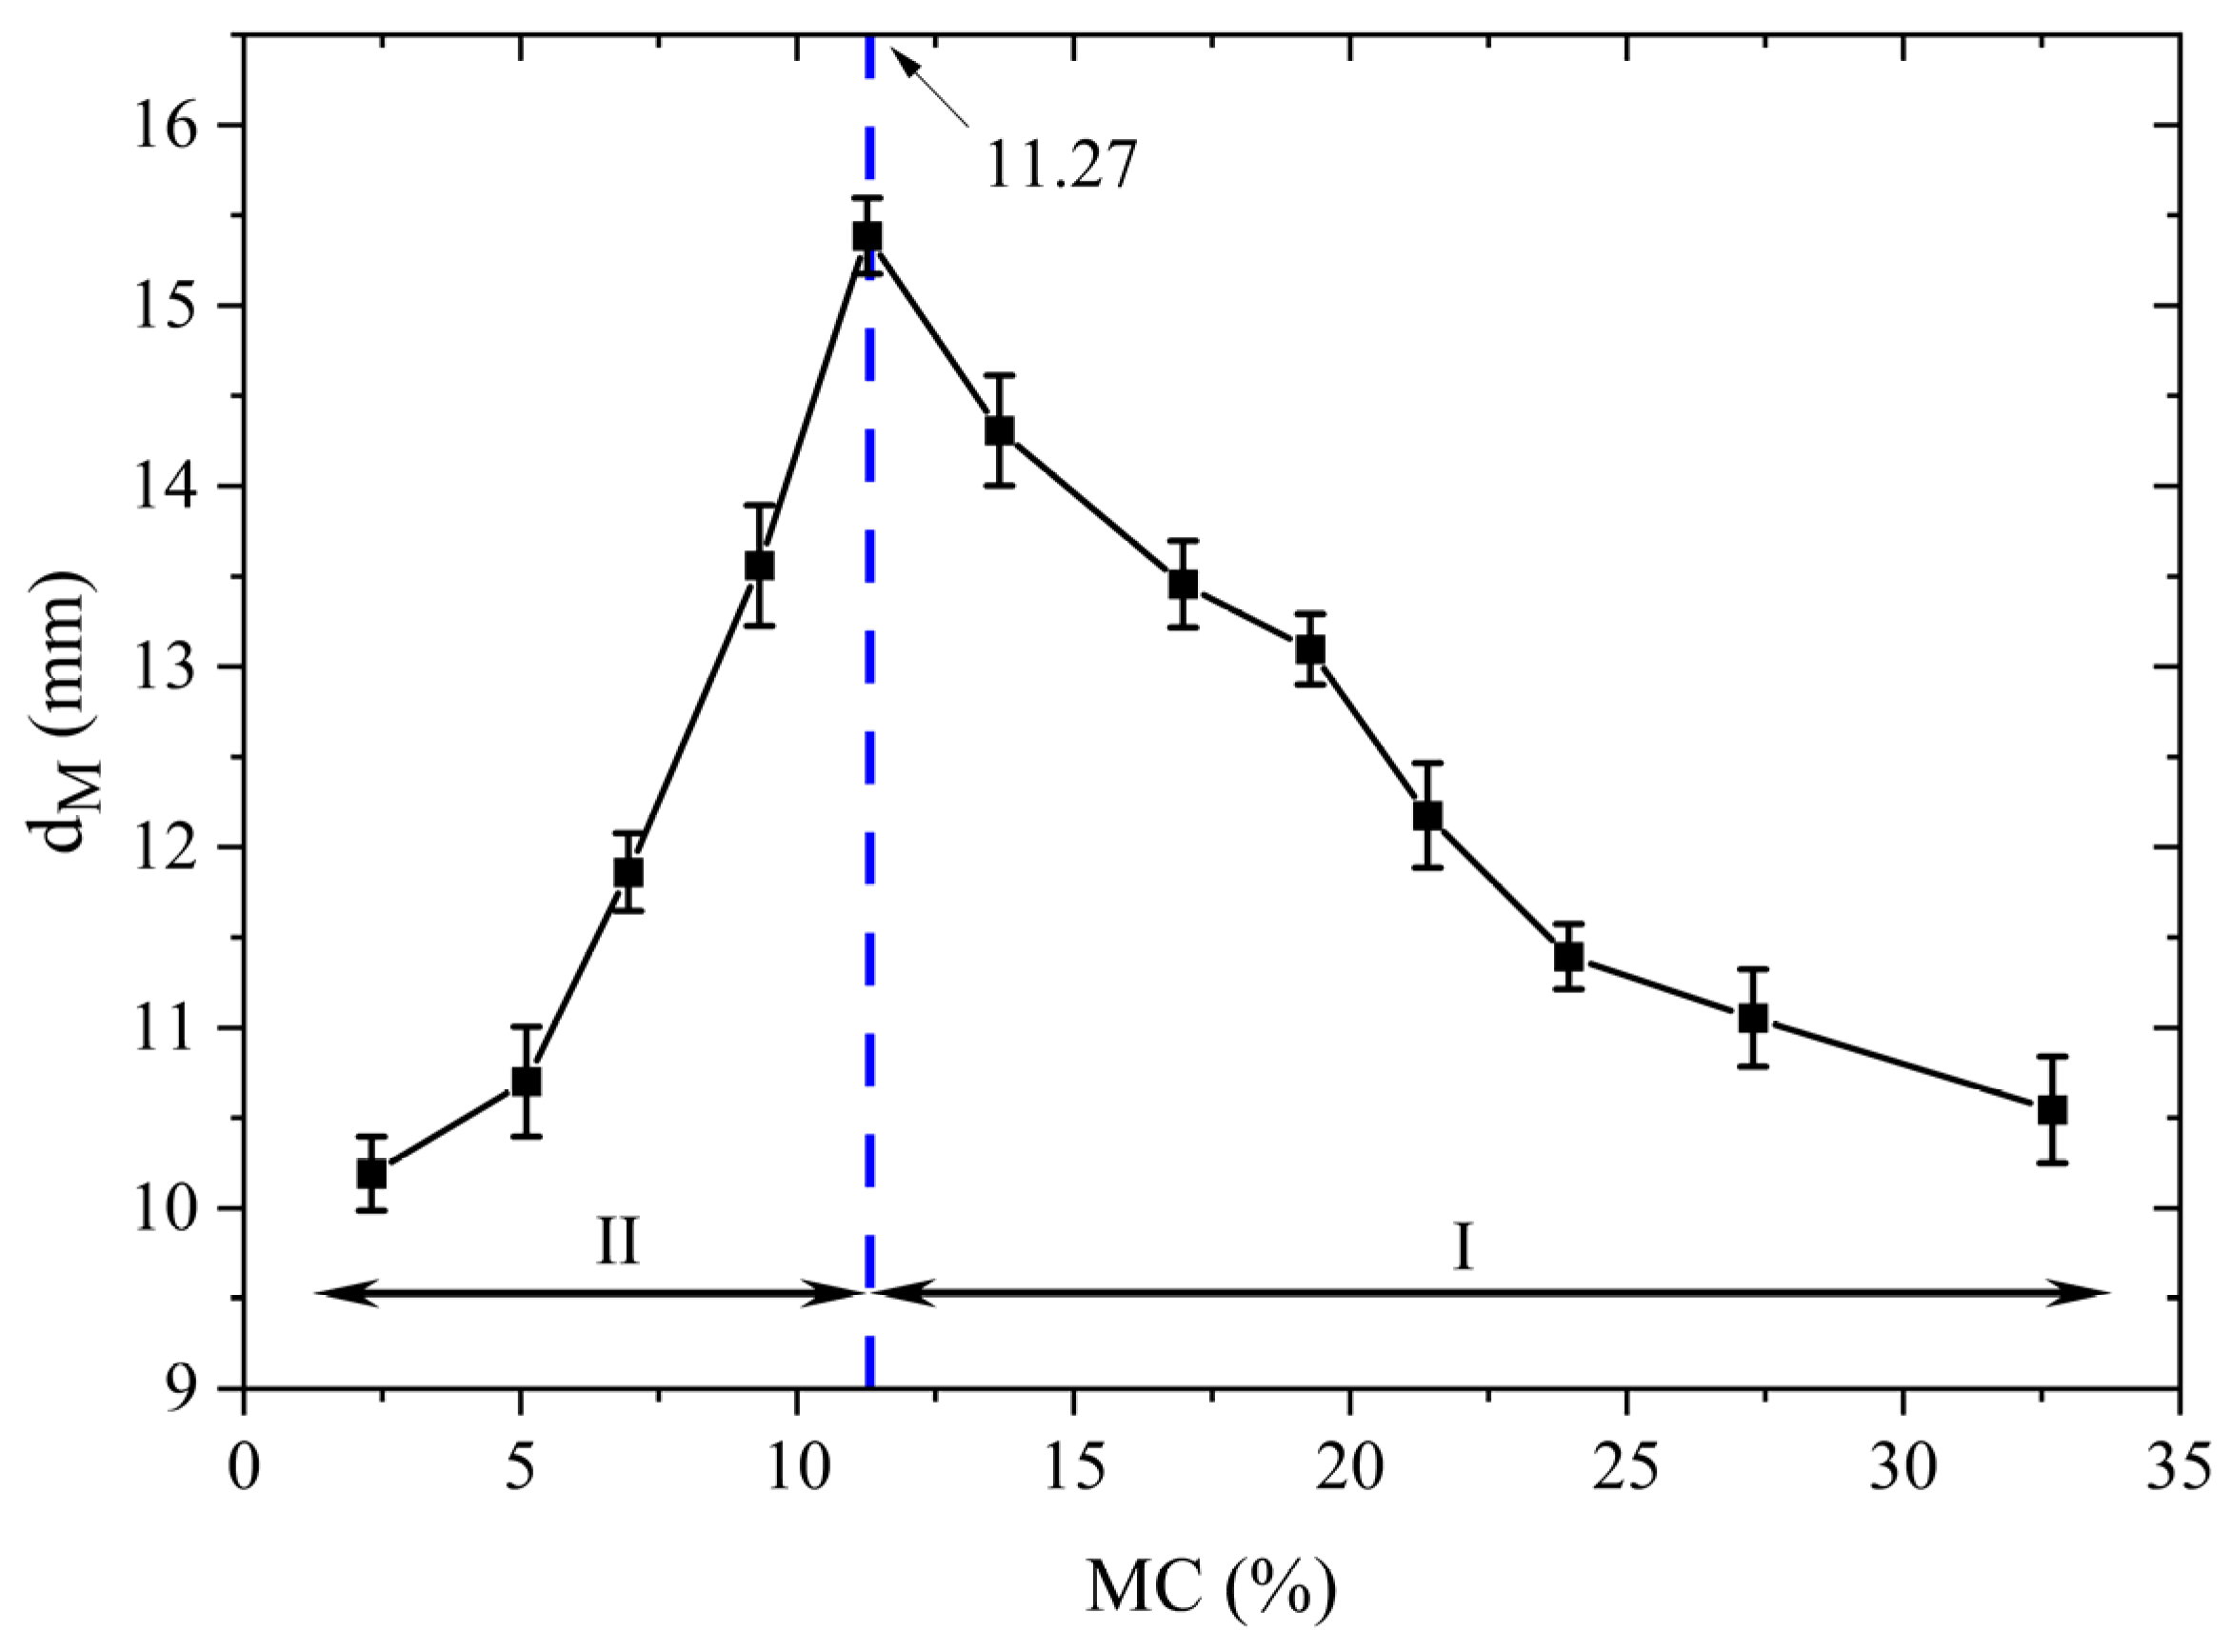
3.1.2. Determination of CMC of Kernels
3.2. HA-MVD Process Facing Walnut Shell Breaking
3.2.1. Fitting Models
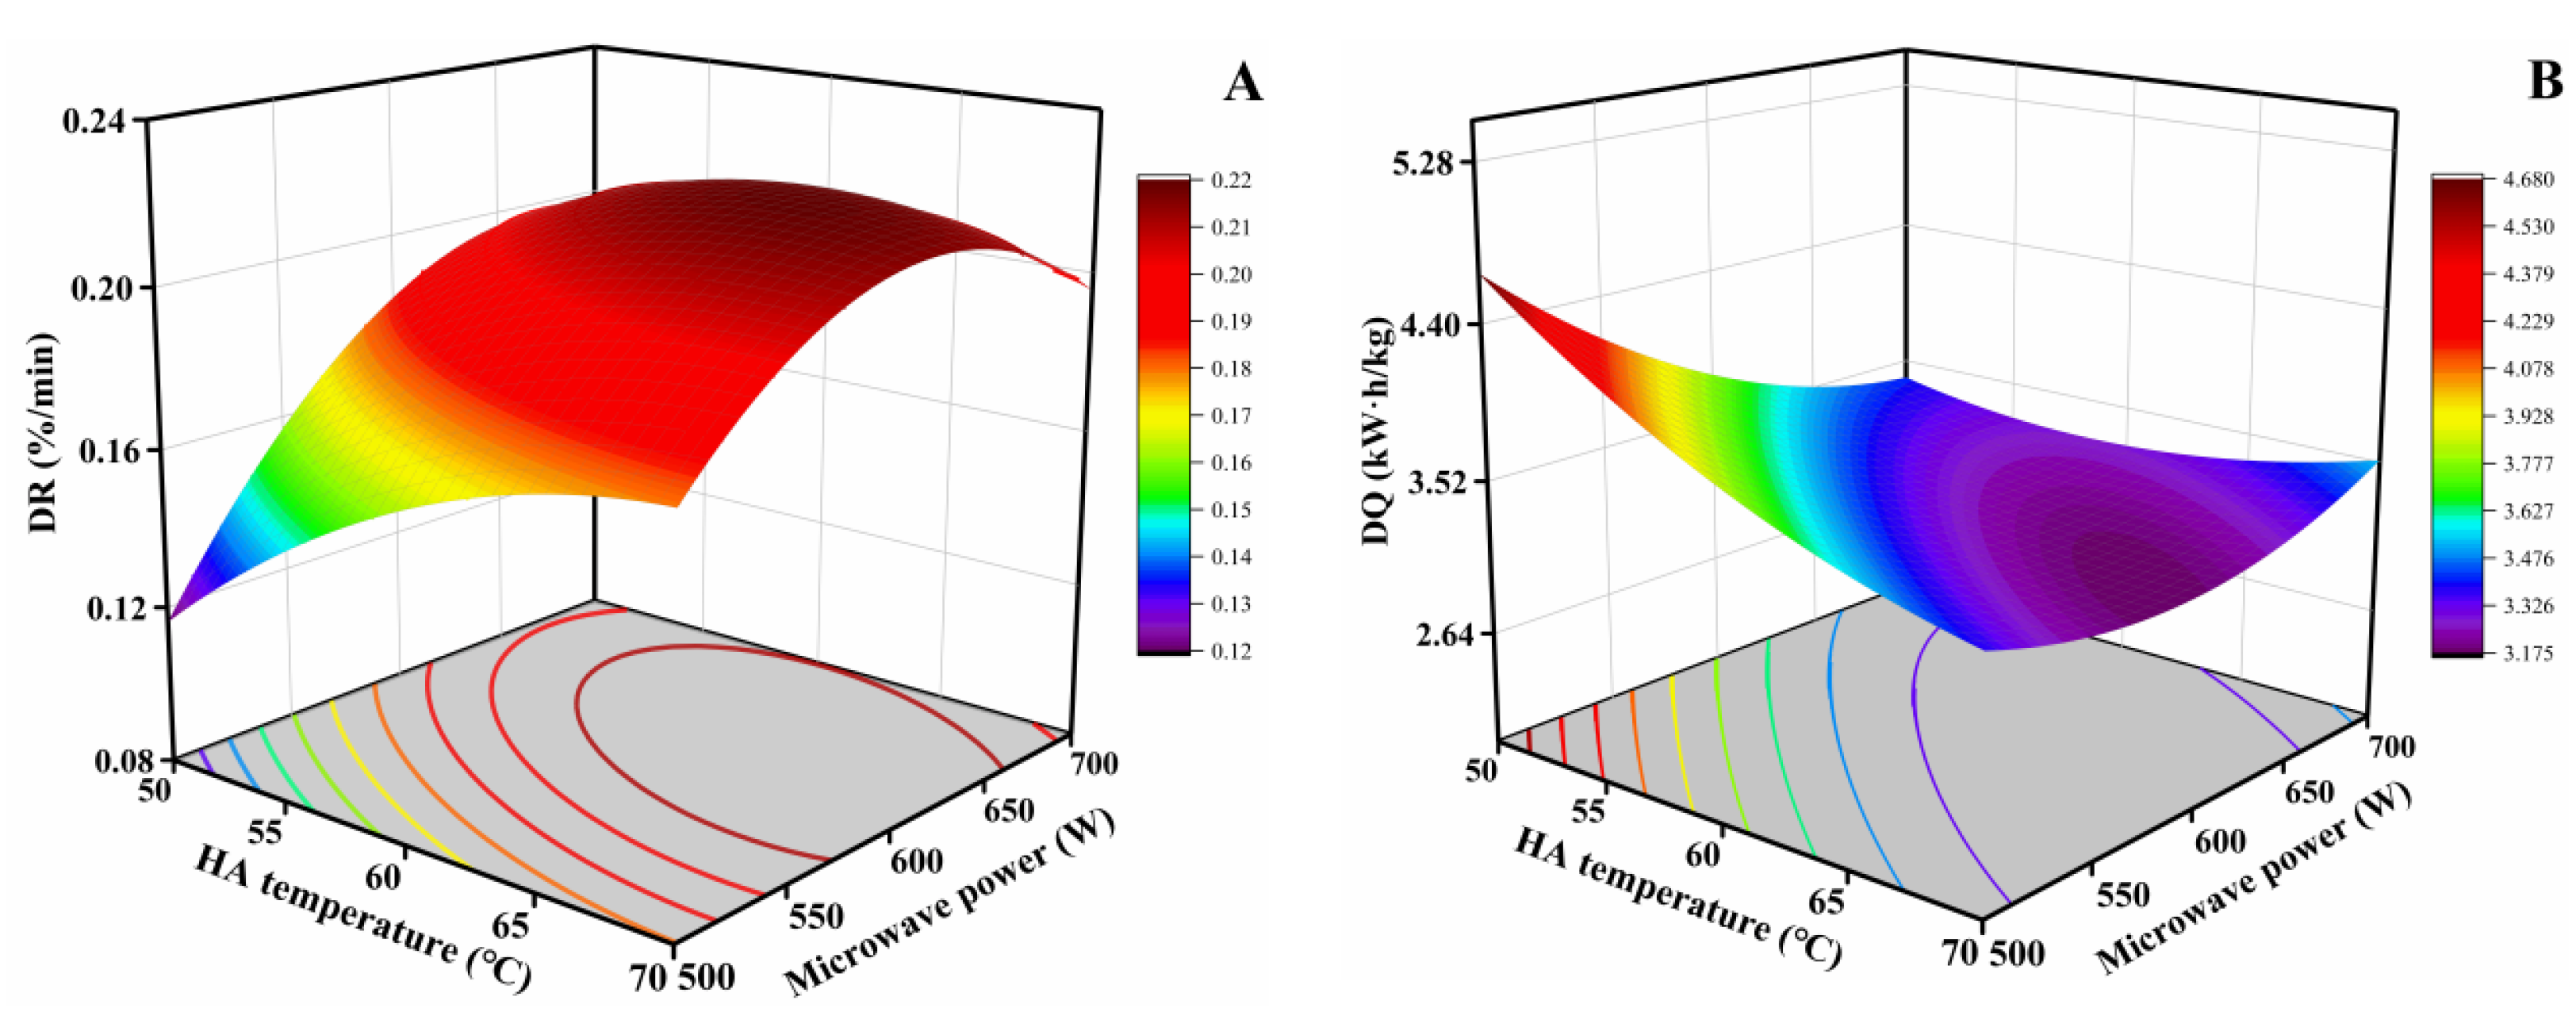
3.2.2. Unit Time Drying Rate
3.2.3. Unit Mass Drying Energy Consumption
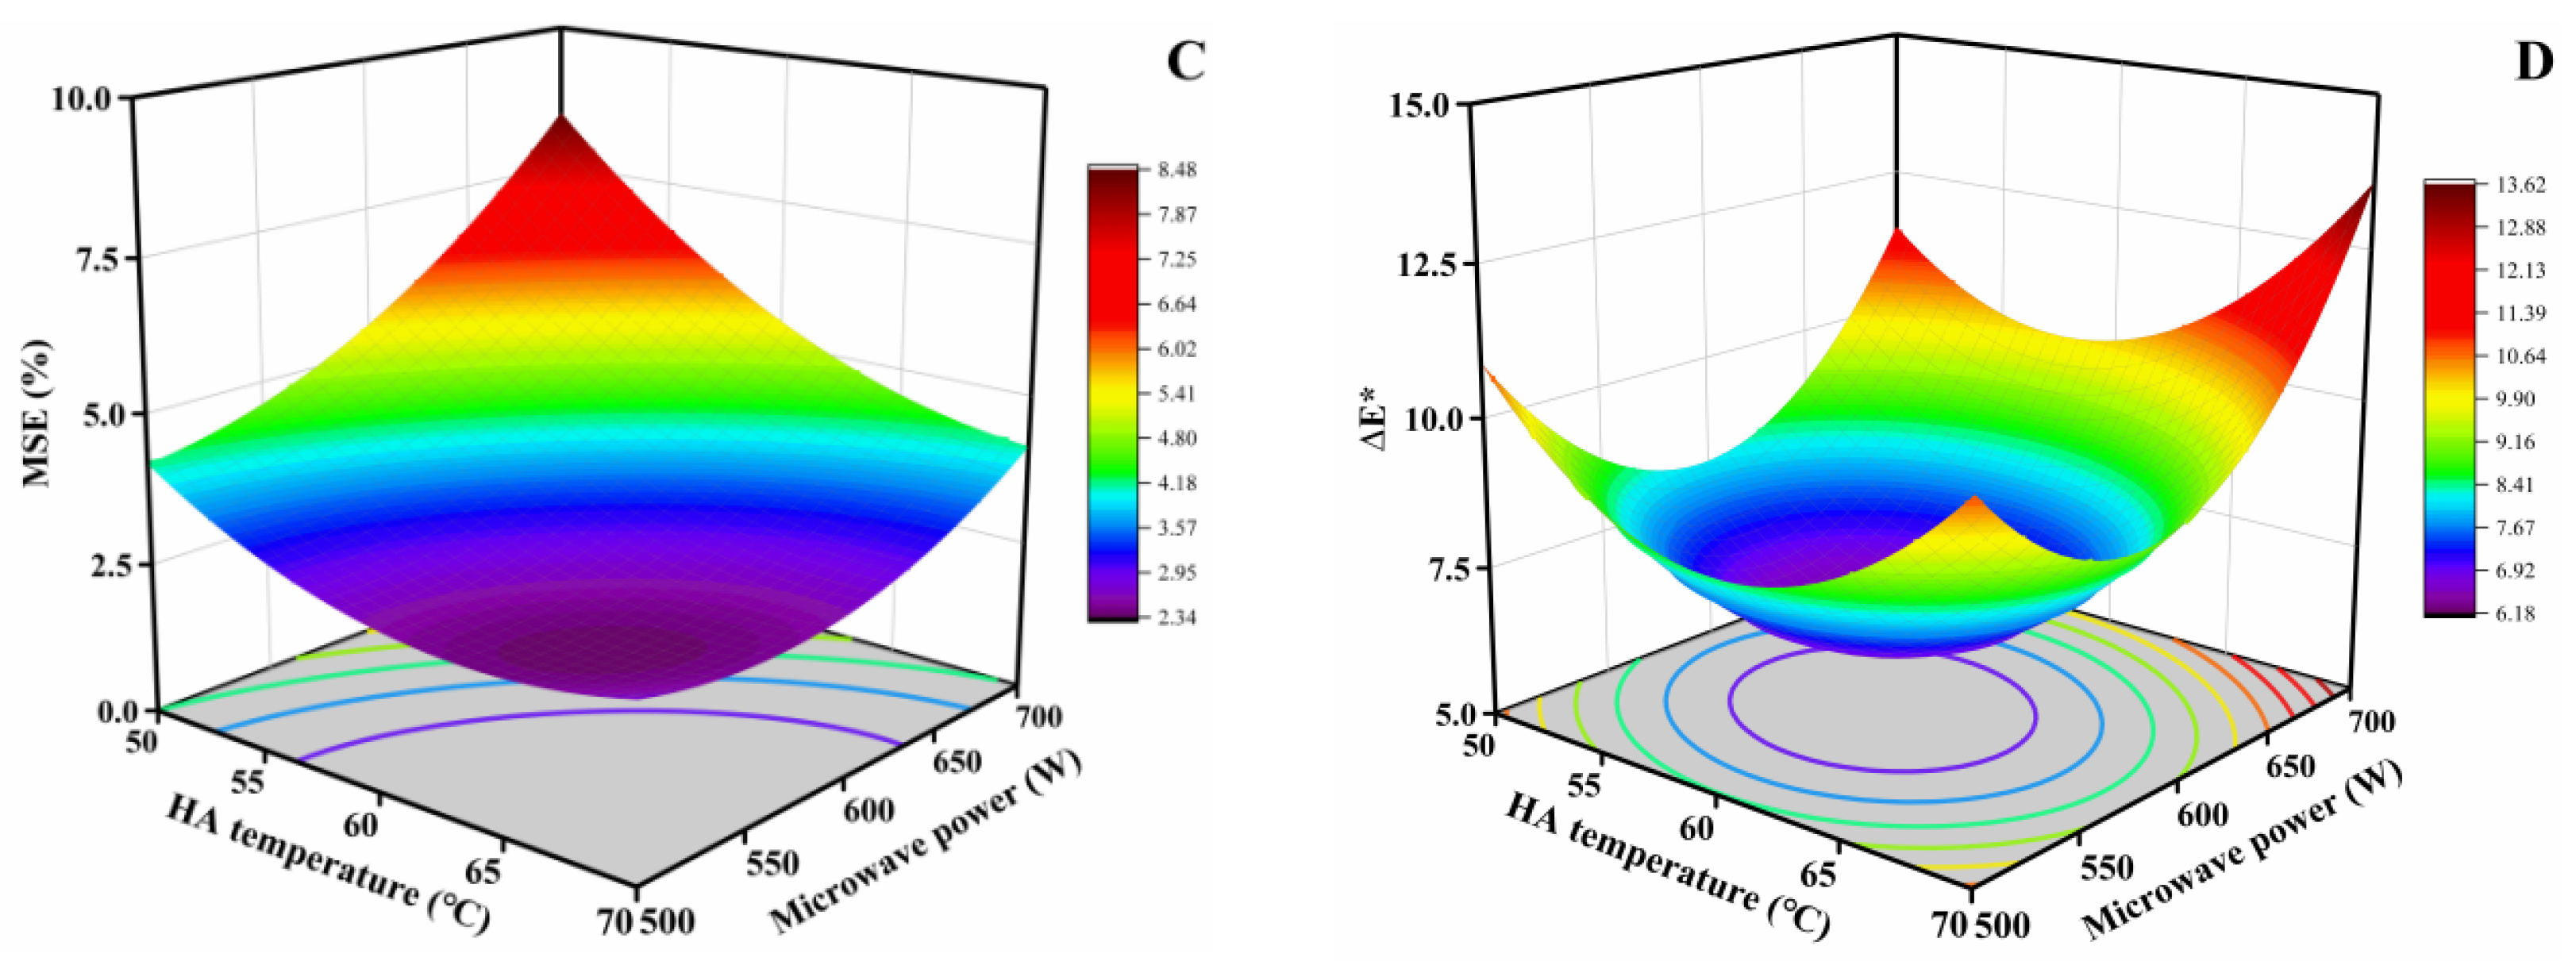
3.2.4. Mean Square Error of Moisture Content
3.2.5. Kernel Color Parameter
3.2.6. Optimization and Validation
3.3. Optimization and Validation
4. Conclusions
Author Contributions
Funding
Institutional Review Board Statement
Informed Consent Statement
Data Availability Statement
Acknowledgments
Conflicts of Interest
References
- Erfani, A.; Pirouzifard, M.K.; Almasi, H.; Gheybi, N.; Pirsa, S. Application of cellulose plate modified with encapsulated cinnamomum zelanicum essential oil in active packaging of walnut kernel. Food Chem. 2022, 381, 132246. [Google Scholar] [CrossRef] [PubMed]
- Wang, Y.Z.; Luo, X.Y.; Song, X.Y.; Guo, W.; Yu, K.; Yang, C.Y.; Qu, F.Y. Turning waste into treasure: Carbonized walnut shell for solar-driven water evaporation. Mater. Lett 2022, 307, 131057. [Google Scholar] [CrossRef]
- Li, L.; Mao, B.Q.; Zeng, Y.; Tang, Y.R.; Man, X.L.; Fan, X.W.; Zhang, Y.C.; Zhang, H. Experimental study on crack irregularity of hollow shell particle under impact loading. Powder Technol. 2023, 427, 118704. [Google Scholar] [CrossRef]
- Man, X.L.; Li, L.; Zeng, Y.; Tang, Y.R.; Yang, J.L.; Fan, X.W.; Zhang, Y.C.; Zhang, H.; Su, G.G.; Wang, J.P. Mechanical impact characteristics of hollow shell granule based on continuous damage theory. Powder Technol. 2023, 429, 118946. [Google Scholar] [CrossRef]
- Liu, M.Z.; Li, C.H.; Cao, C.M.; Wang, L.Q.; Li, X.P.; Che, J.; Yang, H.M.; Zhang, X.W.; Zhao, H.Y.; He, G.Z.; et al. Walnut Fruit Processing Equipment: Academic Insights and Perspectives. Food Eng. Rev. 2021, 13, 822–857. [Google Scholar] [CrossRef]
- Shi, M.C.; Liu, M.Z.; Li, C.H.; Cao, C.M.; Li, X.P. Design and experiment of cam rocker bidirectional extrusion walnut shell breaking device. Trans. CSAE 2022, 53, 140–150. [Google Scholar]
- Wang, J.N.; Liu, M.J.; Wu, H.C.; Peng, J.Y.; Peng, B.L.; Yang, Y.S.; Cao, M.Z.; Wei, H.; Xie, H.X. Design and Key Parameter Optimization of Conic Roller Shelling Device Based on Walnut Moisture-Regulating Treatments. Agriculture 2022, 12, 561. [Google Scholar] [CrossRef]
- Zhang, H.; Liu, H.L.; Zeng, Y.; Tang, Y.R.; Zhang, Z.G.; Che, J. Design and Performance Evaluation of a Multi-Point Extrusion Walnut crushing Device. Agriculture 2022, 12, 1494. [Google Scholar] [CrossRef]
- Altuntas, E.; Erkol, M. The effects of moisture content, compression speeds, and axes on mechanical properties of walnut cultivars. Food Bioprocess Technol. 2011, 4, 1288–1295. [Google Scholar] [CrossRef]
- Shahbazi, F. Effects of moisture content and impact energy on the crushing characteristics of walnuts. Int. J. Food Eng. 2014, 10, 149–156. [Google Scholar] [CrossRef]
- Chen, C.; Zhang, W.P.; Venkitasamy, C.; Khir, R.; McHugh, T.; Pan, Z.L. Walnut structure and its influence on the hydration and drying characteristics. Dry. Technol. 2019, 38, 975–986. [Google Scholar] [CrossRef]
- Chen, C.; Venkitasamy, C.; Zhang, W.P.; Deng, L.Z.; Meng, X.Y.; Pan, Z.L. Effect of step-down temperature drying on energy consumption and product quality of walnuts. J. Food Eng. 2020, 285, 110105. [Google Scholar] [CrossRef]
- Dolgun, G.K.; Aktas, M.; Dolgun, E.C. Infrared convective drying of walnut with energy-exergy perspective. J. Food Eng. 2021, 306, 110638. [Google Scholar] [CrossRef]
- Mao, Y.X.; Wang, P.H.; Wu, Y.; Hou, L.X.; Wang, S.J. Effects of various radio frequencies on combined drying and disinfestation treatments for in-shell walnuts. LWT-Food Sci Technol. 2021, 144, 111246. [Google Scholar] [CrossRef]
- Chen, C.; Pan, Z.L. Heat and moisture transfer studies on walnuts during hot air drying in a fixed-bed column dryer. Appl. Therm. Eng. 2021, 199, 117554. [Google Scholar] [CrossRef]
- Chen, C.; Venkitasamy, C.; Zhang, W.P.; Khir, R.; Upadhyaya, S.; Pan, Z.L. Effective moisture diffusivity and drying simulation of walnuts under hot air. Int. J. Heat Mass Transf. 2020, 150, 119283. [Google Scholar] [CrossRef]
- Gharibzahedi, S.M.T.; Mousavi, S.M.; Hamedi, M.; Khodaiyan, F.; Dadashpour, A. Mechanical behavior of persian walnut and its kernel under compression loading: An experimental and computational study. J. Food Process Pres. 2012, 36, 423–430. [Google Scholar] [CrossRef]
- Zeng, Y.; Mao, B.Q.; Jia, F.G.; Han, Y.L.; Li, G.R. Modelling of grain breakage of in a vertical rice mill based on dem simulation combining particle replacement model. Biosyst. Eng. 2022, 215, 32–48. [Google Scholar] [CrossRef]
- Chen, C.; Upadhyaya, S.; Khir, R.; Pan, Z.L. Simulation of walnut drying under hot air heating using a nonequilibrium multiphase transfer model. Dry. Technol. 2020, 40, 987–1001. [Google Scholar] [CrossRef]
- Han, D.Y.; Cao, P.; Liu, J.; Zhu, J.B. An experimental study of dependence of optimum TBM cutter spacing on pre-set penetration depth in sandstone fragmentation. Rock Mech. Rock Eng. 2017, 50, 3209–3221. [Google Scholar] [CrossRef]
- Hu, M.F.; Zhang, S.Q.; Dong, W.; Xu, F.J.; Liu, H.T. Adaptive denoising algorithm using peak statistics-based thresholding and novel adaptive complementary ensemble empirical mode decomposition. Inf. Sci. 2021, 563, 269–289. [Google Scholar] [CrossRef]
- Xiao, Y.; Meng, M.Q.; Daouadji, A.; Chen, Q.S.; Wu, Z.J.; Jiang, X. Effects of particle size on crushing and deformation behaviors of rockfill materials. Geosci. Front. 2020, 11, 375–388. [Google Scholar] [CrossRef]
- Wu, Z.J.; Zhang, P.L.; Fan, L.F.; Liu, Q.S. Numerical study of the effect of confining pressure on the rock breakage efficiency and fragment size distribution of a tbm cutter using a coupled fem-dem method. Tunn. Undergr. Space Technol. 2019, 88, 260–275. [Google Scholar] [CrossRef]
- He, M.C.; Yang, G.X.; Miao, J.L.; Jia, X.N.; Jiang, T.T. Classification and research methods of rockburst experimental fragments. CJRME 2009, 28, 1521–1529. [Google Scholar] [CrossRef]
- Li, M.; Li, Y. Local fractal and multifractal characteristics of soil number-based particle size distributions. J. Northwest Agric. For. Univ. (Nat. Sci. Ed.) 2011, 39, 216–222. [Google Scholar]
- Li, H.C.; Zeng, R.; Yang, T.Y.; Niu, Z.Y. Experimental study on the impact breakage characteristics of maize kernels. Trans. CSAE 2022, 38, 29–37. [Google Scholar] [CrossRef]
- Chen, C.; Pan, Z.L. Postharvest processing of tree nuts: Current status and future prospects-A comprehensive review. Compr. Rev. Food Sci. F 2022, 21, 1702–1731. [Google Scholar] [CrossRef] [PubMed]
- Cuccurullo, G.; Metallo, A.; Corona, O.; Cinquanta, L. Comparing different processing methods in apple slice drying. part 1. performance of microwave, hot air and hybrid methods at constant temperatures. Biosyst. Eng. 2019, 188, 331–344. [Google Scholar] [CrossRef]
- Xu, W.X.; Song, C.F.; Li, Z.F.; Song, F.H.; Hu, S.G.; Li, J.; Zhu, G.Y.; Vijaya Raghavan, G.S. Temperature gradient control during microwave combined with hot air drying. Biosyst. Eng. 2018, 169, 175–187. [Google Scholar] [CrossRef]
- Zhou, Y.H.; Staniszewska, I.; Liu, Z.L.; Zielinska, D.; Xiao, H.W.; Pan, Z.L.; Nowak, K.W.; Zielinska, M. Microwave-vacuum-assisted drying of pretreated cranberries: Drying kinetics, bioactive compounds and antioxidant activity. LWT-Food Sci. Technol. 2021, 146, 111464. [Google Scholar] [CrossRef]
- Shen, L.Y.; Zhu, Y.; Liu, C.H.; Wang, L.; Liu, H.; Kamruzzaman, M.; Liu, C.; Zhang, Y.P.; Zheng, X.Z. Modelling of moving drying process and analysis of drying characteristics for germinated brown rice under continuous microwave drying. Biosyst. Eng. 2020, 195, 64–88. [Google Scholar] [CrossRef]
- Ye, J.H.; Xu, C.; Zhang, C.; Zhu, H.C.; Huang, K.M.; Li, Q.; Wang, J.; Zhou, L.; Wu, Y.Y. A hybrid ale/implicit function method for simulating microwave heating with rotating objects of arbitrary shape. J. Food Eng. 2021, 302, 110551. [Google Scholar] [CrossRef]
- Kaveh, M.; Abbaspour-Gilandeh, Y.; Nowacka, M. Optimisation of microwave-rotary drying process and quality parameters of terebinth. Biosyst. Eng. 2021, 208, 113–130. [Google Scholar] [CrossRef]
- Bauemler, E.; Cuniberti, A.; Nolasco, S.M.; Riccobene, I.C. Moisture dependent physical and compression properties of safflower seed. J. Food Eng. 2006, 72, 134–140. [Google Scholar] [CrossRef]
- Xiao, N.; Felhofer, M.; Antreich, S.J.; Huss, J.C.; Mayer, K.; Singh, A.; Bock, P.; Gierlinger, N. Twist and lock: Nutshell structures for high strength and energy absorption. R. Soc. Open Sci. 2021, 8, 210399. [Google Scholar] [CrossRef] [PubMed]
- Mousaviraad, M.; Tekeste, M.Z. Effect of grain moisture content on physical, mechanical, and bulk dynamic behaviour of maize. Biosyst. Eng. 2020, 195, 186–197. [Google Scholar] [CrossRef]
- Lu, Y.J.; Ren, G.Y.; Duan, X.; Zhang, L.D.; Ling, Z.Z. Moisture migration properties and quality changes of fresh in-shell peanuts during hot air drying. Food Sci. 2020, 41, 86–92. [Google Scholar] [CrossRef]
- Raponi, F.; Moscetti, R.; Chakravartula, S.S.N.; Fidaleo, M.; Massantini, R. Monitoring the hot-air drying process of organically grown apples (cv. gala) using computer vision. Biosyst. Eng. 2021, 223, 1–13. [Google Scholar] [CrossRef]
- Martínez-Vera, C.; Vizcarra-Mendoza, M.G. Concentration-dependent moisture diffusion coefficient estimation in peas drying considering shrinkage: An observer approach. Biosyst. Eng. 2022, 218, 256–273. [Google Scholar] [CrossRef]
- Chen, A.Q.; Achkar, G.E.; Liu, B.; Bennacer, R. Experimental study on moisture kinetics and microstructure evolution in apples during high power microwave drying process. J. Food Eng. 2020, 29, 110362. [Google Scholar] [CrossRef]
- Ishibashi, R.; Numata, T.; Tanigawa, H.; Tsuruta, T. In-situ measurements of drying and shrinkage characteristics during microwave vacuum drying of radish and potato. J. Food Eng. 2022, 323, 110988. [Google Scholar] [CrossRef]
- Song, Z.L.; Jing, C.M.; Yao, L.S.; Zhao, X.Q.; Sun, J.; Wang, W.L.; Mao, Y.P.; Ma, C.Y. Coal slime hot air/microwave combined drying characteristics and energy analysis. Fuel Process Technol. 2016, 156, 491–499. [Google Scholar] [CrossRef]
- Moreno, Á.H.; Aguirre, Á.J.; Maqueda, R.H.; Jiménez, G.J.; Miño, C.T. Effect of temperature on the microwave drying process and the viability of amaranth seeds. Biosyst. Eng. 2022, 215, 49–66. [Google Scholar] [CrossRef]
- Ma, X.T.; Luo, G.Y.; Li, Z.F.; Raghavan, G.S.V.; Chen, H.Y.; Song, C.F. Microwave power control scheme for potatoes based on dielectric loss factor feedback. J. Food Eng. 2020, 288, 110134. [Google Scholar] [CrossRef]
- An, N.N.; Lv, W.Q.; Li, D.; Wang, L.J.; Wang, Y. Effects of hot-air microwave rolling blanching pretreatment on the drying of turmeric (Curcuma longa L.): Physiochemical properties and microstructure evaluation. Food Chem. 2023, 398, 133925. [Google Scholar] [CrossRef]
- Wang, H.; Fang, X.M.; Sutar, P.P.; Meng, J.S.; Wang, J.; Yu, X.L.; Xiao, H.W. Effects of vacuum-steam pulsed blanching on drying kinetics, colour, phytochemical contents, antioxidant capacity of carrot and the mechanism of carrot quality changes revealed by texture, microstructure and ultrastructure. Food Chem. 2021, 338, 127799. [Google Scholar] [CrossRef]
- Eichner, K.; Laible, R.; Wolf, W. The Influence of Water Content and Temperature on the Formation of Maillard Reaction Intermediates during Drying of Plant Products. Propert. Water Foods 1985, 90, 191–210. [Google Scholar] [CrossRef]
- Shen, L.Y.; Wang, L.; Zheng, C.Y.; Liu, C.H.; Zhu, Y.; Liu, H.; Liu, C.; Shi, Y.K.; Zheng, X.Z.; Xu, H. Continuous microwave drying of germinated brown rice: Effects of drying conditions on fissure and color, and modeling of moisture content and stress inside kernel. Dry. Technol. 2020, 39, 669–697. [Google Scholar] [CrossRef]
- Chen, Y.N.; Li, M.; Dharmasiri, T.S.K.; Song, X.Y.; Liu, F.; Wang, X. Novel ultrasonic-assisted vacuum drying technique for dehydrating garlic slices and predicting the quality properties by low field nuclear magnetic resonance. Food Chem. 2020, 306, 125625. [Google Scholar] [CrossRef]


| Sample Mark | A0 | A1 | A2 | A3 | A4 | A5 | A6 | A7 | A8 | A9 | A10 | A11 | A12 |
|---|---|---|---|---|---|---|---|---|---|---|---|---|---|
| Drying time, h | 0 | 3 | 6 | 9 | 12 | 15 | 19 | 23 | 28 | 34 | 40 | 48 | 56 |
| Shell MC, % | 45.59 | 36.89 | 30.01 | 26.41 | 23.39 | 21.29 | 18.91 | 16.83 | 14.25 | 11.24 | 9.41 | 7.72 | 5.45 |
| Kernel MC, % | 33.69 | 27.28 | 23.95 | 21.40 | 19.28 | 16.98 | 13.66 | 11.27 | 9.32 | 6.95 | 5.11 | 2.31 | 2.23 |
| Walnut MC, % | 40.73 | 33.01 | 27.17 | 23.87 | 21.43 | 19.21 | 16.74 | 14.42 | 12.43 | 10.09 | 8.04 | 6.58 | 4.97 |
| Parameters | Size |
|---|---|
| Grading accuracy/(%) | ≥96 |
| Power of cracker/kw | 0.75 |
| Cracking angle/(°) | 0–1 (0.47) |
| Overall weight/kg | 165 |
| Roller speed/(r/min) | 0–210 (108) |
| Length × width × height/(mm × mm × mm) | 1200 × 800 × 1200 |
| Productivity/(kg/h) | 1080 |
| Inlet size/(mm × mm) | 94 × 45 |
| One-Dew Kernel | Two-Dew Kernel | Three-Dew Kernel | Four-Dew Kernel | Crushed Kernel | Powder |
|---|---|---|---|---|---|
 |  | 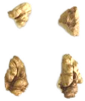 | 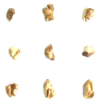 |  | 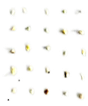 |
| 18~26 mm | 12~18 mm | 8~12 mm | 4~8 mm | 2~4 mm | 0~2 mm |
| Run # | x1 (°C) | x2 (%) | x3 (W) | x4 (°C) | DR (%/min) | DQ (kW·h/kg) | MSE (%) | ∆E* |
|---|---|---|---|---|---|---|---|---|
| 1 | 55 (−1) | 21 (−1) | 550 (−1) | 45 (−1) | 0.141 | 5.31 | 2.30 | 8.46 |
| 2 | 65 (1) | 21 (−1) | 550 (−1) | 45 (−1) | 0.160 | 4.83 | 2.01 | 8.74 |
| 3 | 55 (−1) | 27 (1) | 550 (−1) | 45 (−1) | 0.175 | 3.89 | 4.77 | 6.84 |
| 4 | 65 (1) | 27 (1) | 550 (−1) | 45 (−1) | 0.195 | 3.03 | 3.32 | 7.12 |
| 5 | 55 (−1) | 21 (−1) | 650 (1) | 45 (−1) | 0.171 | 5.00 | 2.99 | 8.58 |
| 6 | 65 (1) | 21 (−1) | 650 (1) | 45 (−1) | 0.179 | 4.58 | 2.33 | 8.78 |
| 7 | 55 (−1) | 27 (1) | 650 (1) | 45 (−1) | 0.203 | 2.72 | 6.41 | 8.04 |
| 8 | 65 (1) | 27 (1) | 650 (1) | 45 (−1) | 0.204 | 2.86 | 4.38 | 8.38 |
| 9 | 55 (−1) | 21 (−1) | 550 (−1) | 55 (1) | 0.167 | 5.14 | 2.81 | 9.22 |
| 10 | 65 (1) | 21 (−1) | 550 (−1) | 55 (1) | 0.188 | 4.59 | 2.48 | 9.62 |
| 11 | 55 (−1) | 27 (1) | 550 (−1) | 55 (1) | 0.179 | 2.83 | 5.82 | 8.02 |
| 12 | 65 (1) | 27 (1) | 550 (−1) | 55 (1) | 0.218 | 2.62 | 4.26 | 8.38 |
| 13 | 55 (−1) | 21 (−1) | 650 (1) | 55 (1) | 0.200 | 5.01 | 4.67 | 9.28 |
| 14 | 65 (1) | 21 (−1) | 650 (1) | 55 (1) | 0.214 | 4.63 | 3.28 | 10.24 |
| 15 | 55 (−1) | 27 (1) | 650 (1) | 55 (1) | 0.214 | 2.61 | 8.42 | 8.90 |
| 16 | 65 (1) | 27 (1) | 650 (1) | 55 (1) | 0.229 | 2.59 | 5.92 | 10.94 |
| 17 | 50 (−2) | 24 (0) | 600 (0) | 50 (0) | 0.189 | 3.61 | 5.88 | 8.34 |
| 18 | 70 (2) | 24 (0) | 600 (0) | 50 (0) | 0.213 | 3.23 | 2.43 | 8.94 |
| 19 | 60 (0) | 18 (−2) | 600 (0) | 50 (0) | 0.153 | 6.71 | 1.89 | 8.90 |
| 20 | 60 (0) | 30 (2) | 600 (0) | 50 (0) | 0.217 | 2.54 | 7.39 | 7.52 |
| 21 | 60 (0) | 24 (0) | 500 (−2) | 50 (0) | 0.162 | 3.78 | 2.51 | 8.46 |
| 22 | 60 (0) | 24 (0) | 700 (2) | 50 (0) | 0.212 | 3.23 | 5.67 | 10.16 |
| 23 | 60 (0) | 24 (0) | 600 (0) | 40 (−2) | 0.180 | 4.04 | 2.99 | 7.58 |
| 24 | 60 (0) | 24 (0) | 600 (0) | 60 (2) | 0.217 | 3.31 | 5.37 | 9.72 |
| 25 | 60 (0) | 24 (0) | 600 (0) | 50 (0) | 0.213 | 3.67 | 3.41 | 6.70 |
| 26 | 60 (0) | 24 (0) | 600 (0) | 50 (0) | 0.211 | 3.29 | 2.82 | 6.08 |
| 27 | 60 (0) | 24 (0) | 600 (0) | 50 (0) | 0.216 | 3.17 | 3.18 | 6.38 |
| 28 | 60 (0) | 24 (0) | 600 (0) | 50 (0) | 0.209 | 3.22 | 3.01 | 6.50 |
| 29 | 60 (0) | 24 (0) | 600 (0) | 50 (0) | 0.217 | 3.19 | 3.39 | 6.26 |
| 30 | 60 (0) | 24 (0) | 600 (0) | 50 (0) | 0.201 | 3.20 | 3.46 | 6.36 |
| 31 | 60 (0) | 24 (0) | 600 (0) | 50 (0) | 0.221 | 3.41 | 3.34 | 6.32 |
| 32 | 60 (0) | 24 (0) | 600 (0) | 50 (0) | 0.209 | 3.29 | 2.98 | 6.26 |
| 33 | 60 (0) | 24 (0) | 600 (0) | 50 (0) | 0.215 | 3.17 | 2.72 | 5.92 |
| 34 | 60 (0) | 24 (0) | 600 (0) | 50 (0) | 0.207 | 3.25 | 3.31 | 6.24 |
| 35 | 60 (0) | 24 (0) | 600 (0) | 50 (0) | 0.212 | 3.24 | 3.37 | 6.30 |
| 36 | 60 (0) | 24 (0) | 600 (0) | 50 (0) | 0.222 | 3.39 | 3.06 | 5.98 |
| Source | DF | Unit Time Drying Rate (DR) | Unit Mass Drying Energy Consumption (DQ) | Mean Square Error of Moisture Content (MSE) | Kernel Color Parameter (∆E*) | ||||||||
|---|---|---|---|---|---|---|---|---|---|---|---|---|---|
| Coefficient | Sum of Squares | p-Value | Coefficient | Sum of Squares | p-Value | Coefficient | Sum of Squares | p-Value | Coefficient | Sum of Squares | p-Value | ||
| Model | 14 | −3.0668 | 0.017 | <0.0001 | 86.0392 | 31.11 | <0.0001 | 81.9638 | 85.6 | <0.0001 | 380.4542 | 69.04 | <0.0001 |
| x1 | 1 | 2.0817 × 10⁻² | 1.426 × 10⁻³ | <0.0001 | −6.1 × 10⁻¹ | 0.52 | 0.0001 | −1.2083 × 10⁻¹ | 12.2 | <0.0001 | −3.5860 | 1.53 | <0.0001 |
| x2 | 1 | 5.8694 × 10⁻² | 4.401 × 10⁻³ | <0.0001 | −1.8631 | 24.56 | <0.0001 | −1.4133 | 41.16 | <0.0001 | −4.7117 | 3.42 | <0.0001 |
| x3 | 1 | 4.505 × 10⁻³ | 3.528 × 10⁻³ | <0.0001 | −6.6583 × 10⁻² | 0.46 | 0.0002 | −1.145 × 10⁻¹ | 11.97 | <0.0001 | −4.5990 × 10⁻¹ | 4.28 | <0.0001 |
| x4 | 1 | 1.4917 × 10⁻² | 2.709 × 10⁻³ | <0.0001 | −6.2350 × 10⁻¹ | 0.56 | <0.0001 | −1.2782 | 8.06 | <0.0001 | −3.1013 | 8.10 | <0.0001 |
| x1×2 | 1 | 5.417 × 10⁻⁵ | 1.056 × 10⁻⁵ | 0.5670 | 3.6667 × 10⁻³ | 0.048 | 0.1684 | −2.0292 × 10⁻² | 1.48 | <0.0001 | 4.9167 × 10⁻³ | 0.087 | 0.2333 |
| x1x3 | 1 | −1.525 × 10⁻⁵ | 2.326 × 10⁻⁴ | 0.0126 | 3.55 × 10⁻⁴ | 0.13 | 0.0317 | −7.375 × 10⁻⁴ | 0.54 | 0.0066 | 5.5500 × 10⁻⁴ | 0.31 | 0.0312 |
| x1x4 | 1 | 1.025 × 10⁻⁴ | 1.051 × 10⁻⁴ | 0.0808 | 1.15 × 10⁻³ | 0.031 | 0.4641 | −3.375 × 10⁻³ | 0.11 | 0.1818 | 6.6500 × 10⁻³ | 0.44 | 0.0116 |
| x2x3 | 1 | −1.0417 × 10⁻⁵ | 3.906 × 10⁻⁵ | 0.2759 | −3.9167 × 10⁻⁴ | 0.055 | 0.1425 | 1.3708 × 10⁻³ | 0.68 | 0.0029 | 2.1083 × 10⁻³ | 1.60 | <0.0001 |
| x2x4 | 1 | −2.2917 × 10⁻⁴ | 1.891 × 10⁻⁴ | 0.0226 | −6.25 × 10⁻³ | 0.14 | 0.0241 | 8.0417 × 10⁻³ | 0.23 | 0.0617 | 8.5833 × 10⁻³ | 0.27 | 0.0440 |
| x3x4 | 1 | 4.75 × 10⁻⁶ | 2.256 × 10⁻⁵ | 0.4048 | 3.9 × 10⁻⁴ | 0.15 | 0.0195 | 8.025 × 10⁻⁴ | 0.64 | 0.0035 | 3.7500 × 10⁻⁴ | 0.14 | 0.1337 |
| x12 | 1 | −1.3792 × 10⁻⁴ | 3.804 × 10⁻⁴ | 0.0022 | 1.85 × 10⁻³ | 0.068 | 0.1046 | 8.9708 × 10⁻³ | 1.61 | <0.0001 | 2.3775 × 10⁻² | 11.31 | <0.0001 |
| x22 | 1 | −8.275 × 10⁻⁴ | 1.775 × 10⁻³ | <0.0001 | 3.8611 × 10⁻² | 3.86 | <0.0001 | 3.8391 × 10⁻² | 3.82 | <0.0001 | 5.4097 × 10⁻² | 7.59 | <0.0001 |
| x32 | 1 | −2.7792 × 10⁻⁶ | 1.545 × 10⁻³ | <0.0001 | 2.7 × 10⁻⁵ | 0.15 | 0.0219 | 8.3208 × 10⁻⁵ | 1.38 | <0.0001 | 3.0475 × 10⁻⁴ | 18.57 | <0.0001 |
| x42 | 1 | −1.6292 × 10⁻⁴ | 5.308 × 10⁻⁴ | 0.0005 | 4.4 × 10⁻³ | 0.39 | 0.0006 | 9.2208 × 10⁻³ | 1.7 | <0.0001 | 2.3875 × 10⁻² | 11.40 | <0.0001 |
| Residual | 21 | 6.555 × 10⁻⁴ | 0.50 | 1.26 | 1.21 | ||||||||
| Lack of fit | 10 | 2.652 × 10⁻⁴ | 0.6729 | 0.27 | 0.3160 | 0.58 | 0.5372 | 0.71 | 0.2435 | ||||
| Pure error | 11 | 3.903 × 10⁻⁴ | 0.22 | 0.68 | 0.50 | ||||||||
| Total | 35 | 0.018 | 31.61 | 86.85 | 70.25 | ||||||||
| R2 | 0.9627 | 0.9842 | 0.9856 | 0.9827 | |||||||||
| Adj-R2 | 0.9378 | 0.9737 | 0.9759 | 0.9712 | |||||||||
| Perd-R2 | 0.8865 | 0.9415 | 0.9525 | 0.9334 | |||||||||
| Adeq. precision | 24.401 | 42.445 | 42.177 | 27.302 | |||||||||
| PRESS | 0.002 | 1.85 | 4.13 | 4.68 | |||||||||
| CV | 2.82 | 4.20 | 6.36 | 3.04 | |||||||||
| Index Evaluation | Predicted Value | Test Value |
|---|---|---|
| Unit time drying rate (DR), %/min | 0.215 | 0.211 ± 0.01 |
| Unit mass drying energy consumption (DQ), kW·h/kg | 3.03 | 2.99 ± 0.08 |
| Mean square error of moisture content (MSE), % | 2.93 | 2.89 ± 0.65 |
| Kernel color parameter (∆E*) | 6.42 | 6.49 ± 0.31 |
| Control Groups | Db | dM, mm |
|---|---|---|
| RMC (shell: 6.89%, kernel: 2.31%) | 1.65 ± 0.04 | 10.22 ± 0.49 |
| CMC (shell: 9.41%, kernel: 11.27%) | 1.77 ± 0.05 | 15.65 ± 0.53 |
Disclaimer/Publisher’s Note: The statements, opinions and data contained in all publications are solely those of the individual author(s) and contributor(s) and not of MDPI and/or the editor(s). MDPI and/or the editor(s) disclaim responsibility for any injury to people or property resulting from any ideas, methods, instructions or products referred to in the content. |
© 2023 by the authors. Licensee MDPI, Basel, Switzerland. This article is an open access article distributed under the terms and conditions of the Creative Commons Attribution (CC BY) license (https://creativecommons.org/licenses/by/4.0/).
Share and Cite
Li, L.; Man, X.; Zhang, H.; Lan, H.; Tang, Y.; Fan, X.; Zhang, Y. Determination of Critical Moisture Content Facing Walnut Shell Breaking and Optimization of Combined Hot Air and Microwave Vacuum Drying Process. Appl. Sci. 2023, 13, 13287. https://doi.org/10.3390/app132413287
Li L, Man X, Zhang H, Lan H, Tang Y, Fan X, Zhang Y. Determination of Critical Moisture Content Facing Walnut Shell Breaking and Optimization of Combined Hot Air and Microwave Vacuum Drying Process. Applied Sciences. 2023; 13(24):13287. https://doi.org/10.3390/app132413287
Chicago/Turabian StyleLi, Long, Xiaolan Man, Hong Zhang, Haipeng Lan, Yurong Tang, Xiuwen Fan, and Yongcheng Zhang. 2023. "Determination of Critical Moisture Content Facing Walnut Shell Breaking and Optimization of Combined Hot Air and Microwave Vacuum Drying Process" Applied Sciences 13, no. 24: 13287. https://doi.org/10.3390/app132413287
APA StyleLi, L., Man, X., Zhang, H., Lan, H., Tang, Y., Fan, X., & Zhang, Y. (2023). Determination of Critical Moisture Content Facing Walnut Shell Breaking and Optimization of Combined Hot Air and Microwave Vacuum Drying Process. Applied Sciences, 13(24), 13287. https://doi.org/10.3390/app132413287