Article

Multi-Defect Detection Network for High-Voltage Insulators Based on Adaptive Multi-Attention Fusion

1
Hubei Provincial Engineering Technology Research Center for Power Transmission Line, China Three Gorges University, Yichang 443002, China
2
College of Electrical Engineering and New Energy, China Three Gorges University, Yichang 443002, China
3
College of Mechanical and Power Engineering, China Three Gorges University, Yichang 443002, China
*
Author to whom correspondence should be addressed.
Appl. Sci. 2023, 13(24), 13351; https://doi.org/10.3390/app132413351
Submission received: 20 November 2023 / Revised: 13 December 2023 / Accepted: 15 December 2023 / Published: 18 December 2023
(This article belongs to the Special Issue Applications of Deep Learning and Artificial Intelligence Methods)

Abstract

:
Insulators find extensive use across diverse facets of power systems, playing a pivotal role in ensuring the security and stability of electrical transmission. Detecting insulators is a fundamental measure to secure the safety and stability of power transmission, with precise insulator positioning being a prerequisite for successful detection. To overcome challenges such as intricate insulator backgrounds, small defect scales, and notable differences in target scales that reduce detection accuracy, we propose the AC-YOLO insulator multi-defect detection network based on adaptive attention fusion. To elaborate, we introduce an adaptive weight distribution multi-head self-attention module designed to concentrate on intricacies in the features, effectively discerning between insulators and various defects. Additionally, an adaptive memory fusion detection head is incorporated to amalgamate multi-scale target features, augmenting the network’s capability to extract insulator defect characteristics. Furthermore, a CBAM attention mechanism is integrated into the backbone network to enhance the detection performance for smaller target defects. Lastly, improvements to the loss function expedite model convergence. This study involved training and evaluation using publicly available datasets for insulator defects. The experimental results reveal that the AC-YOLO model achieves a notable 5.1% enhancement in detection accuracy compared to the baseline. This approach significantly boosts detection precision, diminishes false positive rates, and fulfills real-time insulator localization requirements in power system inspections.

1. Introduction

Amidst the swift progression of the economy, the escalating need for electrical power presents challenges in maintaining and repairing the power grid infrastructure. Insulators, serving as essential components of high-voltage transmission lines, deliver both electrical insulation and mechanical support [1]. Nonetheless, insulators are vulnerable to defects such as spontaneous explosion, fracture, and flashover, attributed to influences such as atmospheric conditions and mechanical stress. More importantly, insulator defects represent one of the primary sources of power system failures, responsible for over half of all incidents. Consequently, the expedient and precise detection and characterization of insulators and their defects carry substantial practical implications for maintenance and repair staff.
It is acknowledged that the detection process of high-voltage insulators can be accomplished through conventional image processing algorithms, based on techniques such as background removal, masking, contouring, and BW conversion [2,3]. Traditional image processing algorithms primarily rely on manually designed feature structures for the target. For instance, in the work by Zhai et al. [4], based on the spatial morphological consistency of insulators, significant detection was performed on inspection images to identify candidate regions of insulators. Subsequently, descriptors characterizing the insulator features were defined based on the projection curves obtained after binary segmentation of the candidate regions. This augmentation enables precise localization of insulator strings. However, this approach not only requires sufficient prior knowledge but also heavily depends on manually designed features, resulting in poor generalization and difficulty in application across different scenarios in electrical engineering.
Owing to the advancements in deep learning technology [5,6,7], defect detection techniques grounded on convolutional neural networks (CNNs) [8] have gained popularity. In contrast with traditional insulator defect detection methodologies, deep learning-based approaches can discern defect areas more accurately, even amidst complex backgrounds or occlusions, and they do not demand additional information. Therefore, it is necessary to employ deep learning methods for insulator detection. The current deep learning-based target detection techniques can be bifurcated into two categories. The first encompasses two-stage deep learning target detection algorithms that utilize Faster R-CNN [9]. For instance, Ni et al. [10] put forth an enhanced Faster R-CNN-based method to identify faults in key components of transmission lines. This method merges the Inception [11] and ResNet101 [12] networks to establish a feature extraction network and accomplishes accurate identification of defective parts via target positioning and classification. Lin et al. [13] introduced a size-corrected CNN-based strategy for locating and classifying defects in insulator strings. This approach utilizes laser radars to compute the unmanned aerial vehicle (UVA) correction vector, ensuring consistent spatial dimensions of insulators. Furthermore, it employs Faster R-CNN for the purpose of defect detection. Despite this method providing high detection accuracy and excelling in the detection of small targets, its two-stage detection methodology introduces increased model complexity and a considerable number of parameters, which subsequently results in diminished detection speeds. The second category encompasses single-stage target detection algorithms, among which YOLO [14,15,16] is frequently employed. Huang et al. [17] proposed an automatic insulator detection method using the YOLOv5 target detection model. This method effectively identifies and localizes insulator defects on transmission lines by implementing the K-means clustering technique. Han et al. [18] suggested the MobilenetV1-YOLOv4 network, which integrates Mobilenetv1 with the channel attention mechanism in YOLOv4, thereby achieving a lightweight detection model; however, this approach results in suboptimal detection accuracy. Xu et al. [19] employed Ghostnet to reconfigure the extraction network in YOLOv4 and incorporated the channel attention mechanism into the path aggregation network, aiming to accelerate the detection speed of insulator defects. Nonetheless, the detection accuracy of this method reaches only 0.77%.
Despite the notable results achieved in insulator and defect detection by the aforementioned studies, the primary focus has been on insulator self-explosion defects, with other types of defects receiving less attention. Furthermore, the majority of the improved models prioritize enhancing the model’s speed at the cost of accuracy. This trade-off complicates the algorithms’ ability to meet the inspection requirements in practical applications.
In response to these challenges, we propose in this paper an insulator multi-defect detection network, AC-YOLO, grounded on an adaptive multi-attention fusion framework based on the YOLOv5 algorithm. This study’s main contributions can be summarized as follows:
(1) An adaptive weight distribution multi-head self-attention module (AWDMSM) was designed to replace certain CSP modules in the backbone feature extraction network and the path aggregation network. This helps eradicate disturbances emanating from complex backgrounds. The module establishes a balance between local and global information, effectively resolving the challenge of distinguishing between insulators and defects amidst complex backgrounds.
(2) We developed an adaptive memory fusion detection head (AMFDH), superseding the original YOLO detection head. This new design fully decouples the regression and classification tasks, markedly enhancing the model’s convergence speed and small target detection accuracy.
(3) CBAM (convolutional block attention module) was integrated into the C3 (cross-stage partial network) module to underscore the critical shallow features and suppress irrelevant information. This allows for the accurate localization of small target defects in the network and augments the overall feature representation capability of the network.
(4) The SIoU (structural similarity intersection over union) regression loss function was employed to concentrate on high-quality anchor boxes, thereby accelerating the network’s convergence speed.
The improvements highlighted above strike a balance between weighing accuracy and speed. Finally, validation using a dataset containing normal insulators, breakage insulators, and flashover insulator defects demonstrates the effectiveness of the improved algorithm.

2. YOLOv5 Target Detection Network

YOLOv5 is the fifth version of the YOLO series of algorithms and is a target detection algorithm further optimized and improved based on YOLOv4, with the advantages of a fast detection speed, high detection accuracy, easy deployment of edge devices, etc. YOLOv5 is divided into five different models according to the sub-module width and depth, namely, YOLOv5n, YOLOv5s, YOLOv5m, YOLOv5l, and YOLOv5x. These five models gradually improve with the increase in model volume. With the increase of the model volume, the detection accuracy gradually improves in these five models. Considering the real-time detection and accuracy in real scenarios, the YOLOv5s-6.1 model was chosen as the benchmark model for insulator multi-defect detection in this paper. The YOLOv5s network structure is shown in Figure 1.
YOLOv5, as a whole, consists of four parts: the input side, the backbone feature extraction network, the neck network, and the prediction header. The input side uses mosaic data enhancement, adaptive anchor frame calculation, and adaptive image scaling operations to enrich the dataset, alleviate model overfitting, and improve the overall model performance. For the backbone feature extraction network part, YOLOv5 version 6.1 replaces the Focus module, the first layer of the network, with a 6 × 6 sized convolutional layer, both of which are equivalent in feature extraction but are more efficient for training on certain GPU devices: the C3 module achieves feature fusion and improves the computational speed by residual linking and embedding multiple bottleneck modules; the SPPF module uses multiple small-sized pooling. The SPPF module uses multiple small-size pooling kernels cascaded instead of a single large-size pooling kernel in the SPP (spatial pyramid pooling) module, which further improves the operation speed while retaining the original functionality. Neck feature fusion adopts the FPN (feature pyramid network) and the PANet (path aggregation network) to realize the fusion of deep semantic features and shallow location features and to enhance the fusion of information at multiple scales. The prediction head part, which receives the feature maps of different scales delivered by Neck, uses the GIoU (generalized intersection over union) bounding box loss function to speed up the model convergence and employs non-maximal inhibition to filter the target frames to form three prediction layers, which are used for predicting and regressing the targets. The components of the YOLOv5s network are shown in Figure 2.

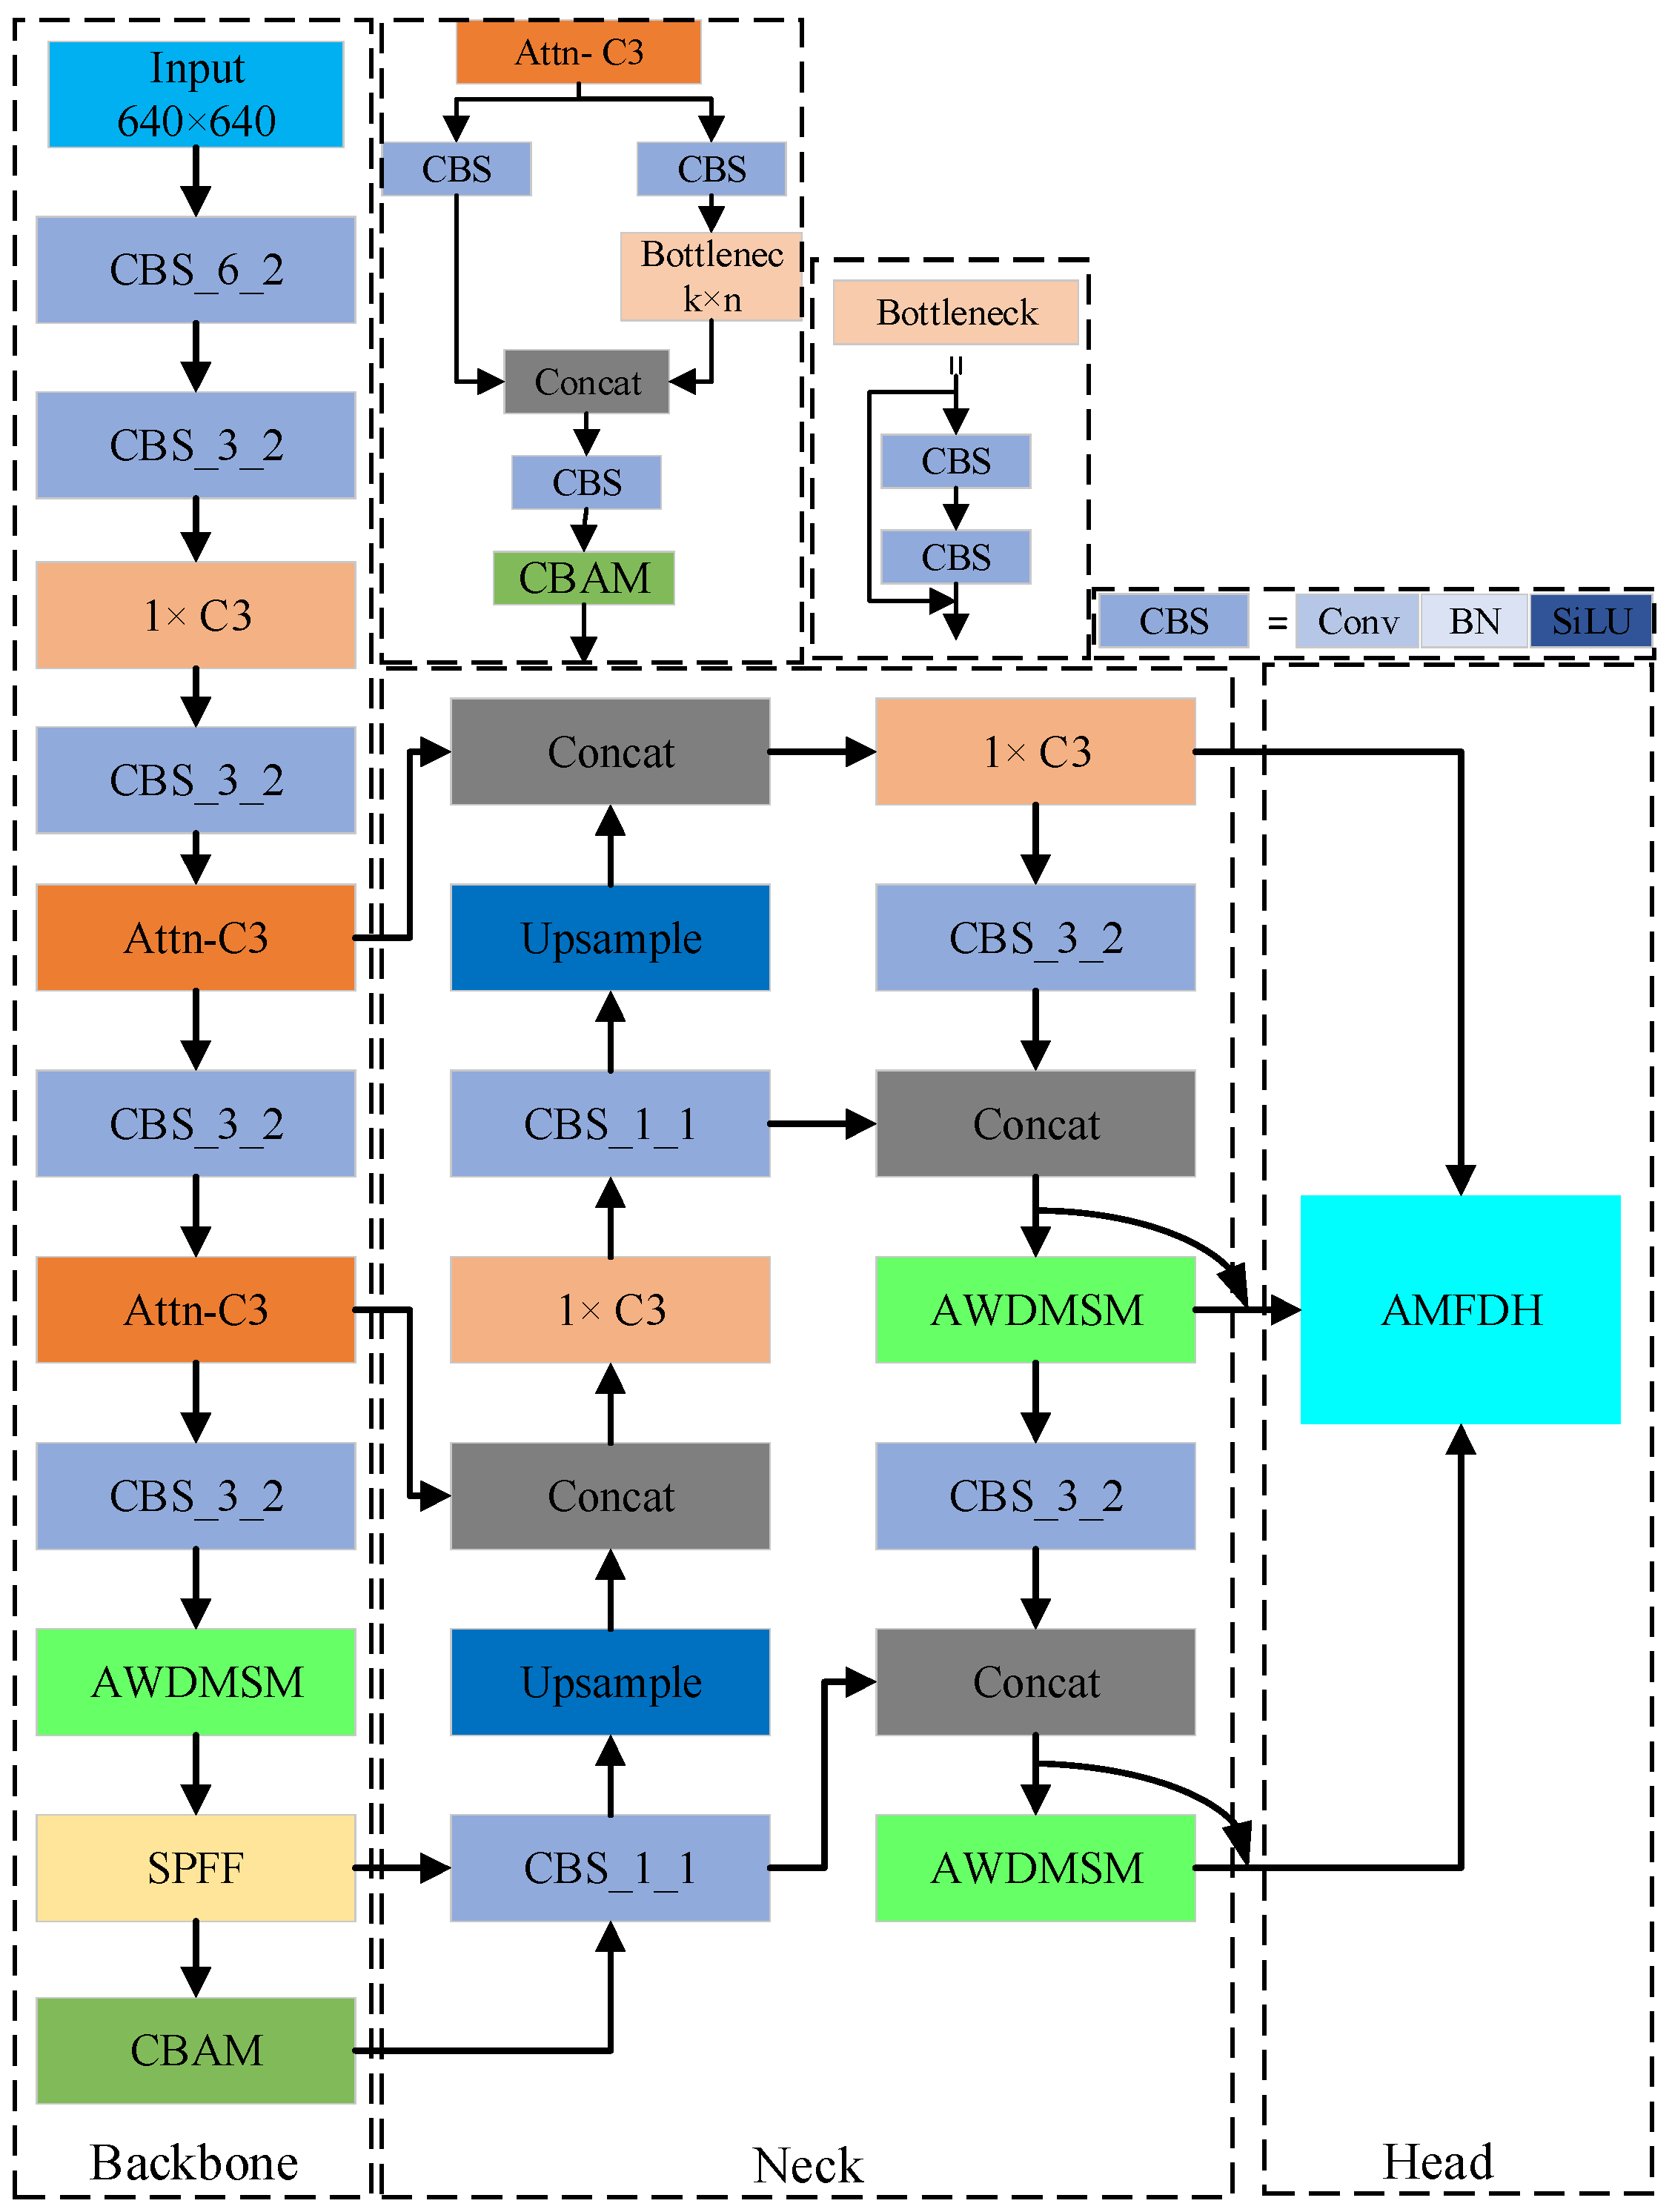
3. AC-YOLO Target Detection Network

The model AC-YOLO proposed in this paper is improved based on YOLOv5. Its structure is shown in Figure 3. At first, the AWDMSM (adaptive weight distribution multi-head self-attention module) is substituted for some of the C3 modules in the backbone network and path aggregation network, enhancing the processing capability of the features from different layers and improving the insulator and defect discrimination ability. Secondly, using AMFDH (adaptive memory fusion detection head), adaptive learning of the importance of the features is undertaken to reduce the conflict of feature information in different demands and introducing CBAM attention to construct the Attn-C3 (attention cross-stage partial network) module after the backbone output to refine the features to increase the attention of insulator defects. Finally, the SIoU function is used in the bounding box loss calculation to accelerate the model convergence. The above-improved parts together constitute the basic structure of the AC-YOLO network.

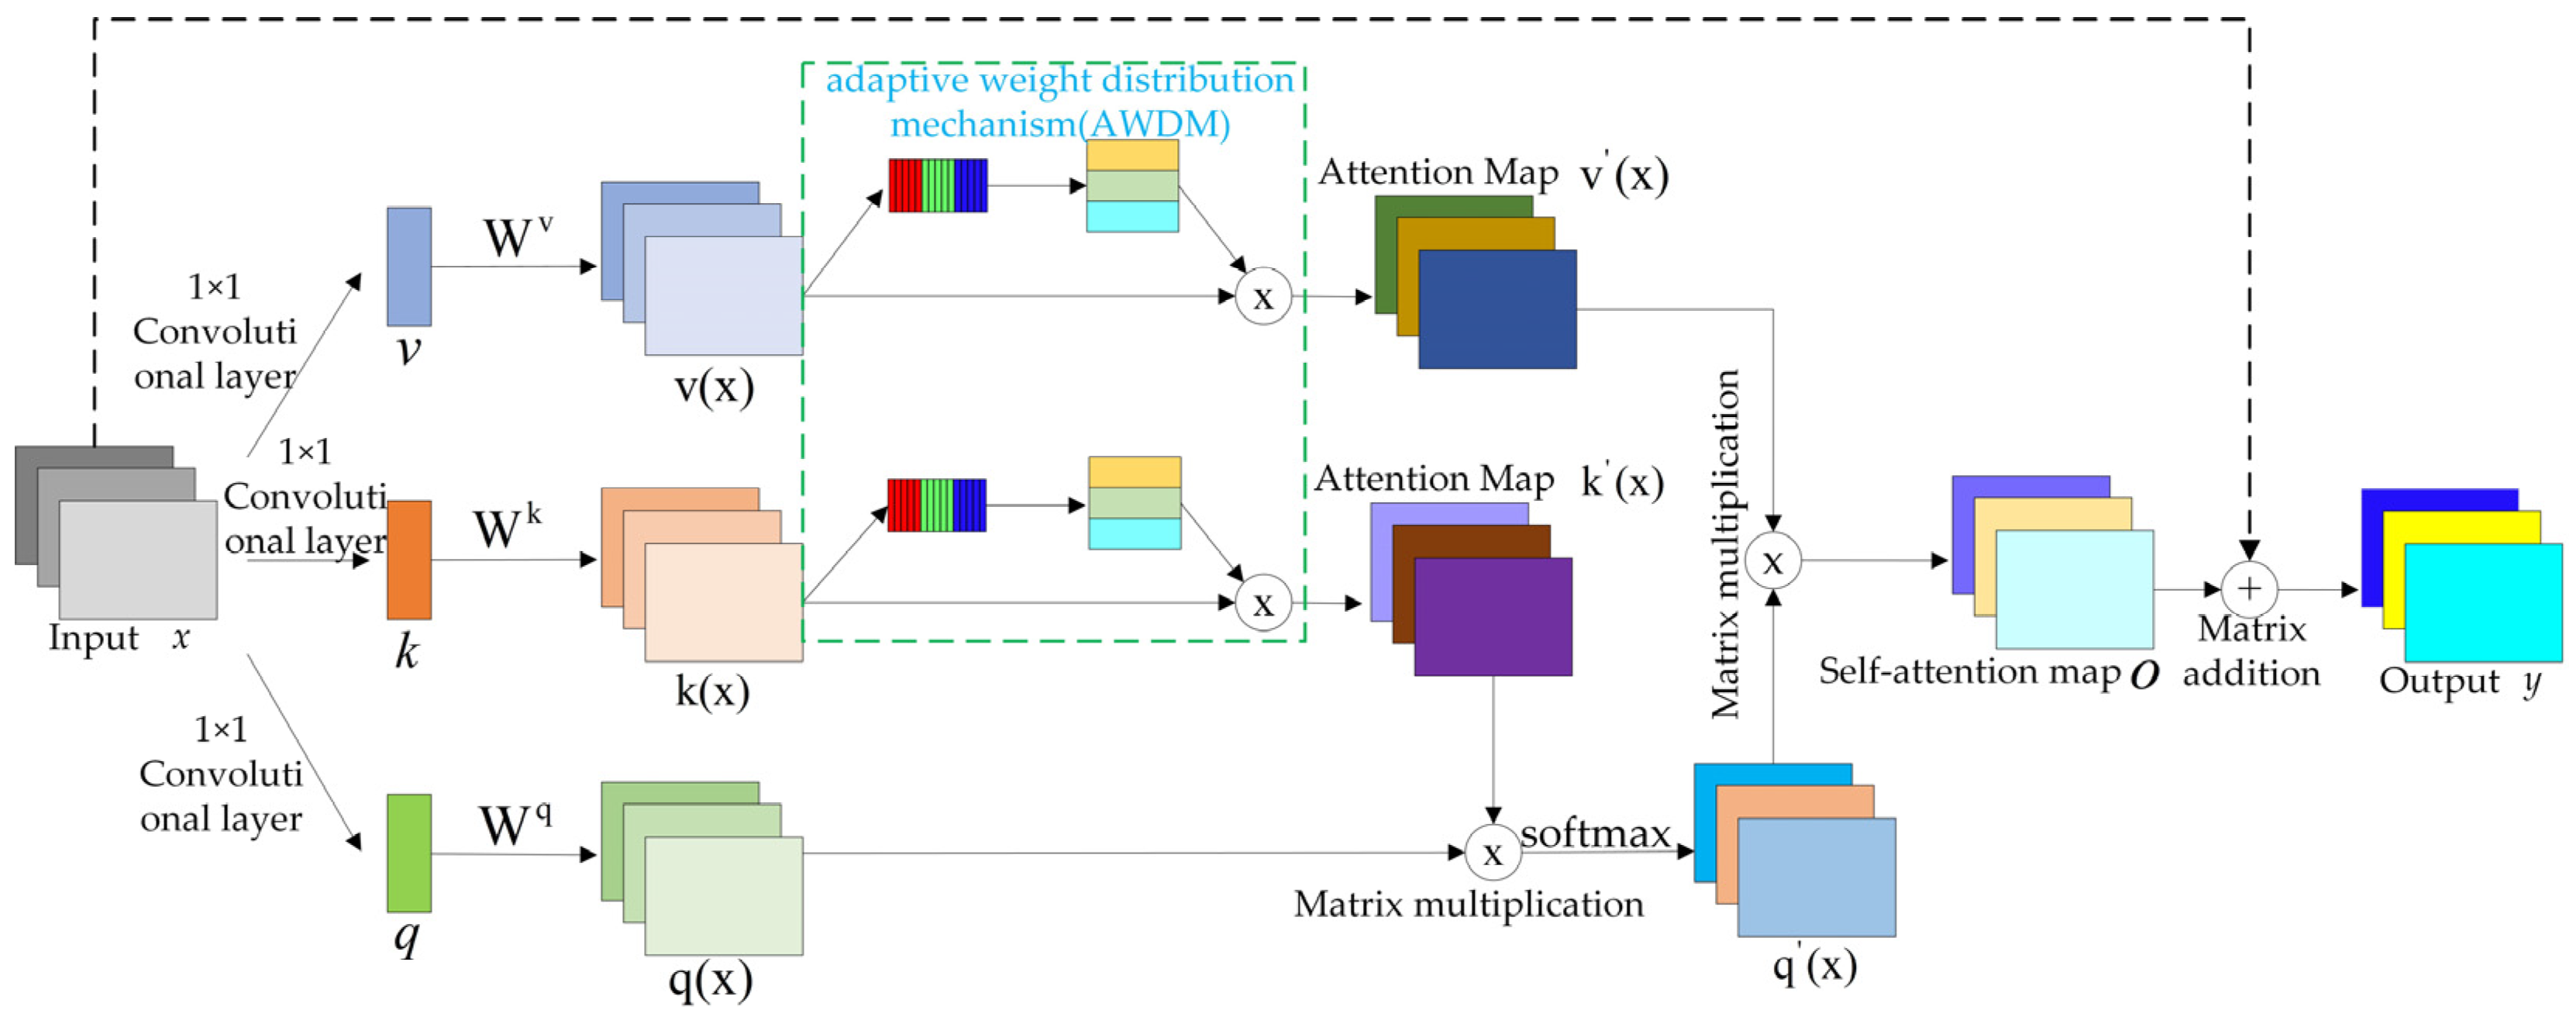
3.1. Adaptive Weight Distribution Multi-Head Self-Attention Module

The complex diversity of the background of the high-voltage overhead transmission line and the distance of the UAV aerial photography result in the insulator defect target being detected with relatively little pixel information in the image. In this case, the original YOLOv5 model is susceptible to the interference of complex background information and other fixtures on the transmission line when extracting insulator breakage and flashover features, thus affecting the ability to extract and discriminate effective features of insulators and their defects. To completely utilize the computational resources and focus attention on the extraction of key information about insulators and their surface defects, Ashish et al. [20] proposed a multi-head self-attention mechanism in which each head learns a set of weights, which is used to weigh combinations of features for each head’s attention. It allows more attention to be focused on the feature information of the insulators and their local defects in the labeled region, which leads to a more effective distinction between the complex background and the insulator region. However, the multi-head attention mechanism assigns relatively fixed weights to the insulator and defect process, and there is a problem of unbalanced weight distribution, which makes it difficult for the model to distinguish insulators and their defects, thus affecting the convergence effect of the model. To solve this problem, this paper introduces the AWDM (adaptive weight distribution mechanism) module based on the multi-head self-attention mechanism to design a new AWDMSM (adaptive weight distribution multi-head self-attention module), the structure of which is shown in Figure 4. The introduction of the AWDMSM makes the model more flexible in combining and weighing different features in the training process. Specifically, the model assigns smaller weights to large targets that are easy to detect, such as normal insulators, and larger weights to small targets that are not easy to detect, such as insulator breakage and flashover. This significantly reduces the difficulty of the model in distinguishing insulators and their defects, thus accelerating the convergence of the model.
The locally extracted feature map x is utilized as the input, and three 1 × 1 convolution operations are performed to yield three feature vectors: q, k, and v. The objective of these convolution operations is to encode the positional information of each feature, thereby bolstering the model’s perception of sequence structure capability. Subsequently, the correlations q(x), k(x), and v(x) between the corresponding local area features and global features are computed utilizing Equation (1):
q ( x ) = W q · q k ( x ) = W k · k v ( x ) = W v · v ,
where Wq, Wk, and Wv are weight matrices, which are learned during training.
The imbalance between semantic and location information during the feature extraction process curtails the model’s detection accuracy. To address this, we propose the AWDM, the structure of which is illustrated in Figure 5. In the AWDM, first, input the feature layer Xn (where n ∈ [0,1,2]) with positional encoding. Subsequently, each feature layer undergoes separate global average pooling to condense its spatial information. These pooled feature layers are then integrated to obtain the global balanced feature layer Z1×1×λ, where λ = λ0 + λ1 + λ2. Following that, the globally balanced feature layer is deployed to equalize the location and semantic information of both shallow and deep layers through the application of Equation (2). The assigned weights, denoted as Λi, of the output feature layer are learned via full connection in a defined proportion. Finally, the assigned weights are used to enhance the original feature layer information to output each attention graph as R H i × W i × K i , where R is k ( x ) or v ( x ) , as shown in Equation (3):
Λ i = F i ( Z ) ,   i { 0 , 1 , 2 } ,
P i = X i × Λ i ,   i { 0 , 1 , 2 } ,
where F(·) denotes the fully connected operation and Ki denotes the number of channels of the i output feature map.
The self-attention output feature map is obtained using Equations (4)–(6):
S i j = k ( x i ) T q ( x j ) ,
β j , i = exp ( S i j ) / i = 1 N exp ( S i j ) ,
O = i n β j i / λ i n v ( x i ) n j ,
where i is the row of the matrix; j is the column of the matrix; n[1…,d…,d], where d is the feature dimension, and n is the row or column of the feature matrix; λ is the scaling factor used to avoid the problem of very small gradients; and O = (o1, o2, …, od) represents the self-attention output feature map. The final output of this module is as shown in Equation (7):
y i = ξ O i + x i ,
where xi is the input feature layer, yi is the output feature layer, and ξ is the weight factor, which is initialized to 0 so that the module can fully utilize the initial local information and gradually assign weights to key local features through the learning of the parameter ξ.

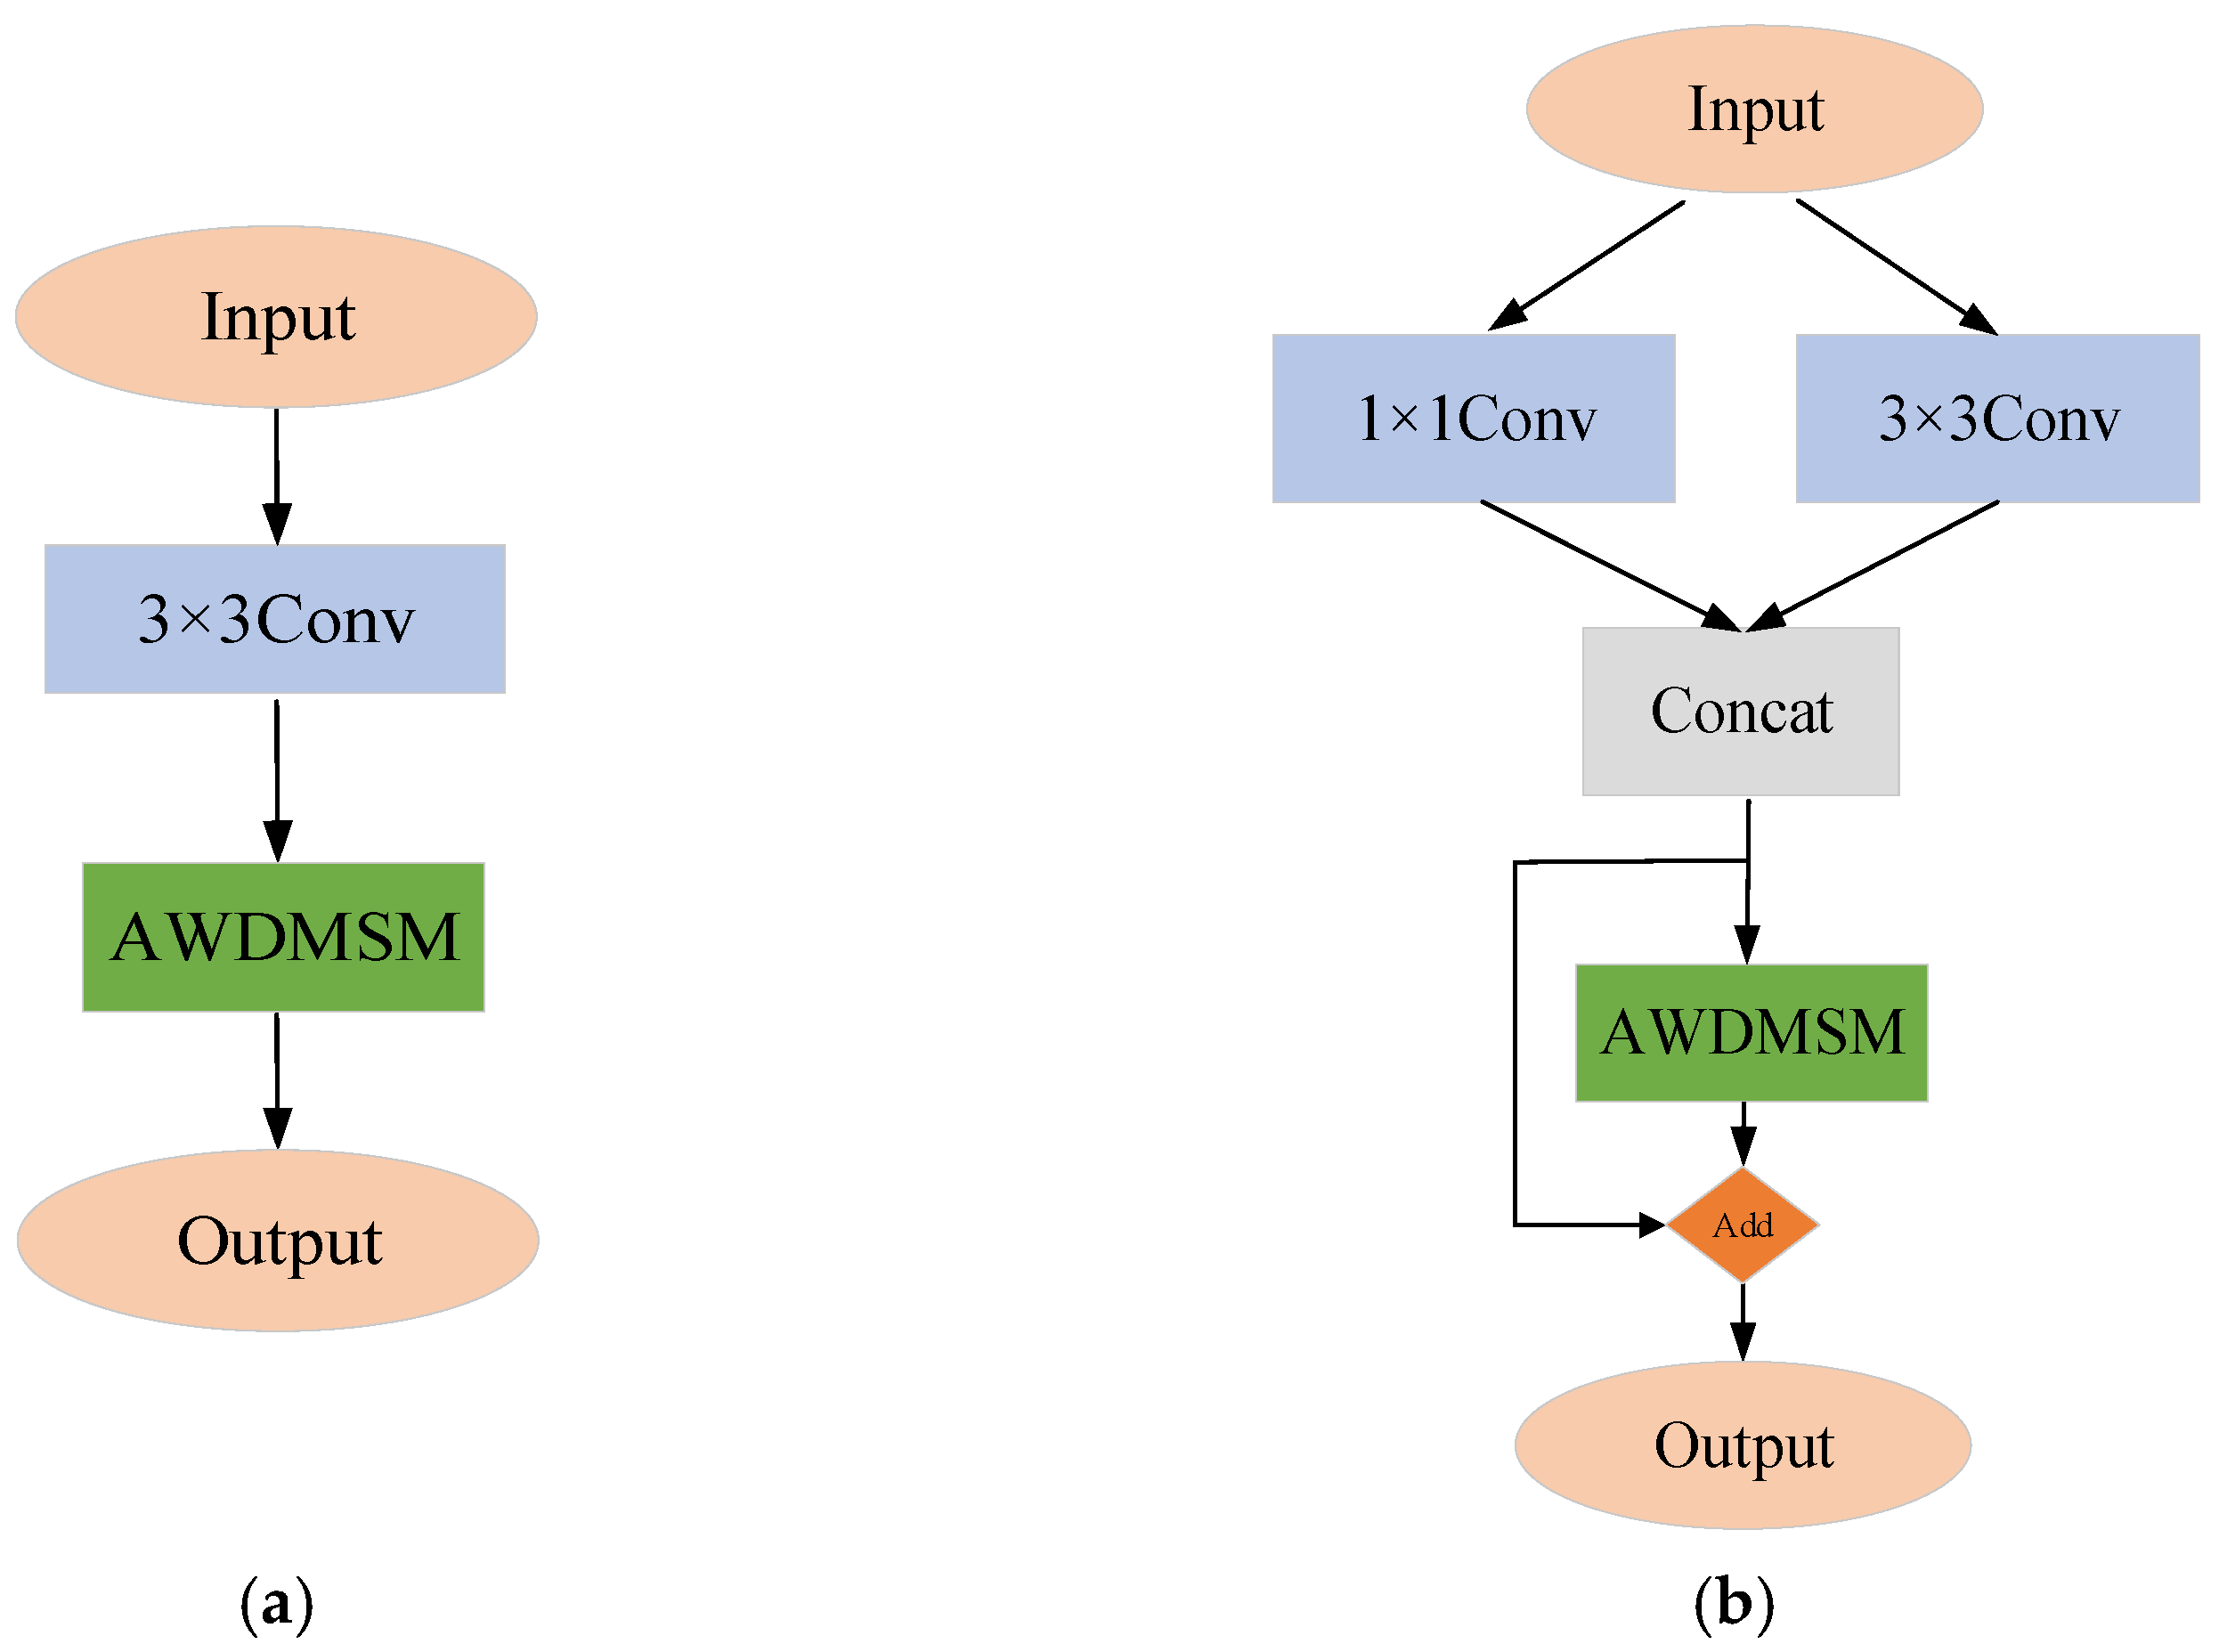
3.2. Embedded AWDMSM Module

The CSP module in YOLOv5 enhances the learning performance of CNN, yet its overutilization can result in network model overfitting or underfitting, particularly when managing small datasets that comprise vital multi-target information. To address this issue, we introduce the AWDMSM as a replacement for the CSP module in both the final layer of the backbone and the PANet. The structural diagram is depicted in Figure 6.
Figure 6a details the method of embedding within the backbone. After the extraction of 3 × 3 size convolutional features, the feature map is consolidated from local to global information via the AWDMSM module. At this stage, the feature information is sufficiently abundant; thus, no residual connection is performed to curtail the consumption of computational resources.
In the YOLOv5 algorithm, the features drawn out by the feature pyramid undergo only a simple residual-free bottleneck block process. This process proves to be too rudimentary, and the superfluous part of the features extracted by the feature pyramid can negatively influence the ultimate detection outcomes. Therefore, the post-processing module of the feature pyramid necessitates further feature filtration, discarding irrelevant information and preserving only the most effective information to attain the optimal detection effect. The embedding process is showcased in Figure 6b.
As depicted in Figure 6b, the integration method of the path aggregation network is illustrated. The input feature maps undergo a 1 × 1 convolution for information refinement and a 3 × 3 convolution for feature extraction. Subsequently, these extracted features are introduced into the AWDMSM module for high-semantic feature classification. Ultimately, feature fusion is accomplished using the original feature maps through the residual structure’s skip connection. This technique successfully resolves the vanishing gradient issue prevalent in deep neural networks and expedites the convergence of the training process.
By simultaneously integrating these two modules into the network, the model’s perceptual field is expanded, thereby augmenting the network’s learning capacity, which results in superior detection outcomes.

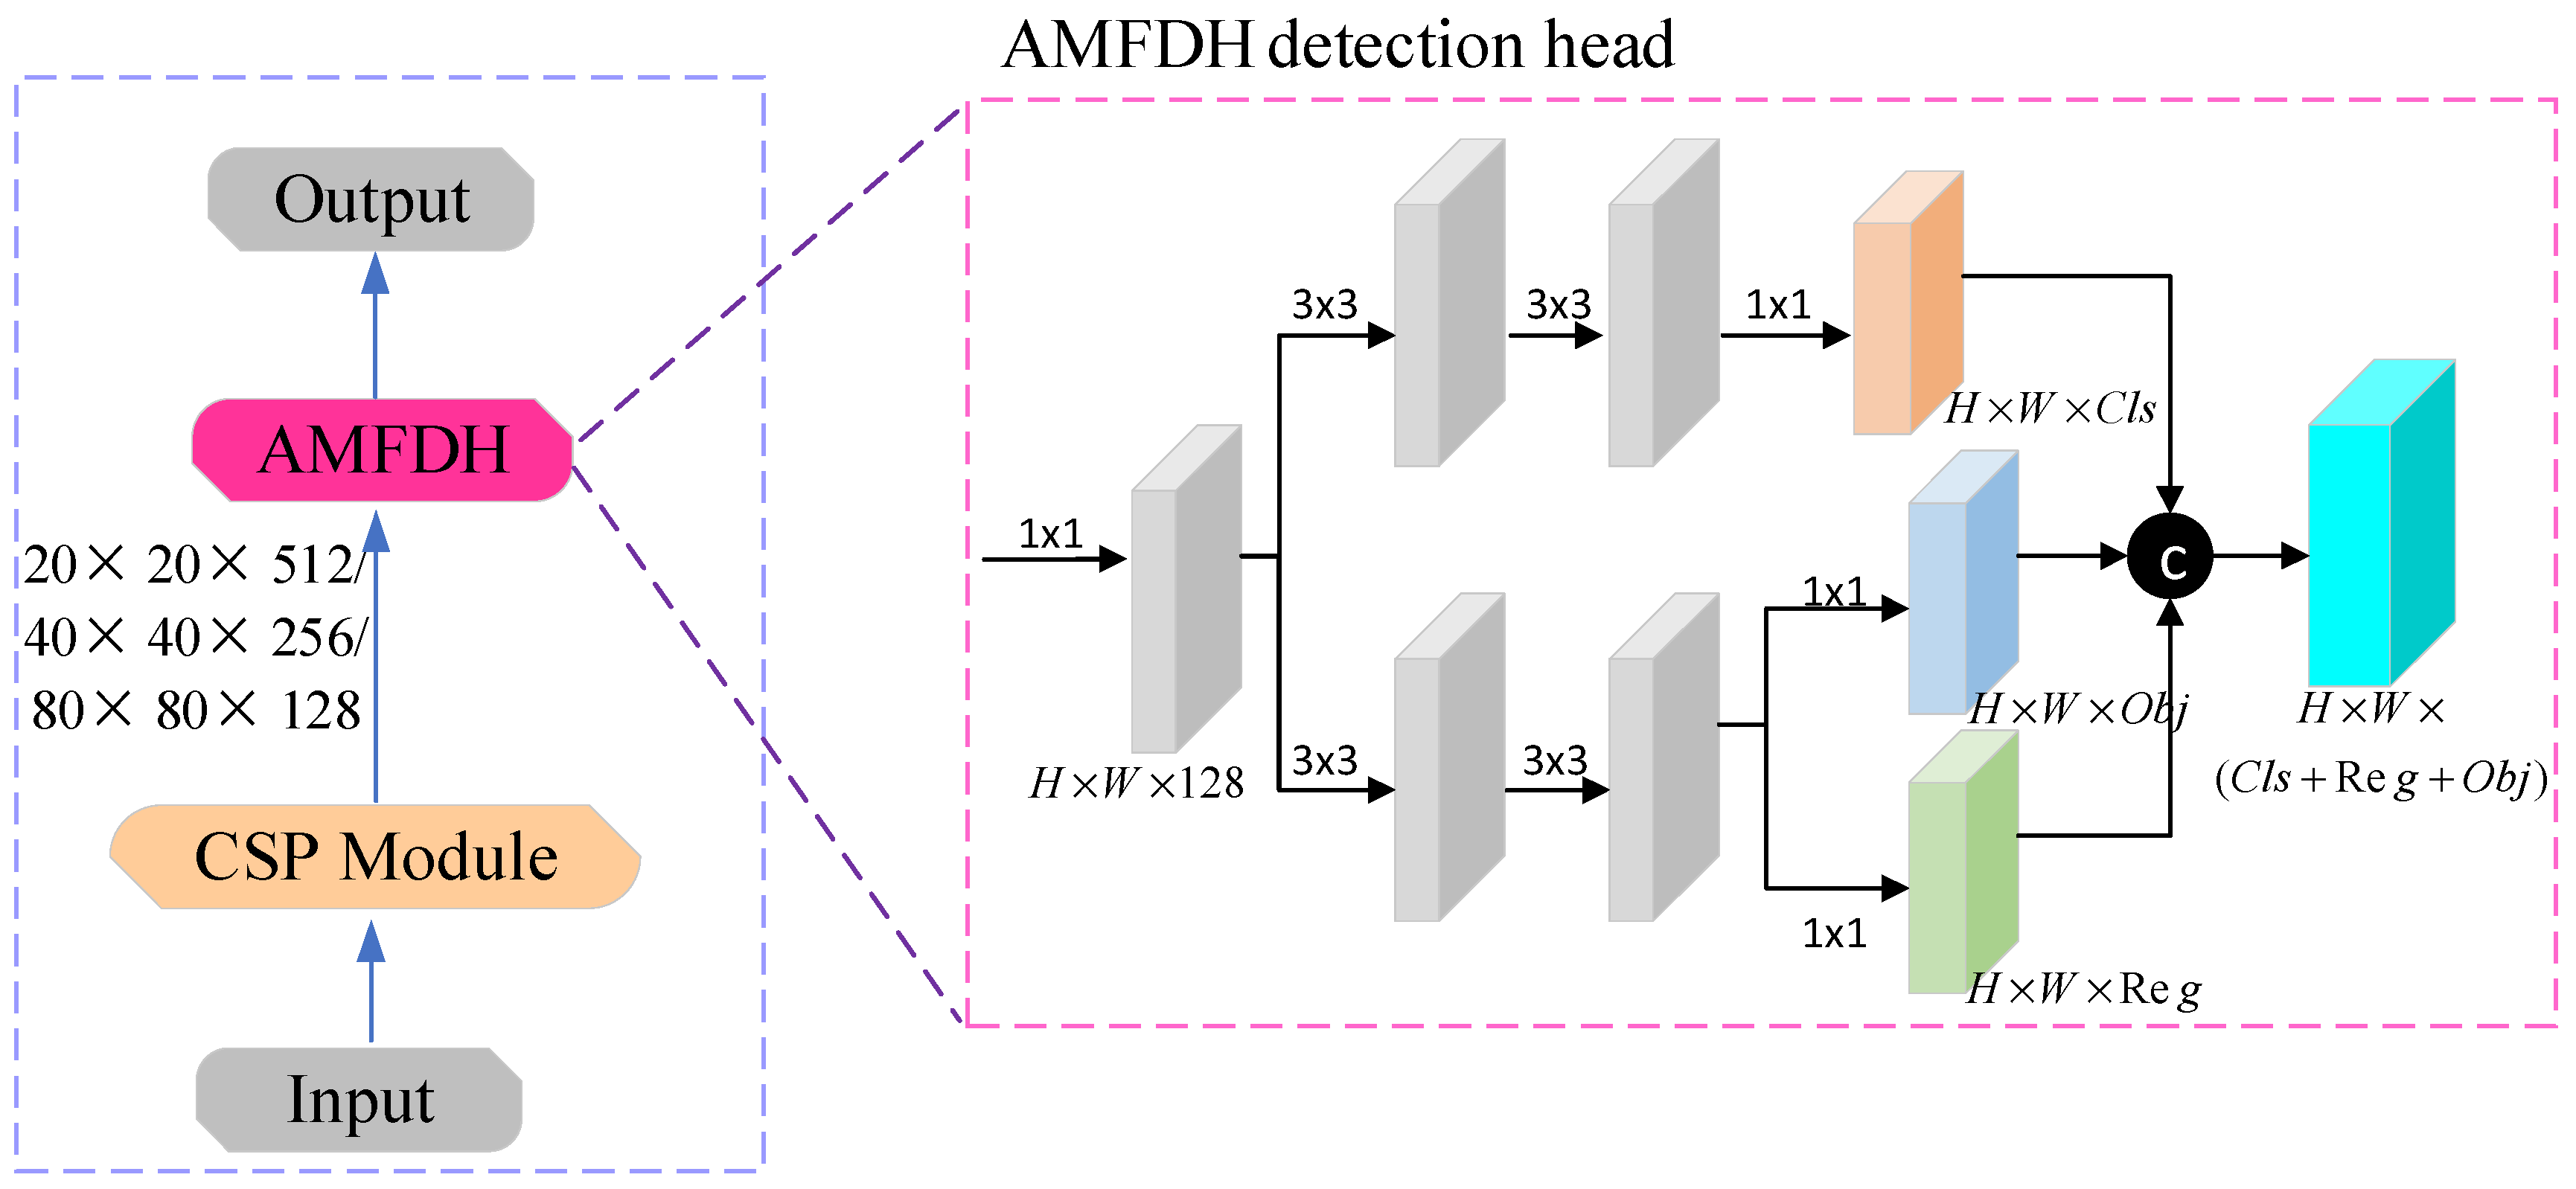
3.3. Adaptive Memory Fusion Detection Head

Given the significant size variation between insulators and their defective targets, conventional detection head structures that perform classification and regression simultaneously can lead to weight-sharing issues. These issues may cause the model to underperform in one task, impeding accurate differentiation between large and small targets. Taking into account the distinctive focuses of classification and regression tasks, we introduce the AMFDH (adaptive memory fusion detection head) in this paper. This approach utilizes distinct branches to execute these tasks, allowing for individual adjustment of the weights for each task. This ultimately enhances the model’s convergence speed and overall performance. The architecture of the AMFDH is illustrated in Figure 7.
Firstly, high semantic features of 20 × 20, 40 × 40, and 80 × 80 are standardized to 128 dimensions using a 1 × 1 convolutional layer. This process merges feature information and decreases the computational requirements. Following this, a pair of 3 × 3 convolutional layers are employed to handle the target classification and localization tasks for the insulators and their assorted defects independently and in parallel. This encourages feature decoupling and channel attention, allowing the model to better apprehend both global and local features of the insulator targets. This ultimately enhances the model’s aptitude for differentiating objects from backgrounds and improves the model’s detection accuracy and resilience. The target positioning branch also computes the confidence of the prediction box. Lastly, three 1 × 1 convolutional layers output the detection target category vector, detection box coordinate vector, and detection box confidence vector.
The conventional SiLU activation function, usually implemented in the decoupling detection head, typically has a fixed shape. As the shape of the activation function cannot adaptively adjust, it curtails the model’s expressive capability and performance. To overcome this limitation, we replaced it with the Meta-ACON [21] activation function, which adaptively adjusts to the shapes of diverse input features. This improvement increases the robustness, the adaptability, and the capability to effectively handle noise and outliers within the input features.
To showcase the superiority of the Meta-ACON activation function, we substituted it for various activation functions within the AMFDH. The results are displayed in Table 1.

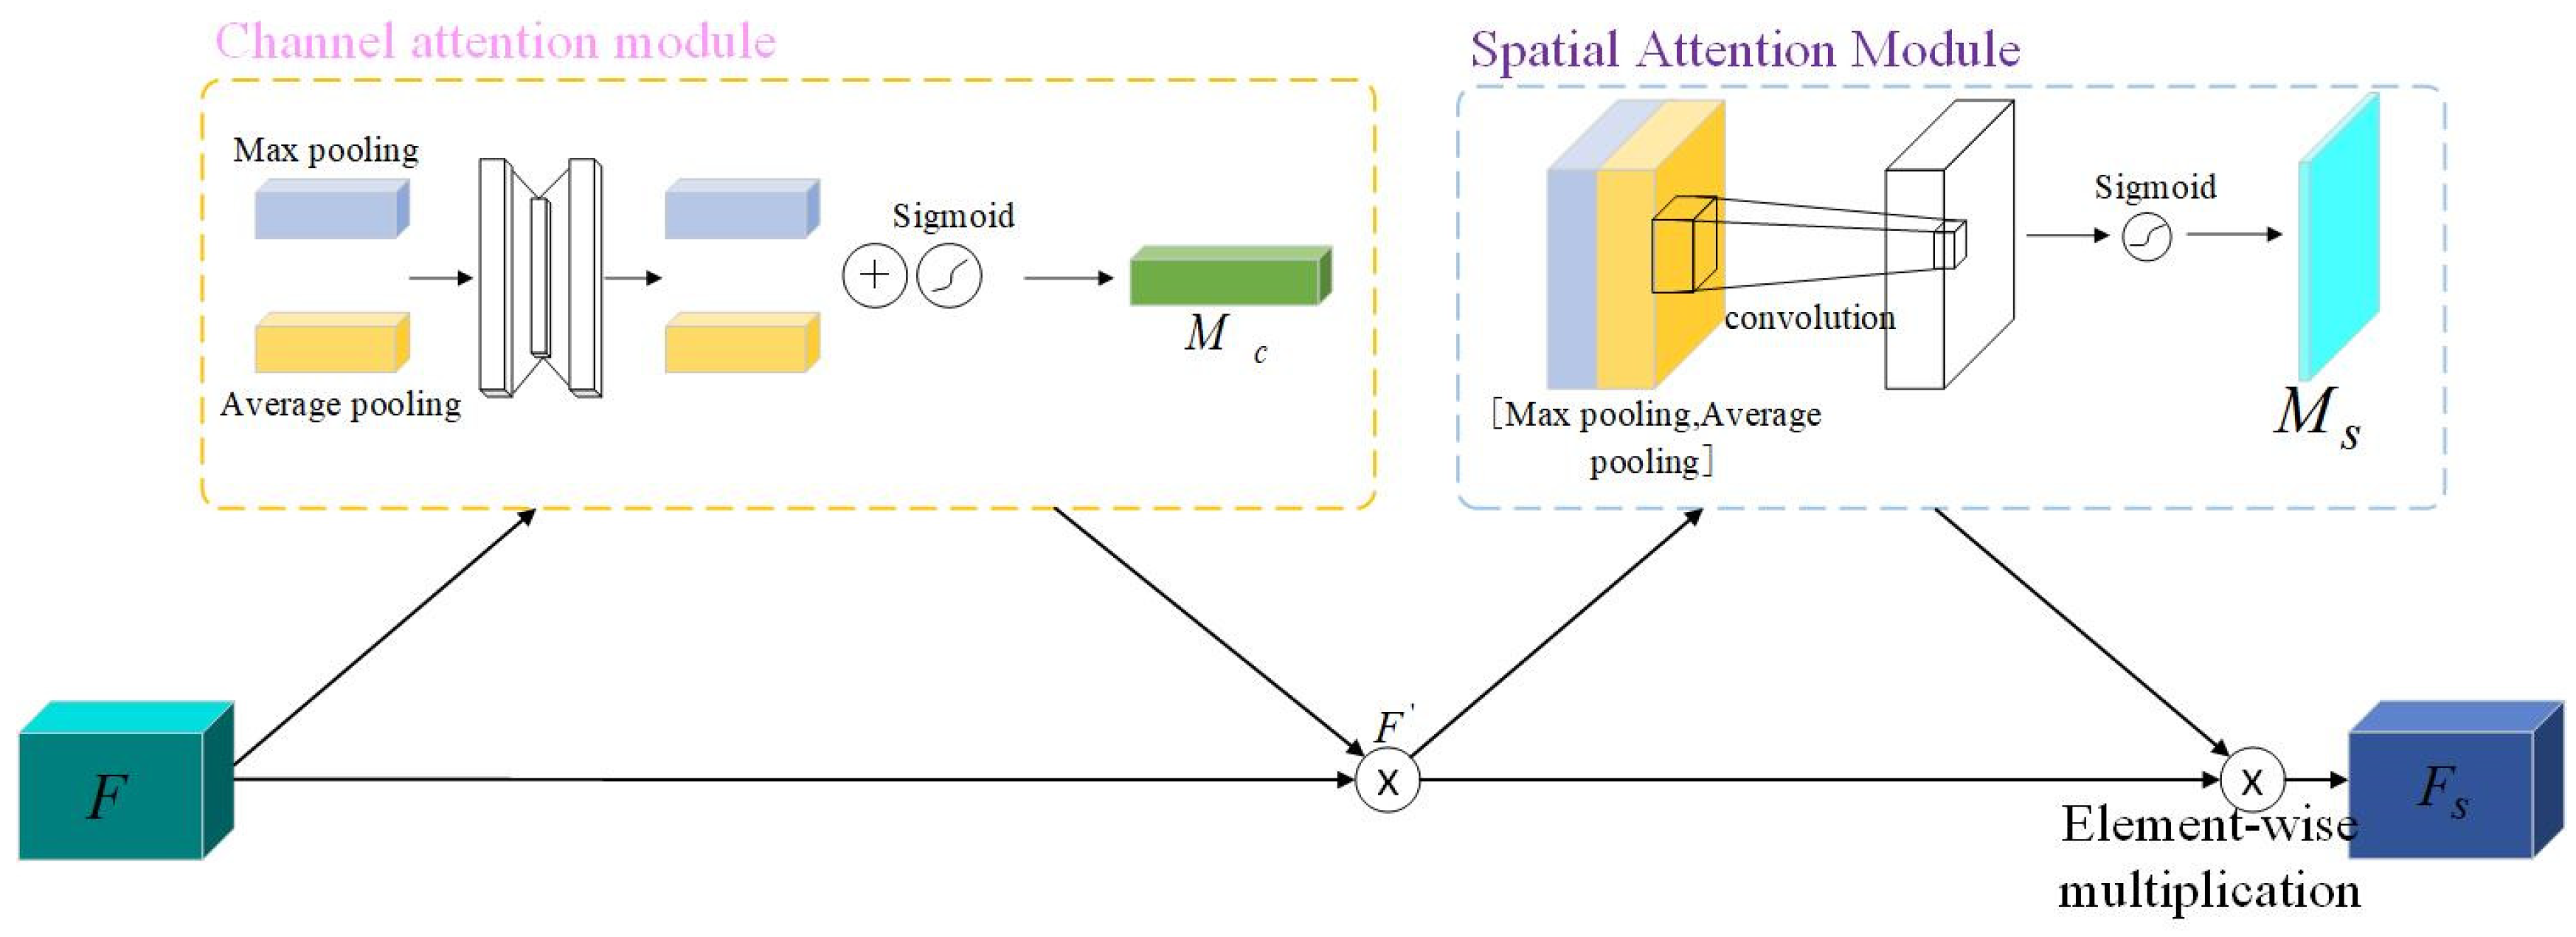
3.4. CBAM Attention Mechanism

Adding the CBAM attention module after the backbone feature extraction network can avoid feature loss and filter out useful features in the neural network during the multi-layer operation iteration process. The CBAM [22] attention module is shown in Figure 8. Compared with attention modules such as SE and ECA, which can only screen out channel features, the CBAM attention module can simultaneously screen channel and spatial features. The CBAM attention module uses the channel attention mechanism and the spatial attention mechanism to perform weighting operations on the input feature map F, in turn. Multiplying the weight and the feature map can complete the screening of channel and spatial features and obtain the weighted adjusted selected feature map. It also strengthens the ability to express the characteristics of small target defects.
Within the channel attention module, the input feature map, denoted by F, undergoes a process of global aggregation. This operation combines the global channel information of the image through both global average and maximum pooling. This results in dimensions of 1 × 1 × C. Following this, a shared perceptron and a sigmoid function are employed. These tools assign high-weight values to channels that are significantly correlated with the target information, which aids in filtering out irrelevant channel details. Through this process, the channel-specific details are integrated to produce the channel attention weight coefficients, symbolized by MCRC×1×1. Finally, the feature map F is obtained by performing element-wise multiplication with the original feature map. The calculation equation is as follows:
M C ( F ) = σ ( M L P ( A v g P o o l ( F ) ) + M L P ( M a x P o o l ( F ) ) ) F = M C ( F ) F ,
where F is the input feature map, MC is the channel weight coefficient, F is the channel attention map of size C × H × W, σ denotes the sigmoid function, and denotes matrix multiplication.
Within the spatial attention module, the feature map is subjected to maximum pooling and average pooling processes. These generate two feature maps that carry comprehensive spatial information. These maps are subsequently concatenated along the channel dimension, which allows for the filtration of spatial information pertinent to the target. The output feature map from this process has dimensions of H × W × 2. Thereafter, this map is processed through a 7 × 7 convolutional layer, which produces a channel feature map with a dimension of 1. To derive the spatial weight, denoted as MS, the sigmoid function is then applied. Finally, the CBAM attention output feature map FS is obtained through element-wise multiplication between the feature maps F and FS. The calculation equation is as follows:
M S ( F ) = σ ( f 7 × 7 ( [ A v g P o o l F ; M a x P o o l F ] ) ) F S = M S ( F ) F ,
where MS denotes the spatial weight matrix and FS is the final output feature map.
To highlight the benefits of the CBAM attention mechanism in model validation, we visualized the AC-YOLO network and compared it with the original YOLOv5 network. The visualization results are presented as heatmaps, which highlight the regions the neural network pays attention to during the detection process. Figure 9a shows the original YOLOv5 network heat map, while Figure 9b shows the AC-YOLO network heat map. The darker shading indicates a higher likelihood of insulator presence. Thermal imaging further confirms the ability of the CBAM attention mechanism to identify small insulator defects in complex backgrounds accurately. Comparing the thermograms of defects with those of various insulator types, it is evident that the enhanced model emphasizes the small target regions in the thermograms. This enhancement highlights the improved performance of the CBAM attention mechanism in insulator identification and localization. Furthermore, the CBAM attention mechanism demonstrates significant stability and accuracy in detection, even in the presence of complex background interference.

3.5. SIoU Loss Function

The GIoU (generalized intersection over union) [23] loss function only focuses on the overlap area between the prediction frame and the real frame without considering the balance of difficult and easy samples, and there is a certain degree of fuzziness. For the problems above existing in the GIoU and in view of the insulator defect detection, the model convergence speed is slow, and the target prediction frame may not be able to match the real frame during training correctly. Therefore, this paper adopts the SIoU [24] loss function, and then, based on the GIoU loss function, the vector angle between the centers of the two frames is considered when the prediction frame returns to the real frame. This makes the prediction frame move quickly to the nearest coordinate axis and then return to a single coordinate (x or y), effectively reducing the free variables in the loss function and improving the classification accuracy of the model. The SIoU loss function consists of three parts: angular loss, distance loss, and shape loss.
The SIoU loss function incorporates the angle between the center of the true bounding box Bgt and the predicted bounding box B, resulting in a reduction of distance-related variables. The calculation of this function is as follows:
σ d = ( B c x g t B c x ) 2 + ( B c y g t B c y ) 2 C H = max ( B c y g t , B c y ) min ( B c x g t , B c x ) x = C H / σ d = sin ( α ) Λ = 1 2 × sin 2 ( arcsin ( x ) π 4 ) ,
where Λ is the angle final result, σd is the distance between the prediction box and the center point of the real frame, CH is the height difference between the prediction box and the center point of the real box, Bcx and Bcy are the center coordinates of the prediction box, and B c x g t and B g t are the center coordinates of the real box, as shown in Figure 10a.
Considering the angular loss defined above, the distance loss Δ can be redefined as follows:
ρ x = B cx gt B cx C w ,   ρ y = B cy gt B cy C h ,   γ = 2 Λ Δ = t = x , y ( 1 e γ ρ t ) ,
where Ch and Cw are the minimum external box length and width, respectively. As α approaches 0, the contribution of Δ decreases; conversely, the closer α is to π/4, the larger the contribution of Δ. Thus, as the angle increases, γ is assigned a time-preferred distance value. When α tends to 0, the distance loss becomes more regular, as depicted in Figure 10b. The final shape loss, denoted as Ω, is calculated as follows:
W w = w w gt max ( w , w gt ) , W h = h h gt max ( h , h gt ) ,
Ω = ( 1 e w w ) θ + ( 1 e w h ) θ ,
where (w, h) and (wgt, hgt) are the width and height of the prediction frame and the real frame, respectively; θ denotes the attention factor, and the specific value of the shape loss varies for different datasets. In this study, the shape loss was determined to be 5 based on the experimental results. The calculation equation for SIoU loss is as follows:
SIoU Loss = 1 - IOU + Ω + Δ 2 ,
To further emphasize the superiority of the SIoU loss function, this study introduced the SIoU and GIoU loss functions separately into YOLOv5, and the convergence speed and effectiveness of the model convergence were determined and compared. The comparative results are shown in Figure 11. From the graph, it is evident that introducing the SIoU loss function on the basis of YOLOv5 enables the model to continue to maintain the lowest loss level during the training process and accelerates the convergence speed of the model. During the training process, the minimum loss converged to less than 0.04, close to 0, and the model showed no signs of overfitting.

4. Experiment Preparation

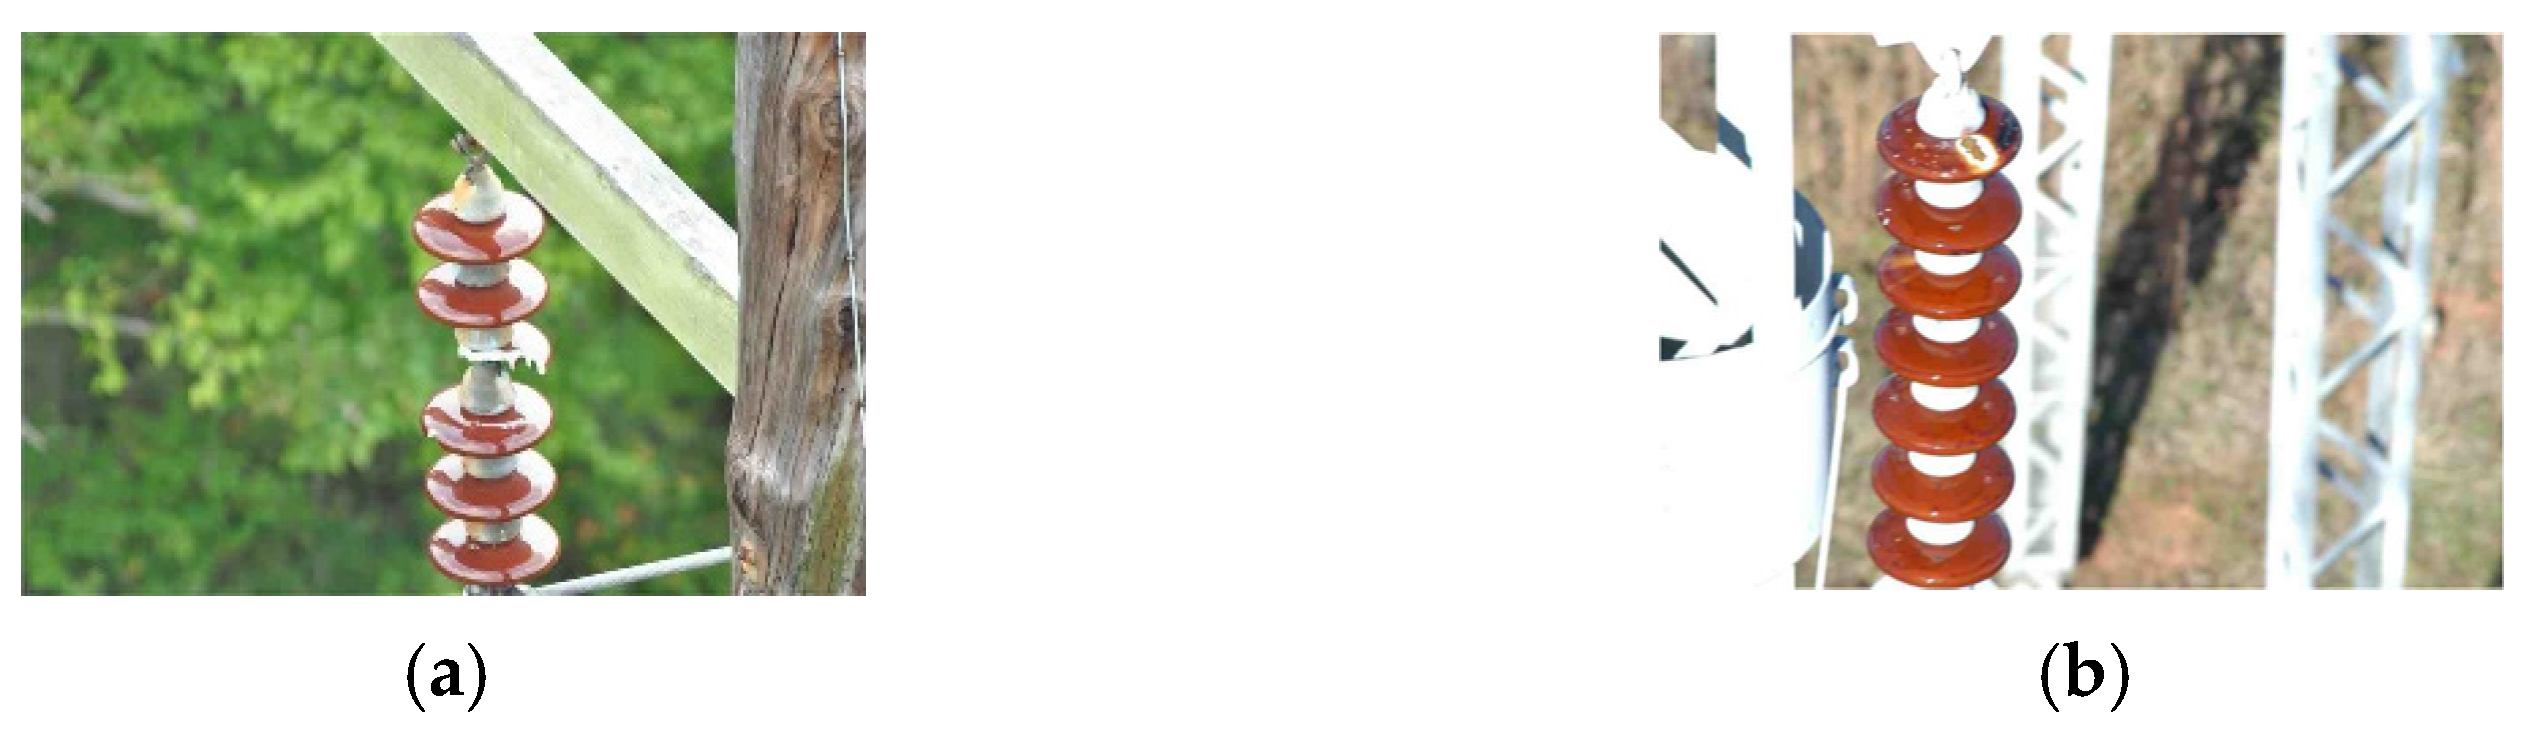
4.1. Experimental Environment and Dataset

The experimental hardware setup comprised an Intel(R) Core(TM) i3–9100F CPU at 3.60 GHz, 16-GB RAM, an RTX 2080Ti graphics card with 11 GB of video memory, and GPU acceleration through CUDA 11.0 and cuDNN 8.6.0. The software environment consisted of the Windows 10 Professional operating system, PyCharm 20.1.1, and the PyTorch DL 1.7.1 framework.
Due to the limited defect dataset of overhead transmission lines or power fields and considering the ability to comprehensively evaluate the condition of insulators, we conducted this study using the insulator dataset provided by a company affiliated with the State Grid Corporation of China that was captured by drones. During image acquisition, the mutual positioning of the investigated object and the camera was set to 0°, ±90°, and ±45° to ensure that multi-angle information was fully considered. To enhance the model’s generalization ability and to mitigate overfitting, various data augmentation techniques, such as angle rotation, saturation adjustment, image flipping, and panning, were applied to increase the sample size. The augmented dataset comprised 1593 images. These images were labeled using the LabelImg tool, and the labeling process is illustrated in Figure 12. The labeling categories were divided into three groups: the insulator, breakage defect (posun), and flashover defect (wushan). Sample images representing these defects are shown in Figure 13. The broken defects could be chipping, breaking, etc., and the degree of breakage includes single-piece and multi-piece umbrella skirt breakage. According to the different variations of the lighting conditions, the form of dirty flash defects includes single-piece and multi-piece umbrella skirt flashing, and there is diversity in the area region of the flashing. The acquired images have a consistent spatial resolution of 3216 × 2136 pixels. In order to speed up the model training efficiency, the acquired images were resized to a resolution of 640 × 640 pixels before training. The dataset was split into a training set and a validation set in a 9:1 ratio, with 1416 images in the training set and 177 images in the validation set. The sample distribution is presented in Table 2.

4.2. Evaluation Indicators

As the primary objective of this research was to enhance detection accuracy, various performance metrics were utilized to evaluate the algorithm. These metrics include the average precision (AP), recall rate (R), accuracy rate (precision, P), overall accuracy F1 (F1 score), frames per second (FPS), and mean average precision (mAP). P and R assess the algorithm’s comprehensiveness and accuracy in detecting the target, while the F1 score provides a comprehensive evaluation based on both precision and recall. AP measures the detection accuracy for each category. FPS evaluates the speed of object detection by representing the frame rate per second, indicating the number of pictures that can be processed within a second. mAP represents the overall detection accuracy across all the categories. These evaluation indicators are calculated using the following equations:
R = T P T P + F N × 100 % ,
P = T P T P + F P × 100 % ,
F 1 = 2 P R / ( P + R ) ,
A P = 0 1 P ( R ) d R ,
The evaluation metrics used in this study include TP (number of correctly detected targets), FP (number of wrongly detected targets), FN (number of missed targets), N (total number of detected categories), and P(R) (a function with R as the independent variable and P as the dependent variable). The mAP is calculated as the mean value of the AP values for each category.

5. Experimental Results and Analysis

5.1. Model Parameter Debugging

The AC-YOLO model was used to train and test the insulator multi-defect image dataset; the batch size (Batchsize) was set to 8, the initial learning rate was set to 0.01, the momentum was set to 0.937, and the total number of training rounds (epoch) was set to 300. The Adam optimizer, which can obtain the optimal model weights, was used to optimize the process. The training process used the cosine annealing learning rate decay strategy to accelerate the convergence speed of the model, and the model evaluation index of the training process is shown in Figure 14.
As shown in Figure 14a, the total losses of AC-YOLO were kept low during the training process and had a faster convergence speed. The lowest loss value can be converged to less than 0.03, which is close to 0, and there was no overfitting phenomenon. As shown in Figure 14b, the larger the mAP value, the higher the accuracy of detection and the better the network performance. From the figure, it can be seen that the AC-YOLO model gradually stabilized when the number of iterations reached 100, and the detection accuracy (mAP) reached up to 93.4% with the threshold set to 0.5, which is 5.1 percentage points higher than the detection accuracy of the original YOLOv5 model.

5.2. Ablation Experiment

To assess the effectiveness of the enhancements made to the original YOLOv5 algorithm model, we conducted ablation experiments, and the results are presented in Table 3. The p-values and R-values represent the average accuracy and recall values for the three categories, respectively.
As can be seen from Table 3, The results of Experiment 2 show that after introducing AWDMSDM into YOLOv5, the [email protected] and R-value of the model increased by 1.5% and 5.4% respectively. This shows that AWDMSDM can effectively distinguish complex backgrounds, insulators, and multiple defects to a large extent, and can focus on tiny target defects. Replacing the original detection head with AMFDH solved the conflict between the multi-defect features of the insulators in the classification problems and regression tasks. This improvement increased the [email protected] by 3.6%. The CABM attention mechanism and SIoU loss function introduced based on YOLOv5 increased the [email protected] by 0.9% and 2.2%, respectively, compared with the original YOLOv5 model. Furthermore, the proposed refined approach in this paper improved the YOLOv5 p-value, R-value, F1 accuracy, and [email protected] by 1.3%, 8.0%, 5.0%, and 5.1%, respectively, compared to the original model. The data above show that the model used in this study has stronger feature extraction capabilities and multi-scale fusion performance and has better detection performance in detecting multi-type defects in insulators.

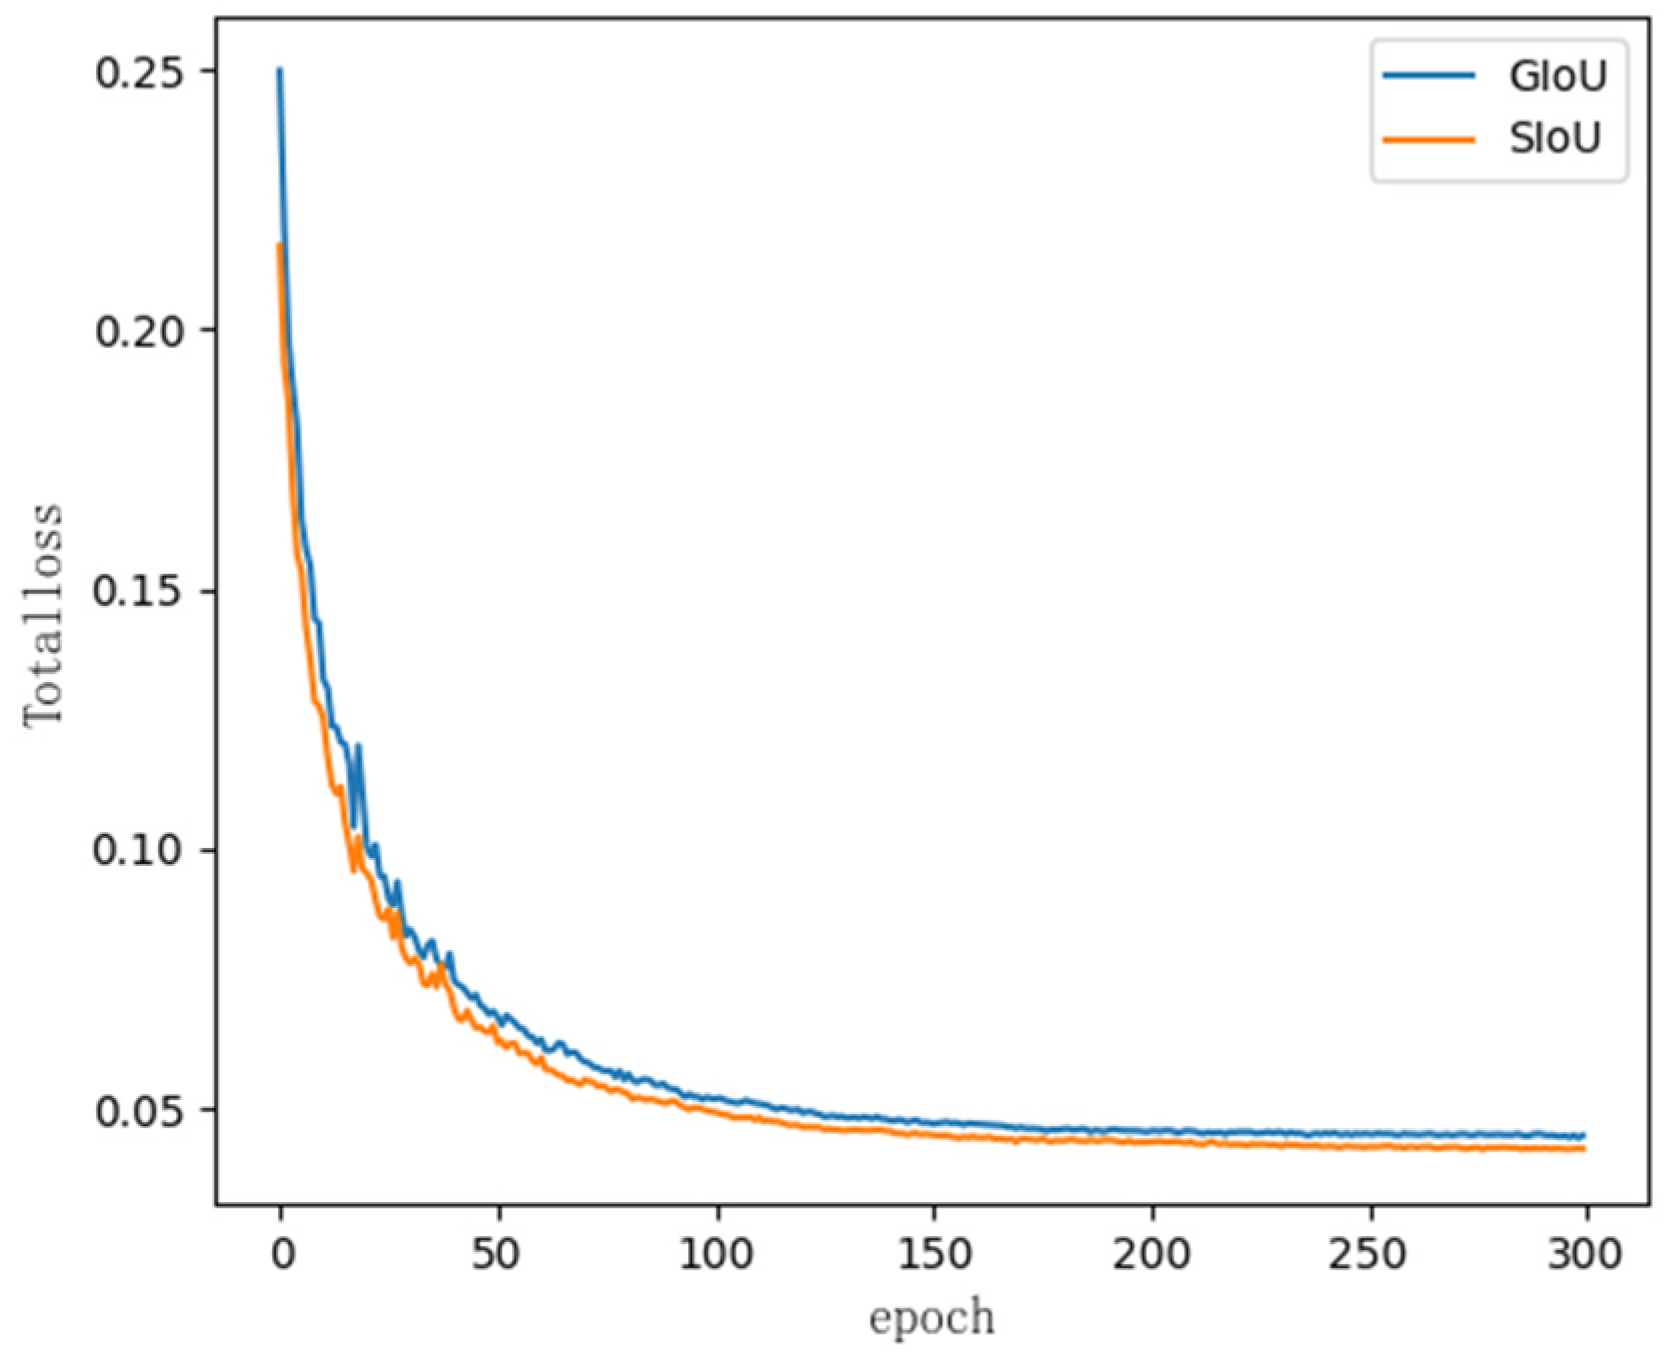
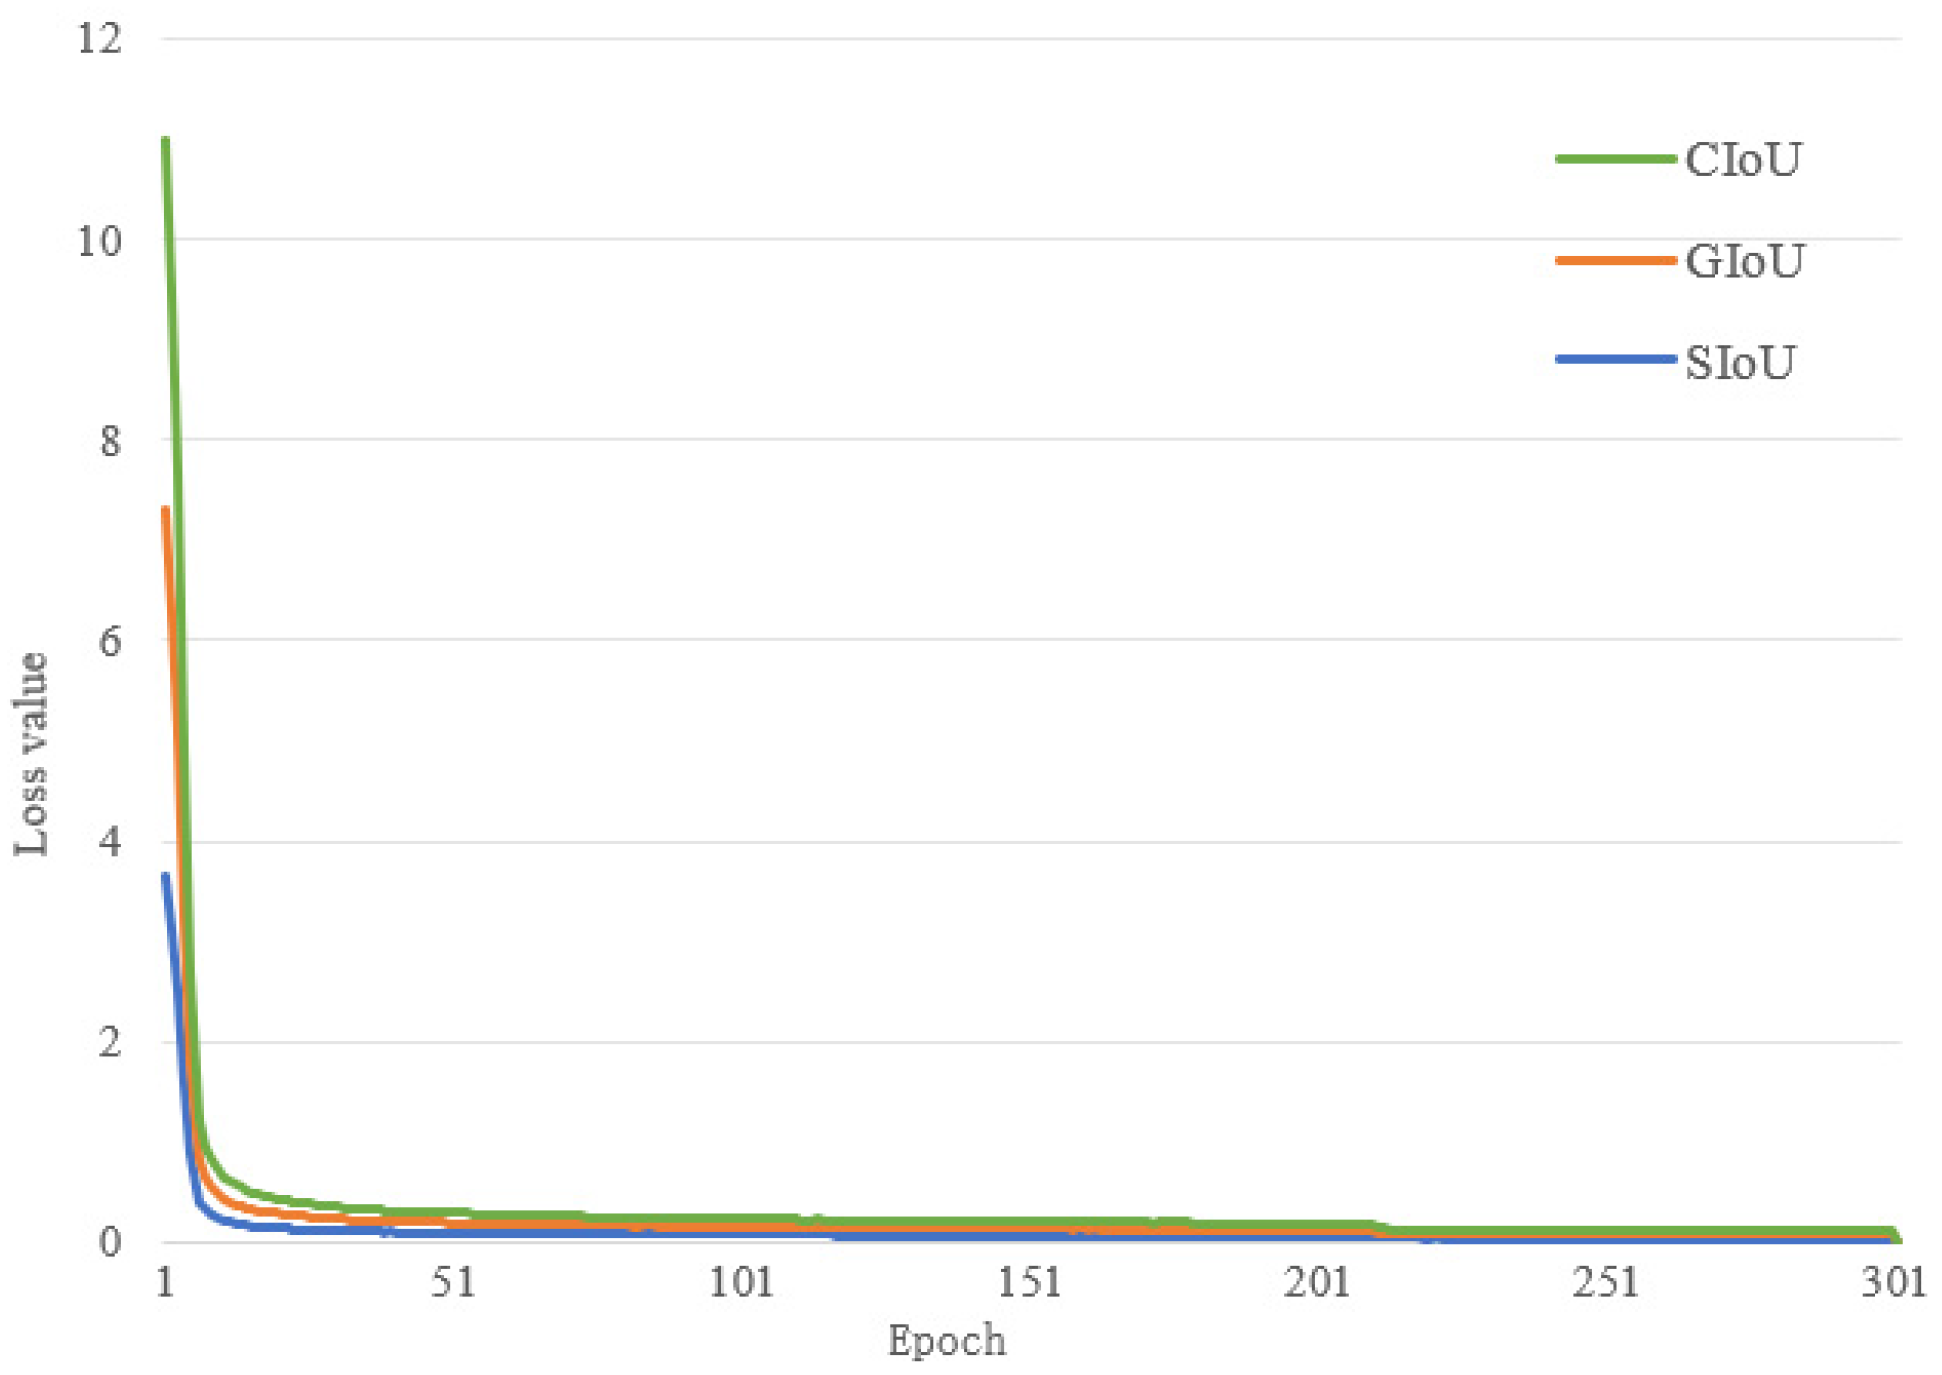
5.3. Comparison Experiments of Different Loss Functions

To showcase the superior performance of the SIoU loss function in comparison to other loss functions, we enhanced the YOLOv5 algorithm by incorporating GIoU, CIoU, and SIoU. The improved models were trained and tested using identical parameters, and the outcomes of the three loss functions were assessed. The convergence speed and training outcomes associated with each loss function are depicted in Figure 14 and summarized in Table 4.
The results presented in Table 4 demonstrate the superiority of the SIoU loss function compared to GIoU and CIoU in terms of the p-value and mAP. The accuracy rates for SIoU were 92.8%, showing a slight improvement of 0.1% and 0.4% compared to GIoU and CIoU. Similarly, the mAP for SIoU showed an improvement of 0.4% and 1.2% over GIoU and CIoU. However, the R-value obtained with SIoU was 0.8% and 0.4% lower than that of GIoU and CIoU, respectively. This discrepancy can be attributed to SIoU’s emphasis on estimating smaller bounding boxes. Additionally, as depicted in Figure 15, SIoU exhibited faster convergence than the other two loss functions within the initial 70 training rounds, while CIoU showed the slowest convergence, aligning with the findings in Table 4. Therefore, based on this analysis, it is evident that the SIoU loss function offers comprehensive advantages over the other two alternatives and demonstrates excellent performance in detecting insulator defects.

5.4. Performance Comparison of Different Detection Networks

To validate the effectiveness and generalizability of the proposed approach and to provide a comprehensive assessment of the model’s performance, we compared it with five other target detection algorithms: YOLOX [25], YOLOv7 [26], YOLOv8 [27], RetinaNet [28], and Faster RCNN. All the algorithms underwent training and testing using identical experimental settings. The evaluation metrics for the network models are presented in Table 5.
From the results in Table 5, it can be inferred that both the two-stage algorithm Faster RCNN and the one-stage algorithm RetinaNet no longer possess any advantages in terms of detection accuracy and speed when compared to the YOLO series. Among the YOLO series algorithms, YOLOv7 achieved a high mAP of 92.3% by addressing the issue of sample imbalance with a deeper network structure. The proposed AC-YOLO algorithm showed a 2.9% increase in mAP compared to YOLOv8. YOLOX performed well in terms of both detection accuracy and speed. However, the YOLOv5 algorithm outperformed other types of algorithms, achieving superior detection accuracy and a simultaneous detection speed of 42.24 FPS. In this study, the improved AC-YOLO network had a mAP of 93.4%, an accuracy of 93.8%, and a recall of 89.2%, which is further subdivided into an insulator breakage defect detection accuracy of 95.0% and an insulator flashover defect detection accuracy of 85.2%. Compared with the original YOLOv5 network, the improved AC-YOLO network had a higher mAP in terms of overall detection accuracy. The accuracy and the recall were improved by 5.1%, 1.3%, and 8.0%, respectively. In contrast, the detection accuracy of small target defects, such as insulator breakage and insulator flashover, was improved by 11.4% and 3.4%, respectively. The improved AC-YOLO network achieved a significant improvement in the modeling accuracy, as well as insulator defect detection. At the same time, the AC-YOLO network model size increased by 1.75M, and the detection speed decreased by 1.66 FPS compared to the original YOLOv5 because the increase in model complexity will inevitably bring about a reduction in the detection speed and an increase in model volume. Therefore, the detection speed and model volume, compared to the original network model, are slightly inferior, but a small amount of time and a small amount of increase in the model volume was noted. However, a small increase in time and a small increase in model volume will not substantially impact the model’s lightweight and real-time aspects. At the same time, it is very cost effective to increase the detection accuracy at the cost of a small increase in detection speed and a small increase in model volume. Therefore, the method proposed in this paper strikes a good balance between detection speed and accuracy.

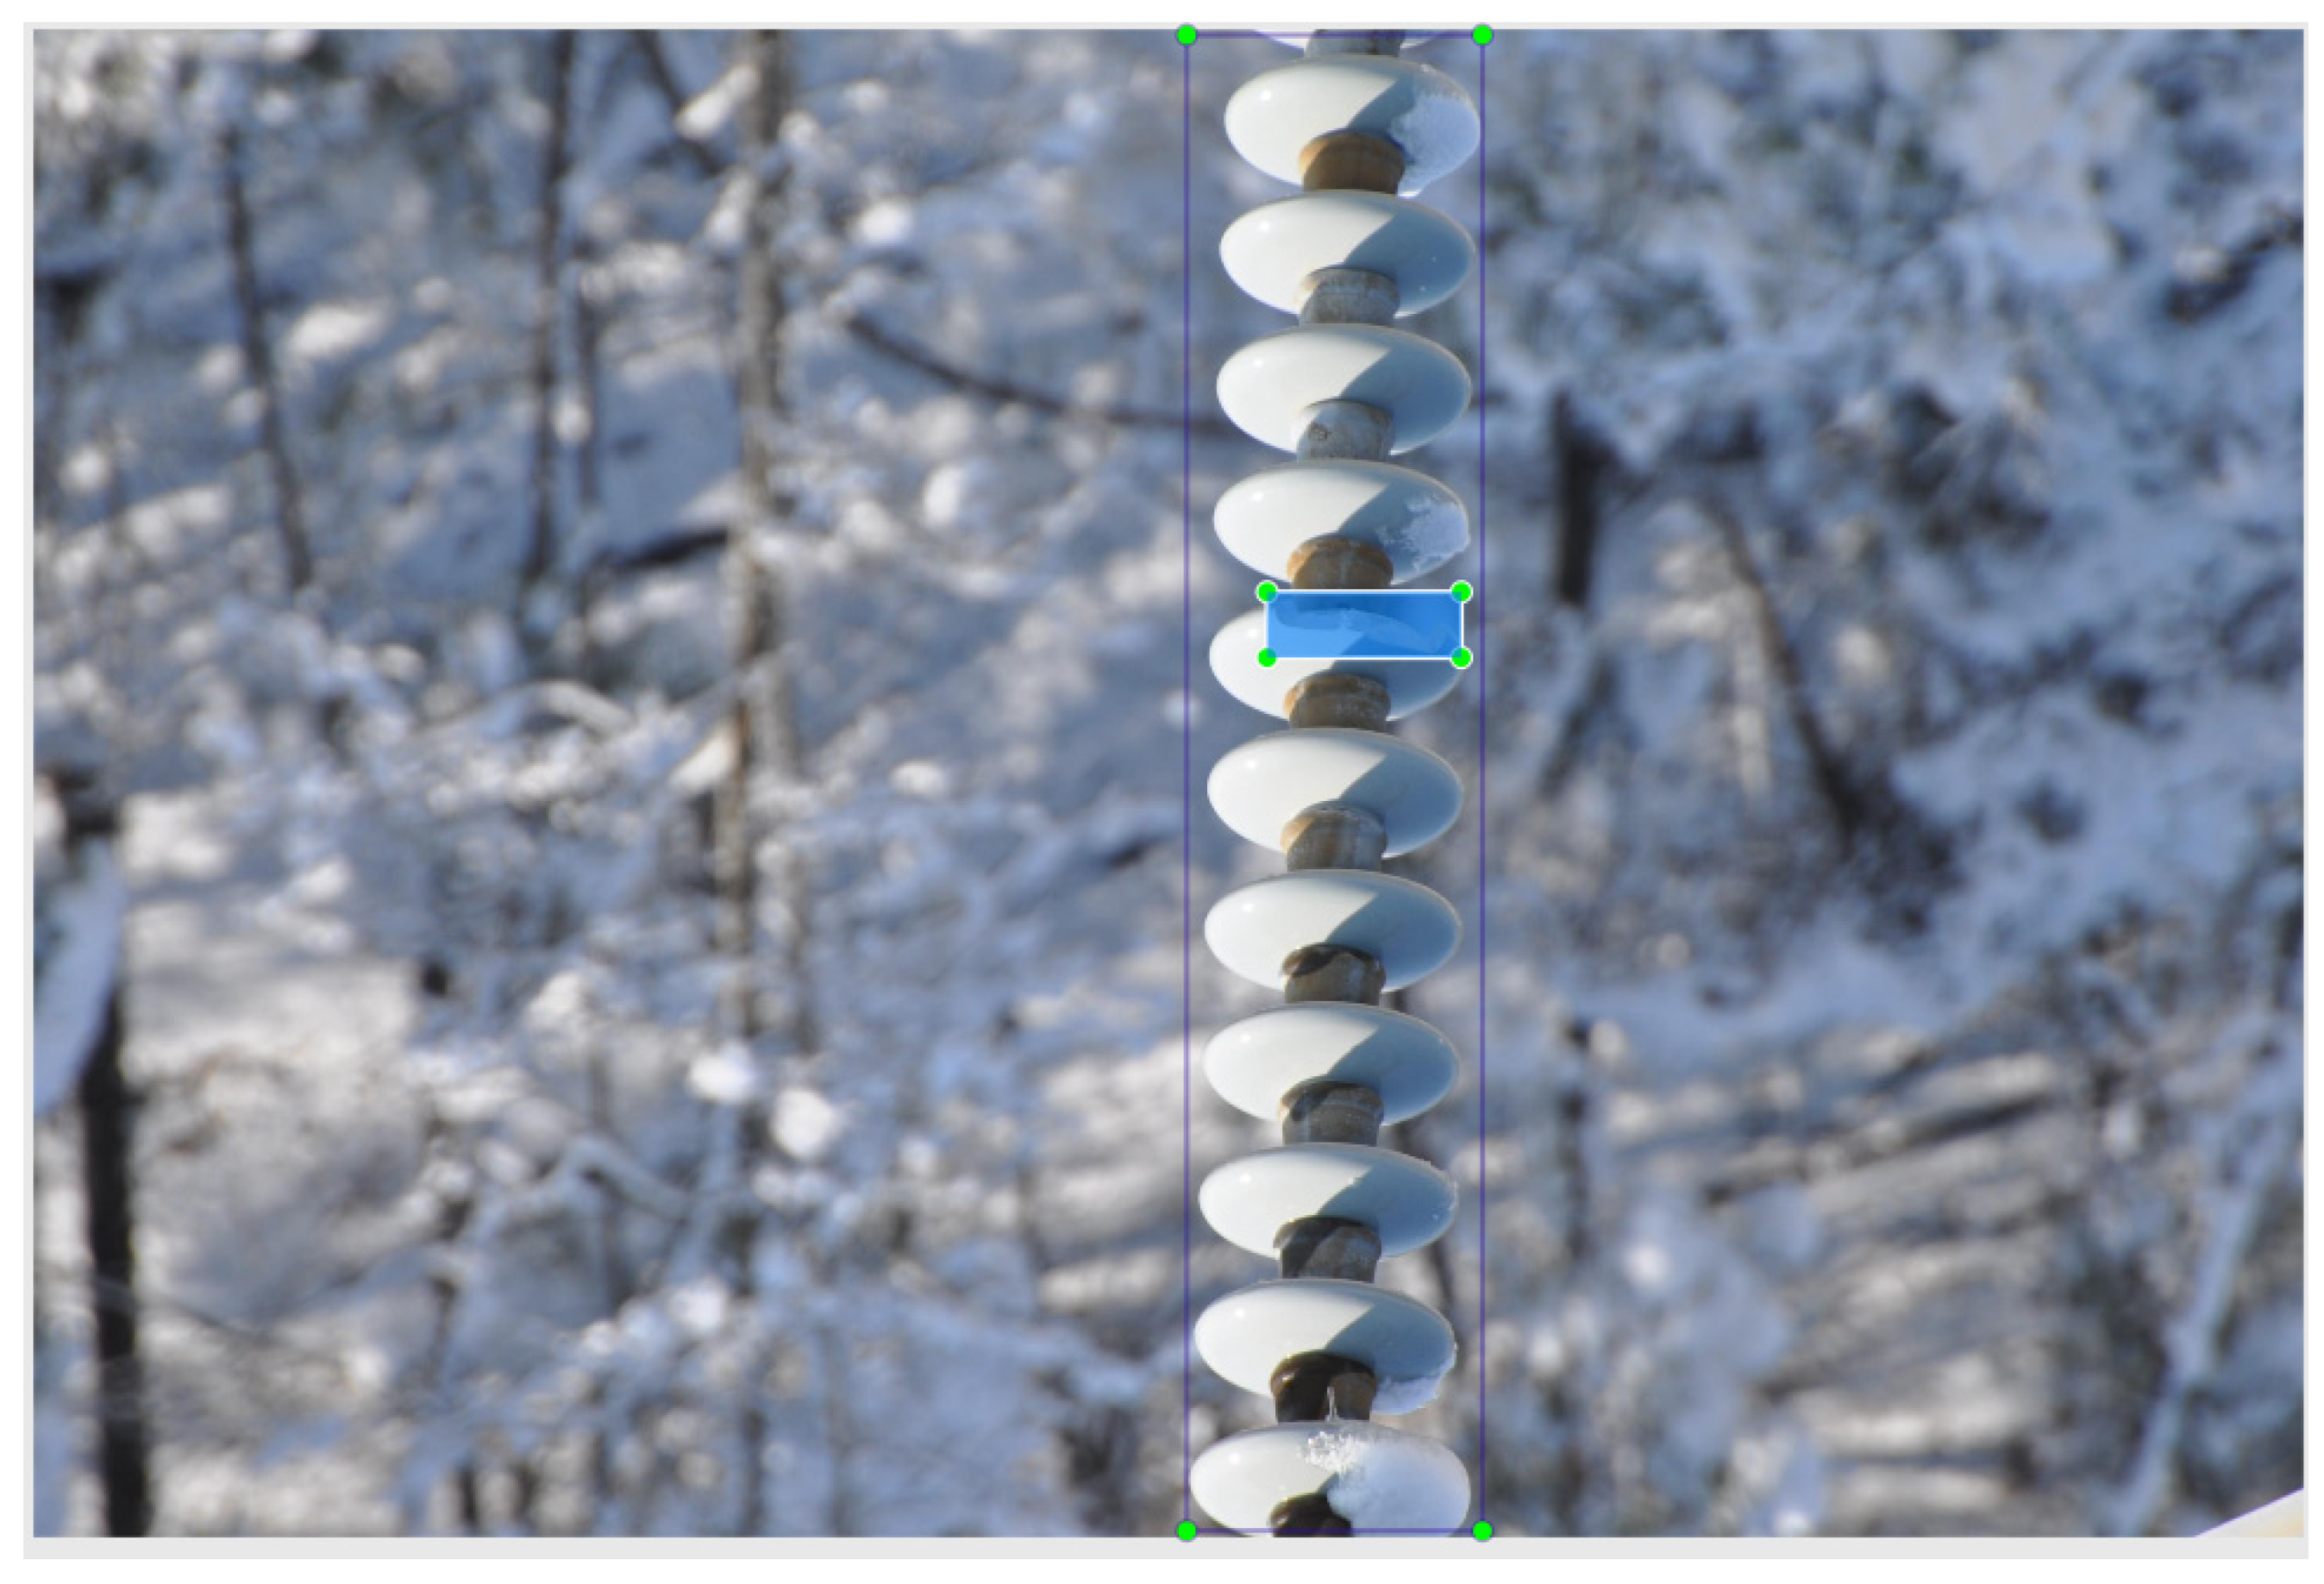
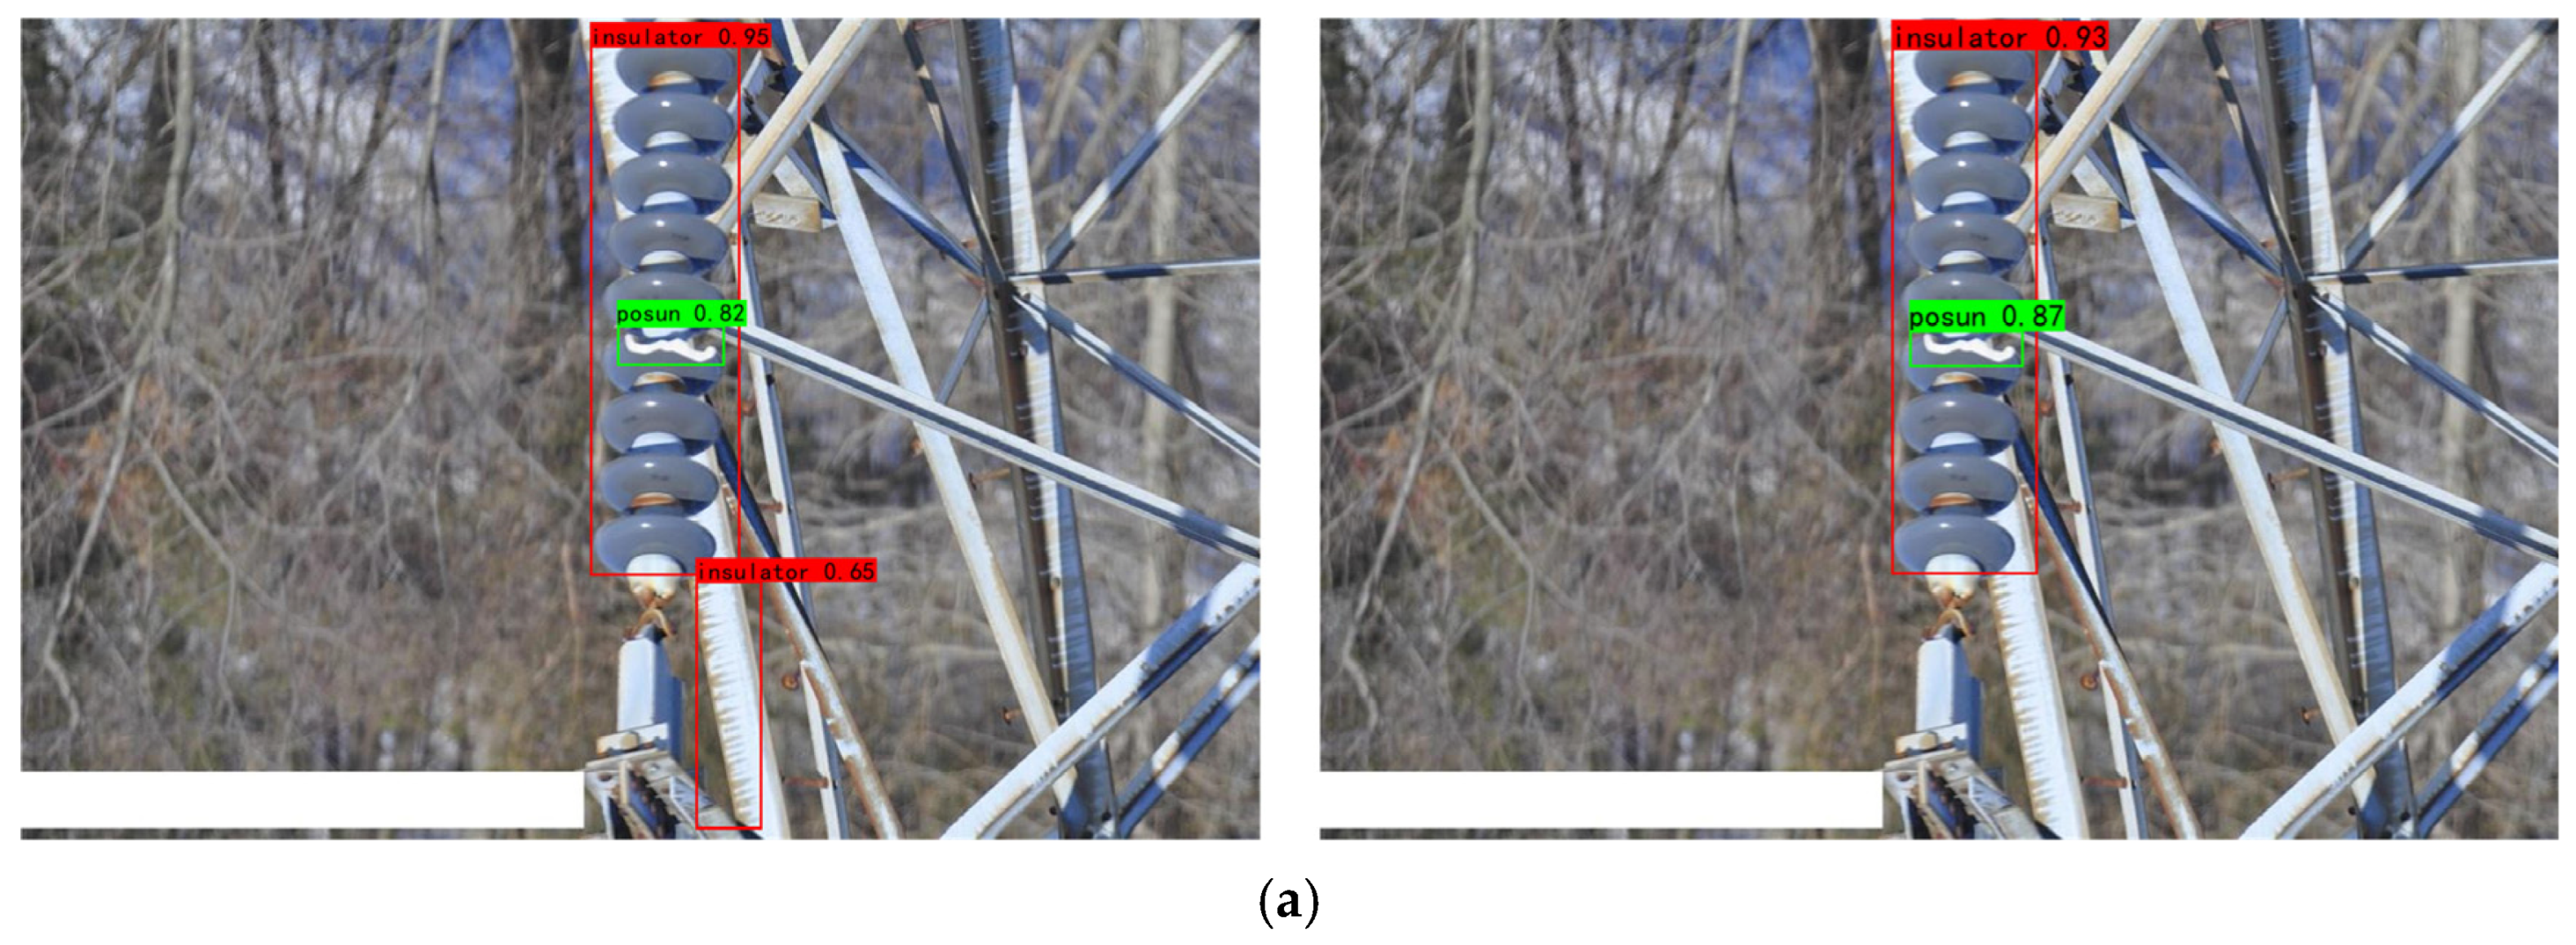
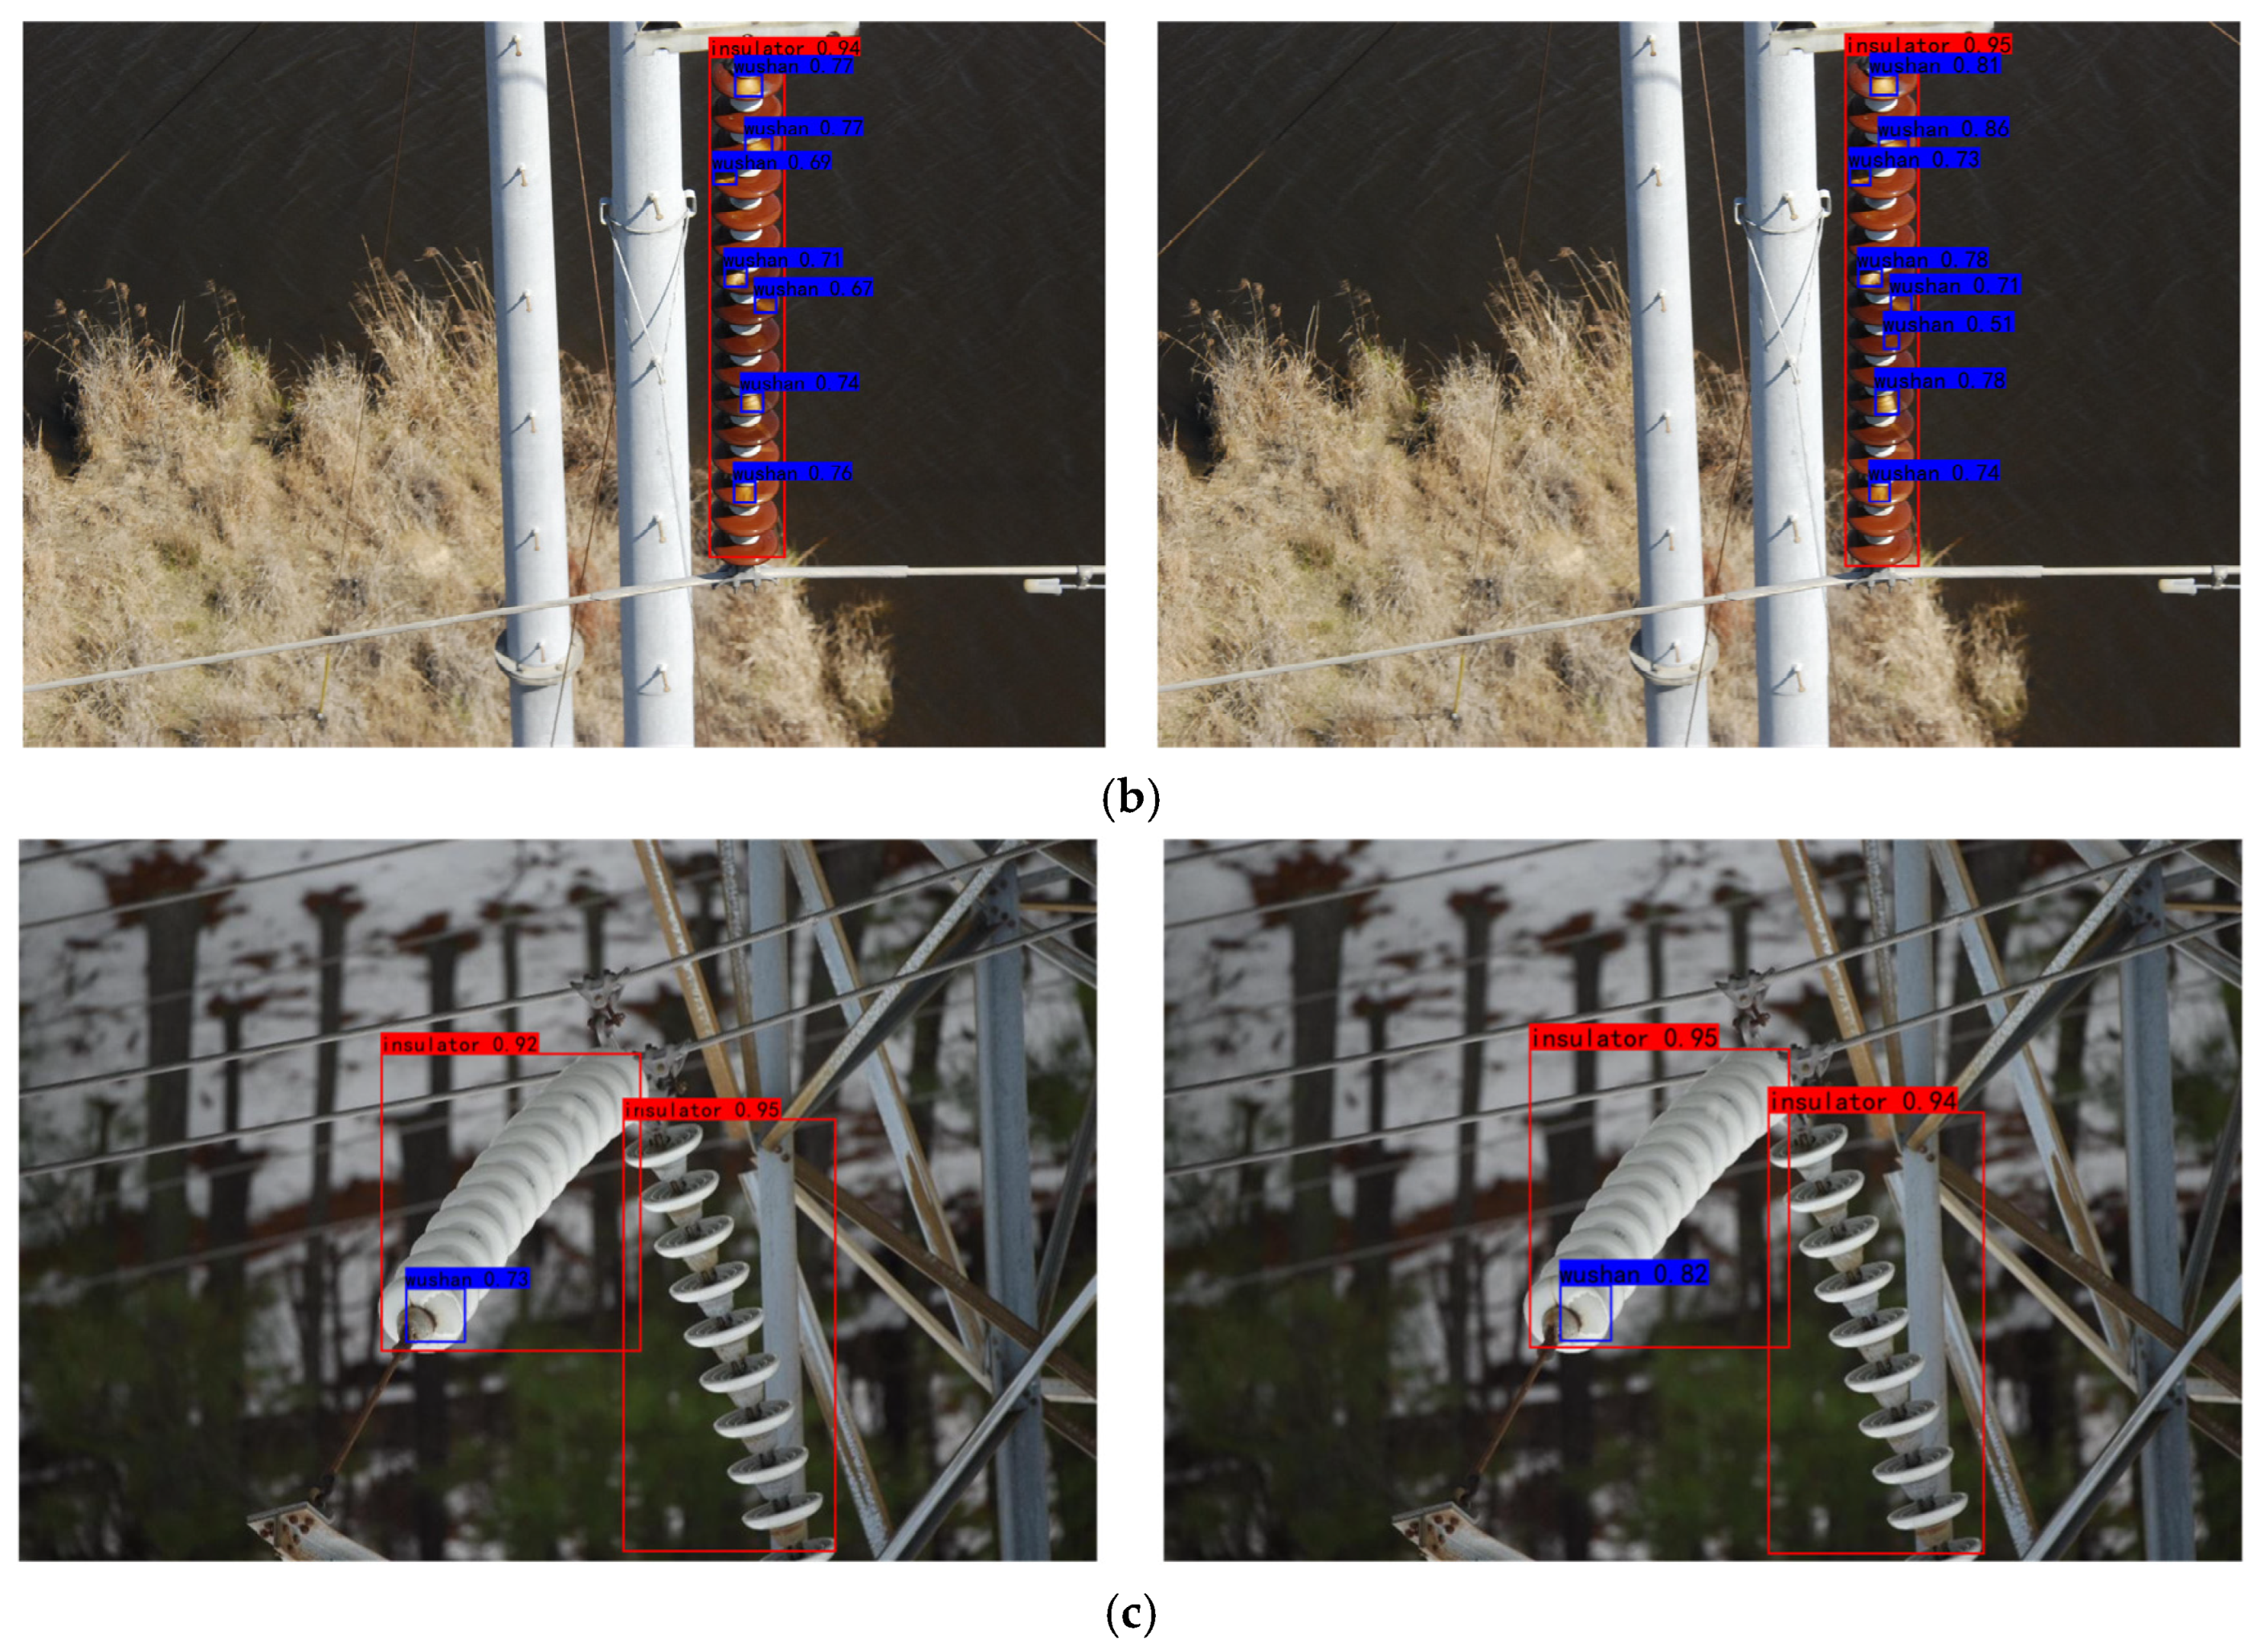
5.5. Practical Result Verification

To more intuitively compare the detection effect of the original YOLOv5 model with that of the AC-YOLO model for insulator defect picture detection, a comparative study of the performance of the AC-YOLO network and the original YOLOv5 network was carried out under the same hardware environment. The comparative results are shown in Figure 16. The left panel shows the detection results of YOLOv5, while the right panel demonstrates the detection results of AC-YOLO. From the results in Figure 16a, YOLOv5 is greatly affected by environmental factors, which leads to false detections. In Figure 16b, when there are more small target defects in the insulator pictures, the AC-YOLO model has no leakage phenomenon in detecting tainted flash defects, and the detection accuracy of AC-YOLO is better than that of the original YOLOv5. In Figure 16c, YOLOv5 suffers from inaccurate target localization frames when facing the detection of multiple defect categories. The combined situation shows that the proposed improved algorithm balances accuracy and speed in detecting multiple defective insulators. In practical applications, its leakage and false detection rates are low, which can more effectively meet the requirements of practical detection.

6. Conclusions

This paper introduces AC-YOLO, a network designed for detecting multiple defects in insulators. AC-YOLO incorporates several improvement methods, including the AWDMSM module, Attn-CSP module, AMFDH detection head, and SIoU loss function. These enhancements enhance the network’s feature extraction and processing capabilities, resulting in improved detection performance for small defective targets. AC-YOLO achieves a mAP of 93.4% and a detection speed of 40.58 FPS, surpassing the existing mainstream target detection algorithms. Therefore, AC-YOLO is suitable for insulator defect detection in UAV power inspection tasks. Future research will focus on several directions, including methods to find the optimal balance between the detection speed and accuracy for specific applications, especially in embedded chip detection. We will further attempt to improve the robustness of the network to complex environmental conditions to ensure reliable execution in real detection tasks. In addition, we also plan to continuously improve the network architecture of the proposed algorithms and effectively integrate them into the hardware environment required for transmission line fault detection. Research in these areas will continue to advance technology and lead to more innovative and reliable solutions in automatic insulator detection.

7. Discussion

AC-YOLO has a wide range of practical applications and significant benefits in real-world grid maintenance and repair scenarios. The following are some of the potential applications and benefits:
(1) Efficient defect detection: AC-YOLO realizes efficient detection of multiple defects on insulators by adding the adaptive weight distribution multi-head self-attention module AWDMSM, designing the adaptive memory fusion detection head, and introducing the CBAM attention mechanism and SIoU loss function on top of YOLOv5. This includes small defect targets, such as insulator breakage, insulator flashover, and other defects, and the AC-YOLO algorithm in the grid to find potential problems more quickly and reliably.
(2) Improve safety: In the power grid, it is essential to find and repair defects on the insulator in a timely manner to ensure the safe operation of the grid. AC-YOLO high-precision detection helps prevent potential failures, reducing the risk of accidents.
(3) Reducing human risk: Embedding AC-YOLO in a UAV can allow for performing tasks in complex grid environments, reducing the risk of human inspections. This is especially important for inspection in high-risk or difficult-to-access areas.
(4) Improve maintenance efficiency: AC-YOLO’s high detection speed means that it can inspect large areas of the grid more quickly, improving maintenance efficiency. This helps to identify problems in a timely manner and take appropriate maintenance measures to minimize grid outage time.
(5) Reduce costs: Automated inspection and maintenance processes can reduce labor costs and improve the overall effectiveness of grid maintenance. The application of AC-YOLO is expected to reduce the cost of inspection and maintenance for grid operators while improving service levels.
(6) Comprehensive coverage: Drones equipped with AC-YOLO can cover all the grid parts, including hard-to-reach areas. This ensures comprehensive monitoring of the grid system and improves the detection of potential problems.
Overall, applying AC-YOLO in grid maintenance and repair is expected to bring multiple benefits to the power system’s reliability, safety, and economy. As technology evolves, AC-YOLO will play an important role in the power industry, providing smarter and more efficient solutions for grid operations.

Author Contributions

Conceptualization, Y.H.; methodology, Y.H. and B.W.; validation, Y.H. and B.W.; formal analysis, Y.Y.; investigation, Y.H. and B.W.; resources, Y.Y. and C.Y.; data curation, C.Y. and B.W.; writing—original draft, Y.H.; writing—review and editing, Y.H., B.W., C.Y. and Y.Y.; visualization, Y.H. and B.W.; supervision, C.Y.; project administration, C.Y.; funding acquisition, Y.Y. All authors have read and agreed to the published version of the manuscript.

Funding

This work was supported by the National Natural Science Foundation of China under grant nos. 62273200 and 61876097 and by the Hubei Provincial Engineering Technology Research Center for Power Transmission Line (China Three Gorges University) Open Research Fund Project under grant no. 2022KXL03.

Institutional Review Board Statement

Not applicable.

Informed Consent Statement

Not applicable.

Data Availability Statement

The authors confirm that the data supporting the findings of this study are available within the article.

Conflicts of Interest

The authors declare no conflict of interest.

References

  1. Zheng, J.F.; Wu, H.; Zhang, H.; Wang, Z.Q.; Xu, W.Y. Insulator-Defect Detection Algorithm Based on Improved YOLOv7. Sensors 2022, 22, 8801. [Google Scholar] [CrossRef] [PubMed]
  2. Yao, C.Y.; Jin, L.J.; Yan, S.J. Recognition of insulator string in power grid patrol images. J. Syst. Simul. 2012, 24, 1818–1822. [Google Scholar]
  3. Zhai, Y.J.; Wang, D.; Wu, Y.; Cheng, H.Y. Two-stage recognition method of aerial insulator images based on skeleton extraction. J. North China Electr. Power Univ. Nat. Sci. Ed. 2015, 42, 105–110. [Google Scholar]
  4. Zhai, Y.; Wang, D.; Zhao, Z.; Cheng, H.Y. Insulator String Location Method Based on Spatial Configuration Consistency Feature. Proc. Chin. Soc. Electr. Eng. 2017, 37, 1568–1577. [Google Scholar]
  5. Qi, Y.F.; Li, Y.M.; Du, A.Y. Research on an Insulator Defect Detection Method Based on Improved YOLOv5. Appl. Sci. 2023, 13, 5741. [Google Scholar] [CrossRef]
  6. Chen, J.L.; Fu, Z.J.; Cheng, X.; Wang, F. An method for power lines insulator defect detection with attention feedback and double spatial pyramid. Electr. Power Syst. Res. 2023, 218, 7. [Google Scholar] [CrossRef]
  7. Elhanashi, A.; Gasmi, K.; Begni, A.; Dini, P.; Zheng, Q.; Saponara, S. Machine Learning Techniques for Anomaly-Based Detection System on CSE-CIC-IDS2018 Dataset. In Applications in Electronics Pervading Industry, Environment and Society: APPLEPIES 2022; Springer: Cham, Switzerland, 2023; pp. 131–140. [Google Scholar]
  8. O’Shea, K.; Ryan, N. An Introduction to Convolutional Neural Networks. arXiv 2015, arXiv:1511.08458. [Google Scholar]
  9. Ren, S.Q.; He, K.M.; Ross, G.; Jian, S. Faster R-CNN: Towards Real-Time Object Detection with Region Proposal Networks. arXiv 2015, arXiv:1506.01497. [Google Scholar] [CrossRef]
  10. Ni, H.X.; Wang, M.Z.; Zhao, L.Y. An improved Faster R-CNN for defect recognition of key components of transmission line. Math. Biosci. Eng. 2021, 18, 4679–4695. [Google Scholar] [CrossRef]
  11. Szegedy, C.; Sergey, I.; Vincent, V.; Alex, A. Inception-v4, Inception-ResNet and the Impact of Residual Connections on Learning. arXiv 2016, arXiv:1602.07261. [Google Scholar] [CrossRef]
  12. He, K.M.; Zhang, X.Y.; Ren, S.Q.; Sun, J. Deep Residual Learning for Image Recognition. arXiv 2015, arXiv:1512.03385. [Google Scholar]
  13. Lin, T.; Liu, X.W. An intelligent recognition system for insulator string defects based on dimension correction and optimized faster R-CNN. Electr. Eng. 2021, 103, 541–549. [Google Scholar] [CrossRef]
  14. Redmon, J.; Santosh, D.; Ross, G.; Ali, F. You Only Look Once: Unified, Real-Time Object Detection. arXiv 2015, arXiv:1506.02640. [Google Scholar]
  15. Wen, B.; Zhu, H.; Yang, C.; Li, Z.C.; Cao, R.X. Feature back-projection guided residual refinement for real-time stereo matching network. Signal Process.-Image Commun. 2022, 103, 8. [Google Scholar] [CrossRef]
  16. Redmon, J.; Ali, F. YOLOv3: An Incremental Improvement. arXiv 2018, arXiv:1804.02767. [Google Scholar]
  17. Huang, Y.R.; Jiang, L.Y.; Han, T.; Xu, S.Y.; Liu, Y.W.; Fu, J.H. High-Accuracy Insulator Defect Detection for Overhead Transmission Lines Based on Improved YOLOv5. Appl. Sci. 2022, 12, 12682. [Google Scholar] [CrossRef]
  18. Han, G.J.; Zhao, L.; Li, Q.; Li, S.D.; Wang, R.J.; Yuan, Q.W.; He, M.; Yang, S.Q.; Qin, L.A. Lightweight Algorithm for Insulator Target Detection and Defect Identification. Sensors 2023, 23, 1216. [Google Scholar] [CrossRef]
  19. Xu, S.Y.; Deng, J.C.; Huang, Y.R.; Ling, L.Y.; Han, T. Research on Insulator Defect Detection Based on an Improved MobilenetV1-YOLOv4. Entropy 2022, 24, 1588. [Google Scholar] [CrossRef]
  20. Ashish, V.; Noam, S.; Niki, P.; Jakob, U.; Llion, J.; Aidan, N.; Gomez, L.K.; Illia, P. Attention Is All You Need. arXiv 2017, arXiv:1706.03762. [Google Scholar]
  21. Ma, N.N.; Zhang, X.Y.; Liu, M.; Sun, J. Activate or Not: Learning Customized Activation. arXiv 2020, arXiv:2009.04759. [Google Scholar]
  22. Woo, S.; Park, J.; Lee, J.Y.; Kweon, I.S. CBAM: Convolutional Block Attention Module. arXiv 2018, arXiv:1807.06521. [Google Scholar]
  23. Rezatofighi, H.; Nathan, T.; Gwak, J.Y.; Amir, S.; Ian, R.; Silvio, S. Generalized Intersection over Union: A Metric and A Loss for Bounding Box Regression. arXiv 2019, arXiv:1902.09630. [Google Scholar]
  24. Gevorgyan, Z. SIoU Loss: More Powerful Learning for Bounding Box Regression. arXiv 2022, arXiv:2205.12740. [Google Scholar]
  25. Ge, Z.; Liu, S.T.; Wang, F.; Li, Z.M.; Sun, J. YOLOX: Exceeding YOLO Series in 2021. arXiv 2021, arXiv:2107.08430. [Google Scholar]
  26. Wang, C.Y.; Alexey, B.; Liao, H.Y. YOLOv7: Trainable bag-of-freebies sets new state-of-the-art for real-time object detectors. arXiv 2022, arXiv:2207.02696. [Google Scholar]
  27. Dillon, R.; Jordan, K.; Jacqueline, H.; Ahmad, D. Real-Time Flying Object Detection with YOLOv8. arXiv 2023, arXiv:2305.09972. [Google Scholar]
  28. Lin, T.Y.; Priya, G.; Ross, G.; He, K.M.; Piotr, D. Focal Loss for Dense Object Detection. arXiv 2017, arXiv:1708.02002. [Google Scholar]
Figure 1. YOLOv5s network structure.
Applsci 13 13351 g001
Figure 2. YOLOv5s components.
Applsci 13 13351 g002
Figure 3. Structure of the AC-YOLO network model.
Applsci 13 13351 g003
Figure 4. Structure of the adaptive weight distribution multi-head self-attention module.
Applsci 13 13351 g004
Figure 5. AWDM structure diagram.
Applsci 13 13351 g005
Figure 6. AWDMSM with different embedding methods. (a) AWDMSM without residuals in the backbone; (b) AWDMSM with residuals in PANet.
Applsci 13 13351 g006
Figure 7. Structure of AMFDH.
Applsci 13 13351 g007
Figure 8. CBAM attention module.
Applsci 13 13351 g008
Figure 9. Heat map visualization results, the dark red or yellow in the figure indicates the area that the CBAM attention mechanism focuses on. (a) Original YOLOv5 heat map; (b) added CBAM attention mechanism heat map.
Applsci 13 13351 g009
Figure 10. Angle and distance loss calculation. (a) Angle calculation. (b) Distance cost.
Applsci 13 13351 g010
Figure 11. Comparison of the convergence of the two loss functions.
Applsci 13 13351 g011
Figure 12. Labeling process of LabelImg tool.
Applsci 13 13351 g012
Figure 13. Insulator defect sample diagram. (a) Breakage insulators. (b) Flashover insulators.
Applsci 13 13351 g013
Figure 14. Model evaluation index. (a) Total training loss comparison curve. (b) mAP0.5 comparison curve.
Applsci 13 13351 g014
Figure 15. Convergence speed of different loss functions.
Applsci 13 13351 g015
Figure 16. YOLOv5 and AC-YOLO detection results. (a) Left: YOLOv5; right: AC-YOLOv5. (b) Left: YOLOv5; right: AC-YOLOv5. (c) Left: YOLOv5; right: AC-YOLOv5.
Applsci 13 13351 g016aApplsci 13 13351 g016b
Table 1. Accuracy of different activation functions.
Activation FunctionAccuracy (%)
AMFDH+ SiLU90.1
AMFDH+ HardSwish89.5
AMFDH+ Meta-ACON91.2
Table 2. Sample statistics of the insulator dataset.
Dataset CategoryLabelNumber of Targets
Insulatorsinsulator1825
Breakage defectposun1091
Flashover defectwushan2423
Table 3. Ablation experiment of AC-YOLO network model.
GroupImprovement MethodsP/%R/%F1/%[email protected]/%
AMFDHAWDMSMAtt-CSP ModuleGIoUSIoU
1----92.581.286.388.3
2---91.886.689.089.8
3---92.785.288.389.2
4--- 92.885.288.390.5
5---91.688.090.091.9
6--92.790.391.792.0
7-92.788.190.392.4
8-93.889.291.393.4
Table 4. Results of different loss functions.
Loss FunctionP/%R/%[email protected]/%
GIoU92.786.090.1
CIoU92.485.689.3
SIoU92.885.290.5
Table 5. Comparison experiments of classical target detection networks.
ModelAP/%P/%R/%F1/%[email protected]/%Parameters/MFPS/(f/s)
InsulatorsBreakage DefectFlashover Defect
YOLOv599.783.481.892.581.286.388.36.6342.24
YOLOX99.786.382.491.885.888.389.58.9439.20
YOLOv799.690.187.294.089.491.792.337.2128.75
YOLOv899.589.482.692.686.789.690.511.2040.38
RetinaNet99.581.144.595.465.174.773.736.3724.30
Faster RCNN99.779.650.853.987.965.376.7137.0816.31
AC-YOLO99.895.085.293.889.291.393.48.3840.58
Disclaimer/Publisher’s Note: The statements, opinions and data contained in all publications are solely those of the individual author(s) and contributor(s) and not of MDPI and/or the editor(s). MDPI and/or the editor(s) disclaim responsibility for any injury to people or property resulting from any ideas, methods, instructions or products referred to in the content.

