Article

Prediction of Tunnel Blasting Vibration Velocity Considering the Influence of Free Surface

1
School of Civil Engineering, Central South University, Changsha 410075, China
2
MOE Key Laboratory of Engineering Structures of Heavy Haul Railway, Central South University, Changsha 410075, China
*
Author to whom correspondence should be addressed.
Appl. Sci. 2023, 13(3), 1373; https://doi.org/10.3390/app13031373
Submission received: 6 December 2022 / Revised: 8 January 2023 / Accepted: 17 January 2023 / Published: 20 January 2023

Abstract

:
The blast vibration attenuation will change as the tunnel cut hole is blasted to create a new free surface. To guarantee safe tunnel construction and optimize blast design parameters, it is crucial to understand the impact of the free surface on blast vibration attenuation. Previous studies have often only qualitatively evaluated the effect of the free surface on blast vibration, failing to quantify these impacts on vibration attenuation. In this paper, by analyzing the decay law of the blast vibration velocity under different free surfaces, we quantitatively assessed the effect of the number of free faces and burden distance on the peak vibration velocity. Then, we introduced free-face parameters to enhance the current formula for predicting blast vibration velocity. The results show that the peak vibration velocity decreases with the increasing free surface number and increases with increasing burden distance; the free surface factor cannot be ignored in the decay of vibration velocity and contributes about 21% more to the total decay factor than the scale distance factor. The average tolerance rises from 24.79% in the Sadovsky formula to 13.32% in the correction formula, and the correction formula more precisely predicts the peak vibration velocity. The accuracy of the correction formula provides a good scientific basis for the design of tunnel blasting parameters. The research results were successfully applied to the Jiujiawan proximity tunnel on the Duyun-Anshun highway in Guizhou, effectively guaranteeing blasting safety with a minimum clear distance of 17.2 m.

1. Introduction

Tunnel blasting vibration has a negative impact on the surrounding buildings [1,2,3,4], and the reasonable prediction of vibration velocity can provide a theoretical basis for field charge design. Currently, the charge in the cut hole is the primary calculation parameter in blast vibration calculations [5,6]. When a tunnel-cutting hole blast creates a new free surface, the free surface of the non-cutting hole blasting increases, and the conversion of explosive energy into vibration energy decreases accordingly [7,8]. The blasting-free surface and burden affect the propagation of vibration waves [9,10]. Many scholars have conducted a lot of research on the vibration velocity of different free surfaces. Yu [11] has confirmed through field tests that the cutting blasthole causes a vibration that is 1.5–2 times greater than that caused by the breaking blasthole and contour blasthole. According to Yu [12], the cutting blasthole has a substantially higher blasting vibration velocity per unit charge than the non-cutting blasthole. Lu [13] studied the vibration of multi-row blasthole blasting using field measurements and numerical simulations and came to the conclusion that the vibration generated by the following row was 14–22% less than that of the first row with the same charge. The blast vibration is also impacted by the burden at the same time. Uysal [14] believed that the blast vibration decreases as the burden reduces. Unfortunately, the above literature does not quantify the effect of the number of free faces on the peak velocity. In China, the Sadovsky formula suggested by Chinese regulations (GB 6722-2014) is frequently used to determine the peak blast vibration prediction:
v = k ( Q 3 R ) α
where v is the peak vibration velocity of the particle, cm/s, and Q is the explosive amount per delay (kg). R is the distance between the blasting source and the measurement point (m), k is the blasting design and field geology coefficient, and α is the attenuation coefficient.
Ji [15] and Qiu [16] studied the effect of free surface on blast vibration and also revised the site coefficients K and α. Shi [17] and Jia [18] modified and validated the Sadovsky formula by taking into account the number and area of free surfaces. Existing research has taken into account how the number of free surfaces affects the calculation of blast velocity, but few studies have taken into account another crucial factor—the burden. Therefore, an in-depth understanding of the influence of free surface and burdens on blast vibration is important for optimizing blast design.
In order to develop a prediction formula for peak vibration velocity that can effectively predict the influence of blasting-free surfaces, this paper aims to investigate the effects of the number of blasting-free surfaces and burden distance on the blasting vibration velocity through single-hole tests and field engineering applications. The study’s findings can quantify the effect of the free surface factor on the attenuation of blasting vibrations and offer a more precise method for predicting blasting vibrations, which can offer a theoretical basis for ensuring the security of tunnel construction and guiding the design of blasting parameters.

2. Effect of Free Surface on Rock Blasting Mechanism

The tunnel of the blasthole is according to the role of the different divided into cutting blasthole and non-cutting blasthole. Cutting blastholes are pre-blasted to form a free surface to provide favorable blasting conditions for subsequent blastholes [19,20]; The non-cutting blasthole (breaking blasthole, bottom blasthole, and contour blasthole) rely on the free surface opened up by the cutting hole blasting and are thrown out of the rock by blasting.
The blasting crack of a single hole can be illustrated in Figure 1. According to the damage degree of the rock near the blasthole, it can be divided into a crushing zone, a crack zone, and an elastic vibration zone in turn [21,22]. At the moment of the explosion, an overpressure shock wave is formed, causing the rock around the blast hole wall to break up and form a crushing zone. Then, the explosion gas expands outward, causing the rock to crack in all directions, forming a crack zone. When the stress wave passes through the crack zone and decays into an elastic vibration wave, the energy is low, and the rock cannot be broken, causing mainly rock vibration. However, the stress wave is reflected by the free surface to form a tensile wave, which is superimposed with the original stress wave, resulting in tensile cracks in the surrounding rock and forming a laminated crack zone on the free surface.
When the free surface is less, the surrounding rock is more constrained, and the proportion of blast energy converted into vibrational energy in the elastic zone is higher [23]. The increased free surface intensifies the superposition of vibration waves, resulting in more rock cracks and optimizing the crushing effect. Therefore, the rock-breaking mechanism of blasting in the cutting blasthole and non-cutting blasthole is different. By creating a new free surface via blasting the cutting hole, the energy transmission during subsequent blasting is altered. Therefore, it is reasonable to consider the effect of the free surface when analyzing the effect of blasting vibration in different types of blastholes.

3. Effect of Free Surface on Tunnel Blast Vibration

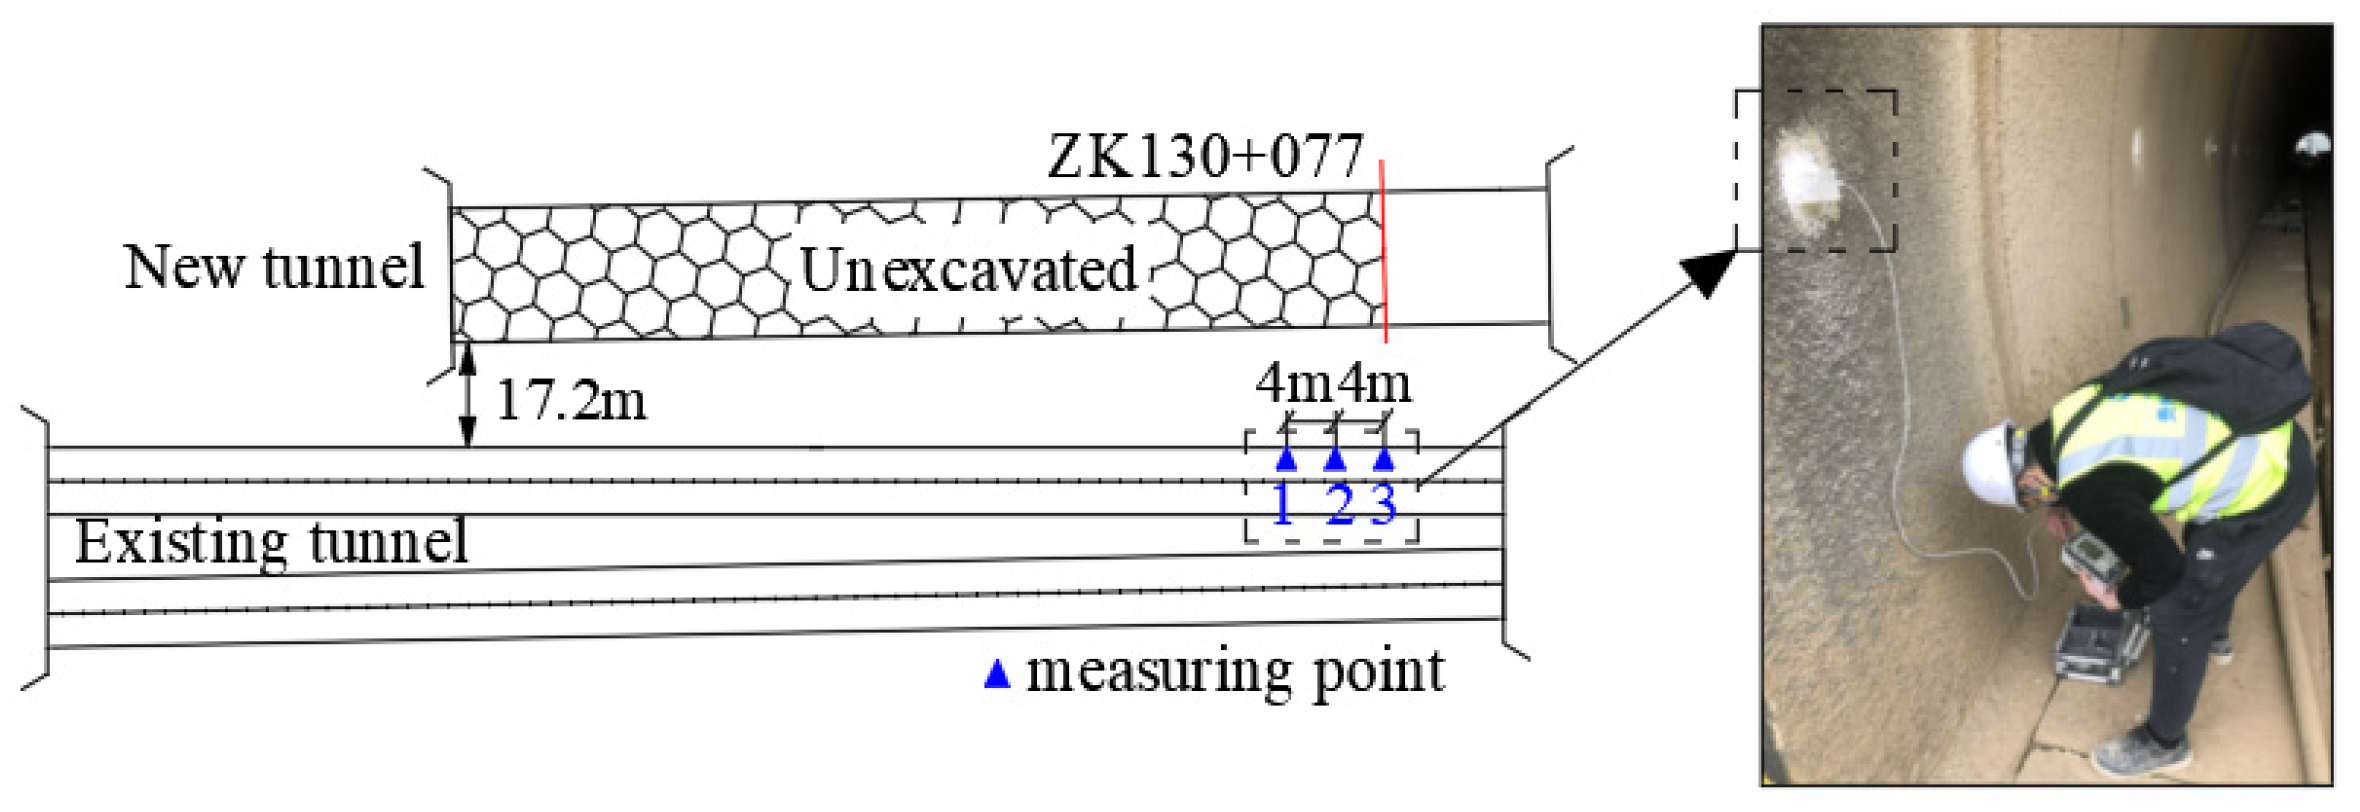
3.1. Introduction to the Test

In small tunnels with various free surface conditions, Lu [13] conducted blasting tests on the vibration velocity propagation; unfortunately, the study could not quantify the impact of the free surface on peak vibration velocity propagation. A total of six blast holes in a double row were tested for their vibration velocity profile, and the site drilling arrangement is shown in Figure 2: the detonation sequence for A → B → C → D → E → F. The parameters for the blasting were as follows: 1.0 m row spacing, 0.8 m hole spacing, 45 mm blasthole diameter, 32 mm explosive diameter, 2.1 kg single hole charge, 3.0 m single hole depth, 0.9 m stemming length, and 2.1 m explosive length. The blasting parameters are shown in Table 1, and the blasting sequence and blasting free surface changes are shown in Figure 3, in which the blasthole A is blasted under only one free surface, and the rest of the holes are blasted under multiple free surfaces. All the blastholes were of the same size except for the inconsistent free surface conditions, and the blast vibration velocities were measured at regular intervals on the tunnel floor.

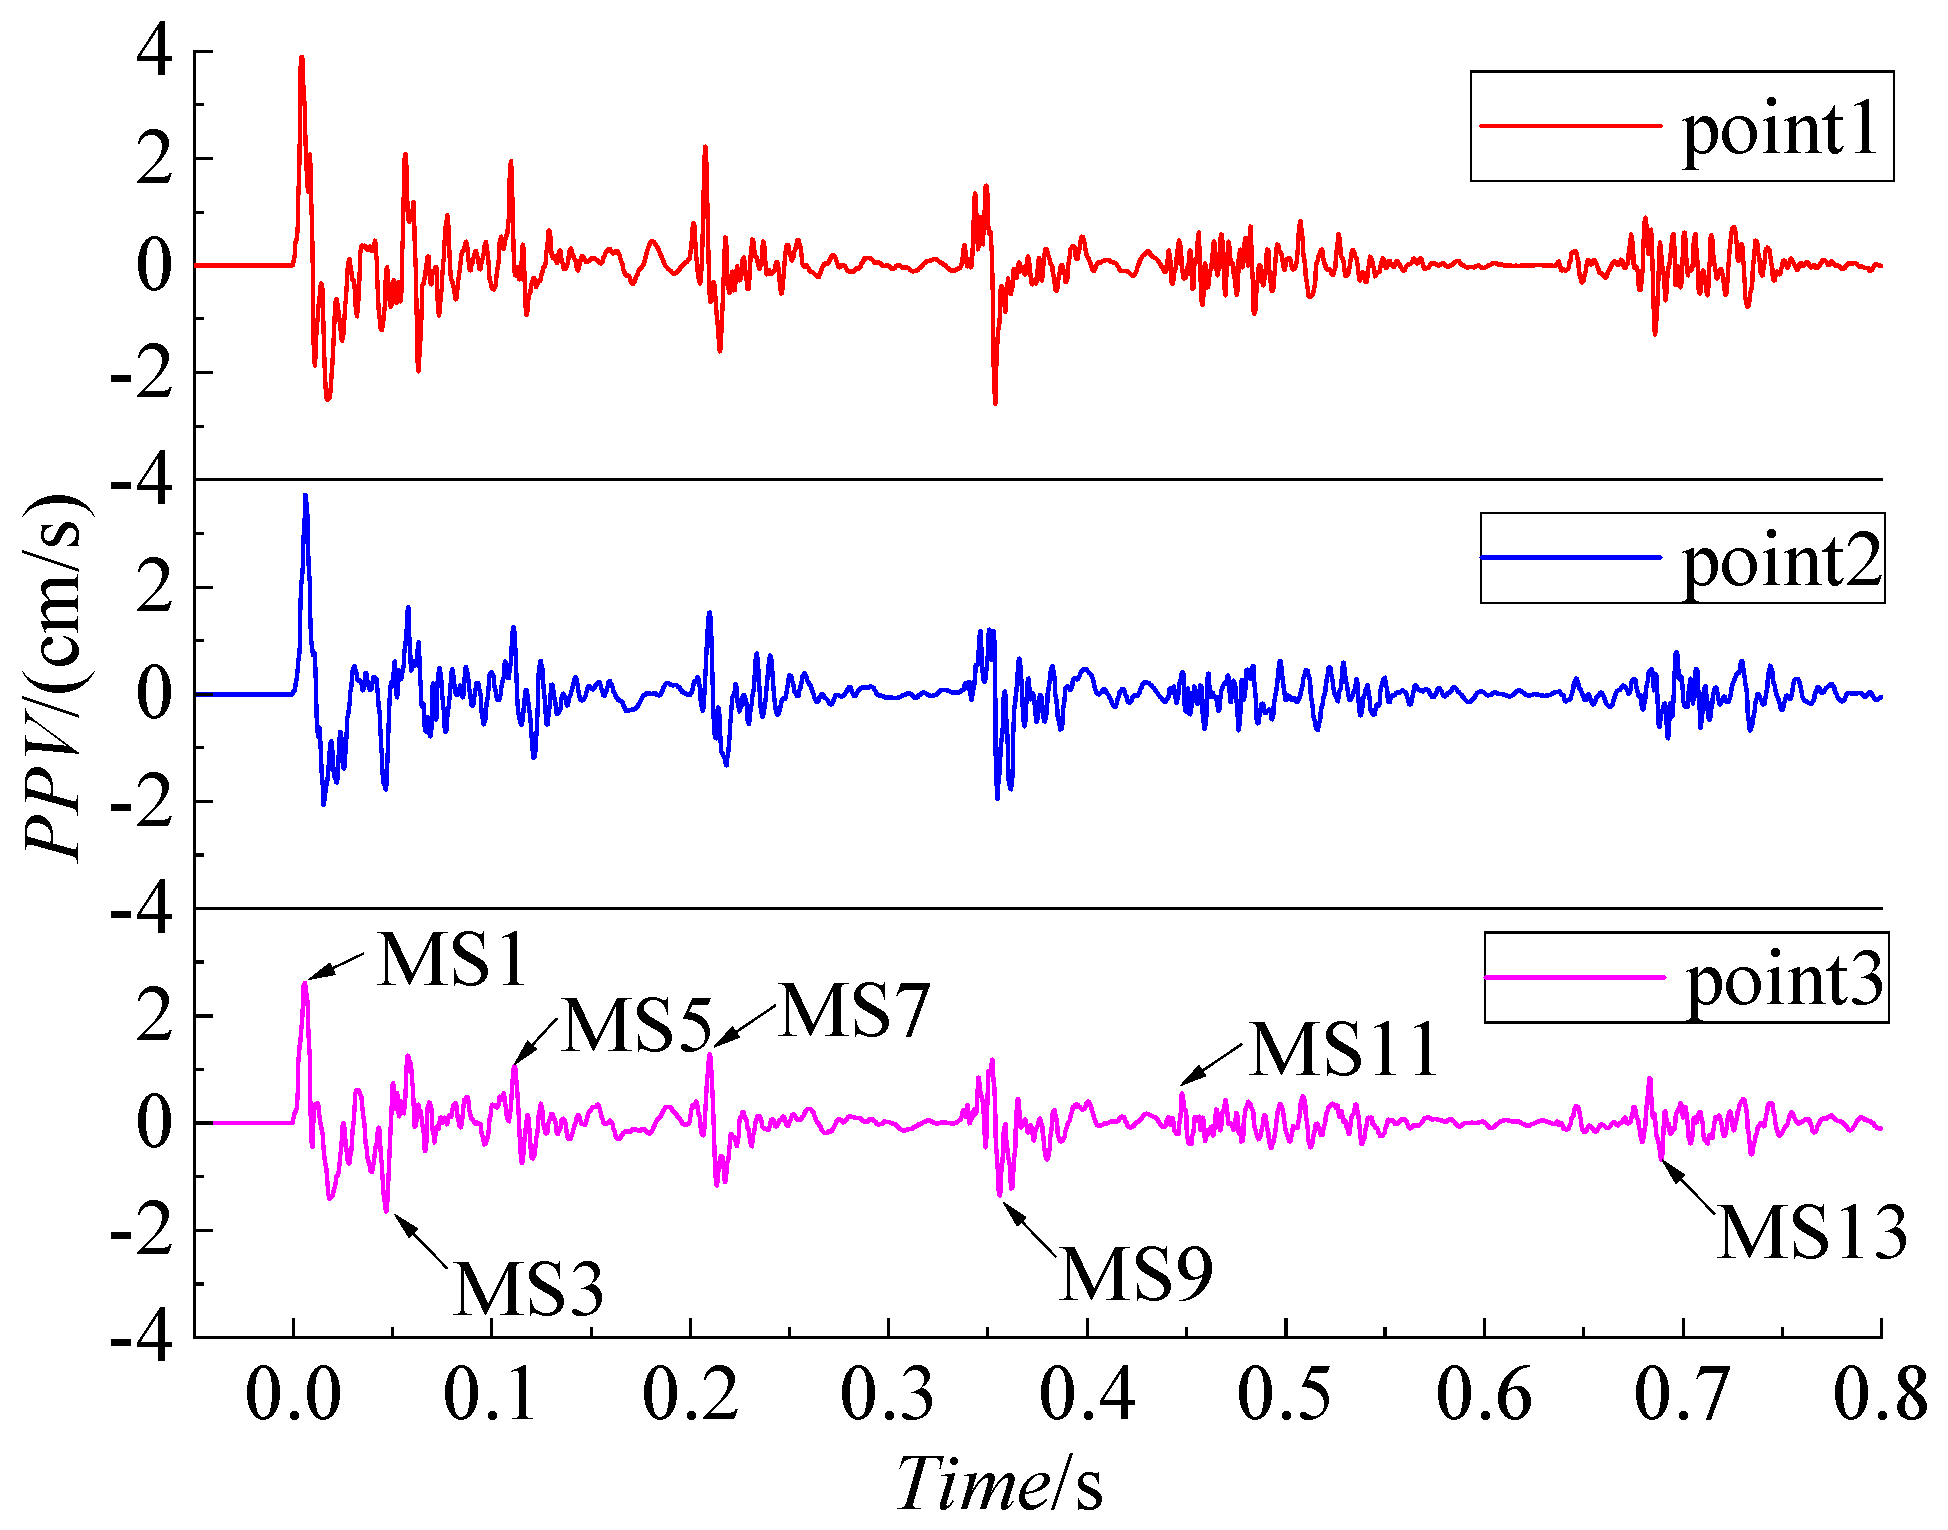
3.2. Analysis of Test Data

The experimental test results are summarized in Table 2, while a box-line diagram is drawn, as shown in Figure 4. According to Table 2 and Figure 4, the peak distribution of vibration velocity varied with the number of blastholes. The average vibration velocity is very near when the free surface and burden are the same, and the average vibration velocities of groups B and C are 0.64 cm/s and 0.55 cm/s, respectively, according to the analysis of the results for a total of 48 groups of data.
However, the propagation of the vibration waves is greatly impacted by changes in the number of free surfaces and burdens. The most significant aspect is that the vibration velocity decreases as the number of free surfaces increases. When the number of free surfaces increases from one to four, the average vibration velocity of group A decreases from 0.91 cm/s to 0.41 cm/s in group F. Groups D and E have the same burden, and the average vibration speed decreases from 0.62 cm/s to 0.51 cm/s when the number of free surfaces increases by one.
Meanwhile, the burden also affects the propagation of the vibration velocity. Despite the same number of free surfaces in groups C and D, the average vibration velocity rises from 0.55 cm/s to 0.62 cm/s.

4. Blast Velocity Formula Considering the Effect of Free Surface

4.1. The Proposed Correction Formula for Blast Vibration Velocity

According to the field test results, the free surface factor has a significant impact on the tunnel blasting vibration velocity propagation. The peak vibration velocity falls with the number of free surfaces while increasing with the distance between burdens. In general, the cutting blasthole only has a free surface; at this moment, the nearby rock is tightly clamped, intensifying the vibration effect. In contrast, there are multiple free surfaces in non-cutting blasting, where the peak vibration velocity is more closely related to the distance of the burden. Tunnel blasting, the number of free surfaces, and the burden distance in the cutting blasthole and non-cutting blasthole of the change in the schematic are shown in Figure 5.
Both the tunnel blasting the free surface and the minimum burden has a large influence on the blasting vibration (Figure 5), and the peak vibration velocity is negatively correlated with the number of free surfaces and positively correlated with the burden distance. Therefore, when predicting the vibration velocity formula, the Sadovsky-modified the formula considering the influence of the free surface, which is established as:
v = k ( Q 3 R ) α ( W min m R ) η
where Wmin is the minimum burden (m), m is the number of free surfaces, and η is the attenuation coefficient associated with the free surface. Equations (1) and (2) were linearized for regression analysis, and logarithms were taken on both sides of the equation.
Sadovsky formula:
ln v = ln k + α ln ( Q 3 R )
Correction formula:
ln v = ln k + α ln ( Q 3 R ) + η ln ( W min m R )

4.2. Verification of Blast Vibration Velocity Correction Formula

The data in Table 2 were substituted into the Sadovsky formula and the modified formula, respectively, and the values of the coefficients k, α, and η were solved using linear regression. Additionally, to measure the accuracy of the prediction coefficients, the correlation coefficient R2 of each formula was solved, as shown in Equation (5):
R 2 = 1 ( y y ) 2 ( y y ¯ ) 2
where, y is the measured vibration velocity value; y is the fitted regression value; and y ¯ is the mean value of the measured data.
Additionally, the obtained formulas are shown in Equations (6) and (7) and plotted in Figure 6. The regression coefficient R2 of the correction formula obtained by fitting is 0.83, which is more accurate than that of the Sadovsky formula, which is 0.74. The parameters α and η in Equation (4) reflect the contribution of the proportional distance factor and the free surface factor to the vibration velocity attenuation, and the calculated α:η = 0.73:0.21, indicating that the vibration speed attenuation caused by the free surface factor accounts for about 21% of the total attenuation factor, which also indicates that the blast free surface factor has a greater impact on the vibration. Therefore, the proportion of the distance factor (distance, explosive charge) and free surface factors (free surface number, burden distance) will have a greater degree of impact on the attenuation of the blasting vibration. Vibration prediction should be considered with the impact of the above factors.
Sadovsky formula (R2 = 0.74):
ln v = 3.267 + 1.175 ln ( Q 3 R )
Correction formula (R2 = 0.83):
ln v = 3.769 + 0.858 ln ( Q 3 R ) + 0.317 ln ( W min m R )
Comparing the vibration velocity prediction values obtained from Equation (3) and Equation (4) with the measured peak vibration velocity in the literature (Figure 6), it is clear that the modified formula improves the prediction effect. When the amount of single-hole charge and propagation distance is the same, it is obvious that considering the effects of the number of free surfaces and the burden distance will improve the accuracy of vibration velocity prediction.

5. Engineering Applications

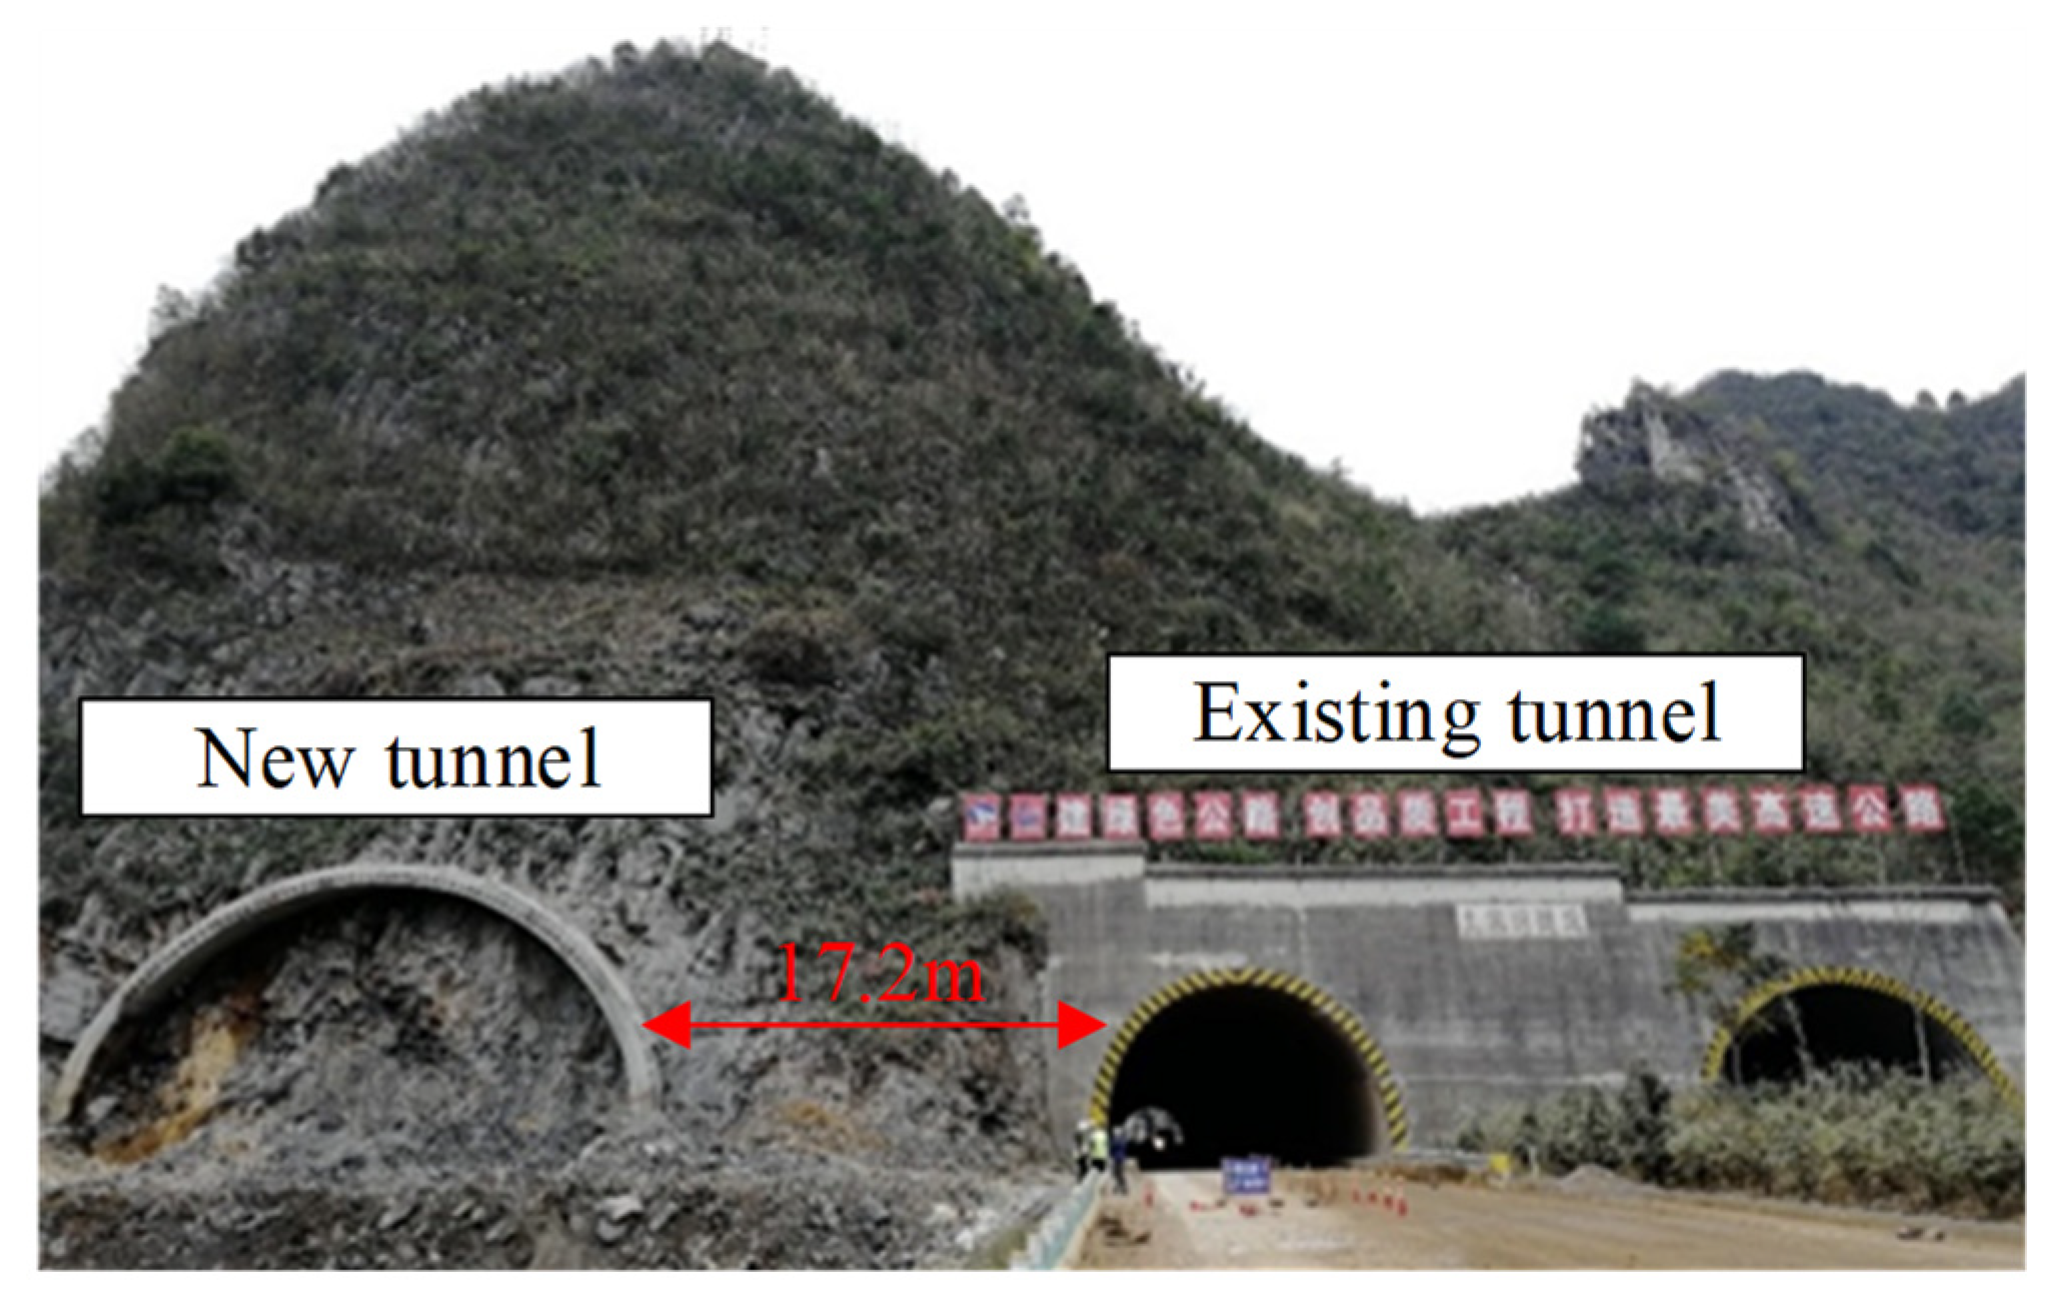
5.1. Project Overview

The new Jiujiawan tunnel on the Duyun-Anshun highway in Guizhou needs to be close to the adjacent existing tunnel with a minimum distance of 17.2 m (Figure 7). To avoid adverse effects of blasting vibration on the existing tunnel lining, blasting effects need to be controlled by predicting the peak blasting vibration velocity and determining the optimal blasting parameters.
The total length of the new Jiujiawan tunnel is 230 m, with a section size of 21.5 × 13.7 (length × width). The tunnel mainly crosses the stratum of medium weathering tuff, with a rock density of 2660 kg/m3, an elastic modulus of 6.5 GPa, and a P-wave speed of 4100 m/s. The tunnel construction is in the order of Part I to Part V. Part Ⅰ is the construction of the middle guide tunnel, the size of which is 7.0 m × 7.4 m (width × height). The drilling and blasting methods were adopted on-site. The hole diameter was 38 mm, and the diameter of the rock emulsion explosive was 32 mm. It was detonated by a non-electric detonator. To better guide the blasting design, a test blast was first conducted at the site when the new tunnel was 20.0 m away from the existing tunnel. the blasthole is shown in Figure 8, and the blasting parameters are shown in Table 3.

5.2. Formula Fitting

Considering the structural health and service life of the existing tunnel, the construction unit set 5 cm/s as the blasting vibration velocity threshold. To obtain a suitable vibration velocity prediction formula to guide the design of subsequent blasting parameters, in the existing tunnel near the blast source side of the arch waist, a test was conducted every 4 m to test the vibration velocity (Figure 9), The vibration velocity of the measurement point is the maximum in the vertical tunnel direction, and the vertical vibration velocity curve is shown in Figure 10.
At the same time, as the vertical test results are summarized in Table 3, the first test explosion excavation in the middle guide tunnel, the largest section of MS3, produced a delayed charge of 42.6 kg, and the MS1 and MS3 charges were close to 33.6 kg and 42.6 kg, respectively. Obviously, by Figure 10. it can be seen that the cutting blasthole was subject to the strongest clamping restraint, inducing the largest peak vibration velocity.
In engineering applications, we paid more attention to radial and vertical vibration, while the regularity of the tangential vibration was poor [24]. Therefore, the prediction formula was used to fit the test data in radial and vertical directions, as in Equation (8). The fitted regression coefficients R2 = 0.91 in the vertical direction and R2 = 0.70 in the radial direction are satisfactory for engineering applications. In addition, it is clear that the larger the vibration velocity, the better the fitting effect of the modified formula.
Vertical   direction :   ln v = 9.27 + 3.25 ln ( Q 3 R ) + 0.43 ln ( W min m R ) Radial   direction :   ln v = 13.64 + 2.95 ln ( Q 3 R ) + 0.58 ln ( W min m R )
To evaluate the accuracy of the modified formula, the modified formula and the Sadovsky formula were used for prediction analysis. To save space in the article, only the prediction results in the vertical direction are presented, as shown in Table 4. It can be seen that the average relative tolerance calculated by the modified formula is 13.32% and the relative tolerance of the cutting blasthole is 18.15%, which is much smaller than the average relative tolerance calculated by the Sadovsky formula of 24.79% and the relative tolerance of the cutting blasthole of 56.48%, indicating that the correct formula significantly improves the prediction effect of the peak blast vibration velocity and more truly reflects the engineering reality.

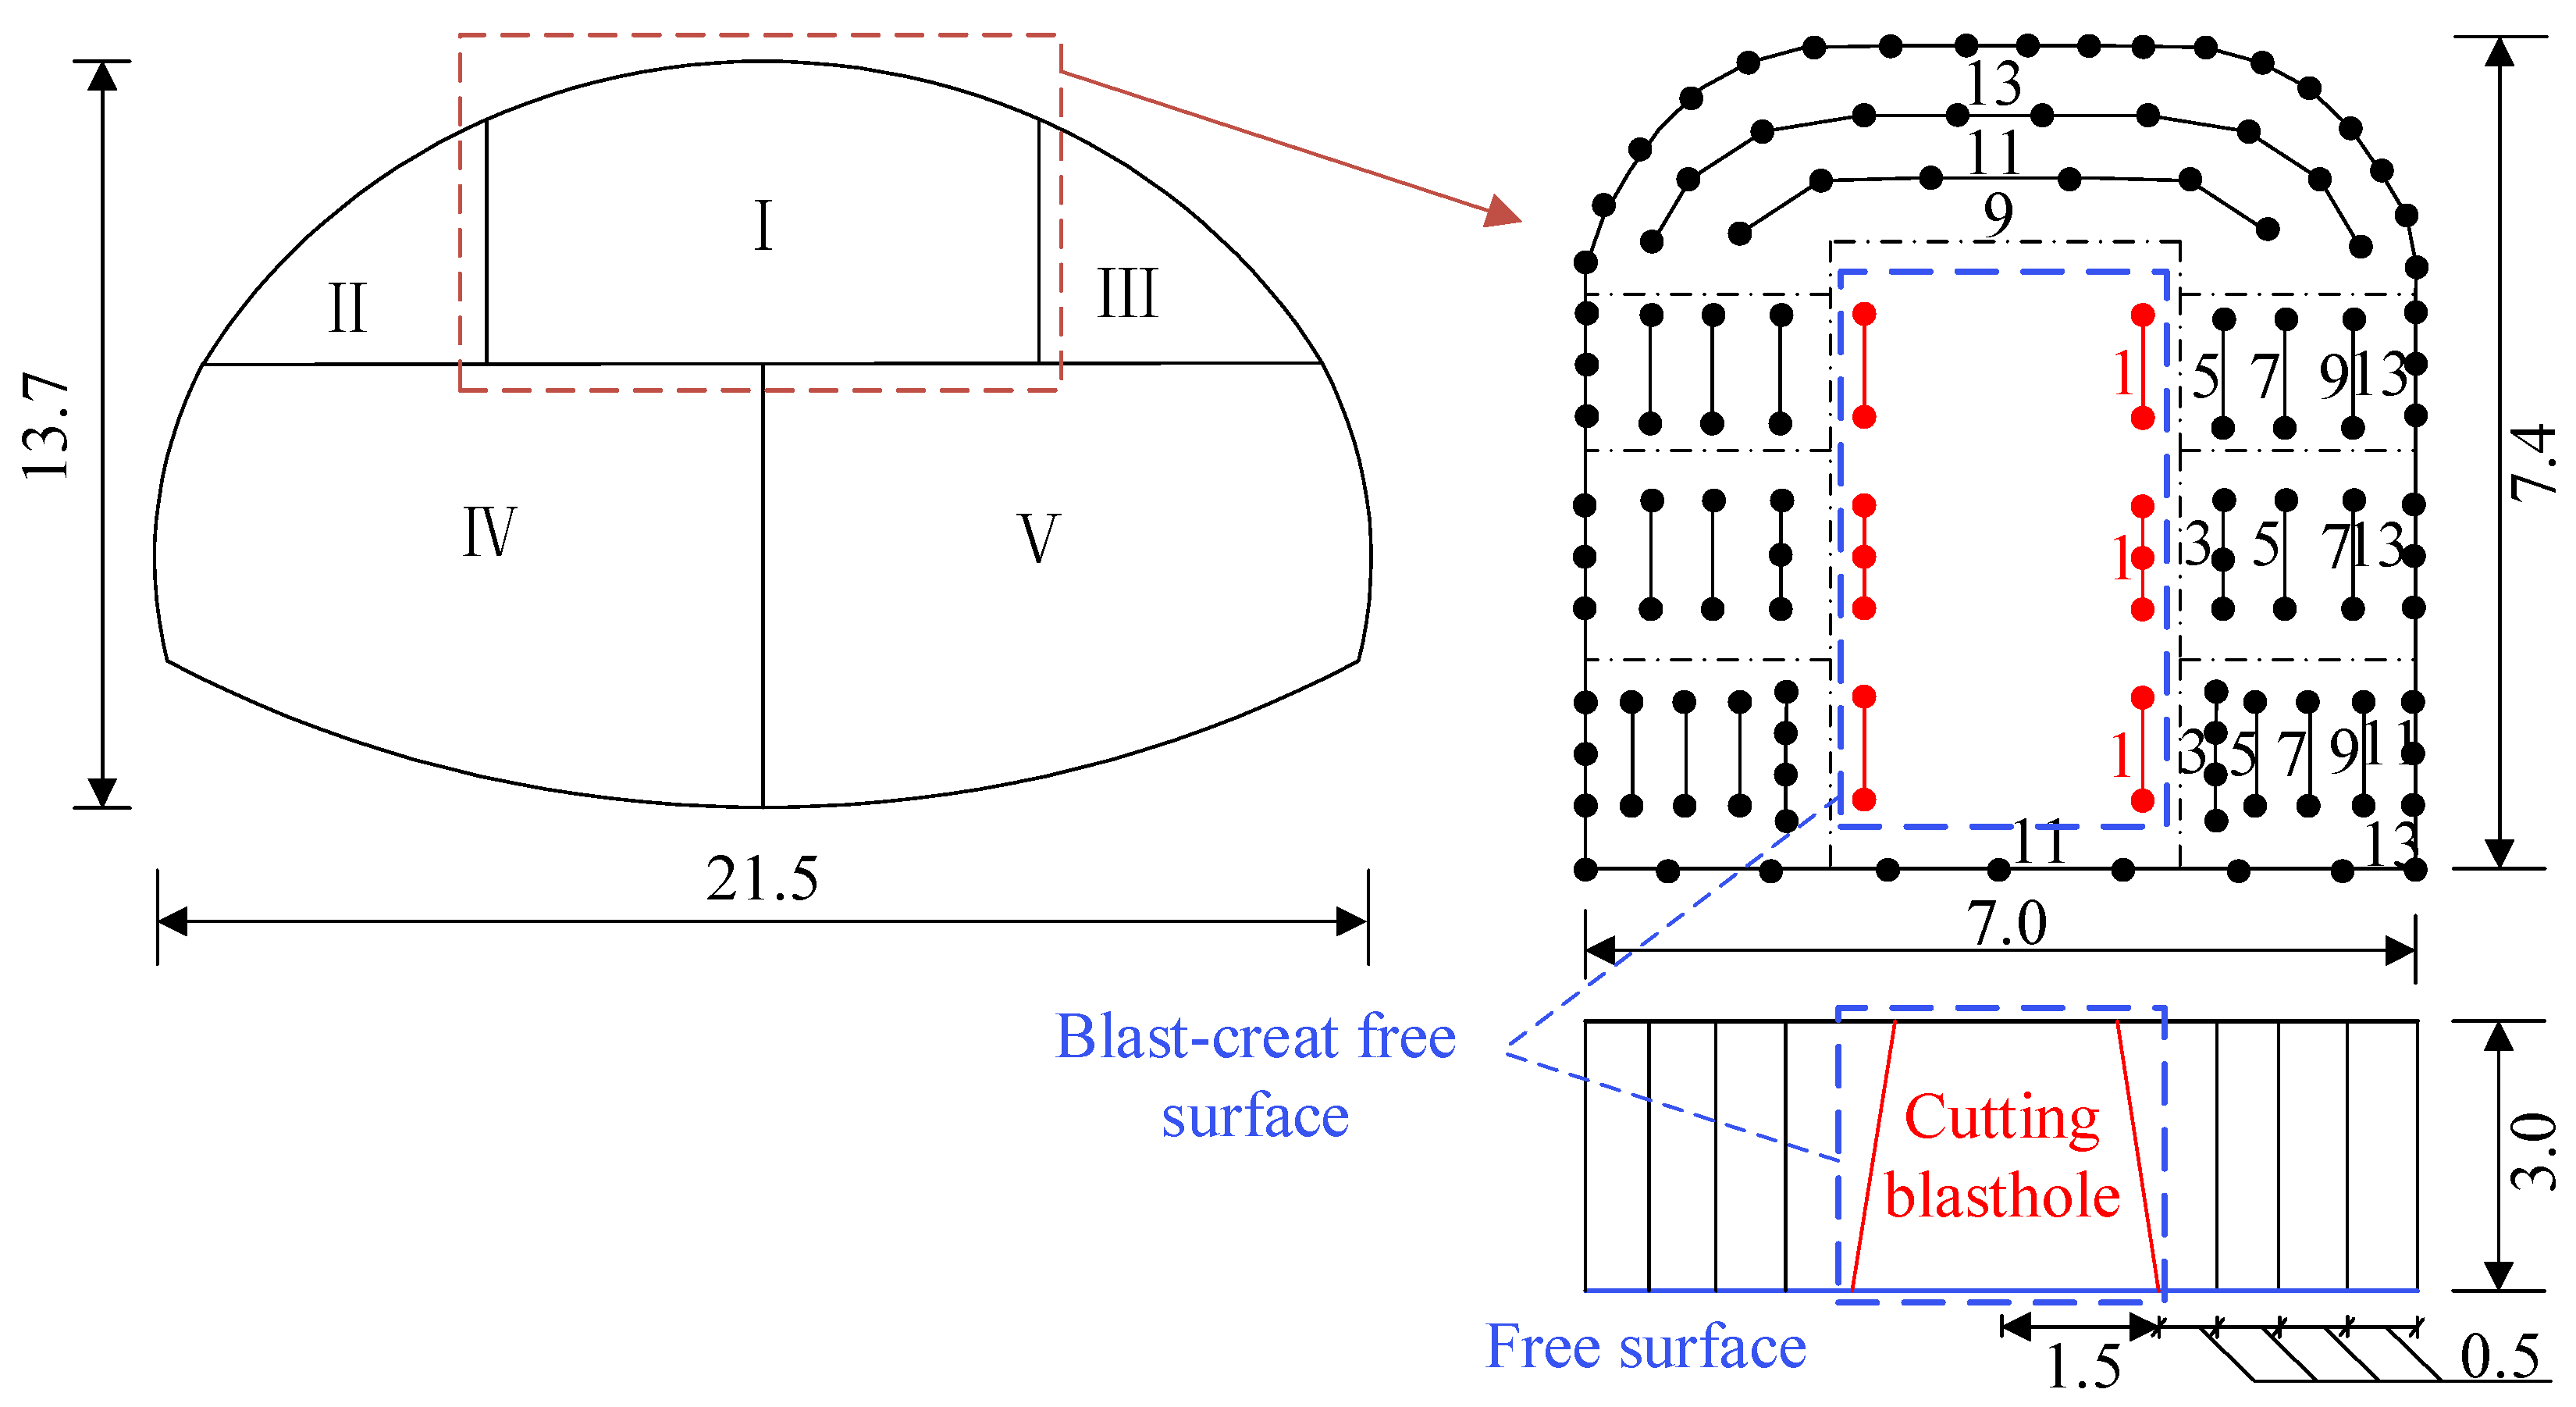
5.3. Control of Blasting Parameters

With the large excavation section of the new tunnel and a large number of boreholes, the superimposed blasting vibration effect could lead to peak vibration velocity. Meanwhile, when the new tunnel is closest to the existing tunnel, the minimum clear distance is smaller than the excavation span and also aggravates the construction risk. Therefore, it is essential to dynamically modify the burden distance and amount per delayed charge in addition to controlling the blasting charge in the cutting blasthole. To obtain the relationship between the proximity tunnel vibration effect and blasting parameters, the peak blast velocity of each delayed charge can be accurately predicted according to Equation (8). Once the set safe vibration velocity is selected, the optimal blasting parameters can be selected by the relationship between the amount of charge per charge Q, the number of free surfaces m, and the burden distance Wmin, as reflected in Equation (9).
Q = R 3 × exp ( 0.92 ln v 8.54 0.40 ln ( W min m R ) )
When the safe vibration velocity of 5 cm/s is determined, the blasting parameters can be selected according to Figure 11. For example, when the near tunnel distance R = 15 m, Wmin = 2.0 m for the cutting blasthole, and the maximum delayed charge is controlled within 6.5 kg, the number of blastholes in the contour blasthole is large, m = 2, Wmin = 0.5 m, and the maximum delayed charge is controlled within 14.9 kg.

6. Conclusions

Through the analysis of the tunnel single-hole blasting test and field blasting prediction, the blasting vibration velocity under different free surfaces and burdens were compared and analyzed, and the following conclusions were drawn.
(1)
There is a strong relationship between the number of free faces and the minimum burden, with more free faces resulting in a lower vibration velocity and a smaller minimum burden resulting in a lower vibration velocity.
(2)
By introducing the number of free surfaces and burden distance to the Sadovsky formula for correction, the correction formula regression coefficient is R2 = 0.83 and R2 = 0.74 for the Sadovsky formula. The correction formula significantly enhances the ability to predict blast vibration, allowing for a greater application while more correctly reflecting the decay pattern of the blast vibration brought on by the free surface.
(3)
Through the analysis and fitting of the measured peak value of vibration velocity, the ratio of the parameter α of the proportional distance factor to the parameter η reflecting the free surface factor is 0.73/0.21. The contribution of the free surface factor to the attenuation of vibration velocity accounts for 21% of the total factors, which cannot be ignored.
(4)
The correction formula considering the number of free surfaces and burden distance can improve the accuracy of vibration velocity prediction. The prediction accuracy of the cutting blasthole is improved from 56.48% to 18.15% of the relative tolerance of the Sadovsky formula, and the average tolerance is improved from 24.79% to 13.32%. The correction formula can better predict the variation in vibration velocity at the site and provide a reliable basis for the design parameters of blasting at the site.
(5)
When the safe vibration velocity is known, the correction formula can be used to back-calculate the maximum charge for each series. This can be used to optimize the blasting design parameters for each series in the field.
In this paper, the effect of free surface factors on the blast vibration was investigated through single-hole tests and field applications, and a free surface correction was made to the traditional Sadovsky formula. However, the essence of the effect of the free face on blast vibration lies in altering the confining action of the surrounding rock, and this paper fails to study the effect of the free face from the theory. Therefore, in future research, theoretical studies are needed to further reveal the mechanism of the free surface effect.

Author Contributions

Writing—original draft preparation, X.Z. (Xiaohui Zeng); Conceptualization, X.Z. (Xuemin Zhang); Investigation, J.C.; writing—review and editing, X.Z. (Xianshun Zhou); data curation, Y.D. All authors have read and agreed to the published version of the manuscript.

Funding

Supported by the National Natural Science Foundation of China (51978671) and the Graduate Innovation Project of Central South University (1053320213139).

Institutional Review Board Statement

Not applicable.

Informed Consent Statement

Not applicable.

Data Availability Statement

Not applicable.

Acknowledgments

The authors would like to thank Bin DAI of the Railway Development Investment Group Co., Ltd. for his support of this work.

Conflicts of Interest

The authors declare no conflict of interest.

References

  1. Singh, P.K.; Roy, M.P. Damage to surface structures due to blast vibration. Int. J. Rock Mech. Min. Sci. 2010, 47, 949–961. [Google Scholar] [CrossRef]
  2. Zhao, H.b.; Long, Y.; Li, X.; Lu, L. Experimental and numerical investigation of the effect of blast-induced vibration from adjacent tunnel on existing tunnel. KSCE J. Civ. Eng. 2016, 20, 431–439. [Google Scholar] [CrossRef]
  3. Feher, J.; Cambal, J.; Cvoliga, M.; Kacmar, L.; Sulovec, V.; Suver, M.; Beca, J. Impacts of noise and technical seismicity from blasting works during tunnel construction on the surrounding environment. Acta Montan. Slovaca 2019, 24, 151–161. [Google Scholar]
  4. Noren-Cosgriff, K.M.; Ramstad, N.; Neby, A.; Madshus, C. Building damage due to vibration from rock blasting. Soil Dyn. Earthq. Eng. 2020, 138, 106331. [Google Scholar] [CrossRef]
  5. Wang, Y.L.; Tan, Z.S.; Chi, Y.L. Research on blasting control technology for blast in shallow tunnel crossing existing buildings. In Applied Mechanics and Materials; Trans Tech Publications Ltd.: Bach, Switzerland, 2011; Volume 90, pp. 1768–1771. [Google Scholar]
  6. Jiang, N.; Zhou, C. Blasting vibration safety criterion for a tunnel liner structure. Tunn. Undergr. Space Technol. 2012, 32, 52–57. [Google Scholar] [CrossRef]
  7. Sanchidrian, J.A.; Segarra, P.; Lopez, L.M. Energy components in rock blasting. Int. J. Rock Mech. Min. Sci. 2007, 44, 130–147. [Google Scholar] [CrossRef]
  8. Wu, H.; Gong, M.; Zhao, Q.; Wu, X.; Liu, X. Vibration energy comparison helps identify formation time of new free surface in urban tunnel blasting. Appl. Sci. 2022, 12, 10061. [Google Scholar] [CrossRef]
  9. Joo, G.W.; Oh, T.M.; Cho, G.C. Free Surface Effects for Ground Vibration and Effective Burden by using Abrasive Waterjet System. In From Fundamentals to Applications in Geotechnics; IOS Press: Amsterdam, The Netherlands, 2015; pp. 2677–2684. [Google Scholar]
  10. Zou, B.; Xu, Z.; Wang, J.; Luo, Z.; Hu, L. Numerical investigation on influential factors for quality of smooth blasting in rock tunnels. Adv. Civ. Eng. 2020, 2020, 9854313. [Google Scholar] [CrossRef]
  11. Yu, J.; Zhou, Z.; Zhang, X.; Yang, X.; Wang, J.; Zhou, L. Vibration response characteristics of adjacent tunnels under different blasting schemes. Shock. Vib. 2021, 2021, 5121296. [Google Scholar] [CrossRef]
  12. Yu, W.; Gao, W.; Yang, N. Study on Drilling and Blasting Construction of a Small-Spacing Tunnel and Vibration Characteristics of Intermediate Rock Strata. IOP Conf. Ser. Earth Environ. Sci. 2021, 861, 052094. [Google Scholar] [CrossRef]
  13. Lu, W.; Leng, Z.; Hu, H.; Chen, M.; Wang, G. Experimental and numerical investigation of the effect of blast-generated free surfaces on blasting vibration. Eur. J. Environ. Civ. Eng. 2018, 22, 1374–1398. [Google Scholar] [CrossRef]
  14. Uysal, O.; Arpaz, E.; Berber, M. Studies on the effect of burden width on blast-induced vibration in open-pit mines. Environ. Geol. 2007, 53, 643–650. [Google Scholar] [CrossRef]
  15. Ji, X.; Gao, S.; Zhao, H.; Liu, G. Research on the influence of the number of tunnel blasting free faces on ground vibration based on ANSYS/LSDYNA. In Proceedings of the Sixth International Conference on Electromechanical Control Technology and Transportation (ICECTT 2021), Chongqing, China, 6 February 2022. [Google Scholar]
  16. Qiu, X.; Shi, X.; Gou, Y.; Zhou, J.; Chen, H.; Huo, X. Short-delay blasting with single free surface: Results of experimental tests. Tunn. Undergr. Space Technol. 2018, 74, 119–130. [Google Scholar] [CrossRef]
  17. Shi, J.-J.; Guo, S.-C.; Zhang, W. Expansion of blast vibration attenuation equations for deeply buried small clearance tunnels based on dimensional analysis. Front. Earth Sci. 2022, 10, 791. [Google Scholar] [CrossRef]
  18. Jia, B.; Zhou, L.; Cui, J.; Chen, H. Attenuation model of tunnel blast vibration velocity based on the influence of free surface. Sci. Rep. 2021, 11, 21077. [Google Scholar] [CrossRef] [PubMed]
  19. Zhang, H.; Li, T.; Du, Y.; Zhu, Q.; Zhang, X. Theoretical and numerical investigation of deep-hole cut blasting based on cavity cutting and fragment throwing. Tunn. Undergr. Space Technol. 2021, 111, 103854. [Google Scholar] [CrossRef]
  20. Zhang, X.T.; Zou, P.; Zhou, H.M.; Wang, H.L. Study and application on cutting technology of underground drifting blasting. In Advanced Materials Research; Trans Tech Publications Ltd.: Bach, Switzerland, 2012; Volume 549, pp. 1002–1006. [Google Scholar]
  21. Sim, Y.; Cho, G.-C.; Song, K.-I. Prediction of fragmentation zone induced by blasting in rock. Rock Mech. Rock Eng. 2017, 50, 2177–2192. [Google Scholar] [CrossRef]
  22. Li, Q.; Gao, Z.-H.; Yu, Q.; Huang, C.; Wang, K.; Xu, W.-L. Effect of explosive stress waves on the crack propagation in the defective medium using strain gauge method. KSCE J. Civ. Eng. 2022, 26, 2780–2788. [Google Scholar] [CrossRef]
  23. Guan, X.; Guo, C.; Mou, B.; Shi, L. Tunnel millisecond-delay controlled blasting based on the delay time calculation method and digital electronic detonators to reduce structure vibration effects. PLoS ONE 2019, 14, e0212745. [Google Scholar] [CrossRef] [PubMed]
  24. Gao, Q.; Lu, W.; Yang, S. Components and attenuation of seismic waves induced by horizontal smooth blasting. Explos. Shock Waves 2019, 39, 170–182. (In Chinese) [Google Scholar]
Figure 1. Blasting plane diagram.
Applsci 13 01373 g001
Figure 2. Field drilling diagram.
Applsci 13 01373 g002
Figure 3. Detonation sequence and blasting free surface change.
Applsci 13 01373 g003
Figure 4. Diagram of variation in vibration velocity peak distribution with the serial number of blastholes.
Applsci 13 01373 g004
Figure 5. Schematic diagram of blasting of different blasting holes in the tunnel: (a) Burden variation. (b) Free surface variation.
Applsci 13 01373 g005
Figure 6. Formula validation.
Applsci 13 01373 g006
Figure 7. Relative position of the new tunnel to the existing tunnel.
Applsci 13 01373 g007
Figure 8. Schematic diagram of on-site drilling.
Applsci 13 01373 g008
Figure 9. Schematic diagram of measuring point layout.
Applsci 13 01373 g009
Figure 10. Time history curve of the measuring point.
Applsci 13 01373 g010
Figure 11. Control of safe charge.
Applsci 13 01373 g011
Table 1. Table of blasting parameters.
BlastholeFunctionQ/kgmW/cmWmin/cm
ACutting blasthole2.111.951.95
BNon-cutting blasthole2.121.95, 0.40.4
CNon-cutting blasthole2.121.95, 0.40.4
DNon-cutting blasthole2.121.95, 0.50.5
ENon-cutting blasthole2.131.95, 0.5, 1.20.5
FNon-cutting blasthole2.141.95, 0.5, 0.4, 0.40.4
Table 2. Test data statistics.
Points NumberVibration Velocity of Measuring Point/(cm/s)Distance/m
ABCDEF
12.371.361.131.991.611.0011.20
21.730.830.651.491.000.5620.30
30.910.640.550.620.510.4139.30
40.870.560.480.560.450.2650.50
50.640.420.310.420.310.2264.20
60.330.230.180.190.150.1179.80
70.270.170.150.180.170.10110.80
80.120.060.030.100.050.03140.00
Table 3. Statistical table of blasting parameters for the middle guide tunnel.
TypeBlasthole TypeDetonator SeriesBlasthole
Number/Pieces
Charge Weight per Hole/kgTotal Charge
/kg
The middle guide tunnelCutting blasthole1102.433.6
Breaking blasthole3143.0~3.342.6
5122.4~3.334.2
7122.1~3.337.0
9140.9~2.728.5
11170.9~1.818.6
Contour blasthole1160.9~1.58.1
13320.6~1.224.6
Total 121 216.1
Table 4. Test result statistics.
Points NumberDetonator SeriesQ
/kg
mWmin
/cm
R
/m
PPV
/(cm/s)
Sadovsky Formula
/(cm/s)
ToleranceCorrection Formula
/(cm/s)
Tolerance
1MS133.612.026.73.901.44 44.89%3.08 18.15%
MS342.620.526.72.091.94 53.78%1.63 29.43%
MS534.220.526.71.961.47 37.46%1.29 20.14%
MS725.820.526.72.231.62 25.85%1.40 8.52%
MS928.520.526.71.501.17 1.69%1.06 11.34%
MS1126.720.526.70.730.55 0.16%0.55 0.14%
MS1324.620.526.70.900.97 17.18%0.90 8.38%
2MS133.612.026.93.721.65 55.63%3.53 5.19%
MS342.620.526.91.632.22 36.39%1.87 14.43%
MS534.220.526.91.261.69 33.93%1.47 16.69%
MS725.820.526.91.531.86 21.74%1.60 4.65%
MS928.520.526.91.211.34 10.93%1.21 0.27%
MS1126.720.526.90.620.63 1.61%0.63 1.32%
MS1324.620.526.90.791.12 41.26%1.03 30.24%
3MS133.612.027.92.611.70 56.48%3.63 7.05%
MS342.620.527.91.262.29 9.40%1.92 8.27%
MS534.220.527.91.071.74 11.45%1.51 22.90%
MS725.820.527.91.291.92 14.09%1.65 26.20%
MS928.520.527.91.191.38 7.96%1.24 17.31%
MS1126.720.527.90.550.65 11.24%0.65 11.55%
MS1324.620.527.90.831.15 27.52%1.06 17.51%
Average tolerance 24.79% 13.32%
Disclaimer/Publisher’s Note: The statements, opinions and data contained in all publications are solely those of the individual author(s) and contributor(s) and not of MDPI and/or the editor(s). MDPI and/or the editor(s) disclaim responsibility for any injury to people or property resulting from any ideas, methods, instructions or products referred to in the content.

