Surface Discharge Characteristics and Numerical Simulation in C4F7N/CO2 Mixture


Abstract
:1. Introduction
2. Simulation Model
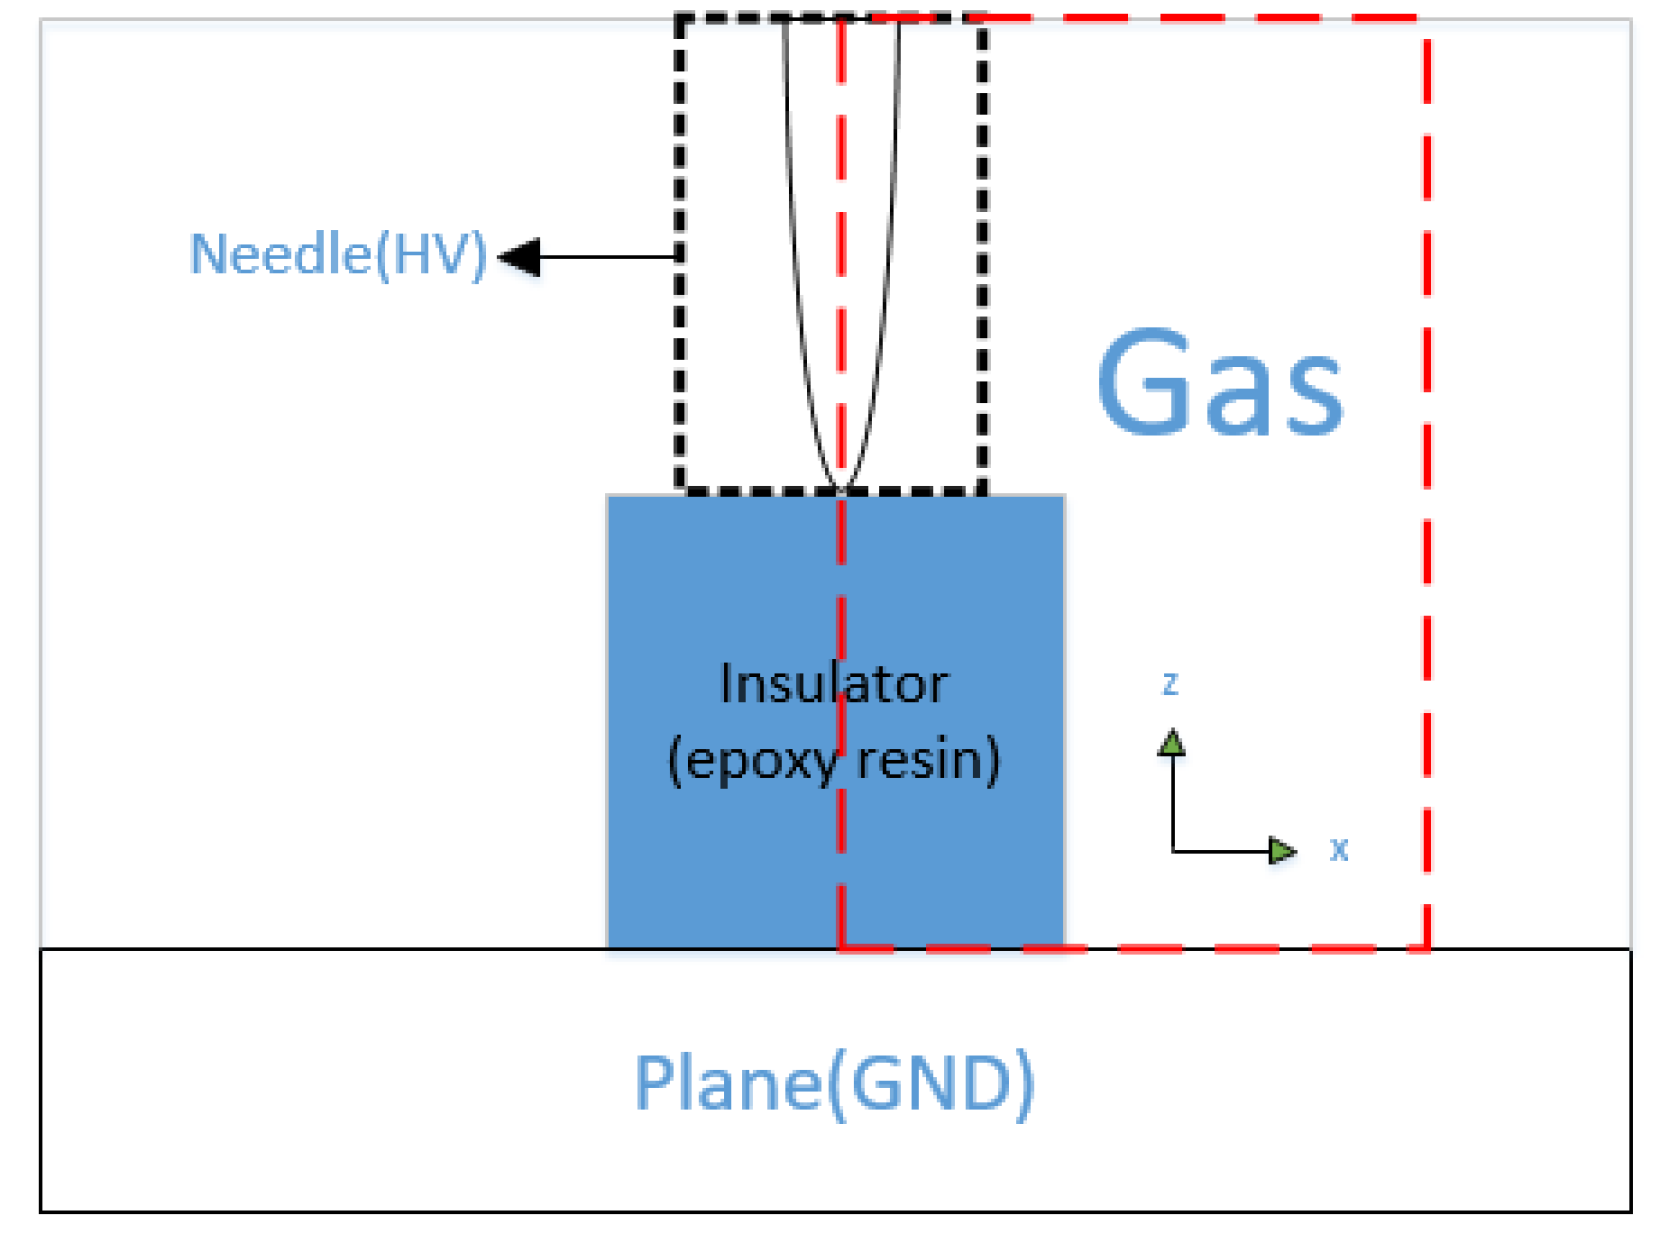
2.1. Physical Model
2.2. Numerical Model
2.3. Calculation of Photon Flux
3. Analysis of Simulation Result
3.1. Streamer Development Process
3.2. Effect of Voltage on Discharge
3.3. Effect of Dielectric Constant on Discharge
3.4. Comparison with the Discharge in SF6
4. Conclusions
- Surface discharge in C4F7N/CO2 can be divided into three stages: it develops along the upper surface of the insulator, transitions along the rounded corner, and develops along the right surface of the insulator. The streamer branch appears during the transition phase, develops for a short time, and then stops in the third phase.
- When the streamer reaches the vicinity of the cathode, the electric field intensity increases from to , the photon flux increases from to , and the change law of the photon flux is similar to that of the electric field intensity. The expression of the maximum photon flux by fitting is (stage 1) and (stage 3).
- As the applied voltage increases, the peak of electric field intensity and the peak of photon flux in the streamer head increase, and the streamer growth speed increases.
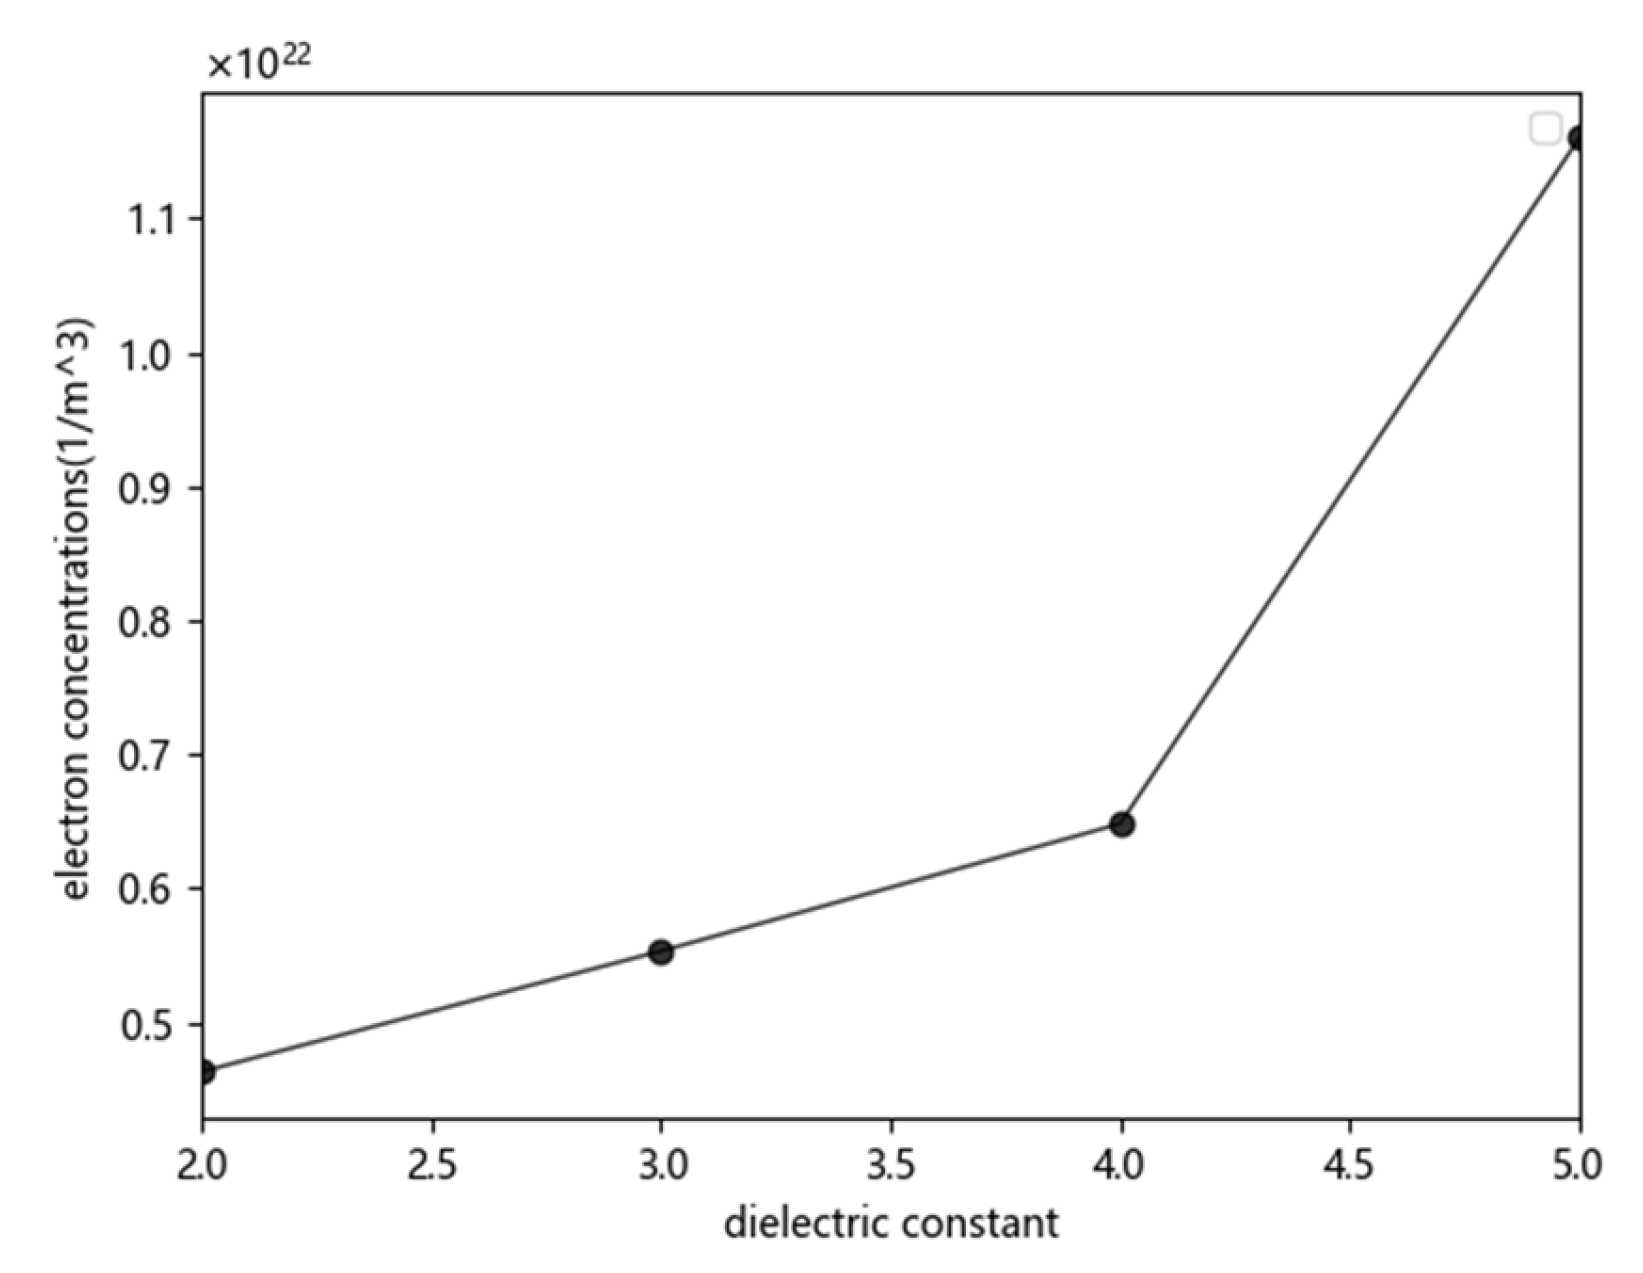
- The peak electric field intensity of the streamer head likewise increases along with the insulator’s increased dielectric constant, which further accelerates the streamer’s development.
- As an alternative to SF6, C4F7N/CO2 has a similar surface discharge phenomenon and a slightly faster discharge rate than that of SF6. The electric field intensity, electron concentration, and photon flux generated by discharge in C4F7N/CO2 are higher than those in SF6, and the streamer channel is also more obvious than that in SF6.
Author Contributions
Funding
Data Availability Statement
Conflicts of Interest
References
- Stone, G.C. Partial discharge diagnostics and electrical equipment insulation condition assessment. IEEE Trans. Dielectr. Electr. Insul. 2005, 12, 891–904. [Google Scholar] [CrossRef]
- Zang, Y.; Qian, Y.; Wang, H.; Xu, A.; Sheng, G.; Jiang, X. Method of GIL partial discharge localization based on natural neighbor interpolation and ECOC-MLP-SVM using optical simulation technology. High Volt. 2021, 6, 514–524. [Google Scholar] [CrossRef]
- Yu, Z.; Wenjun, Z.; Jianhui, Y.; Shizhuo, H.; Tianran, Z. Analysis on application characteristics of environmental insulated mixed gases. Guangdong Electr. Power 2018, 31, 3–8. [Google Scholar]
- Hu, S.; Wenjun, Z.; Jianhui, Y. Application of quantitative structure-property relationship model in research on SF6 alternative gases. Guangdong Electr. Power 2018, 31, 9–17. [Google Scholar]
- Qin, Z.; Zheng, Y.; Wei, L.; Yang, S.; Zhang, C.; Zhou, W. Impulse insulation property of SF6/N2 mixture under low temperatures. High Volt. Eng. 2017, 43, 3907–3913. [Google Scholar]
- Zhao, S.; Jiao, J.; Zhao, X.; Zhang, H.; Xiao, D.; Yan, J.D. Synergistic effect of SF6/N2 gas mixtures in slightly non-uniform electric field under lightning impulse. High Volt. Eng. 2016, 42, 635–641. [Google Scholar]
- Zhang, X.; Tian, S.; Xiao, S.; Deng, Z.; Li, Y.; Tang, J. Insulation strength and decomposition characteristics of a C6F12O and N2 gas mixture. Energies 2017, 10, 1170. [Google Scholar] [CrossRef] [Green Version]
- Okabe, S.; Ueta, G.; Utsumi, T.; Nukaga, J. Insulation characteristics of GIS insulators under lightning impulse with DC voltage superimposed. IEEE Trans. Dielectr. Electr. Insul. 2015, 22, 3269–3277. [Google Scholar] [CrossRef]
- Li, X.; Deng, Y.; Jiang, X.; Zhao, H.; Zhuo, R.; Wang, D.B.; Fu, M.L. Insulation performance and application of environment-friendly gases mixtures of C4F7N and C5F10O with CO2. High Volt. Eng. 2017, 43, 708–714. [Google Scholar]
- Nechmi, H.E.; Beroual, A.; Girodet, A.; Vinson, P. Effective ionization coefficients and limiting field strength of fluoronitriles-CO2 mixtures. IEEE Trans. Dielectr. Electr. Insul. 2017, 24, 886–892. [Google Scholar] [CrossRef]
- Kieffel, Y.; Irwin, T.; Ponchon, P.; Owens, J. Green gas to replace SF6 in electrical grids. IEEE Power Energy Mag. 2016, 14, 32–39. [Google Scholar] [CrossRef]
- Raether, H. Die entwicklung der elektronenlawine in den funkenkanal. Z. Phys. 1939, 112, 464–489. [Google Scholar] [CrossRef]
- Sima, W.X.; Shi, J.; Yang, Q. Surface discharge simulation in SF6 and N2 mixtures with a plasma chemical model. Surf. Rev. Lett. 2014, 21, 1450010. [Google Scholar] [CrossRef]
- Tran, T.N.; Golosnoy, I.O.; Lewin, P.L.; Georghiou, G.E. Numerical modelling of negative discharges in air with experimental validation. J. Phys. D Appl. Phys. 2010, 44, 015203. [Google Scholar] [CrossRef] [Green Version]
- Li, X.; Sun, A.; Teunissen, J. A computational study of negative surface discharges: Characteristics of surface streamers and surface charges. IEEE Trans. Dielectr. Electr. Insul. 2020, 27, 1178–1186. [Google Scholar] [CrossRef]
- Zhiqiang, H.; Ruochen, G.; Junhao, L. Surface partial discharge characteristics of SF_6/N_2 Gas mixture at DC Voltage. Trans. China Electrotech. Soc. 2020, 35, 3087–3096. [Google Scholar]
- Zhiqiang, H.; Shanyuan, S.; Ruochen, G.U.O.; Peichuan, P.; Junhao, L.I. Surface partial discharge characteristics of SF_6 gas at DC Voltage. High Volt. Technol. 2020, 46, 1643–1651. [Google Scholar]
- Jee, S.; Lim, D. Surface discharge mechanism with a change of gas pressure in N2/O2 mixed gas for insulation design of SF6 -free high-voltage power equipment. IEEE Trans. Dielectr. Electr. Insul. 2021, 28, 771–779. [Google Scholar] [CrossRef]
- Liu, W.; Zhao, Y.; Zhang, Y.; Yan, J.; Zhu, Z.H. Study on theoretical analysis of C4F7N infrared spectra and detection method of mixing ratio of the gas mixture. J. Mol. Spectrosc. 2021, 381, 111521. [Google Scholar] [CrossRef]
- Zhang, X.; Zhang, Y.; Huang, Y.; Li, Y.; Cheng, H.; Xiao, S. Detection of decomposition products of C4F7N-CO2 gas mixture based on infrared spectroscopy. Vib. Spectrosc. 2020, 110, 103114. [Google Scholar] [CrossRef]
- Lingzhi, W.; Wenjun, Z.; Tianshi, Z.; Wei, L.; Shizhuo, H.; Jianhui, Y. Power frequency insulation properties of C_4F_7N/CO_2 mixture gas under homogeneous and extremely heterogeneous electric fields. High Volt. Technol. 2019, 45, 1101–1107. [Google Scholar]
- Naidis, G.V. Positive and negative streamers in air: Velocity-diameter relation. Phys. Rev. E 2009, 79, 057401. [Google Scholar] [CrossRef] [PubMed]
- Yiming, Z.; Yong, Q.; Wei, L. Simulation study on streamer of tip defects in C4F7N/CO2 mixed gas. Trans. China Electrotech. Soc. 2020, 35, 34–42. [Google Scholar]
- Luo, B.; He, H.; Cheng, C.; Xia, S.; Du, W.; Bian, K.; Chen, W. Numerical simulation of the positive streamer propagation and chemical reactions in SF6/N2 mixtures under non-uniform field. IEEE Trans. Dielectr. Electr. Insul. 2020, 27, 782–790. [Google Scholar] [CrossRef]
- Dhali, S.K.; Pal, A.K. Numerical simulation of streamers in SF6. J. Appl. Phys. 1988, 63, 1355–1362. [Google Scholar] [CrossRef]
- Zhang, J.; Sinha, N.; Jiang, M.; Wang, H.; Li, Y.; Antony, B.; Liu, C. DC breakdown characteristics of C4F7N/CO2 mixtures with particle-in-cell simulation. IEEE Trans. Dielectr. Electr. Insul. 2022, 29, 1005–1010. [Google Scholar] [CrossRef]
- Hua, W.; Fukagata, K. Near-surface electron transport and its influence on the discharge structure of nanosecond-pulsed dielectric-barrier-discharge under different electrode polarities. Phys. Plasmas 2019, 26, 013514. [Google Scholar] [CrossRef]
- Morrow, R.; Lowke, J.J. Streamer propagation in air. J. Phys. D Appl. Phys. 1999, 30, 614. [Google Scholar] [CrossRef] [Green Version]
- Zhao, L.; Zang, Y.; Liu, W.; Qian, Y.; Zhou, X. Two-dimensional simulation of transition from primary to secondary streamer discharge in air. AIP Adv. 2019, 9, 095028. [Google Scholar] [CrossRef]
- Sobota, A.; Lebouvier, A.; Kramer, N.J.; Van Veldhuizen, E.M.; Stoffels, W.W.; Manders, F.; Haverlag, M. Speed of streamers in argon over a flat surface of a dielectric. J. Phys. D Appl. Phys. 2009, 42, 015211. [Google Scholar] [CrossRef]


| Existing Research | This Research | |
|---|---|---|
| surface discharge | Concentrate on SF6, SF6/N2, air, and other gases [15,16,17,18]. | Concentrated on the mixture of C4F7N and CO2. |
| C4F7N and its mixture | For its insulation performance and decomposition product [9,10,19,20]. | For its surface discharge characteristics. |
Disclaimer/Publisher’s Note: The statements, opinions and data contained in all publications are solely those of the individual author(s) and contributor(s) and not of MDPI and/or the editor(s). MDPI and/or the editor(s) disclaim responsibility for any injury to people or property resulting from any ideas, methods, instructions or products referred to in the content. |
© 2023 by the authors. Licensee MDPI, Basel, Switzerland. This article is an open access article distributed under the terms and conditions of the Creative Commons Attribution (CC BY) license (https://creativecommons.org/licenses/by/4.0/).
Share and Cite
Yan, X.; Zhou, X.; Li, Z.; Qian, Y.; Sheng, G. Surface Discharge Characteristics and Numerical Simulation in C4F7N/CO2 Mixture. Appl. Sci. 2023, 13, 1409. https://doi.org/10.3390/app13031409
Yan X, Zhou X, Li Z, Qian Y, Sheng G. Surface Discharge Characteristics and Numerical Simulation in C4F7N/CO2 Mixture. Applied Sciences. 2023; 13(3):1409. https://doi.org/10.3390/app13031409
Chicago/Turabian StyleYan, Xinfeng, Xiaoli Zhou, Ze Li, Yong Qian, and Gehao Sheng. 2023. "Surface Discharge Characteristics and Numerical Simulation in C4F7N/CO2 Mixture" Applied Sciences 13, no. 3: 1409. https://doi.org/10.3390/app13031409