Article

Numerical and Experimental Studies on the Aerodynamics of NACA64 and DU40 Airfoils at Low Reynolds Numbers

1
Department of Civil Engineering, Tamkang University, New Taipei City 251301, Taiwan
2
Department of Civil Engineering, National Taipei University of Technology (Taipei Tech.), Taipei 10608, Taiwan
3
Cheetah Industrial Aero-Dyna Tech. Co., Ltd., New Taipei City 25168, Taiwan
*
Author to whom correspondence should be addressed.
Appl. Sci. 2023, 13(3), 1478; https://doi.org/10.3390/app13031478
Submission received: 15 November 2022 / Revised: 12 January 2023 / Accepted: 18 January 2023 / Published: 22 January 2023

Abstract

:
The aerodynamics of airfoils can be seen in a wide range of applications. To obtain the aerodynamic loads, geometrically-scaled airfoil sections are tested in wind tunnels. However, due to the limited space of the wind tunnel, the mismatch of Reynolds numbers may lead to different aerodynamic loads. Previous works showed that decreased lifts and increased drag coefficients are associated with lower Reynolds numbers, which are accompanied by the changes in ambient flow, such as increased sizes of the separation bubbles and wake vortices. Although insightful, few direct connections between loads, pressures, and ambient flow were presented, leaving a critical knowledge gap for aerodynamic modifications to improve the aerodynamic performances at low Reynolds numbers. To bridge this gap, this work utilizes numerical simulations and wind tunnel experiments to study the aerodynamics of a thin airfoil (NACA64) and a thick airfoil (DU40), at two chord Reynolds numbers, i.e., 4000 and 60,000. The two-dimensional (2D) vortex particle method (VPM) with varying-sized particles is used to simulate the unsteady flow and compared to the steady-state simulations by XFOIL. As the Reynolds number increases, it reveals that the higher lift coefficients are associated with the increased upstream suction and positive pressures on the upper and lower surfaces of the airfoils, respectively. These changes are explained by the increased and decreased normalized wind speeds on the upper and lower surfaces of the airfoils, respectively. Stronger pressure recoveries observed downstream of the reattachment points are the main cause of drag reductions at higher Reynolds numbers. The smaller and more irregular vortices in the roll-up shear layers and wakes observed at the higher Reynolds number are similar to the previous experimental findings, which are shown in this work to make the force fluctuations more irregular at higher frequencies. Possibly due to missing 3D effects, the results obtained from the 2D VPM are observed to ‘overestimate’ the effects of increasing the Reynolds number at ReC = 60,000. Furthermore, both VPM and XFOIL are found to work best in explaining the physics at low angles of attacks, i.e., 10 ° α 10 ° , which are similar to the previous numerical works utilizing 2D methods.

1. Introduction

The effects of climate change urge the need for clean energy, and the wind is one of the major natural resources. To harness the power of wind, horizontal axis wind turbines are usually used. A typical horizontal-axis wind turbine consists of three blades, a nacelle, and a tower. In terms of power production and wind load, the aerodynamics of the turbine blades play an important role.
For the base design of a turbine tower, wind tunnel measurement of the wind load is one of the options. In contrast to typical building structures, the cross-sections of a turbine blade are specially designed airfoils that have smooth curve shapes. Similar to circular cylinders, the aerodynamics of a curved-shaped body are known to be sensitive to Reynolds number variations (e.g., [1]). Due to the limitation of the wind tunnel space, the inevitable use of a geometrically-scaled model in wind tunnel tests implies that the measurements may not represent the full-scale wind loads. Therefore, the Reynolds number effects increase the complexities in designing a suitable wind turbine model for wind tunnel experiments. To simulate the performance of the Technical University of Denmark (DTU) 10 MW wind turbine [2] in wind tunnel experiments, for example, the authors of [3] developed a systematic iterative approach for designing a 1/75 geometrically-scaled model. The method first matches the full-scale blade aerodynamics using the ‘low-Reynolds’ number airfoils, and refines it to satisfy the characteristics of the full-scale structural dynamics. As a result, the shape, the chord lengths, and the pitch angles of the model blades are all different from the 1/75 downsized prototype. Although rigorous, this method requires the knowledge of the aerodynamic performances of another set of (low-Reynolds number) airfoils, implying a time-consuming task to only design a wind turbine model. Not only for wind turbine model design, but also the effects of low-Reynolds number flow play crucial roles in the blade design of small unmanned aerial vehicles [4]. Therefore, one of our intents in this work is to see if it is possible to simplify the model blade design to compensate for the Reynolds effects, e.g., using the same airfoils but rougher surfaces, given that only the tower base load is of interest. For example, the authors of [5] added surface roughness on the top surface of NACA4412 airfoil at 30% and 40% of the chord in wind tunnel measurements and found increased drag and delayed stall at high Reynolds number, ReC = 1.7 × 10⁵. The effect of surface roughness on the two circular cylinders in tandem was studied by [6] numerically in the subcritical flow regime (ReC = 6.5 × 10⁴), in which the drag reduction, intermittence of vortex shedding, and wake destruction are identified. Therefore, using surface roughness to increase airfoil performance at low Reynolds numbers, i.e., R e C < 1 × 10 5 , has not been clear. Before this can be carried out, understanding the aerodynamic mechanism due to Reynolds number variations is needed.
The airfoils of a wind turbine model tested in a typical boundary layer wind tunnel are in the low Reynolds number regime, i.e., O ( 10 4 ) . Not only for wind tunnel tests, but also the low-Reynolds number flow is found in many other applications. The wing of insects resembles airfoils in the flow of the ‘ultra-low’ Reynolds number regime, i.e., O ( 10 3 ) (e.g., [7]). In Reynolds number of O ( 10 4 ) , other application examples can be micro air vehicles (e.g., [8]). In Reynolds number of O ( 10 5 ) , applications are found in the blades of small-scale wind turbines (e.g., [9]) and propellers. Sailplanes are found in the Reynolds number of O ( 10 6 ) (e.g., [10]) and commercial aircraft are in O ( 10 7 ) and O ( 10 8 ) (e.g., [11]). As a result, airfoil aerodynamics have been studied in a wide range of Reynolds numbers, as well. Examples of the works that have been carried out experimentally are ([12,13,14,15,16]) or numerically are ([17,18,19,20,21,22]).
Most of the previous works focused on the flow separation above the airfoils, since it has strong connections to the surface pressures and the aerodynamic forces. Since the airfoils are generally used to generate lift, small angles of attack are usually considered in the literature, i.e., 0 ° α 15 ° . For large angles of attack, the flow separates regardless of Reynolds number and behaves in a similar way to a flat plate that is placed normal to the flow direction. An illustrative overview of the Reynolds number effects is given by [21]. For Reynolds of O ( 10 7 ) or more, flow separation can be observed on the upper surface near the leading edge. Due to the high inertia of the approaching flow, the separated flow reattaches at a short distance after the separation, resulting in a small separation bubble. During the separation, the laminar separated flow transforms to turbulence, forming a reattached turbulent boundary layer. For Reynolds number in 5 × 10 4 < R e C < 10 5 , the laminar boundary layer before separation thickens as compared to the higher Reynolds number scenario (i.e., R e C 10 7 ). Since the inertia of the approaching flow becomes weaker, it is unable to force the separated flow back to the surface as quickly as in R e C 10 7 ; therefore, the reattachment point moves toward the trailing edge, forming a larger separation on the upper surface. By decreasing the Reynolds number to the range of 10 4 < R e C < 5 × 10 5 , the laminar boundary layer becomes thicker and more stable. Since the reattachment point propagates further downstream, the flow may not be able to reattach in this low-Reynolds number flow. Surface pressure measurements conducted in experiments (e.g., [14,15]) and numerical simulations (e.g., [18,21]) show strong dependences on the behavior of the separated flow. For lower Reynolds numbers, i.e.,   R e C < 10 5 , the effects due to Reynolds number variations are more drastic than in the higher Reynolds number scenario, i.e., R e C > 10 5 , as also noted in [21]. As a result, this work tries to understand the mechanism of the Reynolds number effects on the airfoil aerodynamics in the low Reynolds number region.
At low Reynolds numbers, i.e., ReC < 106, relatively few works have been carried out to study the effects of Reynolds number variations. The authors of [18] applied INS2D to numerically simulate the unsteady flow passing Eppler 387 airfoil at ReC = 6 × 10⁴, 1 × 10⁵, and 2 × 10⁵ as well as 0 ° α 7 ° . Their results showed that the size of the time-averaged separation bubbles decreases as the Reynolds number increases. Nearly uniform distributions of pressures can be found along the windward portion of the bubbles, while adverse pressure gradients can be observed near flow reattachments. The PIV measurements by [14] on the GA (W)-1 airfoil at ReC = 7 × 10⁴ and 6 ° α 12 ° showed that the transition process of the laminar separated shear layer to turbulent reattachment is through Kelvin-Helmholz vortices. Utilizing smoke flow visualization, hot wire velocity measurements, and surface pressure measurements on the NACA0025 airfoil at 5.5 × 10⁴  ReC  2.1 × 10⁵ as well as α = 0 ° , 5 ° , and 5 ° , the authors of [15] further categorized the separated flows into two regimes: (i) At lower Reynolds numbers, i.e., 5.5 × 10⁴  ReC  1.1 × 10⁵, the flow separates from the upper surface without reattachment; (ii) at higher Reynolds numbers, i.e., 1.75 × 10⁵  ReC     2.1 × 10⁵, the flow separates and reattaches, forming separation bubbles. By comparing the flow visualization and the velocity energy spectrum, they found that the most energetic peaks are associated with the shear layer roll-up vortices and speculated that the merging of the roll-up vortices is associated with the other subharmonic peaks. As the Reynolds number increases, the length scales of the roll-up vortices and the wake vortices reduce and the flow structures become more irregular. Recently, the authors [21] examined the performance of various airfoils (NACA0009, NACA0012, Clark-Y, Flat plate, Cambered plates) at 104 < ReC < 105 and 0 ° α 30 ° using the in-house time-averaged turbulence solver TURNS2D. As the Reynolds number increases, the performance of the airfoils increases due to the increased lift coefficients and reduced drag coefficients. Moreover, they noted the non-linearity of the lift coefficient curve below the stall angles, which is usually assumed to be linear for high Reynolds numbers. These non-linearities are attributed to the movement of the separation bubbles induced by the variations of attack angles. As the angle of attack increases significantly beyond the stall values (e.g., α 30 ° ), the PIV and force measurements of NACA0012 by [16] showed that the airfoil aerodynamics are nearly independent of the variations of Reynolds numbers, i.e., 5.1 × 10³    ReC  5.3 × 10³.
Although the mentioned works provided great implications from the velocity measurements, they were not directly linked to the wind loads. For example, the decreased airfoil performances are generally associated with the formation of the separation bubbles at low Reynolds numbers (e.g., [14,15,16,18,21]). However, no further explanation was provided for why the separation bubbles are detrimental. Therefore, to contribute to the detailed connections between the ambient flow fields and the overall loads, this work adds the vorticity and the pressure fields for explanation. As shown in Section 2.2, the velocity and vorticity are both responsible for the suction on the upper surface, generating the lift forces for the airfoil. One of the best ways to simulate the shear layer vorticity numerically is the vortex method. Therefore, the two-dimensional (2D) vortex particle method (VPM), as proposed in [23], is utilized in this work.
It is not rare to see the applications of the vortex methods in the simulations of airfoil flow. For example, the authors of [17] simulated the separating shear layers at high angles of attack using discrete vortices with empirically defined separation points. The authors of [19] used the vortex-in-cell method to investigate the characteristics of the airfoil undergoing dynamic stall. Moreover, the authors of [22] applied the vortex-in-cell technique to study the aerodynamic modifications on the airfoils. In the current work, VPM simulations of free-stream passing airfoils under two different Reynolds numbers (based on chord length, C), i.e., ReC = 4000 and 60,000, are conducted for various angles of attack. The results are compared to steady-state simulations obtained from XFOIL [24,25] and wind tunnel measurements. Two airfoils are studied: (i) NACA64 represents the thin cross-sections of the turbine blade near the tip; (ii) DU40 represents the thicker cross-section used near the blade root for transition to a circular cross-section. These airfoils are picked from the 5 MW wind turbine used for benchmark tests in National Renewable Energy Laboratory (NREL) [26]. Since the aerodynamics differs as the shape of the airfoil changes, a dedicated study is required for a specific airfoil. The layout of this paper is organized as follows: Section 2 presents the setup of numerical and wind tunnel experiments. Section 3 discusses the results, and finally, Section 4 presents the conclusions.

2. Numerical and Experimental Methods

2.1. General Formulation of the Problem

The surface coordinates of the two studied airfoils, i.e., NACA64 and DU40, are extracted from the FAST program built by NREL [26] and are shown in Figure 1. The maximum thicknesses are 18% and 35% of the chord for NACA64 and DU40 airfoils, respectively. The chord length, C, is defined as the length of the line connecting the leading edge and the trailing edge (Figure 1). The definition of the free stream velocity, U, and the angle of attack, α , are noted in Figure 1, as well. The Reynolds number is calculated based on the chord length, i.e., R e C U C / v , where v is the kinematic viscosity of the air. As noted in Figure 1, the drag force, FD, and lift force, FL, are defined by its directions that are parallel and normal to the incident wind, respectively. These lead to the definitions of lift coefficient ( C L ) and drag coefficient ( C D ), for example, as follows:
C L = F D 0.5 ρ U 2 C ;  
C D = F D 0.5 ρ U 2 C

2.2. Vortex Particle Simulation (VPM)

To conveniently obtain the normalized flow quantities in the numerical simulation, the chord lengths, C, the free stream velocity, U, and air density, ρ , are set as unity (i.e., U = 1 m/s, C = 1 m, ρ = 1 kg/m3) in the numerical method introduced in this section. Two Reynolds numbers, i.e., R e C = 4000 and 60,000, are considered in the modeling, which can be easy to setup by changing the kinematic viscosity in the model, i.e., v = U C / R e C = R e C 1 , if unitary values of basic parameters are utilized.
The current vortex particle method (VPM) detailed in [23] is used to directly simulate the unsteady incompressible flow in two dimensions (2D). By taking the curl of the Navier-Stokes equations and noting that the vortex stretching terms vanish in 2D, the advection and diffusion of the vorticity form the governing equation for the vortex simulations, for example, as follows:
D ω D t = v 2 ω
where ω = ω   e 3 is the vorticity in the out-of-plane direction, e 3 and D / D t represents the material derivative. The current method discretizes the vorticity-intense region by vorticity-carrying particles, for example, as follows:
ω ( x ) = j = 1 N Γ j δ σ ( x x j )
where δ σ is the Gaussian radial function used to distribute the circulation of the j-th particle located at x j to a nearby location, x , based on the radius of the, σ j , for example, as follows:
δ σ ( r ) = 1 2 π σ j 2 exp ( r 2 2 σ j 2 )
and r = | x x j | . The particles are transported by the local velocity, u ( x i ) , evaluated using the Biot-Savart law, for example, as follows:
u ( x i ) = 1 2 π e ( z ) × j = 1 N Γ j x i x j | x i x j | 2 f ( | x i x j | )
where f is the velocity mollification kernel corresponding to the vorticity support δ σ , for example, as follows:
f ( r ) = 1 exp ( 1 r 2 2 σ i j 2 )
Note that the symmetrized particle radius, i.e., σ i j 2 = ( σ i 2 + σ j 2 ) / 2 , is used to conserve moments of order 0, 1, and 2. To evaluate the vorticity diffusion on the right-hand-side of Equation (2), particle-strength-exchange (PSE) is applied, for example, as follows:
Γ i ( n + 1 ) = Γ i ( n ) + υ d t σ i j 2 j = 1 N h 2 ( Γ j ( n ) Γ i ( n ) ) η σ ( x j x i ) ,
The interaction kernel of the PSE, η σ , corresponding to the vorticity kernel is as follows:
η σ ( r ) = 1 π σ i j 2 exp ( r 2 2 σ i j 2 )
Utilizing the 2nd-order accurate Adam-Bashforth scheme, the numerical procedure in simulating Equation (2) is split into advection, i.e., Equation (9), and diffusion, i.e., Equation (10), as follows:
x i ( n + 1 ) = x i ( n ) + Δ t ( 3 2 u i ( x ( n ) , Γ ( n ) ) 1 2 u i ( x ( n 1 ) , Γ ( n 1 ) ) )
Γ i ( * ) = Γ i ( n ) + Δ t d Γ d t | PSE ( x ( n ) , Γ ( n ) )
where the superscript ( n ) denotes the n-th time step. To account for the vorticity flux from the solid wall, the strengths of the surface vortex panels need to be solved by cancelling the slip velocity on the surface, which is followed by the vorticity flux to the nearby particles, for example, as follows:
Γ i ( n + 1 ) = Γ i ( * ) + Δ t d Γ d t | wall ( x ( n + 1 ) , Γ ( * ) )
To maintain good performance of the simulations, the spacings between particles, h, are set to be equal to the particle of the radii, σ , to ensure overlaps between particles. As time elapses, the degree of particle overlaps decreases due to the strain in the flow. Therefore, the particles are redistributed to a regularized grid every 10 steps. As the Reynolds number increases, the concentration of vorticity in smaller regions is anticipated, which implies that smaller flow structures could appear with faster local rotation. As a result, smaller time increments in simulation steps are required to resolve the details of advection and diffusion for higher Reynolds numbers. Here, Δ t = 0.05 s and 0.002 s are applied to low and high Reynolds number simulations, respectively. Near the airfoil, the particle radii are maintained near the order of the viscous length scale, i.e., σ = 1.4 v Δ t . Therefore, as the Reynolds number increases, the particles become finer, and the number of particles increases accordingly.
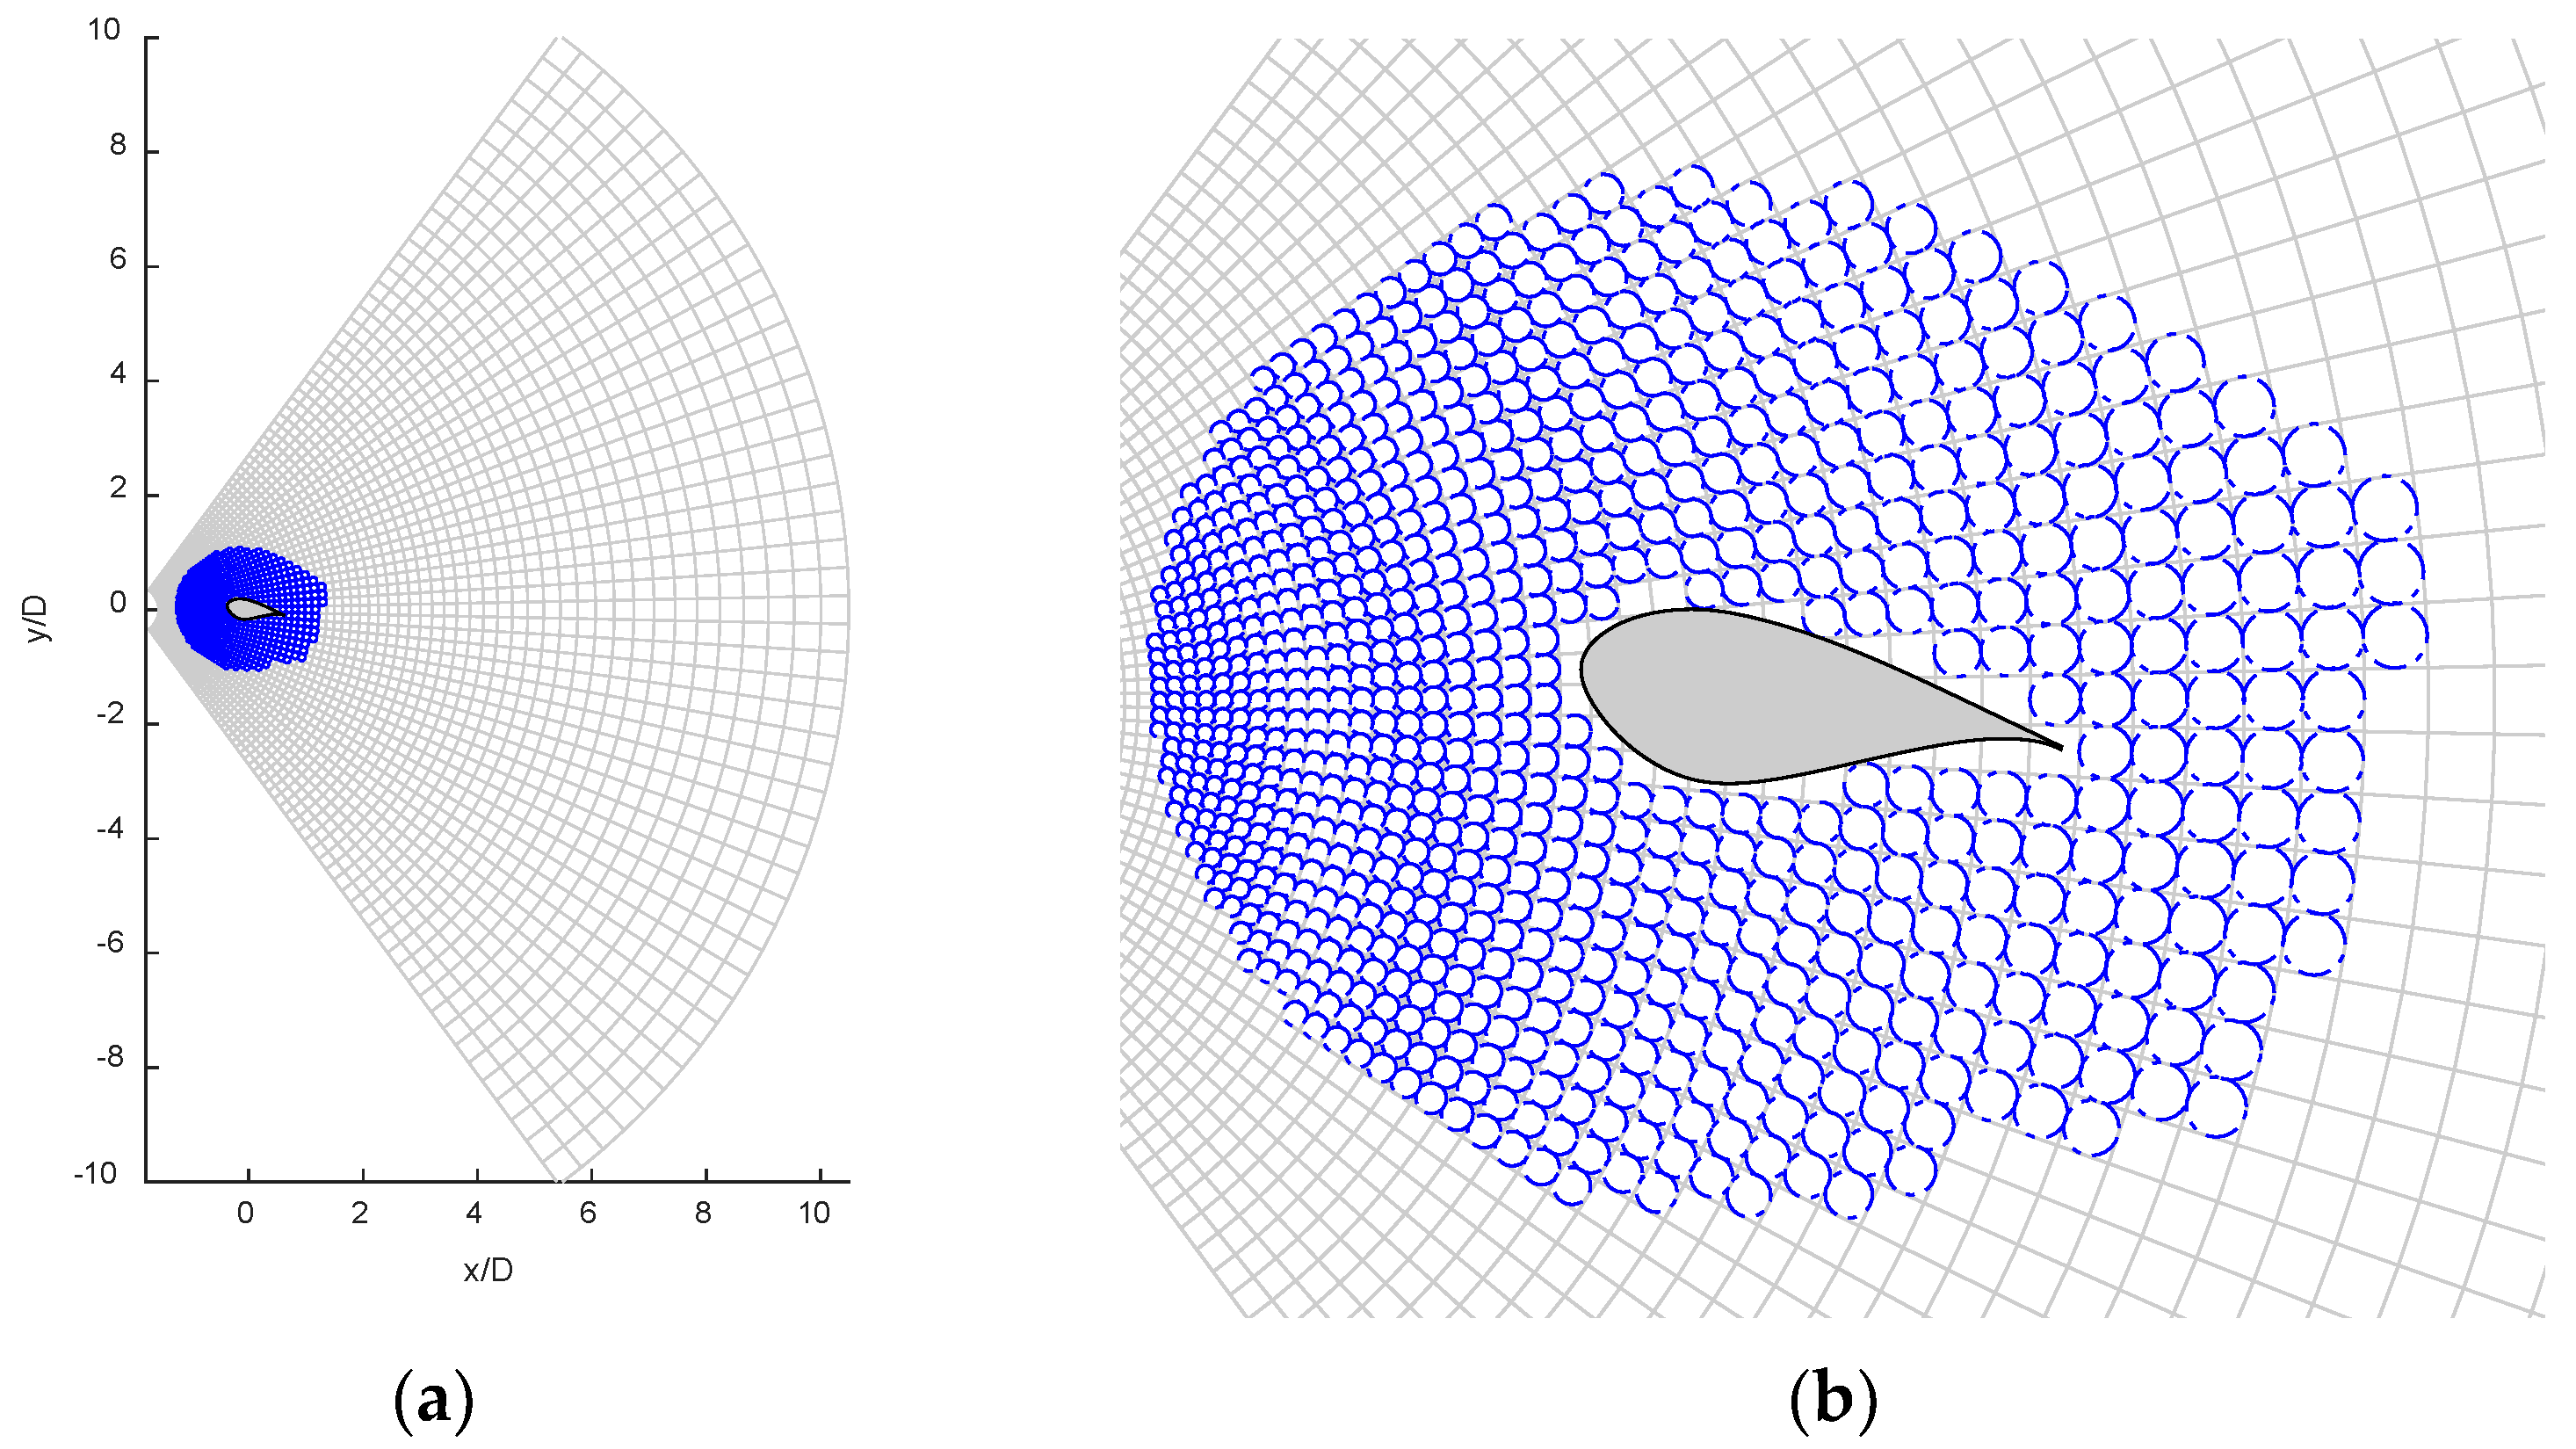
To economically use the computational elements, variable-sized particles are implemented in the simulations, since the particles occupying the wake region are of secondary importance. The varying-sized particles are established based on the radial grid in each redistribution step. Figure 2a,b schematically shows the variations of the grid size along the streamwise direction. The entire simulation domain is shown in Figure 2a, which resembles a sector. As can be seen, the maximum length of the domain in the streamwise direction can extend up to slightly more than x/C = 10. The center (or the singularity point) of the radial grid is located at (x, y) = (−2 m, 0 m) and the number of azimuthal divisions, Nm, varies with the Reynolds number (Table 1). The grid cells are the finest upstream and gradually increase their sizes in the downstream direction. If a particle moves out of the simulation domain, it is simply disregarded in simulation. Figure 2b shows an example of a closed view of particles initialized near the bluff body. The surface of the airfoil is numerically achieved by straight-line constant-strength vortex panels [27], which are used to impose surface vorticity flux to the particles near the body. Near the leading and trailing edges, smaller panel lengths are used, as can be seen from the distribution of panel edge points indicated in Figure 1. The setups of VPM simulations are summarized in Table 1.
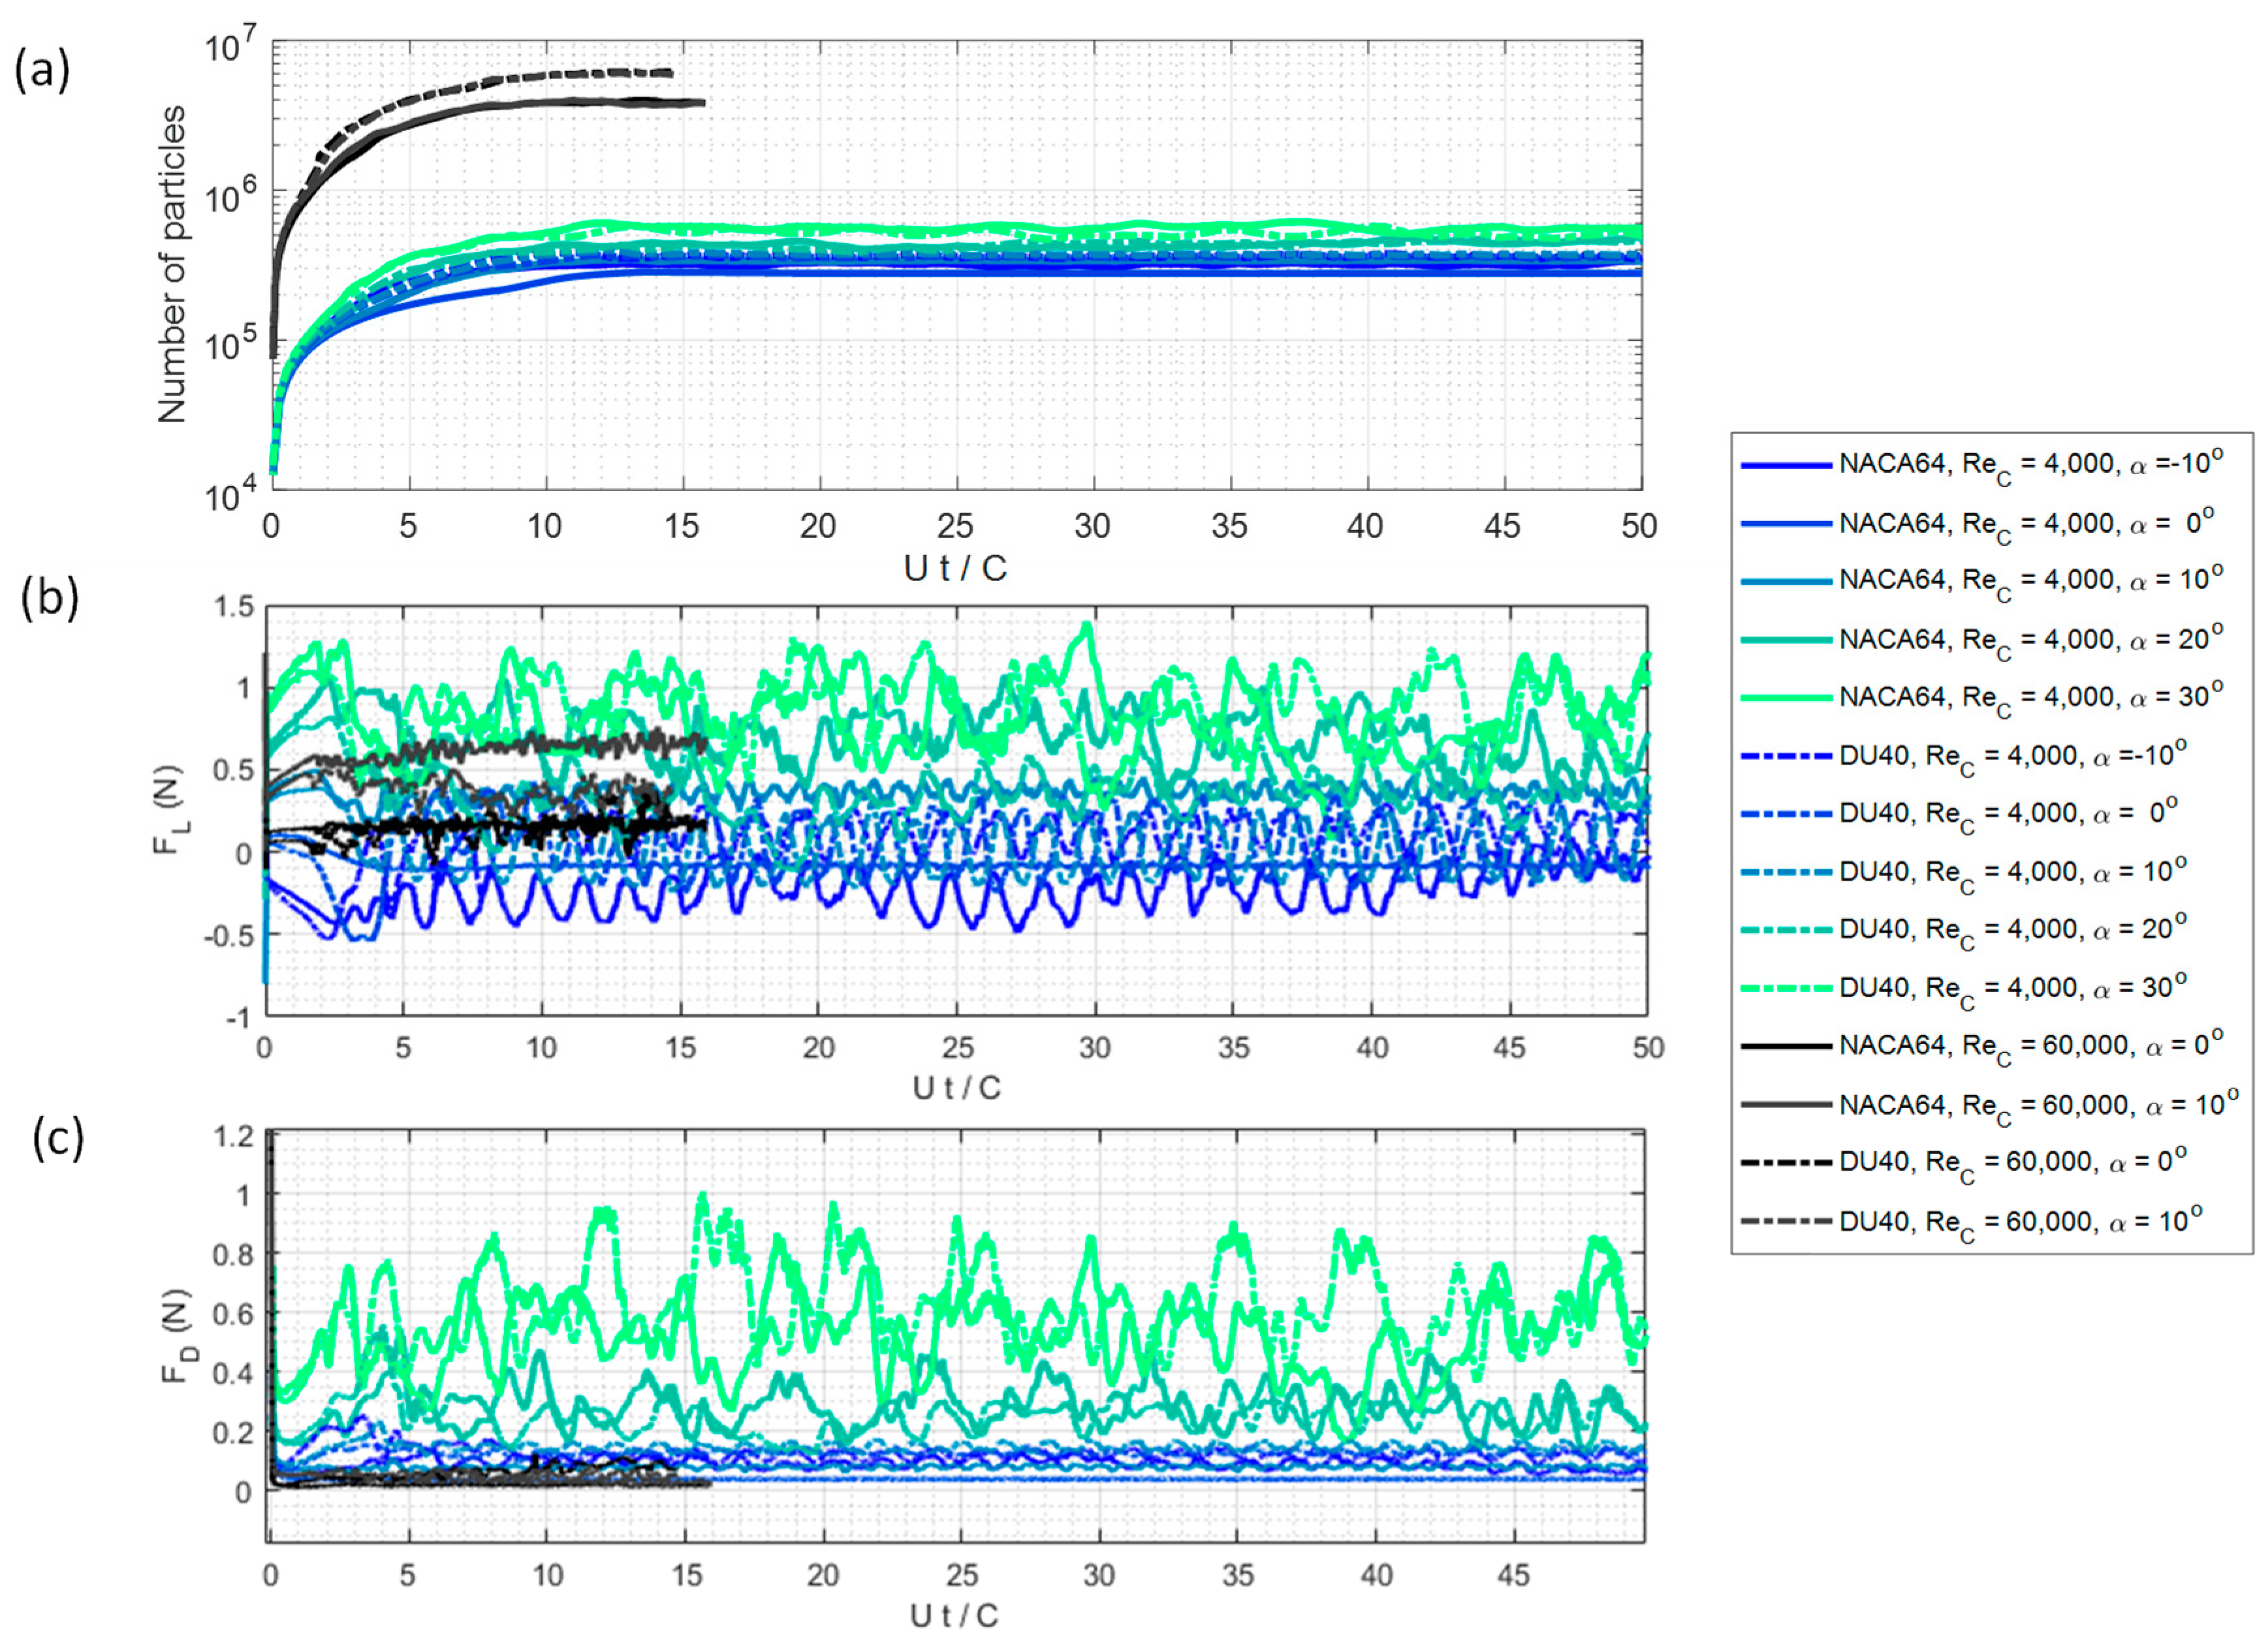
The numbers of particles used in the simulations are shown in Figure 3a. The rapid growth of the particles can be observed for U t / C 3 , while the growth rate is slowed down by the use of a variable-sized particle grid for 3 U t / C 10 . The number of particles stabilizes after the particles fill the wake region in the simulation domain ( U t / C 10 ). The stabilized numbers of the particles are about O (105) for ReC = 4000 and one order higher, i.e., O (106), for ReC = 60,000. As a result, the simulations of low Reynolds number cases are significantly faster and thus longer. Due to the larger numbers of particles and shorter time increments (see Table 1) that are implemented, the simulation times of high Reynolds number cases are shorter.
The integral forces, F = F D e 1 + F L e 2 , are calculated using the integral momentum equations derived by [28] that are convenient for the current VPM:
F = d d t V ρ   x × ω   d V + S ρ   n · γ   d S
where the lift, FL, and drag, FD are defined in Figure 1. Additionally ,   γ = 0.5 u 2 I u u u ( x × ω ) + ω ( x × u ) is the tensor that needs to be evaluated on the surface, S , of the control volume, V . The viscous components of the force are neglected in the original formulation due to the small portion of the overall force (generally of a few percent, see, e.g., [6]). Furthermore, since the airfoil body is assumed to be stationary, the control volume and its surface remain fixed. The setup of the control volume for the force calculation is shown in Table 1. The resulting lift and drag force histories are shown in Figure 3b,c, respectively, with legends consistent with those of Figure 3a. After the impulsive start of the airfoils, traces of force development can be observed before the steady-state fluctuations occur. The steady-state portions of the force histories are used to obtain the representative force statistics. For simulations of ReC = 4000, the steady-state forces generally occur for 5 U t / C 50 , leading to time-averaging durations of U T avg / C = 45 . For simulations of ReC = 60,000, the steady-state forces occur for 10 U t / C 15 , giving the time-averaging durations of U T avg / C = 5 .
Moreover, instants of pressure fields are calculated by solving the Poisson equations of pressure, for example, as follows:
2 p = ρ · ( u × ω ( u 2 2 ) v × ω ) .
where the velocity gradient sources, such as ω and ( u 2 / 2 ) , are ‘measured’ on the Eulerian grids. The solution is obtained on a rectangular domain enclosing the airfoil. Neumann boundary conditions are used on the outlet border while Dirichlet conditions are imposed on the rest of the boundaries. The Dirichlet conditions are obtained using Bernoulli’s equation. The locations of the Eulerian grid used for the pressure solution are noted in Table 1.
The VPM code used for the current work is written in MATLAB and has been validated by comparing the flow field and aerodynamic forces induced by an impulsively started cylinder at Reynolds number of 550 [29].

2.3. Application of XFOIL

The unsteady simulation of the flow is time-consuming. One popular alternative in the airfoil design is the use of XFOIL to simulate steady-state airfoil aerodynamics. XFOIL is an open-source tool that can be executed in Fortran [22]. Similar to the current VPM, the airfoil body is represented by vortex panels, but with additional source elements to represent the inviscid flow atop the boundary layer. Then, a serious of boundary-layer equations are coupled to obtain the final solution [21]. The advantages of using this program are its speed and the capability of simulating a series of different angles of attack at once.

2.4. Wind Tunnel Experiments

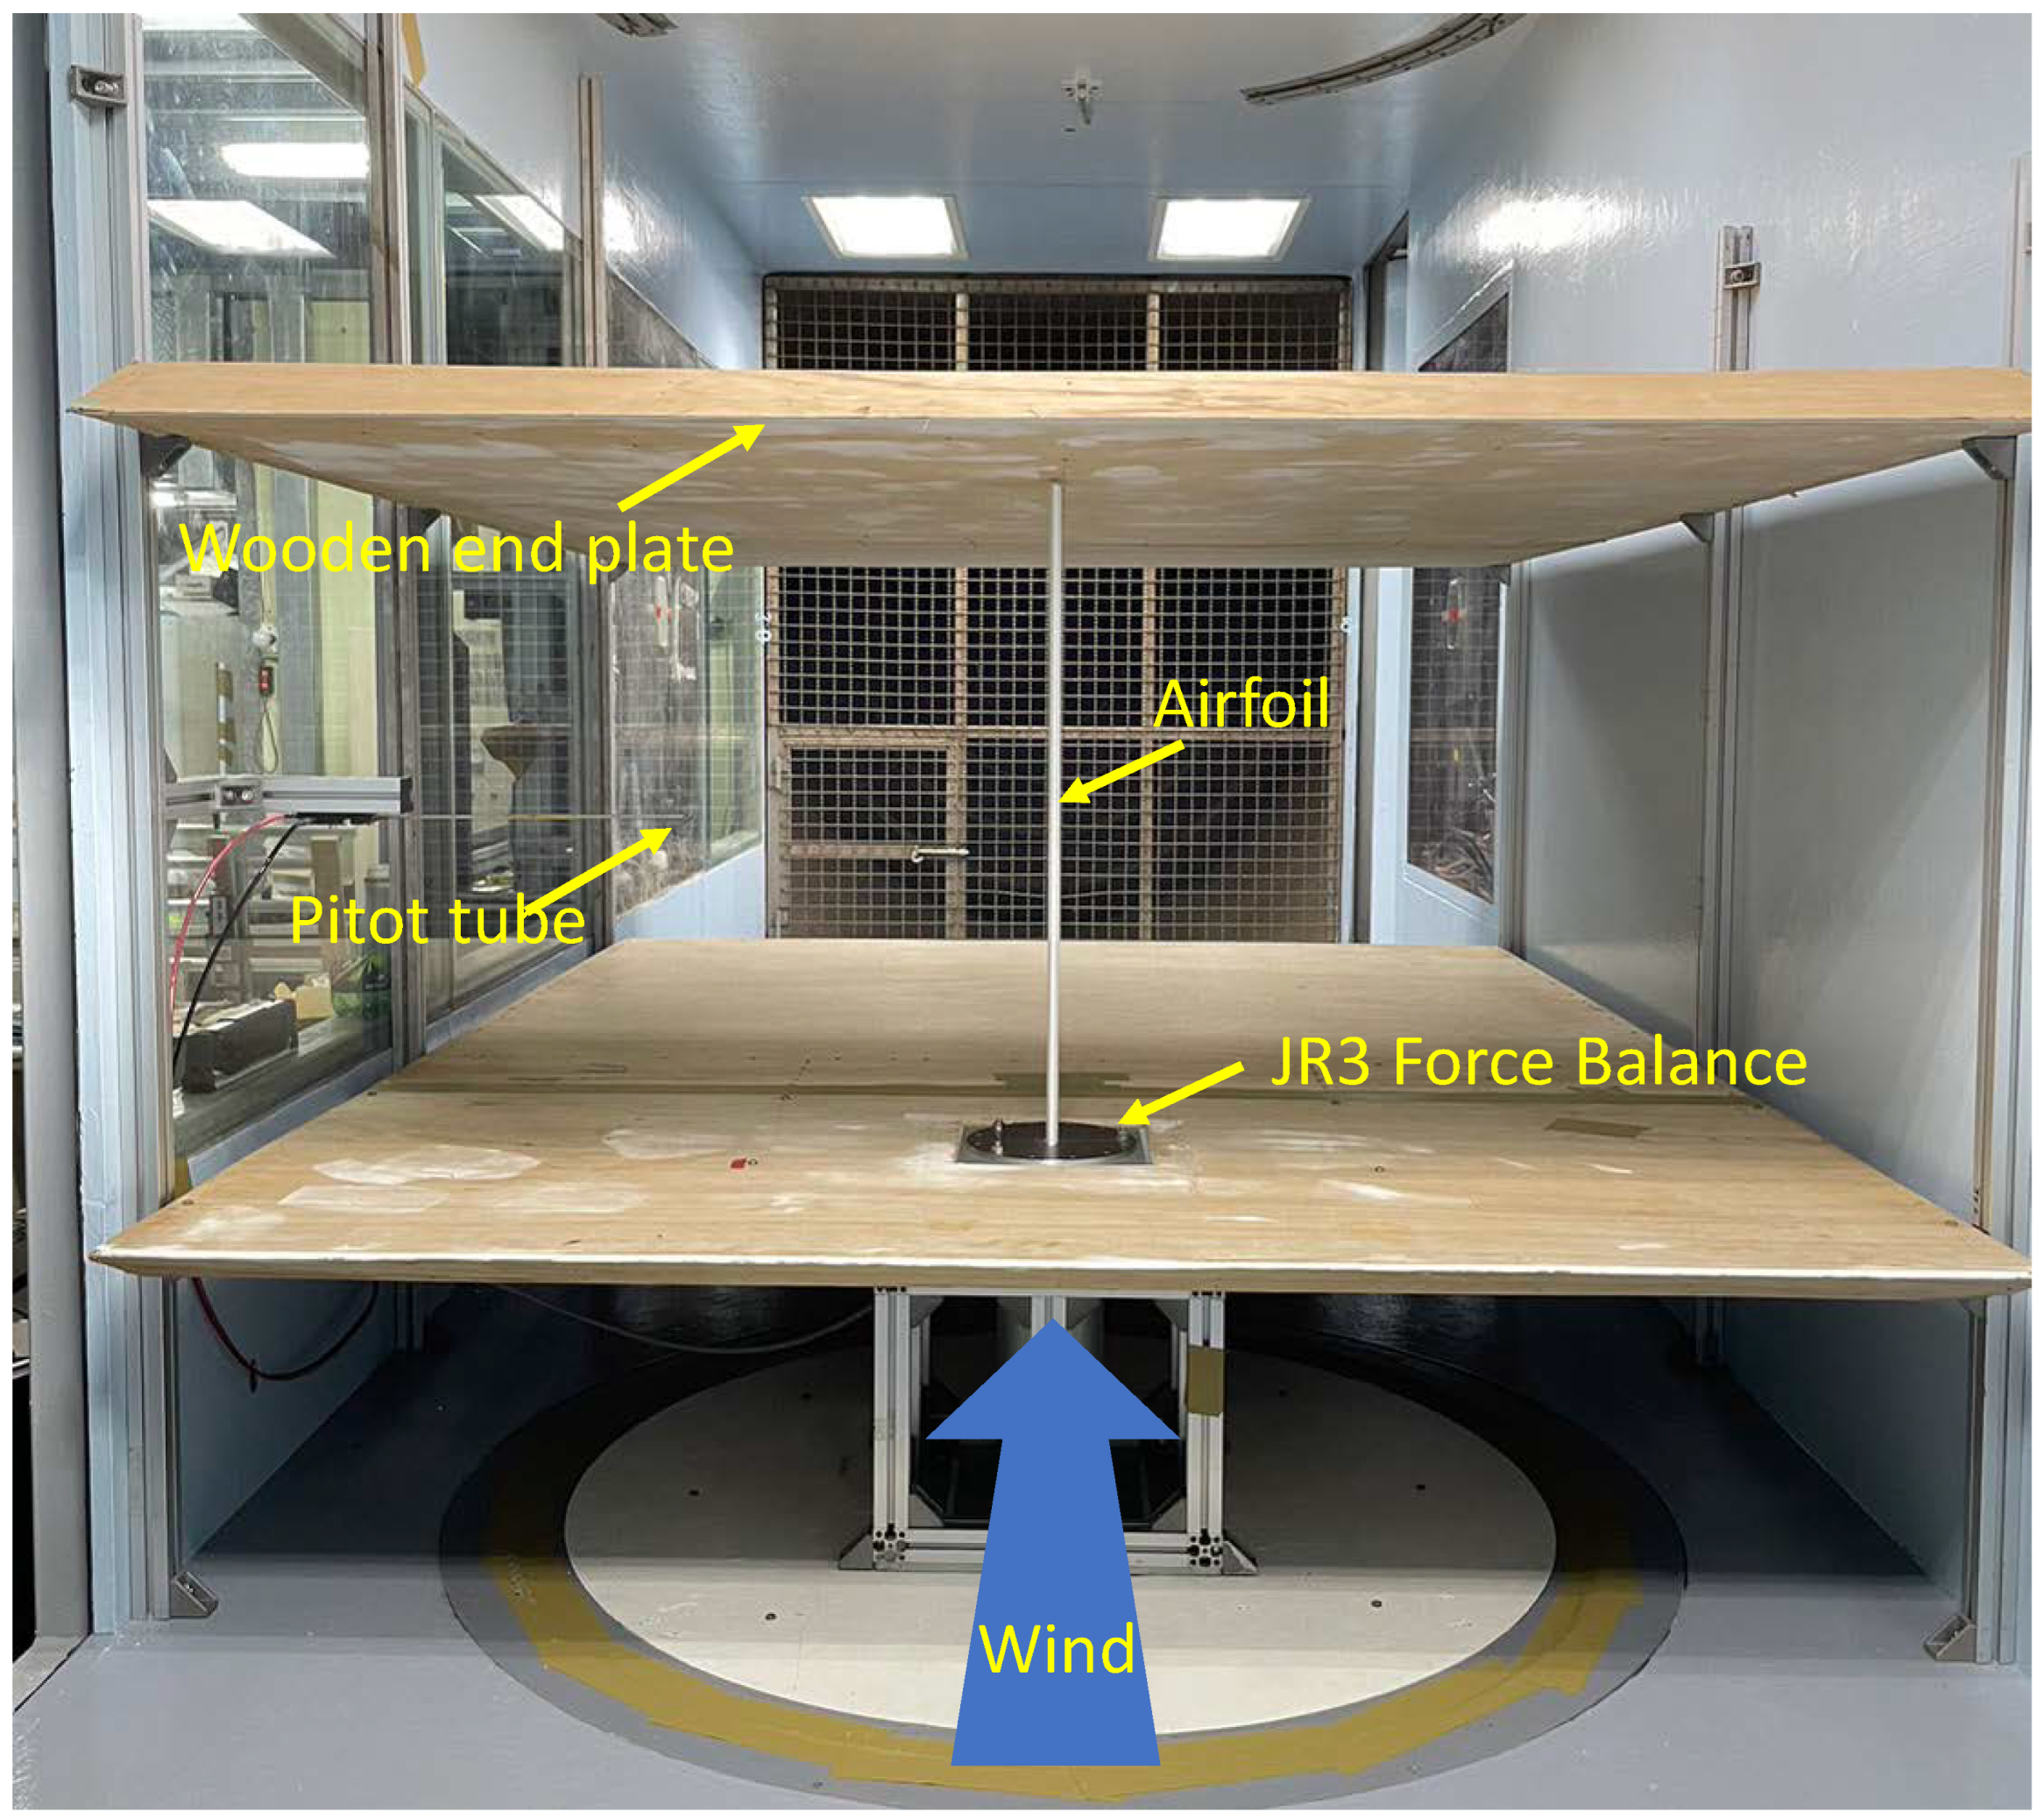
To check the fidelity of the numerical simulations, the time-averaged aerodynamic forces acting on the airfoils are measured in the subsonic wind tunnel at Tamkang University. The test section of the wind tunnel has a length of 7.4 m and a cross-section of 1.5 m in width and 1.8 m in height. The free stream turbulence is controlled below 0.6% in the test section. An example of the setup is shown in Figure 4. The two-dimensional airfoil body has a chord length of 0.06 m and a height of 0.6 m. The upstream speed used in the tests is 15 m/s, leading to ReC = 60,000. The shape of the body is made by 3D printing. To have sufficient stiffness for the model, a circular steel rod is embedded in the airfoil. Two wooden end plates are used to maintain the flow conditions. Beneath the airfoil, the aerodynamic forces are measured using a JR3 force balance. Preliminary validation tests showed that the errors of the JR3 force measurements are within 10%. A small gap of about 0.003 m exists between the top plate and airfoil to ensure that the aerodynamic force is fully transferred to the bottom support while the effects of the tip vortex are sufficiently suppressed. The gap distance only satisfies the 5% of the model height (0.6 m) proposed by [30]. Therefore, no correction is applied to the force measurement results. A Pitot tube placed aside is used to measure the free stream reference dynamic pressure. The measurements of both forces and wind speeds are sampled at a rate of 1000 Hz for 120 s.

3. Results and Discussion

3.1. VPM and XFOIL Simulations—NACA64 Airfoil

Segments of C L time histories simulated for NACA64 airfoil using VPM for a duration U Δ T / C = 2 are shown in Figure 5 for different Reynolds numbers and angles of attack. At the α = 0 ° , Figure 5a shows a negative time-averaged lift force, i.e., C L ¯ = 0.17 , for the lower Reynolds number, i.e., ReC = 4000. As the Reynolds number increases to ReC = 60,000, Figure 5c shows a significant increase in the mean lift coefficient, i.e., C L ¯ = 0.34 , at the same angle of attack. Similar increasing trends can be observed for α = 10 ° , as well. At ReC = 4000, the mean lift coefficient observed in Figure 5b is C L ¯ = 0.73 , and is increased to C L ¯ = 1.31 at ReC = 60,000 in Figure 5d. In addition to the lift enhancement, a higher Reynolds number flow is found to increase the irregularity of the lift time histories; namely, more regularized periodic lift histories are observed in ReC = 4000 (Figure 5a,b) while less periodic histories are observed in ReC = 60,000 (Figure 5c,d).
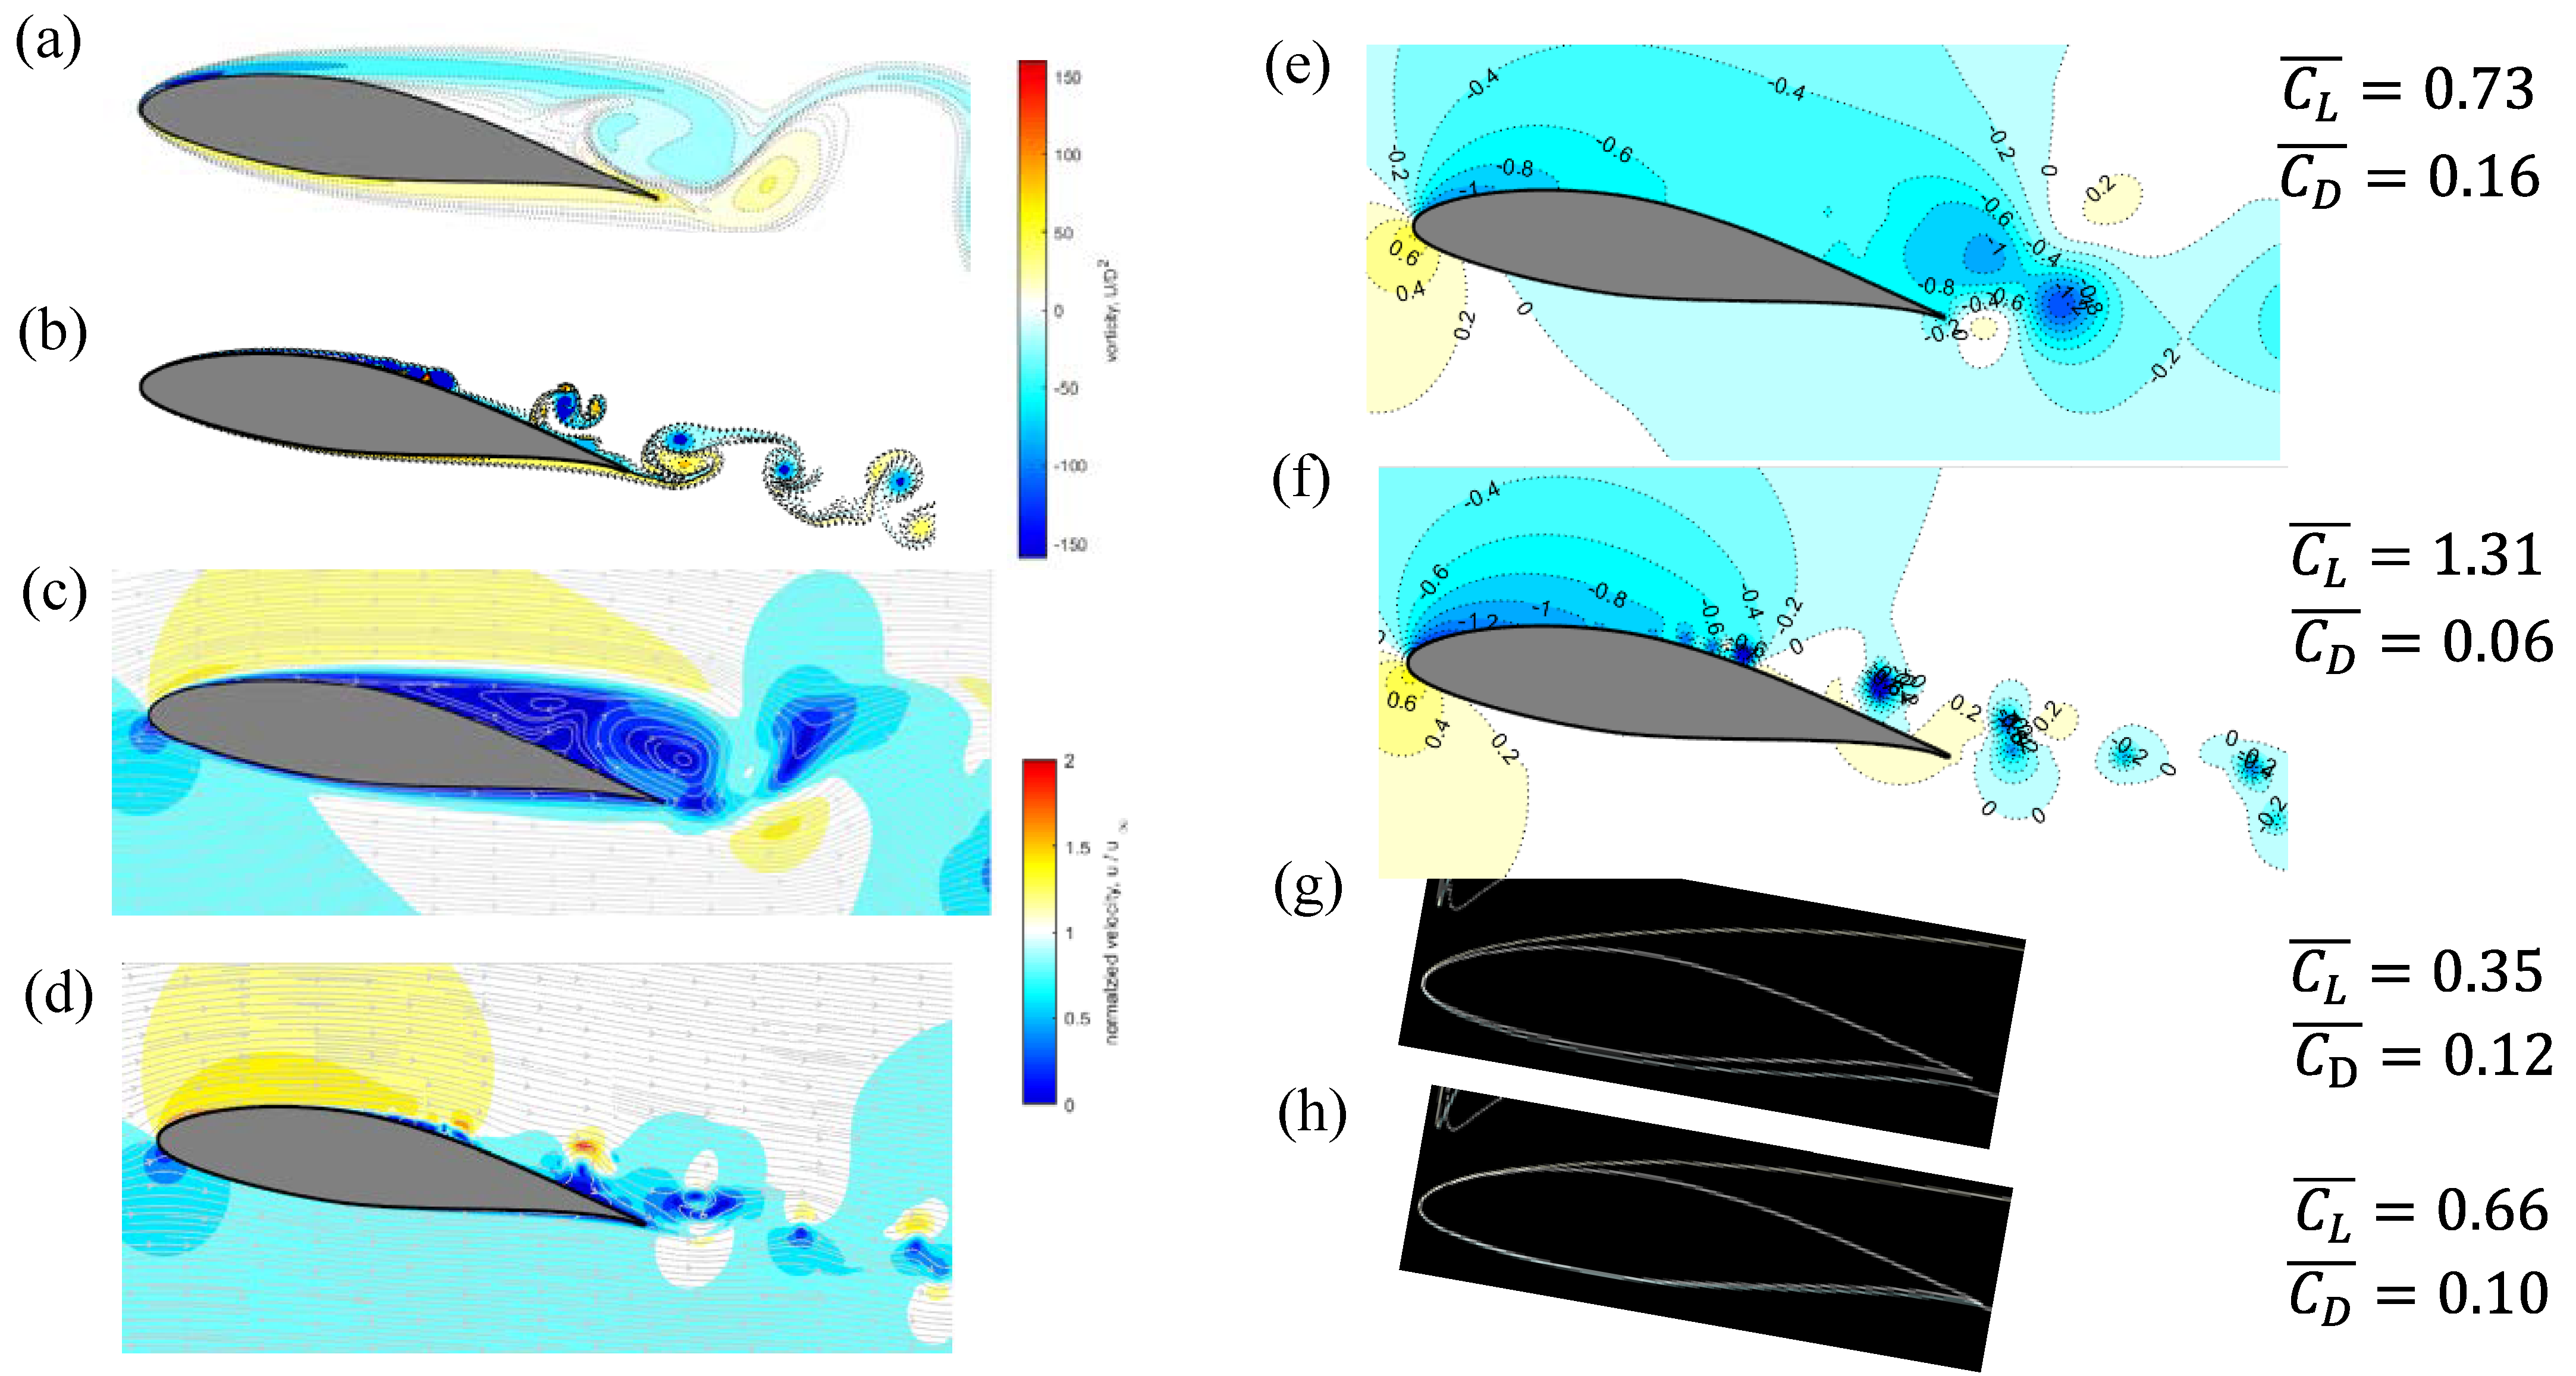
To examine the effects in detail, instantaneous flow fields and surface pressures are examined for α = 0 ° and 10 ° . For α = 0 ° , Figure 6 shows the flow fields at instants U t / D = 55 .06 and 11.68 for ReC = 4000 and 60,000, respectively, which correspond to the instants labeled by the first red stars in Figure 5c. For the low Reynolds number case, the vorticity (Figure 6a) develops from the windward portion of the body wall, indicating the growth of laminar boundary layers in this region. At approximately 60% of the chord, the flow and the vorticity separate, feeding into the wake. The two laminar shear layers of opposite signs interact downstream and a Karman-type of wake forms at around 20% of the chord length downstream of the trailing edge. For the high Reynolds number case (Figure 6b), the upstream boundary layers become thinner. The higher inertia of the ambient flow forces the separation point to move slightly downstream to about 65% of the chord. Instantaneous separation bubbles form and the shear layers roll up to vortices of about 70~80% of the chord.
For the low Reynolds number case, Figure 6c shows no flow reattachment at α = 0 ° and quiescent flow beneath the separation. For the high Reynolds number flow, Figure 6d shows thinner boundary layers before separation. Above this, higher wind speeds can be observed. Figure 6e,f shows the corresponding instantaneous pressure fields with the mean force coefficients attached on the right. For the VPM, the reported mean drag coefficients consider only the pressure drag. The mean drag coefficients reported by XFOIL include both viscous and pressure components. According to Bernoulli’s equation, higher wind speed results in higher suction atop the upper surface for the higher Reynolds number flow. Below the upstream portion of the lower surface, the wind speed is reduced at the higher Reynolds number, leading to increased positive pressure in this region. The associated mean force coefficients are attached on the right of Figure 6e–h. The steady-state boundary layer streamlines obtained from XFOIL are shown in Figure 6g,h for comparison, as well. The results agree with the trend that the higher Reynolds number flow makes the boundary layer thinner and moves the separation point downstream, although the degree of the effects is not as significant as the VPM results.
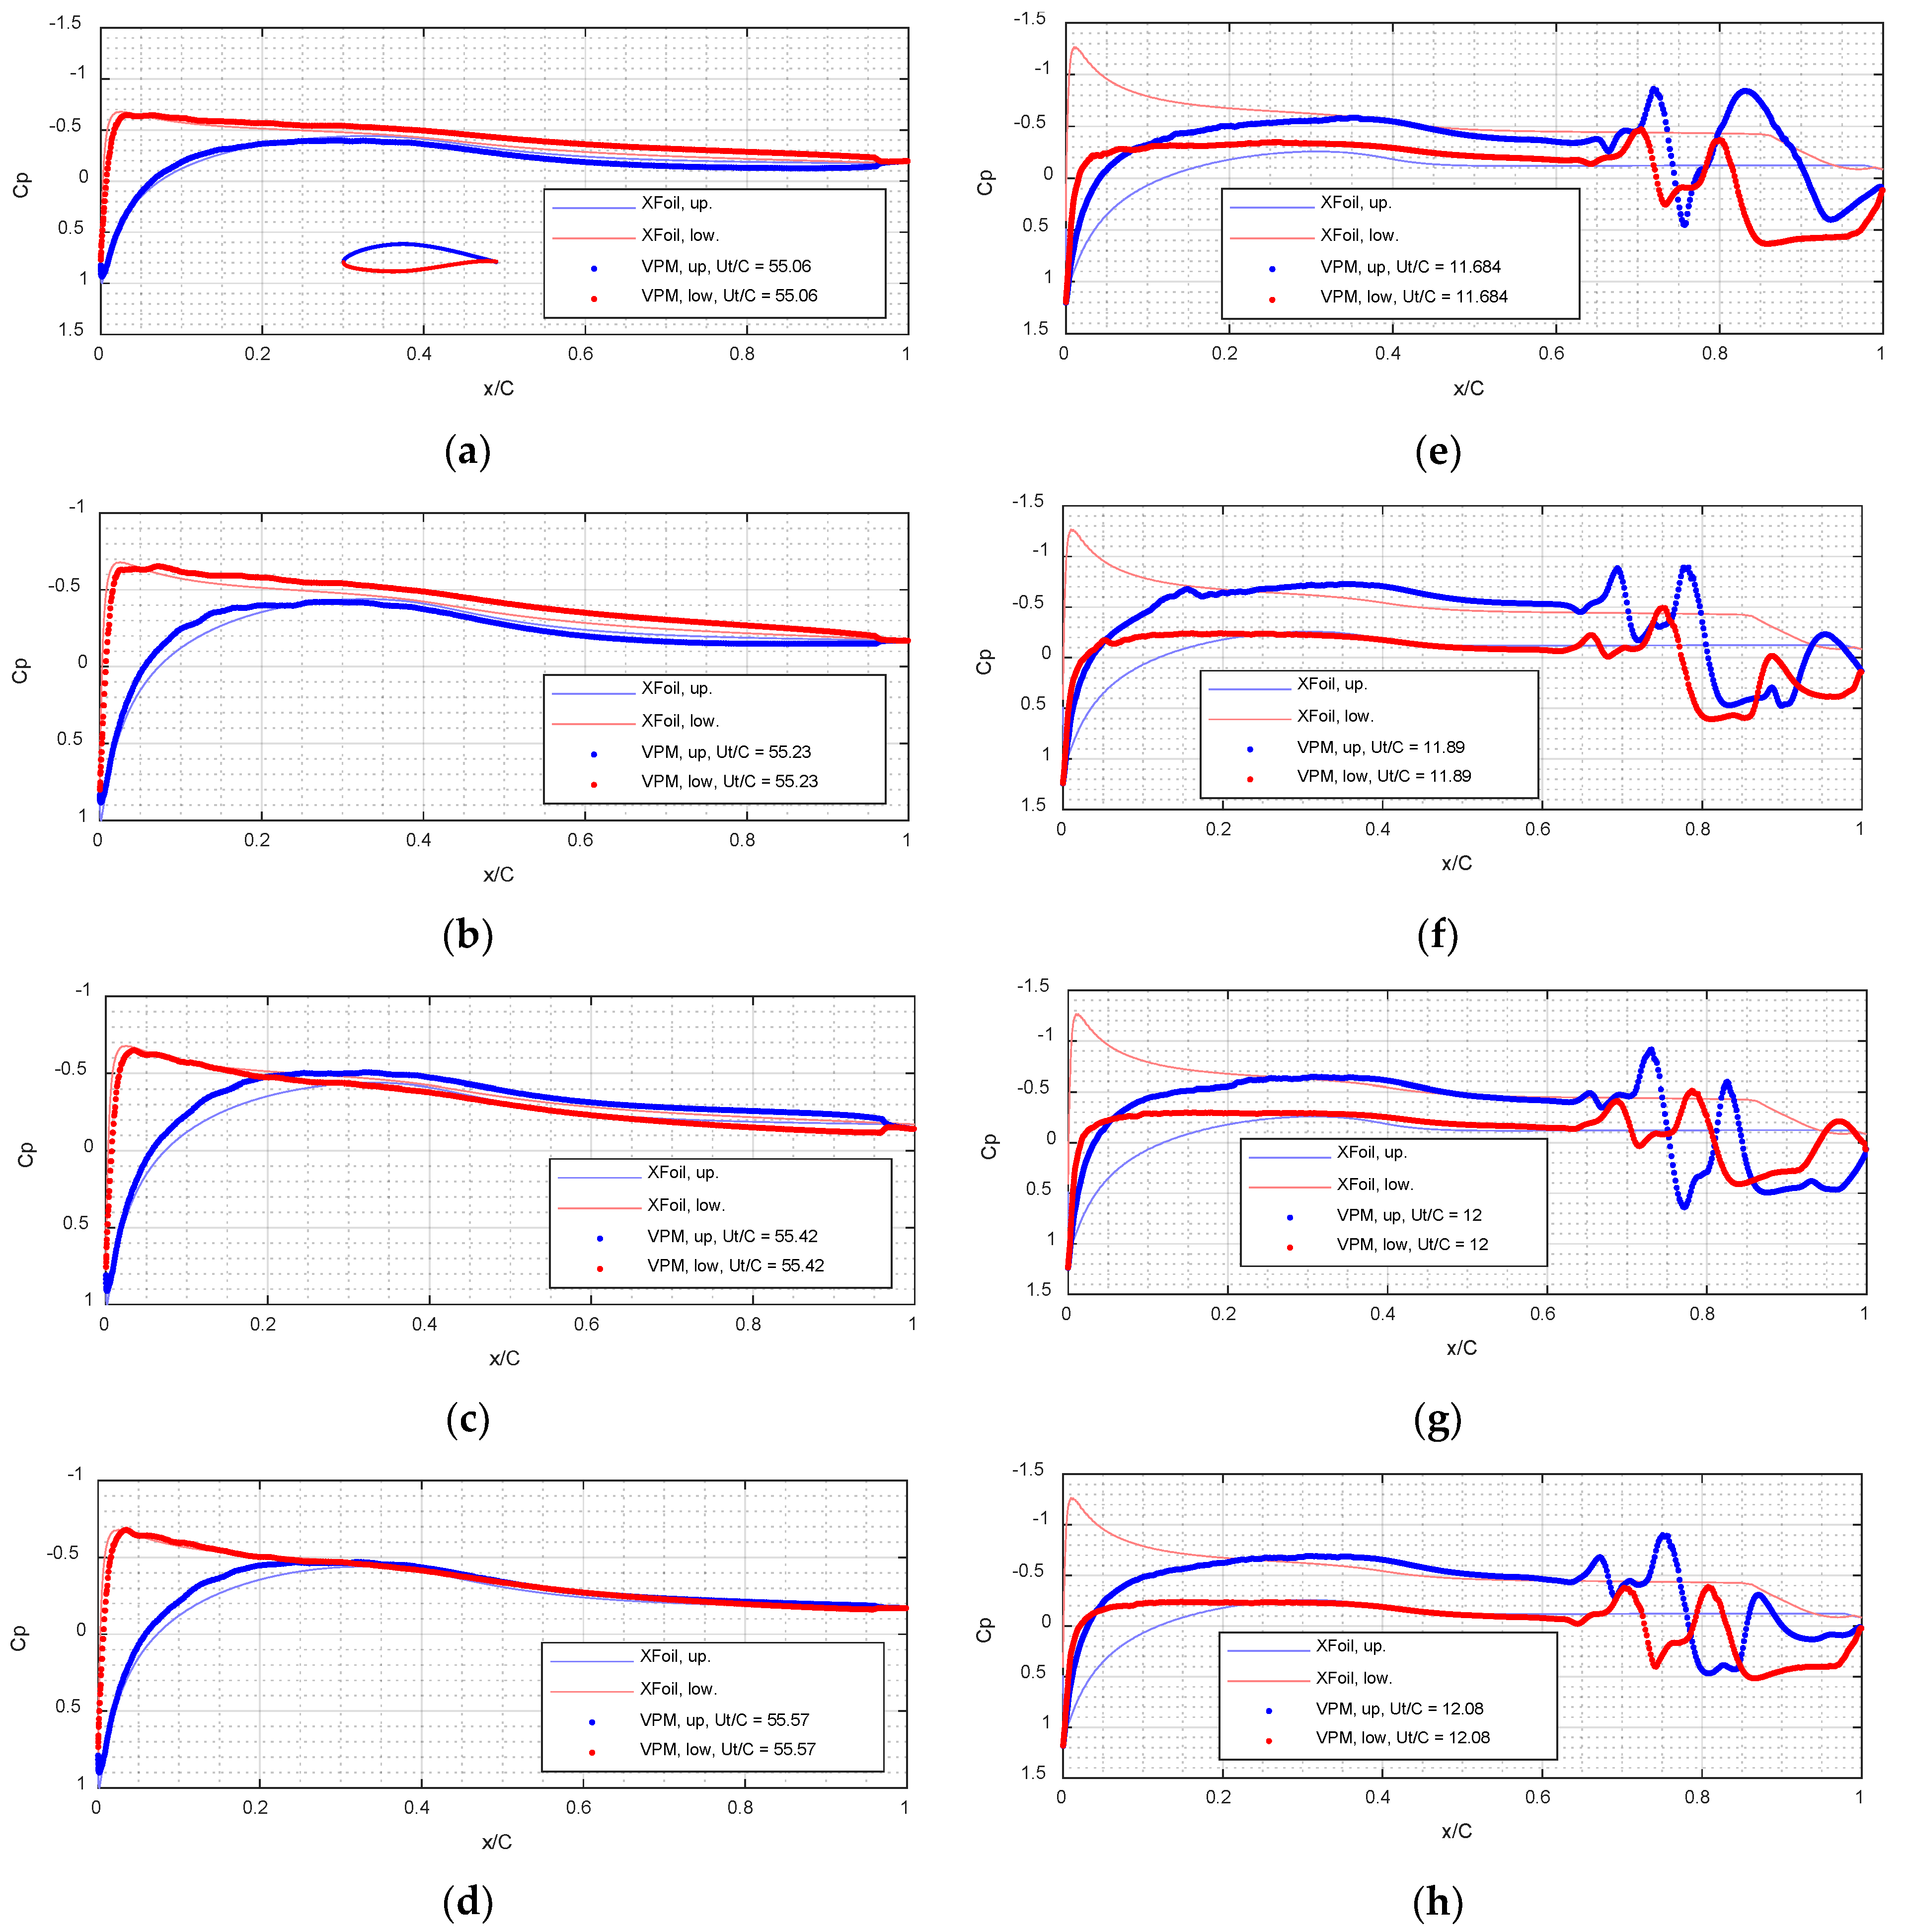
Figure 7 compares the instantaneous airfoil surface pressures of α = 0 ° at the representative instants during one cycle of lift fluctuations, which are labeled by the red stars in the force histories in Figure 5a,c. Steady-state surface pressure solutions obtained from XFOIL are plotted in Figure 7, as well. For the low-Reynolds number flow shown in Figure 7a–d, the lower surface experiences higher suctions near the leading edge, causing the negative lift shown in Figure 5a. Instantaneous alternation of suction strengths can be observed on the upper and lower surfaces for x/C > 0.2. The VPM unsteady simulations generally agree with the XFOIL steady-state pressures, except for the downstream surface where unsteady wake effects are more significant. Therefore, the mean force coefficients obtained from VPM, i.e., C L ¯ = 0.17 and C D ¯ = 0.08 , agree with the XFOIL results, i.e., C L ¯ = 0.13 and C D ¯ = 0.08 , at ReC = 4000 (Figure 6e,g).
For high Reynolds number flow, the VPM results in Figure 7e–h show higher suctions along the upper surface before separation, which leads to the higher mean lift coefficient, i.e., C L ¯ = 0.34 . However, XFOIL shows reversed results for this Reynolds number, i.e., the upper surface has lower suctions than the lower surface. This leads to a lower mean lift coefficient, C L ¯ = 0.44 , as compared to its low Reynolds number result, C L ¯ = 0.13 (Figure 5g,h). Significant spatial pressure fluctuations can be observed for x/C > 0.65 in VPM simulations, which are due to the shedding of small-scale vortices (see Figure 6b,f). Sudden drops of suctions at x/C > 0.8 can be observed. The steady-state pressure obtained from XFOIL has a similar pressure recovery at x/C > 0.9 on the lower surface.
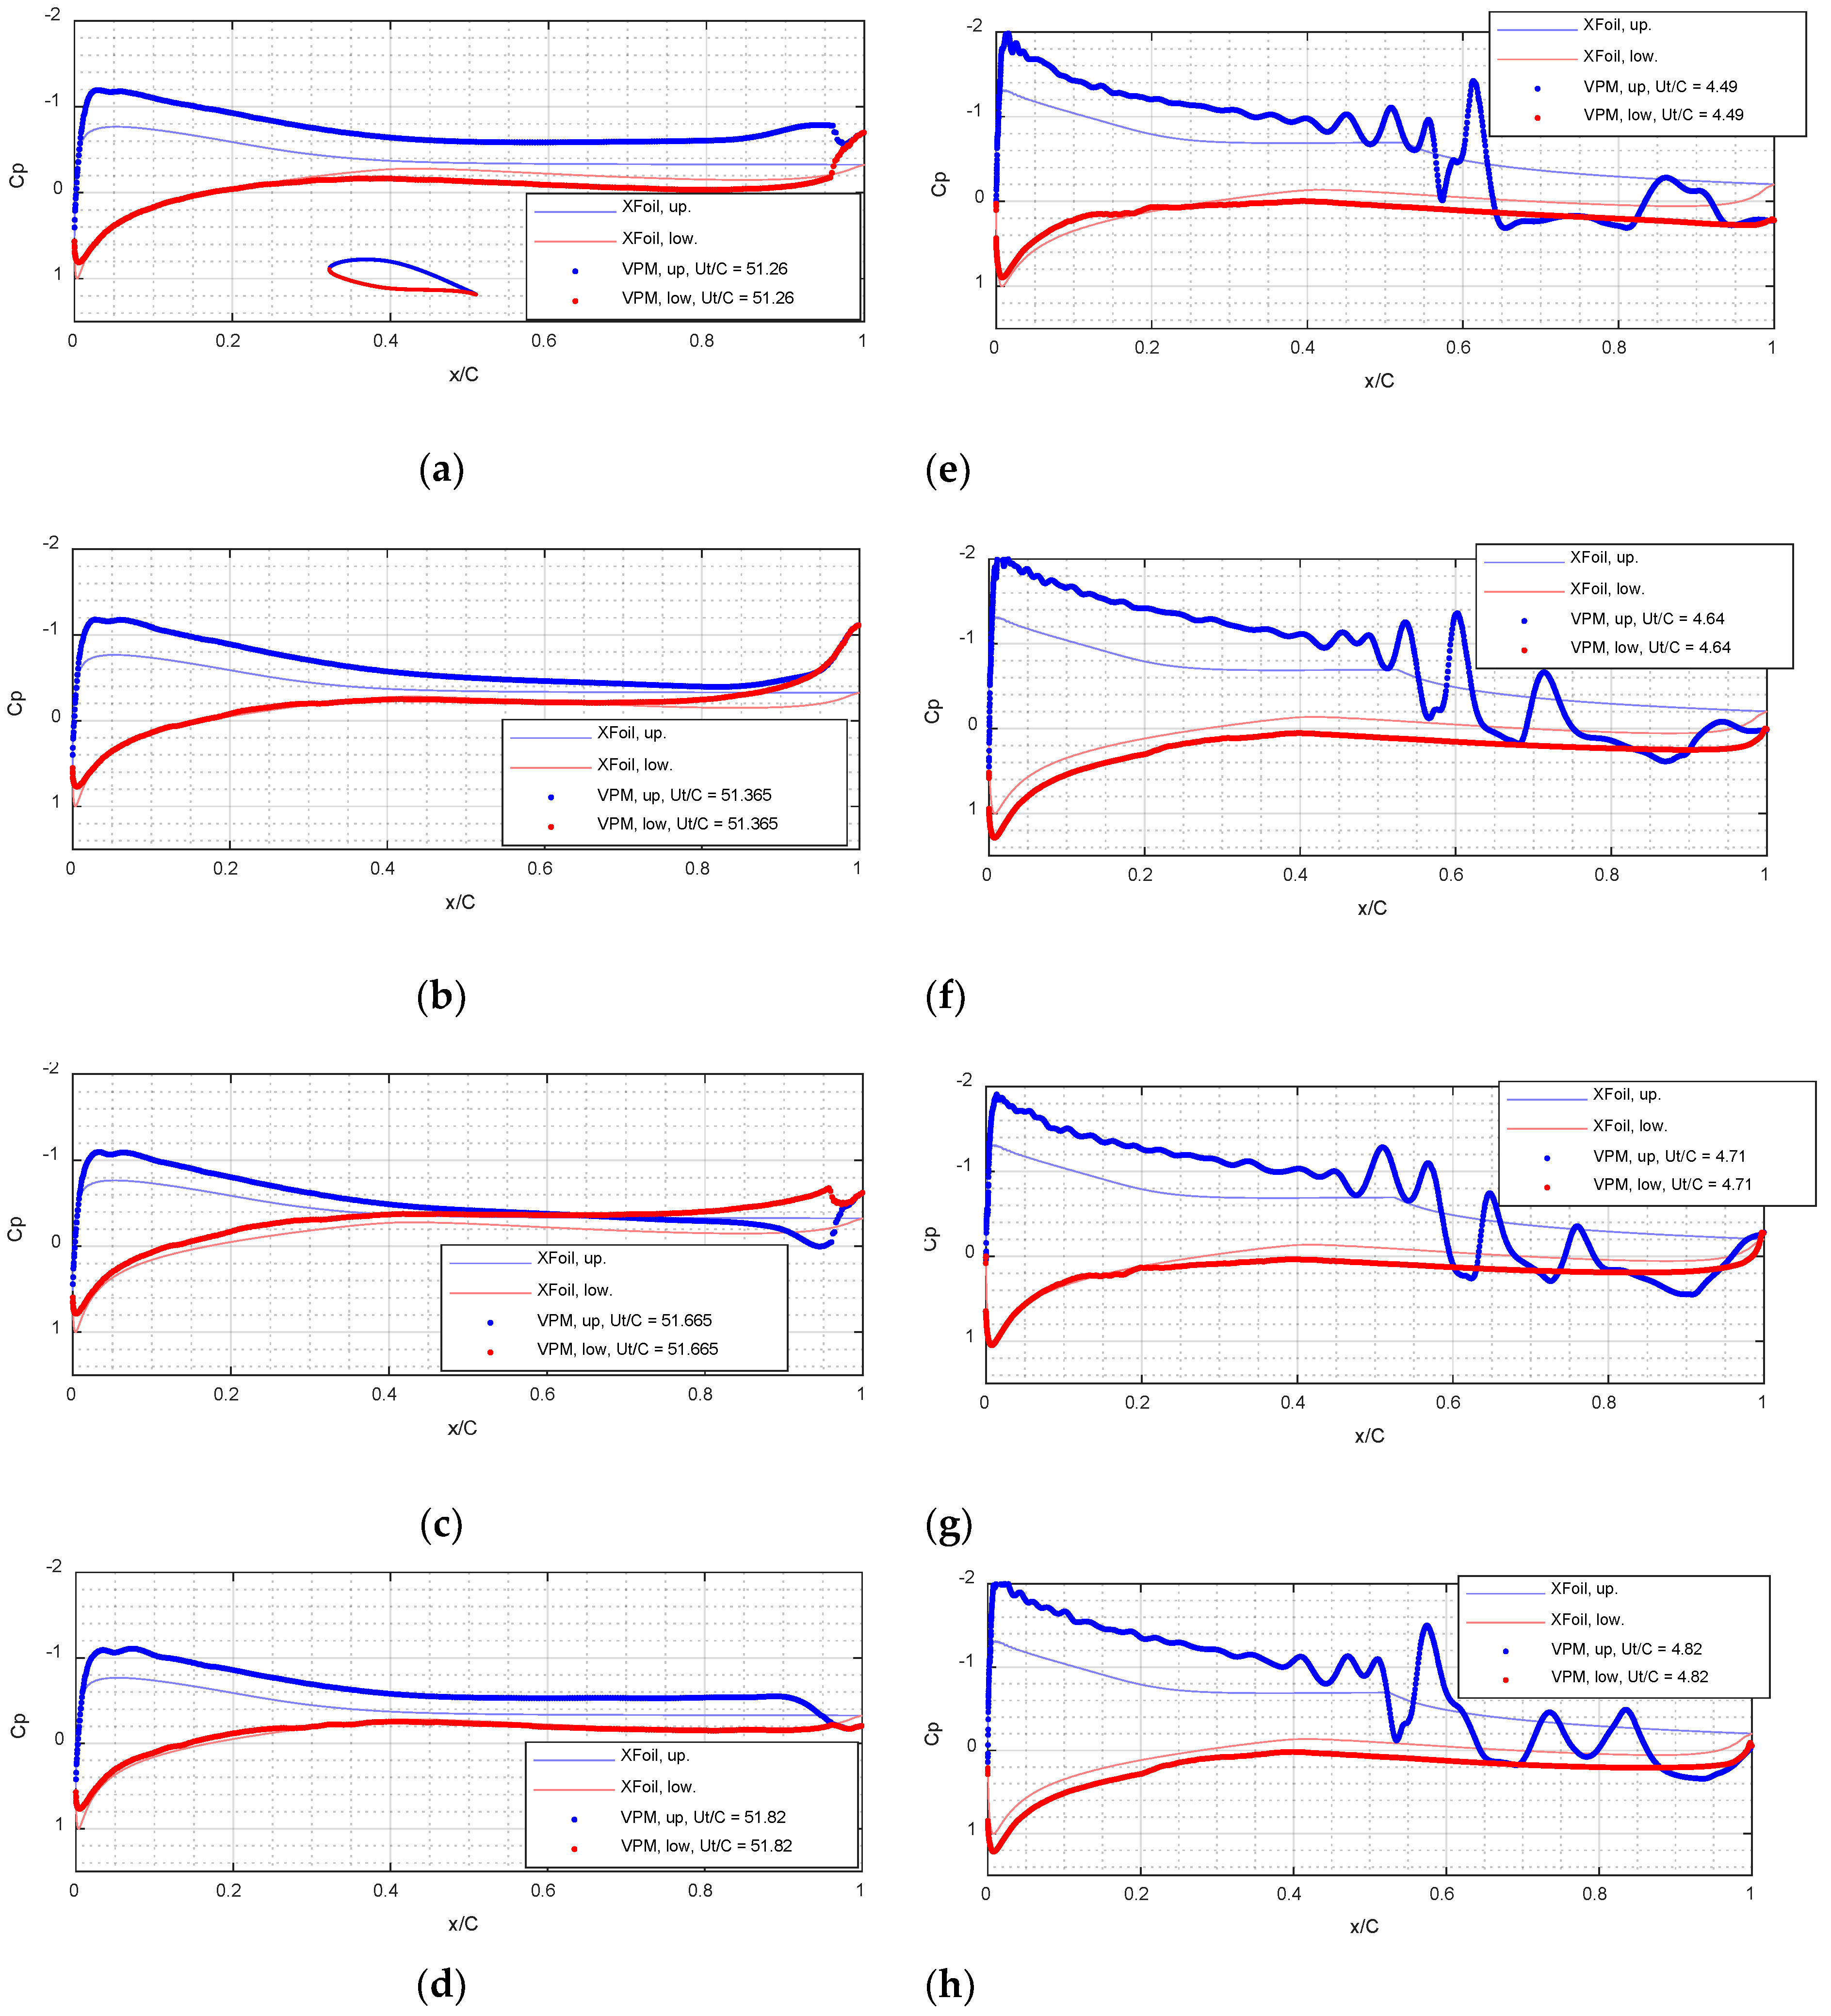
For α = 10 ° , a similar set of results is shown in Figure 8 and Figure 9. Figure 8 shows the instantaneous flow fields associated with the peak lifts, i.e., at times U t / D = 51.26 and 4.49, for ReC = 4000 (Figure 5b) and 60,000 (Figure 5d), respectively. Under this angle of attack, Figure 8 indicates that the flow separations only occur on the upper surface. As compared to the case of α = 0 ° , the higher angle of attack moves the separation points upstream. For ReC = 4000, Figure 8a,c indicates that the separation occurs at 40% of the chord. No reattachment is observed in this Reynolds number. Under the separated shear layer, quiescent flow is observed. Since the wake vortices are significantly larger than those in the high Reynolds number flow, the frequency of the lift fluctuation shown in Figure 5b is lower than observed in Figure 5d. The instantaneous separation streamlines (Figure 8c) agree with the XFOIL simulation (Figure 8g) at the low Reynolds number. For the higher Reynolds number flow fields shown in Figure 8b,d, the higher inertia of the ambient flow still has an effect on moving the separation point downstream to about 45% of the chord. The separated flow is forced to reattach due to the high ambient flow inertia, resulting in small separation bubbles and roll-up vortices. Due to this flow pattern, the higher wind speed observed above the upper surface leads to a higher mean lift coefficient, C L ¯ = 1.31 , as compared to the low Reynolds number result, C L ¯ = 0.73 . As compared to the steady-state separating streamline of XFOIL in Figure 8h, the instantaneous streamlines in Figure 8d are more attached to the airfoil upper surface.
Instantaneous surface pressures at four representative times in lift history, i.e., the four red stars labeled in Figure 5b,d are compared in Figure 9 for α = 10 ° . Figure 9a–d shows the sequence of the results of low-Reynolds number flow, while Figure 9e–h shows the high Reynolds number sequence. Due to the large vortex wake in the low-Reynolds number flow, smooth surface pressure variations can be observed. The VPM simulated instantaneous pressures are closer to the XFOIL steady-state simulation along the lower surface while being always higher in suction for the upper surface, a fact that governs the differences in the C L ¯ between Figure 8e,g. On the other hand, in the high Reynolds number flow, significant spatial surface pressure variations are observed along the upper surface due to the presence of small-scale roll-up vortices downstream of the upper surface. VPM and XFOIL give more consistent pressure simulations on the lower surface in this Reynolds number, as well. On the upper surface, a drop in the mean surface suction that occurred at about x/C = 0.5 can be observed in the VPM simulations, which is consistent with the point of pressure-recovery predicted by XFOIL. However, the magnitudes of the instantaneous suction simulated by the VPM are larger before the pressure recovery and smaller afterward. The higher upstream suction on the upper surface and higher positive pressure on the lower surface both result in higher C L ¯ in VPM (Figure 8f) than in XFOIL (Figure 8h).

3.2. VPM and XFOIL Simulations—DU40 Airfoil

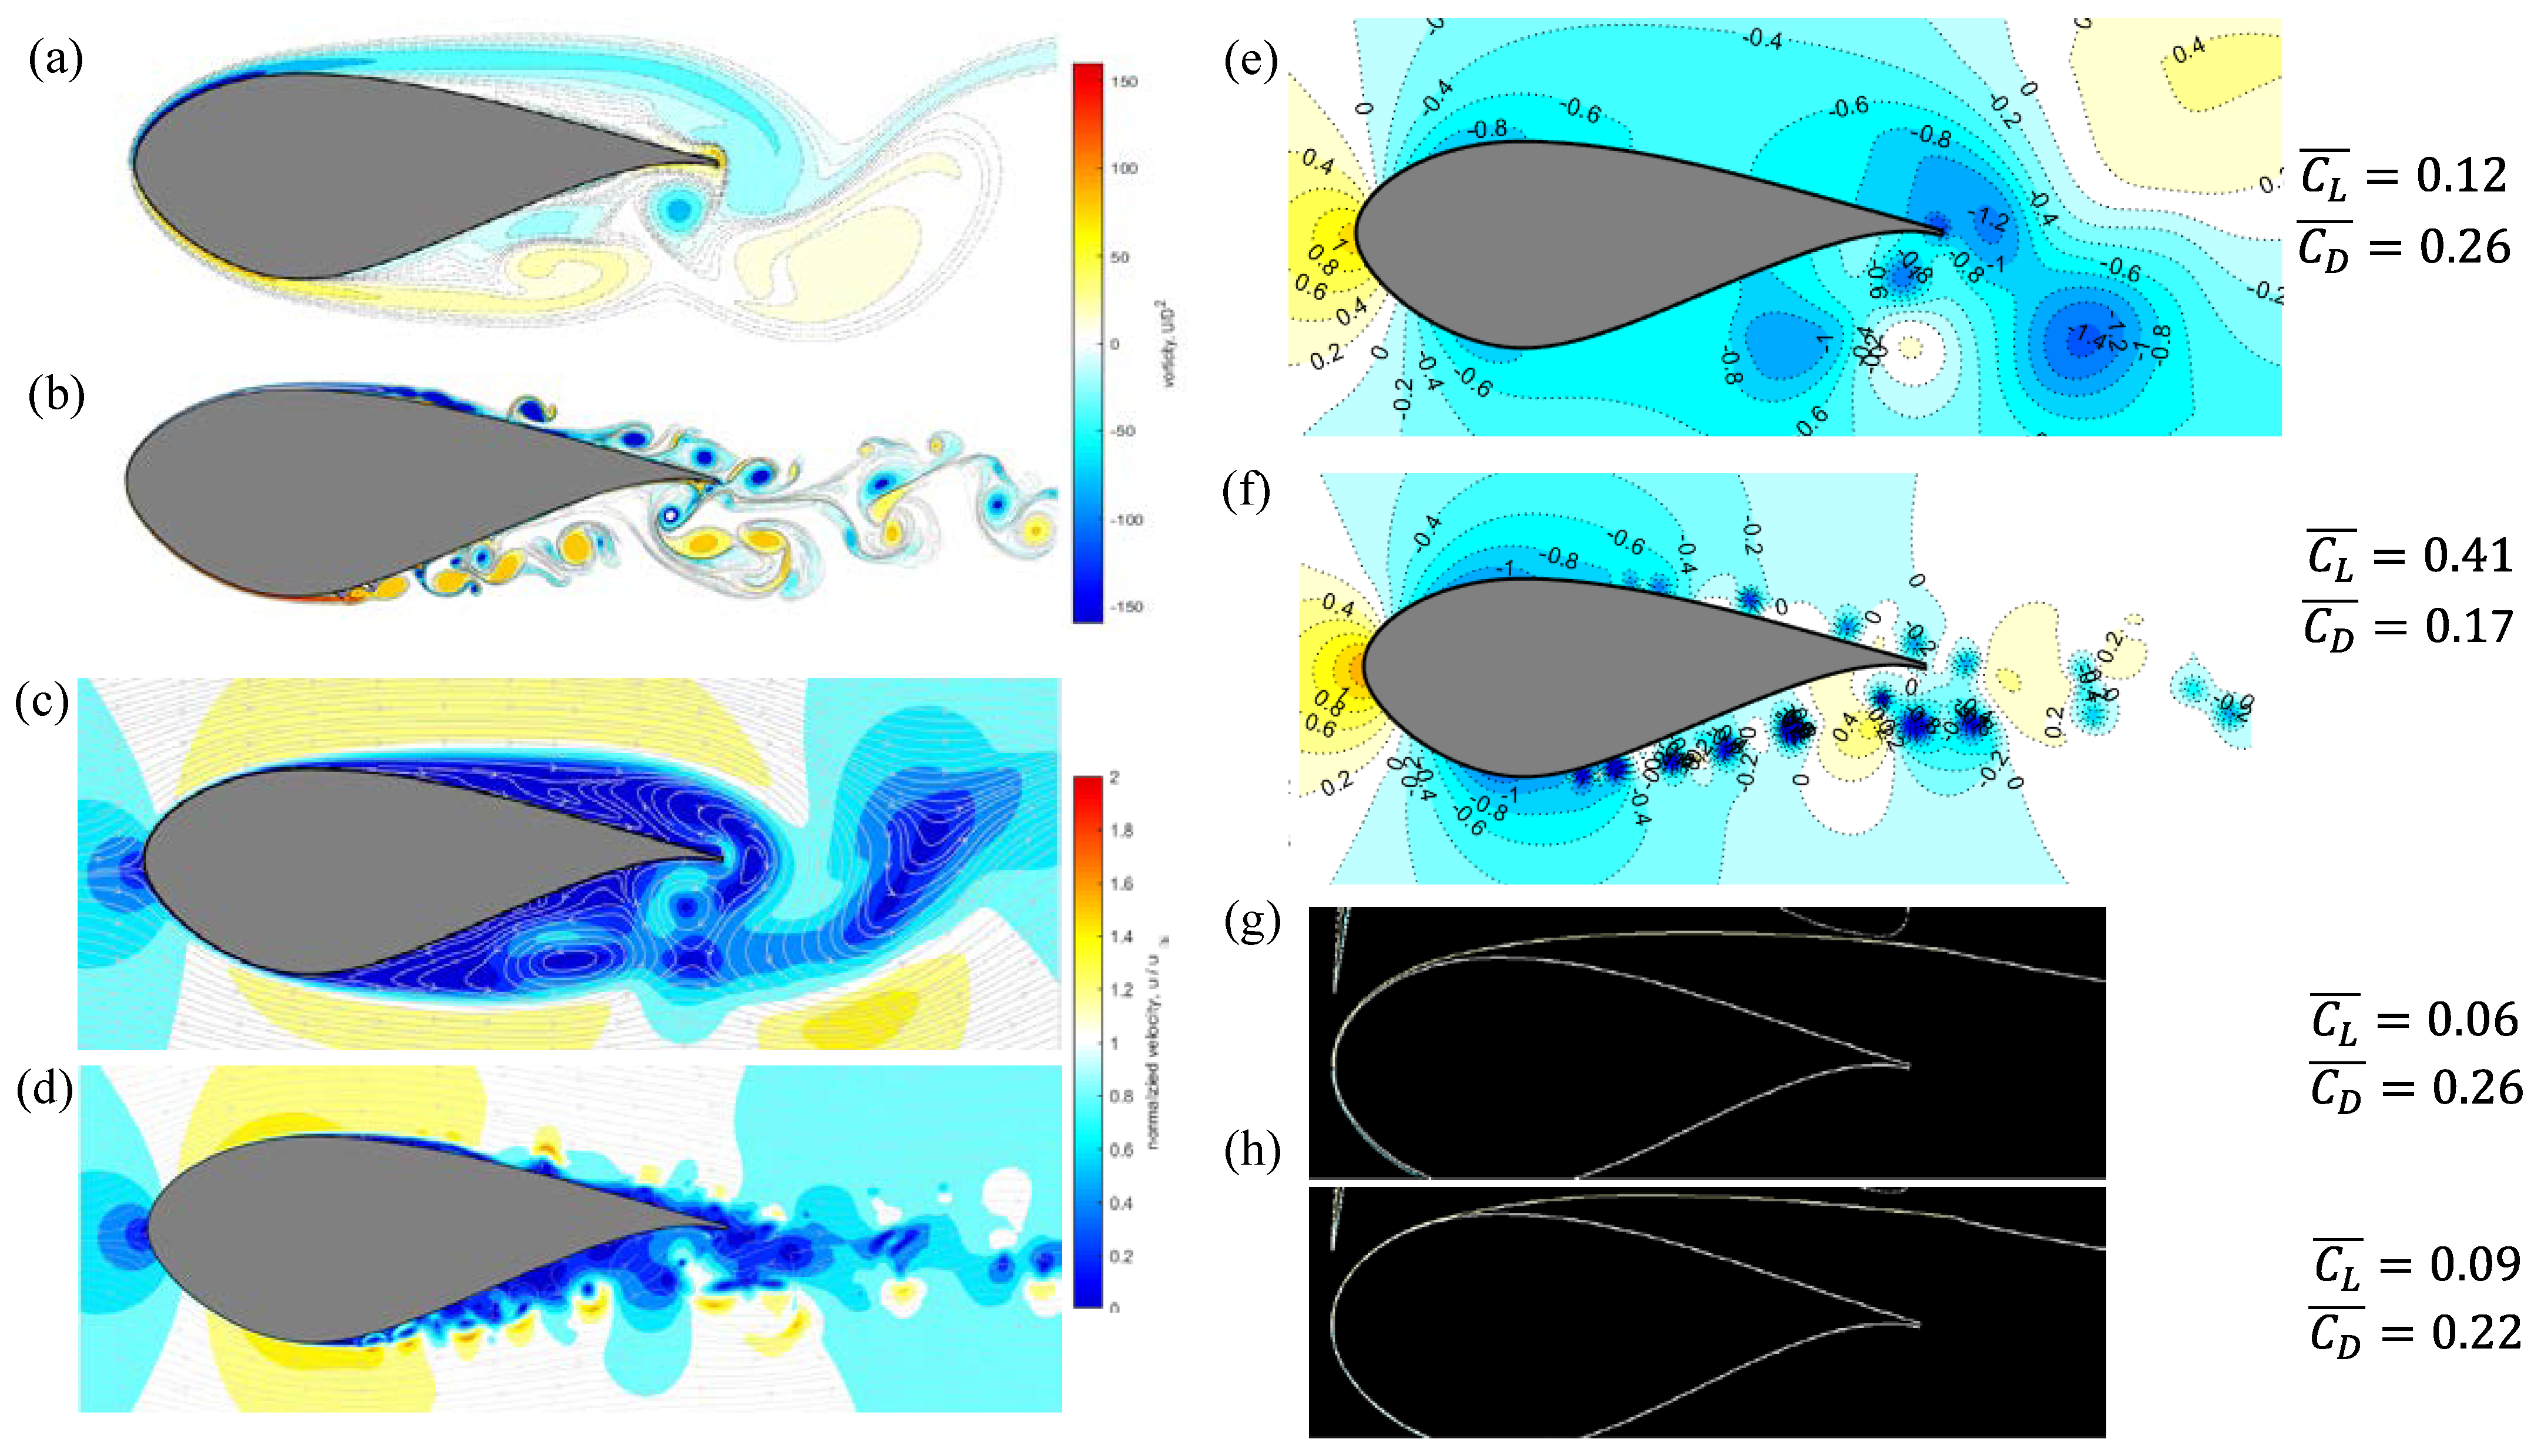
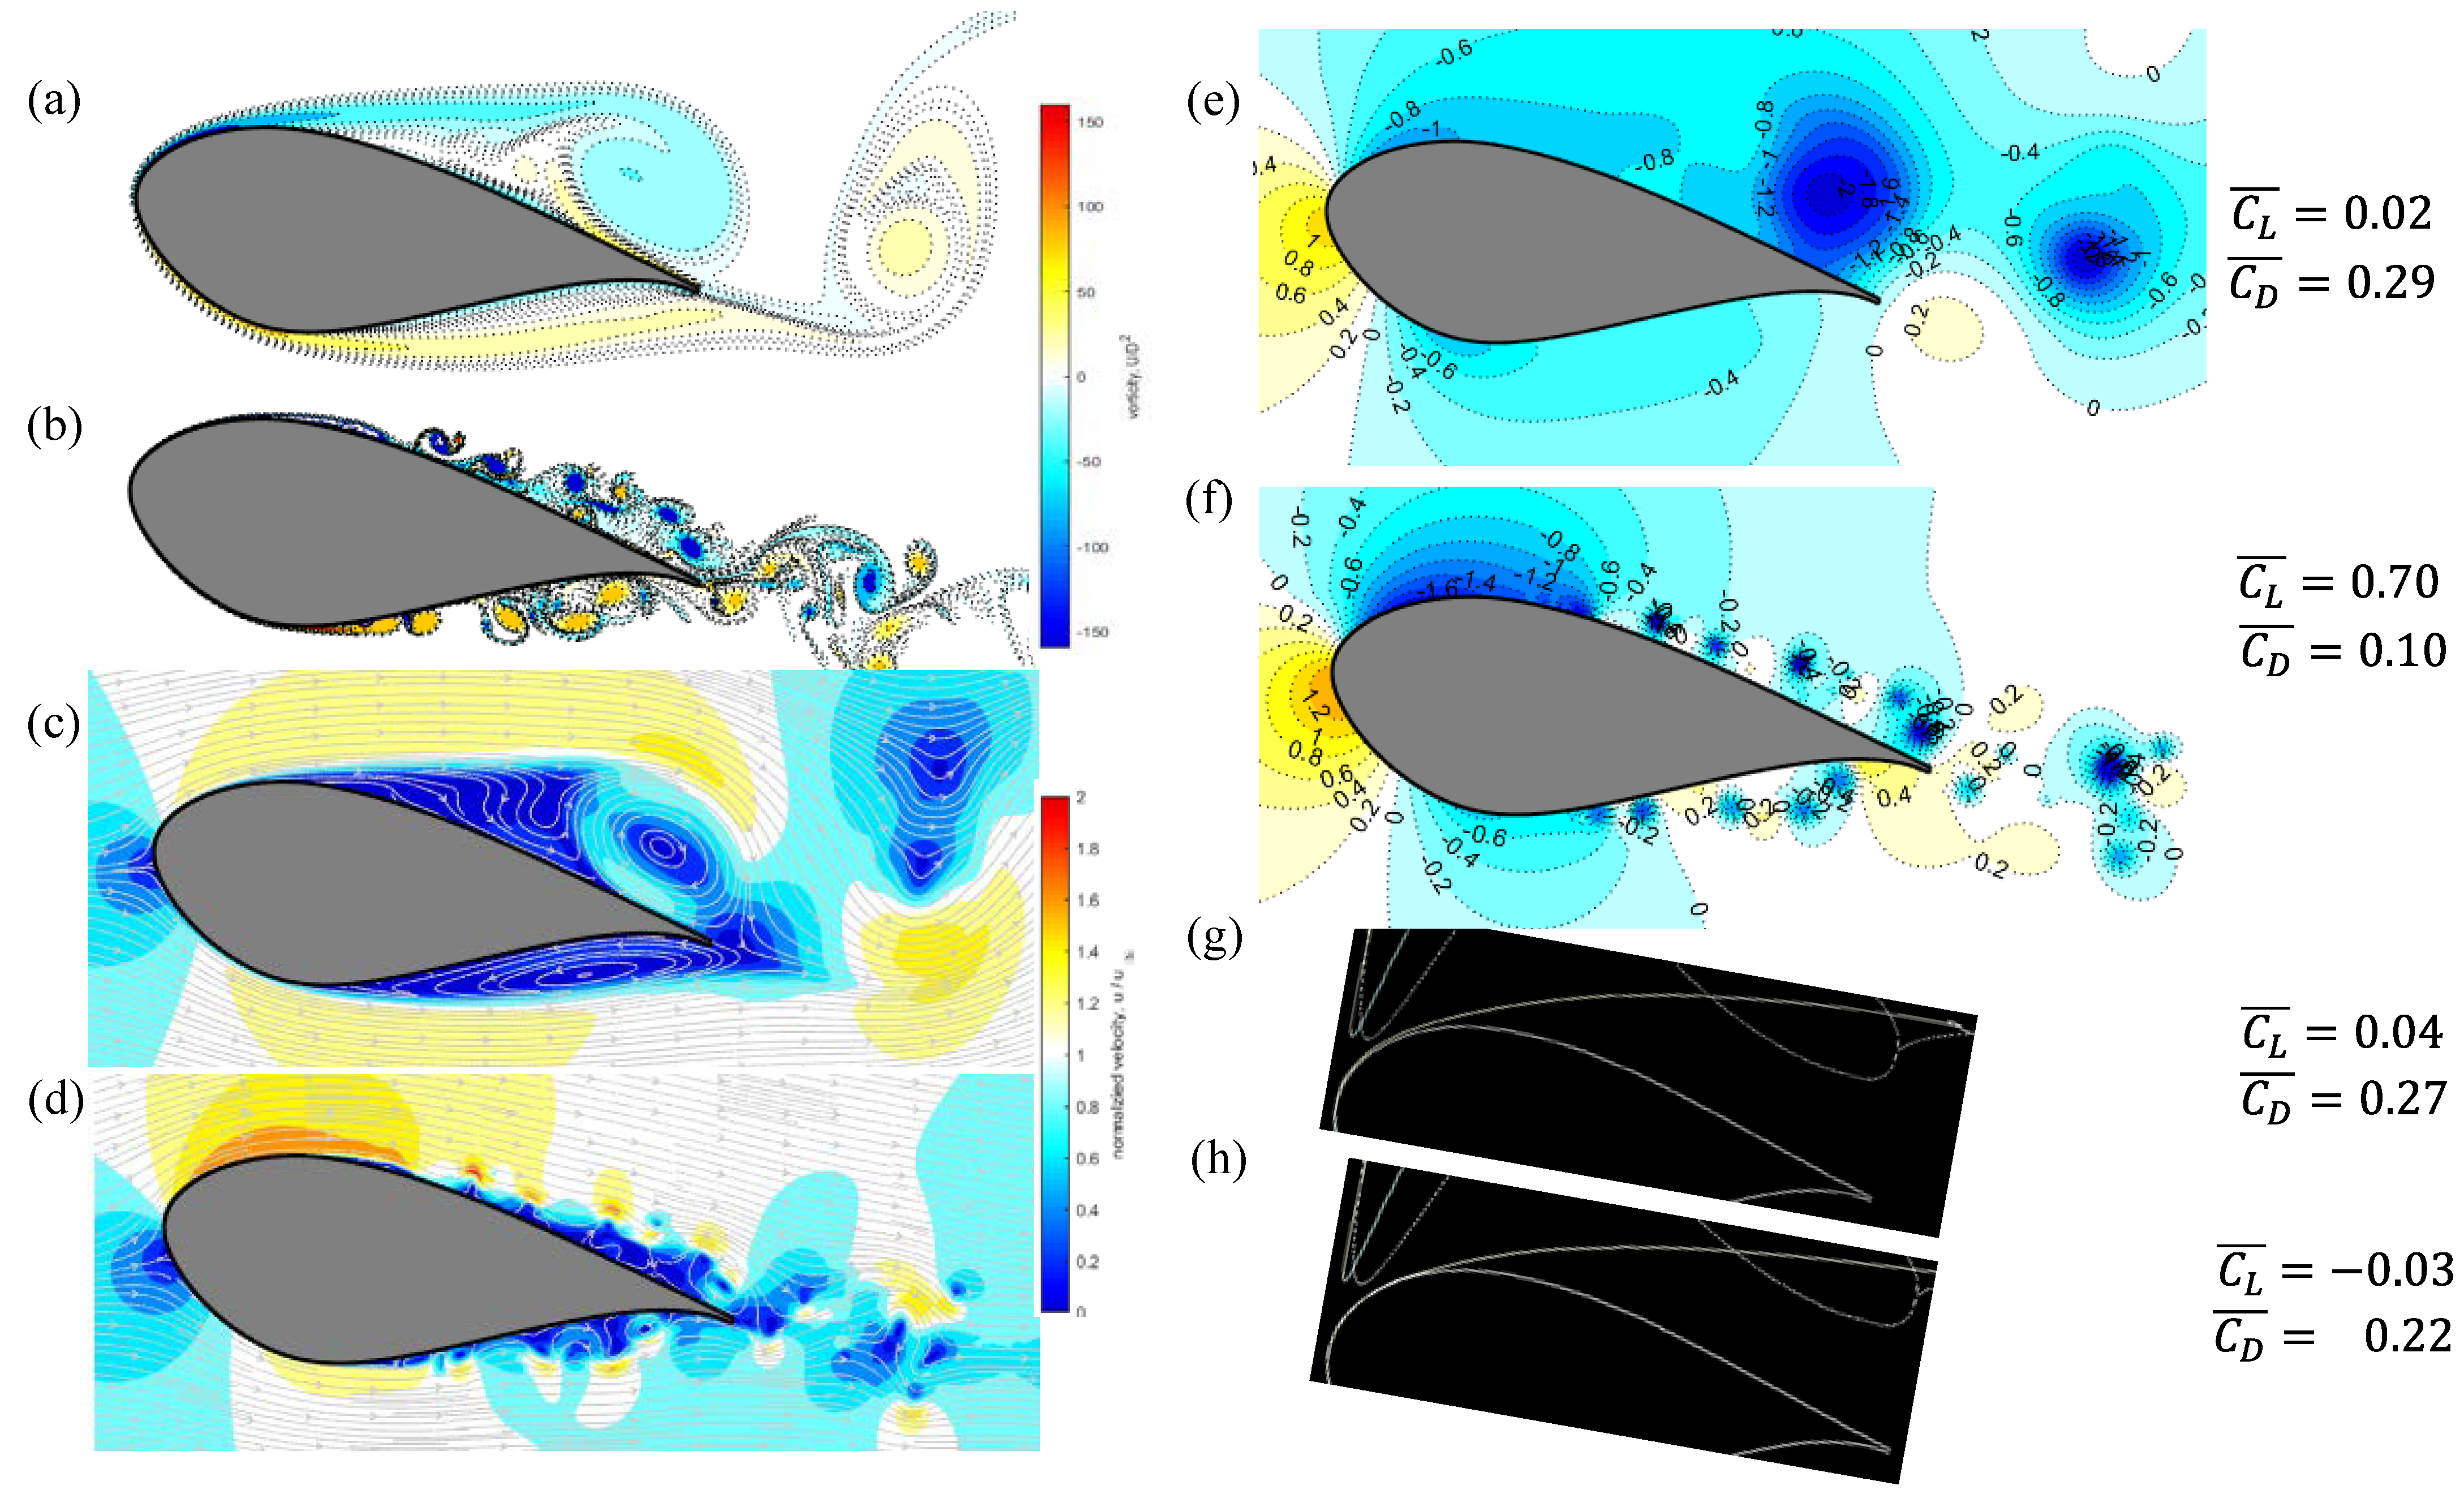
Similar to NACA64, the set of the results of the thick airfoil, i.e., DU40, are presented in Figure 10, Figure 11, Figure 12 and Figure 13. For the lower Reynolds number (ReC = 4000), the lift force history shown in Figure 10a,c resembles a regular sine wave, with relatively low fluctuation frequency and larger magnitude as compared to the high Reynolds number scenario in Figure 10b,d. Instantaneous flow fields when peak lifts are observed are shown in Figure 11 and Figure 12 and compared to the XFOIL steady-state boundary layer streamlines.
The slower and larger lift fluctuation are linked to the larger wake vortices observed in the low-Reynolds number flow (see Figure 11a and Figure 12a). No reattachment is found in the low-Reynolds number flow. On the other hand, the higher Reynold number flow makes the turbulent-like boundary layer more attached to the surface, as can be seen in Figure 11b and Figure 12b. Similar Reynolds number effects can be observed in the XFOIL simulated steady-state boundary layer streamlines (Figure 11g,h and Figure 12g,h). However, VPM simulations give thinner boundary layers in high Reynolds number flow (Figure 11d and Figure 12d). By comparing the pressure fields in Figure 11e,f and Figure 12e,f, it can be seen that the pressure recovers faster downstream in the high Reynolds number flow, leading to a smaller mean drag as compared to the low Reynolds number pressure fields.
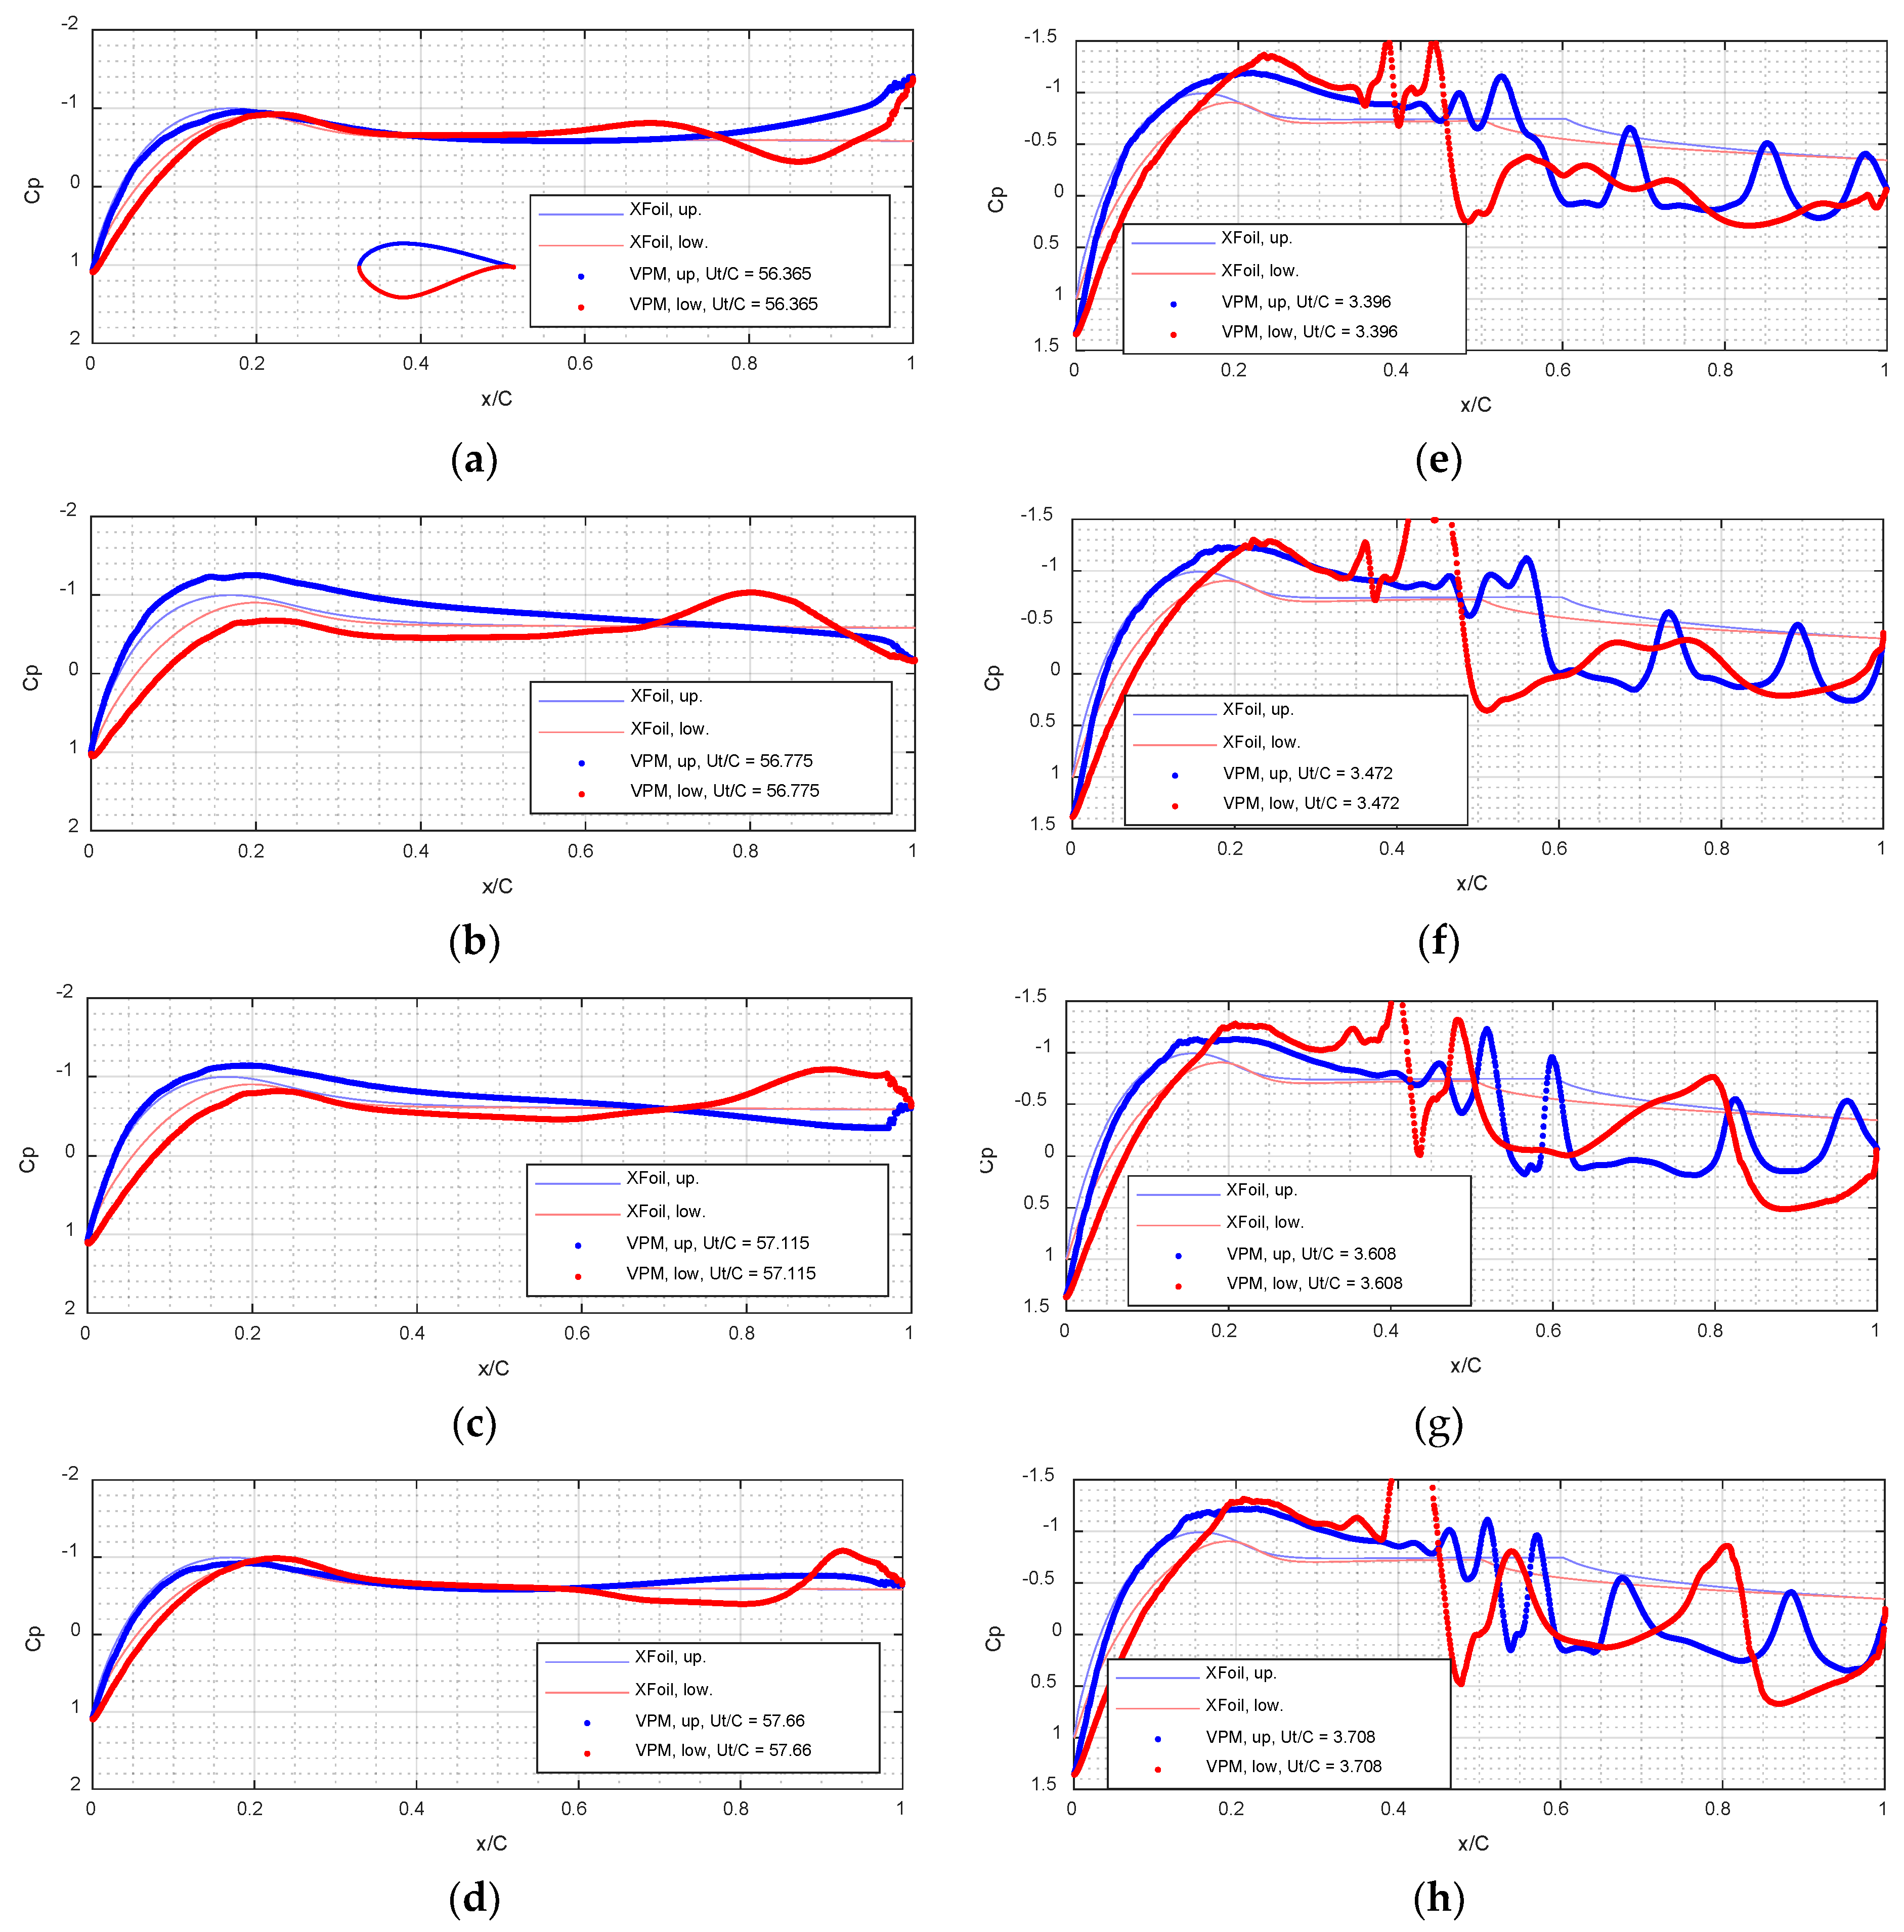
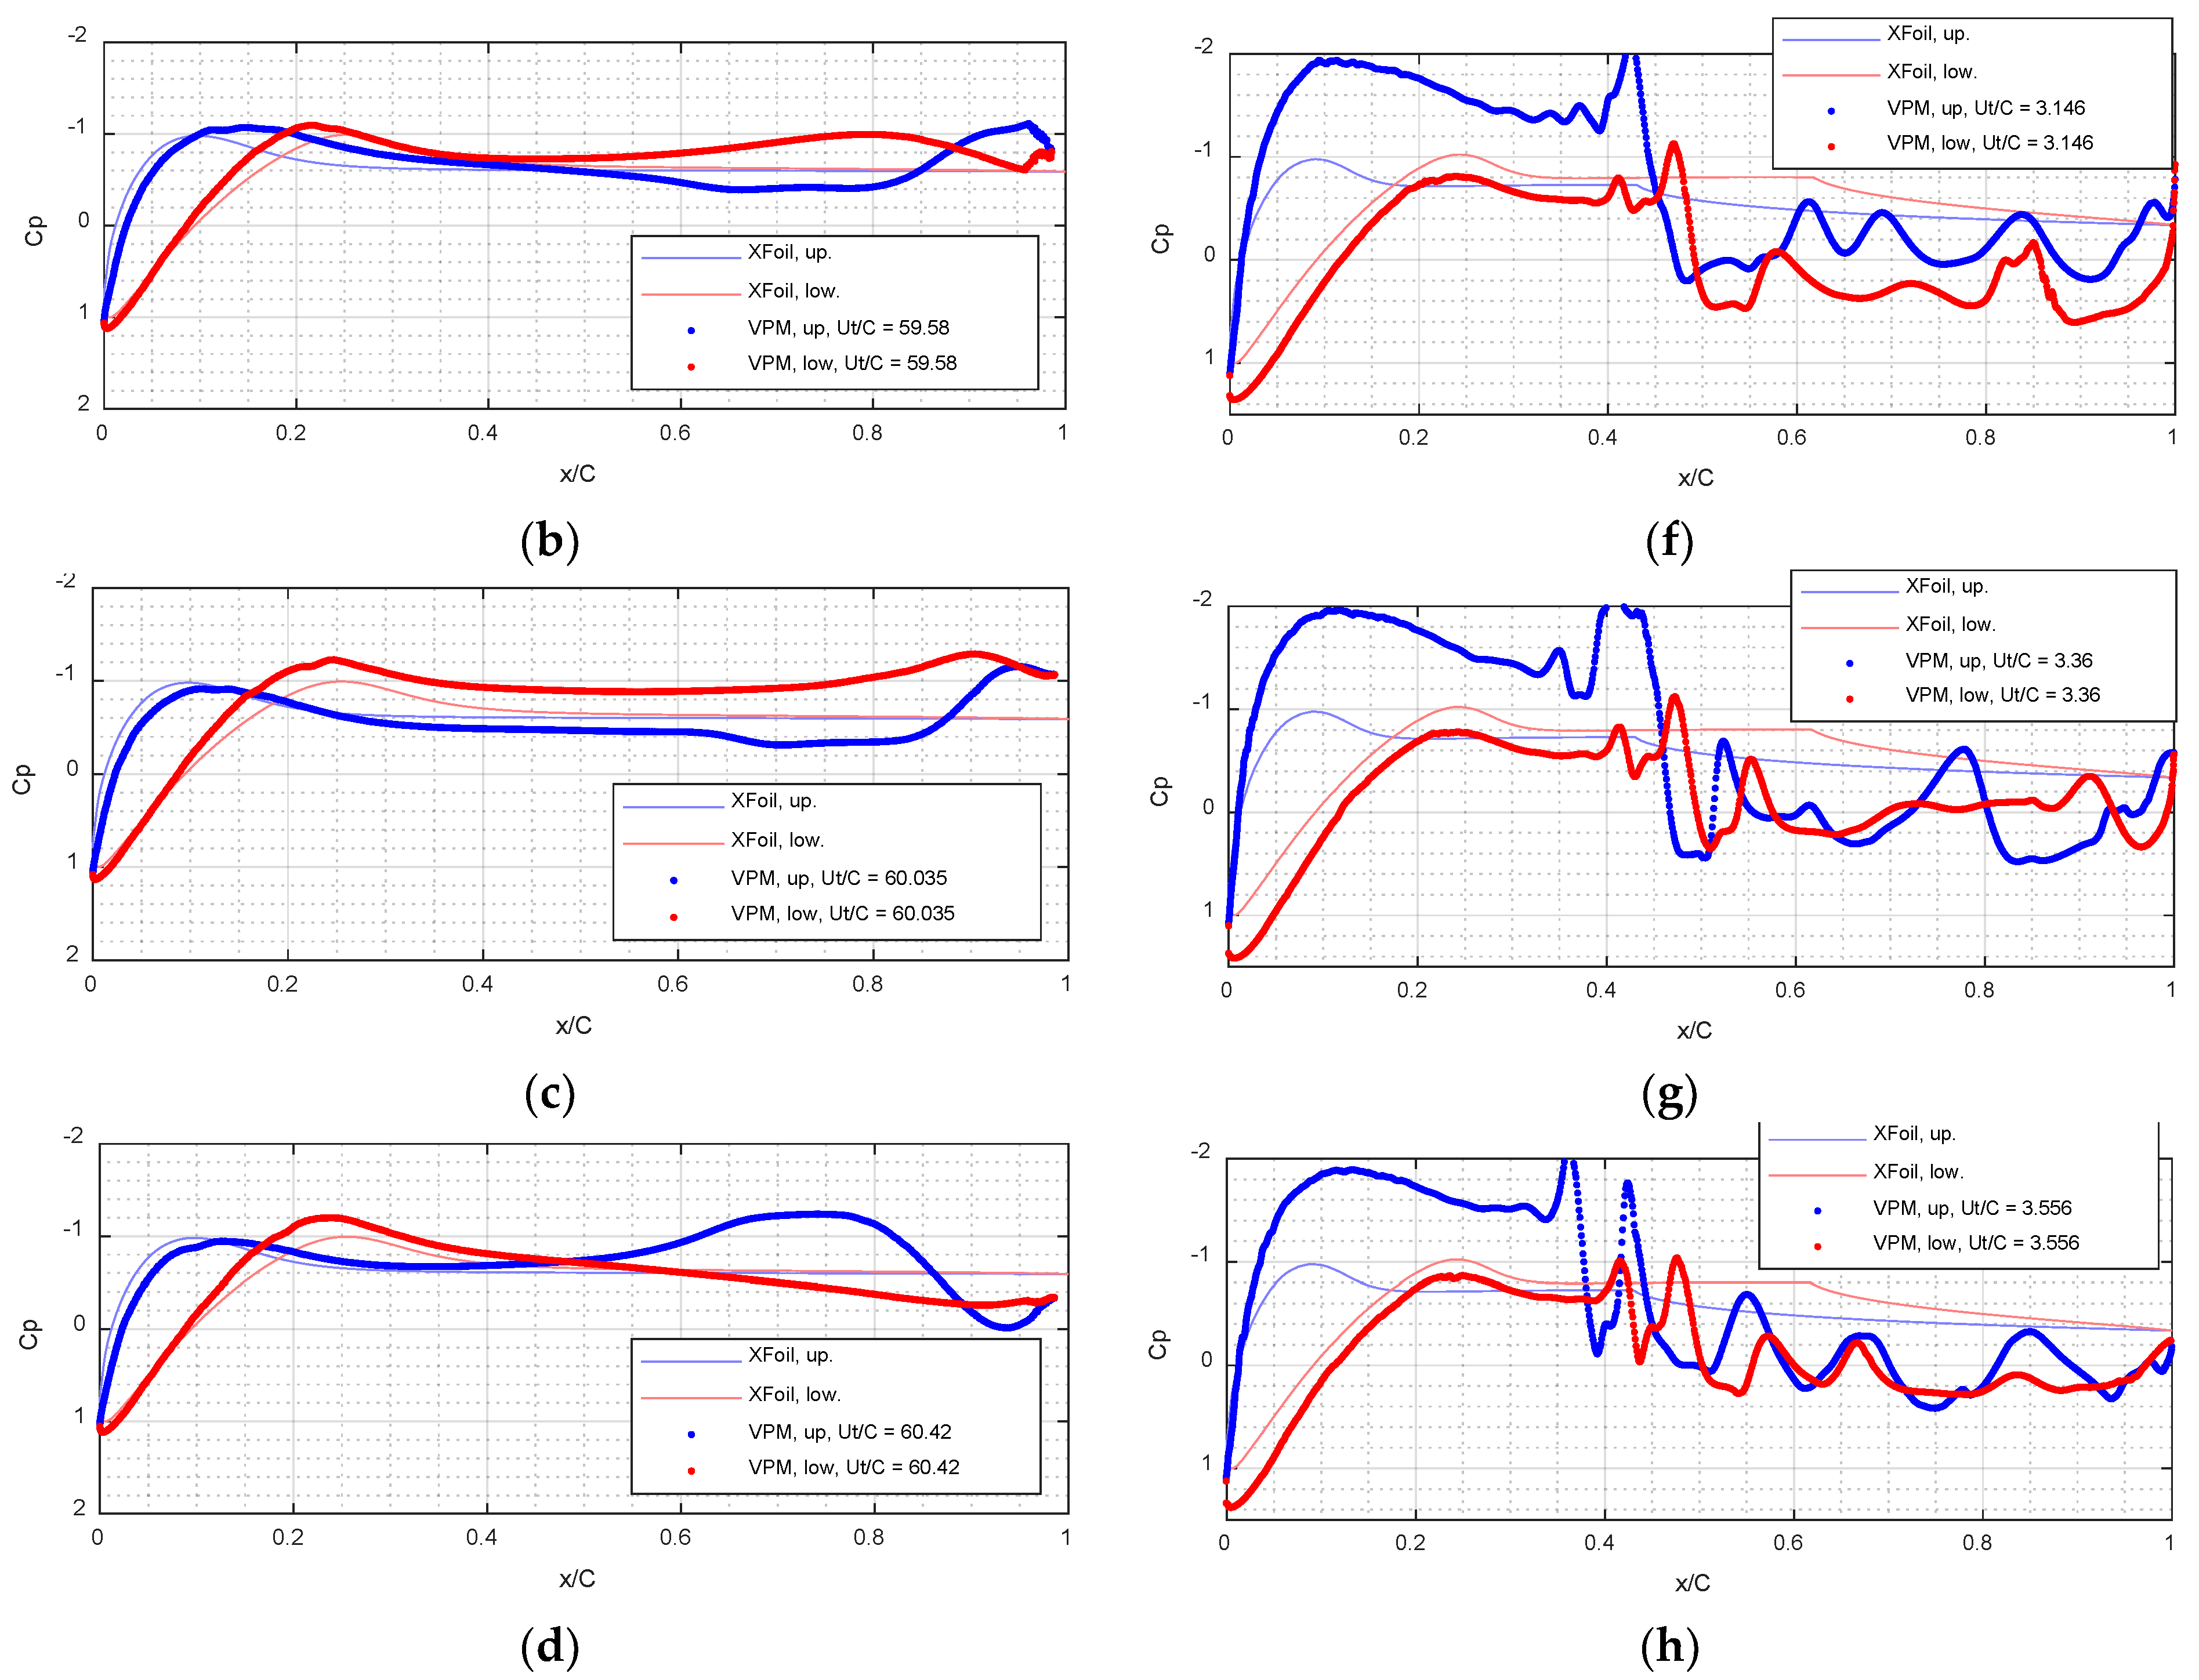
The surface pressures at representative instants of the lift history, i.e., the red stars labeled in Figure 10, are shown in Figure 13 and Figure 14 and compared to the XFOIL steady-state solutions. At the low Reynolds number (Figure 13a–d and Figure 14a–d), the upstream portion of the surface pressures remains steady for most of the time while more fluctuations can be observed on the leeward surface due to the unsteady wake. The mean value of surface pressures agrees with the XFOIL steady-state result in low-Reynolds number flow. For the high Reynolds number flow (Figure 13e–h and Figure 14e–h), significant pressure fluctuations caused by flow separation and the roll-up vortices can be observed on the downstream portion of the surfaces. Sudden drops of the mean suction can be observed in 0.4 < x/C < 0.6 on both the upper and lower surfaces. At α = 0 ° , XFOIL simulations indicate that pressure recoveries occur at x/C = 0.6 and 0.5 on the upper and lower surfaces, respectively, which agree with the instantaneous pressures obtained from VPM. For the higher angle of attack, α = 10 ° , both XFOIL and VPM show that the upper surface pressure recovery point moves upstream to about x/C = 0.42 but disagree on the lower surface recovery point (VPM gives about x/C = 0.5 while XFOIL gives x/C = 0.62). For both angles of attack, VPM simulations give higher upper surface suctions than the XFOIL results on the surface upstream to the pressure recovery point. However, after the pressure recovery, VPM gives lower suctions.

3.3. Comparison with Experiments and Other Data

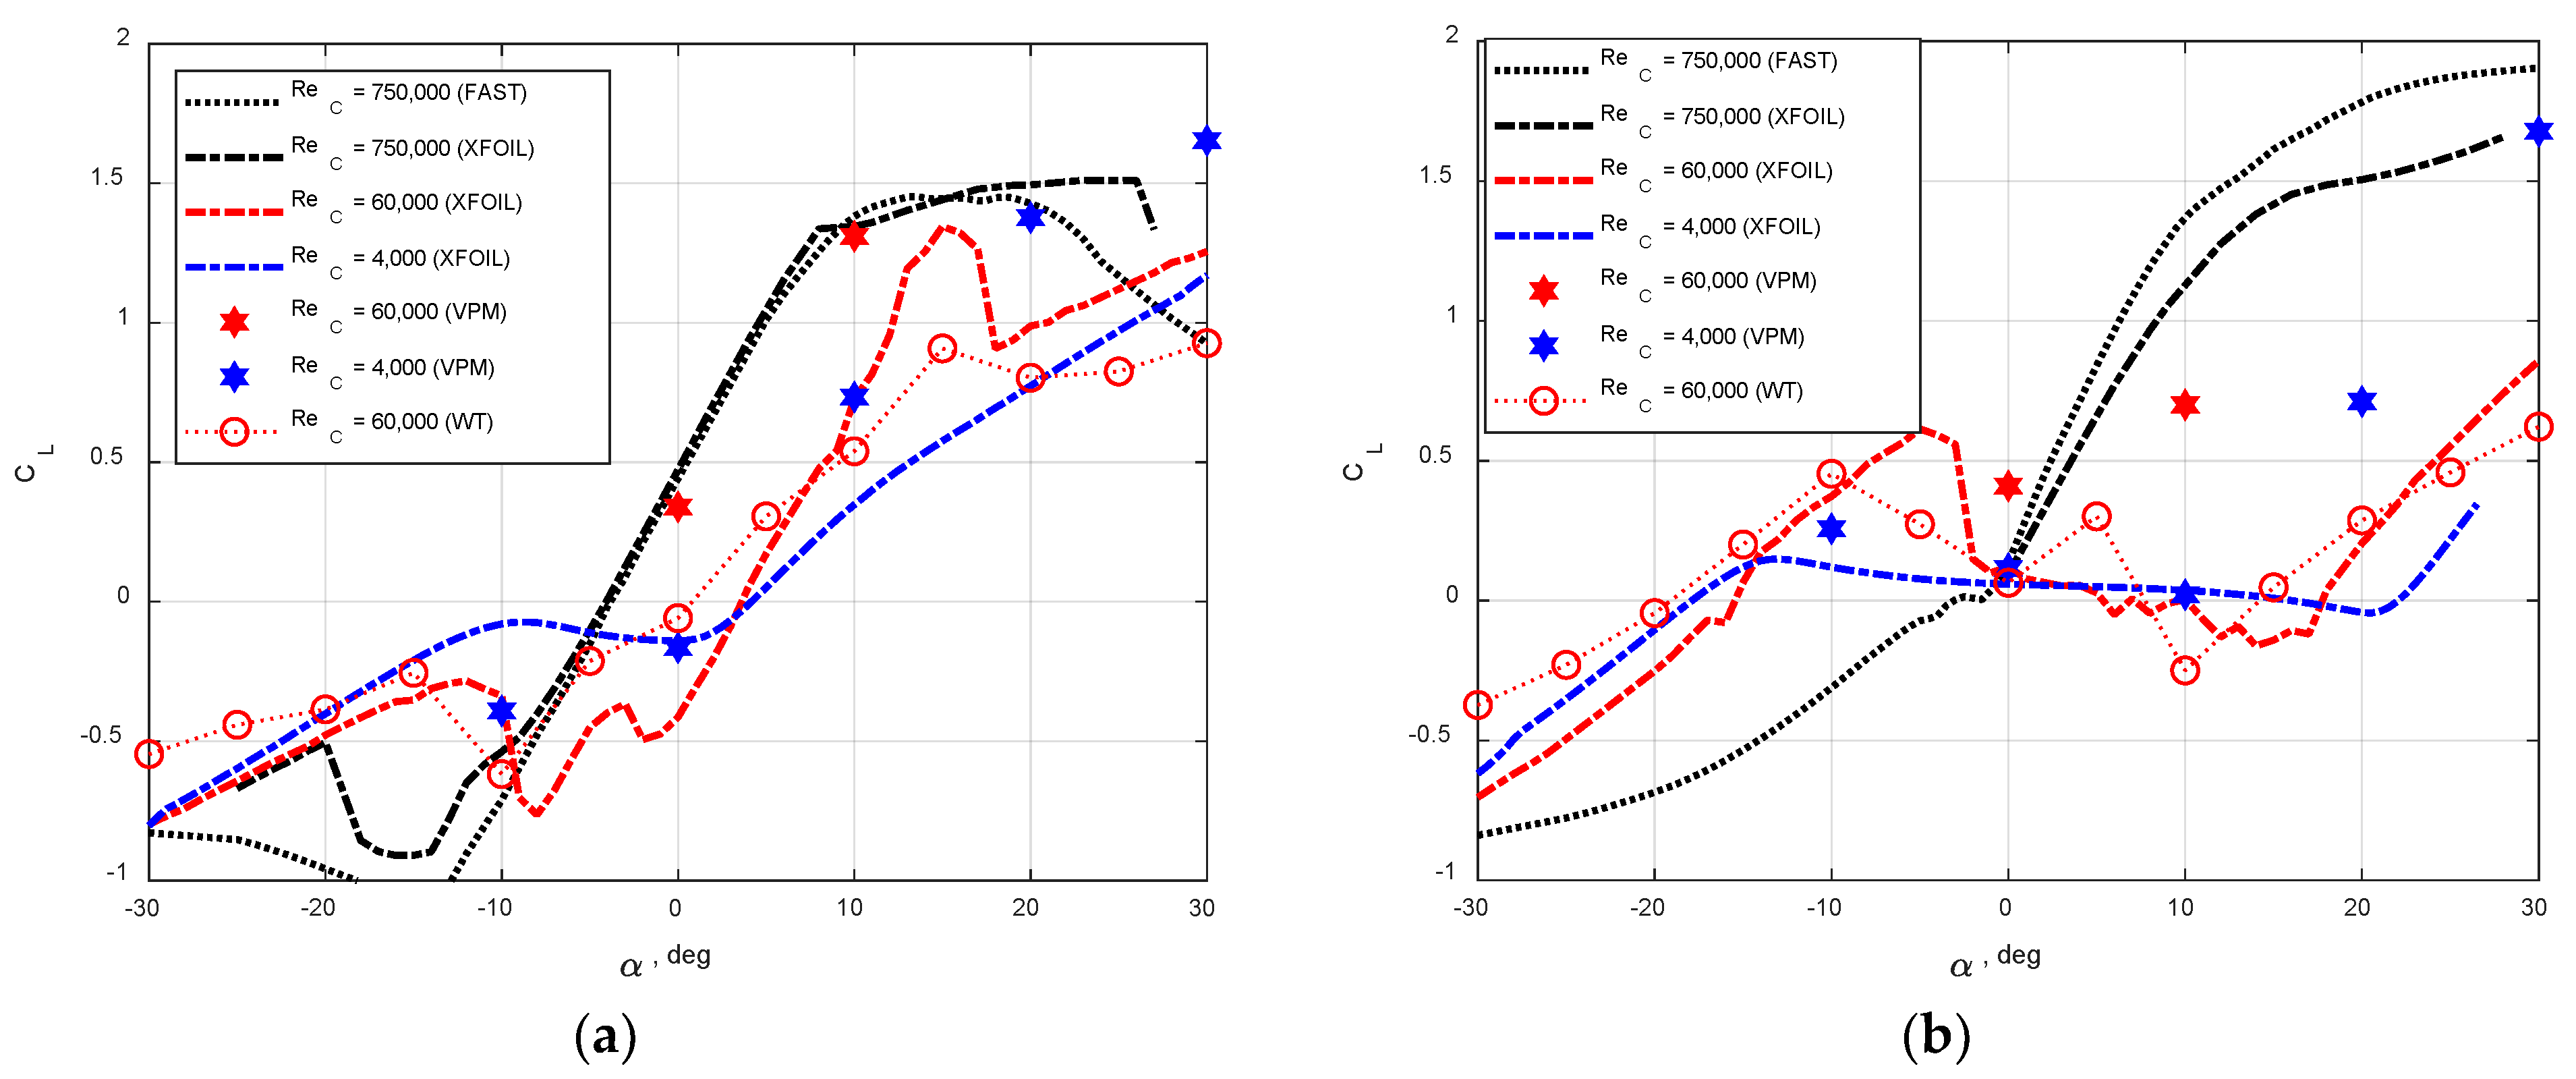
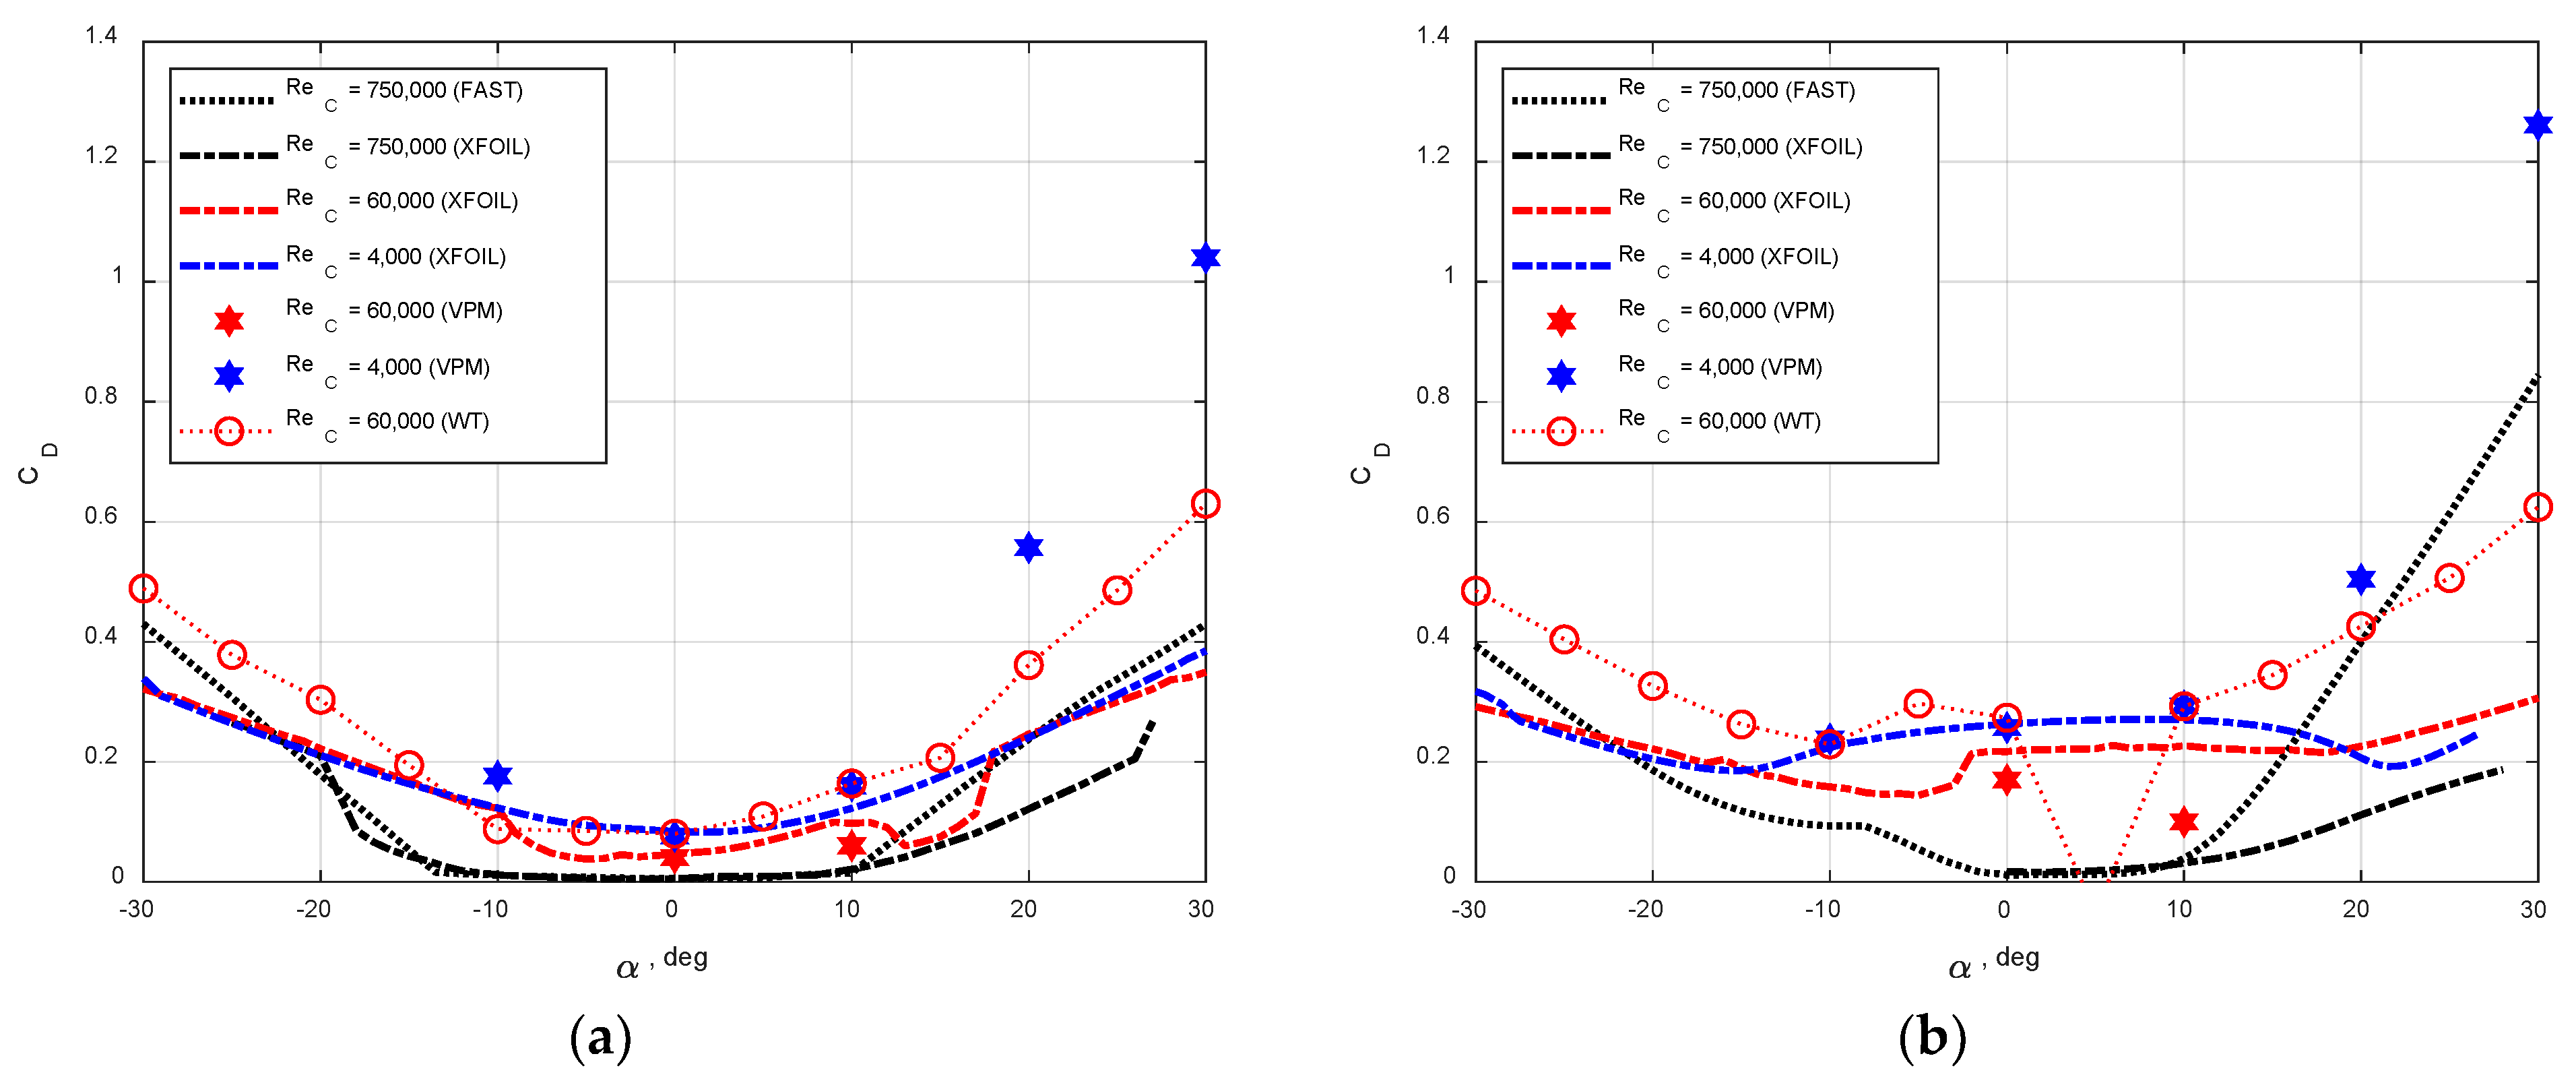
The time average aerodynamic lift and drag coefficients obtained from wind tunnel experiments (WT) and numerical simulations (VPM and XFOIL) are compared in Figure 15 and Figure 16, respectively. The aerodynamic coefficients utilized in the FAST software for the NREL 5 MW baseline wind turbine [26] are given in the figures, as well. Since FAST is used for full-scale wind turbine simulation, the aerodynamic coefficients are associated with ReC = 750,000. In these figures, the blue-, red-, and black-colored symbols are used to represent the results of ReC = 4000, 60,000, and 750,000, respectively.
As can be seen in Figure 15, the highest mean lift coefficients can be observed at the highest Reynolds number for 0 ° α 30 ° . The lift coefficients generally decrease as the Reynolds number decreases for 0 ° α 30 ° . By comparing the results of ReC = 4000 and 750,000, the maximum lift reduction is about Δ C L = 1 at α = 10 ° for NACA64 and Δ C L = 1.8 at α = 20 ° for DU40. For the mean drag coefficients shown in Figure 15, the drag coefficients generally decrease as the Reynolds number increases for low angles of attack 10 ° α 10 ° . Therefore, the effects of Reynolds number variations on the airfoil aerodynamic performance are significant.
At ReC = 750,000, agreements of CL (Figure 15) and CD (Figure 16) in XFOIL simulations and FAST can be found in 10 ° α 10 ° . At ReC = 60,000 as well as α = 0 ° and 10 ° , VPM generally overestimates CL (Figure 15) and underestimates CD (Figure 16), which is obtained by wind tunnel experiments. On the other hand, the XFOIL predictions of CL and CD are generally closer to the measurements at ReC = 60,000 for 10 ° α 10 ° . Deviations of XFOIL CD from the measured values can be observed for α > 10 ° or α < 10 ° . At ReC = 4000, better agreements can be found in VPM and XFOIL simulations for 10 ° α 10 ° . For larger angles of attack, α > 10 ° , VPM gives higher lifts and drags. These excessive lifts and drags may be caused by the missing 3D mechanisms in the 2D simulations for higher angles of attack.
Figure 15 and Figure 16 show that the force coefficients of wind tunnel measurements obtained at ReC = 60,000 are closer to the coefficients of simulations (XFOIL and VPM) at the low Reynolds number, i.e., ReC = 4000. This implies that the aerodynamics observed at ReC = 4000 and 60,000 may be similar. On the other hand, significant differences in aerodynamics may exist in ReC = 60,000 and ReC = 750,000.
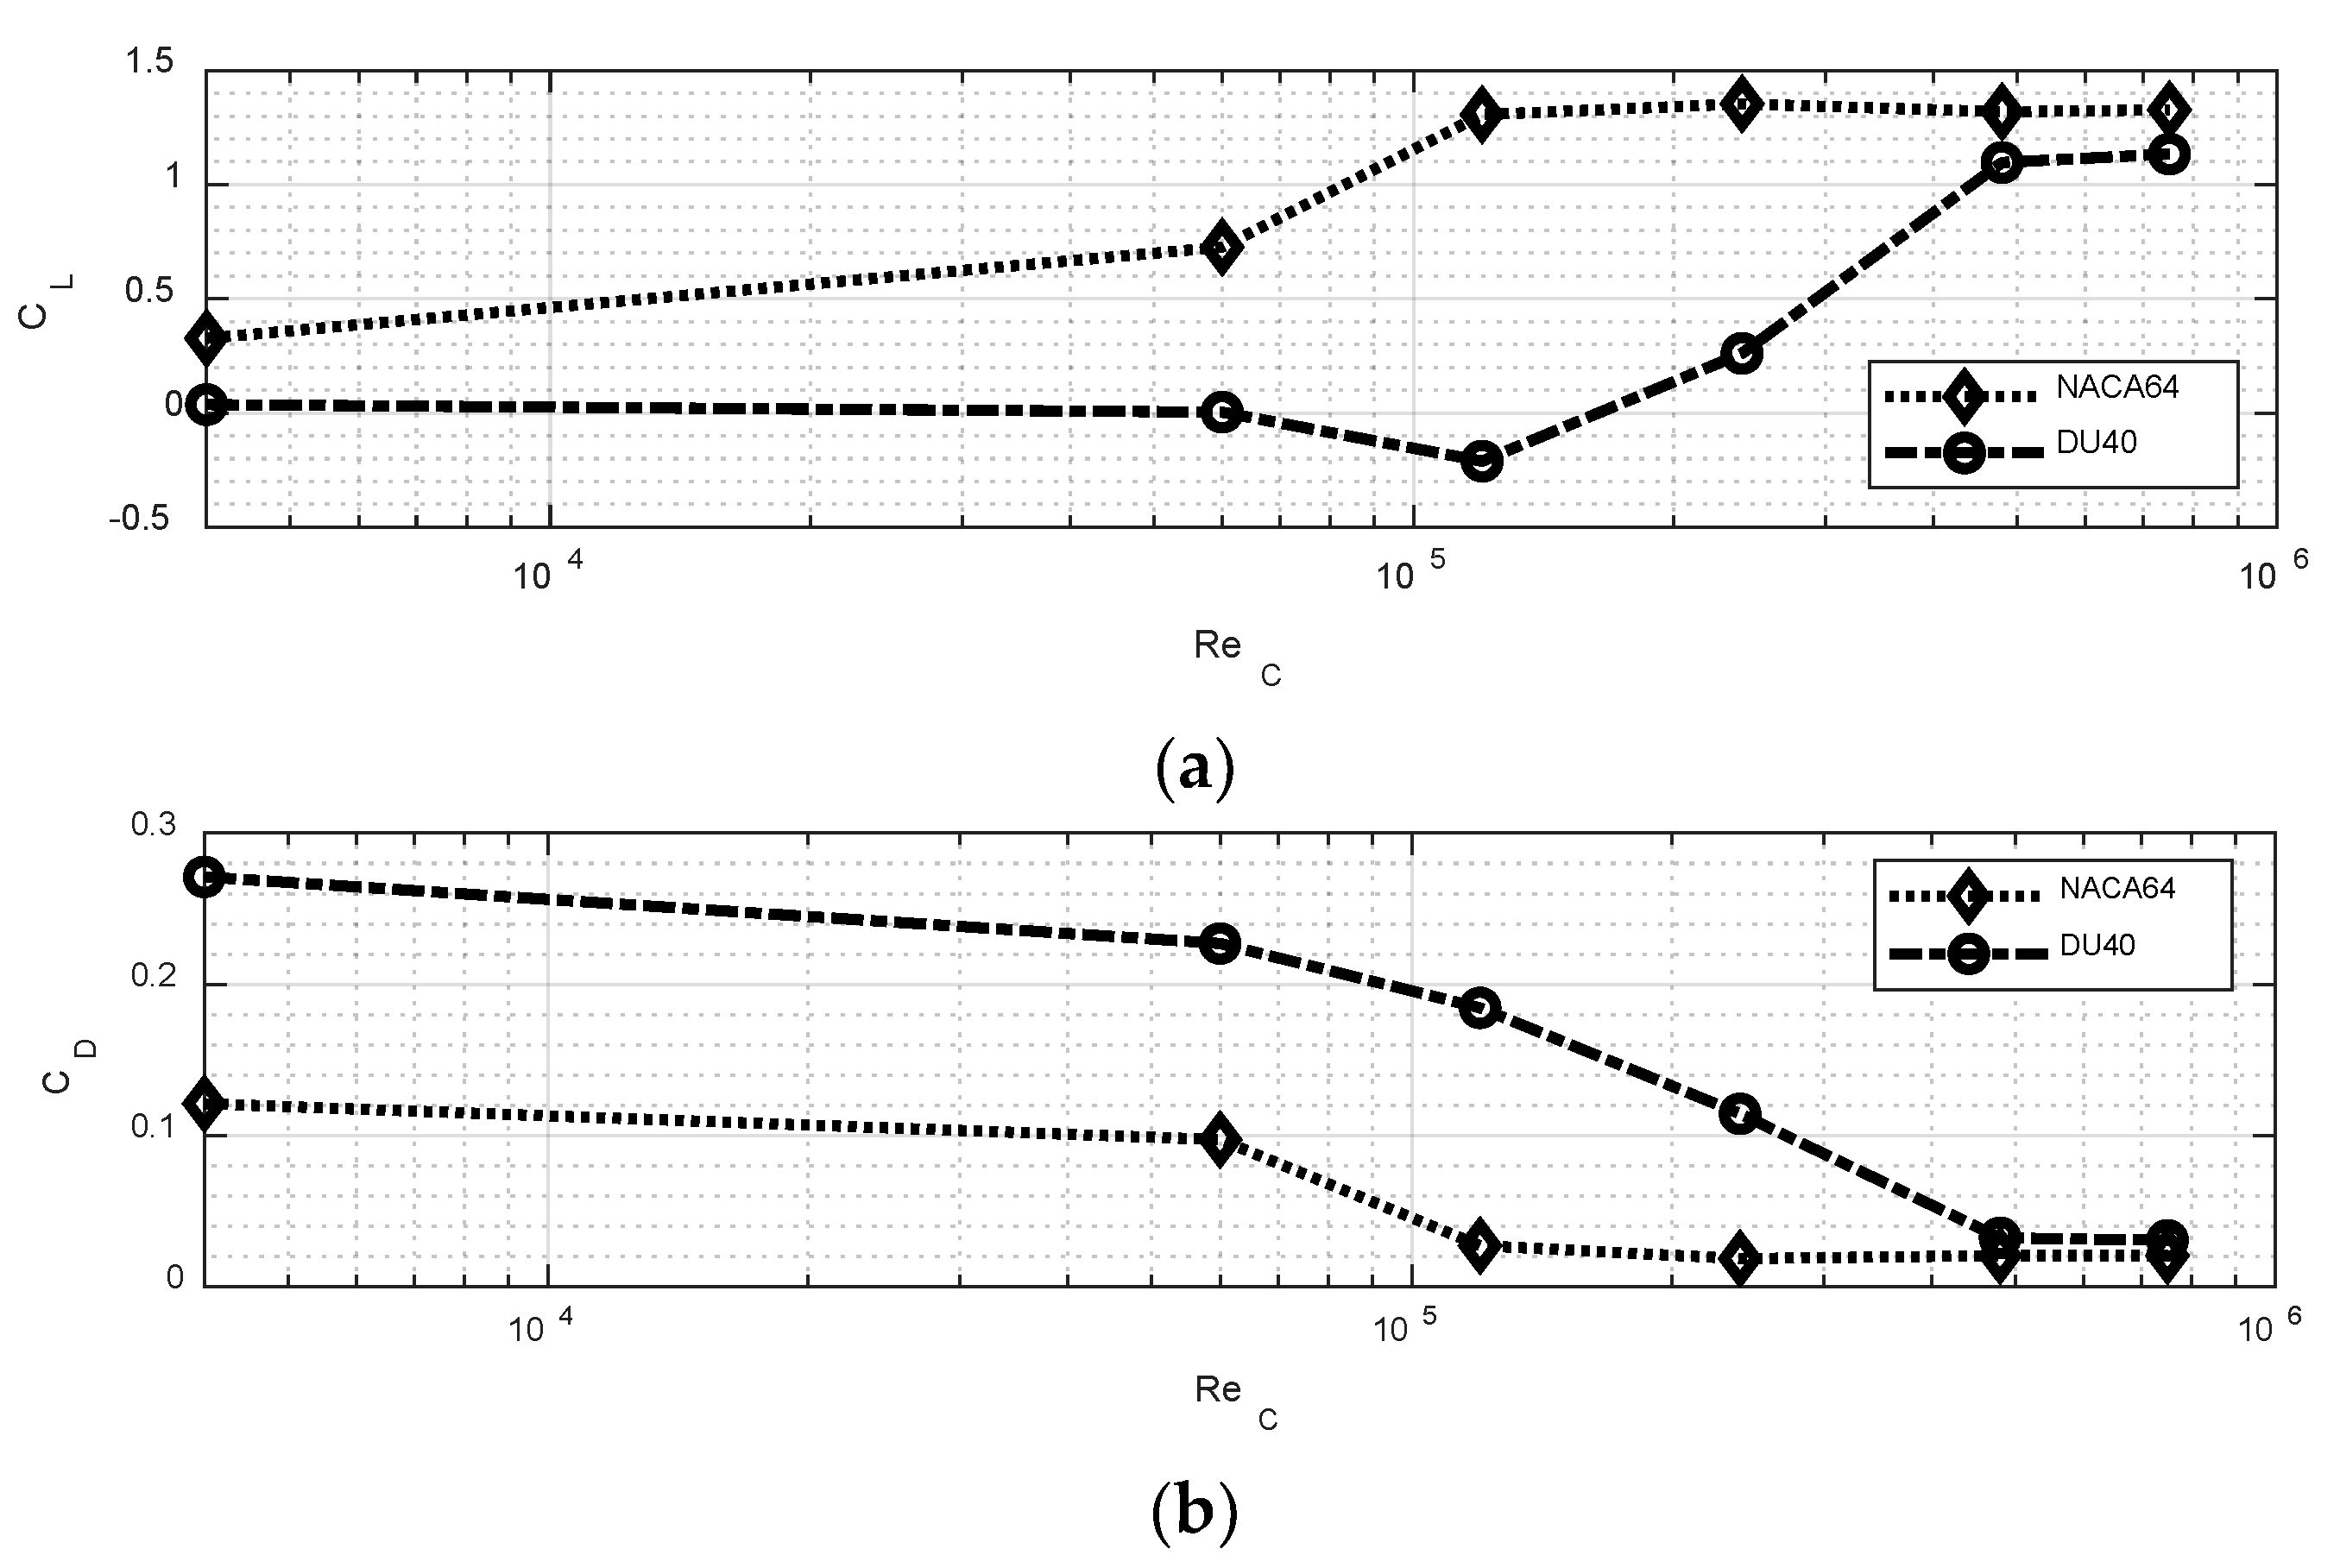
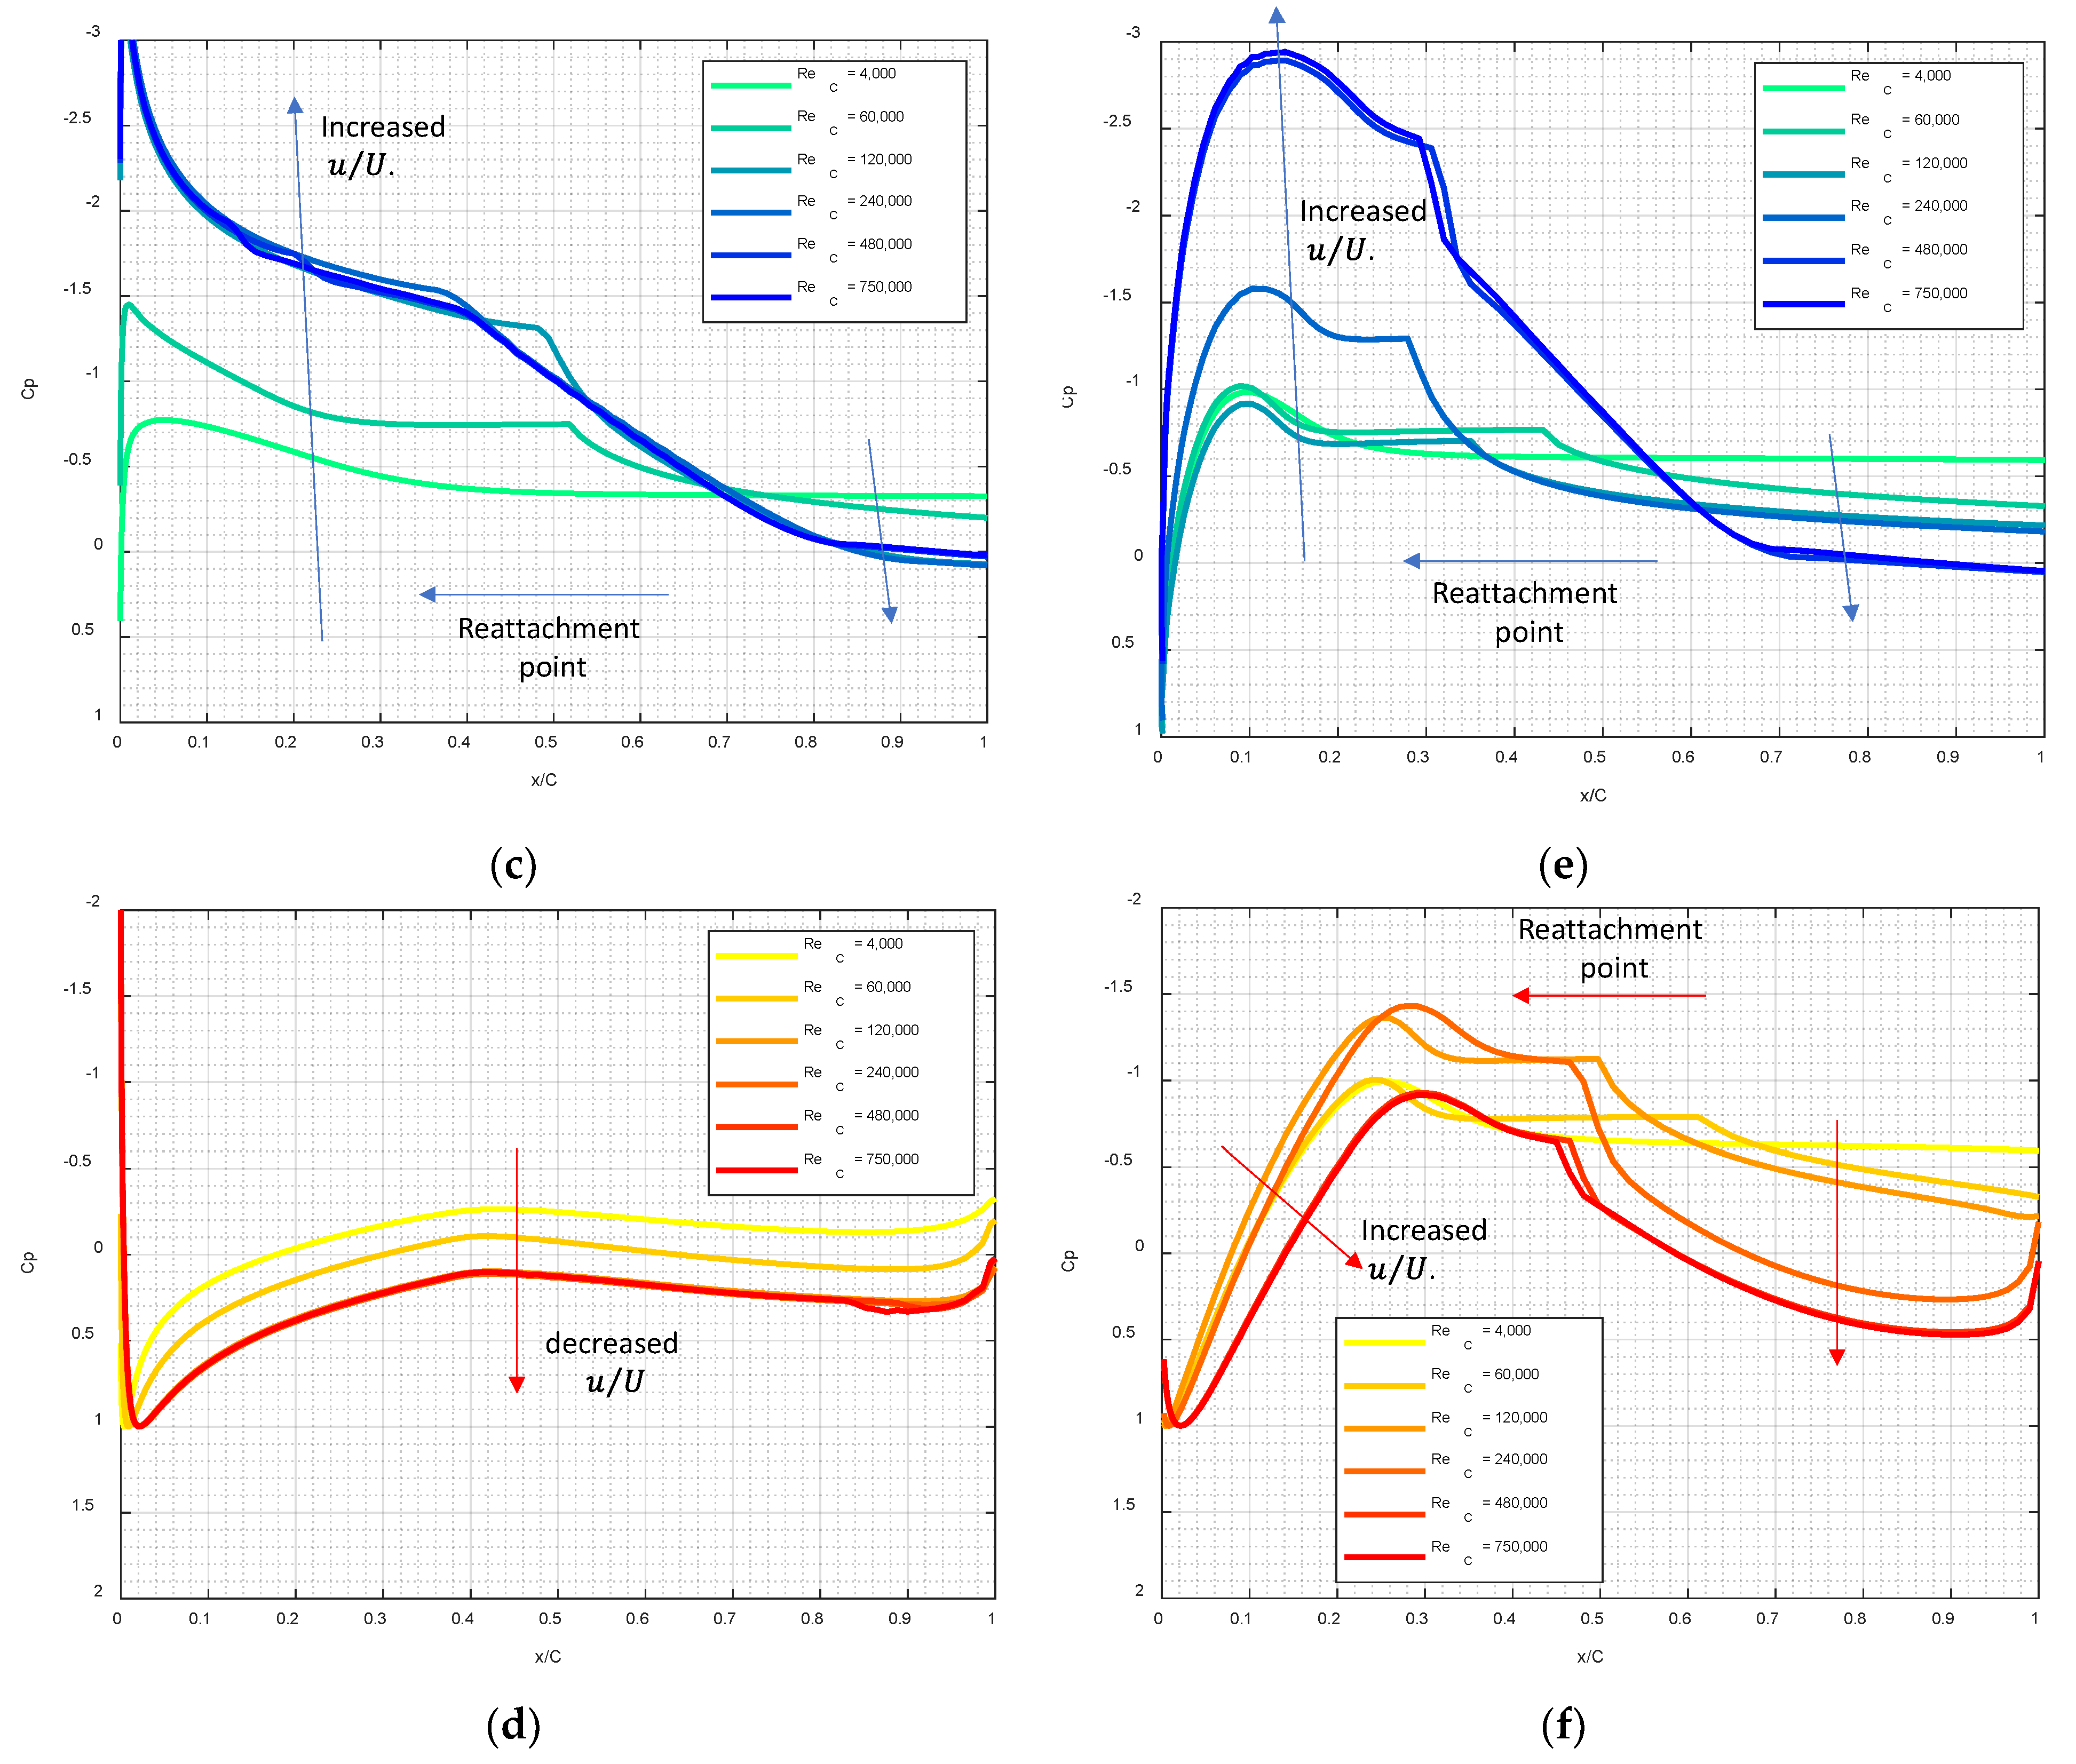
To examine the progressive changes in the aerodynamics, XFOIL is applied to compare the steady-state integral forces coefficients (Figure 17a,b) and surface pressures coefficients (Figure 17c–f) at ReC = 4000, 60,000, 120,000, 240,000, 480,000, and 750,000. The lift (Figure 17a) and drag (Figure 17b) coefficients of the NACA64 airfoil show that significant changes occur in 60 , 000 R e C 120 , 000 . As the Reynolds number further increases, i.e., R e C 120 , 000 , the force coefficients remain constant, indicating that the effects of the Reynolds number variations saturate. On the other hand, for DU40 airfoil, larger variations of the force coefficients over the wider Reynolds number ( 12 , 000 R e C 480 , 000 ) are observed.
As the Reynolds number increases, a significant increase in the suctions on the upstream portion of the upper surface (Figure 17c,e), as well as the increase in positive pressures on the lower surface (Figure 17d,f) contribute to the increase in lift force coefficients (Figure 17a). The increased suction and positive pressure can be explained by the increased and reduced normalized wind speed, u / U , observed above and below the airfoil surfaces, respectively, which are consistent with the observations of the pressure fields (Figure 8e,f and Figure 12e,f) and velocity fields (Figure 8c,d and Figure 12e,f) simulated by the VPM.
Moreover, the decrease in the lengths of the separation bubbles, which can be identified by the region of the suction plateau (Figure 17c,e), can be observed as the Reynolds number increases. As a result, the reattachment point, which can be identified as the starting point of the pressure recovery, moves upstream. Downstream of the reattachment points, the amount of pressure recovery (Figure 17a,c) increases with the Reynolds numbers, which explains the drag reduction (Figure 17b). Similar effects of reduced separation bubbles are observed in VPM-simulated surface pressures, as well (Figure 9 and Figure 14). Although the mismatches are observed in VPM simulated forces at ReC = 60,000 (Figure 15 and Figure 16), the corresponding VPM pressures in Figure 9e–h and Figure 14e–h resemble those of higher Reynolds numbers in Figure 17c–f; namely, the VPM simulations at ReC = 60,000 seem to ‘overestimate’ the effects of the Reynolds number.

3.4. Discussion

At the lower Reynolds number, i.e., ReC = 4000, the flow separation in both thin (NACA64) and thick (DU40) airfoils does not reattach, as observed in the VPM simulations. For the higher Reynolds number, i.e., ReC = 60,000, the separation bubbles and roll-up vortices are observed in the VPM simulations. This trend is consistent with the smoke flow visualization results of NACA0025 by [15]. However, the authors of [15] mentioned that the minimum Reynolds number required to make the separated flow reattach is about ReC = 135,000, 175,000, and 200,000 for α = 0 ° , 5 ° , and 10 ° , respectively. These Reynolds numbers are about 2–3 times the current observations from VPM simulations. From the PIV measurements of GA (W)-1 airfoil at ReC = 70,000 and α = 10 ° , the authors of [14] observed flow separation bubbles and Kelvin-Helmholtz vortices near the separation point. In the numerical simulations of the flow around the Eppler-387 airfoil by [18], instantaneous roll-up vortices are observed at α = 4 ° for ReC = 60,000, 100,000, and 200,000. Similar to the current VPM simulations, their results show that the sizes of the roll-up vortices become smaller and the vortex trajectories become closer to the upper surface as the Reynolds number increases. However, as compared to the numerical simulations by [18] at the ReC = 60,000, the current VPM (Figure 6b, Figure 8b, Figure 11b, and Figure 12b) shows that the roll-up vortices are relatively smaller and more ‘attached’ to the surface.
As the Reynolds number increases, both VPM and XFOIL show increases in suctions on the upper surface upstream to the separation, and sudden pressure recoveries occur downstream of the separation (Figure 9e,f, Figure 13e,f, and Figure 14e,f). The higher upstream suction is due to the increased wind speed and thinner boundary layer (Figure 6d, Figure 8d, Figure 11d, and Figure 12d) while the sudden pressure recovery is related to the flow reattachment. Surface pressures observed in the numerical [18] and experimental [15] tests show a similar variation trend with the Reynolds number. As a result, as the Reynolds number increases, the increases in C L ¯ (Figure 15) are due to the increased suction on the upstream upper surface while decreases in C D ¯ (Figure 16) are due to the pressure recovery caused by flow reattachment.
As the reattached separated flows are generally associated with higher lift and lower drag, adding roughness near the separation point in the low-Reynolds number flow (e.g., ReC = 4000) may promote early roll-ups of the shear layer and thus increase the performance of the airfoil. However, this mechanism has not been proven and merits future investigations.
As the Reynolds number increases, the vortices near the airfoil become smaller and more irregular (Figure 6b, Figure 8b, Figure 11b, and Figure 12b), leading to more disorganized lift force fluctuations at higher frequencies (Figure 5 and Figure 10). The wake velocity measurements by [15] show narrow peaks in the wake velocity spectra at lower Reynolds numbers, indicating organized structures of the wake flow. As the Reynolds number increases, the authors of [15] showed a spectral peak occurring at higher frequencies with the wider bandwidths, indicating a more irregular wake flow. Smoke wake flow visualizations by [15] showed narrower wakes in the higher Reynolds number flow, indicating that the length scales of the wake vortices are reduced.
Although the VPM simulations can reflect the trends of Reynolds number variations, comparisons to the experimental data in Figure 15 and Figure 16 show ‘overestimations’ of the Reynolds number effects. As a result, the wind tunnel measurement of the aerodynamic forces at ReC = 60,000 is closer to the VPM and XFOIL simulations at ReC = 4000 and small angles of attack, 10 ° α 10 ° . At higher larger angles of attack, both VPM and XFOIL are unable to predict the measurement results. In VPM, this may be due to the negligence of the 3D effects in the 2D model.

4. Conclusions

To study the Reynolds number effects on airfoil aerodynamics, the two-dimensional (2D) vortex particle method (VPM) is used to numerically simulate the unsteady flow around a thin (NACA64) and a thick (DU40) airfoil. Simulations obtained at two chord Reynolds numbers, i.e., ReC = 4000 and 60,000, and two angles of attack, i.e., α = 0 ° and 10 ° , are compared in detail, where C is the airfoil chord length. Steady-state simulations by XFOIL at ReC = 4000 and 60,000 and wind tunnel aerodynamic force measurements at ReC = 60,000 are compared, as well. The conclusions and recommendations are as follows:
First, the observations reported by the previous numerical and experimental studies that are replicated by the 2D VPM model are:
  • As the Reynolds number increases, the laminar boundary layers become thinner before separation, and the separated flow may reattach, forming separation bubbles, vortex roll-ups, and irregular wake vortices of reduced length scales.
  • These kinematic observations are related to variations of the surface pressure distributions, increased lifts, and reduced drags.
The main contributions of this work are the explanation of the connection between the aerodynamic loads, surface pressures, and nearby flow:
  • Above the upstream portion of the upper airfoil surface, higher normalized wind speed occurs as ReC increases, leading to significant increases in suction coefficients. Below the lower airfoil surface, the reduced normalized wind speed occurs as ReC increases, leading to increased positive pressure coefficients. These two observations are the main causes that increase the lift coefficients.
  • As ReC increases, stronger pressure recoveries induced by the flow reattachments are observed downstream of the separation bubble, leading to reduced drag coefficients.
  • At the lower Reynolds number, i.e., ReC = 4000, the VPM-simulated unsteady wake vortices are larger and more organized, leading to larger wavelengths of surface pressure fluctuations and lower frequencies of aerodynamic force fluctuations.
  • At the higher Reynolds number, i.e., ReC = 60,000, small-scale roll-up vortices shed downstream to form the wake, causing significant spatial pressure fluctuations on the downstream surfaces and more irregular force fluctuations at higher frequencies.
  • The wind tunnel measurements of the mean integral forces at ReC = 60,000 are similar to VPM and XFOIL simulations at ReC = 4000, implying little changes in aerodynamics in this range of Reynolds numbers, i.e., 4000 < ReC < 60,000.
Based on the analyses, recommendations for future works are as follows:
  • It is not clear at this point why the pressure recoveries are stronger as the ReC increases. The 2D VPM simulations at intermediate Reynolds numbers, i.e., 4000 < ReC < 60,000, may assist in explaining this mechanism.
  • To increase the airfoil performance at low Reynolds numbers, adding roughness near the separation point may be a feasible way, since it may promote the roll-up of separating vorticity and thus the reattachments, higher lift, and reduced drag coefficients. However, this mechanism needs to be validated.
  • The 2D VPM simulations are shown to ‘overestimate’ the effects of the increasing Reynolds number at ReC = 60,000. At higher angles of attack, i.e., α > 10 ° , reduced accuracy of VPM simulations is observed. These deficiencies are possibly due to the missing consideration of the 3D effects, which may be considered in future models. Although less accurate, the 2D VPM model is valuable in terms of its capability at a reduced cost to reflect the aerodynamics with Reynolds numbers at low angles of attack.

Author Contributions

Conceptualization, C.-H.W., Y.-L.L. and C.-L.F.; methodology, C.-H.W. and J.-Z.C.; software, C.-H.W. and J.-Z.C.; validation, all authors; investigation, C.-H.W. and J.-Z.C.; resources, C.-H.W. and J.-Z.C.; writing—original draft preparation, C.-H.W.; writing—review and editing, all authors; visualization, C.-H.W. and J.-Z.C.; funding acquisition, Y.-L.L. and C.-L.F. All authors have read and agreed to the published version of the manuscript.

Funding

This work is partially funded by the Bureau of Standards, Metrology and Inspection, M. O. E. A. in Taiwan for the sub-plan C1-4 of the project “Offshore wind power site survey and design technical specification construction plan”.

Institutional Review Board Statement

Not applicable.

Informed Consent Statement

Not applicable.

Data Availability Statement

Not applicable.

Acknowledgments

The authors appreciate the technical help offered by the lab technicians and graduate students in setting up the wind tunnel tests at Tamkang University, New Taipei City, Taiwan.

Conflicts of Interest

The authors declare no conflict of interest.

Nomenclatures

CChord length of the airfoil. Unit: meter (m).
C D Drag force coefficient, C D = F D / ( 0.5 ρ U 2 C ) .
C L Lift force coefficient, C L = F L / ( 0.5 ρ U 2 C ) .
ReCReynolds number based on airfoil chord length, i.e., R e C = U C / v .
tTime. Unit: second (s).
UFreestream wind speed. Unit: m/s.
α Angle of attack. Unit: degree (o).
v Kinematic viscosity. Unit: m2/s.
ρ Air density. Unit: kg/m3.

References

  1. Moran, J. An Introduction to Theoretical and Computational Aerodynamics; Wiley: New York, NY, USA, 1984. [Google Scholar]
  2. Bak, C.; Zahle, F.; Bitsche, R.; Kim, T.; Yde, A.; Henriksen, L.C.; Hansen, M.H.; Blasques, J.P.A.A.; Gaunaa, M.; Natarajan, A. The DTU 10-MW Reference Wind Turbine; Danish Wind Power Research: Fredericia, Denmark, 2013; (Sound/Visual production (digital)). [Google Scholar]
  3. Bayati, I.; Belloli, M.; Bernini, L.; Giberti, H.; Zasso, A. Scale model technology for floating offshore wind turbines. IET Renew. Power Gener. 2016, 11, 1120–1126. [Google Scholar] [CrossRef] [Green Version]
  4. Kapoulas, I.K.; Statharas, J.C.; Hatziefremidis, A.; Baldoukas, A.K. Fast Airfoil Selection Methodology for Small Unmanned Aerial Vehicles. Appl. Sci. 2022, 12, 9328. [Google Scholar] [CrossRef]
  5. Dwivedi, Y.D.; Wahab, A.; Pallay, A.D.; Shesham, A. Effect of surface roughness on aerodynamic performance of the wing with NACA 4412 airfoil at Reynolds number 1.7 × 10⁵. Mater. Today Proc. 2022, 56, 468–476. [Google Scholar] [CrossRef]
  6. Moraes, P.G.d.; Alcântara Pereira, L.A. Surface Roughness Effects on Flows Past Two Circular Cylinders in Tandem Arangement at Co-Shedding Regime. Energies 2021, 14, 8237. [Google Scholar] [CrossRef]
  7. Koehler, C.; Wischgoll, T.; Dong, H.; Gaston, Z. Vortex Visualization in Ultra Low Reynolds Number Insect Flight. IEEE Trans. Vis. Comput. Graph. 2011, 17, 2071–2079. [Google Scholar] [CrossRef] [PubMed]
  8. Mueller, T.J. Aerodynamic measurements at low Reynolds numbers for fixed wing micro-air vehicles. In RTO AVT/VKI Special Course on Development and Operation of UAVs for Military and Civil Applications; Von-Karman Institute: Brussels, Belgium, 1999. [Google Scholar]
  9. Leloudas, S.N.; Eskantar, A.I.; Lygidakis, G.N.; Nikolos, I.K. Low Reynolds airfoil family for small horizontal axis wind turbines based on RG15 airfoil. SN Appl. Sci. 2020, 2, 371. [Google Scholar] [CrossRef] [Green Version]
  10. Boermans, L.M.M.; van Garrel, A. Design and Wind Tunnel Test Results of a Flapped Laminar Flow Airfoil for High Performance Sailplane Applications; XXIV OSTIV Congress: Onmrama, New Zealand, 1995. [Google Scholar]
  11. Addy, H.E.; Broeren, A.P.; Zoeckler, J.G.; Le, S. A wind tunnel study of icing effects on a business jet airfoil. In Proceedings of the 41st Aerospace Sciences Meeting and Exhibit, Reno, NE, USA, 6–9 January 2003. [Google Scholar]
  12. Arena, A.V.; Mueller, T.J. Laminar separation, transition, and turbulent reattachment near the leading edge of airfoils. AIAA J. 1980, 18, 79-0004R. [Google Scholar] [CrossRef]
  13. Selig, M.S.; McGranahan, B.D. Wind tunnel aerodynamic tests of six airfoils for use on small wind turbines. Trans. ASME 2004, 126, 986–1001. [Google Scholar] [CrossRef]
  14. Hu, H.; Yang, Z. An experimental study of the laminar flow separation on a low-Reynolds-number airfoil. J. Fluids Eng. 2008, 130, 051101. [Google Scholar] [CrossRef] [Green Version]
  15. Yarusevch, S.; Sullivan, P.; Kawall, J. On vortex shedding from an airfoil in low-Reynolds-number flows. J. Fluid Mech. 2009, 632, 245–271. [Google Scholar] [CrossRef]
  16. Mahbub Alam, M.; Zhou, Y.; Yang, H.X.; Guo, H.; Mi, J. The ultra-low Reynolds number airfoil wake. Exp. Fluids 2010, 48, 81–103. [Google Scholar] [CrossRef]
  17. Katz, J. A Discrete Vortex Method for the Non-Steady Separated Flow over an Airfoil. J. Fluid Mech. 1981, 102, 315–328. [Google Scholar] [CrossRef]
  18. Lin, J.C.M.; Pauley, L.L. Low-Reynolds-number separation on an airfoil. AIAA J. 1996, 34, 1570–1577. [Google Scholar] [CrossRef]
  19. Akbari, M.H.; Price, S.J. Simulation of dynamic stall for a NACA 0012 airfoil using a vortex method. J. Fluids Struct. 2003, 17, 855–874. [Google Scholar] [CrossRef]
  20. Kurtulus, D.F. On the wake pattern of symmetric airfoils for different incidence angles at Re = 1000. Int. J. Micro Air Veh. 2016, 8, 109–139. [Google Scholar] [CrossRef] [Green Version]
  21. Winslow, J.; Hikaru, O.; Govindarajan, B.; Chopra, I. Basic Understanding of Airfoil Characteristics at Low Reynolds Numbers (104–105). J. Aircr. 2018, 55, 1050–1061. [Google Scholar] [CrossRef]
  22. Błoński, D.; Strzelecka, K.; Kudela, H. Vortex Trapping Cavity on Airfoil: High-Order Penalized Vortex Method Numerical Simulation and Water Tunnel Experimental Investigation. Energies 2021, 14, 8402. [Google Scholar] [CrossRef]
  23. Ploumhans, P.; Winckelmans, G.S. Vortex methods for high-resolution simulations of viscous flow past bluff bodies of general geometry. J. Comput. Phys. 2000, 165, 354–406. [Google Scholar] [CrossRef]
  24. Drela, M. XFOIL: An analysis and design system for low Reynolds number airfoils. In Low Reynolds Number Aerodynamics, Proceedings of the Conference, Notre Dame, IN, USA, 5–7 June 1989; University of Notre Dame: Notre Dame, IN, USA, 1989; Volume 54, pp. 1–12. [Google Scholar]
  25. XFOIL. Available online: https://web.mit.edu/drela/Public/web/xfoil/ (accessed on 22 September 2022).
  26. Jonkman, J.; Butterfield, S.; Musial, W.; Scott, G. Definition of a 5-MW Reference Wind Turbine for Offshore System Development; Technical Report NREL/TP-500-38060; National Renewable Energy Lab. (NREL): Golden, CO, USA, 2009. [Google Scholar]
  27. Katz, J.; Plotkin, A. Low-Speed Aerodynamics; Cambridge University Press: Cambridge, UK, 2000. [Google Scholar]
  28. Noca, F.; Shiels, D.; Jeon, D. A comparison of methods for evaluating time-dependent fluid dynamic forces on bodies, using only velocity fields and their derivatives. J. Fluid. Struct. 1999, 13, 551–578. [Google Scholar] [CrossRef]
  29. Wu, C.-H.; Kopp, G.A. Two-dimensional vortex particle simulation of the separated flows induced by impulsively started cylinder. In Proceedings of the 14th Americas Conference on Wind Engineering, Lubbock, TX, USA, 17–19 May 2022. [Google Scholar]
  30. Rae, W.H., Jr.; Pope, A. Low-Speed Wind Tunnel Testing, 2nd ed.; Wiley: New York, NY, USA, 1984; Volume 176, pp. 344–444. [Google Scholar]
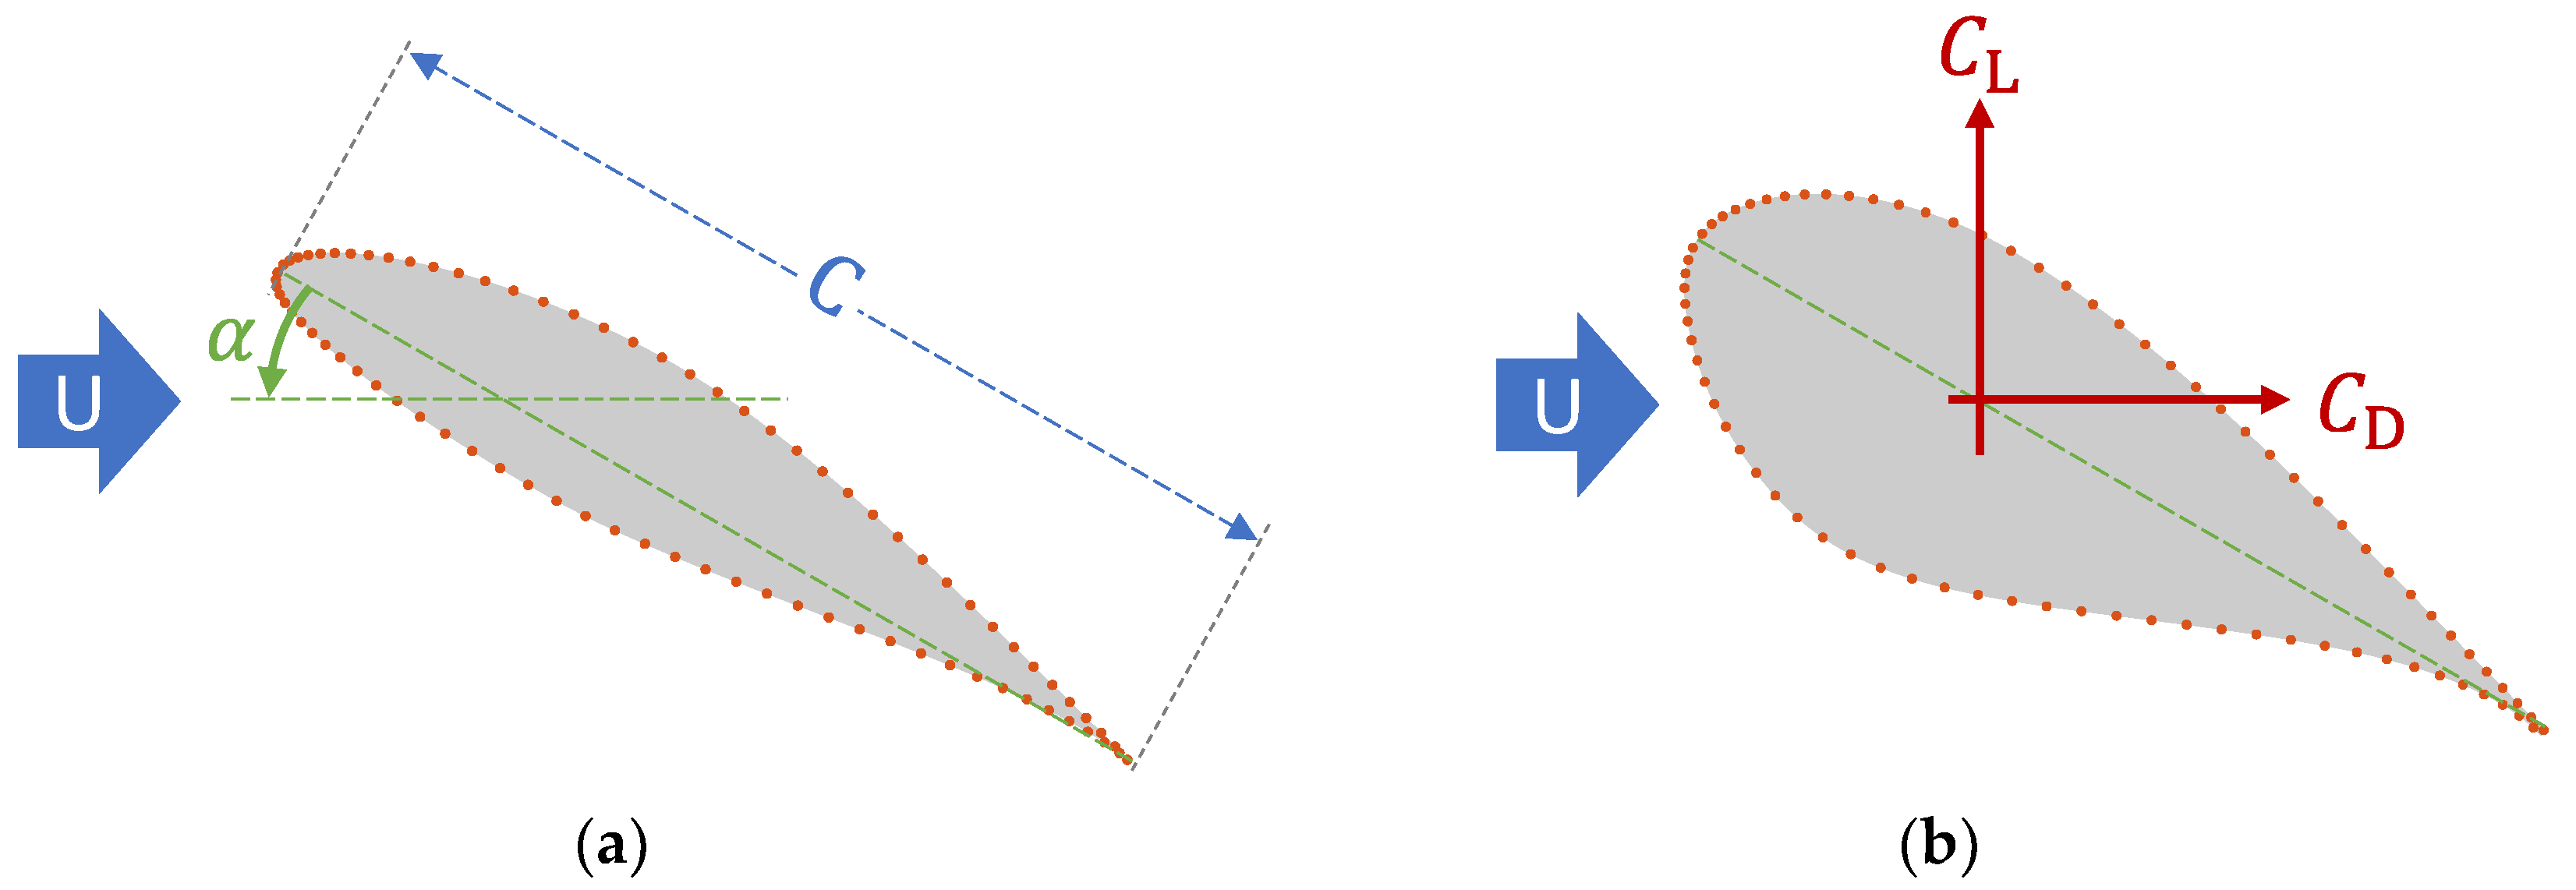
Figure 1. Airfoils studied in this work: (a) NACA64 and (b) DU40. The dots on the airfoil surface represent the edges of the surface panels.
Applsci 13 01478 g001
Figure 2. Schematic description of the vortex particles initialized on the varying-sized grid for ReC = 500: (a) Entire domain. (b) Close view of particles near the airfoil.
Applsci 13 01478 g002
Figure 3. Time evolutions of flow quantities: (a) Numbers of particles used in simulations. (b) Lift force. (c) Drag force.
Applsci 13 01478 g003
Figure 4. Wind tunnel test setup for the airfoil aerodynamic force measurements.
Applsci 13 01478 g004
Figure 5. Segments of lift force coefficient time histories simulated using VPM for NACA64 at (a) α = 0 ° , ReC = 4000, (b) α = 10 ° , ReC = 4000, (c) α = 0 ° , ReC = 60,000, and (d) α = 10 ° , ReC = 60,000.
Applsci 13 01478 g005
Figure 6. Instantaneous fields of NACA64 airfoil at α = 0 ° . Vorticity: (a) ReC = 4000 and (b) ReC = 60,000. Velocity: (c) ReC = 4000 and (d) ReC = 60,000. Pressure coefficients, Cp: (e) ReC = 4000 and (f) ReC = 60,000. Steady-state simulation of boundary layer streamlines by XFOIL: (g) ReC = 4000 and (g) ReC = 60,000. Note: (a,c,e) correspond to the first red star in Figure 5a (Ut/C = 55.06) while (b,d,f) correspond to the first red star in Figure 5b (Ut/C = 11.68). For (eh), the associated mean force coefficients are attached on the right.
Applsci 13 01478 g006
Figure 7. Instantaneous distribution of surface pressure coefficient of NACA64 airfoil. For α = 0 ° , ReC = 4000, Ut/C = (a) 55.06, (b) 55.23, (c) 55.42, and (d) 55.57. For ReC = 60,000, Ut/C = (e) 11.684, (f) 11.89, (g) 12, and (h) 12.08. Note that the blue-colored symbols represent the upper surface while the red represents the lower surface.
Applsci 13 01478 g007
Figure 8. Instantaneous fields of NACA64 airfoil at α = 10 ° . Vorticity: (a) ReC = 4000 and (b) ReC = 60,000. Velocity: (c) ReC = 4000 and (d) ReC = 60,000. Pressure coefficients, Cp: (e) ReC = 4000 and (f) ReC = 60,000. Steady-state simulation of boundary layer streamlines by XFOIL: (g) ReC = 4000 and (g) ReC = 60,000. Note: (a,c,e) correspond to the first red star in Figure 4b (Ut/C = 51.26) while (b,d,f) correspond to the first red star in Figure 4d (Ut/C = 4.49). For (eh), the associated mean force coefficients are attached on the right. For (eh), the associated mean force coefficients are attached on the right.
Applsci 13 01478 g008
Figure 9. Instantaneous distribution of surface pressure coefficient of NACA64 airfoil. For α = 10°, ReC = 4000, Ut/C = (a) 51.26, (b) 51.365, (c) 51.665, and (d) 51.82. For ReC = 60,000, Ut/C = (e) 4.49, (f) 4.64, (g) 4.71, and (h) 4.82. Note that the blue-colored symbols represent the upper surface while the red represents the lower surface.
Applsci 13 01478 g009
Figure 10. Segments of lift force coefficient time histories of DU40 at (a) α = 0 ° , ReC = 4000, (b) α = 10 ° , ReC = 4000, (c) α = 0 ° , ReC = 60,000, and (d) α = 10 ° , ReC = 60,000.
Applsci 13 01478 g010
Figure 11. Instantaneous fields of DU40 airfoil at α = 0 ° . Vorticity: (a) ReC = 4000 and (b) ReC = 60,000. Velocity: (c) ReC = 4000 and (d) ReC = 60,000. Pressure coefficients, Cp: (e) ReC = 4000 and (f) ReC = 60,000. Steady-state simulation of boundary layer streamlines by XFOIL: (g) ReC = 4000 and (h) ReC = 60,000. Note: (a,c,e) correspond to the first red star in Figure 10a (Ut/C = 53.365) while (b,d,f) correspond to the first red star in Figure 10b (Ut/C = 3.396). For (eh), the associated mean force coefficients are attached on the right.
Applsci 13 01478 g011
Figure 12. Instantaneous fields of DU40 airfoil at α = 10 ° . Vorticity: (a) ReC = 4000 and (b) ReC = 60,000. Velocity: (c) ReC = 4000 and (d) ReC = 60,000. Pressure coefficients, Cp: (e) ReC = 4000 and (f) ReC = 60,000. Steady-state simulation of boundary layer streamlines by XFOIL: (g) ReC = 4000 and (h) ReC = 60,000. Note: (a,c,e) correspond to the first red star in Figure 9b (Ut/C = 59.315) while (b,d,f) correspond to the first red star in Figure 9d (Ut/C = 3.05). For (eh), the associated mean force coefficients are attached on the right.
Applsci 13 01478 g012
Figure 13. Instantaneous distribution of surface pressure coefficient of DU40 airfoil. For α = 0 ° , ReC = 4000 and Ut/C = (a) 56.365, (b) 56.775, (c) 57.115, and (d) 57.66. For α = 0 ° , ReC = 60,000 and Ut/C = (e) 3.396, (f) 3.472, (g) 3.608, and (h) 3.708. Note that the blue-colored symbols represent the upper surface while the red represents the lower surface.
Applsci 13 01478 g013
Figure 14. Instantaneous distribution of surface pressure coefficient of DU40 airfoil. For α = 10 ° , ReC = 4000 and Ut/C = (a) 59.315, (b) 59.58, (c) 60.035, and (d) 60.42. For α = 0 ° , ReC = 60,000 and Ut/C = (e) 3.048, (f) 3.146, (g) 3.36, and (h) 3.556. Note that the blue-colored symbols represent the upper surface while the red represents the lower surface.
Applsci 13 01478 g014aApplsci 13 01478 g014b
Figure 15. Time-averaged lift coefficients: (a) NACA64 and (b) DU40.
Applsci 13 01478 g015
Figure 16. Time-averaged drag coefficients: (a) NACA64 and (b) DU40.
Applsci 13 01478 g016
Figure 17. XFOIL simulations of surface pressures and forces at α = 10 ° and ReC = 4000, 60,000, 120,000, 240,000, 480,000, and 750,000: (a) Lift force coefficients. (b) Drag force coefficients. (c) NACA64 upper surface Cp. (d) NACA64 lower surface Cp. (e) DU40 upper surface Cp. (f) DU40 upper surface Cp.
Applsci 13 01478 g017aApplsci 13 01478 g017b
Table 1. Numerical setup in the vortex particle method (VPM).
Reynolds number, ReC400060,000
Time increment, Δ t (sec)0.0050.002
Particle spacing at the center of the airfoil, h   ( × 10 3 m ) 1.6 0.25
AirfoilsNACA64DU40NACA64DU40
Surface panel length, Δ S B ( × 10 3 m ) 0.7 ~ 3.4 0.6~1.80.4~1.70.32~0.9
Azimuthal division of the redistribution grid, Nm802449217
Control volume for integral force calculation, Equation (12)
Control volume limits in x-dir, [xmin, xmax] (m)[−0.8, 1.5]
Control volume limits in y-dir, [ymin, ymax] (m)[−1.2, 1.2]
Eulerian grid for pressure Poisson solution, Equation (13)
Domain limits in x-dir, [xmin, xmax] (m)[−1.5, 5][−0.8, 1.3]
Domain limits in y-dir, [ymin, ymax] (m)[–3, 3][−0.8, 0.8]
Grid spacing, Δ s G ( × 10 3 m ) 1.60.26
Disclaimer/Publisher’s Note: The statements, opinions and data contained in all publications are solely those of the individual author(s) and contributor(s) and not of MDPI and/or the editor(s). MDPI and/or the editor(s) disclaim responsibility for any injury to people or property resulting from any ideas, methods, instructions or products referred to in the content.