Article

Characterization of Pyrolysis Products of Forest Residues and Refuse-Derived Fuel and Evaluation of Their Suitability as Bioenergy Sources

by
Despina Vamvuka
1,*,
Katerina Esser
1 and
Dimitrios Marinakis
2
1
School of Mineral Resources Engineering, Technical University of Crete, 73100 Chania, Greece
2
School of Mineral Resources Engineering, University of Western Macedonia, 53100 Florina, Greece
*
Author to whom correspondence should be addressed.
Appl. Sci. 2023, 13(3), 1482; https://doi.org/10.3390/app13031482
Submission received: 12 December 2022 / Revised: 5 January 2023 / Accepted: 14 January 2023 / Published: 22 January 2023

Abstract

:
The products generated from a fixed bed pyrolysis unit of solid waste materials were quantitatively characterized, and their energy potential was determined, in order to evaluate their suitability as energy sources. An elemental analyzer, a bomb calorimeter, an X-ray fluorescence spectrometer, a Couette viscometer and a TG-MS (thermogravimetric-mass spectrometry) analyzer were employed for the measurements. Biochars obtained at 450 °C were enriched in carbon; their calorific value was high (20–39 MJ/kg) and exceeded that of raw materials. These biochars can be utilized for energy production, preferably at temperatures below 1000 °C, to avoid slagging/fouling phenomena. The bio-oils of pinecones and forest residue obtained at 450 °C, with a density of 0.93–0.94 kg/m3, a pH of 2.1–3, a dynamic viscosity of 1.5–7 cP and a calorific value of 22–27 MJ/kg, were superior to typical flash pyrolysis oil and could be used in static applications for heat or electricity generation after a de-oxygenation process. The quality of RDF bio-oil was lower. The higher heating value of gases from pinecones and RDF fuels at 450 °C was satisfactory for the energy requirements of the process (13.6–13.8 MJ/m3); however, that of forest residue gas was moderately low.

1. Introduction

The current global energy and climate crisis demands an increased share of renewable sources. Biomass materials, which account for about 15% of the world’s energy supply, are widespread in most countries, are low in cost and reduce greenhouse gas emissions, in line with the European Union directives for decarbonized energy by 2050. Furthermore, the European Union’s Waste Framework Directive has set the management hierarchy for the recycling and reuse of waste, such as municipal waste, due to environmental restrictions, limited landfill sites and high cost [1].
Among thermochemical processes, pyrolysis is a promising solution for the reduction of the volume of waste material, destroying its hazardous constituents and allowing the recovery of energy and added-value products [2]. Biochar, the solid pyrolysis product, can be used not only for soil amelioration, improving its physicochemical and biological properties while sequestrating carbon and restoring contaminated soil and water, but also for heat and power generation, or tar-free fuel gas production [3,4,5,6]. The liquid pyrolysis product, bio-oil, can be utilized as a source of special chemicals, or in energy appliances such as boilers, engines or turbines [7,8]. The gaseous pyrolysis product, consisting of H2, CO, CO2 and light hydrocarbons, can be used to dry the biomass feedstock and supply the heat for the pyrolysis process [4,8].
Many studies have been carried out to assess the properties of various biochars for soil amendment and active carbon applications [4,5,9,10,11,12]. The properties of biochars are directly affected by the type of feedstock used and the pyrolysis operating conditions, especially temperature. The majority of previous studies focused on biochars derived from agricultural waste, such as rice straw, sugarcane bagasse, empty fruit bunches, corn residues, etc. [4,13,14,15,16], and only a few focused on forest waste [17,18]. The characterization of biochars for their evaluation as energy sources was conducted by proximate and ultimate analyses, calorific value, specific surface area and pore volume, Fourier transform infrared (FTIR), scanning electron microscopy (SEM) and X-ray diffraction (XRD) measurements.
Many different chromatographic and spectroscopic techniques have also been used to characterize bio-oils from a variety of species [4,8,17,19,20]. Gas chromatography–mass spectrometry (GC/MS) analysis was carried out to identify the individual chemical compounds in bio-oils produced from fast pyrolysis of woody biomasses at 500 °C. Several carbohydrates were detected [17]. A FTIR spectrometer was used to characterize various functional groups found in the bio-oil produced from the pyrolysis of date palm stones at 500 °C. The FTIR spectrum showed that the obtained bio-oil was composed of several functional groups belonging to various families of organic groups, namely aliphatic groups, oxygenated fractions and aromatic groups. The chemical composition of the bio-oil was determined by liquid column chromatography fractionation. [19]. The characterization of sugarcane bagasse bio-oil produced from semi-batch pyrolysis experiments at 500 °C was performed by FTIR, GC/MS and nuclear magnetic resonance (NMR) spectroscopy. It was found to consist of a complex mixture of chemical compounds, including acids, alcohols, aldehydes, furfural, furan, phenols and some aromatics [4,20]. Meanwhile, the characterization of bio-oil produced from the pyrolysis of sawdust at 500 °C was performed using 1H and 13CNMR, FTIR and GC/MS analysis techniques. These analyses showed that the bio-oil was a reservoir of oxygenated and highly functionalized chemical compounds, such as phenols, ketones, alcohols, nitrogen-containing compounds, cyclic ethers, aromatic compounds, acids, halides, aldehydes, hydrocarbons, furan and esters [8]. GC/MS and FTIR analyses of bio-oil produced from empty palm fruit bunches showed that it contained esters, nonane, acids and phenols [13]. The oil phase from the co-pyrolysis of different refuse-derived fuel (RDF) samples in a rotary kiln reactor at 500 °C consisted of n-aliphatic, branched aliphatic compounds and primary alcohols [21].
Very few investigations have analyzed the physicochemical features of bio-oils from forest waste. In one study, the physical properties of bio-oils produced from pitch pine and Japanese cedar using fast pyrolysis at 500 °C, including pH, water content and viscosity, as well as elemental analysis and calorific value, were found to be similar regardless of feedstock. These bio-oils were acidic (pH = 2.4–2.5), had water contents of 20–24%, and their heating value was determined to be 18–19 MJ/kg [17]. In another study, a fast pyrolysis bio-oil, produced at 450 °C from softwood sawmill residues in a pilot-scale auger reactor, was distilled in an advanced distillation curve apparatus at atmospheric pressure and at a vacuum of 5 kPa, and a thermodynamic model was used to predict its bulk physicochemical properties. The density of oil was 1.2 g/mL, the water content was 23.7%, the solid content was 3.75%, the kinematic viscosity at 40 °C was 18.1 cSt and the gross heat of combustion was 18.2 MJ/kg [22]. Some studies have examined the catalytic pyrolysis of forest residues using CaO, MgO, alkali carbonates, zeolites, bauxite ores and marble dust to improve the quality of the bio-oil in terms of oxygen content [23,24].
With regard to the gases evolved during the pyrolysis of sawdust and various agricultural residues, including rice husk, date seeds, banana peel and coffee residues [8,25,26,27,28,29], GC, TG/MS or TG/FTIR analysis techniques were employed, mainly for qualitative measurements and to identify the evolution pathway/mechanism. Analyses of gaseous components from forest residues are rare. The effect of alkali and alkaline metals on gas formation behavior during the pyrolysis of pinewood was examined. It was observed that alkali metals enhanced gas yield at low temperatures, while they reduced it at high temperatures [30].
Forest and organic waste materials are generated in vast quantities around the world. The availability of energy from forest waste could range from 10 to 16 EJ/y globally, while that from municipal solid waste (MSW) could vary from 1 to 3 EJ/y, depending on the composition, consumption pattern and economic development. In Greece, about 1.7 Mt of forest waste and 3.5 Mt of MSW are produced annually [31]. Woody residues from forests, with very low ash content and high calorific value, could be very useful for the production of biofuels [32]. MSW, on the other hand, with its diverse composition and problematic elements in the ash produced, creates technical and environmental barriers [33,34], and requires a detailed study of its properties and uses in order to accelerate its promotion in the energy sector.
As discussed above, there is limited research on the physical and chemical properties of all solid, liquid and gaseous pyrolysis products as a function of temperature, particularly in reference to forest residues and MSW, and there is lack of information on the pyrolysis products of RDF from municipal solid waste fractions. Accordingly, the present work aimed to quantitatively characterize the products generated from fixed bed pyrolysis of selected forest waste and RDF, to determine their energy potential and to predict the slagging/fouling propensities of the ash they produce, in order to evaluate their suitability as energy sources. Various techniques, such as elemental analysis, bomb calorimetry, X-ray fluorescence spectrometry, Couette viscometry and TG-MS (thermogravimetric-mass spectrometry), were employed for the quantitative measurements. The study focused on the above properties, which are important from an engineering point of view, in line with the applied sciences, rather than chemical instrumental analyses.

2. Materials and Methods

2.1. Materials and Characterization

The biomass materials investigated were a forest residue (FOR) and pinecones (PCO) collected from local forests in West Crete and refused derived fuel (RDF) provided from a solid waste management enterprise in the Chania area of Crete. The RDF sample was free of glass and metals, which were removed by industrial crushing, sieving and magnetic separation prior to being pelletized. Its average composition was 49% organic materials, 31% paper, 12% leather and wood waste and 8% inert and other materials. After air drying, materials were separated in a mechanical splitter and ground in a Fritsch Pulverizette 15 cutting mill to a final particle size of less than 1 mm. Representative samples were ground to a particle size of less than 250 μm and characterized according to the European Standard CEN/TC335 [35] in terms of proximate analysis (using programmable laboratory furnaces), ultimate analysis (using a Flash 2000, Thermo-Scientific, MA, USA, CHNS analyzer) and higher heating value (using an AC-300, Leco, MI, USA, calorimeter).
Chemical analysis of the ash to identify its major inorganic elements was conducted using a S2 Ranger/EDS (Bruker AXS, Karlsruhe, Germany) X-ray fluorescence spectrometer (XRF). In order to predict the ash deposition tendency in boilers during the utilization of the waste materials studied for energy production, the following slagging and fouling indices were calculated based on their wide acceptance for decision-making when combined with pilot plant testing.
The alkali index (AI) expresses the amount of alkali oxides in the sample per unit of energy [36]:
AI = kg (K2O + Na2O)/GJ
When AI > 0.34 kg/GJ, deposition tendency is high, while when AI = 0.17–0.34 kg/GJ, deposition tendency is low.
The base-to-acid ratio (B/A) is defined as:
B/A = (Fe2O3 + CaO + MgO + K2O + Na2O)/(SiO2 + TiO2 + Al2O3)
When B/A > 0.5, deposition tendency is high; when 0.5 < B/A < 1, deposition tendency is medium; while when B/A < 0.5, deposition tendency is low.
The Babcock index (Rs) is expressed as [37]:
Rs = (B/A) S
When Rs > 2, deposition tendency is high; when 0.6 < Rs < 2, deposition tendency is medium; while when Rs < 0.6, deposition tendency is low.
The slag viscosity index (Sv) is calculated by the equation:
Sv = SiO2 × 100/(SiO2 + Fe2O3 + CaO + MgO)
If Sv < 65, slagging tendency is high; if 65 < Sv < 72, slagging tendency is medium; while if Sv > 72, slagging tendency is low.

2.2. Experimental Procedure of Pyrolysis Tests

Pyrolysis experiments were performed in a high-temperature fixed bed unit (H = 140 mm, ID = 70 mm) consisting of a stainless steel reactor surrounded by a furnace, thermocouple and temperature controller, inlet and outlet gas tubes with flow controllers and cooling of products in ice baths (Figure 1). After placing approximately 20 g of the sample on a cylindrical mesh supported by a rod, the reactor was sealed and placed in the furnace. Nitrogen at a flow rate of 200 mL/min flushed the system for 30 min to purge air, and the furnace was set to the pre-determined temperature, which varied between 350 °C and 550 °C, at a heating rate of 10 °C/min and with a retention time of 30 min at the final temperature. Condensable volatiles were continuously collected in two ice-cooled baths (temperature 15–10 °C). Following system cooling with nitrogen, a mass balance was performed weighing solid and liquid products, and the biochar was stored for further analysis, while the bio-oil was collected after centrifugation of liquid products at 6000 rpm for 20 min and analyzed.

2.3. Characterization of Pyrolysis Products

The solid products of the pyrolysis process were characterized in accordance with the European Standard as above to determine organic matter, ash content, elemental composition and calorific value, and the slagging/fouling indices were calculated.
For the liquid products of the pyrolysis process, physicochemical properties, such as density, viscosity and pH, were measured, and elemental analysis was conducted using the CHNS analyzer previously mentioned. The ASTM Standard 1298 [38] was adopted for measurement of the density of the oils using a 1 mL micropipette and a high-accuracy analytical balance. For pH measurement, a bench Mettler Toledo pH-meter was used. A Grace M3500 Couette-type viscometer with an R1-B1-F1 configuration was used to determine the dynamic viscosity of the bio-oils. This type of viscometer consists of an outer cylinder that rotates at predefined speeds, producing flow and creating torque on a static concentric inner cylinder, which is connected to the sensing unit with a spindle. The major advantage of this viscometer is the absence of turbulent flow on low-viscosity fluids at high shear. The gap between the inner and the outer cylinders was adjusted to 1 mm. Each sample was transferred to a 50 mL beaker (filled to the brim) and the viscometer cylinders were then lowered into the beaker. The outer cylinder was then started at a rotation speed of 100 rpm for 1 min, in order to effectively mix the sample and remove any gas bubbles that may have been trapped between the two cylinders. After the mixing time, the outer cylinder was set to subsequent rotational speeds of 3, 6, 100, 200, 300 and 600 rpm, with 1 min duration for each step, at a constant temperature of 50 °C, and measurements of the shear stress and shear velocity were taken every 10 s. The shear stress versus shear velocity data for each sample were plotted on rheograms to verify the Newtonian flow behavior, and the viscosity was calculated by fitting the data to the Newtonian flow model (straight line) via a regression technique and subsequently computing the line slope.
The higher heating value of the bio-oils was calculated according to the equation [39]:
H H V b i o o i l = 0.3383 C + 1.422 ( H O 8 )
In order to characterize the gaseous products of the pyrolysis process, the biomass materials were also pyrolyzed in a PerkinElmer TG/DTG thermal analyzer (accuracy 0.2%wt, sensitivity < 5 μg, temperature precision ± 2 °C) coupled online with a Balzers MS QME-200 quadrupole mass spectrometer. High-purity Ar at a flow rate of 35 mL/min was used for the tests, which were carried out at up to 550 °C, at a heating rate of 10 °C/min. Product gases were transferred to the MS through a fused silicon capillary line insulated and heated to 200 °C to prevent condensation. The ions, separated according to their mass-to-charge ratio, were detected by a secondary electron multiplier (82 eV, 1–400 atomic mass), and data processing was performed using Pyris v3.5 (Perkin Elmer Int., Rotkreuz, Switzerland) and Quadstar 422 (Balzers, Zuerich, Switzerland) software. The mass-to-charge ratios (m/z) 2, 15, 18, 24–27, 28 and 44, corresponding to H2, CH4, H2O, C2-C3, CO and CO2, respectively, were continuously recorded by the MS and, for each m/z ratio, the intensity of fragments from other compounds was considered. For quantitative analysis, calibration tests were conducted, maintaining the same conditions as those employed during the pyrolysis experiments. Before the calibration procedure, it was confirmed that the MS signal was independent of the rise in temperature in the thermobalance unit and the heating rate applied, and that the flow of gases to the MS unit was stable. High-purity standard gases of known concentrations in argon were used to determine calibration factors. The calibration factors of H2O, CO and CO2 were also determined from the thermal decomposition of calcium oxalate monohydrate (CaC2O4.H2O), in order to check the performance of the system. The sample mass of this compound was varied to obtain a different mass range of the gaseous products, while the flow stability of the capillary response was confirmed.

3. Results

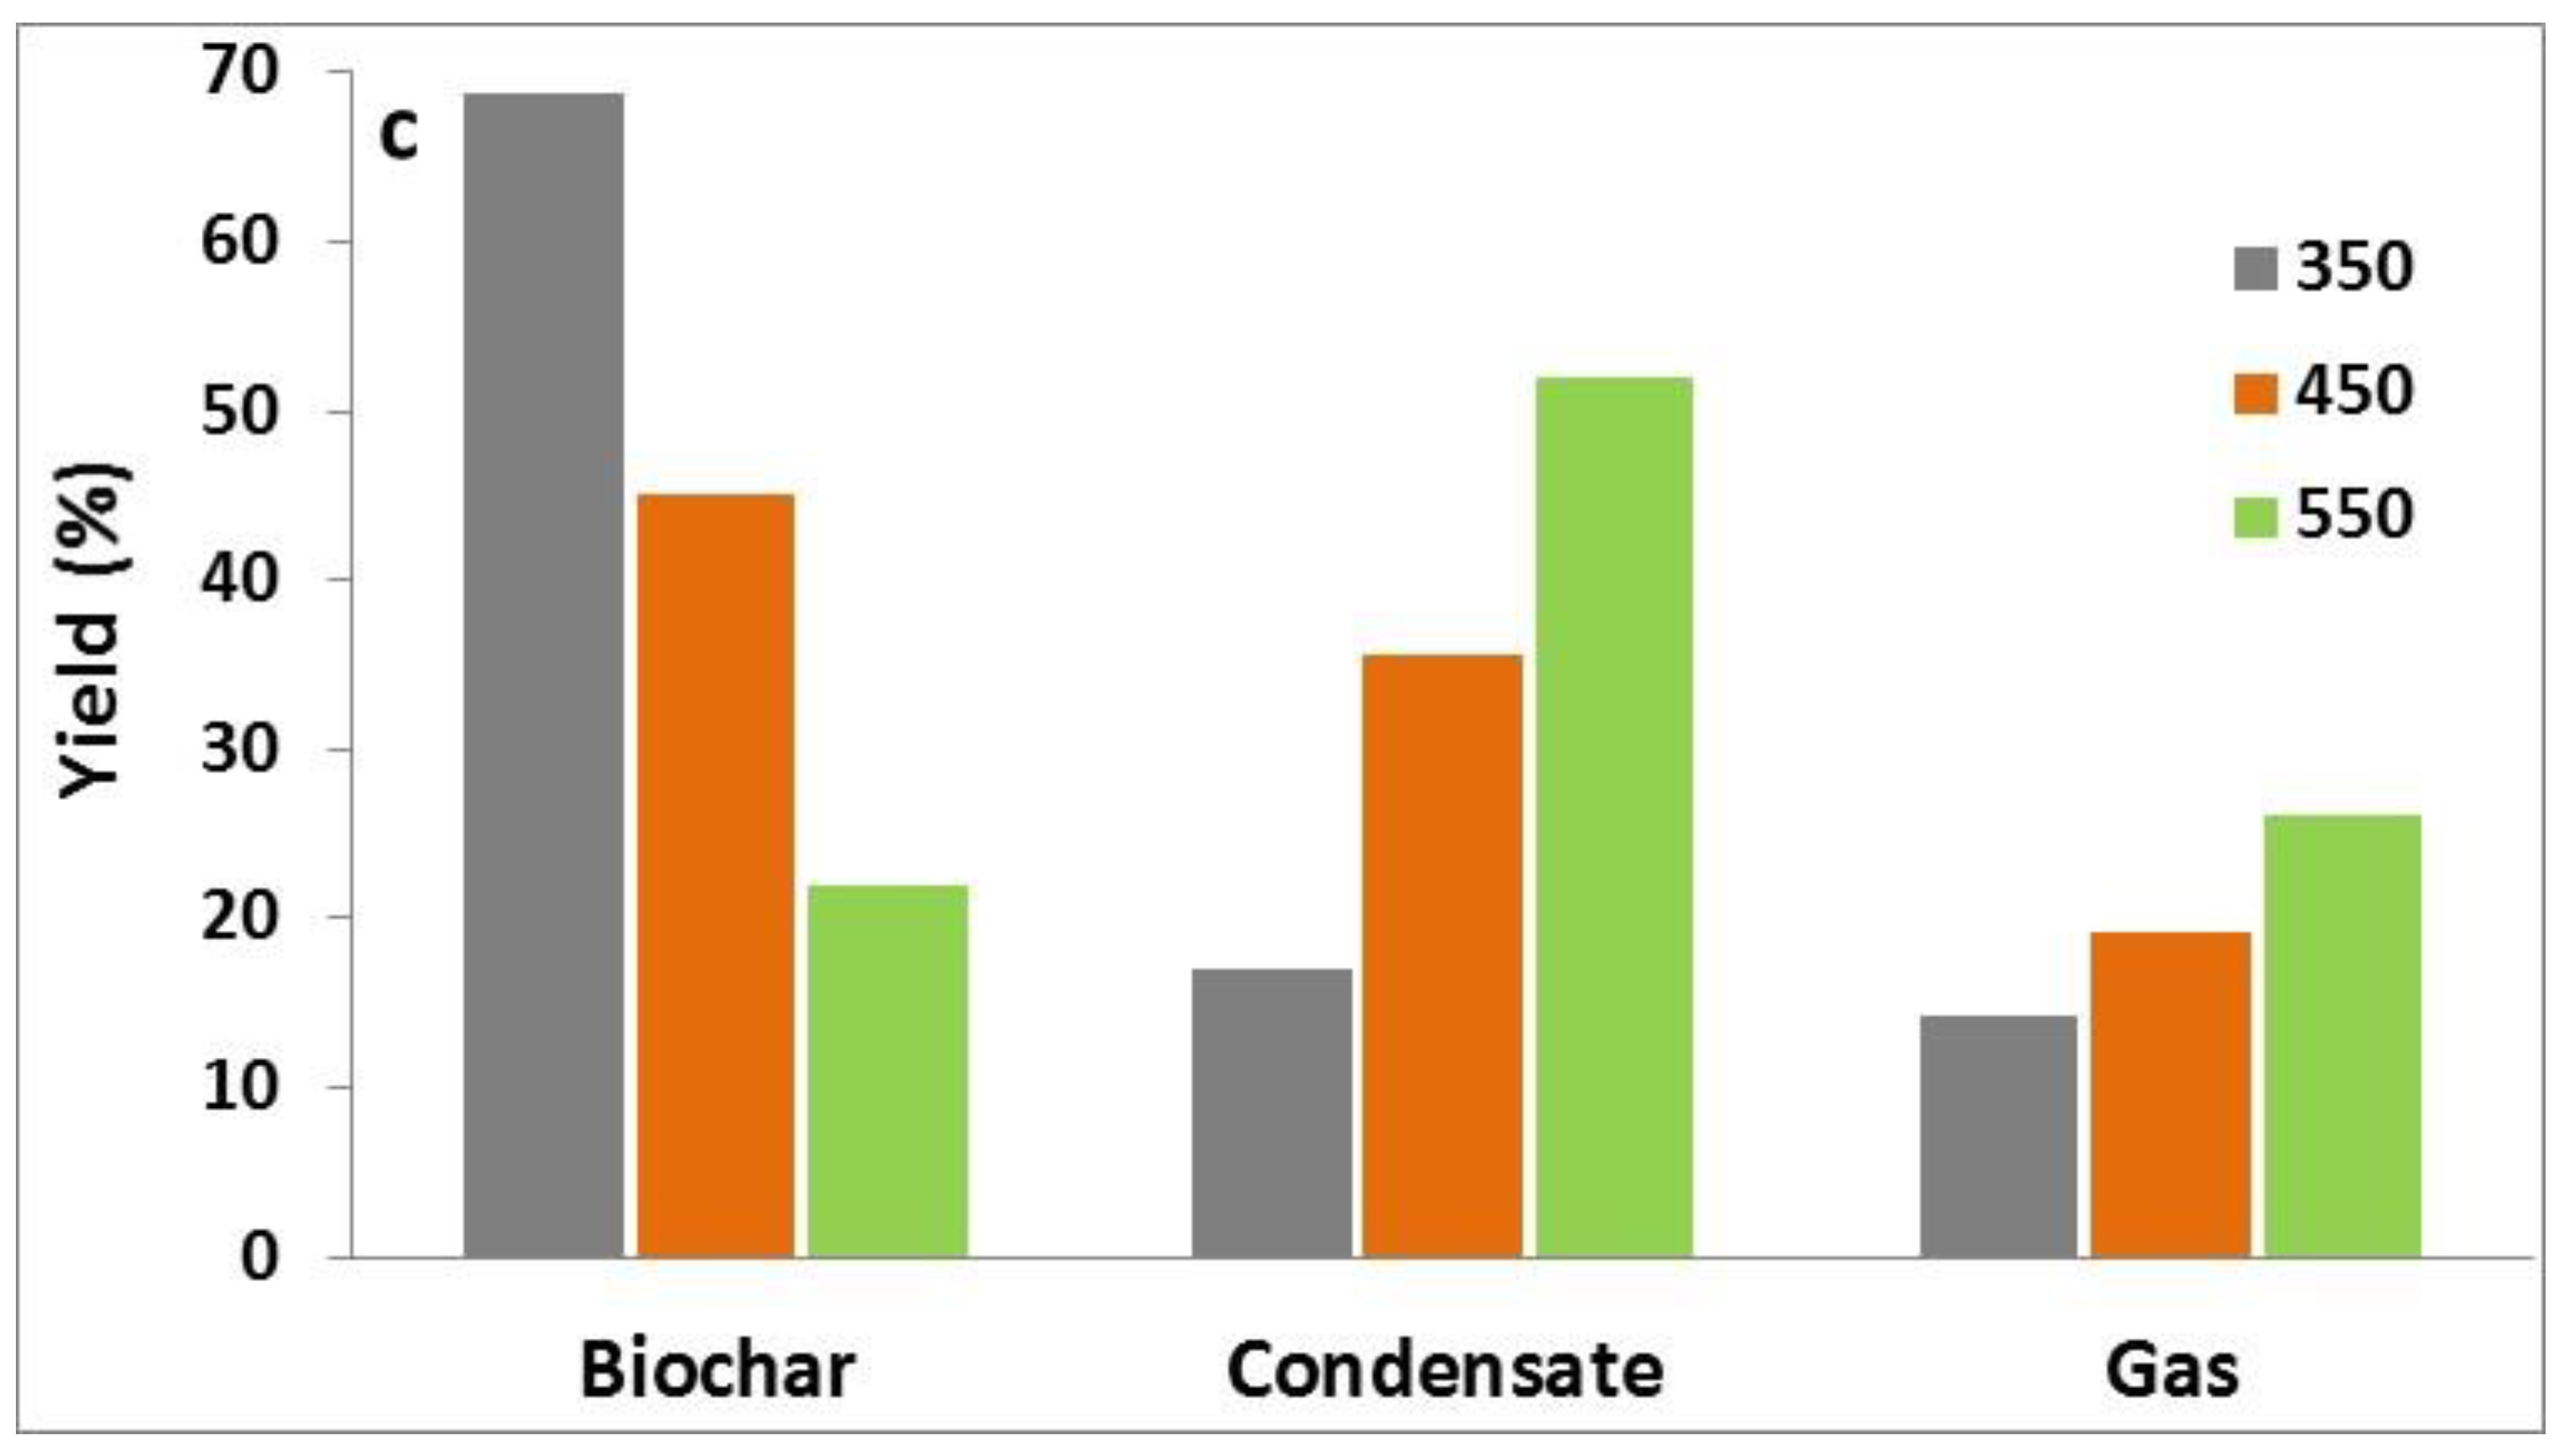
3.1. Characterization of Raw Materials and Product Yield

Table 1, presenting the proximate and ultimate analysis of raw materials, indicates that these were all rich in volatile matter, ranging between 77% and 85%, while each contained different amounts of ash, with FOR having 0.5% and RDF about 15%. Sulfur and Nitrogen contents of all fuels were very low to undetectable, implying insignificant toxic emissions during thermal treatment processes. The calorific value on a dry basis, which was related to the carbon, hydrogen, oxygen (dry ash free, daf) and ash concentrations of the fuels, was higher for the RDF material (~26 MJ/kg).
A comparison between the yield of pyrolysis products as a function of temperature is shown in Figure 2. When the temperature increased, the yield of biochar dropped, as more volatiles were produced due to the thermal decomposition of biomass materials. Figure 2 shows that the highest amounts of biochar, liquid condensates and gases were generated by RDF, FOR and RDF samples, respectively.

3.2. Solid Products—Biochars

The solid products of pyrolysis, biochars, were characterized using proximate and ultimate analysis, and the results are shown in Table 2. In comparison to raw biomass materials, it can be observed that, after the evolution of H- and O-bearing compounds by devolatilization, the solid materials were enriched in carbon and minerals (with the exception of RDF at higher temperatures). Although the concentration of hydrogen decreased, the oxygen concentration was also lowered, with the net result of an increase in the higher heating value, in this case with respect to raw fuels. Calorific values of biochars obtained from pyrolysis at up to 450 °C, ranging between 20 MJ/kg and 39 MJ/kg, were similar or even higher than those reported in the literature for other materials [8]. Moreover, the enrichment of carbon at the expense of hydrogen and oxygen during the pyrolysis process is known to enhance carbon stability and fuel hydrophobicity, which is advantageous for its transportation and storage [17,40]. However, Table 2 shows that when the temperature was ≥450 °C, the carbon content of FOR and RDF chars was reduced, suggesting its bounding in volatile species. The decrease in carbon content was reflected in the increase in oxygen concentration of the biochars. Thus, the higher heating value of these biochars dropped significantly and was lower than that corresponding to raw biomass fuels (15.2 MJ/kg vs. 17.3 MJ/kg for FOR and 11.1 MJ/kg vs. 26.3 MJ/kg for RDF).
The concentrations of the major inorganic elements in biochars produced at 450 °C, expressed as oxides, are shown in Figure 3, while the slagging/fouling indices calculated according to Equations (1)–(4) are compared in Table 3 (Rs has not been included because the content of S was undetectable). With reference to the B/A index, FOR and RDF biochars present a high deposition tendency due to the dominance of basic oxides in ash in relation to acidic ones. The relatively higher Si content of PCO biochar was responsible for its medium fouling propensity, as expressed by this index. The slag viscosity index Sv indicates that all biochar fuels presented a high deposition tendency; however, the opposite was true for the AI index, given the low percentages of K and Na in all biochar ashes.
The results in Table 2 and Table 3 suggest that all the biochar materials studied that were produced at temperatures of up to 450 °C and that had significant calorific value can be utilized for energy through combustion or gasification processes, especially those operated at temperatures below 1000 °C to avoid fouling/slagging phenomena.

3.3. Liquid Products–Bio-Oils

According to the previous results concerning the yield of solid, liquid and gaseous products of the pyrolysis process as a function of temperature, as well as the elemental analysis of biochars, it was decided to analyze the properties of bio-oils obtained at 450 °C. Table 4, which compares the properties of the current samples with those of heavy fuel oil and typical flash pyrolysis oil [31], shows that the densities of FOR and PCO were practically the same as that of heavy oil, while the density of RDF was similar to that of flash pyrolysis oil. The pH values of the bio-oils studied, ranging between 2.1 and 3.1, were close to the values of flash pyrolysis oil and within the range of literature data for other biomass materials [8,17,41,42]. The dynamic viscosities of FOR and PCO oils, which were measured at 1.5 cP and 7 cP, respectively, were lower than the values reported from flash pyrolysis of similar fuels at 500 °C, i.e., 26 cP and 10 cP, respectively. Meanwhile, the viscosity value of RDF oil was within the range of typical flash pyrolysis oil. This property of bio-oils is very important for the design and operation of fuel injection systems, as well as for the quality of combustion of the oil [43]. A lower viscosity enhances the fluidity of the oil and its combustion properties.
From the ultimate analysis of the bio-oils studied (Table 4), it can be seen that PCO and FOR bio-oils, with higher concentrations of carbon and hydrogen and lower concentrations of oxygen than the flash pyrolysis oil and, therefore, a higher calorific value, can be considered superior, while the quality of RDF bio-oil was somewhat lower.
Furthermore, although the high oxygen content of these oils is beneficial for catalytic steam reforming processes for hydrogen production [31], a mild catalytic deoxygenation process is required for them in order to substitute fuel oil in static applications such as boilers, engines and turbines. However, high-severity catalytic processes, which minimize the concentration of oxygen, are recommended for these oils to be utilized as transportation fuels [31,41].

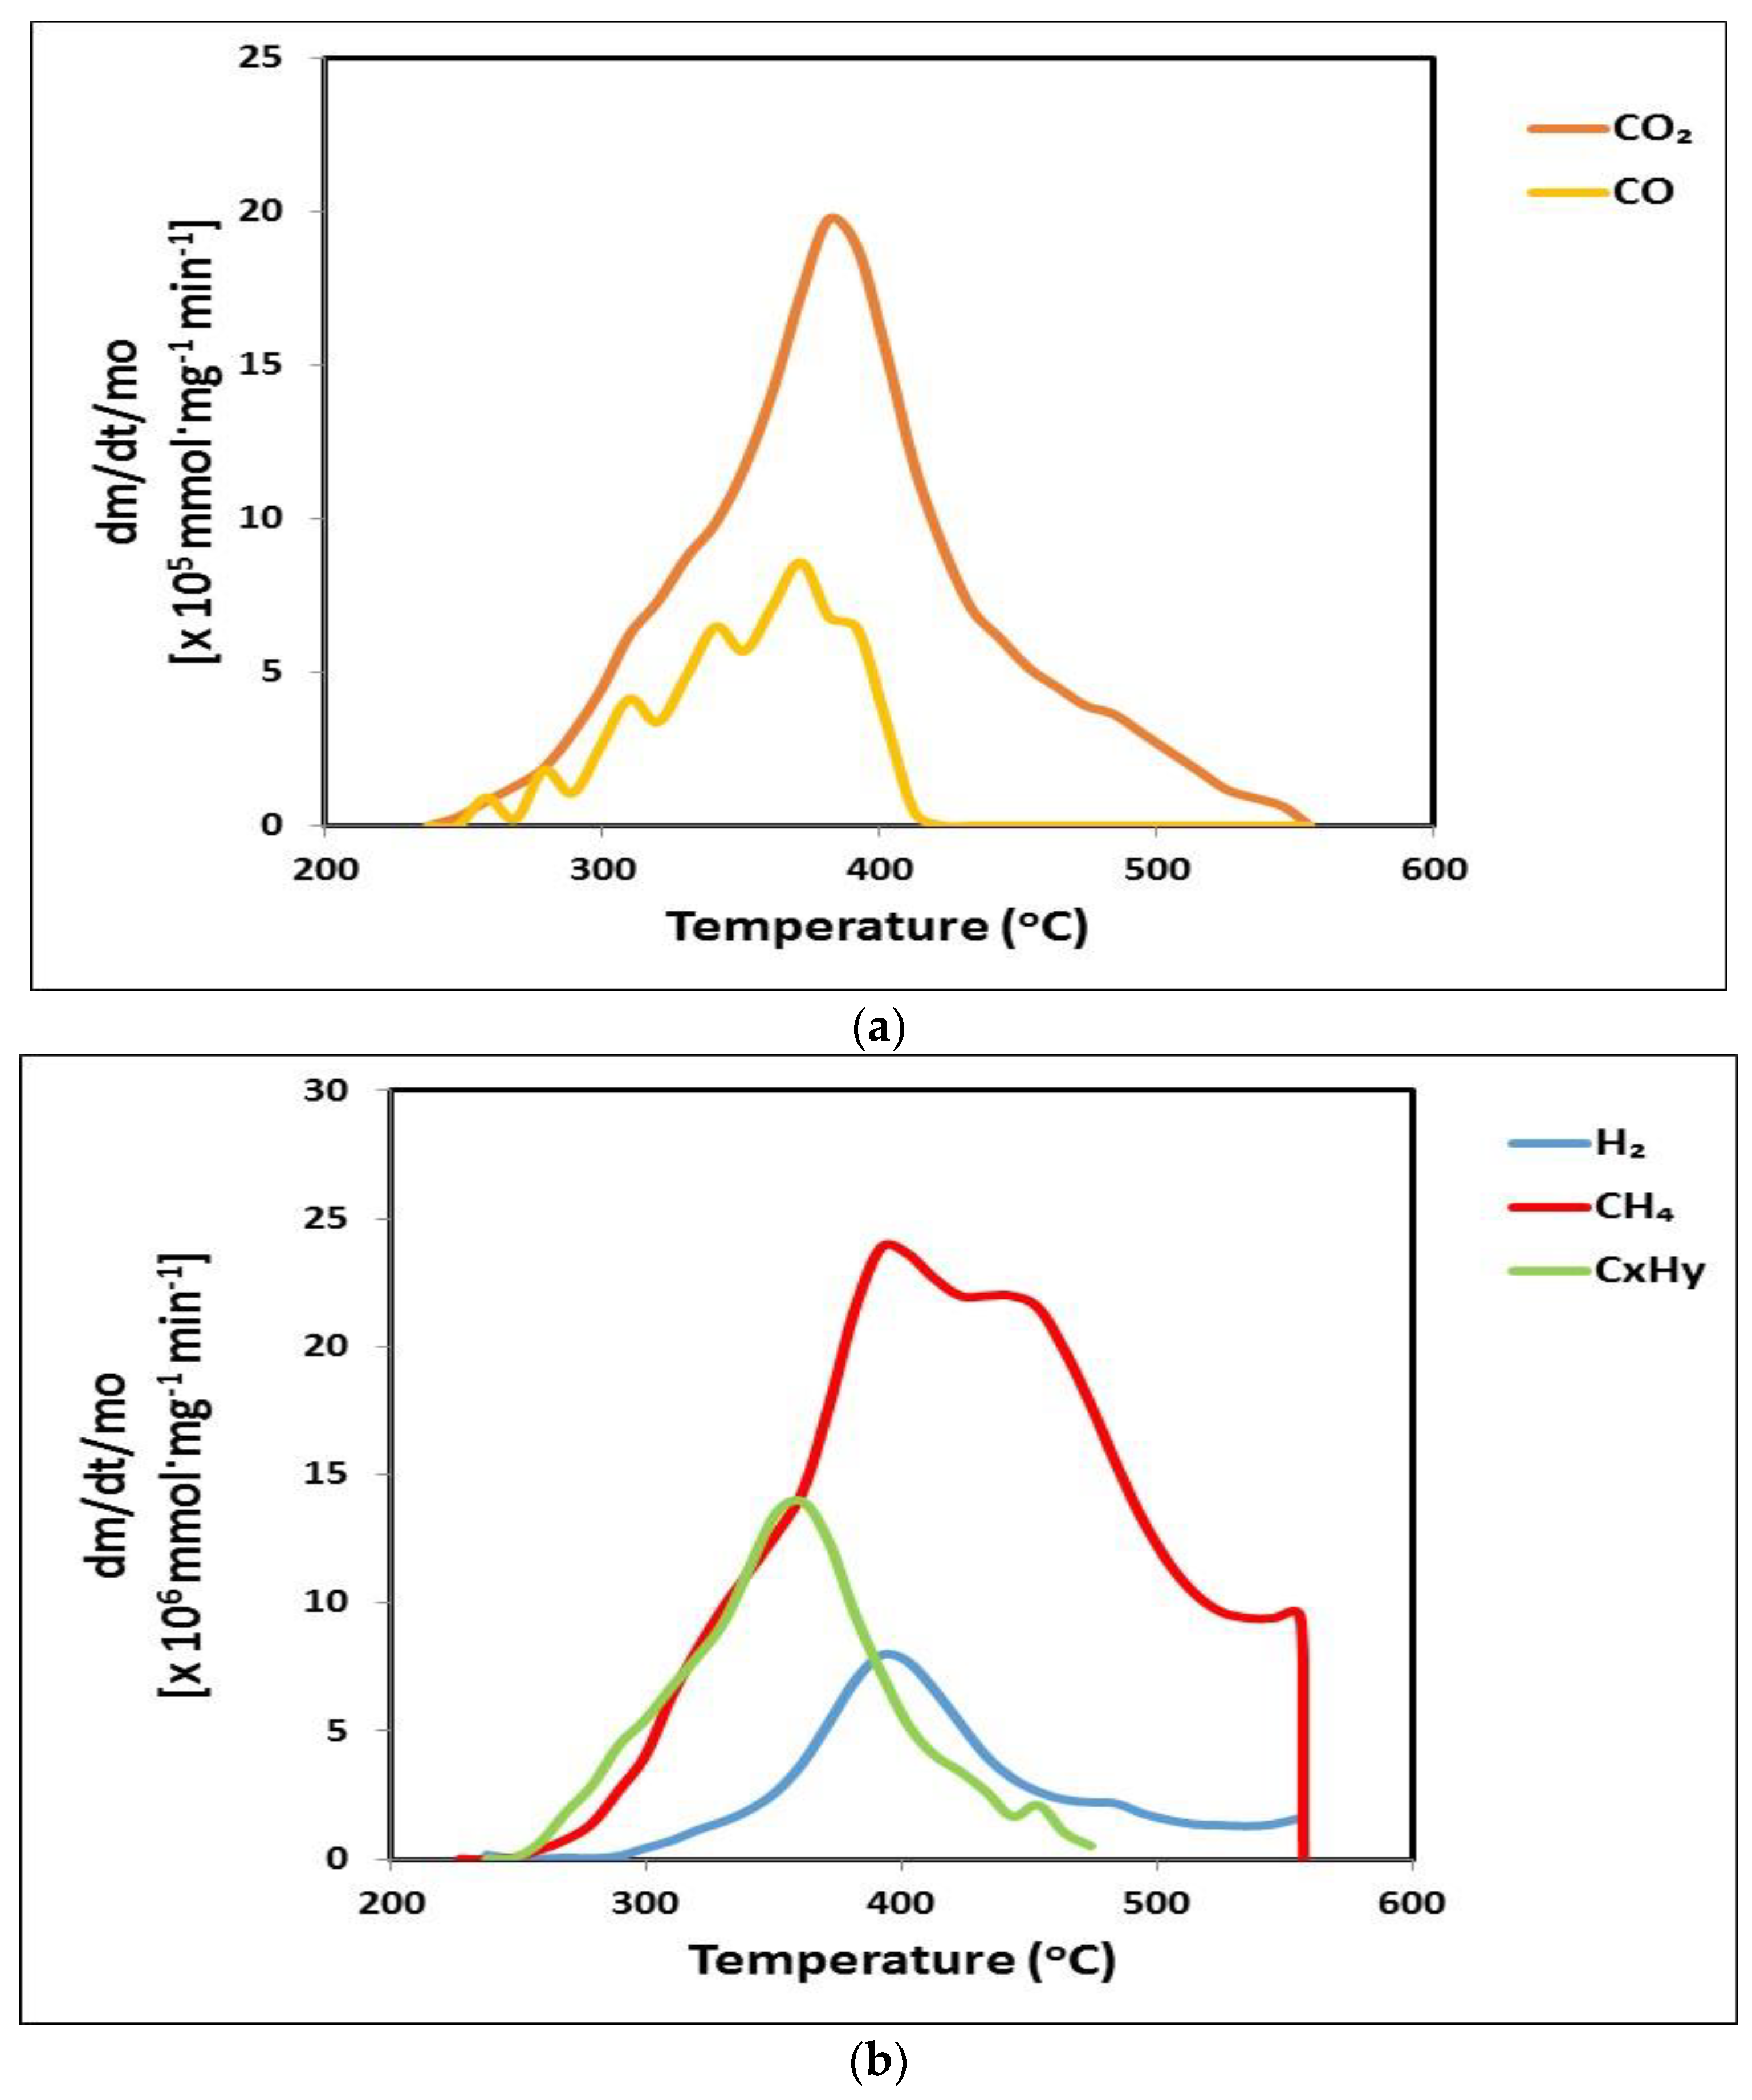
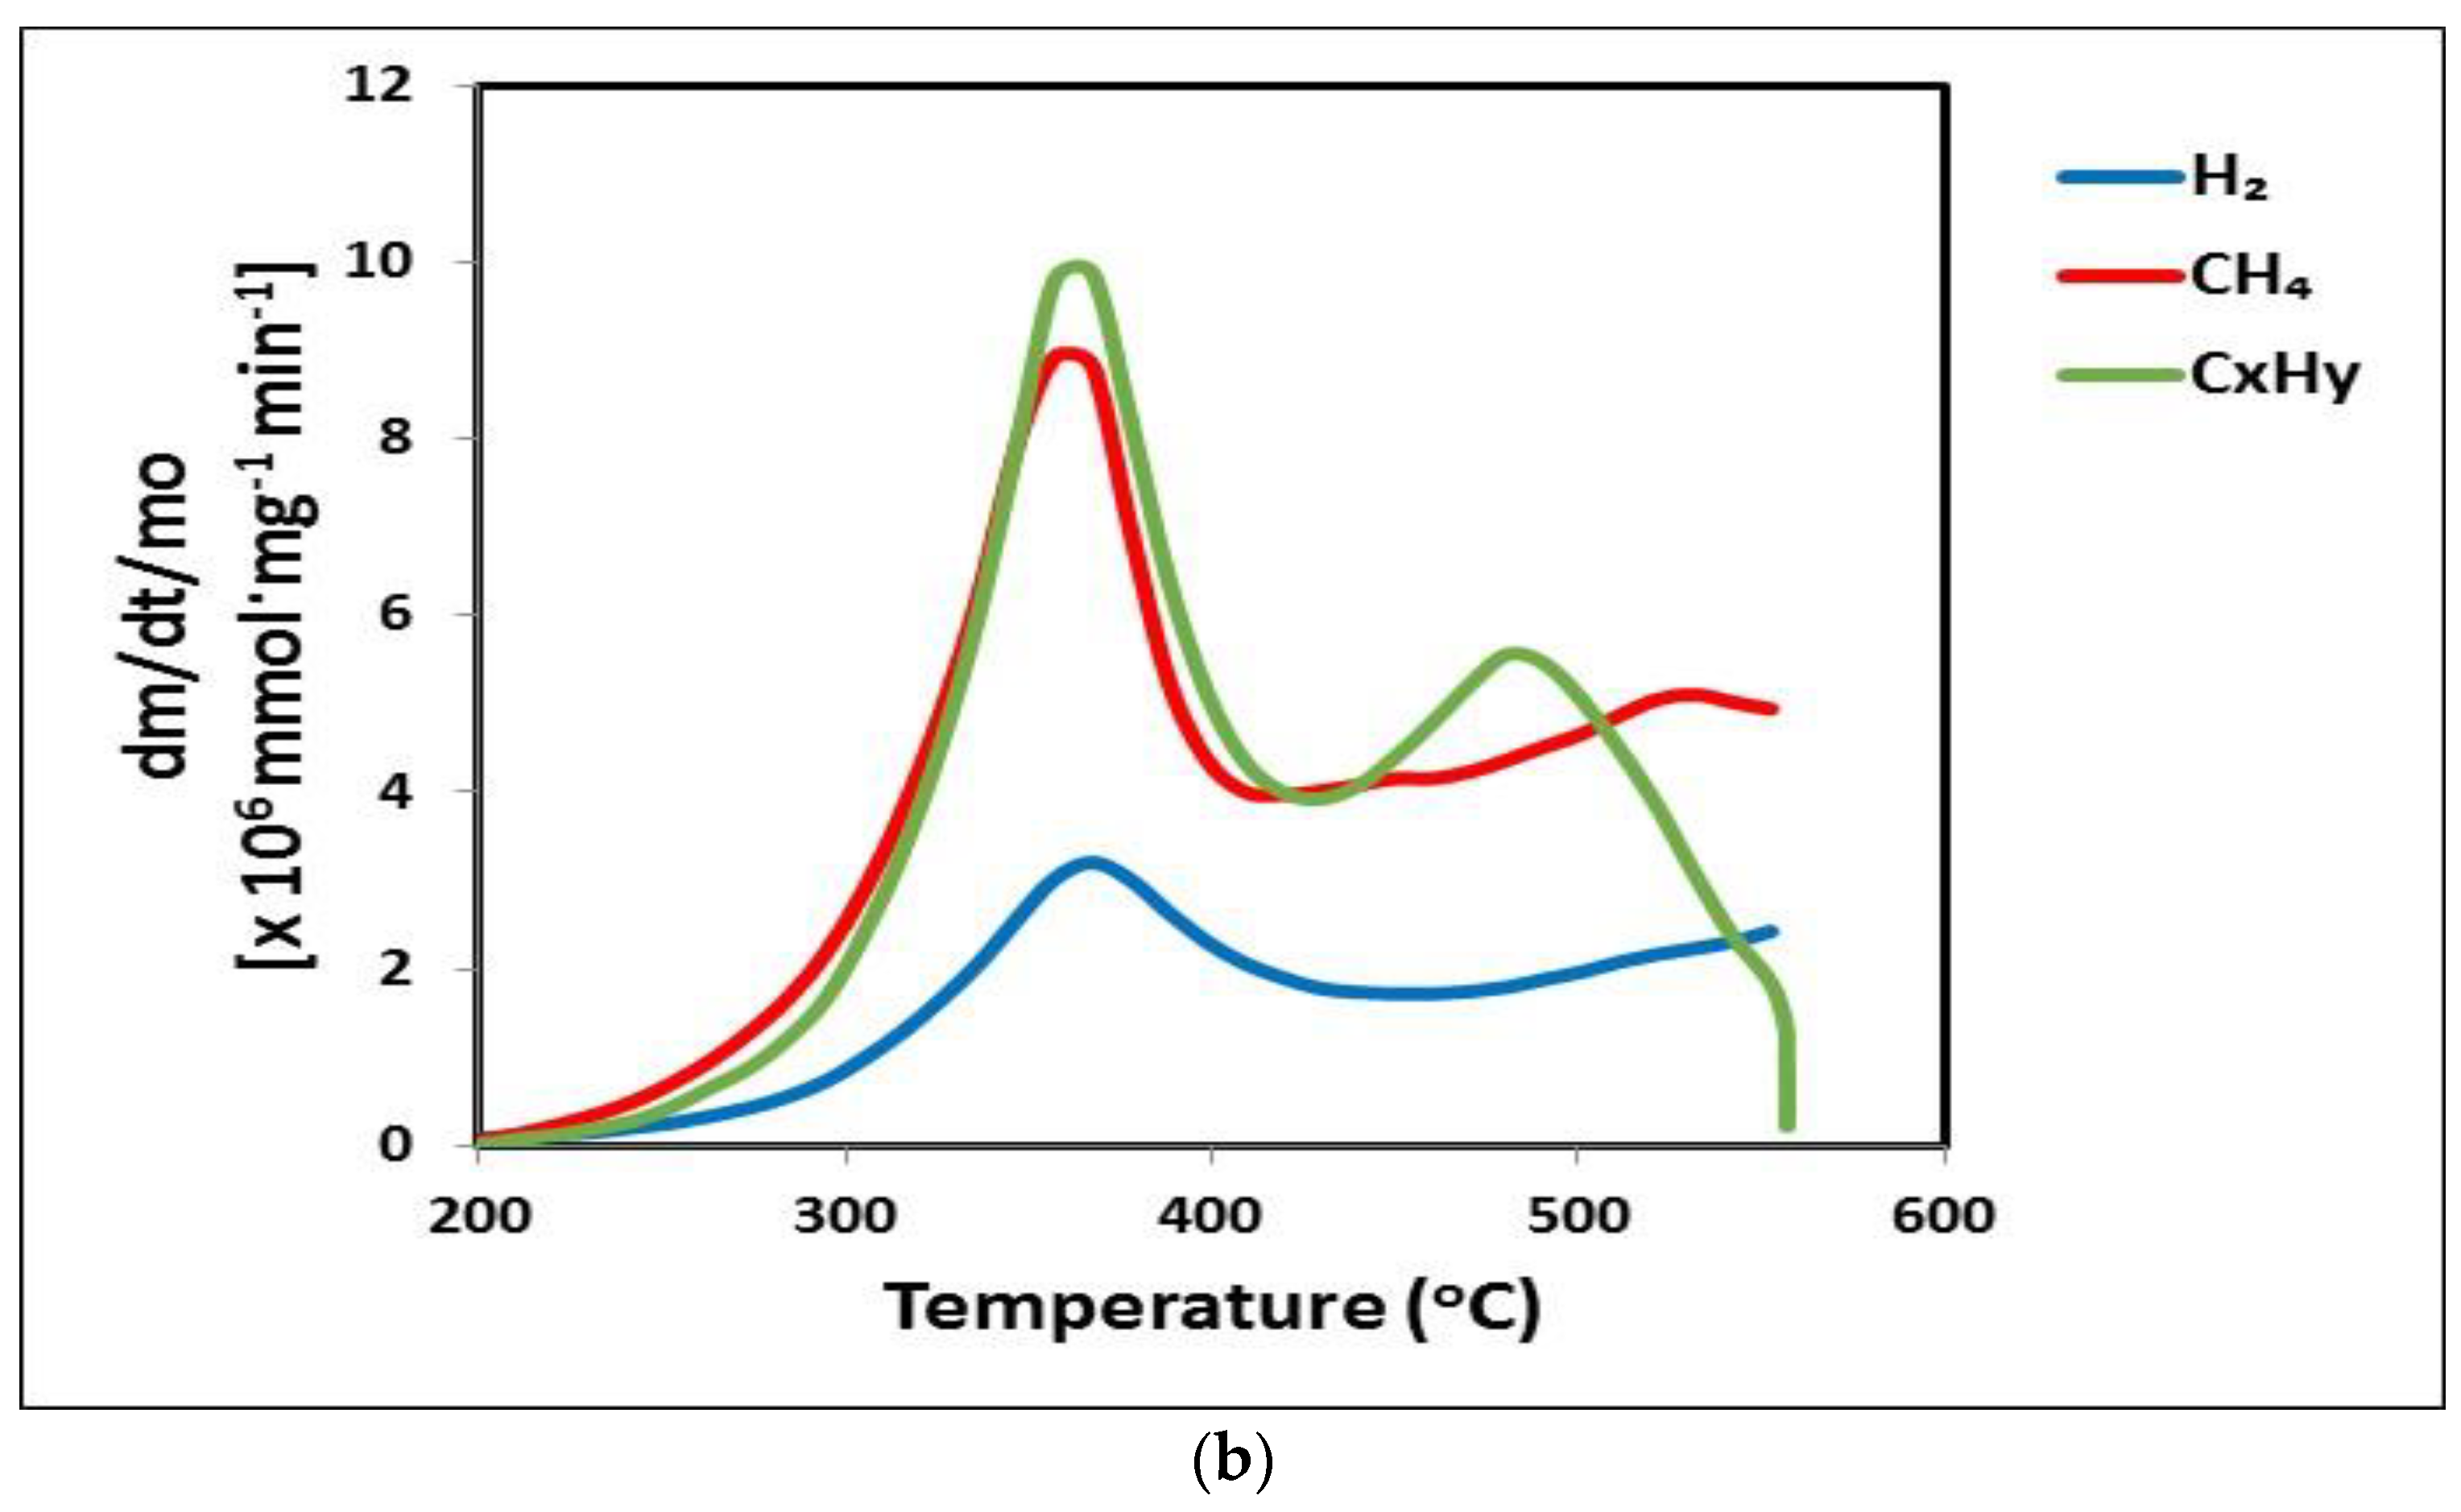
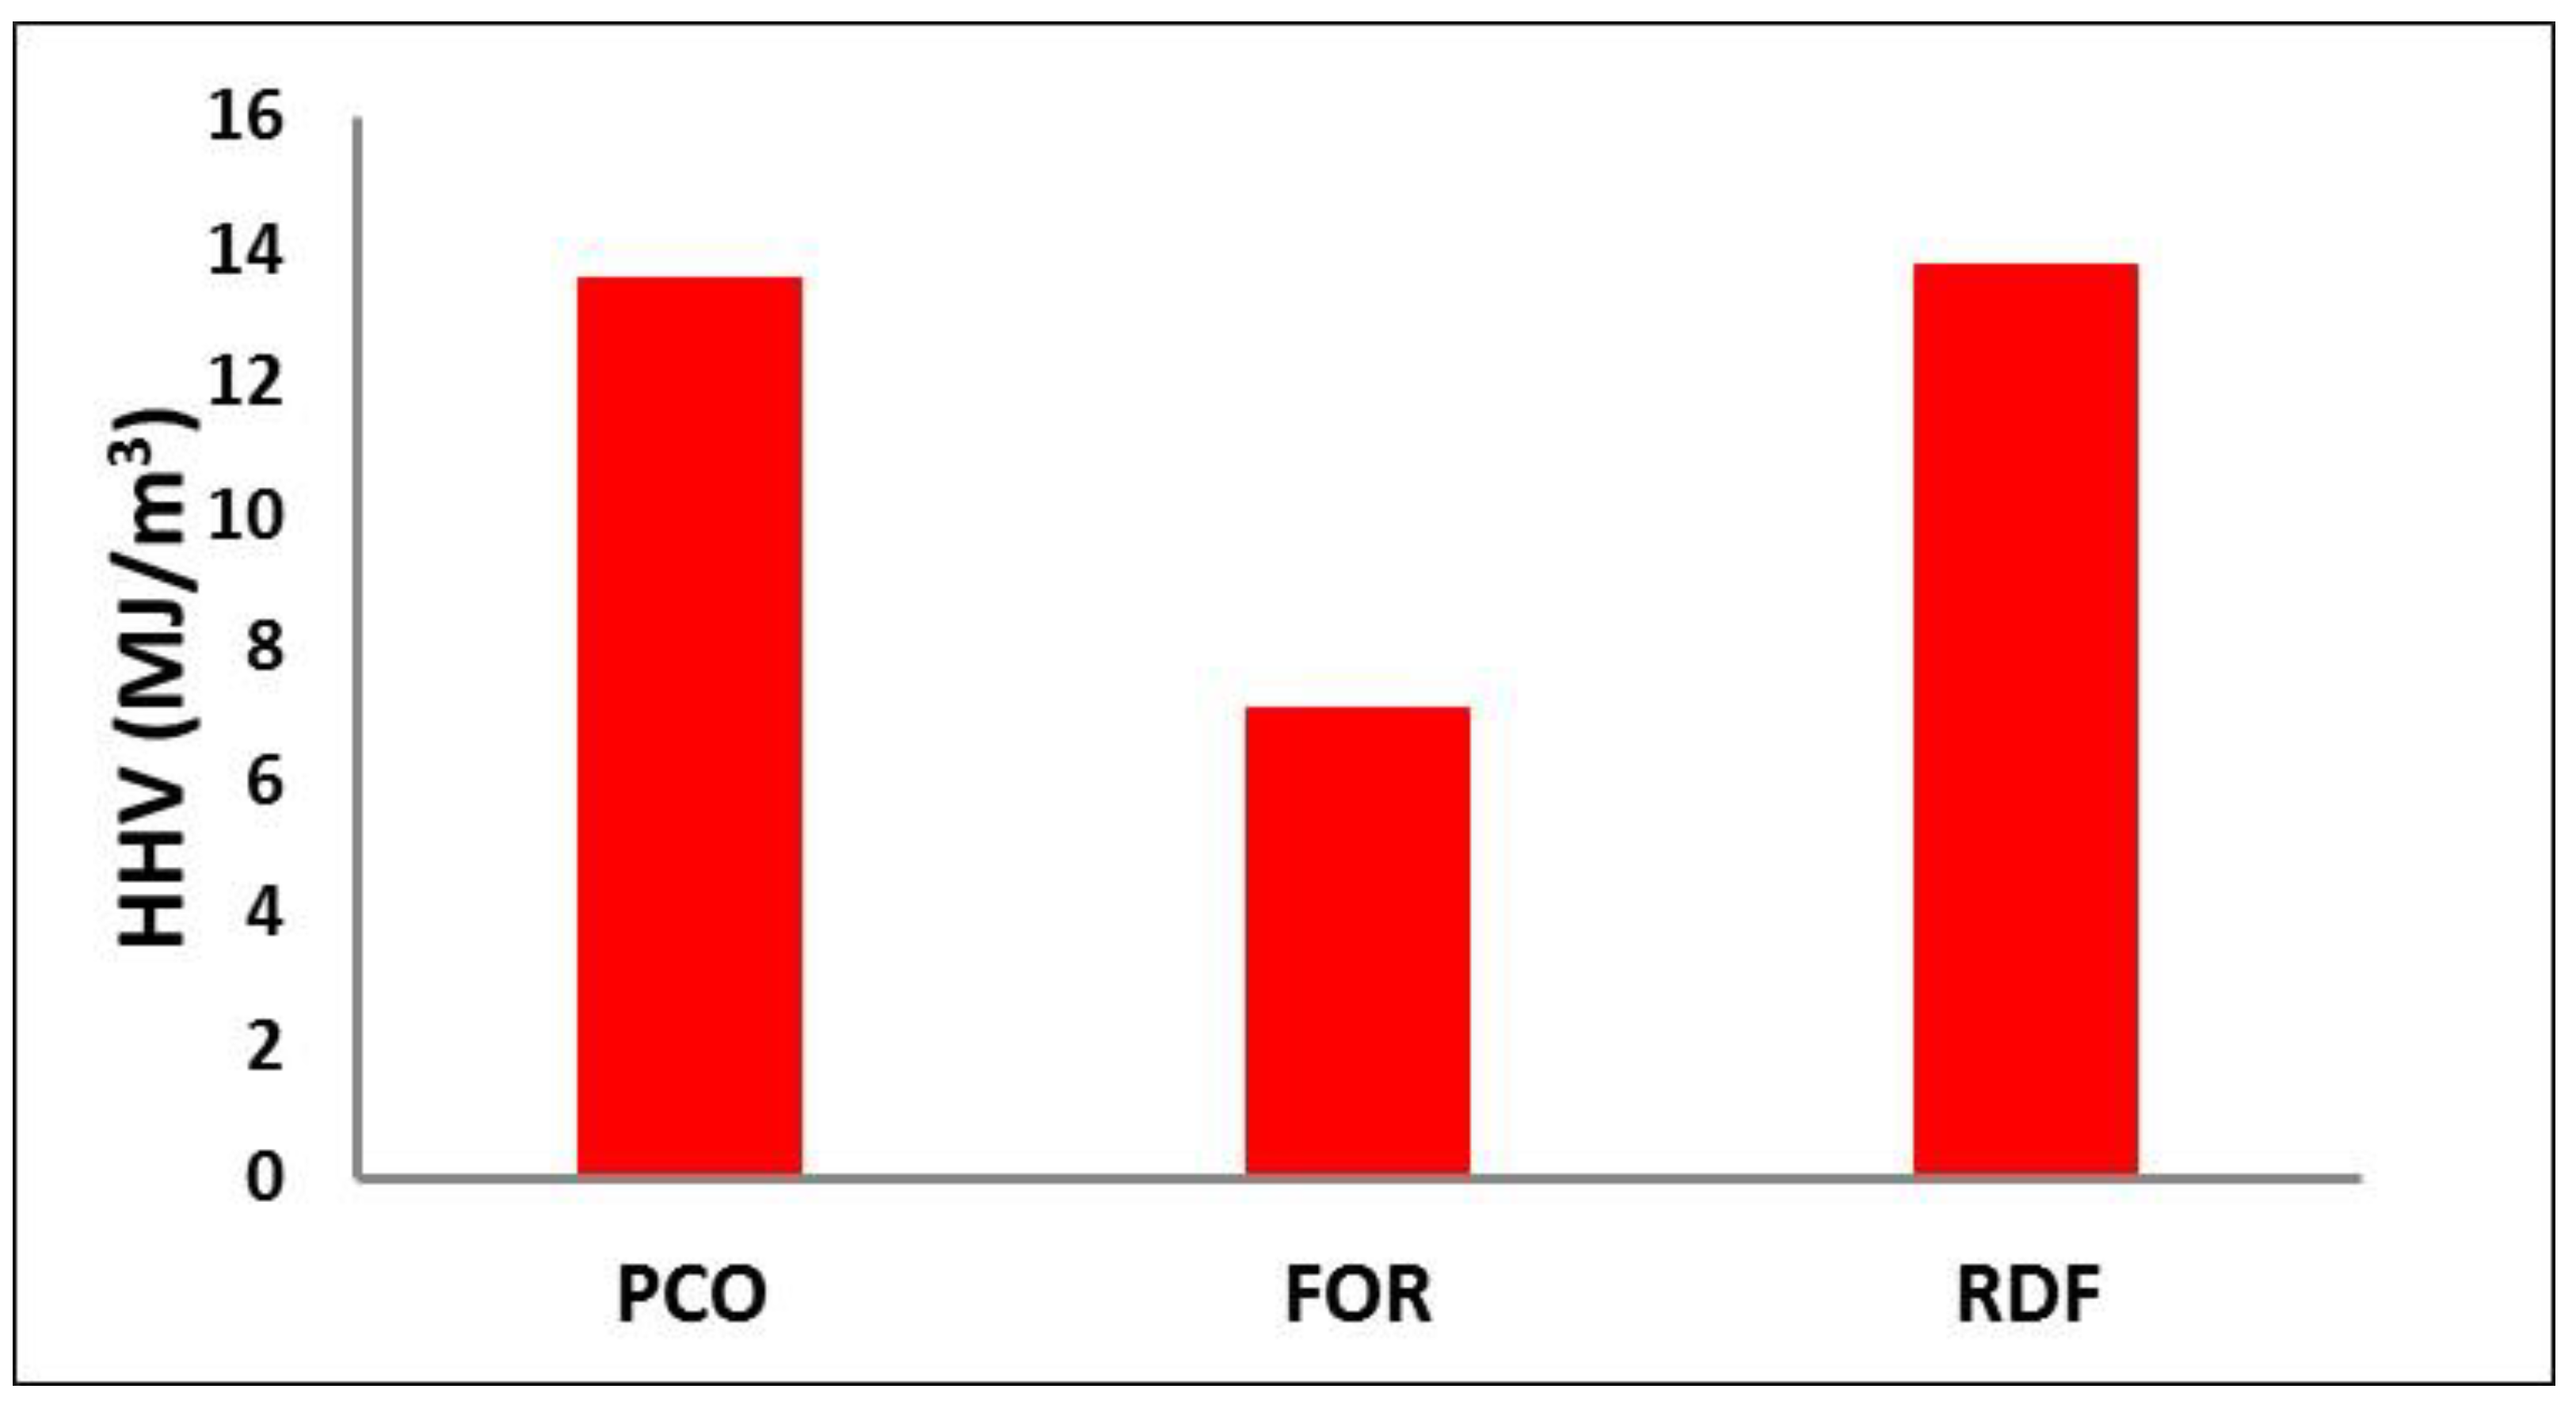
3.4. Gaseous Products

Figure 4, Figure 5 and Figure 6 represent the evolution profiles of the gaseous products of pyrolysis, and Figure 7 compares the higher heating value of gases produced at 450 °C from all the studied fuels. For the woody samples, evolution of CO2 with a peak rate at 350–370 °C was associated with the splitting of C–C and C=O bonds due to the thermal decomposition of hemicelluloses and cellulose components. CO, showing peak intensities at 350–360 °C, could not only arise from the degradation of these constituents but also from the splitting of C–O–C and C=O bonds during the decomposition of lignin at higher temperatures. The formation of CO above 450 °C, in the case of PCO fuel, was a result of charring processes, creating a more condensed aromatic structure [5]. This is in accordance with the results in Table 2, presented earlier, where PCO showed the highest degree of carbonization among the samples examined. In contrast, the enhanced CO2 generated by FOR and RDF fuels reveals the decomposition of carboxylic acids [5]. Furthermore, the lower temperature peak of CH4 at ~350 °C, during the pyrolysis of FOR and RDF, was most probably attributed to the splitting of the –OCH3 functional group [5], while the higher temperature peak of CH4 at ~480 °C for PCO was due to charring processes. The small amounts of CxHy and H2 produced at higher temperatures were associated with the splitting of stronger aliphatic or aromatic bonds. The higher heating values of PCO and RDF gases, consisting mainly of CO, were moderately high (13.6–13.8 MJ/m3) and were satisfactory for the energy requirement of the process [5]; however, the value of FOR gas produced at 450 °C was low (7.1 MJ/m3) as the evolution of CO from this fuel was found to cease at this temperature.

4. Conclusions

During pyrolysis of the biomass materials studied, at 450 °C, the highest amount of bio-oil was generated by FOR (53.2%), while the highest yields of gas and biochar were produced by RDF (19.5% and 45%, respectively). The calorific value, ranging between 20 MJ/kg and 39 MJ/kg, was high and exceeded that of raw materials. These biochars can be utilized for energy production, preferably at temperatures below 1000 °C to avoid slagging/fouling phenomena. The bio-oils of PCO and FOR materials obtained at 450 °C, with a density of 0.93–0.94 kg/m3, a pH of 2.1–3, a dynamic viscosity of 1.5–7 cP and a calorific value of 22–27 MJ/kg, were superior to typical flash pyrolysis oil and could be used in static applications for heat or electricity generation after a deoxygenation process. The quality of RDF bio-oil was lower. The higher heating value of gases from the pyrolysis of PCO and RDF fuels at 450 °C was satisfactory for the energy requirements of the process (13.6–13.8 MJ/m3); however, that of FOR gas was moderately low.

Author Contributions

Conceptualization, D.V.; methodology, D.V.; software, K.E. and D.M.; investigation, D.V., K.E. and D.M.; writing—review and editing, D.V. All authors have read and agreed to the published version of the manuscript.

Funding

This research received no external funding.

Acknowledgments

The authors kindly thank the Hydrocarbons Chemistry and Technology and Geochemistry laboratories of the Technical University of Crete for the ultimate and ash analyses of the samples.

Conflicts of Interest

The authors declare no conflict of interest.

References

  1. Mulvaney, D. Green New Deal. In Sol Power; University of California Press: Berkley, CA, USA, 2019; pp. 47–65. [Google Scholar]
  2. Guedes, R.E.; Luna, A.S.; Torres, A.R. Operating parameters for bio-oil production in biomass pyrolysis: A review. J. Anal. Appl. Pyrol. 2018, 129, 134–149. [Google Scholar] [CrossRef]
  3. Kambo, H.S.; Dutta, A. A comparative review of biochar and hydrochar in terms of production, physico-chemical properties and applications. Renew. Sustain. Energy Rev. 2015, 45, 359–378. [Google Scholar] [CrossRef]
  4. Varma, A.K.; Mondal, P. Pyrolysis of sugarcane bagasse in semi batch reactor: Effects of process parameters on product yields and characterization of products. Ind. Crops Prod. 2017, 95, 704–717. [Google Scholar] [CrossRef]
  5. Vamvuka, D.; Sfakiotakis, S.; Pantelaki, O. Evaluation of gaseous and solid products from the pyrolysis of waste biomass blends for energetic and environmental applications. Fuel 2018, 236, 574–582. [Google Scholar] [CrossRef]
  6. Vamvuka, D.; Teftiki, A.; Sfakiotakis, S. Increasing the reactivity of waste biochars during their co-gasification with carbon dioxide using catalysts and bio-oils. Thermochim. Acta 2021, 704, 179015. [Google Scholar] [CrossRef]
  7. Policella, M.; Wang, Z.; Burra, K.G.; Gupta, A.K. Characteristics of syngas from pyrolysis and CO2-assisted gasification of waste tires. Appl. Energy 2019, 254, 113678. [Google Scholar] [CrossRef]
  8. Soni, B.; Karmee, S.K. Towards a continuous pilot scale pyrolysis based biorefinery for production of biooil and biochar from sawdust. Fuel 2020, 271, 117570. [Google Scholar] [CrossRef]
  9. Vamvuka, D.; Esser, K.; Komnitsas, K. Investigating the Suitability of Grape Husks Biochar, Municipal Solid Wastes Compost and Mixtures of Them for Agricultural Applications to Mediterranean Soils. Resources 2020, 9, 33. [Google Scholar] [CrossRef] [Green Version]
  10. Zhang, P.; Zhang, X.; Li, Y.; Han, L. Influence of pyrolysis temperature on chemical speciation, leaching ability and environmental risk of heavy metals in biochar derived from cow manure. Bioresour. Technol. 2020, 302, 122850. [Google Scholar] [CrossRef]
  11. Vamvuka, D.; Raftogianni, A. Evaluation of Pig Manure for Environmental or Agricultural Applications through Gasification and Soil Leaching Experiments. Appl. Sci. 2021, 11, 12011. [Google Scholar] [CrossRef]
  12. Yang, X.; Ng, W.; Wong, B.S.E.; Baeg, G.H.; Wang, C.-H.; Ok, Y.S. Characterization and ecotoxicological investigation of biochar produced via slow pyrolysis: Effect of feedstock composition and pyrolysis conditions. J. Hazard. Mater. 2019, 365, 178–185. [Google Scholar] [CrossRef] [PubMed]
  13. Ferreira, M.; Oliveira, B.; Pinheiro, W.; Correa, N.; França, L.; Ribeiro, N. Generation of biofuels by slow pyrolysis of palm empty fruit bunches: Optimization of process variables and characterization of physical-chemical products. Biomass Bioenergy 2020, 140, 105707. [Google Scholar] [CrossRef]
  14. Sakhiya, A.K.; Anand, A.; Aier, I.; Vijay, V.K.; Kaushal, P. Suitability of rice straw for biochar production through slow pyrolysis: Product characterization and thermodynamic analysis. Bioresour. Technol. Rep. 2021, 15, 100818. [Google Scholar] [CrossRef]
  15. Miranda, N.T.; Motta, I.L.; Filho, R.M.; Maciel, M.R.W. Sugarcane bagasse pyrolysis: A review of operating conditions and products properties. Renew. Sustain. Energy Rev. 2021, 149, 111394. [Google Scholar] [CrossRef]
  16. Wang, L.; Olsen, M.N.; Moni, C.; Dieguez-Alonso, A.; de la Rosa, J.M.; Stenrød, M.; Liu, X.; Mao, L. Comparison of properties of biochar produced from different types of lignocellulosic biomass by slow pyrolysis at 600 °C. Appl. Energy Combust. Sci. 2022, 12, 100090. [Google Scholar] [CrossRef]
  17. Kim, K.H.; Kim, T.-S.; Lee, S.-M.; Choi, D.; Yeo, H.; Choi, I.-G.; Choi, J.W. Comparison of physicochemical features of biooils and biochars produced from various woody biomasses by fast pyrolysis. Renew. Energy 2013, 50, 188–195. [Google Scholar] [CrossRef]
  18. Yu, S.; Park, J.; Kim, M.; Ryu, C.; Park, J. Characterization of biochar and byproducts from slow pyrolysis of hinoki cypress. Bioresour. Technol. Rep. 2019, 6, 217–222. [Google Scholar] [CrossRef]
  19. Fadhil, A.B.; Alhayali, M.A.; Saeed, L.I. Date palm stones as a potential new feedstock for liquid bio-fuels production. Fuel 2017, 210, 165–176. [Google Scholar] [CrossRef]
  20. Struhs, E.; Sotoudehnia, F.; Mirkouei, A.; McDonald, A.G.; Ramirez-Corredores, M.M. Effect of feedstocks and free-fall pyrolysis on bio-oil and biochar attributes. J. Anal. Appl. Pyrol. 2022, 166, 105616. [Google Scholar] [CrossRef]
  21. Bhatt, M.; Wagh, S.; Chakinala, A.G.; Pant, K.K.; Sharma, T.; Joshi, J.B.; Shah, K.; Sharma, A. Conversion of refuse derived fuel from municipal solid waste into valuable chemicals using advanced thermo-chemical process. J. Clean. Prod. 2021, 329, 129653. [Google Scholar] [CrossRef]
  22. Krutof, A.; Hawboldt, K.A. Thermodynamic model of fast pyrolysis bio-oil advanced distillation curves. Fuel 2020, 261, 116446. [Google Scholar] [CrossRef]
  23. Chireshe, F.; Collard, F.-X.; Görgens, J.F. Production of an upgraded bio-oil with minimal water content by catalytic pyrolysis: Optimisation and comparison of CaO and MgO performances. J. Anal. Appl. Pyrol. 2020, 146, 104751. [Google Scholar] [CrossRef]
  24. Rijo, B.; Dias, A.P.S.; Ramos, M.; Ameixa, M. Valorization of forest waste biomass by catalyzed pyrolysis. Energy 2022, 243, 122766. [Google Scholar] [CrossRef]
  25. Radojevic, M.; Jankovic, B.; Stojiljkovic, D.; Jovanovic, V.; Cekovic, I.; Manic, N. Improved TGA-MS measurements for evolved gas analysis during pyrolysis process of various biomass feedstocks. Syngas energy balance determination. Thermochim. Acta 2021, 699, 178912. [Google Scholar] [CrossRef]
  26. Fermoso, J.; Mašek, O. Thermochemical decomposition of coffee ground residues by TG-MS: A kinetic study. J. Anal. Appl. Pyrol. 2018, 130, 358–367. [Google Scholar] [CrossRef] [Green Version]
  27. Tahir, M.H.; Zhao, Z.; Ren, J.; Rasool, T.; Naqvi, S.R. Thermo-kinetics and gaseous product analysis of banana peel pyrolysis for its bioenergy potential. Biomass Bioenergy 2019, 122, 193–201. [Google Scholar] [CrossRef]
  28. Tian, B.; Wang, X.; Zhao, W.; Xu, L.; Bai, L. Pyrolysis behaviors, kinetics and gaseous product evolutions of two typical biomass wastes. Catal. Today 2021, 374, 77–85. [Google Scholar] [CrossRef]
  29. Hai, A.; Bharath, G.; Ali, I.; Daud, M.; Othman, I.; Rambabu, K.; Haija, M.A.; Hasan, S.W.; Banat, F. Pyrolysis of date seeds loaded with layered double hydroxide: Kinetics, thermodynamics and pyrolytic gas properties. Energy Convers. Manag. 2022, 252, 115127. [Google Scholar] [CrossRef]
  30. Li, J.; Burra, K.G.; Wang, Z.; Liu, X.; Gupta, A.K. Effect of alkali and alkaline metals on gas formation behavior and kinetics during pyrolysis of pine wood. Fuel 2021, 290, 120081. [Google Scholar] [CrossRef]
  31. Vamvuka, D. Biomass, Bioenergy and the Environment; Tziolas Publications: Salonica, Greece, 2009. [Google Scholar]
  32. Vamvuka, D.; Loulashi, C. Catalytic Co-gasification of Lignites Blended with a Forest Residue under the Carbon Dioxide Stream. Catal. Res. 2022, 2, 2203031. [Google Scholar] [CrossRef]
  33. Mohammadi, H.; Salehzadeh, H.; Khezri, S.M.; Zanganeh, M.; Soori, M.M.; Keykhosravi, S.S.; Kamarehie, B. Improving Nitrification and Denitrification Processes in Urban Wastewater Treatment Using Optimized MBBR Reactor Design Considerations. J. Biochem. Technol. 2020, 11, 85–100. [Google Scholar]
  34. Vamvuka, D.; Chatzifotiadis, I. Energy Recovery from Solid Waste Materials via a Two-step Gasification Process by Steam. Eur. J. Energy Res. 2022, 2, 20–24. [Google Scholar] [CrossRef]
  35. European Standard CEN/TC335; Directive 2000/76/EC of the European Parliament and of the Council of 4 December 2000 on the Incineration of Waste. Technical Committee of European Standards: Brussels, Belgium, 2000.
  36. Vamvuka, D.; Trikouvertis, M.; Pentari, D.; Alevizos, G. Characterization and evaluation of fly and bottom ashes from combustion of residues from vineyards and processing industry. J. Energy Inst. 2017, 90, 574–587. [Google Scholar] [CrossRef]
  37. Garcia-Maraver, A.; Mata-Sanchez, J.; Carpio, M.; Perez-Jimenez, J.A. Critical review of predictive coefficients for biomass ash deposition tendency. J. Energy Inst. 2017, 90, 214–228. [Google Scholar] [CrossRef]
  38. ASTM 1298; Refractories, activated carbon, advanced ceramics. In ASTM Book of Standards; American Society for Testing and Materials: West Conshohocken, PA, USA, 2007.
  39. Mateus, M.M.; Gaspar, D.; Matos, S.; Reigo, A.; Motta, C.; Castenheira, I. Converting a residue from an edible source into a bio-oil. J. Environ. Chem. Eng. 2019, 7, 103004. [Google Scholar] [CrossRef]
  40. Alburquerque, J.; Sanchez, M.; Mora, M.; Barron, M. Slow pyrolysis of relevant biomasses in the Mediterranean basin. Part 2. Char characterization for carbon sequestration and agricultural uses. J. Clean. Prod. 2014, 120, 191–197. [Google Scholar] [CrossRef]
  41. Vamvuka, D. Bio-oil, solid and gaseous biofuels from biomass pyrolysis processes-An overview. Int. J. Energy Res. 2011, 35, 835–862. [Google Scholar] [CrossRef]
  42. Cai, W.; Liu, R.; He, Y.; Chai, M.; Cai, J. Bio-oil production from fast pyrolysis of rice husk in a commercial-scale plant with a downdraft circulating fluidized bed reactor. Fuel Process. Technol. 2018, 171, 308–317. [Google Scholar] [CrossRef]
  43. Qiang, L.; Wen-Zhi, L.; Xi-Feng, Z. Overview of fuel properties of biomass fast pyrolysis oils. Energy Convers. Manag. 2009, 50, 1376–1383. [Google Scholar]
Figure 1. Diagram of experimental setup: (1) N2 cylinder, (2) flow control valve, (3) mass flow meter, (4) thermoprogrammable furnace, (5) sample, (6) reactor, (7) thermocouple with indicator and (8) ice baths.
Applsci 13 01482 g001
Figure 2. Yield of pyrolysis products of (a) PCO, (b) FOR and (c) RDF.
Applsci 13 01482 g002aApplsci 13 01482 g002b
Figure 3. Concentration of inorganic species in biochars.
Applsci 13 01482 g003
Figure 4. Evolution profiles of (a) CO and CO2 and (b) H2, CH4 and CxHy of PCO pyrolysis.
Applsci 13 01482 g004
Figure 5. Evolution profiles of (a) CO and CO2 and (b) H2, CH4 and CxHy of FOR pyrolysis.
Applsci 13 01482 g005
Figure 6. Evolution profiles of (a) CO and CO2 and (b) H2, CH4 and CxHy of RDF pyrolysis.
Applsci 13 01482 g006aApplsci 13 01482 g006b
Figure 7. Higher heating values of gases from all studied fuels.
Applsci 13 01482 g007
Table 1. Proximate and ultimate analysis of raw materials (% dry).
SampleVolatile MatterFixed CarbonAshCHNOSHHV (MJ/kg)
PCO76.917.55.647.86.70.239.60.0519.9
FOR84.515.00.546.06.5-47.0-17.3
RDF84.80.314.952.88.20.323.8-26.3
Table 2. Proximate and ultimate analysis of biochars (% dry).
SampleTemperature (°C)Organic MatterAshCHNOHHV (MJ/kg)
PCO35087.912.162.74.91.119.224.8
45084.915.162.93.21.017.822.7
55079.520.563.41.91.013.221.8
FOR35098.61.468.44.0-26.224.2
45098.41.662.72.9-32.819.5
55097.72.356.52.1-39.115.2
RDF35080.219.869.210.80.10.138.7
45066.733.352.06.00.18.624.6
55046.153.934.21.00.210.711.1
Table 3. Slagging/fouling indices of biochars.
SampleB/ASvAIDeposition Tendency
PCO0.9351.90.14medium/high/low
FOR4.318.20.02high/high/low
RDF1.528.80.19high/high/low
Table 4. Physical and chemical properties of bio-oils.
SamplePCOFORRDFHeavy Fuel Oil [31] Flash Pyrolysis Oil [31]
Density (g/cm3)0.940.931.300.941.23
Dynamic viscosity (cP)7.01.5110.6180.055–180
pH3.02.13.1-2.4
C (%)59.052.443.585.244–46
H (%)8.97.95.011.16.6–7.1
N (%)1.20.13.90.3-
S (%)---2.3-
O (%)30.939.647.61.047–49
HHV (MJ/kg)27.121.913.440.015.0–17.5
Disclaimer/Publisher’s Note: The statements, opinions and data contained in all publications are solely those of the individual author(s) and contributor(s) and not of MDPI and/or the editor(s). MDPI and/or the editor(s) disclaim responsibility for any injury to people or property resulting from any ideas, methods, instructions or products referred to in the content.

