Abstract
Large shaft usually achieves high surface quality through multi-pass grinding in practice. Common surface quality indexes include surface roughness and glossiness, which are not only required numerically, but also require high consistency of distribution along the whole shaft. In multi-pass grinding, these two indexes are affected by the process parameters and the surface quality of the previous grinding pass, which leads to the difficulty of modeling. In addition, due to the uneven distribution of actual grinding depth, the surface quality along the whole shaft is usually inconsistent, resulting in the need for multiple spark-out grinding passes to ensure consistency. In this study, the surface quality evolution models for surface roughness and glossiness based on Elman neural network are developed, which build regressions between process parameters, surface quality indexes of the previous grinding pass, and surface quality indexes of the current grinding pass. Moreover, a consistency control method of surface quality is proposed by adjusting the actual grinding depth within the dimensional accuracy tolerance range at the rough grinding stage. Experimental results show that the surface roughness and glossiness prediction errors of the surface quality evolution models are only 5.5% and 5.1%. The consistency control method guarantees the consistency of surface quality, reduces the grinding passes, and increases the grinding efficiency.
1. Introduction
Large shaft is widely used in industry to bear heavy load and transfer motion [1], and multi-pass grinding is the final process to obtain high surface quality [2]. Surface roughness and glossiness are common surface quality indexes, and the requirements of these two indexes are high in large shaft grinding. Moreover, surface quality consistency needs to be ensured, which means the value difference of each surface quality index along the whole shaft should be small. Both surface roughness and glossiness are affected by grinding parameters, so the reasonable selection of grinding parameters is the basis to obtain the desired surface quality [3,4].
Some studies reveal the mechanism of grinding surface formation through physical modeling of the grinding process, and then obtain the correlation between grinding parameters and surface roughness [5,6]. Zhou et al. proposed a conventional method determining the surface roughness using the mean value of the grain protrusion heights [7]. Jiang et al. developed a predictive model for grinding surface roughness based on micro-interacting mechanism modeling [8]. Chakrabart et al. simplified the abrasive particles into a cone and calculated the surface roughness by obtaining the topography of the grinding surface through a simulation method [9]. The above research established surface roughness prediction models based on physical modeling and simulation, but these models are difficult to describe the random factors in the actual grinding process, so the prediction performances are not high enough. Another kind of surface roughness modeling method is the empirical method, by which the correlation between grinding parameters and surface roughness is established by numerical method [10,11]. Kwak et al. proposed a surface roughness prediction model based on a respond surface model for external cylindrical grinding of SCM440 steel [12]. Alao et al. used the Taguchi method to establish the correlation between grinding depth, grinding wheel speed, and surface roughness [13]. Caydas et al. developed the least squares vector machine and spider support vector machine to predict the surface roughness of stainless steel turning [14]. Liu et al. used an artificial neural network to accurately describe the influence of grinding parameters on surface roughness [15]. In general, the empirical method is the most commonly used method for predicting surface roughness with grinding parameters due to its convenient calculation and high precision [16,17]. Recently, some studies predict surface roughness by monitoring grinding signals, such as image [18] and acoustic emission signals [19]. However, this method is not helpful to the selection of grinding parameters.
Glossiness is an optical parameter to represent the reflective capacity of the surface, which also reflects the surface roughness [20]. Generally, the higher the surface roughness, the lower the glossiness [21]. The existing research seldom discusses the correlation between process parameters and glossiness based on the modeling of the machining process, but mostly focuses on the correlation between roughness and glossiness. Yavuz et al. performed polishing experiments on building stone tiles with SiC abrasive particles and found an exponential relationship between the surface roughness and glossiness of the workpiece [22]. Nevertheless, by testing polymer surfaces, Assender et al. pointed out that surfaces with similar roughness can also have very different glossiness [23]. Li et al. simulated the surface roughness and glossiness with non-Gaussian topography features, and it is found that there can be other indexes deciding the final glossiness besides surface roughness [24]. Overall, current research on glossiness modeling is insufficient.
The above researchers have made achievements in the building correlation between grinding surface quality and process parameters, but there are still two limitations. Firstly, the influence of the surface quality of the previous grinding pass is not considered by existing research. In multi-pass grinding, the same grinding parameters will result in different grinding qualities under different initial surface qualities, which makes the surface quality model ineffective. Secondly, the research on the formation mechanism and control method of surface quality consistency is insufficient. Even if better grinding parameters are selected to obtain higher grinding quality, there will still be large differences in the grinding quality indexes along the whole shaft; in other words, the grinding quality consistency is poor. Thus, the surface quality consistency is hard to guarantee through selection of grinding parameters alone.
In this study, the formation mechanism of surface quality consistency is revealed by qualitative analysis of the influence of grinding parameters on surface quality. Then, the surface quality evolution models for surface roughness and glossiness based on Elman neural network are developed, which build regressions between process parameters, surface quality indexes of the previous grinding pass, and surface quality indexes of the current grinding pass. Moreover, a consistency control method of surface quality is proposed by adjusting the actual grinding depth within the dimensional accuracy tolerance range at the rough grinding stage. A case study is performed to verify the effectiveness of the proposed method.
2. Surface Quality Indexes and Influencing Factors
2.1. Surface Quality Indexes
The surface quality indexes in this study are surface roughness and glossiness. Surface roughness is used to measure surface fluctuation. In this study, the arithmetic mean deviation Ra is selected as the surface roughness value. Glossiness is a common index used to evaluate finished surfaces, such as roller grinding and parts polishing [24]. Glossiness G is expressed as:
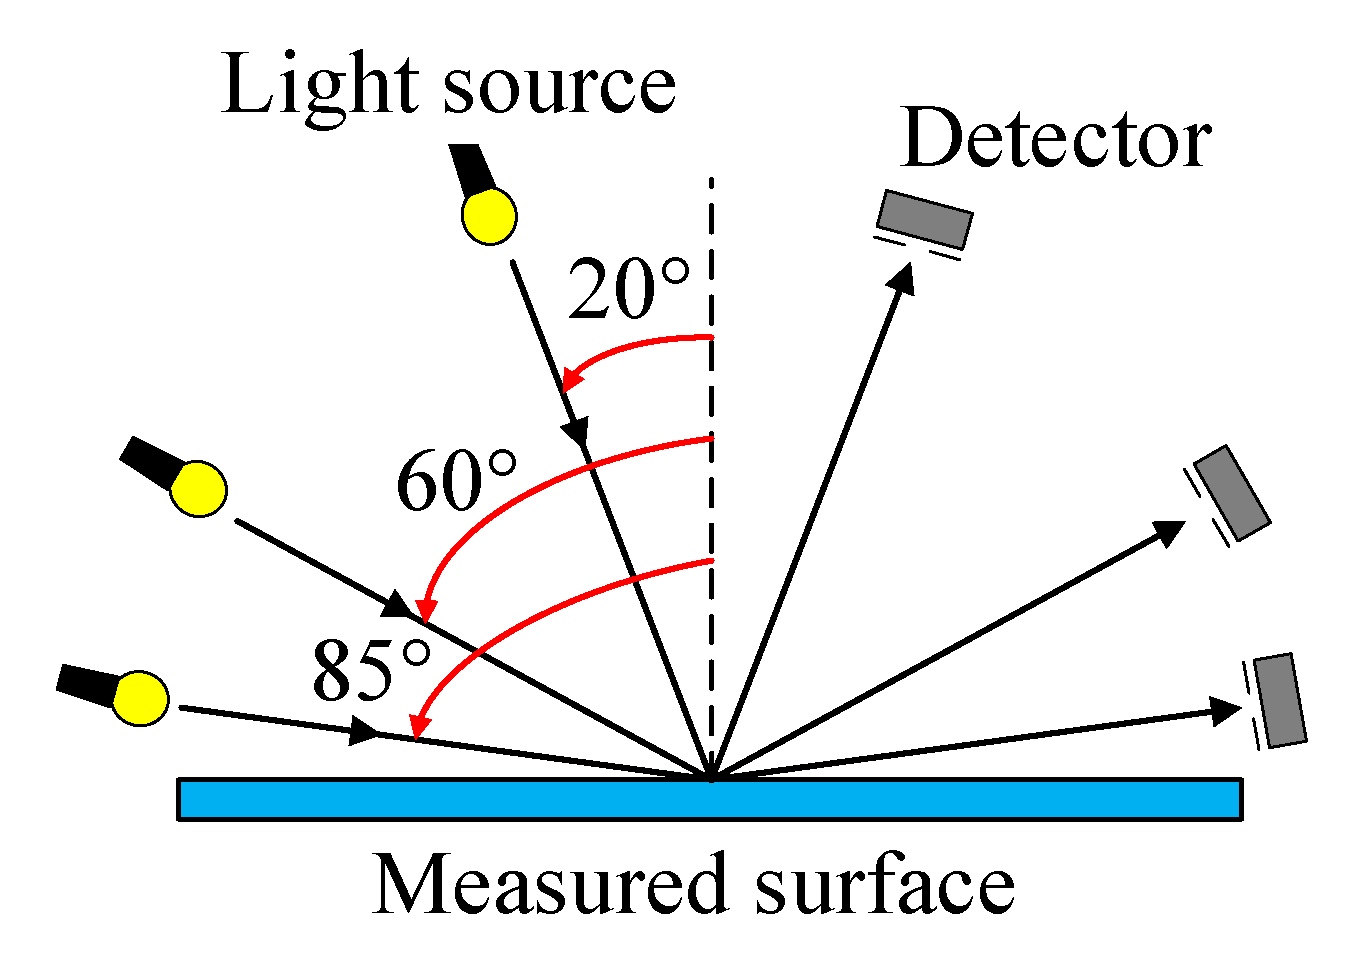
where R is the specular reflectance of the measured surface, and R0 is the specular reflectance of the standard glass, which is the polished black glass with a refractive index of 1.567. The test method for glossiness is shown in Figure 1. The light source illuminates the measured surface at a specific incident angle and is reflected at an angle of the same magnitude as the incident angle. The reflected light is received by the detector, and the ratio of the reflected light energy to the incident light energy is calculated as the specular reflectance of the measured surface R. Mirror reflection of the standard glass is performed to obtain R0, and the glossiness of the measured surface can be calculated according to Equation (1). It should be noted that the test value of glossiness changes when the incident angle of light is changed. The ASTM D523 standard test method developed by Hunter and ASTM (American Society for Testing and Materials) specifies the test of glossiness at 60° incident light, so the angle of incidence used in this paper is 60°.
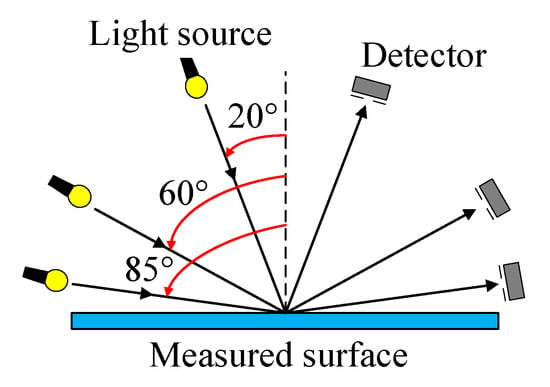
Figure 1.
The test method for glossiness.
2.2. Analysis of Surface Quality Influencing Factors
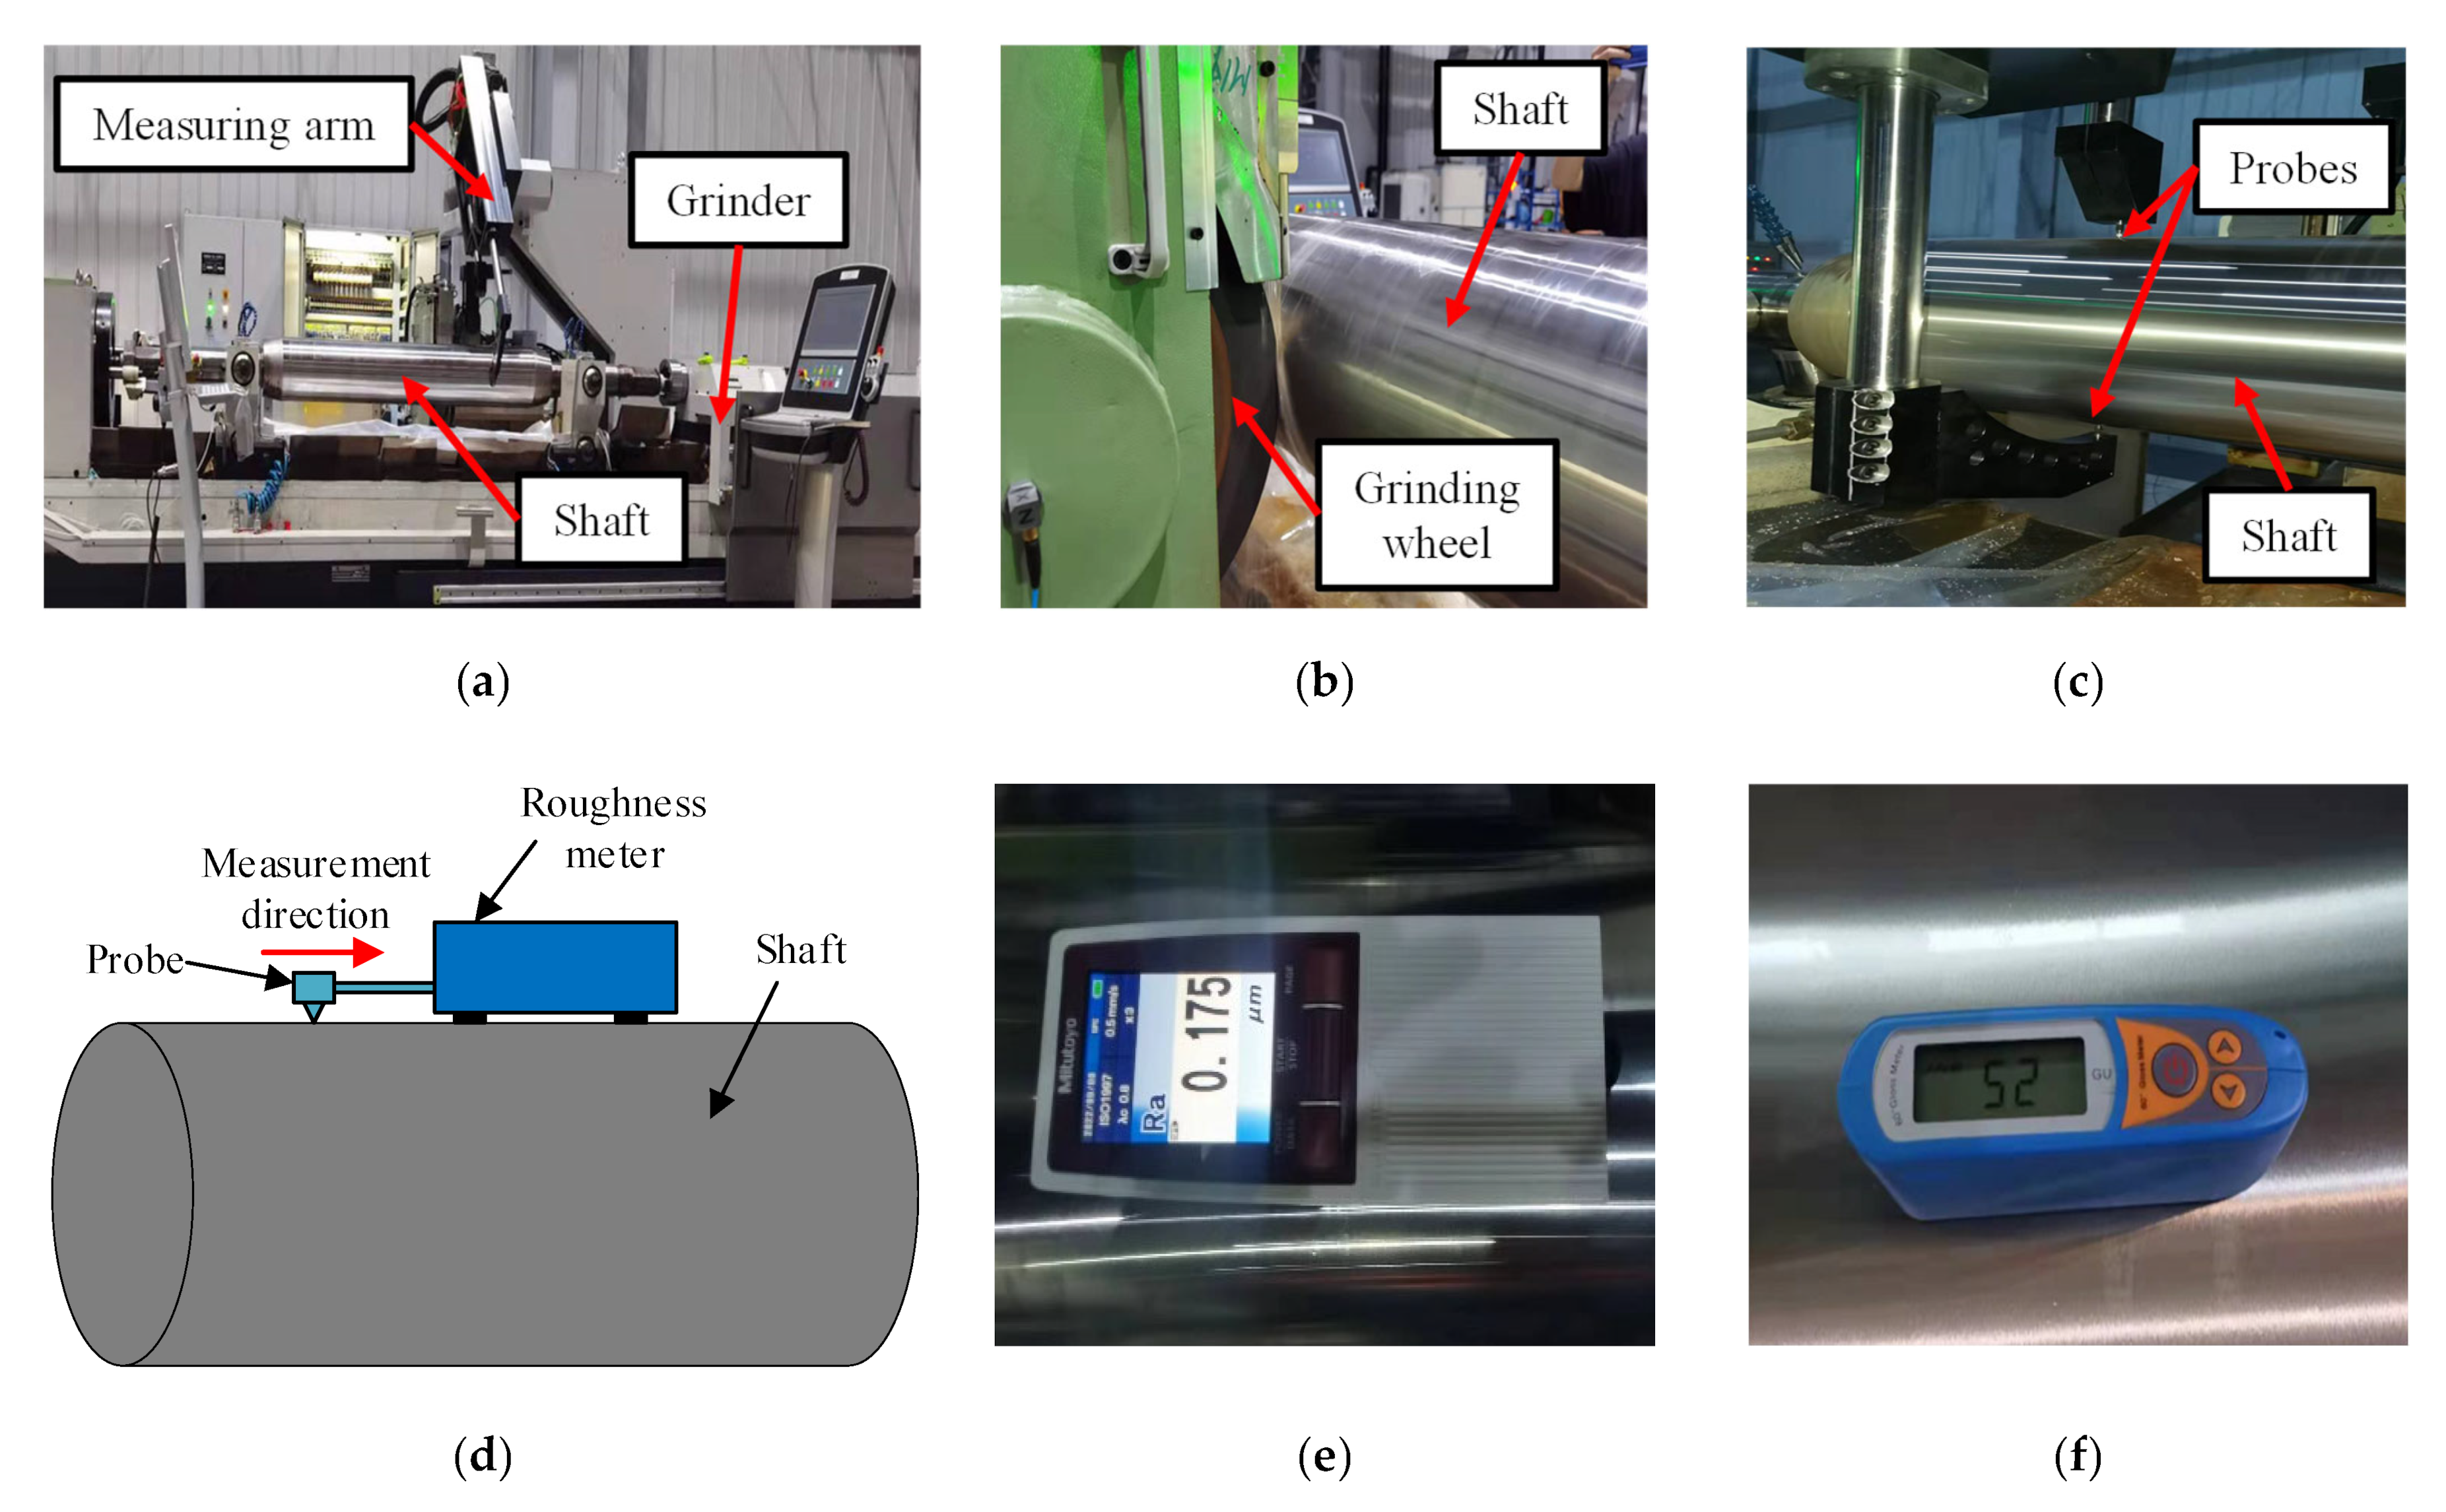
The full factor experiments are carried out to analyze the influence of grinding parameters on surface roughness and glossiness. The grinding machine is a grinder MKT8445. The workpiece is a shaft with a length of 1480 mm and a diameter of 244 mm. The material of the shaft is 92CrMo, which is a kind of alloy steel. The grinding wheel is made of silicon carbide with a width of 60 mm. The grinding system and process are shown in Figure 2a,b. The shaft diameter is obtained by measuring arm as shown in Figure 2c, and the measuring resolution is 0.1 μm. The surface roughness is tested by Surftest-SJ210 roughness meter with a resolution of 0.001 μm. The direction of measurement of roughness is parallel to the direction of grinding passes as shown in Figure 2d. The glossiness is tested by the YG60 glossiness meter with a resolution of 1GU and a test angle of 60°. The testing instruments are shown in Figure 2e,f.
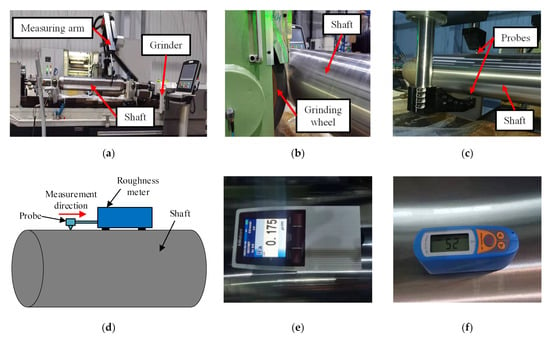
Figure 2.
The grinding system and testing instruments: (a) grinding system, (b) grinding process, (c) diameter measurement, (d) roughness measurement, (e) roughness meter, (f) glossiness meter.
The full factor experiments consist of four factors, i.e., grinding depth ap, grinding wheel speed Nwheel, shaft speed Nshaft, and pallet speed f. The grinding depth and the grinding wheel speed are set at four levels, while the shaft speed and the pallet speed are set at three levels as shown in Table 1. Thus, the full factor experiments consist of 144 grinding passes.

Table 1.
Grinding parameters of the full factor experiments.
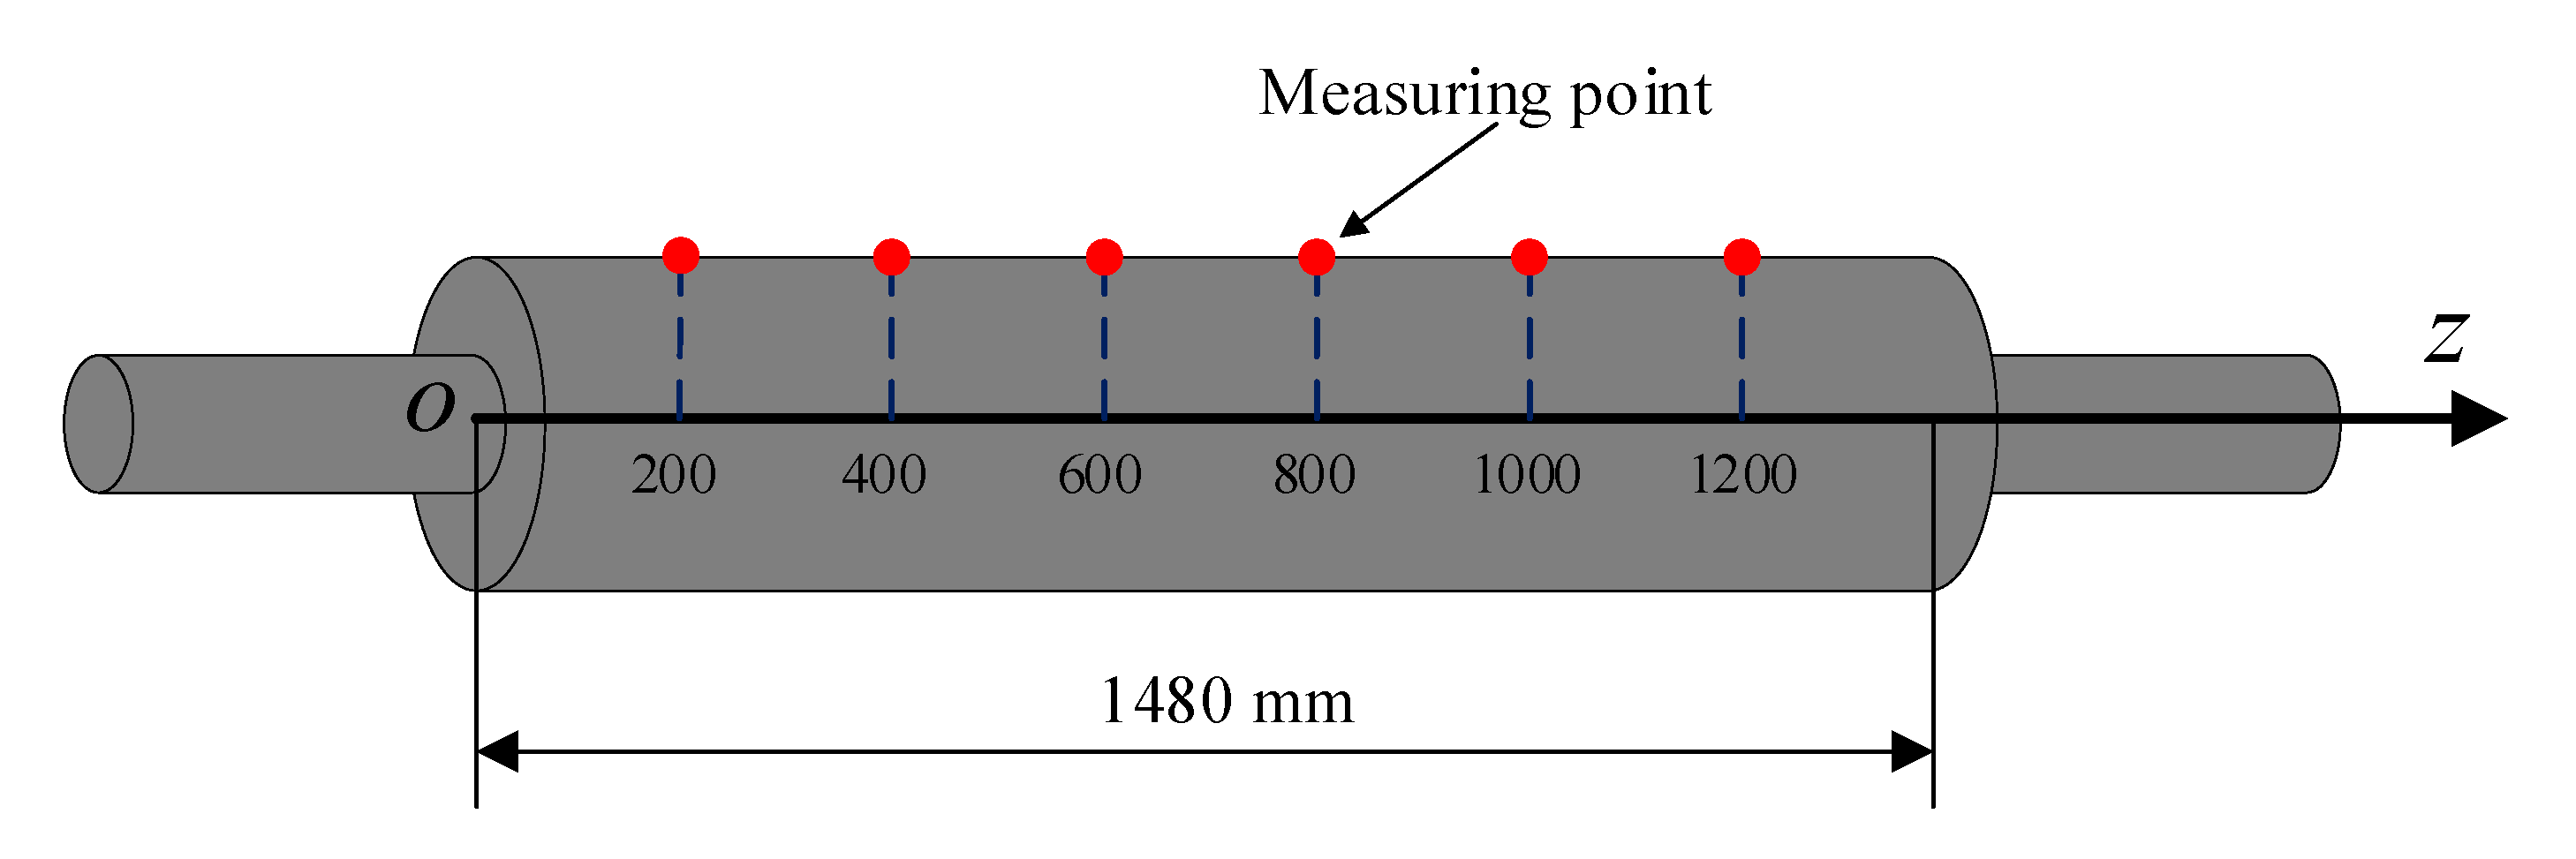
The grinding wheel grinds from the left side of the shaft to the right side in a grinding pass. On the next grinding pass, the grinding wheel grinds from the right side of the shaft to the left side. In order to expand the number of samples, six measuring points are selected along the z-direction on the shaft after grinding to test the surface roughness and glossiness as shown in Figure 3. The measuring points in this study are distributed uniformly along the length of the shaft, which can reflect the trend of surface quality on the whole shaft.

Figure 3.
Measuring points of shaft.
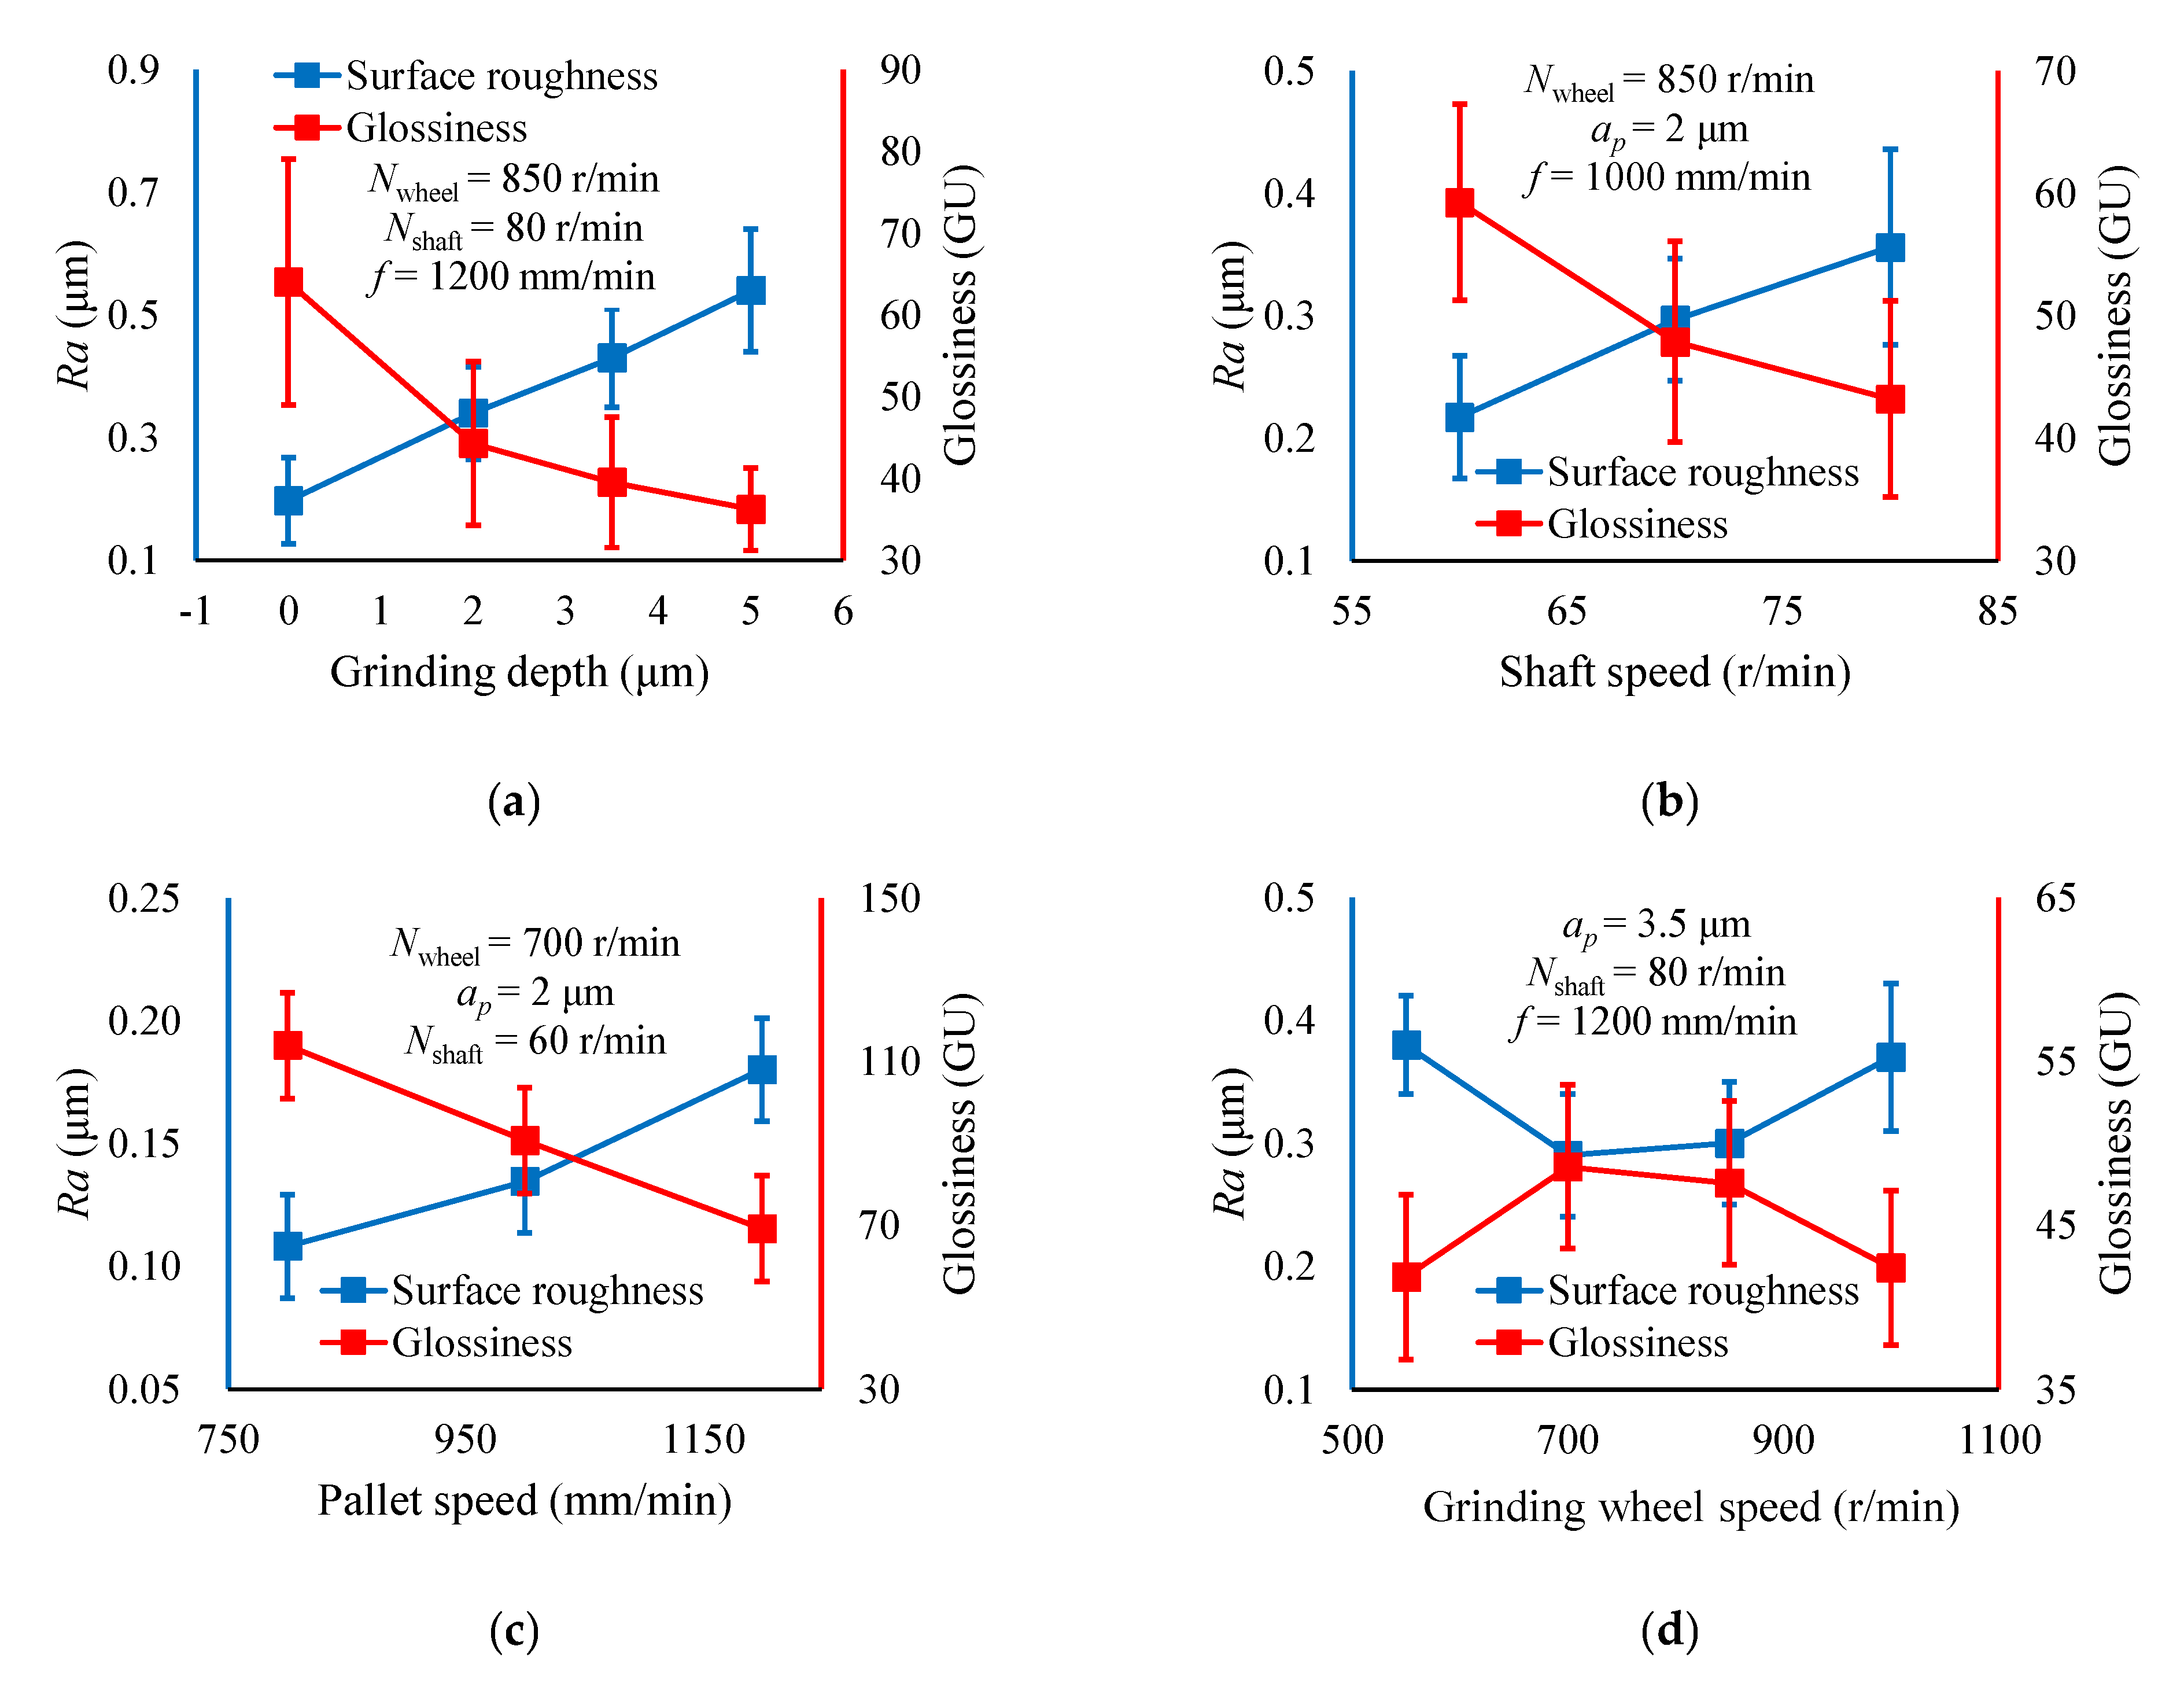
Figure 4 shows the surface roughness and glossiness with different grinding parameters, and the values of surface roughness and glossiness are average values tested on 6 measuring points. The error bar represents the standard deviation. With the increase of grinding depth, shaft speed, and pallet speed, the surface roughness value increases and the glossiness decreases. This is because the increase of these three grinding parameters will increase the grinding force, resulting in more intense plastic deformation of the shaft and a rougher surface.
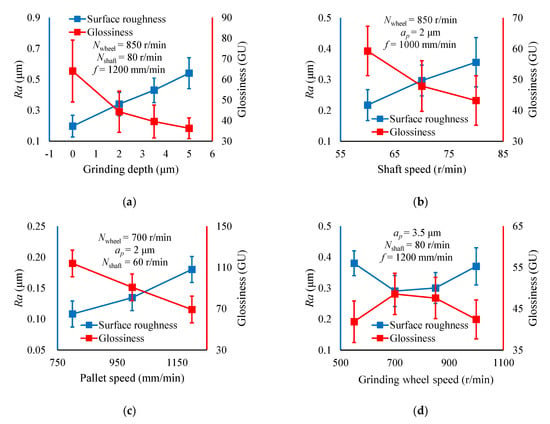
Figure 4.
The influence of three grinding parameters on surface roughness and glossiness: (a) grinding depth, (b) shaft speed, (c) pallet speed, (d) grinding wheel speed.
For grinding wheel speed, lower surface roughness values and higher glossiness values are obtained in the range from 700 to 850 r/min. The spindle current standard deviations of the grinding passes in Figure 5d are shown in Table 2. It can be seen that the current variances are small when the grinding wheel speeds are 700 r/min and 850 r/min. The spindle runs more stably within this speed range, and the contact between the grinding wheel and the shaft is more stable, resulting in higher surface quality.
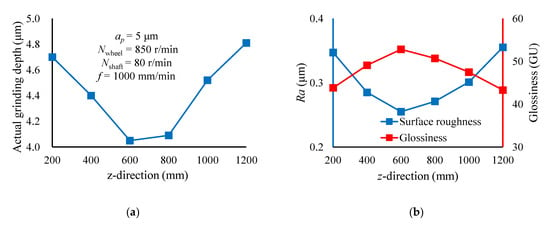
Figure 5.
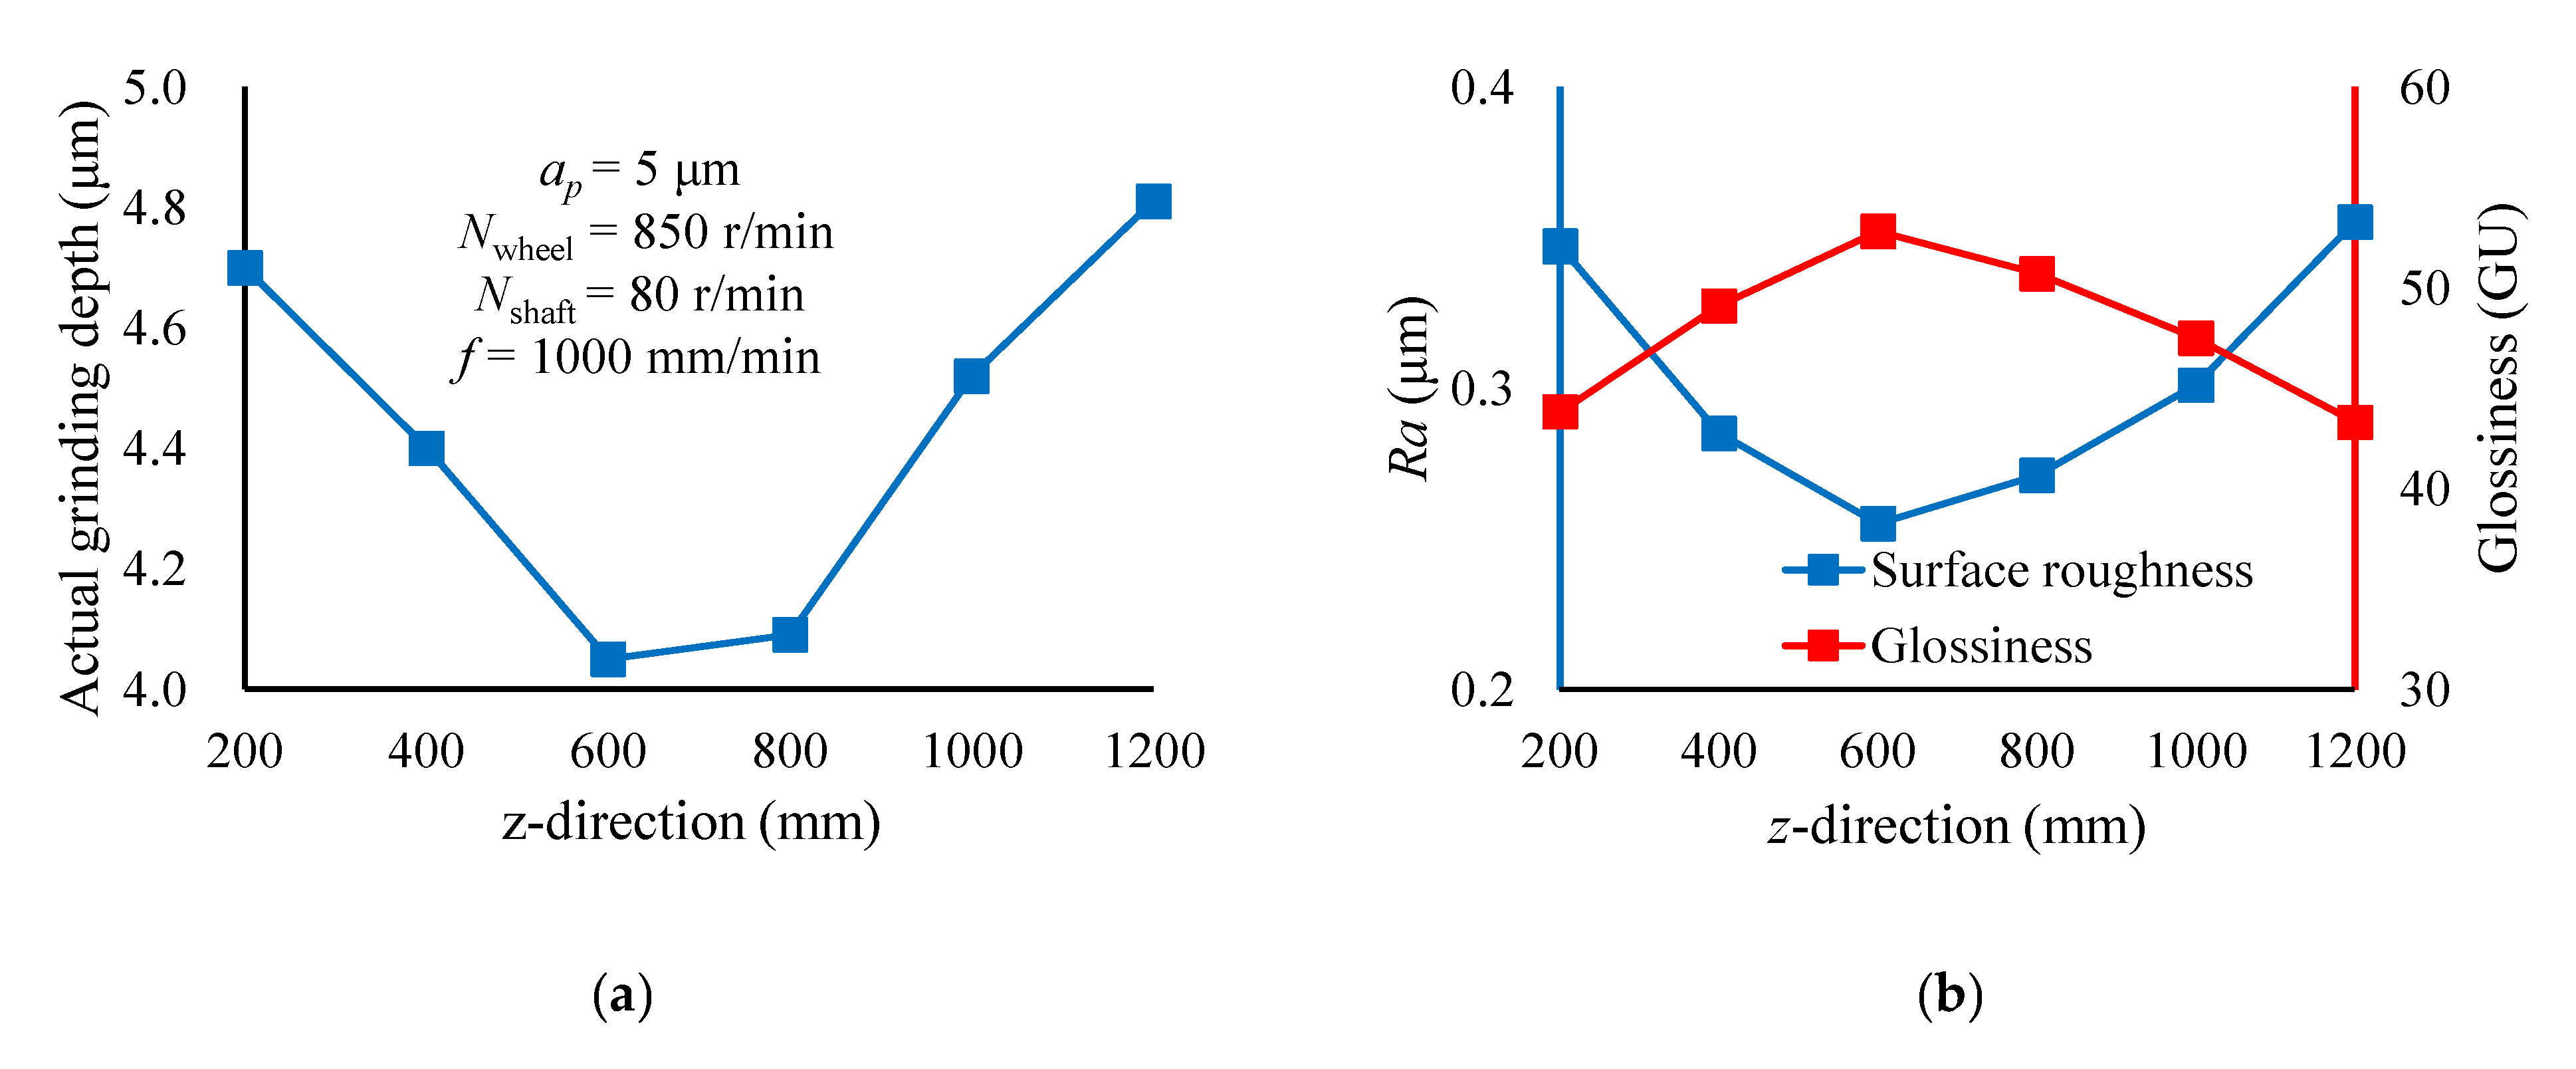
The actual grinding depth, surface roughness, and glossiness of a single grinding pass: (a) actual grinding depth, (b) surface roughness and glossiness.

Table 2.
The spindle current standard deviations of the grinding passes in Figure 5d.
It should be noted that the grinding depth involved in the above analysis is the nominal grinding depth. In fact, due to grinding wheel wear in the grinding process, the actual grinding depth is less than the nominal grinding depth and unevenly distributed along the z-direction. Therefore, it is necessary to further analyze the actual grinding depth at different positions of the same grinding pass and its influence on the surface roughness and glossiness. The actual grinding depth a′p is calculated as:
where Dshaft and D′shaft are diameters of the shaft before and after a grinding pass.
Figure 5 shows the actual grinding depth, surface roughness, and glossiness of a single grinding pass. The actual grinding depth is larger on both sides of the shaft and smaller in the middle due to grinding wheel wear. With the decrease of actual grinding depth, the roughness value decreases and the glossiness increases, which is consistent with the effect of nominal grinding depth on surface quality. This reveals the mechanism of inconsistent surface quality. The actual grinding depth along the z-direction is inconsistent due to grinding wheel wear, so that the surface roughness and glossiness are inconsistent along the z-direction. In addition, the deflection of the shaft and grinding wheel under grinding force will also reduce the actual grinding depth. However, in this study, the shaft size is large and the grinding depth is small (less than 5 μm), so the influence of grinding force can be ignored.
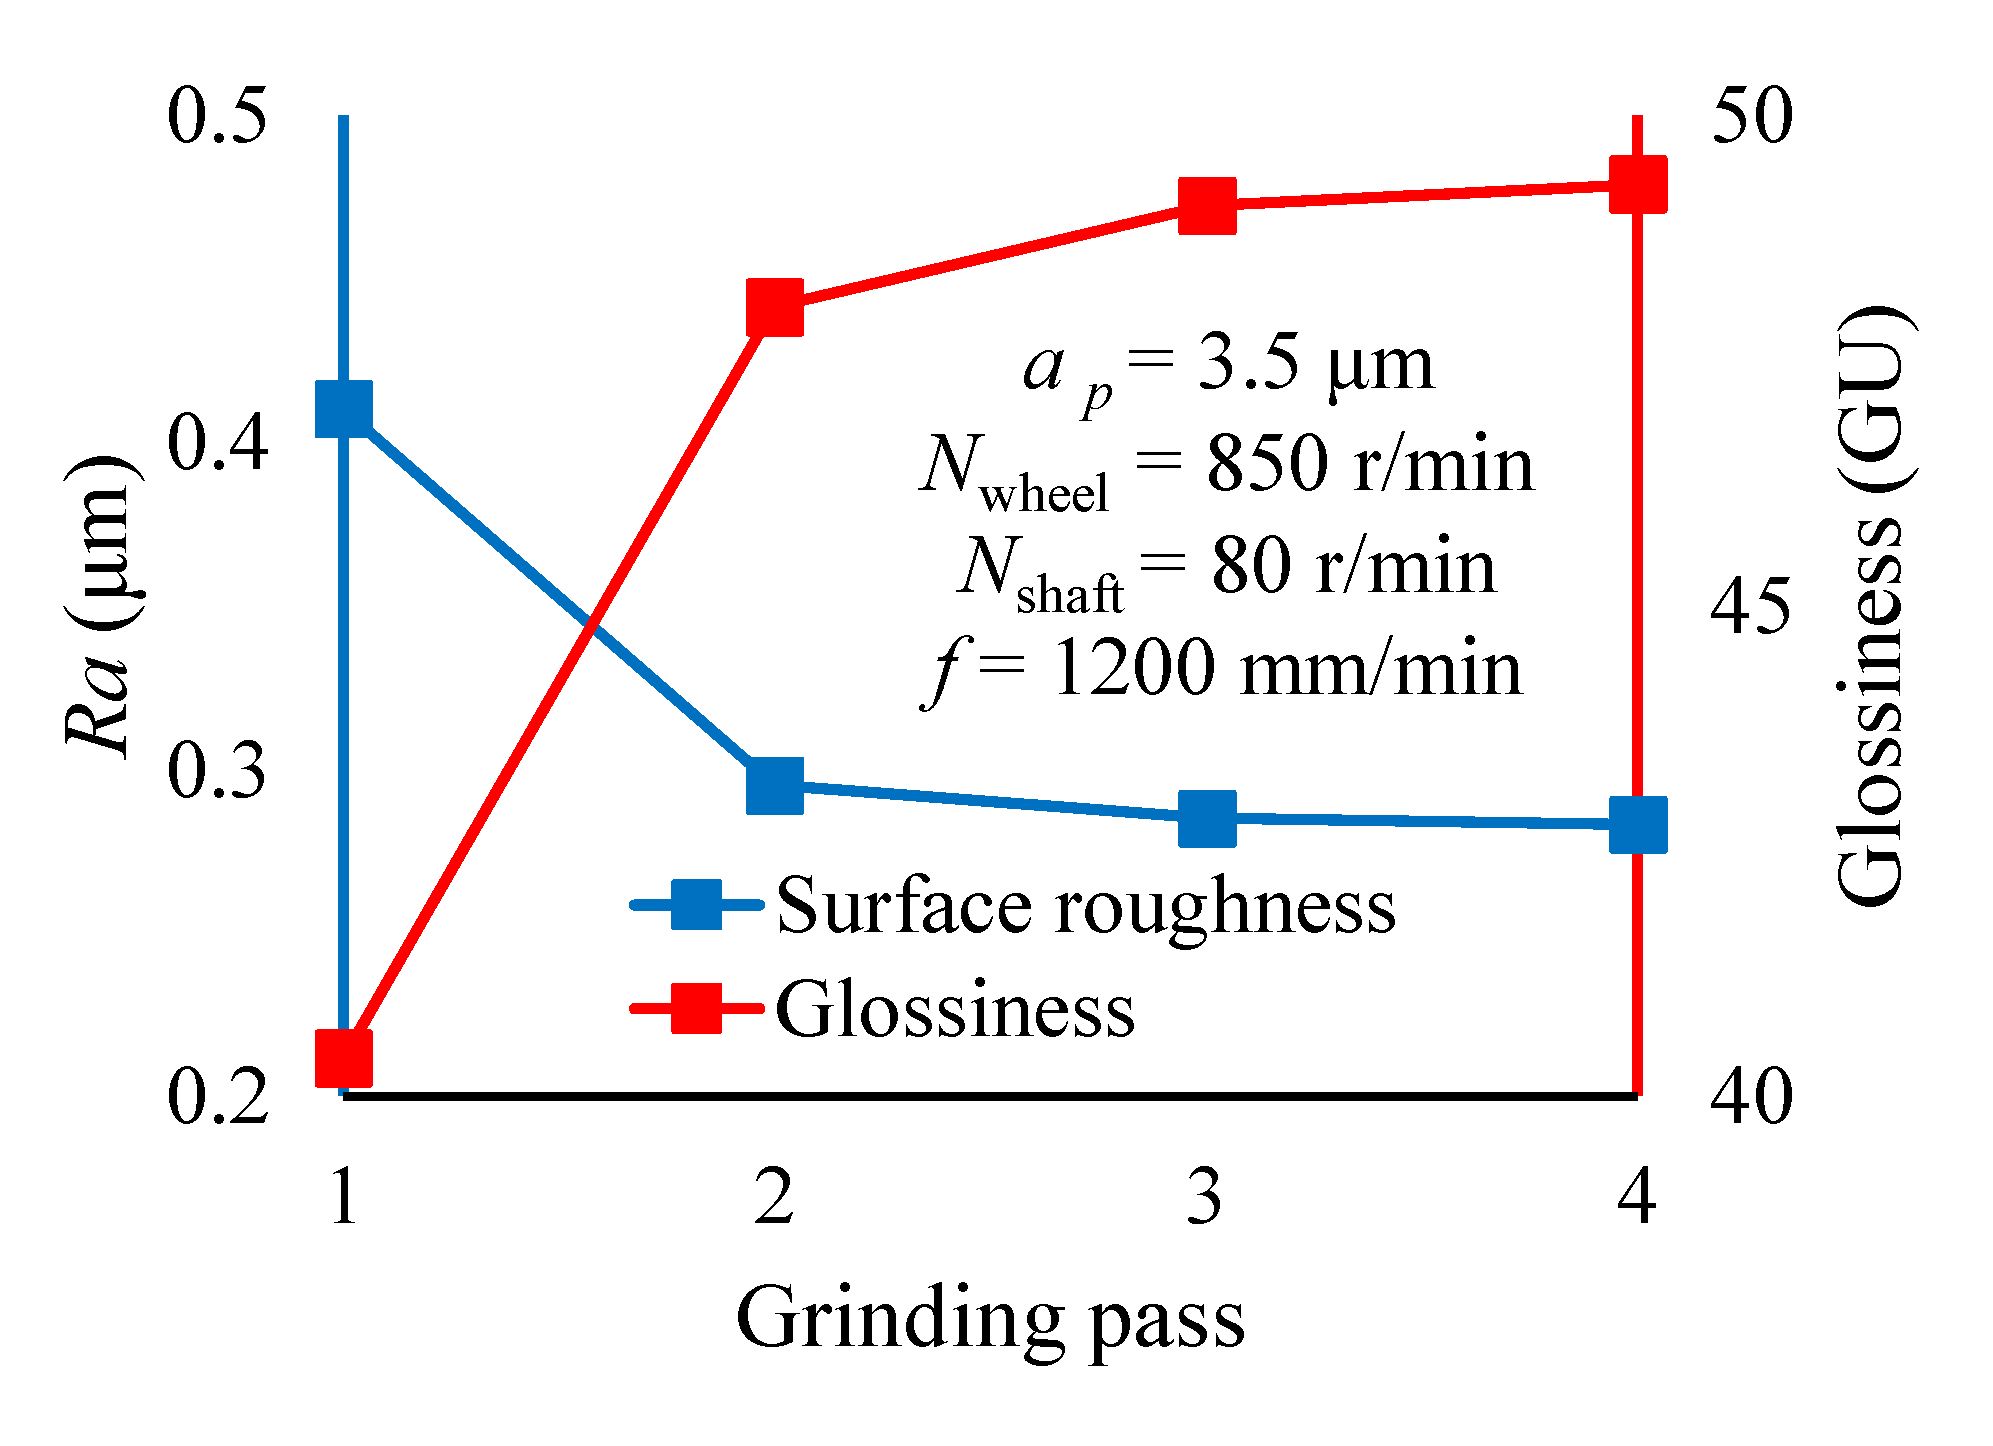
The grinding process of large shaft parts usually includes four stages: rough grinding, semi-finish grinding, finish grinding, and spark-out grinding. Each stage includes several grinding passes with the same parameters. In a grinding stage, even if the grinding parameters are the same, the surface roughness and glossiness after grinding are different. Figure 6 shows the surface roughness and glossiness of four consecutive passes with the same grinding parameters. The data in Figure 6 are the test values only at the measuring point at z = 800 mm. As can be seen from Figure 6, these two surface quality indicators change with the grinding passes. This indicates that the surface quality of large shaft parts in multi-pass grinding is affected by the quality of the previous grinding pass, showing evolutionary characteristics, rather than a simple correlation only with grinding parameters. It should be pointed out that the above conclusions are obtained when the material of workpiece is 92CrMo alloy steel. Considering that the material of the large shaft is essentially alloy steel, this conclusion applies to other large shafts made of different kinds of alloy steel.
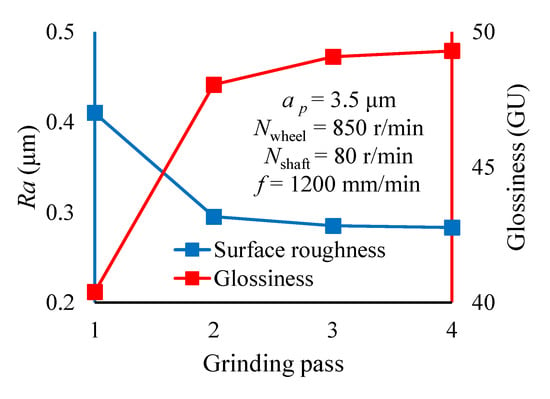
Figure 6.
The surface roughness and glossiness of four consecutive passes.
3. Surface Quality Evolution Model Based on Elman Neural Network
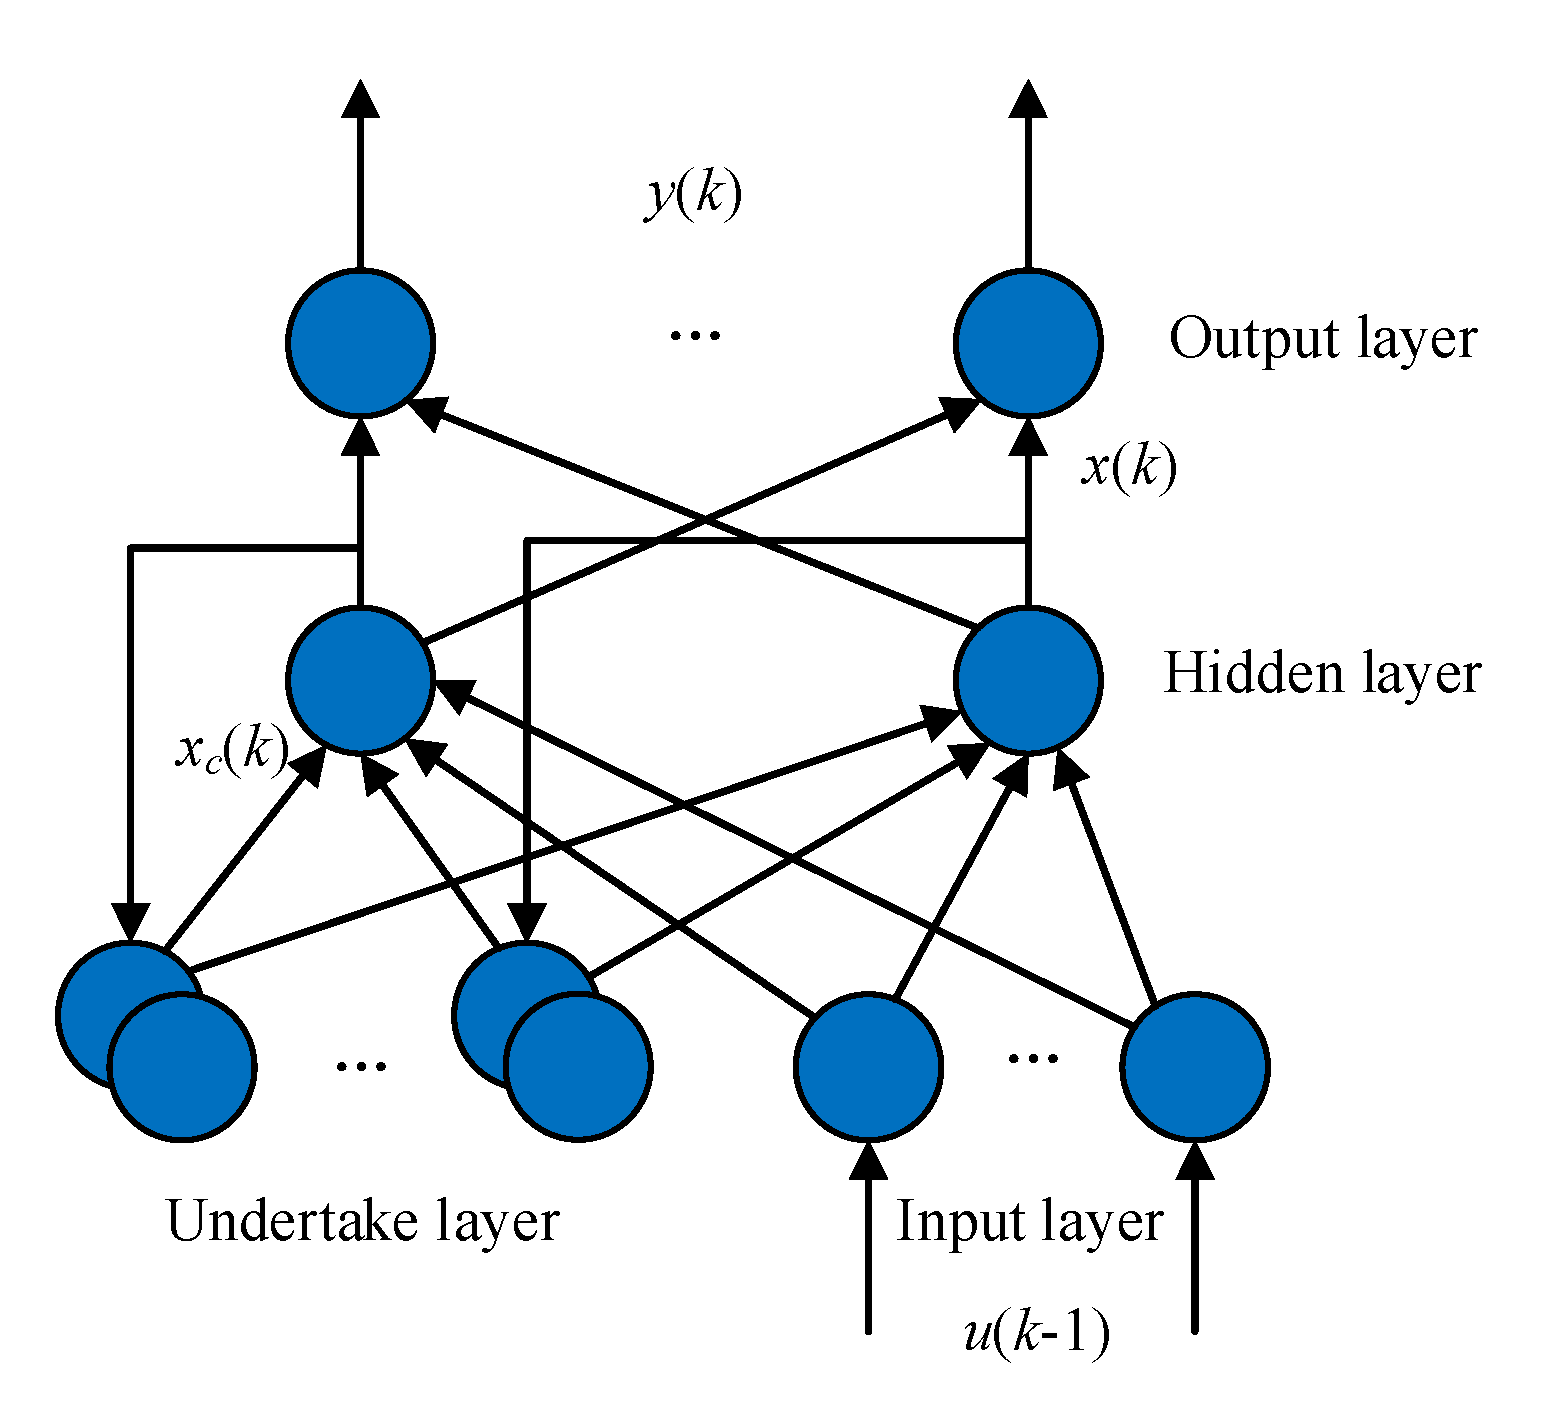
The analysis in Section 2.2 reveals that the surface quality has evolutionary characteristics. Therefore, the surface quality evolution model is established based on Elman neural network, which is suitable to process data with evolutionary characteristics. Elman neural network consists of input layer, hidden layer, undertake layer, and output layer, and its architecture is shown in Figure 7.
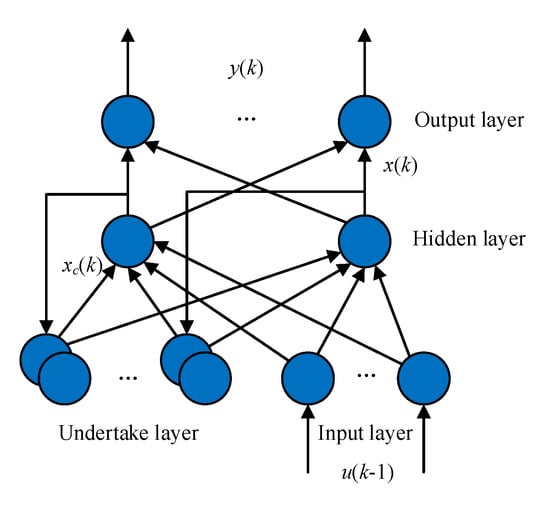
Figure 7.
Architecture of Elman neural network.
Assuming that the input of the network is u(k − 1), the output is y(k), the input of the hidden layer is x(k), and the output of the undertake layer is xc(k), the state space of the Elman neural network can be expressed as:
where , and are the weight matrices of the undertake layer, input layer, and hidden layer, respectively; f(·) and g(·) are the transfer functions of the input layer and the hidden layer, which are tansig function and purelin function, respectively. As can be seen from Equations (2)–(4), the input of the network includes not only the input of the input layer, but also the previous output value of the hidden layer, which makes the network sensitive to the historical state data and suitable to process data with evolutionary characteristics.
Based on the above analysis, the surface quality evolution model based on Elman neural network is developed. The models for surface roughness and glossiness are established respectively. For the model of surface roughness, Elman neural network is trained by the data from the full factor experiments. The input layer of the network has five nodes, which respectively correspond to the four grinding parameters of the current grinding pass, i.e., the actual grinding depth, grinding wheel speed, shaft speed and pallet speed, and the surface roughness of the previous grinding pass. The output of the network has one node that corresponds to the surface roughness of the current pass. The model of glossiness is similar to the model of surface roughness, except that the surface quality index of input and output is glossiness.
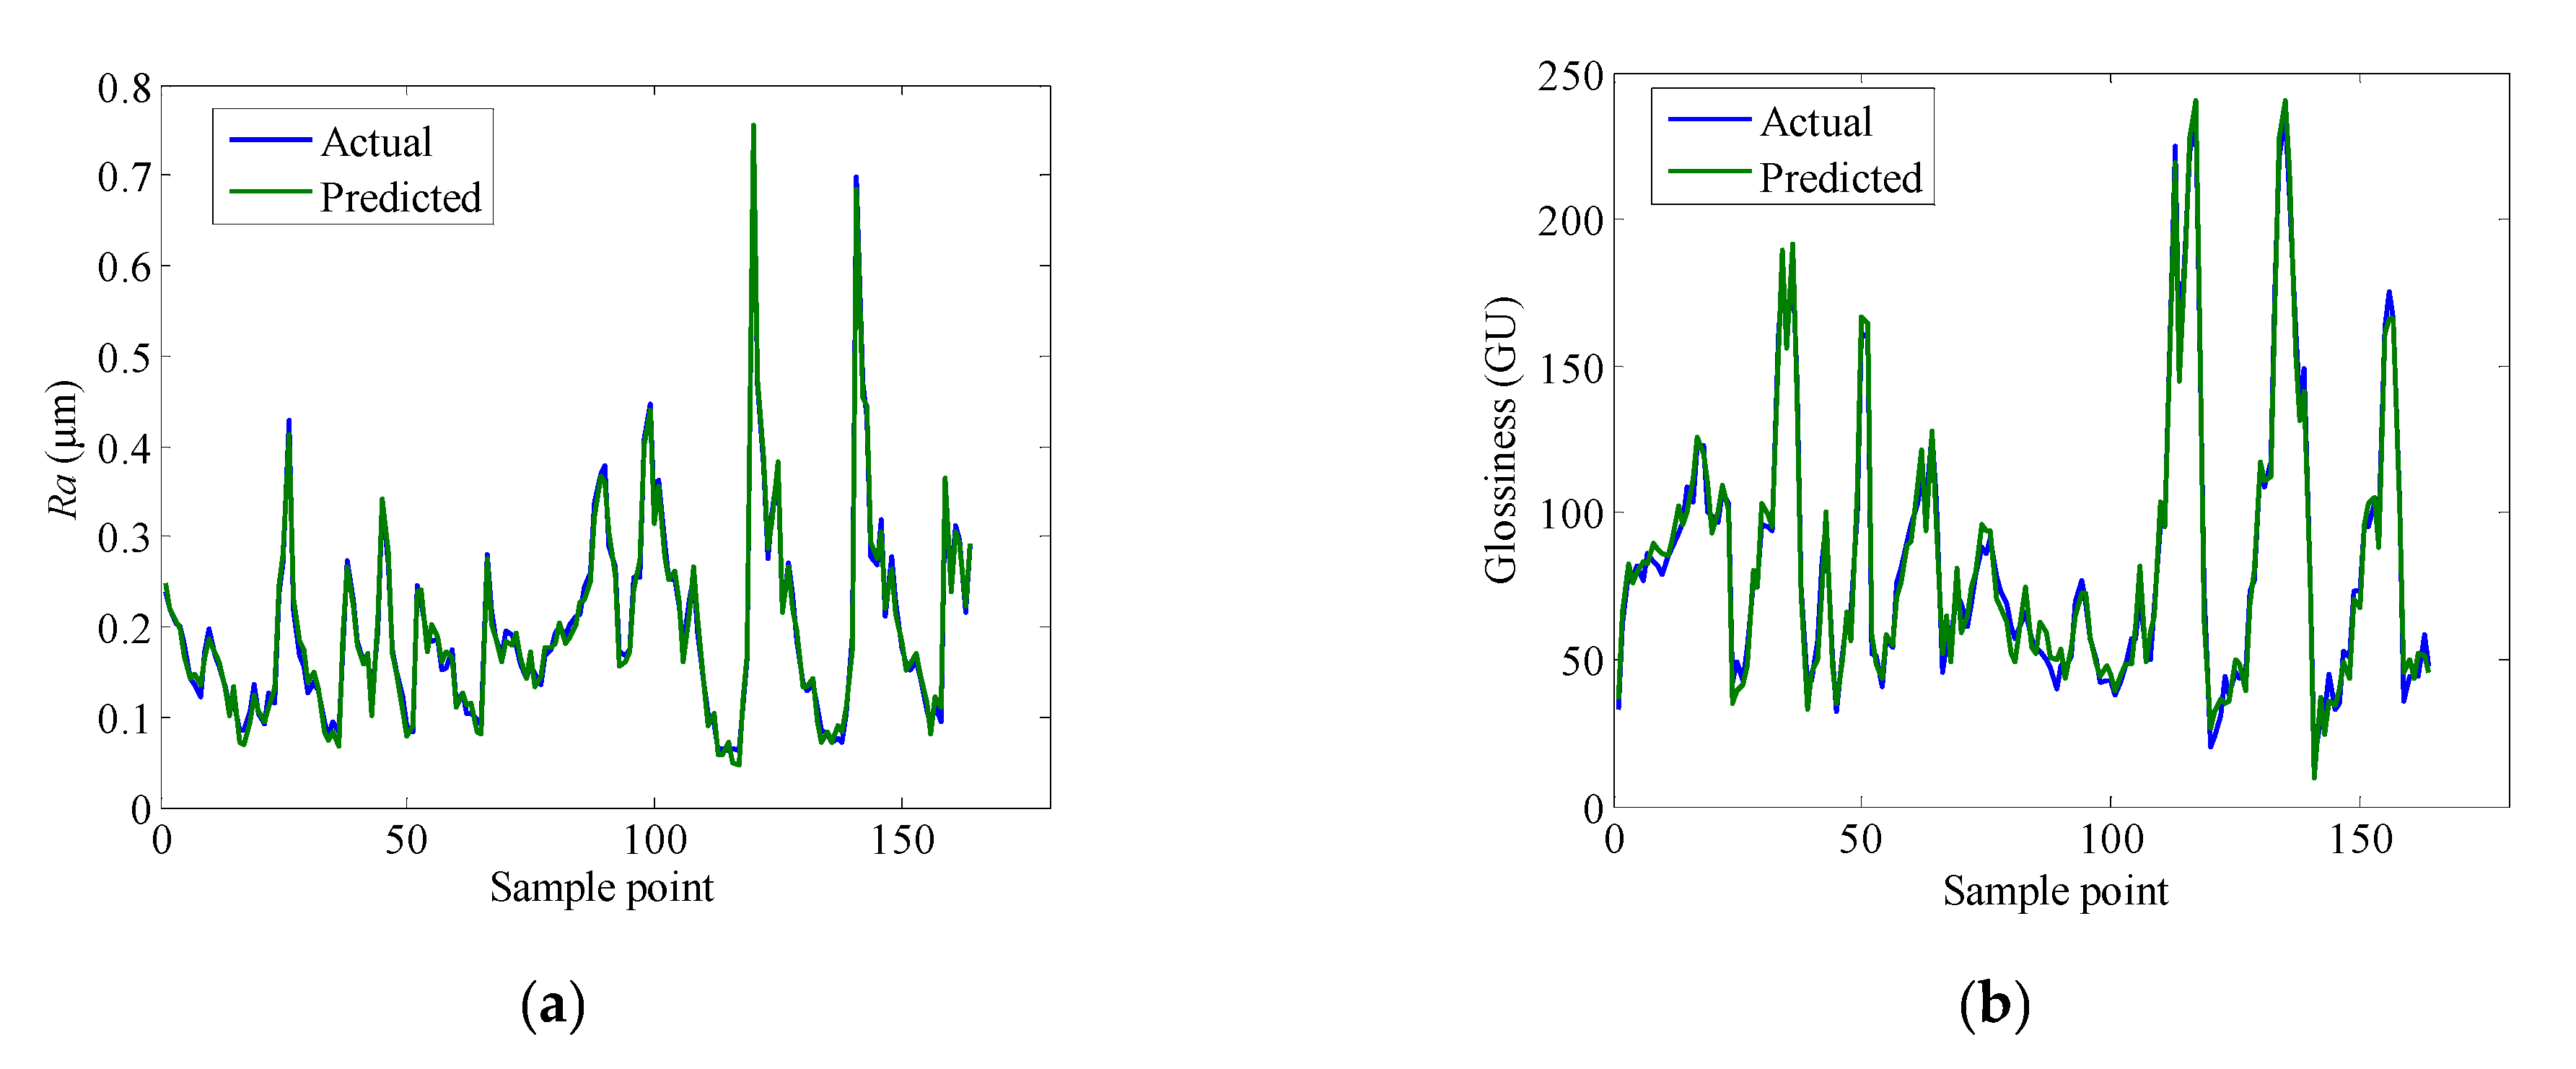
The surface quality evolution models for surface roughness and glossiness are trained using the data from the full factor experiment. The full factor experiments consist of 144 grinding passes, each of which contained six measuring points, resulting in a total of 864 samples. 700 samples are used for training and 164 samples for testing. After the training of 20,000 epochs, the prediction errors of surface roughness and glossiness reach 5.5% and 5.1%, respectively. The actual values of surface roughness and glossiness and predicted values from surface quality evolution models are shown in Figure 8.
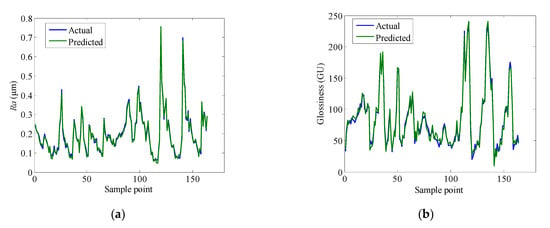
Figure 8.
Prediction performance of surface quality evolution models: (a) surface roughness, (b) glossiness.
In order to verify the superiority of the proposed model, the prediction accuracy of different modeling methods for surface roughness and glossiness is compared. Elman neural network is used in Models 1 to 3. The training samples and parameters are consistent with the proposed model, but there are some differences in the input and output of the model. Model 1 uses nominal grinding depth. Model 2 ignores the influence of the previous grinding surface quality; Model 3 uses nominal grinding depth and ignores the effect of the previous grinding surface quality. The prediction performance of these three models is shown in Table 3.

Table 3.
The prediction performance of different models for surface quality indexes.
It can be seen from Table 3 that the prediction errors of the proposed model for surface roughness and glossiness are minimal. This proves that the grinding surface quality index is affected by the actual grinding depth and the quality of the previous grinding, and also proves the superiority of the proposed model.
4. Consistency Control Method of Surface Quality in Rough Machining
4.1. The Principle of Consistency Control Method of Surface Quality
Since the surface quality is affected by actual grinding depth, a consistency control method of surface quality is proposed based on adjustment of actual grinding depth. Considering the grinding depth is quite small in practice, the adjustment of actual grinding depth is only performed in rough grinding.
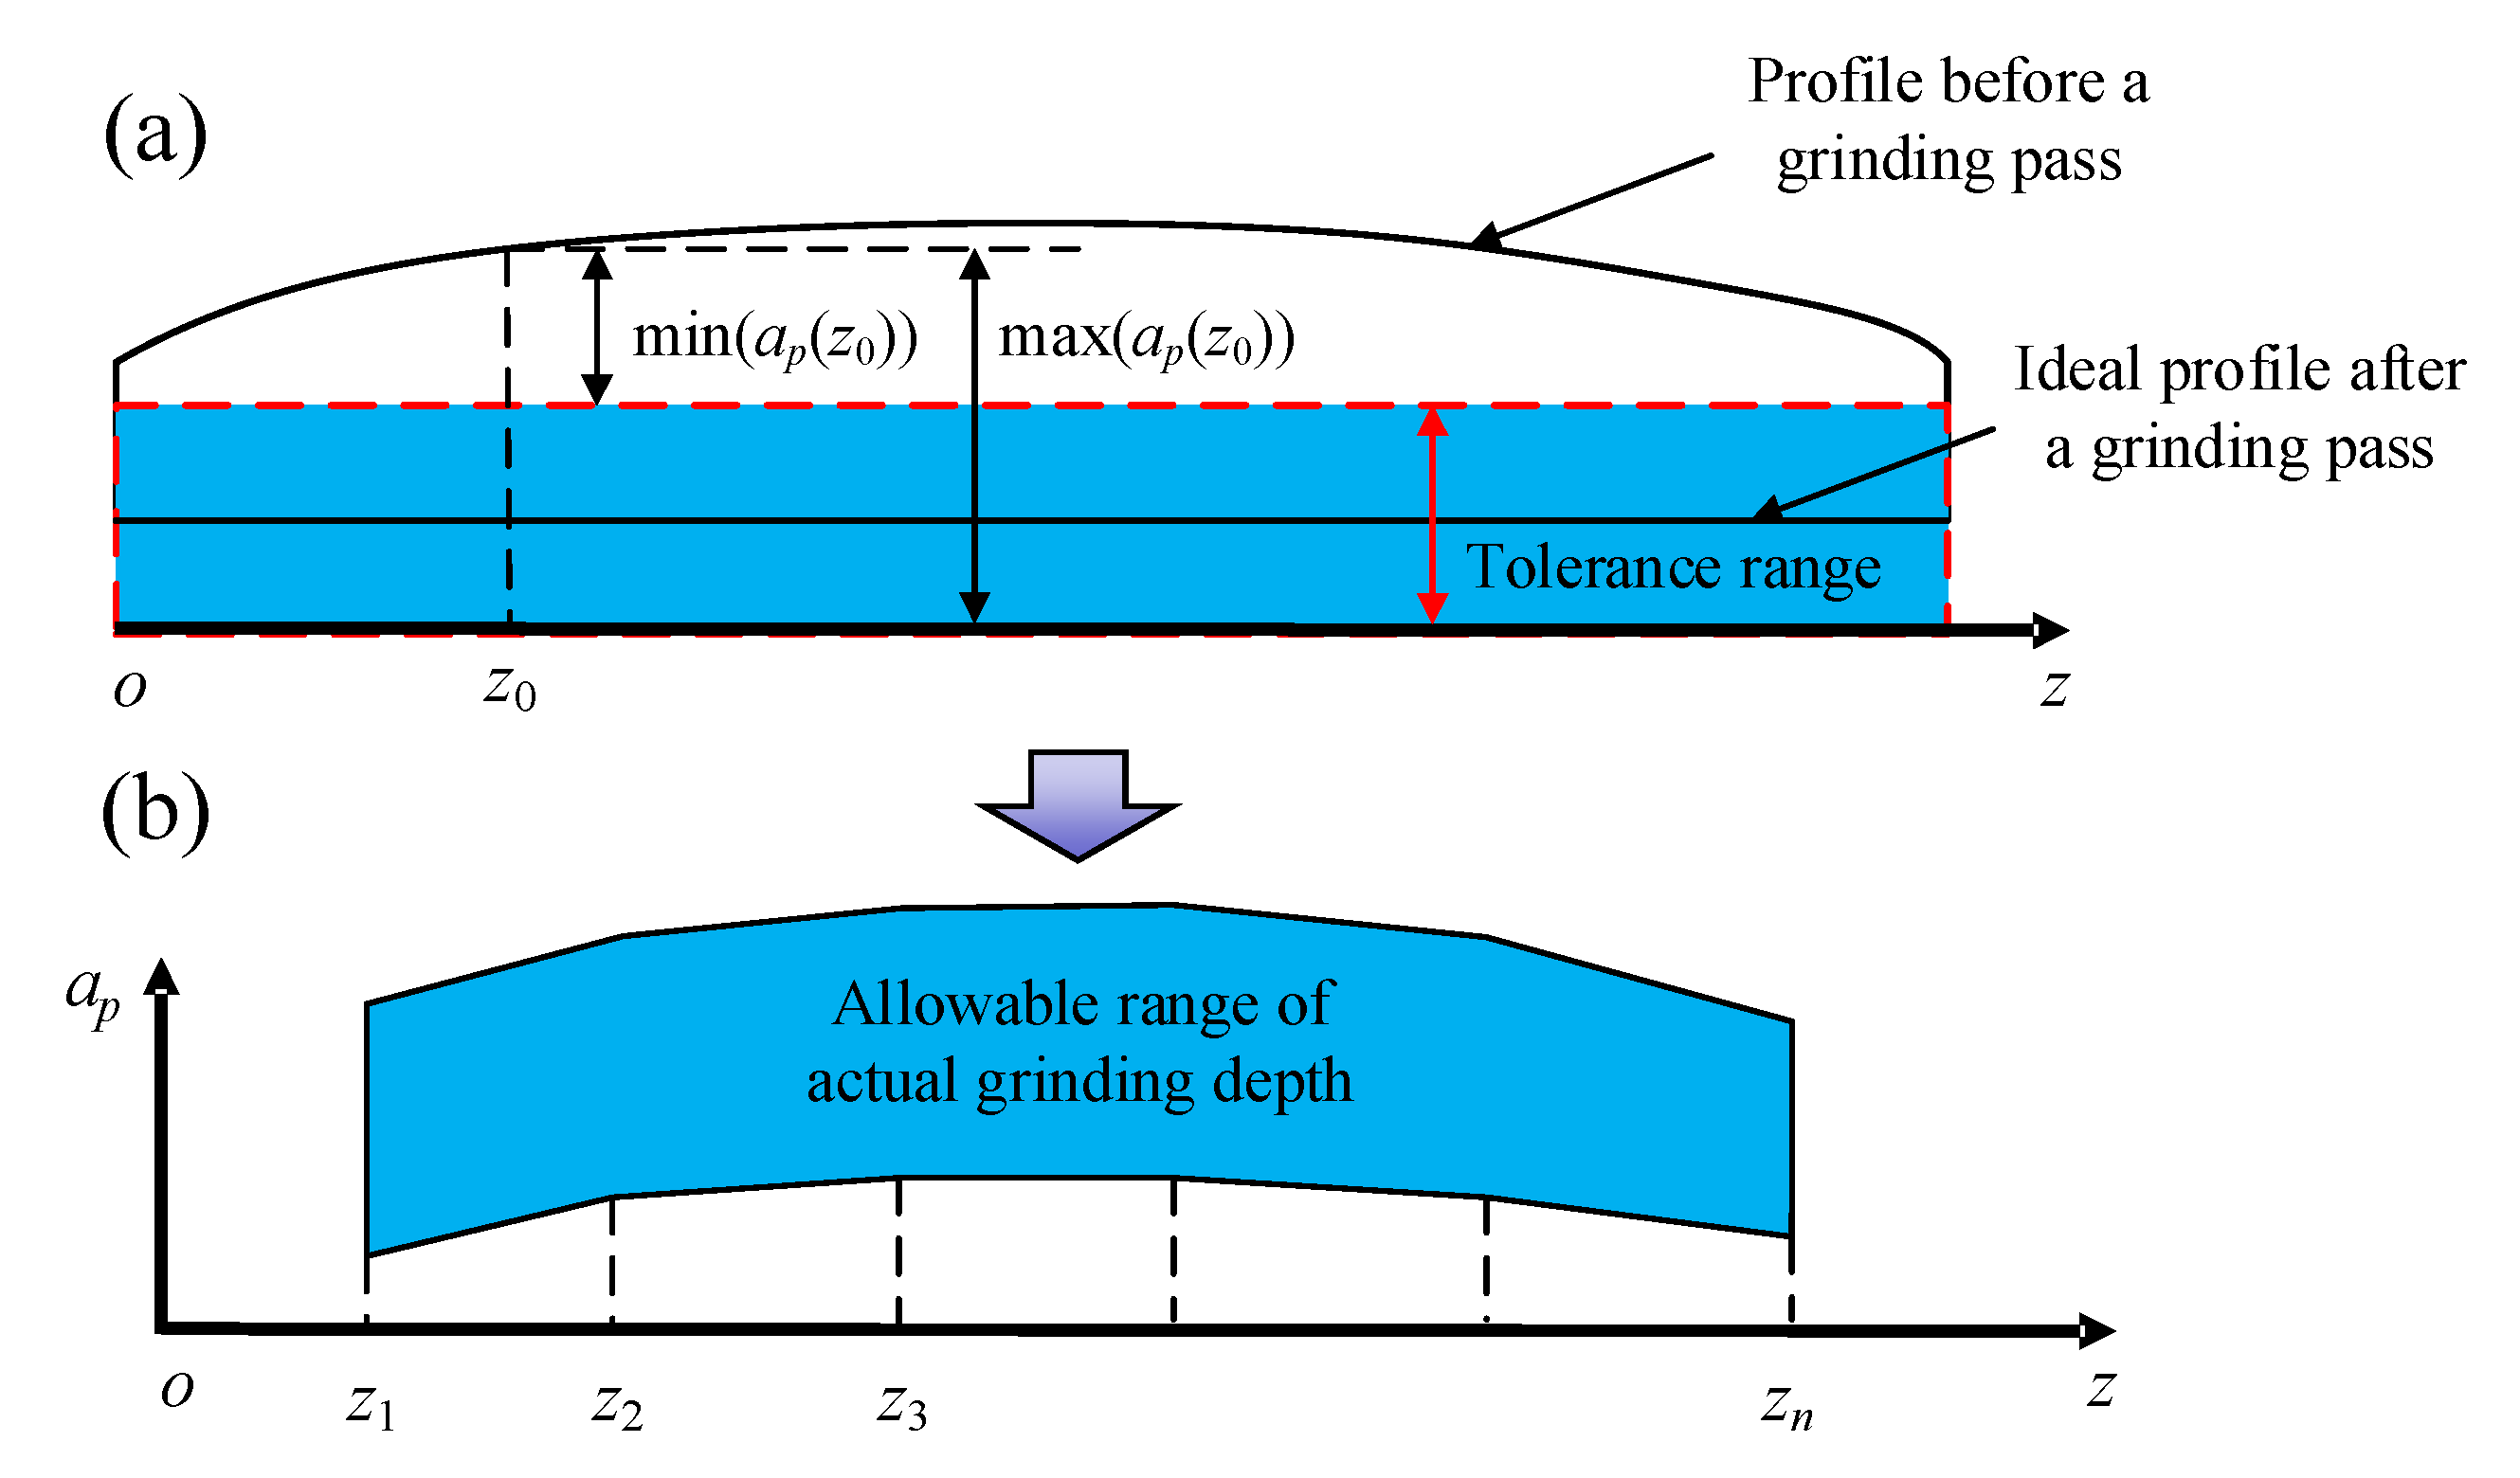
The principle of the adjustment of actual grinding depth is shown in Figure 9. The profile of the shaft before a grinding pass and the ideal profile after a grinding pass are shown in Figure 9a. The blue area is the tolerance range. The maximum and minimum values of the actual grinding depth allowed at z0 are max(ap(z0)) and min(ap(z0)), respectively. Therefore, the allowable range of the actual grinding depth along the z-direction can be obtained, as shown in Figure 9b.
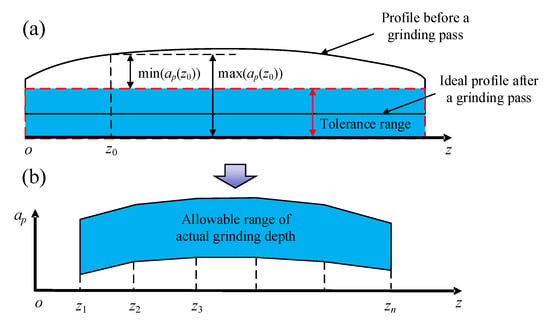
Figure 9.
The principle of the adjustment of actual grinding depth: (a) the profile of the shaft before a grinding pass and the ideal profile after a grinding pass, (b) the allowable range of the actual grinding depth.
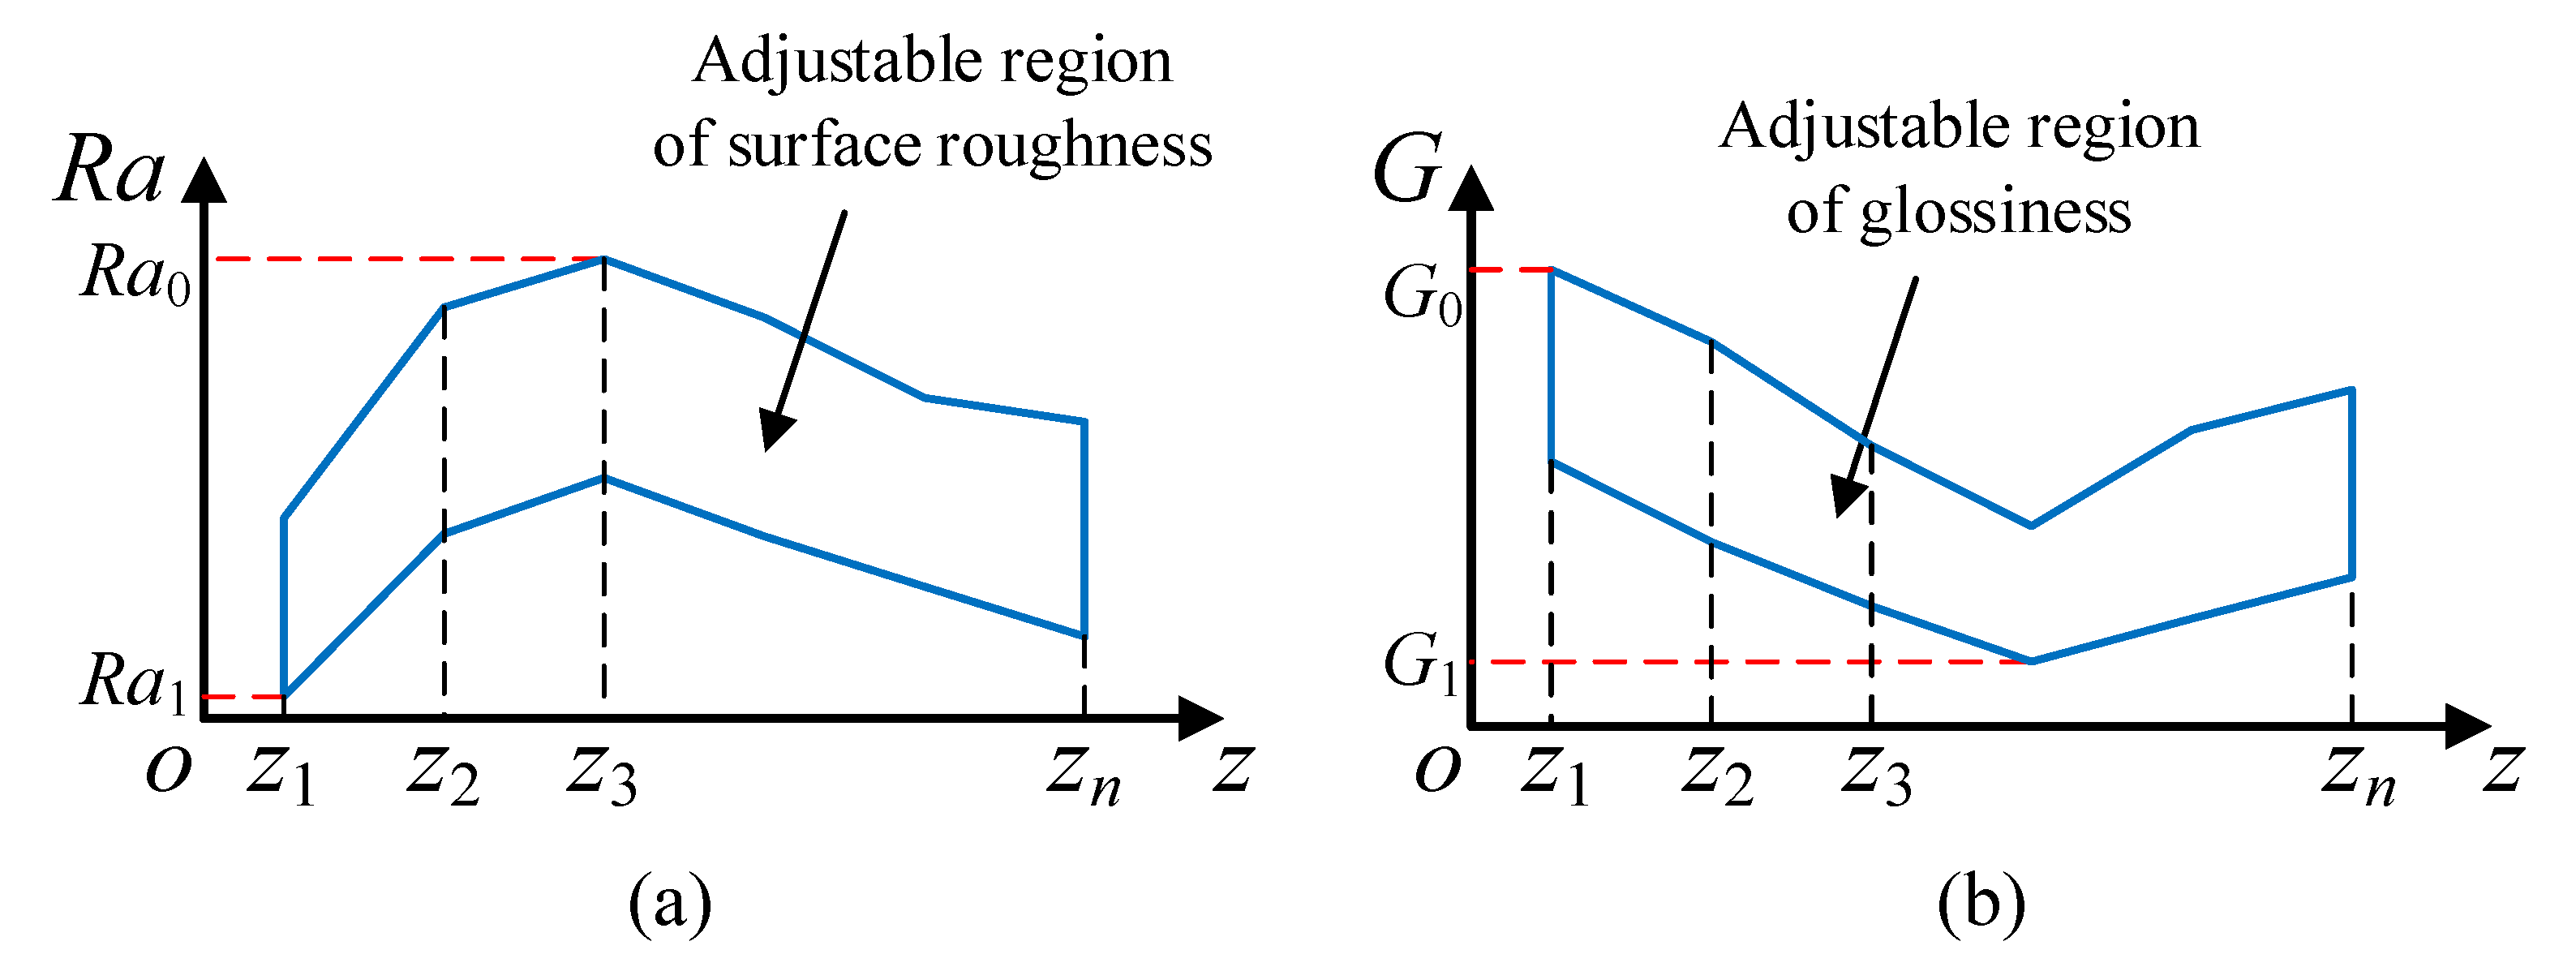
Several points z1, z2...zn are selected along the z-direction. According to the actual grinding depth range allowed at each point and the surface quality evolution model established in Section 4, the adjustable region of surface roughness and glossiness can be obtained as shown in Figure 10. The maximum values and minimum values of surface roughness and glossiness of the adjustable region are Ra0, Ra1, G0, and G1.
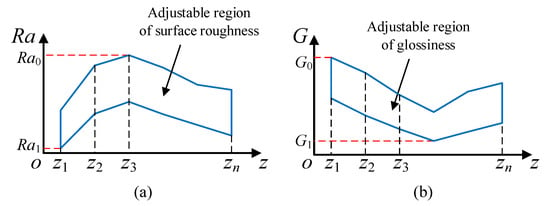
Figure 10.
The adjustable region of (a) surface roughness and (b) glossiness.
The comprehensive index of surface quality, C, is defined as:
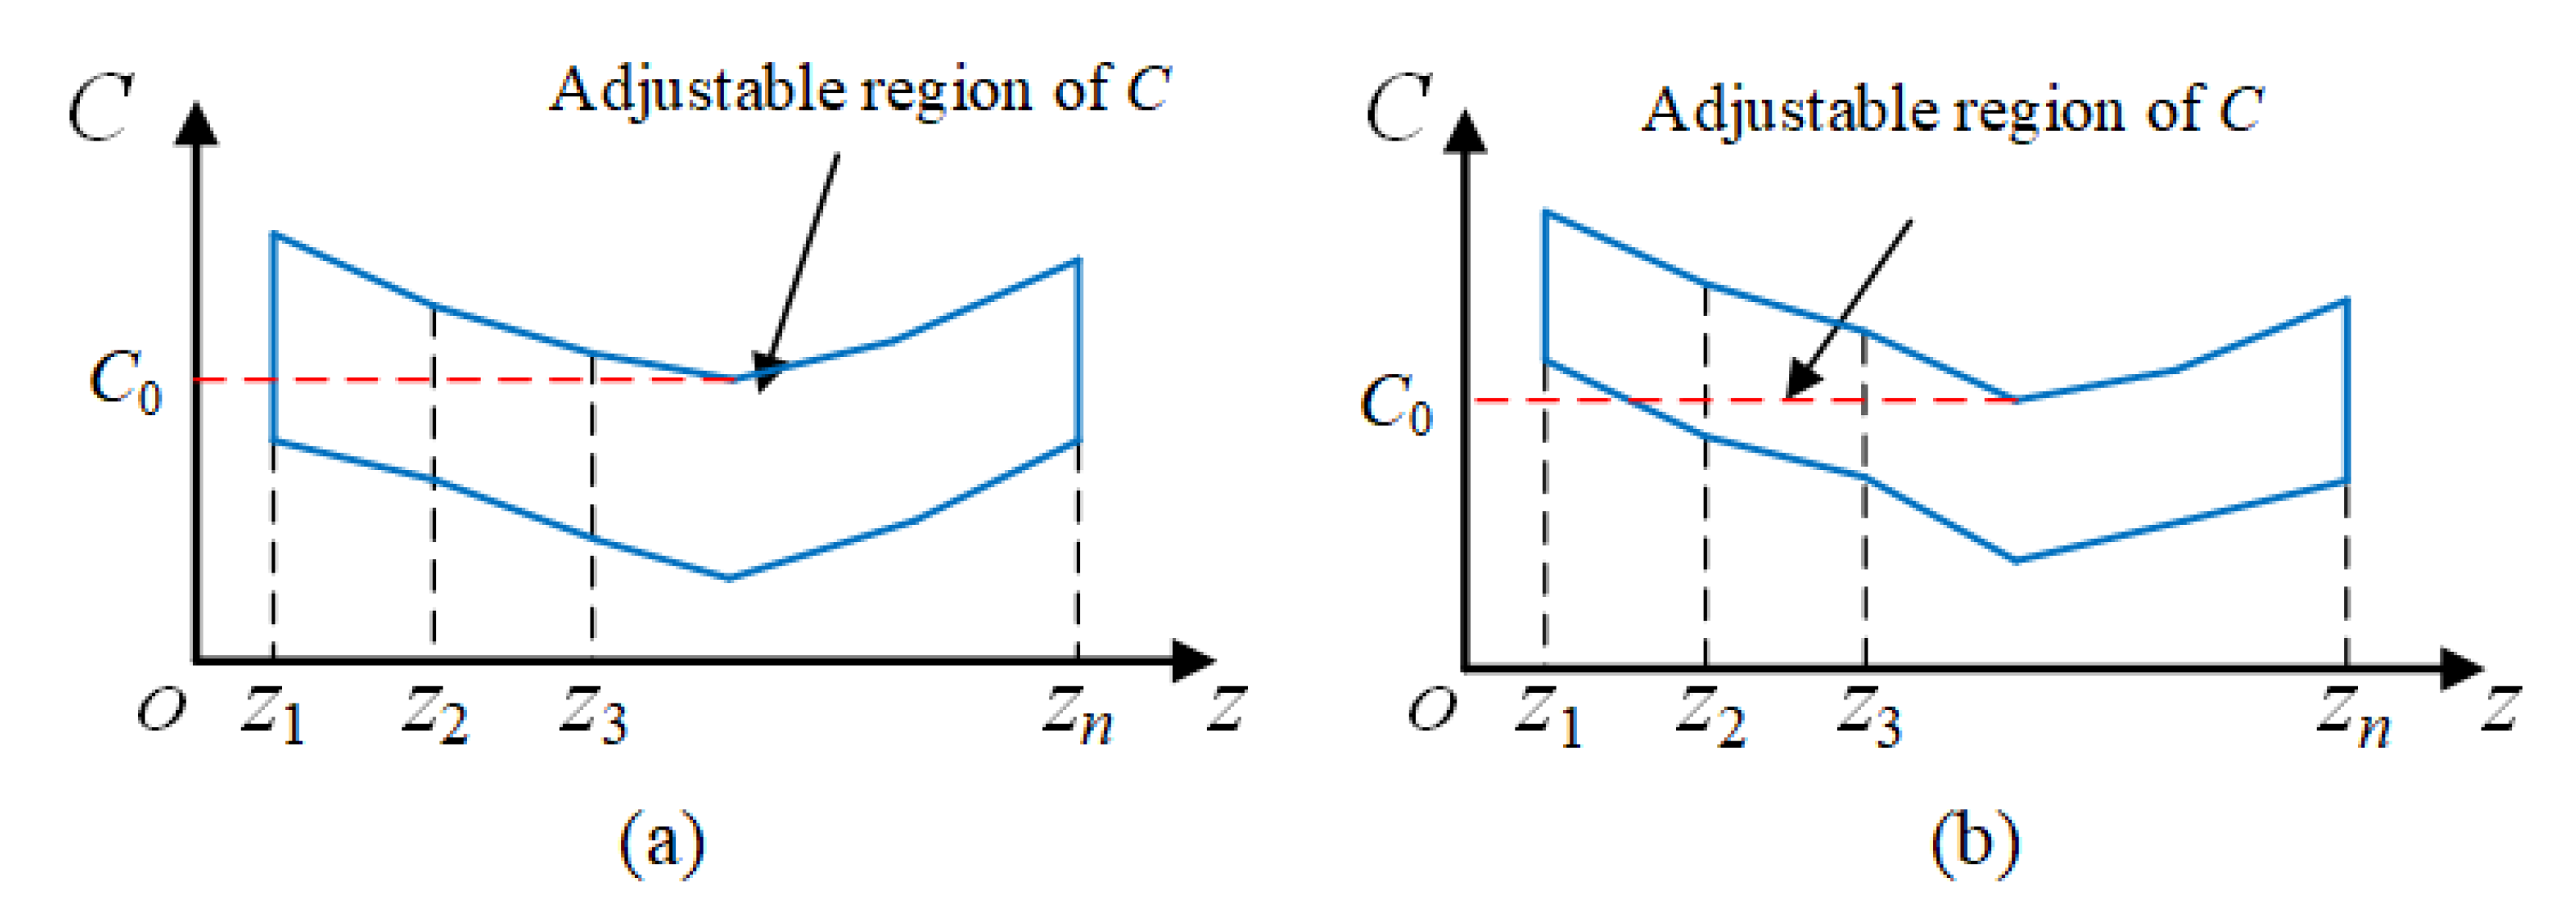
The adjustable range of the comprehensive index of surface quality will have two situations, as shown in Figure 11. In Figure 11a, the minimum value of the upper bound of the adjustable region is completely contained within the adjustable region. Therefore, C of each point can reach C0 by adjusting the actual grinding depth. In Figure 11b, the minimum value of the upper bound of the adjustable region is not fully contained within the adjustable region. Then, the points that can obtain C0 are adjusted to obtain C0, and the points that cannot obtain C0 are adjusted to the value closest to C0.
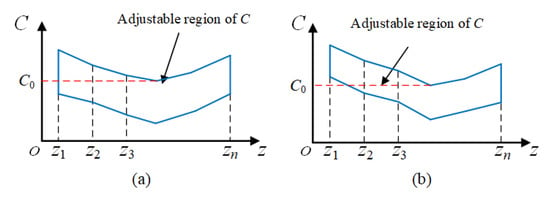
Figure 11.
The adjustable region of C: (a) the adjustable region of C for situation 1, (b) the adjustable region of C for situation 2.
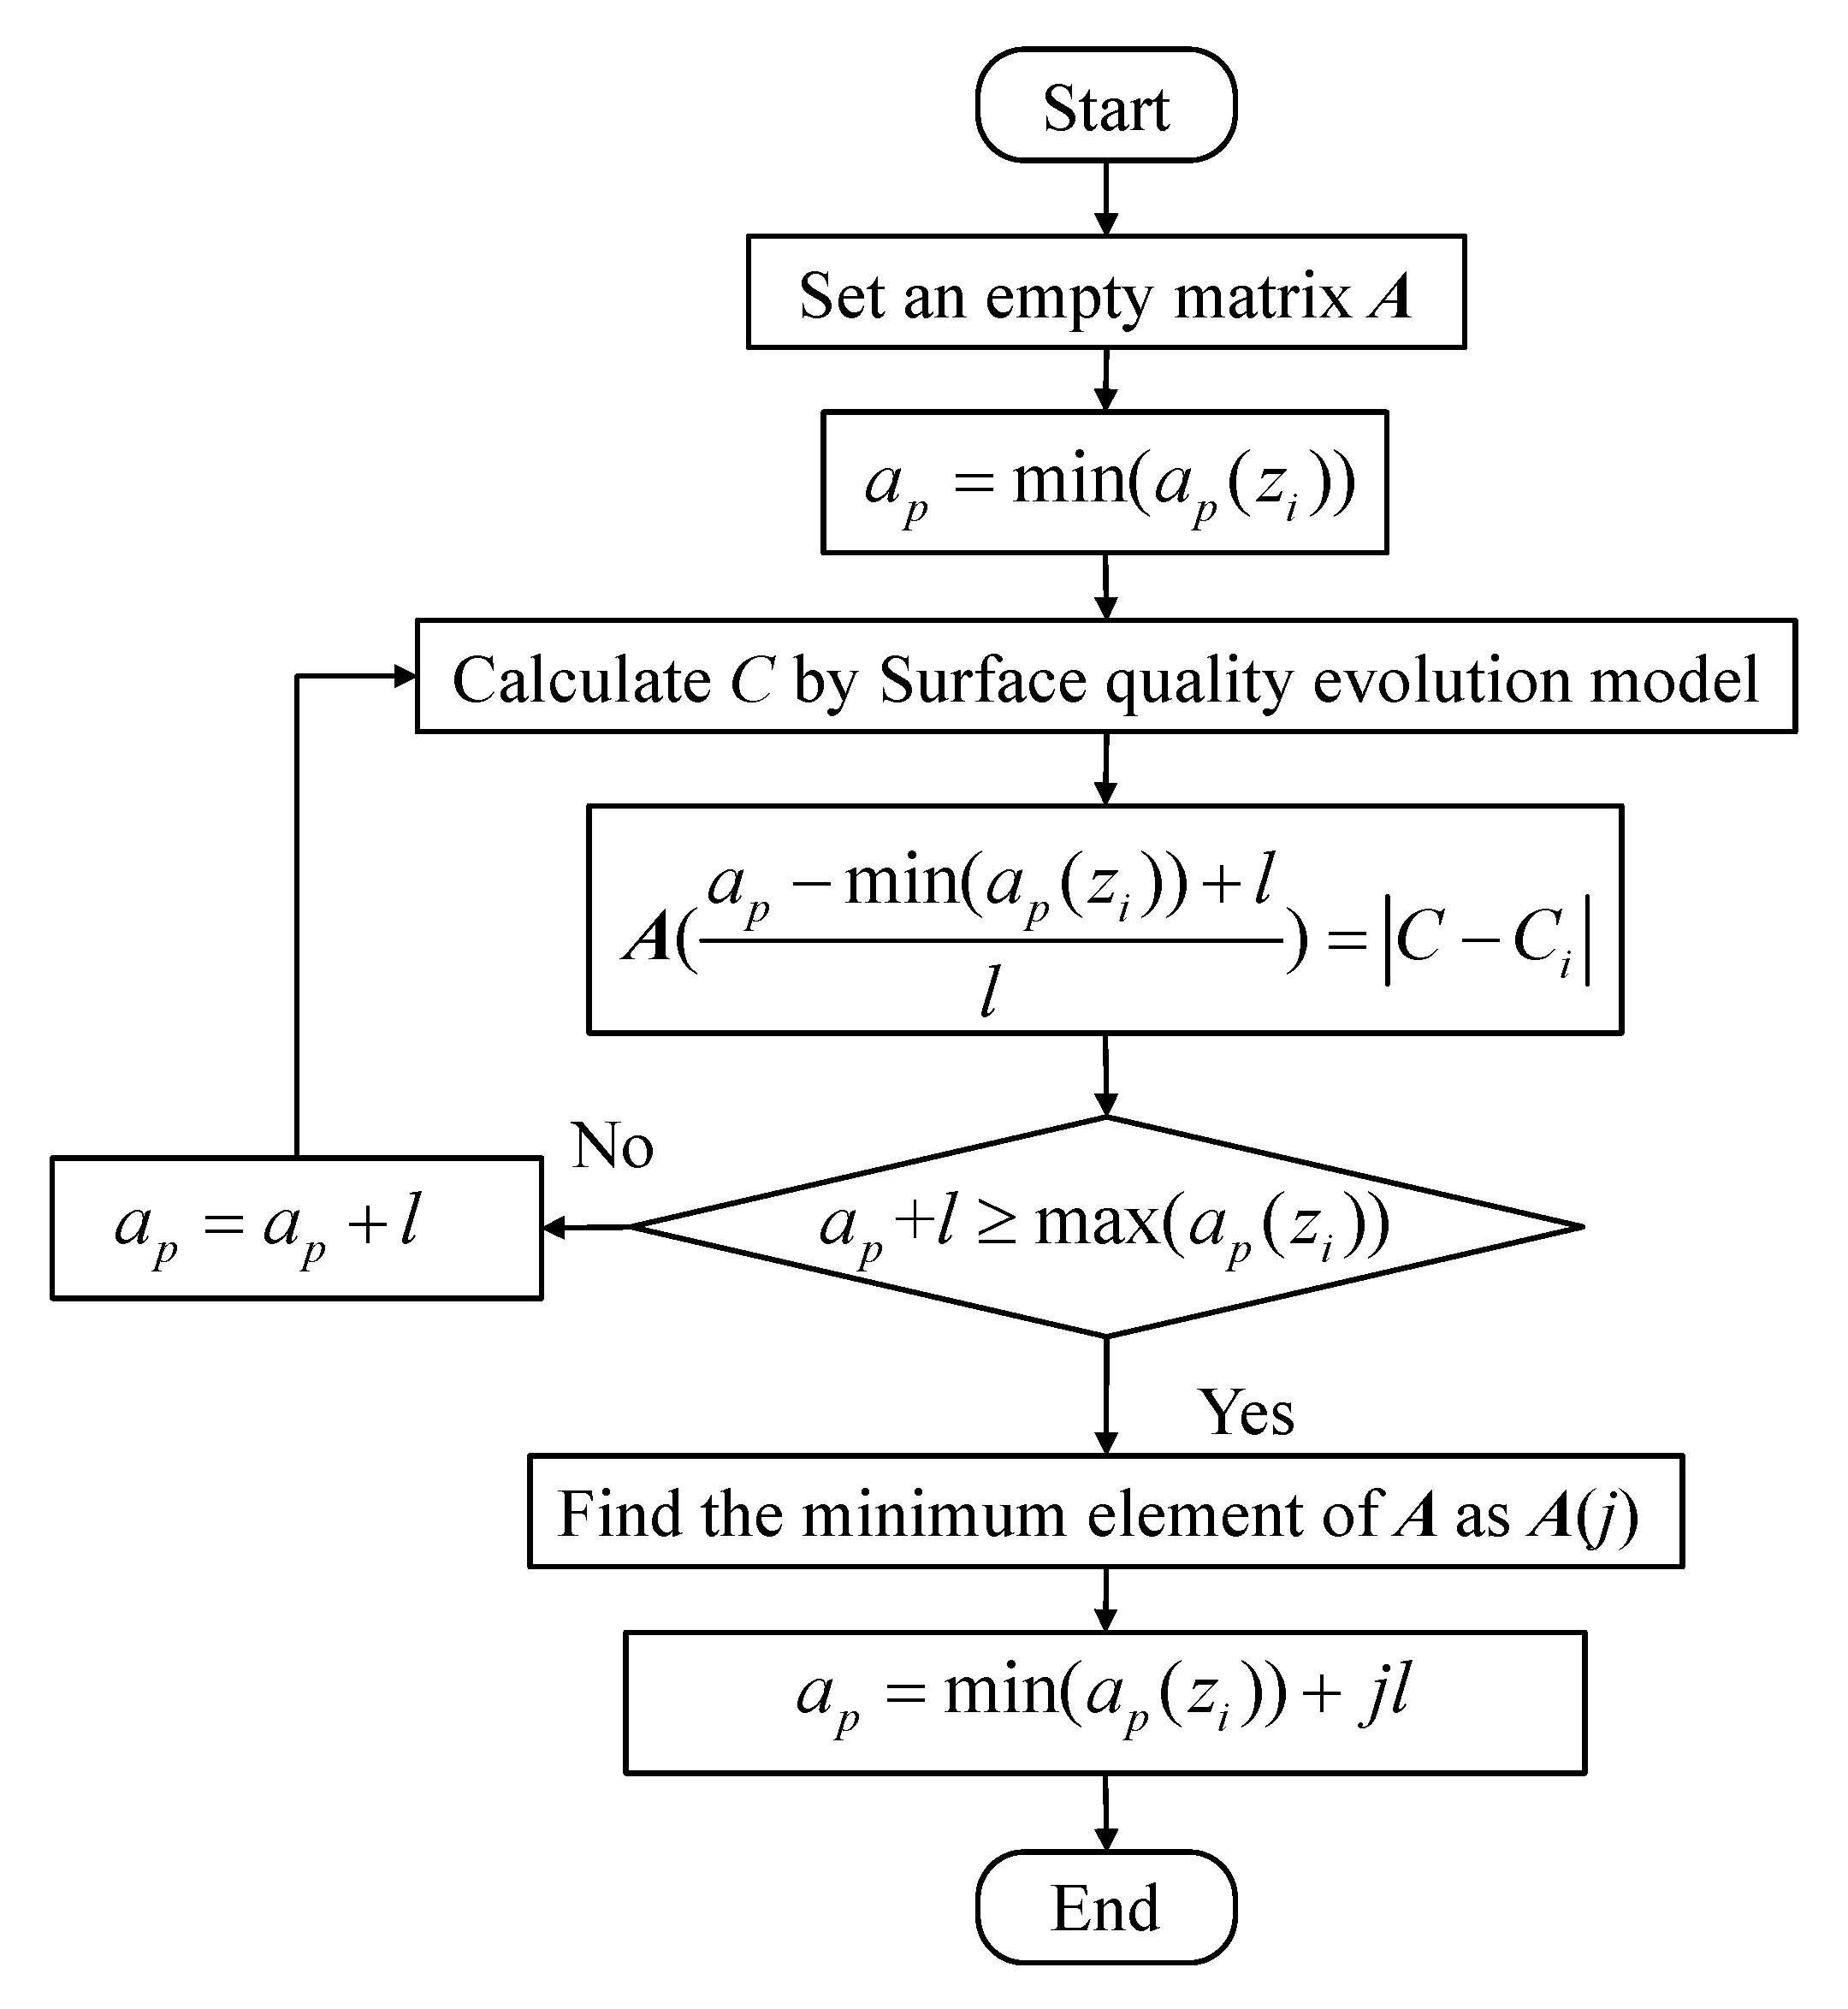
The process of obtaining the desired comprehensive index Ci for point zi by grinding depth adjustment is shown in Figure 12.
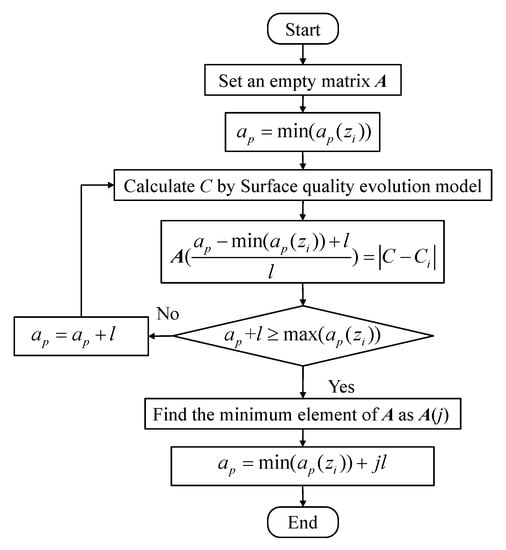
Figure 12.
The process of obtaining the desired comprehensive index Ci for point zi.
In Figure 12, l is the iteration step length. After obtaining the actual grinding depth values of each point, the actual grinding depth curve along the z-direction is generated by B-spline interpolation.
4.2. The Compensation Method to Guarantee the Actual Grinding Depth
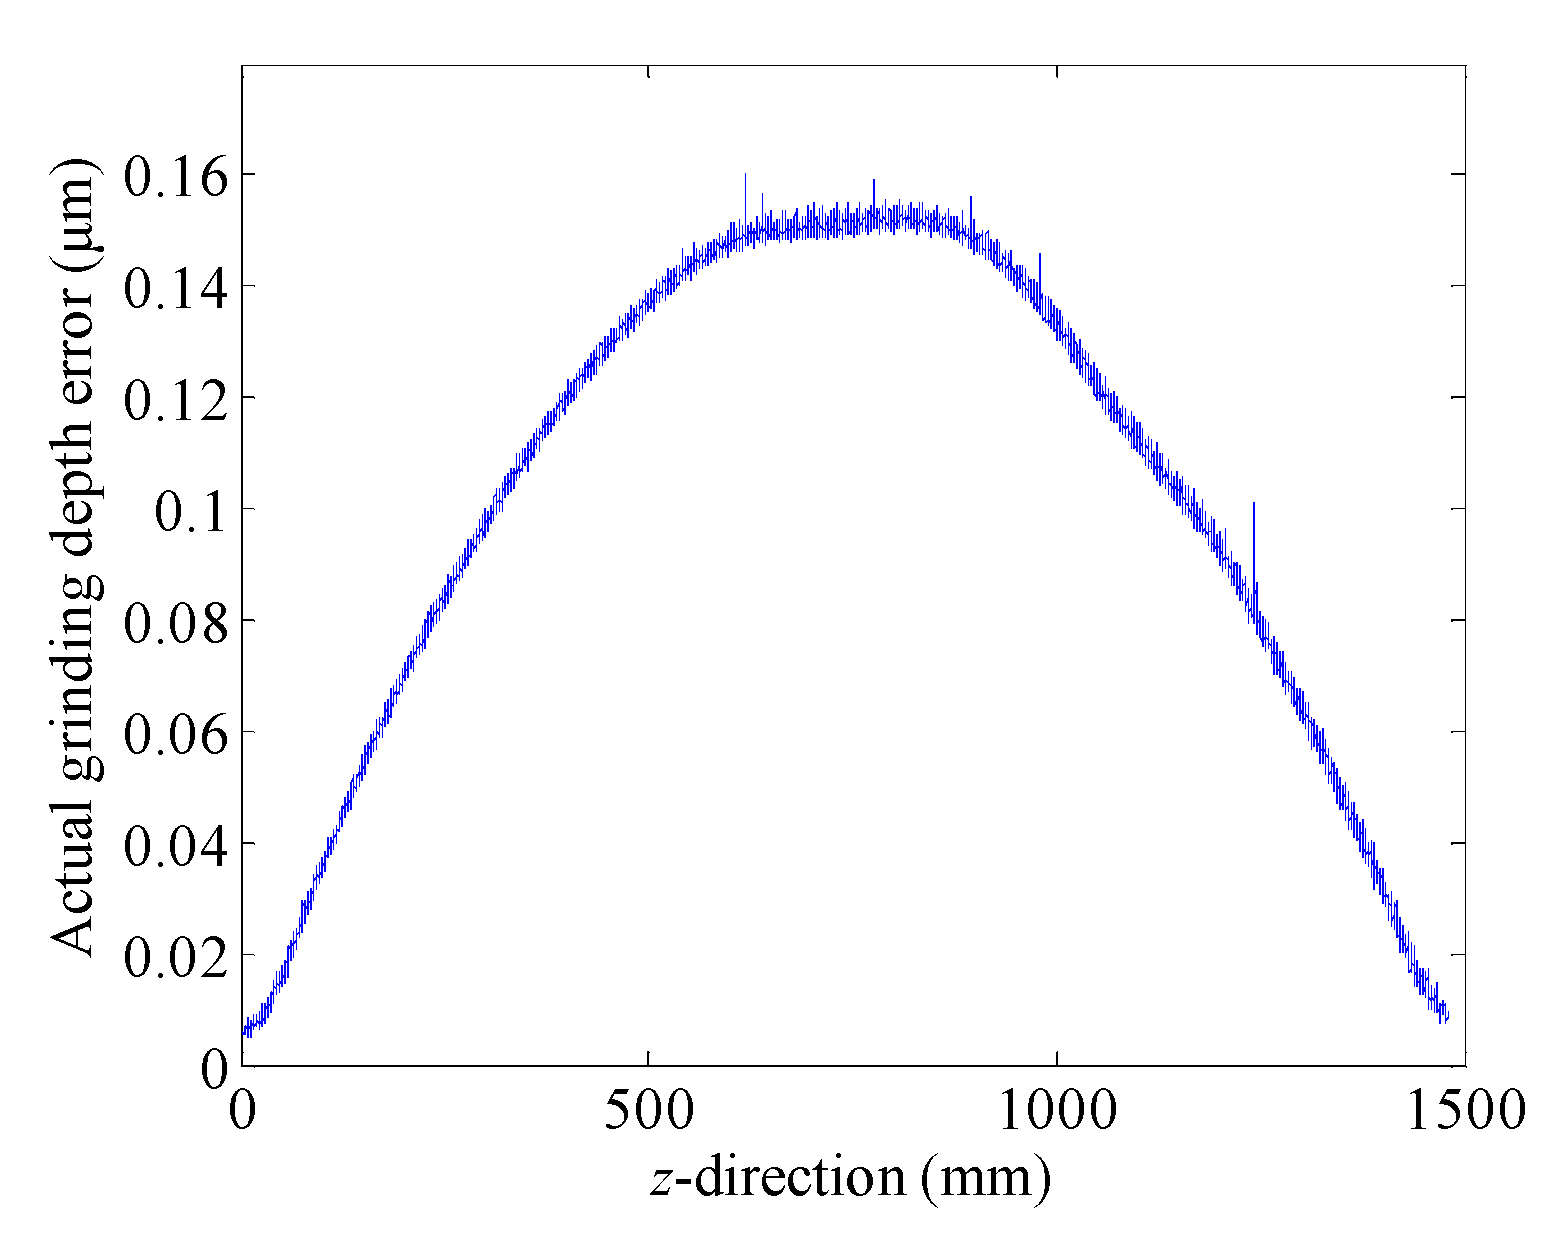
Our previous research indicated that grinding wheel wear is the main factor causing grinding dimensional error of large shaft parts, and the dimensional error model based on grinding wheel wear and compensation method was proposed [2]. Therefore, dimensional errors can be predicted based on grinding process parameters and shaft profiles. Based on the predicted dimensional error, the grinding wheel path can be adjusted to guarantee the actual grinding depth. Experiments show that the actual grinding depth error of the compensation method in reference [2] is only 0.16 μm for the shaft when the nominal grinding depth is 5 μm in this study as shown in Figure 13. It is proved that the compensation method is effective and the main factor causing grinding dimensional error is grinding wheel wear.
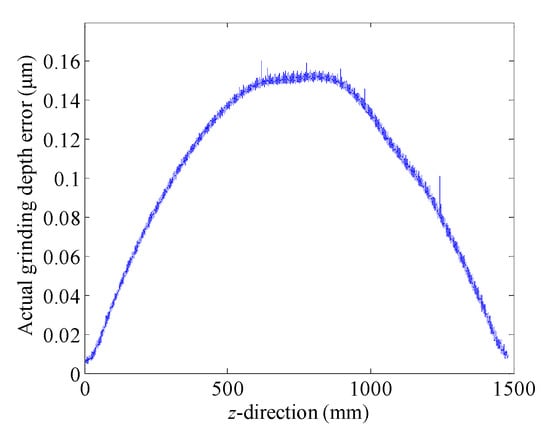
Figure 13.
Actual grinding depth error after compensation.
5. Case Study
5.1. Experimental Set Up
A case study is conducted in this section to verify the proposed methods, i.e., the surface quality evolution model and a consistency control method of surface quality. The grinding machine, grinding wheel, workpiece, and testing instruments used in the experiment are the same as those described in Section 2.
In case study, the complete grinding process is carried out, including rough grinding, semi-finish grinding, finish grinding, and spark-out grinding. The parameters of these four grinding stages are shown in Table 4.

Table 4.
The parameters of grinding process.
Six measuring points are selected on the axis with z-coordinates of 200, 400, 600, 800, 1000, and 1200 mm, respectively. Before each grinding pass in the rough grinding, the profile of the shaft along the z-direction is measured and the actual grinding depth is adjusted by the consistency control method. The dimensional error is predicted according to the process parameters, and the grinding wheel pass is adjusted by compensation method to guarantee the actual grinding depth. The iteration step length l is 0.02 μm, and the tolerance range of machining error is 1 μm in rough grinding. In the semi-finish grinding and finish grinding, only the dimensional error is compensated, while the consistency of surface quality is not controlled. In spark-out grinding, the grinding wheel path is not adjusted, since the grinding depth is 0. After each grinding pass, the surface roughness and glossiness of the measuring points are tested.
5.2. Results and Discussion
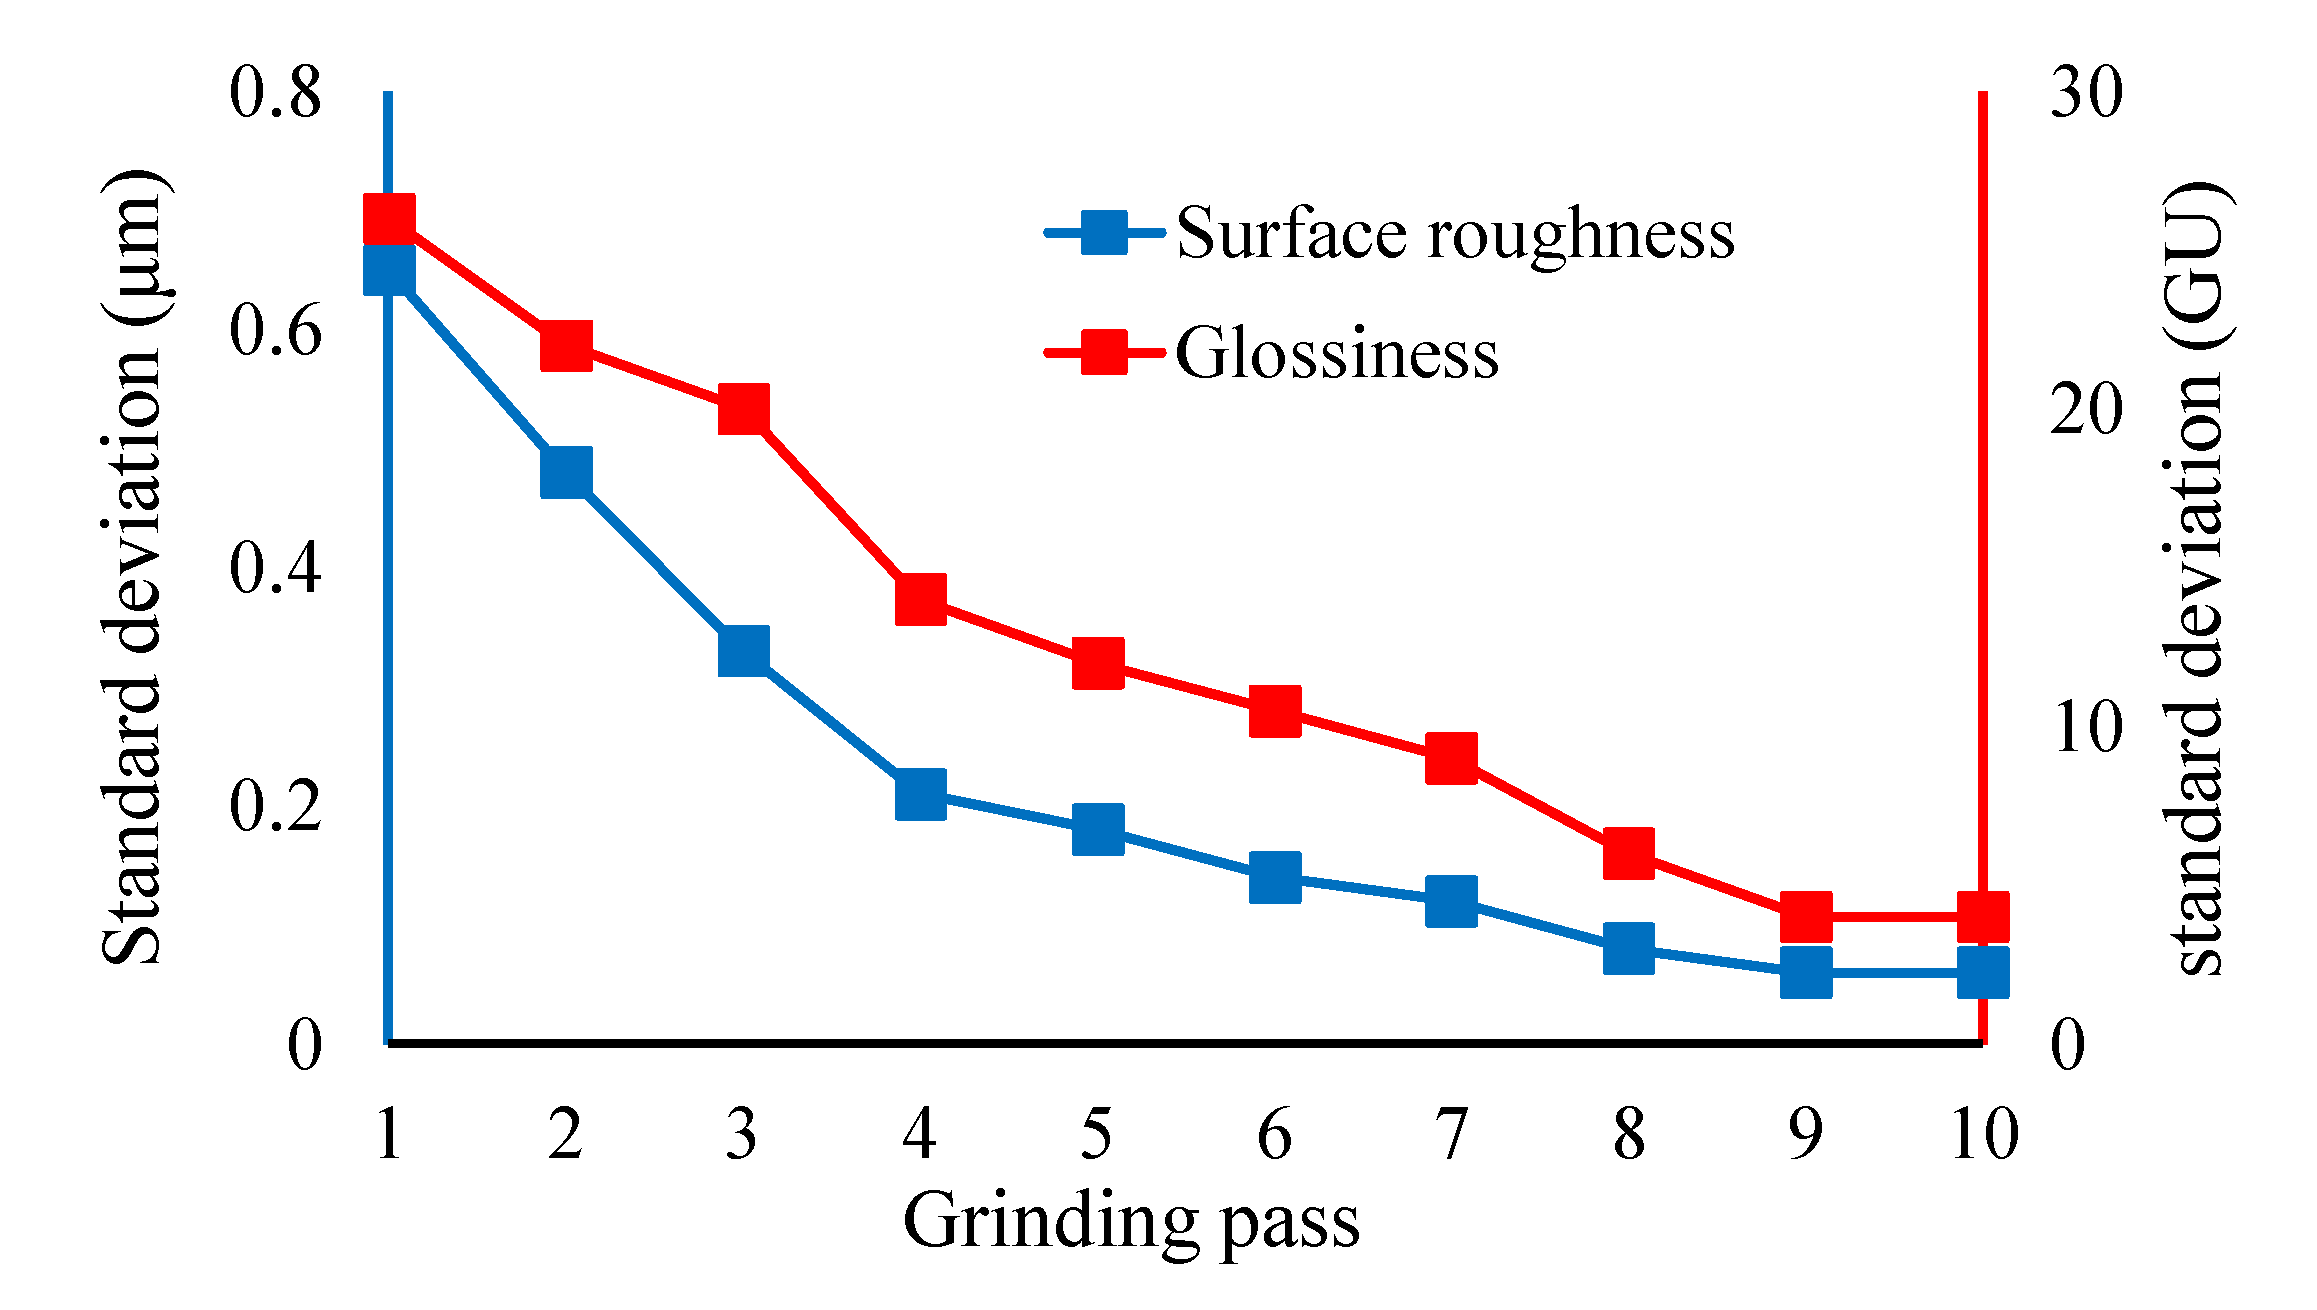
The standard deviations of surface roughness and glossiness of measuring points are used to describe the surface quality consistency as shown in Figure 14, and it can be seen that the surface quality consistency gradually becomes better during the grinding process. The standard deviations of surface roughness and glossiness of measuring points are 0.651 μm and 26.2 GU for the first grinding pass, and 0.060 μm and 4.1 GU for the last grinding pass, respectively.
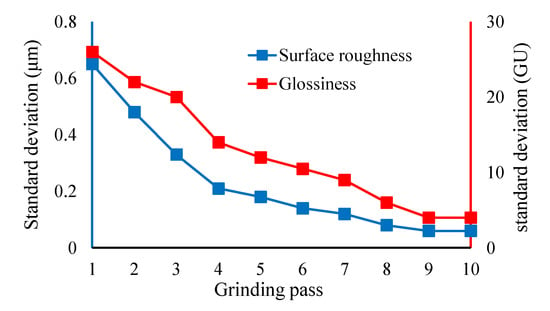
Figure 14.
The standard deviations of surface roughness and glossiness of measuring points.
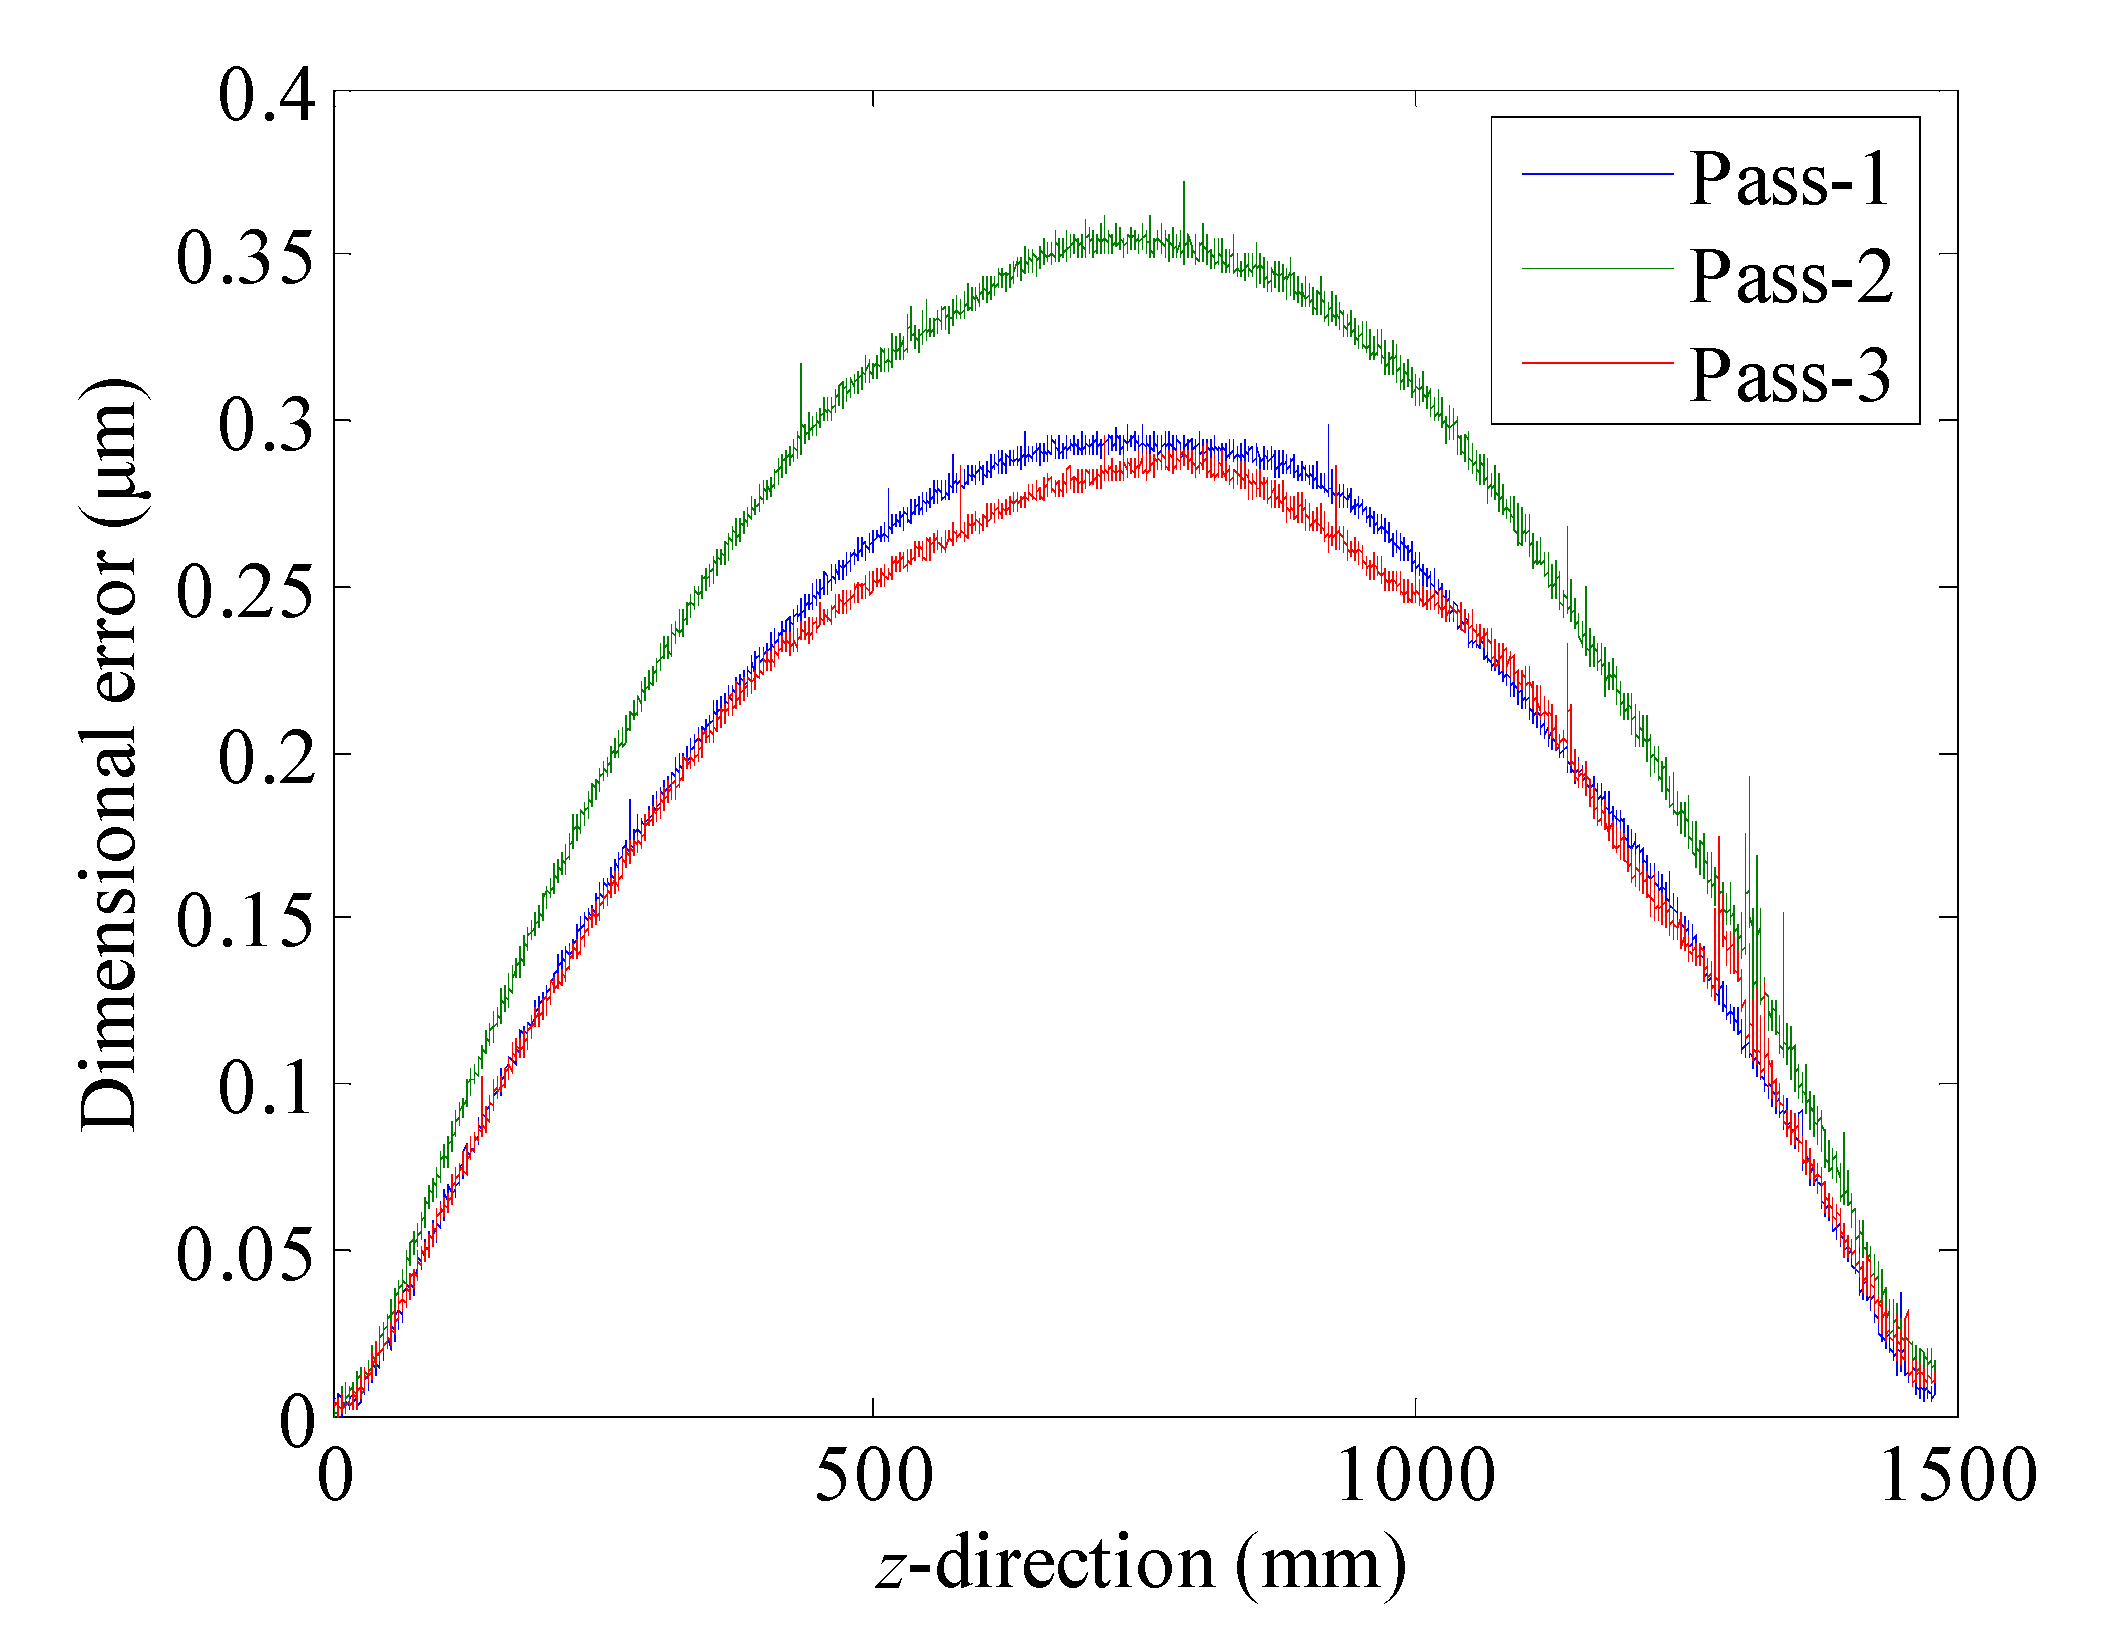
The dimensional errors of rough grinding passes are shown in Figure 15. It can be seen that the dimensional errors are still within the tolerance range after the adjustment of the actual grinding depth, which proves the effectiveness of the compensation method. It is also proved that the consistency control method of surface quality will not make the dimensional error exceed the tolerance range.
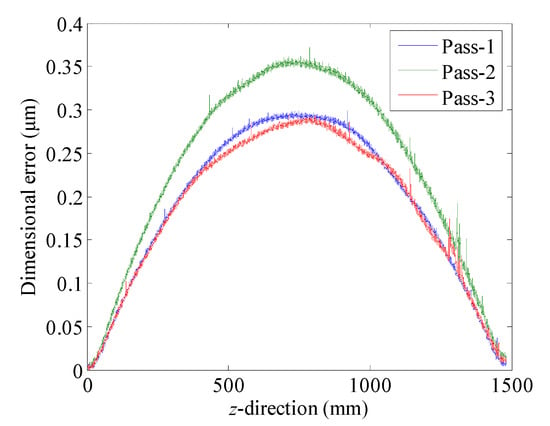
Figure 15.
The dimensional errors of rough grinding passes.
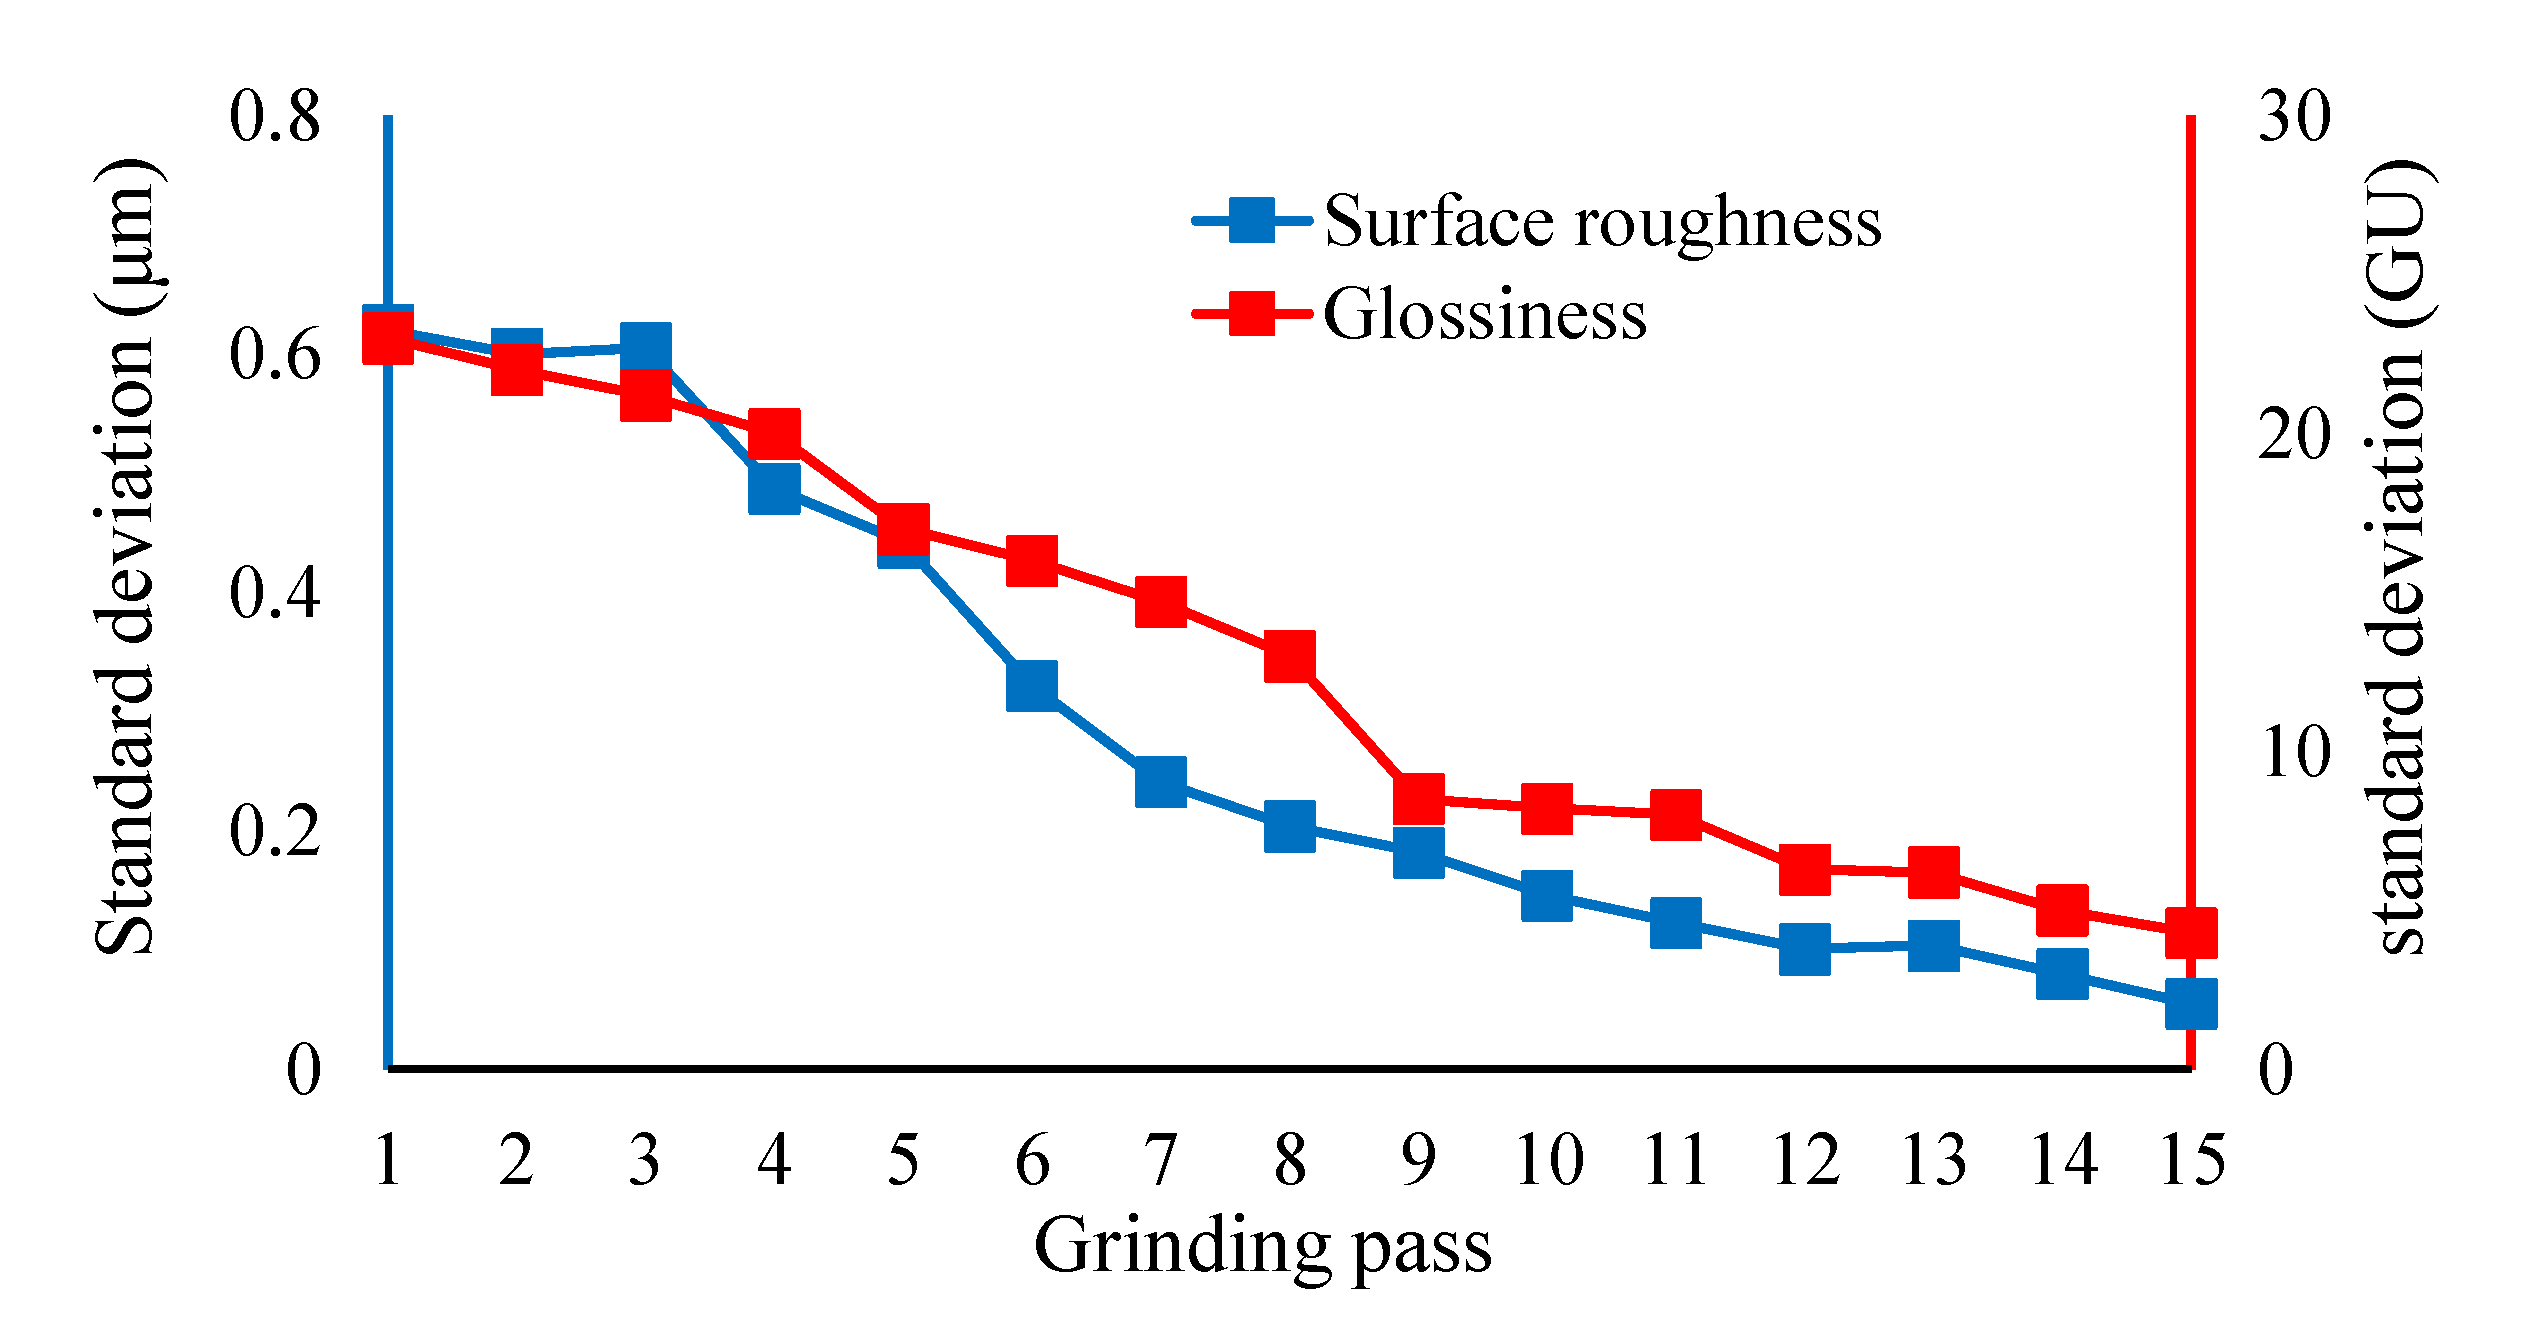
The shaft is continued to be machined with rough grinding process parameters, without compensation and the consistency control method. The standard deviations of surface roughness and glossiness of measuring points become 0.628 μm and 23.1 GU. Then, the shaft is machined again with process parameters in Table 4. During rough grinding, semi-finish grinding, and finish grinding, only the dimensional error is compensated, while the consistency of surface quality is not controlled. Finally, enough spark-out grinding passes are performed until the standard deviations of surface roughness and glossiness are close to the standard deviations of the last grinding pass in Figure 14. After eight spark-out grinding passes, the standard deviations of surface roughness and glossiness are 0.055 μm and 4.1 GU.
The standard deviations of surface roughness and glossiness are shown in Figure 16. It can be seen that without the consistency control method, it requires five more spark-out grinding passes to achieve high consistency. This shows that the consistency control method of surface quality can obtain a higher consistency of surface quality with reducing the grinding passes, resulting in high grinding efficiency.
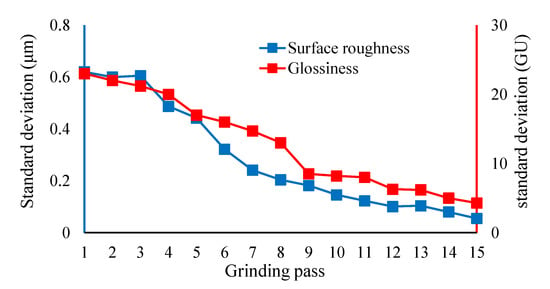
Figure 16.
The standard deviations of surface roughness and glossiness of measuring points.
6. Conclusions
This research studies the surface quality evolution and consistency control of large shaft multi-pass grinding. Based on the analysis of the grinding experimental data, it is found that the grinding surface quality is affected by the grinding process parameters and the surface quality of the previous grinding pass, which shows the evolutionary characteristics. Then, the surface quality evolution model is established based on Elman neural network. Furthermore, the consistency control method of surface quality is proposed by adjusting the actual grinding depth at the rough grinding stage. Experiments show the effectiveness of the proposed methods. The conclusions drawn from this research can be summarized as follows:
(1) The surface quality indexes of multi-pass grinding of shaft parts, i.e., surface roughness and glossiness, have evolutionary characteristics and are affected by grinding parameters and surface quality of the previous grinding pass. The uneven distribution of the actual grinding depth along the length direction of the shaft is the reason for the inconsistent surface quality.
(2) The surface quality evolution model based on Elman neural network accurately describes the evolution characteristics of surface quality, and the prediction errors of surface roughness and glossiness are less than 6%.
(3) The consistency control method of surface quality guarantees the consistency of surface quality, reduces the grinding passes, and increases the grinding efficiency.
Author Contributions
Conceptualization, L.W. and S.F.; methodology, L.W. and S.F.; validation, S.F.; formal analysis, L.W. and S.F.; investigation, S.F.; data curation, L.W.; writing—original draft preparation, L.W. and S.F.; writing—review and editing, D.W. and X.L.; supervision, L.W.; funding acquisition, L.W., D.W. and X.L. All authors have read and agreed to the published version of the manuscript.
Funding
This work is supported by National Natural Science Foundation of China under Grant No.52105520, No.52275440 and No.51975319.
Institutional Review Board Statement
Not applicable.
Informed Consent Statement
Not applicable.
Data Availability Statement
All data included in this study are available upon request by contact with the corresponding authors.
Conflicts of Interest
The authors declare no conflict of interest.
References
- Chybowski, L.; Nozdrzykowski, K.; Grzadziel, Z.; Jakubowski, A.; Przetakiewicz, W. Method to increase the accuracy of large crankshaft geometry measurements using counterweights to minimize elastic deformations. Appl. Sci. 2020, 10, 4722. [Google Scholar] [CrossRef]
- Wang, C.; Wang, D.; Wang, L.P.; Jiang, S.; Li, H.Y.; Li, X.K. The development of time-dependent compensation model for roller CVC profile generation in precision grinding. Int. J. Adv. Manuf. Technol. 2021, 114, 1671–1684. [Google Scholar] [CrossRef]
- Patel, D.K.; Goyal, D.; Pabla, B.S. Optimization of parameters in cylindrical and surface grinding for improved surface finish. R. Soc. Open Sci. 2018, 5, 171906. [Google Scholar] [CrossRef] [PubMed]
- Zhang, S.Y.; Zhang, G.B.; Ran, Y.; Wang, Z.C.; Wang, W. Multi-objective optimization for grinding parameters of 20CrMnTiH gear with ceramic microcrystalline corundum. Materials 2019, 12, 1352. [Google Scholar] [CrossRef] [PubMed]
- Wang, Y.Z.; Liu, Y.; Chu, X.M.; He, Y.M.; Zhang, W. Calculation model for surface roughness of face gears by disc wheel grinding. Int. J. Mach. Tool. Manu. 2017, 123, 76–88. [Google Scholar] [CrossRef]
- Wang, Y.Z.; Chen, Y.Y.; Zhou, G.M.; Lv, Q.J.; Zhang, Z.Z.; Tang, W.; Liu, Y. Roughness model for tooth surfaces of spiral bevel gears under grinding. Mech. Mach. Theory. 2016, 104, 17–30. [Google Scholar] [CrossRef]
- Zhou, X.; Xi, F. Modeling and predicting surface roughness of the grinding process. Int. J. Mach. Tool. Manu. 2022, 42, 969–977. [Google Scholar] [CrossRef]
- Jiang, J.L.; Ge, P.Q.; Hong, J. Study on micro-interacting mechanism modeling in grinding process and ground surface roughness prediction. Int. J. Adv. Manuf. Technol. 2013, 67, 1035–1052. [Google Scholar] [CrossRef]
- Chakrabarti, S.; Paul, S. Numerical modelling of surface topography in superabrasive grinding. Int. J. Adv. Manuf. Technol. 2008, 39, 29–38. [Google Scholar] [CrossRef]
- Yu, H.D.; Wang, M.X.; Xu, J.K.; Chen, G.J.; Dai, B.; Wang, S. Research on surface roughness prediction model of ultrasonic assisted grinding by response surface method. Solid State Phenom. 2021, 324, 66–71. [Google Scholar] [CrossRef]
- Zhu, C.M.; Gu, P.; Wu, Y.Y.; Liu, D.H.; Wang, X.K. Surface roughness prediction model of SiCp/Al composite in grinding. Int. J. Mech. Sci. 2019, 155, 98–109. [Google Scholar] [CrossRef]
- Kwak, J.S.; Sim, S.B.; Jeong, Y.D. An analysis of grinding power and surface roughness in external cylindrical grinding of hardened SCM440 steel using the response surface method. Int. J. Mach. Tool. Manu. 2006, 46, 304–312. [Google Scholar] [CrossRef]
- Alao, A.R.; Konneh, M. Application of Taguchi and Box-Behnken designs for surface roughness in precision grinding of silicon. Int. J. Precis. Technol. 2011, 2, 21–38. [Google Scholar] [CrossRef]
- Caydas, U.; Ekici, S. Support vector machines models for surface roughness prediction in CNC turning of AISI 304 austenitic stainless steel. J. Intell. Manuf. 2012, 23, 639–650. [Google Scholar] [CrossRef]
- Liu, Y.; Song, S.Y.; Zhang, Y.D.; Li, W.; Xiao, G.J. Prediction of surface roughness of abrasive belt brinding of superalloy material based on RLSOM-RBF. Materials 2022, 14, 5701. [Google Scholar] [CrossRef] [PubMed]
- Lipinski, D.; Balasz, B.; Rypina, L. Modelling of surface roughness and grinding forces using artificial neural networks with assessment of the ability to data generalization. Int. J. Adv. Manuf. Technol. 2018, 94, 1335–1347. [Google Scholar] [CrossRef]
- Zhang, Y.W.; Li, B.Z.; Yang, J.G.; Liang, S. Modeling and optimization of alloy steel 20CrMnTi grinding process parameters based on experiment investigation. Int. J. Adv. Manuf. Technol. 2018, 95, 1859–1873. [Google Scholar] [CrossRef]
- Zhang, G.J.; Liu, C.Y.; Min, K.; Liu, H.; Ni, F.L. A GAN-BPNN-based surface roughness measurement method for robotic grinding. Machines 2022, 10, 1026. [Google Scholar] [CrossRef]
- Yin, G.Q.; Wang, J.H.; Guan, Y.Y.; Wang, D.; Sun, Y. The prediction model and experimental research of grinding surface roughness based on AE signal. Int. J. Adv. Manuf. Technol. 2022, 120, 6693–6705. [Google Scholar] [CrossRef]
- Yonehara, M.; Matsui, T.; Kihara, K.; Isono, H.; Kijima, A.; Sugibayashi, T. Evaluation method of surface texture by surface roughness based on geometrical product specifications (GPS). Mater. Trans. 2004, 45, 1019–1026. [Google Scholar] [CrossRef]
- Son, J.; Lee, H. Preliminary study on polishing SLA 3D-printed ABS-like resins for surface roughness and glossiness reduction. Micromachines 2020, 11, 843. [Google Scholar] [CrossRef] [PubMed]
- Yavus, H.; Ozkahraman, T.; Demirdag, S. Polishing experiments on surface quality of building stone tiles. Constr. Bulid. Mater. 2011, 25, 1707–1711. [Google Scholar] [CrossRef]
- Assender, H.; Bliznyuk, V.; Porfyrakis, K. How surface topography relates to materials properties. Science 2002, 297, 973–976. [Google Scholar] [CrossRef] [PubMed]
- Li, H.Y.; Li, X.K.; Tian, C.C.; Yang, X.D.; Zhang, Y.; Liu, X.L.; Rong, Y.M. The simulation and experimental study of glossiness formation in belt sanding and polishing processes. Int. J. Adv. Manuf. Technol. 2017, 90, 199–209. [Google Scholar] [CrossRef]
Disclaimer/Publisher’s Note: The statements, opinions and data contained in all publications are solely those of the individual author(s) and contributor(s) and not of MDPI and/or the editor(s). MDPI and/or the editor(s) disclaim responsibility for any injury to people or property resulting from any ideas, methods, instructions or products referred to in the content. |
© 2023 by the authors. Licensee MDPI, Basel, Switzerland. This article is an open access article distributed under the terms and conditions of the Creative Commons Attribution (CC BY) license (https://creativecommons.org/licenses/by/4.0/).

