Article

Diversity of Bacterial Communities Associated with Solitary Bee Osmia excavata Alfken (Hymenoptera: Megachilidae)

1
Key Laboratory of Conservation and Utilization of Pollinator Insect of the Upper Reaches of the Yangtze River, Ministry of Agriculture and Rural Affairs, Chongqing 401331, China
2
College of Life Sciences, Chongqing Normal University, Chongqing 401331, China
3
Institute of Zoology, Chinese Academy of Sciences, Beijing 100101, China
*
Authors to whom correspondence should be addressed.
Appl. Sci. 2023, 13(3), 1524; https://doi.org/10.3390/app13031524
Submission received: 11 December 2022 / Revised: 8 January 2023 / Accepted: 18 January 2023 / Published: 24 January 2023
(This article belongs to the Section Agricultural Science and Technology)

Abstract

:
Insect-associated microorganisms play important roles in the health and development of insects. This study aimed to investigate the similarities and differences in bacterial community structure and composition between the larval gut of Osmia excavata, nest soil, and brood provision from the nest tube. We sequenced larvae gut and their environments’ microorganisms of O. excavata from four locations based on full-length 16S rRNA gene amplicons. The results showed 156, 280, and 366 bacterial OTUs from gut, brood provision, and nest soil, respectively, and three groups shared 131 bacterial OTUs. In the gut, the top two dominant bacteria were Sodalis praecaptivus (68.99%), Lactobacillus micheneri (17.95%). In the brood provision, the top two dominant bacteria were S. praecaptivus (26.66%), Acinetobacter nectaris (13.05%), and in the nest soil, the two most abundant bacteria were Gaiella occulta (4.33%), Vicinamibacter silvestris (3.88%). There were significant differences in diversity between the brood provision groups and the nest soil groups, respectively. Three of the four locations did not differ for gut microbial diversity. Bacteria similar to other solitary bees also existed in the gut of the larvae. Results indicated when the habitat environments were similar, the bacterial community diversity of the gut of O. excavata was similar, despite significant differences among brood provisions and soils, respectively.

1. Introduction

Wild bees are an economically and ecologically important group of insects because of their ability to participate in plant pollination in a variety of ecosystems. In some cases, the pollination services of wild bee cannot be substituted by domesticated bees [1,2,3]. However, related research on honeybees has shown that the size of bee populations may be affected by microbiomes [4]. The symbiotic microorganisms have different effects on the health of the host, and have been extensively studied [5].
Gut microbes in honeybees can promote growth, increase food consumption, and stimulate the immune system [6,7]. Consequently, imbalance of bacterial communities may result in the occurrence of diseases [8]. Studies have demonstrated that the gut of social bees contains a highly conserved and well-defined core microbial community, usually composed of about 10 species [9,10]. However, wild solitary bees, such as megachilid bees, have not conserved a bacterial community because their bacterial communities are influenced by the surroundings [11]. Nevertheless, a previous study showed that solitary bees had relatively stable and interrelated bacterial communities in their guts, such as Acetobacteraceae, Bacillaceae, Lactobacillaceae, and others [12].
The spread of symbiotic bacteria depends on bee contact among social bees, while that of solitary bees depends mainly on the environment, brood provisions and nesting materials introduced by their parents, such as Osmia bicornis in the nest soil, Megachile sp. on plant leaves, and Osmia caerulescens in the chewed plant tissues [13,14]. Similar microbial communities have been identified in the gut and brood provision of Osmia bicornis, Osmia caerulescens, Megachile rotundata, and Megachile versicolor [15], which indicates that the microbes in the gut of bee larvae are strongly associated with flowers and brood provision. Therefore, environmental factors can cause a high diversity of bacteria in solitary bee nests [16].
Osmia excavata Alfken is a wild solitary bee. Males and females overwinter in the nest and mate in spring. Their new nests are built by females with dead and broken plant stems. The next generation completes its development from larva to adult in the nest tube [17]. The activities of O. excavata, such as nesting and visiting flowers, are mainly affected by various environmental factors, such as temperature, sunshine, wind speed. The higher the temperature, the higher the rate of bees visiting flowers and nesting. However, in cloudy or rainy and windy weather, the activity frequency and nesting rate of adult bees decreases significantly [18]. Osmia excavata is widely distributed in northern China (including Liaoning, Shandong, Henan, Hebei, Shaanxi, Shanxi, Jiangsu) and are used as a pollinator for apples, pears, rape and other crops, and have been artificially released in China [19,20]. Currently, studies on O. excavata focused on their biological properties and pollination [21], whereas the bacterial communities related to its growth and development have not been studied.
In this study, the structure and diversity of bacteria in the larval gut, brood provision, and nest soil of O. excavata were analyzed through full-length 16S rRNA sequencing and correlations between different experimental groups were compared. This study showed that the bacterial communities in the gut of O. excavata larvae were similar in different locations, which may be due to the similarity of their habitats. The purpose of this study was to preliminarily investigate the effects of brood provision and nesting soil on the intestinal bacterial community of larvae, in order to make the larvae grow and develop more healthily so that bees can better exert their pollination values, and to lay a scientific foundation for the subsequent exploration of the related microorganisms of wild pollinator bees such as O. excavata.

2. Materials and Methods

2.1. Sample Collection

Trap-nests (Artificially provided reed canes) of O. excavata were collected (March to May 2020) from four experimental plots of China, including Shandong (SD), Chongqing (CQ), Liaoning (LN) and Xinjiang (XJ). The detailed information is shown in Table 1.
The collected intact trap-nests were placed in a sterilized test tube, the mouth of the test tube was blocked with cotton and brought back to the laboratory in time for post-processing. The test nesting tubes were opened with a scalpel in a sterile environment, and the upper part of the trap-nests was gently lifted for longitudinal dissection and extraction. In an ultraclean workstation, the brood provision and nesting soil immediately adjacent to the larvae were removed with forceps and placed in separate 2 mL centrifuge tubes. Larvae of the 3–4 instar were selected. Larvae were treated by disinfecting the body surface with 70% alcohol for 30 s, treated with 0.1% Triton-X-100 solution for 5 min and finally rinsed three times with ddH2O, then dissected in Ringer’s solution to obtain gut samples [22]. A total of 60 samples were obtained, including five biological replicates of the brood provision, nesting soil and larvae gut in each experimental plot. All samples were snap-frozen in liquid nitrogen and stored at −80 °C for later use.

2.2. DNA Extraction and PCR Amplification of 16S rDNA

Bacterial genomic DNA of the larval gut, brood provision, and nest soil were extracted though the QIAGEN DNeasy Power Soil Kit (Qiagen, Hilden, Germany) according to the manufacturer’s instructions. The purity, quality, and integrity of the extracted DNA were determined by the Qubit 2.0 Fluorimeter (Life Technologies, Carlsbad, CA, USA), NanoDrop spectro-photometer (Thermo Fisher Scientific, Inc., Waltham, MA, USA) and Agilent 2 100 bioana-lyzer (Agilent Technologies, Santa Clara, CA, USA). Then, the extracted DNA was diluted and used as the template to amplify the full-length 16S rRNA genes using the universal primer 27F (5′-AGRGTTTGATYNTGGCTCAG-3′) and 1492R (5′-TASGGHTACCTT GTTASGACTT-3′) (Weiss and Vossbrinck, 1998). PCR reactions were performed in a 50 μL system, containing 25μL KOD FX Neo Buffer (2×), 10 μL dNTPs (2 mM/each), 2.5 μL each primer (10 μM), 1μL KOD FX Neo (TOYOBO), 2 μL template DNA (5 ng/μL) and 7 μL ddH2O. All reactions were performed in an ABI GeneAmp 9700 (Applied Biosystems, Carlsbad, CA, USA) with the following parameters: an initial denaturation at 95 °C for 5 min, followed by 30 cycles of 95 °C for 30 s, 50 °C for 30 s, 72 °C for 1 min and a final extension at 72 °C for 7 min. Amplicons were extracted from 2 % agarose gels and purified using the AxyPrep DNA Gel Extraction Kit (Axygen Biosciences, Union City, CA, USA). The purified products were quantified using Qubit®3.0 (Life Invitrogen, Waltham, MA, USA) and pooled in an equimolar ratio for sequencing.
DNA libraries were constructed by SMRTbell Express Template Prep Kit 2.0 and sequenced with PacBio Sequel. The original reads were analyzed using SMRT Link v8.0 to obtain circular consensus sequence (CCS). Barcode-CCS sequences were obtained by Lima v1.7.0 with the default parameters, then effective sequences were achieved using Cutadapt v2.7. UCHIME v4.2 was used to confirm the quality of Effective-CCS sequences.

2.3. Bioinformatics Analysis

CCS sequences were clustered to obtain the operational taxonomic unit (OTU) using USEARCH v10 [23] at the 97% similarity level. To verify the accuracy and reliability of the annotated results, cumulative curves were plotted using the “ggplot2” package [24]. Using SILVA as the reference database, the representative sequences of OTUs were used in the taxonomy annotated using Naive Bayes classifier [25].
Based on species taxonomic information, the community composition of each sample was counted at different taxonomic ranks (phylum, class, order, family, genus, species) using QIIME2 “https://qiime2.org/ (accessed on 22 November 2022)”. Linear discriminant analysis (LDA) effect size (LefSe) (LDA >4.0) was used to identify the biomarker bacteria between different sample groups [26].
According to the OTUS annotation results, the Alpha diversity index values (ACE and Simpson) were calculated using QIIME2. The Fisher’s least significant difference (LSD) in SPSS v25.0 (SPSS, Inc., Chicago, IL, USA) was used to analyze the differences in sample diversity between different experimental plots and visualized by GraphPad Prism 8 [27]. Beta distance between sample groups was calculated using the Bray–Curtis algorithm, followed by nonmetric multidimensional scaling (NMDS) dimensionality reduction. Non-parametric multivariate analysis of variance (PERMANOVA) (p < 0.05) [28] was used to determine significant differences in bacterial community composition structure among groups using the vegan package in R [29]. The Bray–Curtis distance matrices based on bacterial OTUs of the gut, brood provision, and nest soil were used for the Mantel test by using the vegan package in R [29].

3. Results

3.1. Characteristics of the Sequencing Data

The full-length 16S rRNA gene sequences were amplified from DNA extracted from bulk gut content, brood provision, and nest soil. A total of 376,787 raw sequences were obtained. After filtering low-quality sequences and removing chimeras, 373,858 Effective-CCS were achieved with an average length of 1436 ± 18 bp (Supplementary Table S1). All sequences were clustered into 656 OTUs with a 97% identity threshold and further annotated to obtain 19 phyla, 30 classes, 76 orders, 111 families, and 217 genera (Supplementary Table S2). The gut, brood provision, and nest soil identified 156, 280, and 366 OTUs, respectively. The accumulation curve gradually reached a plateau with increased sequencing samples, indicating that the sample size was qualified for subsequent analysis (Supplementary Figure S1).

3.2. Homogeneity Analysis of Community Composition

Based on OTUs annotation (Figure 1), 131 OTUs were detected in all samples. There were 156 OTUs in the guts of the larvae, of which Sinomonas mesophila was unique. 280 OTUs were detected in brood provisions and Gilliamella apicola, Phaseolibacter flectens, Bartonella apis were unique. Six OTUs were shared by the larval gut and brood provision, including Sodalis praecaptivus, Acetobacter pasteurianus, Clostridium colinum, Empedobacter brevis, Muribaculum intestinale, and one unannotated OTUs. A total of 366 OTUs were found in nest soil, and 77 OTUs were specific.

3.3. Analysis of Bacterial Communities Composition

Analysis of bacterial composition showed that the number of bacteria in the nest soil was significantly higher than in the brood provision, which was higher than in the gut.

3.3.1. Microbial Composition and Dominant Species

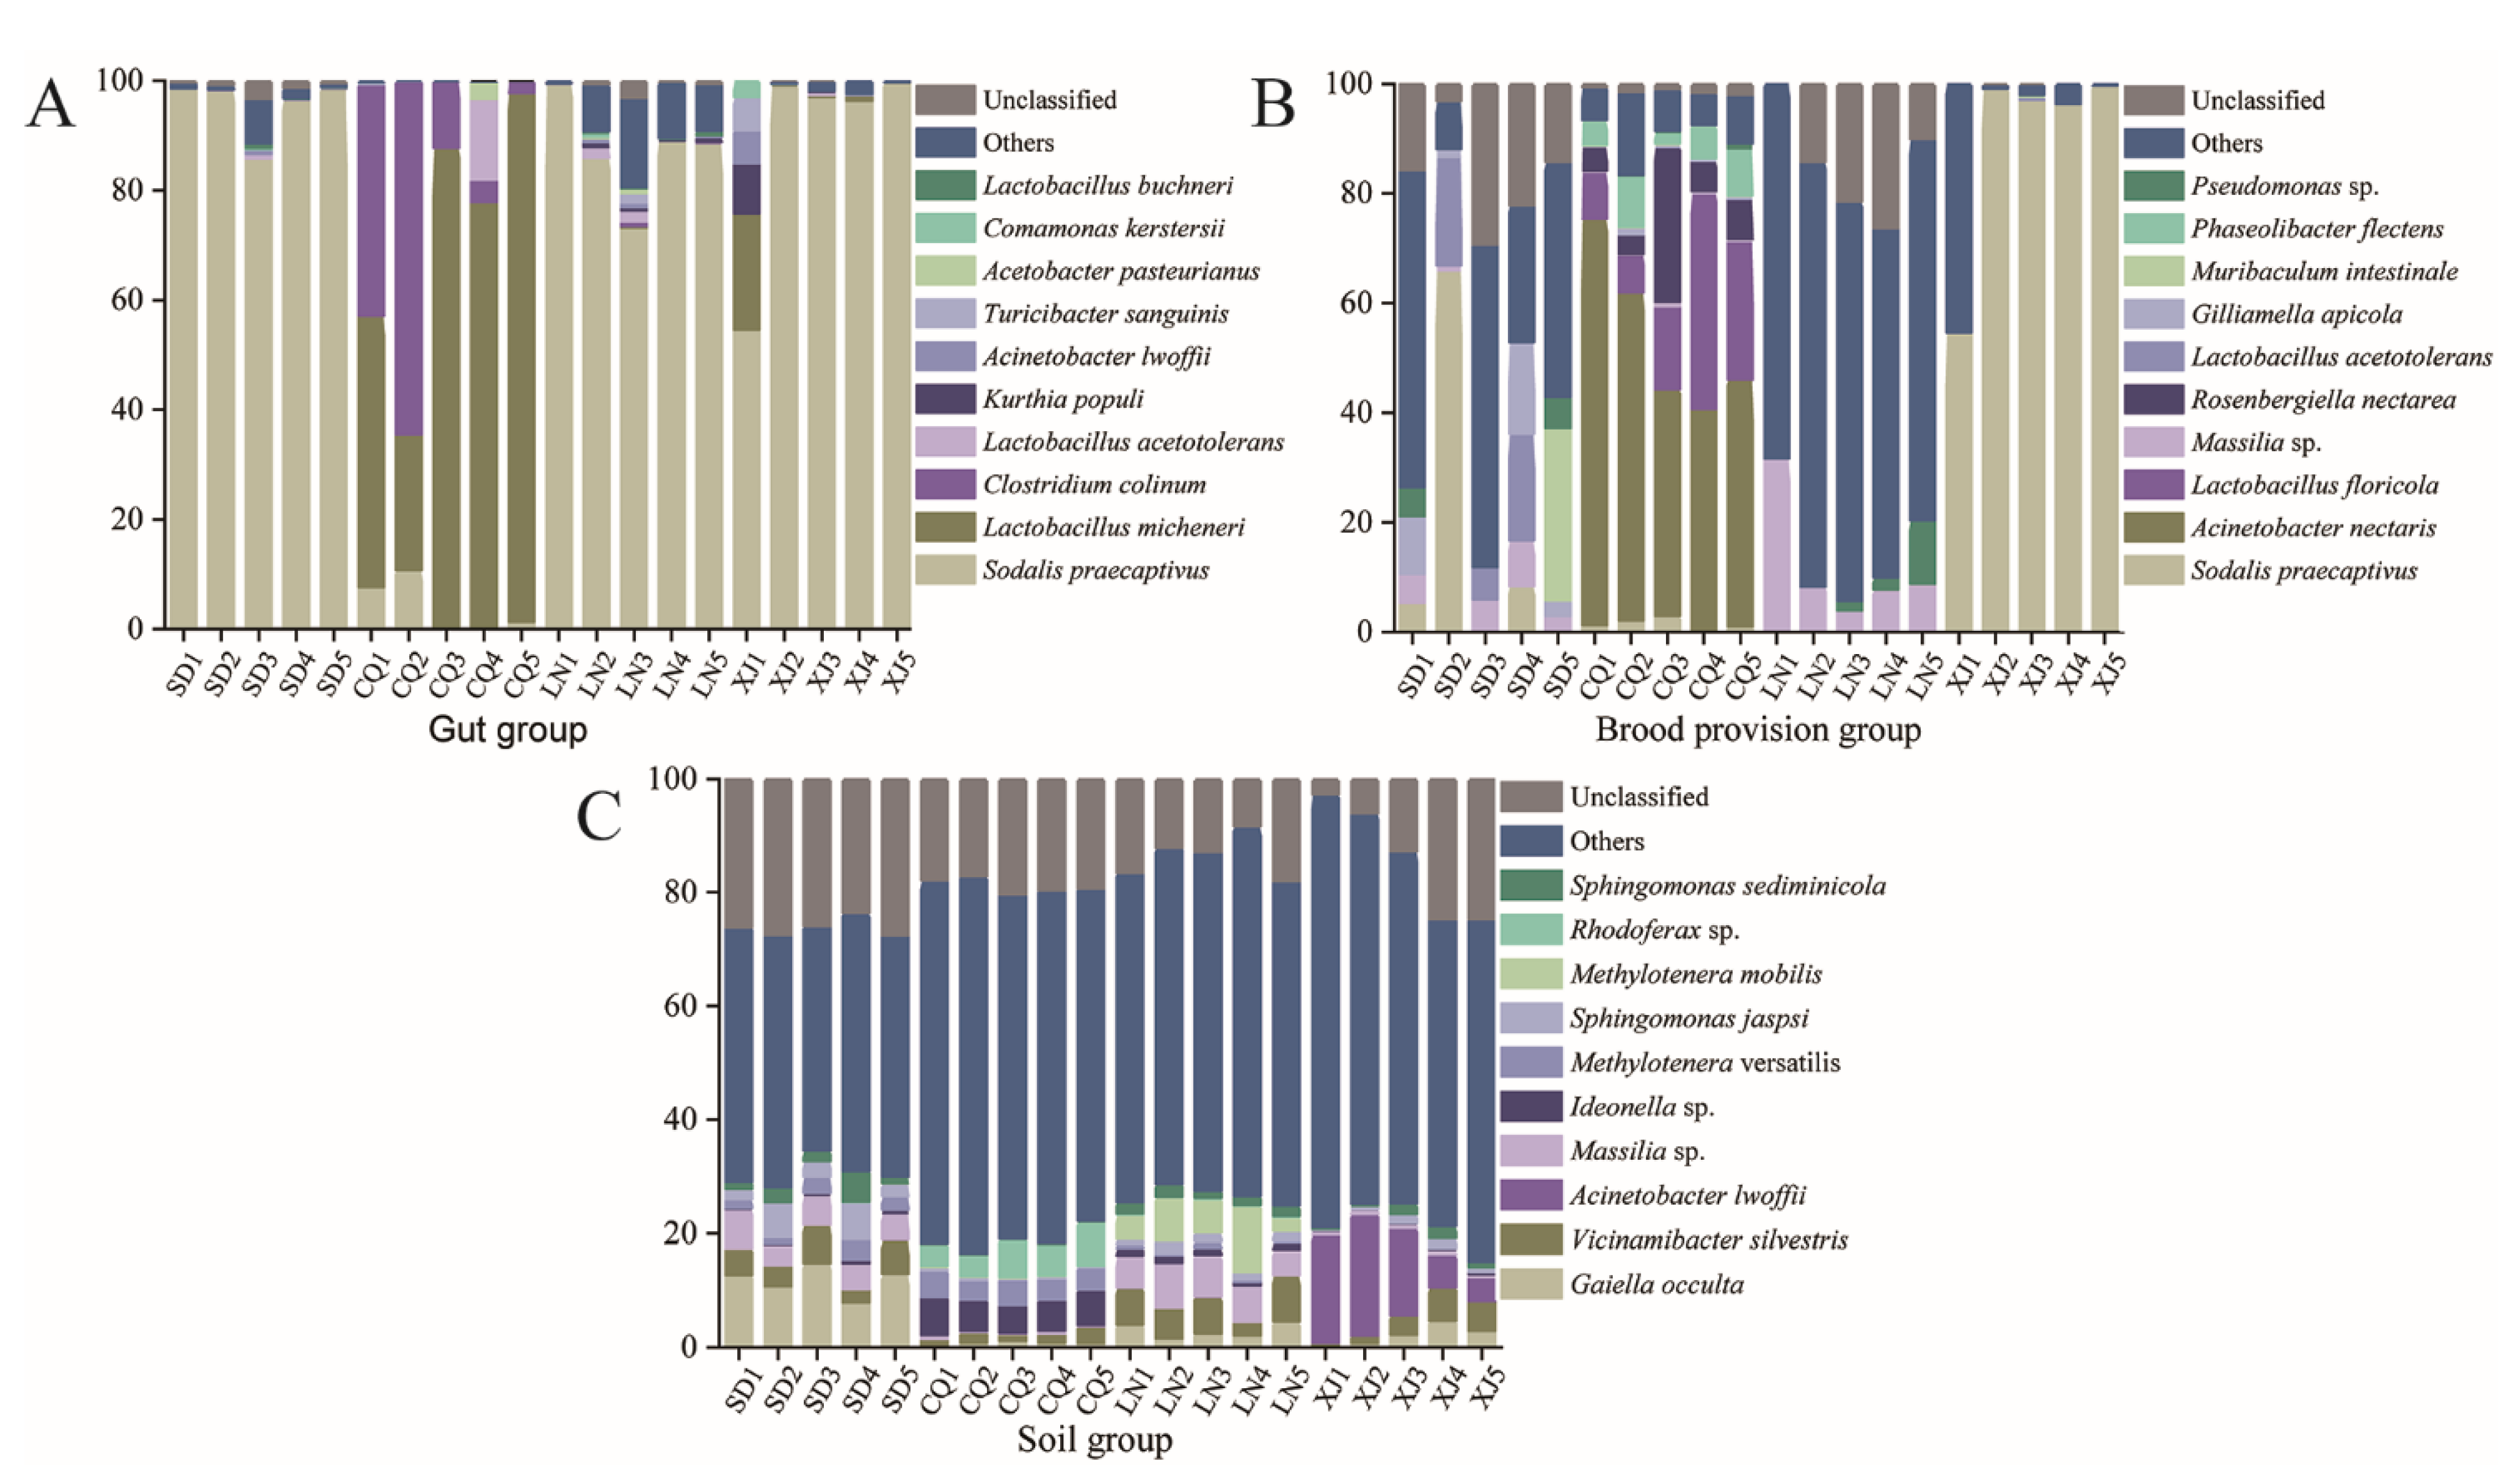
In the gut (Figure 2A), the top six dominant bacteria were S. praecaptivus (68.99%), Lactobacillus micheneri (17.95%), C. colinum (6.32%), Lactobacillus acetotolerans (1.02%), Kurthia populi (0.61%), and Acinetobacter lwoffii (0.45%). Sodalis praecaptivus was dominant in SD (95.48%), LN (87.22%) and XJ (89.30%), while the dominant bacteria in CQ was L. micheneri (67.17%).
In the brood provision (Figure 2B), the top six dominant bacteria were S. praecaptivus (26.66%), Acinetobacter nectaris (13.05%), Lactobacillus floricola (4.76%), A. lwoffii (7.77%), Massilia sp. (4.26%), Rosenbergiella nectarea (2.46%). Further analysis revealed that the dominant bacteria in SD, CQ, LN and XJ were S. praecaptivus (15.90%), A. nectaris (52.18%), Massilia sp. (12.00%) and S. praecaptivus (89.29%), respectively.
In the nest soil (Figure 2C), the six most abundant bacteria were Gaiella occulta (4.33%), Vicinamibacter silvestris (3.88%), A. lwoffii (3.29%), Massilia sp. (3.10%), Ideonella sp. (1.89%), and Methylotenera versatilis (1.73%%). The dominant bacteria of sample SD, CQ, LN and XJ were Gaiella occultas (11.72%), Ideonella sp. (5.77%), Methylotenera mobilis (6.34%) and A. lwoffii (13.13%).
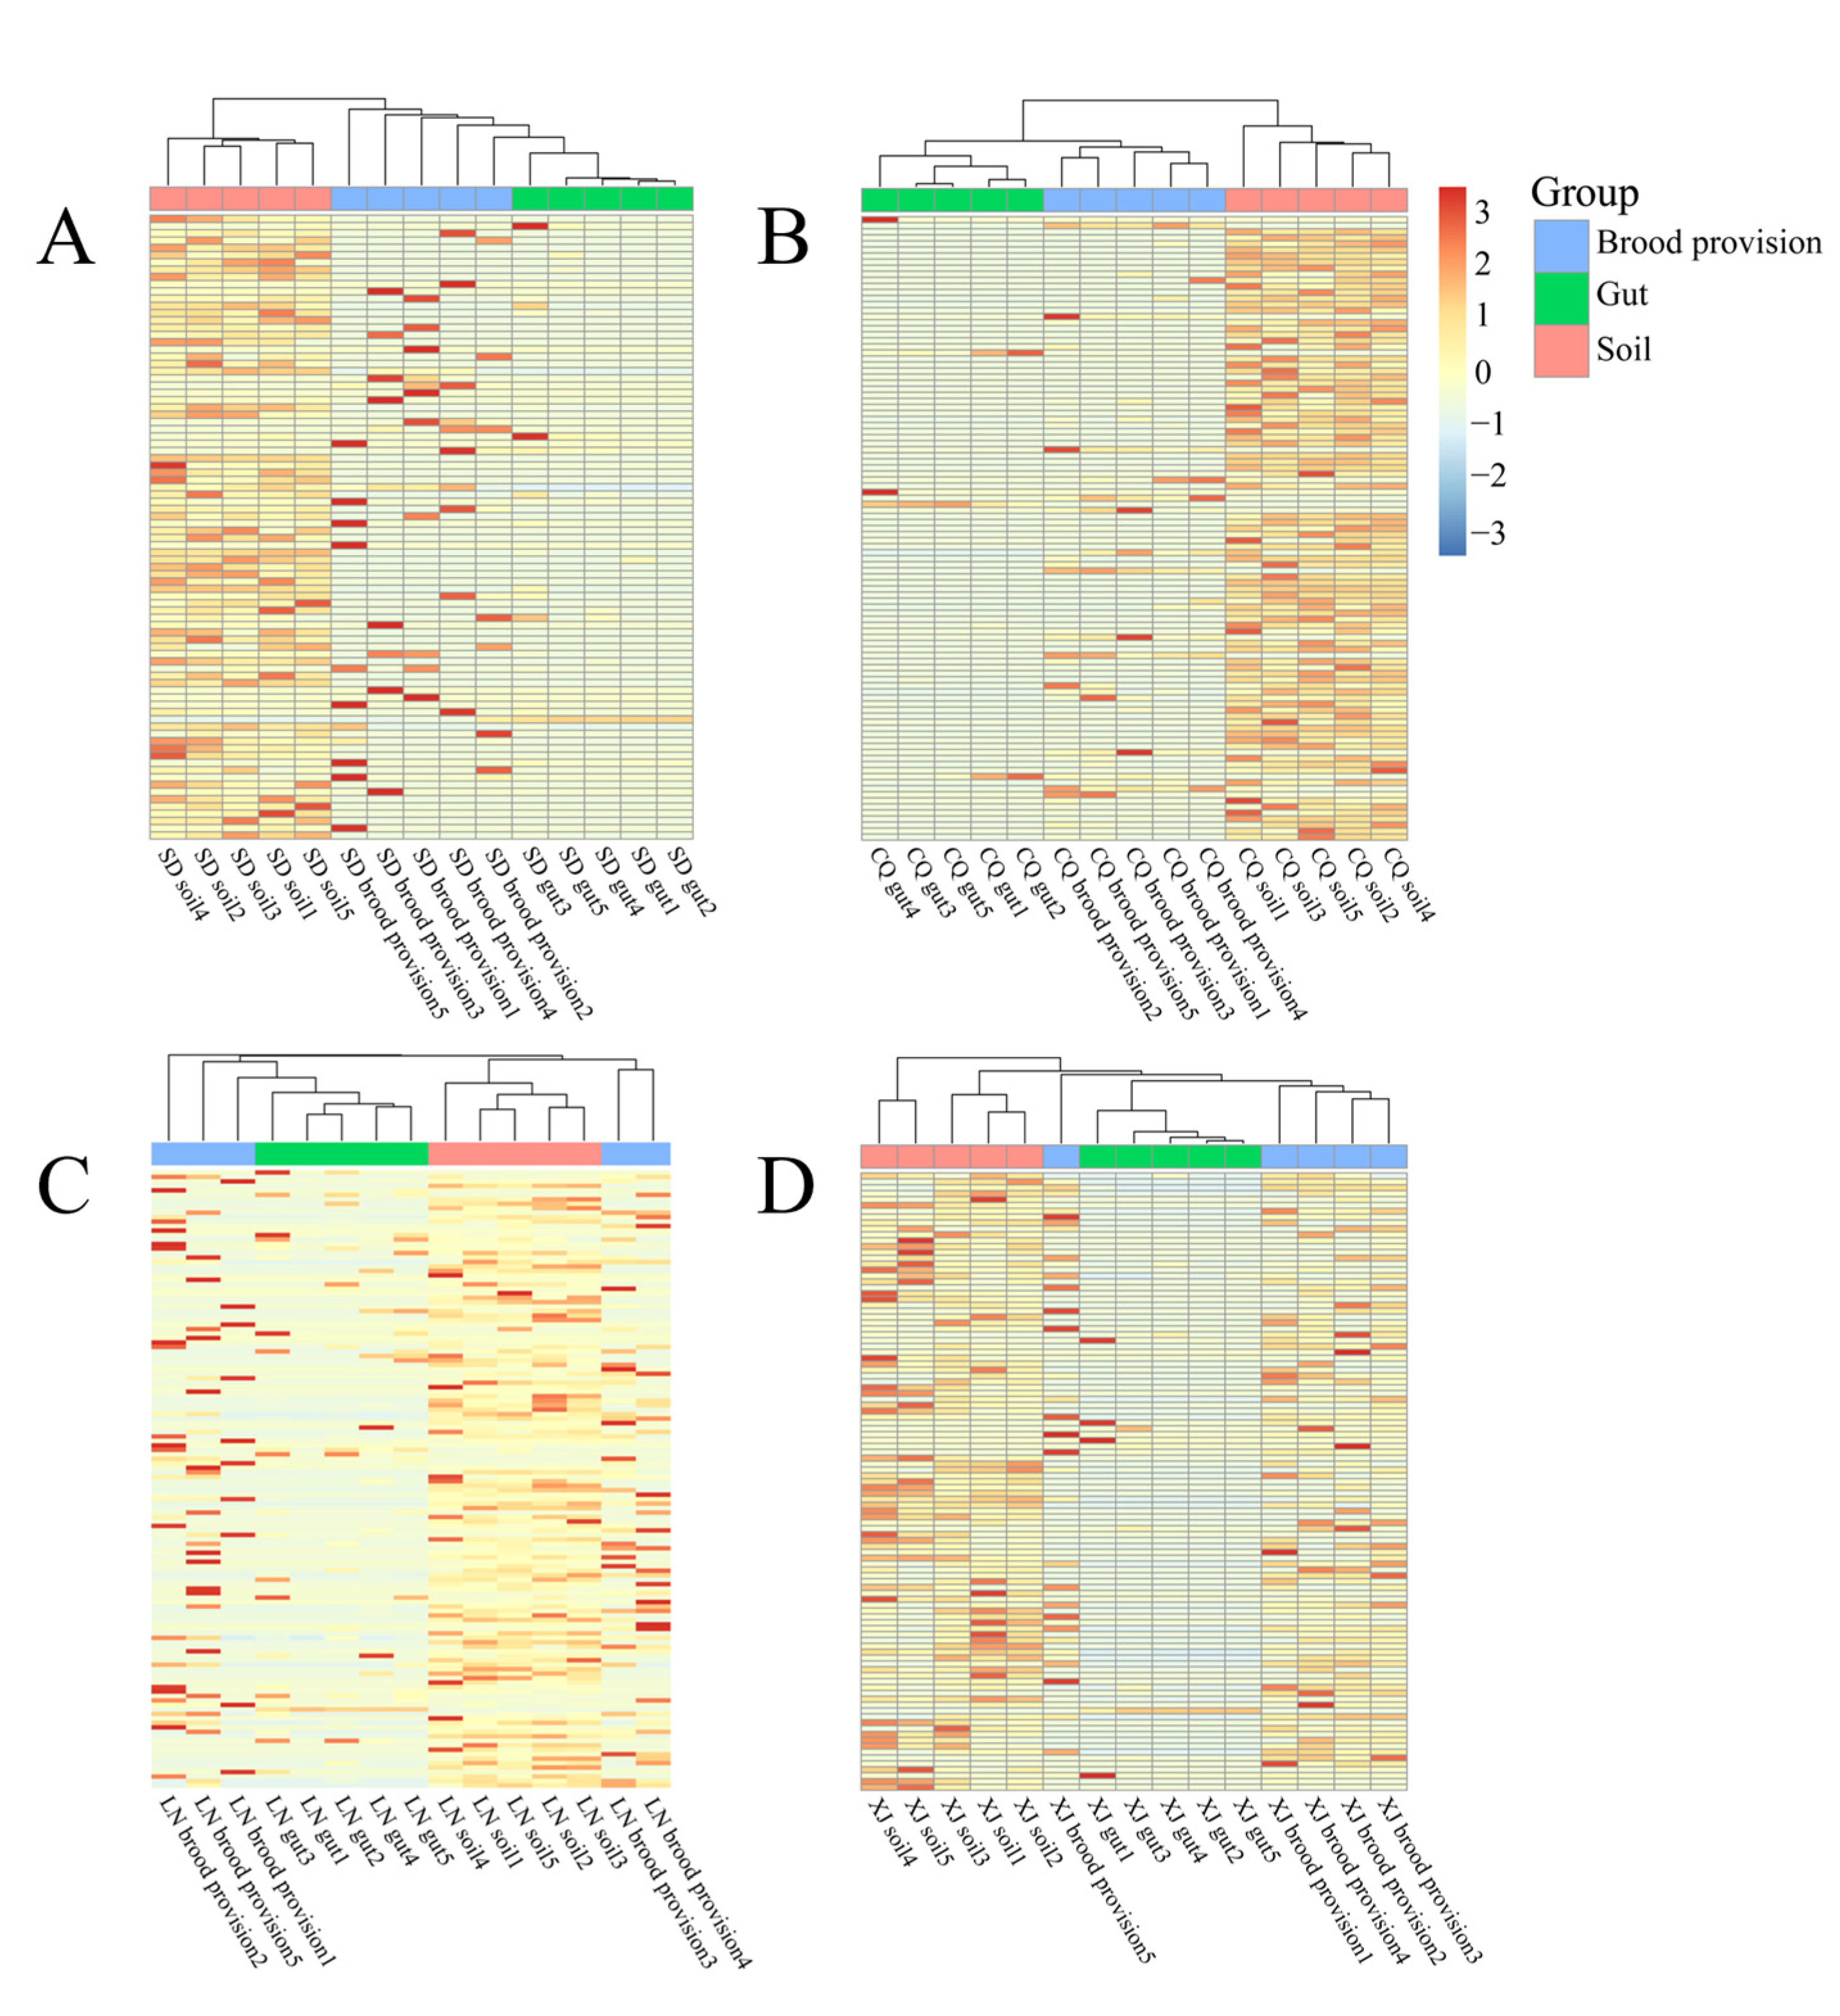
Hierarchical clustering between groups using bacterial species with a relative abundance greater than 1 % in the samples showed that the samples from the four experimental plots all exhibited similar clustering, i.e., larval gut and brood provision samples clustered together, while the nesting soil samples were clustered separately, indicating that the composition of the larval gut bacterial community was relatively close to that of the brood provision (Figure 3).

3.3.2. Differential Analysis of Bacterial Communities

Analysis of LefSe showed that the dominant microbial communities in the gut, brood provision, and nest soil were different. Sodalis praecaptivus, Lactobacillus micheneri and Clostridium colinum were the dominant bacteria in the gut. Massilia sp. and R. nectarea were abundant bacteria in brood provision groups. G. occulta and V. silvestris were dominant in the nest soil.

3.4. Diversity of Bacterial Communities in Different Groups

3.4.1. Alpha-Diversity Analysis

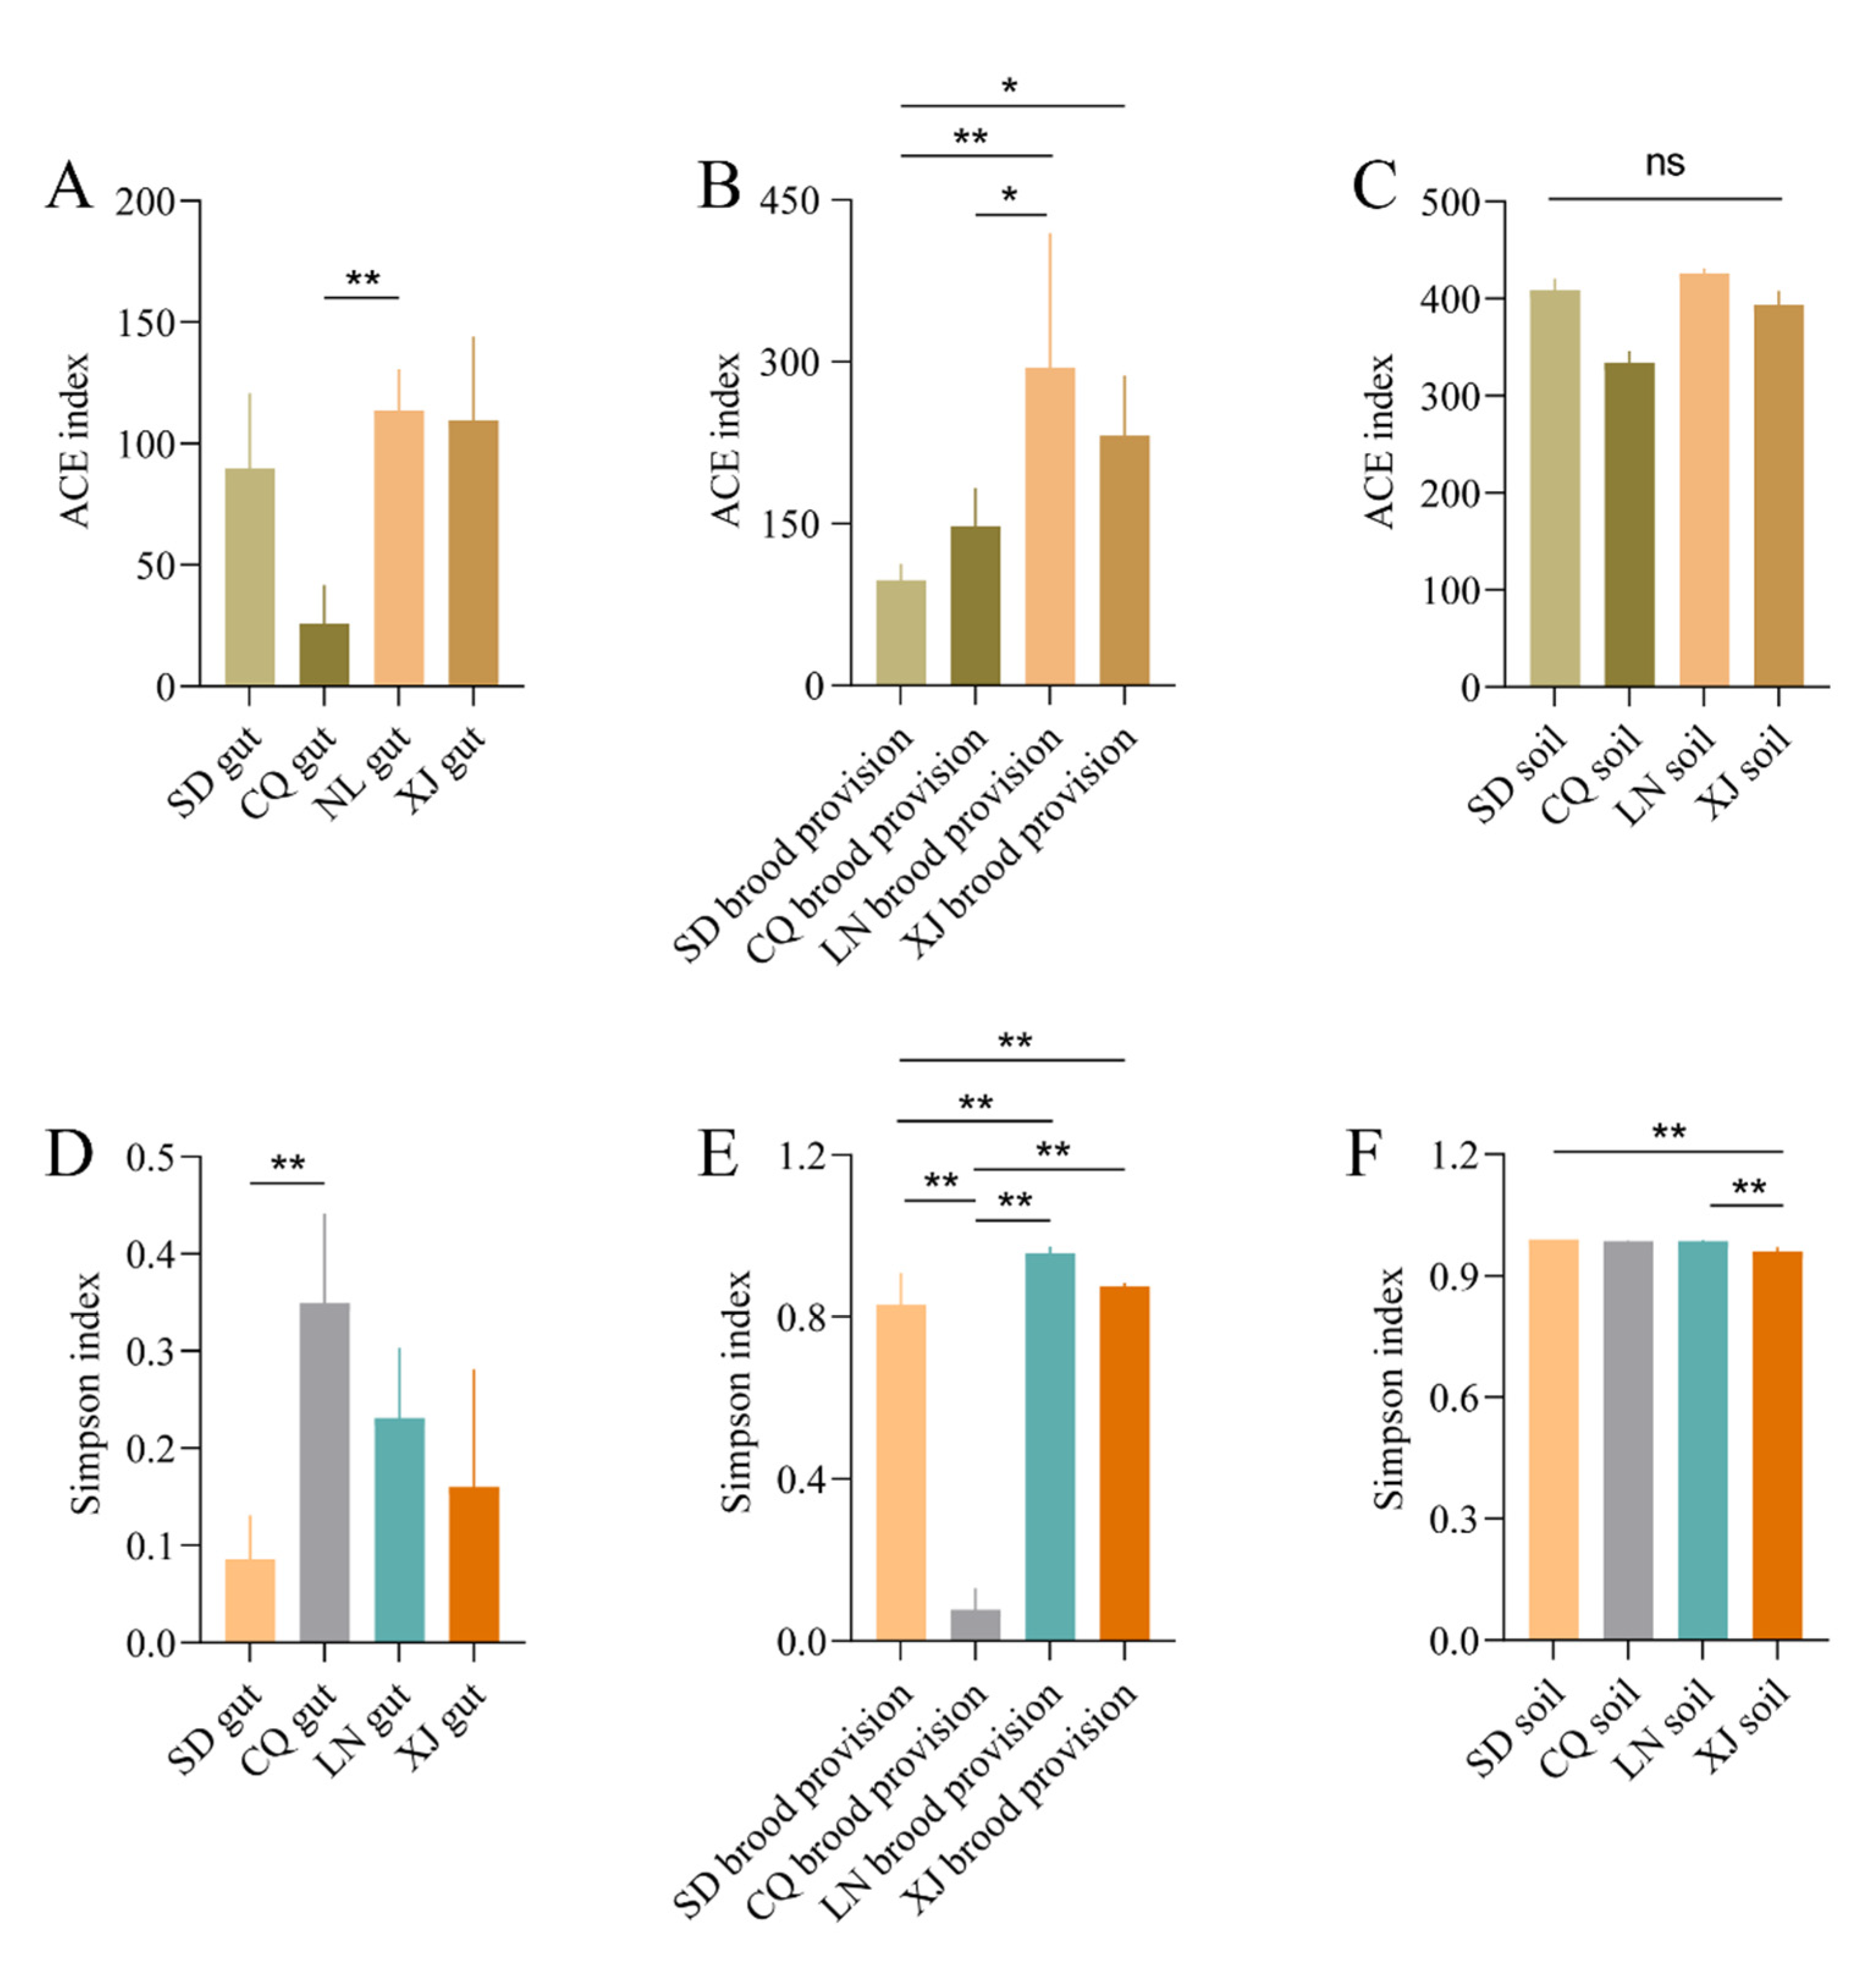
Analysis of the ACE index revealed that there were significant differences in the gut samples of CQ and LN (p = 0.01, n = 10), all brood provisions, but not in nest soils (Figure 4A–C, Table 2). The Simpson index showed that the gut samples of CQ and SD were significantly different (p = 0.01, n = 10). In brood provisions, no differences were found between LN and XJ. However, the nest soil samples of XJ were significantly different from that of SD (p = 0.01, n = 10) and LN (p = 0.03, n = 10) (Figure 4D–F, Table 2).

3.4.2. Beta-Diversity Analysis

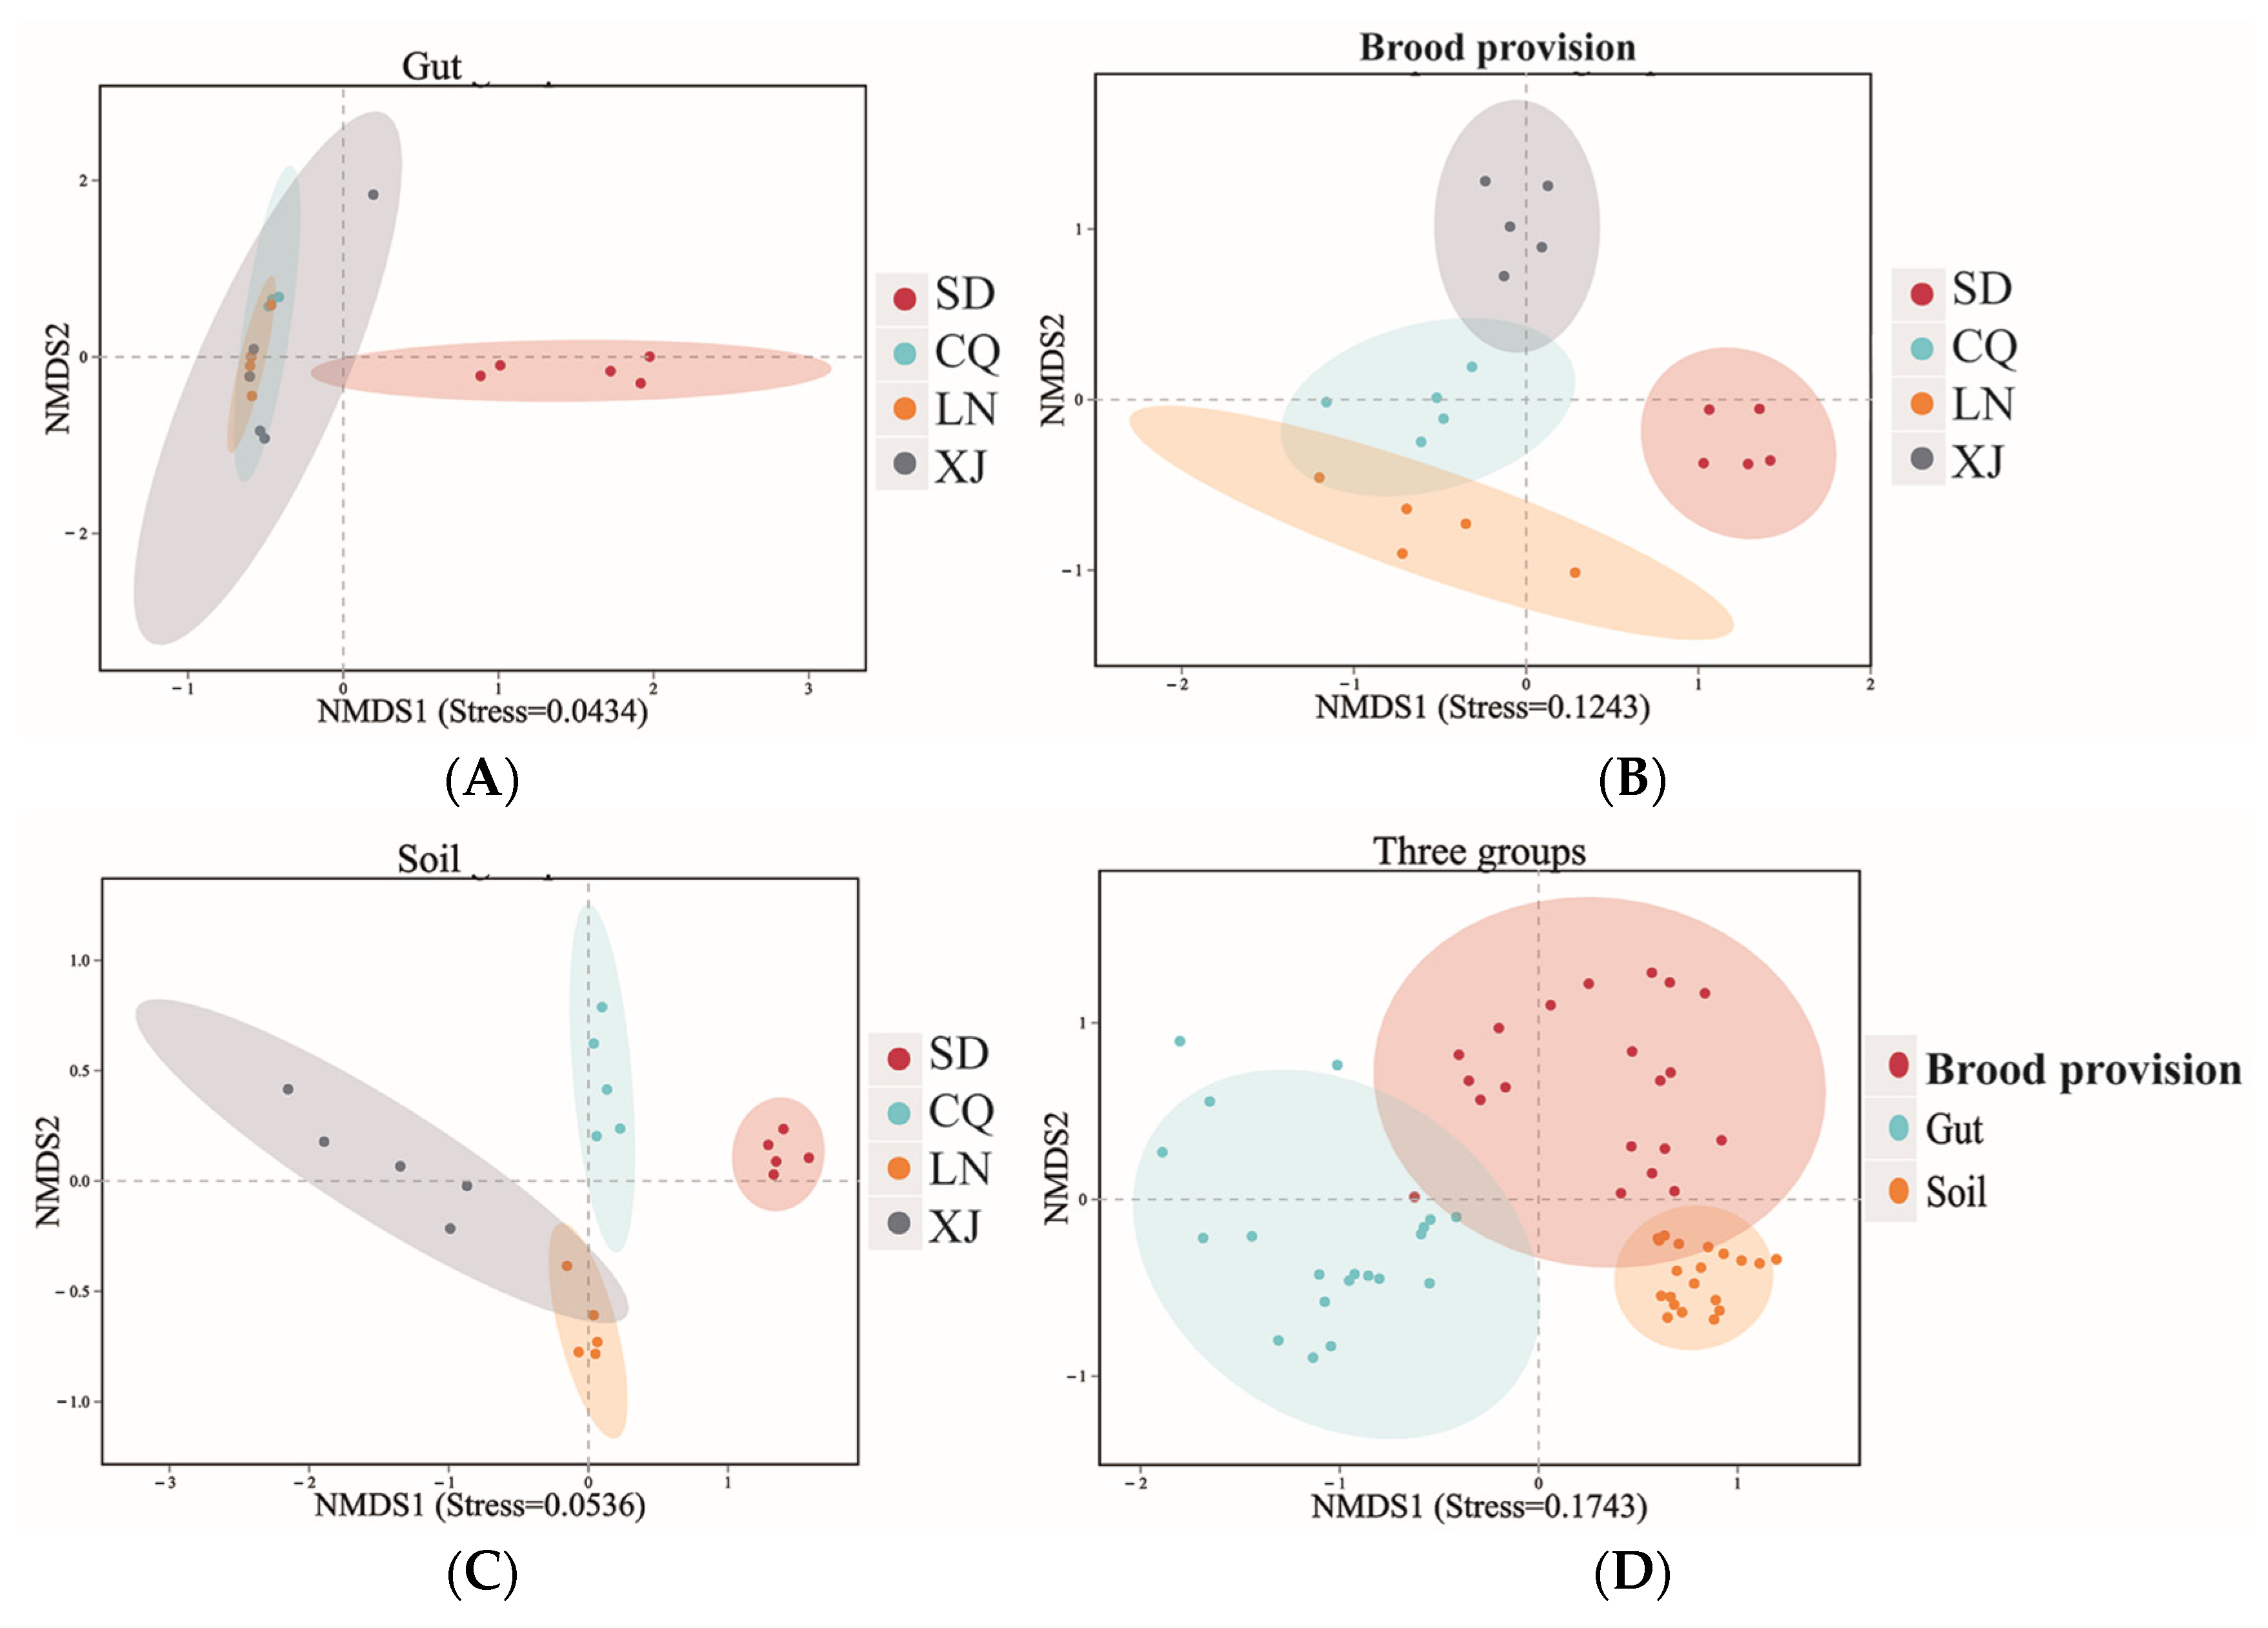
Beta distances based on Bray–Curtis algorithms and NMDS analysis results are shown in Figure 5. The difference in the distance between two different groups was tested by PERMANOVA and listed in Supplementary Table S3. The results showed no significant differences between the gut samples of SD, LN and XJ. Significant differences among brood provisions and nest soils were observed for all samples, respectively. In each region, significant differences were also observed between the gut, brood provision, and nest soil.

3.5. Mantel Tests Analysis

Mantel tests showed that there was no significant correlation between the bacterial communities of the larval gut and brood provision, larval gut and nest soil, brood provision, and nest soil in each plot. (Table 3).

4. Discussion

Osmia excavata is an important wild solitary bee which is currently artificially released in China. It can significantly improve the seed set and fruit quality of some fruits [30]. Given the important role of gut microbes in solitary bee populations and their growth and development, we compared bacterial diversity and community composition in the gut of larvae, brood provision, and nest soil. The dominant bacterial populations from larval gut and brood provision were significantly different, except for the most dominant species (S. praecaptivus), and it was speculated that the larvae of O. excavata will choose specific bacterial species beneficial to their growth and development when feeding on brood provision. The similarity of dominant bacteria in soil and brood provision (e.g., containing A. lwoffii and Massilia sp. together.), which may be due to the fact that adult females of O. excavata collected brood provision immediately after using the soil at the construction brood cell partitions, and the soil bacteria remaining on the foot invade into the brood provision. In addition, the dominant bacteria from the larval gut and brood provision were obviously different, which may be because the dominant bacteria of the brood provision were not adapted to the environment of the gut, or not selected by the larval gut. On the other hand, even if the dominant bacteria of soil may enter the pollen through invasion, it still did not appear in the larval gut. Previous studies have shown that the bacterial diversity of O. excavata nests was much higher than that of social bees [31,32]. Some bacteria found in the gut of other solitary bees were also identified in the gut of O. excavata larvae, such as Bacillaceae, Enterobacteriaceae, Lactobacillaceae [15]. The number and diversity of bacteria present in the brood provision and nest soil were much higher than those in the gut of larvae. It suggests that although larvae develop in different cells close to the brood provisions, not all bacteria can invade or survive in the larval gut.
Our study showed that S.praecaptivus was present in the larval gut and brood provision, and was the most dominant bacteria in both. Previous studies showed that the most abundant bacteria in the gut and brood provision of O. excavata was S. praecaptivus, a common insect endosymbiotic bacterium [33,34,35]. The large number of this beneficial bacterium in the gut and brood provision of O. excavata supported that the bacterial community in solitary bees was derived from environments [13,15]. High abundance of the pathogenic bacterium A. lwoffi was detected in brood provision and nest soil, but was very low in the gut. This suggested that some bacteria cannot survive well in the gut of O. excavata larvae. This finding was similar to a previous study on the bacterial communities of wild solitary bees [15].
Linear discriminant analysis found a significant difference in bacterial communities between the gut, brood provision, and nest soil of O. excavata. This demonstrated that larvae may regulate the type and number of gut bacteria according to their needs Sodalis praecaptivus, L. micheneri and C. colinum was the dominant bacteria in the gut. Lactobacillus, a genus of lactic acid bacteria, had been detected in the gut of a variety of bees in the Megachile and Halictidae as well as the visited flowers [36]. Clostridium colinum was an animal gut pathogen and widely distributed in nature [37]. Massilia sp. and R. nectarea were abundant in the brood provision. The genus Massilia is widely distributed in the soil and can survive stably in a variety of habitats, such as plants, water, and rocks. This genus is also highly adaptable to temperature changes. Importantly, Massilia can synthesize many secondary metabolites and enzymes [38]. R. nectarea is a common nectar-derived bacteria [39]. Gaiella occulta and V. silvestris are abundant in nest soil and V. silvestris can be isolated from the soil [40]. Gaiella occulta has shown an increasing trend in soils with long-term manure application [41].
Analysis of alpha diversity revealed that the bacteria abundance and diversity in the larval gut from SD, LN, and XJ were similar. However, the difference was detected in the brood provision. For the larval gut, beta diversity analysis showed that samples from SD, LN and XJ were clustered together and significantly different from those from CQ. However, the brood provision groups, and nest soil groups were separate. Although the bacterial communities were significantly different in the environment, the diversity in O. excavata gut was similar. However, the exact reason remained unknown. Hosokawa, T et al. speculated that this similarity might be related to the bacteria necessary for the development of larvae inoculated by solitary bees when handing the brood provision [42]. It is well established that O. excavata are mainly distributed in northern China and have strong adaptability [43]. It has become one of the major pollinators in orchards in these regions. In this study, most of the artificial nesting tubes in the three northern sample sites were placed in orchards, while the nesting tubes in the southern sample site were placed in natural fields. Therefore, the above clustering differences may be due to the fact that the northern region is the natural habitat of O. excavata and the ecological environment was similar.
Similar to other studies on bacterial communities in solitary bee nests [11,13], a large number of identical bacterial communities were shared by the larval gut and the nest environment (brood provision, soil), suggesting that the microbes in the larval gut of O. excavata were influenced by the nest environment. The Mantel test showed that the bacterial community structure in the gut was not significantly correlated with the brood provision and nest soil. This may be caused by the high bacterial diversity of the brood provision and soil. Previous studies have shown that environmental influences on the composition and structure of the microbial community may be responsible for hindering the species specificity in host bees and their co-evolution [44,45]. However, we still found a few bacterial communities shared by the larval gut, brood provision, and soil. This also indicated that the gut has certain links to the nest materials. The bacterial communities in the nests of other solitary bees were found in O. excavata hive, and the intestinal flora of the O. excavata was similar in different regions, indicating that there is also a stable core flora in the gut of the solitary bee.

5. Conclusions

In conclusion, a preliminary investigation of bacterial communities associated with O. excavata nest was conducted by high-throughput sequencing of the full-length 16S rRNA. These results showed that the bacterial communities in the gut of O. excavata larvae were similar in different samples. This may be caused by similar habitat conditions, which results in a large number of identical bacterial communities in the brood provision and nest soil of different sampling plots. Subsequently, some bacteria entered the larval gut and survived. There was no significant correlation between bacterial communities in the natal environment (brood provision, soil) and the gut of O. excavata larvae. The environment around the nest, including the temperature, light, precipitation, soil moisture, pH and other factors may affect the gut microbiota of bee larvae by affecting the nesting material and nectar source plants. Our findings will contribute to a better understanding of bacterial communities in O. excavata and other wild solitary bees.

Supplementary Materials

The following supporting information can be downloaded at: https://www.mdpi.com/article/10.3390/app13031524/s1, Figure S1: The species accumulation curves of sample sizes; Table S1: Bacterial 16SrRNA gene sequencing data; Table S2: Statistics of the number of OTUs at different taxonomic levels; Table S3: Nonparametric multivariate analysis of variance.

Author Contributions

Conceptualization, W.L., Y.L. and D.H.; methodology, W.L., Y.L. and H.L.; software, W.L., Y.L., H.L. and K.Z.; validation, W.L., Y.H., X.D. and Z.Z.; formal analysis, W.L., Y.L., Y.H.; investigation, W.L., Y.L., C.Z., H.L. and H.Z.; resources, Z.Z. and D.H; data curation, W.L., Y.L., H.L. and X.F.; writing—original draft preparation, W.L., Y.L., Y.H. and H.L.; writing—review and editing, W.L., Y.L., D.H., K.Z. and A.L.; visualization, W.L., Y.L. and Y.H.; supervision, D.H.; project administration, D.H. and Z.Z.; funding acquisition, D.H. All authors have read and agreed to the published version of the manuscript.

Funding

This research was funded by National Natural Science Foundation of China, grant number 31970484; Research on Basic Resources of Science and Technology, grant number 2018FY100405; The National Natural Science Foundation of China, grant number 32070465; The Key Laboratory of Animal Evolution and Systematics, Chinese Academy of Sciences, grant number E052G21305.

Institutional Review Board Statement

All experiments procedures for this study complied with the current animal ethics guidelines and did not involve any protected animals.

Informed Consent Statement

Not applicable.

Data Availability Statement

The sequence data that support the findings of this study are openly available in GenBank of NCBI at https://www.ncbi.nlm.nih.gov/ (accessed on 18 September 2021). The associated BioProject, SRA, and BioSample numbers are PRJNA763777, SRR15925876, and SAMN21449395, respectively.

Acknowledgments

We are grateful to the editor and reviewers for helpful comments.

Conflicts of Interest

The authors declare that the research was conducted in the absence of any commercial or financial relationships that could be construed as a potential conflict of interest.

References

  1. Klein, A.; Vaissière, B.; Cane, J.; Steffan-Dewenter, I.; Cunningham, S.; Kremen, C.; Tscharntke, T. Importance of pollinators in changing landscapes for world crops. Proc. Biol. Sci. 2007, 274, 303–313. [Google Scholar] [CrossRef] [PubMed] [Green Version]
  2. Fijen, T.; Scheper, J.; Boom, T.; Janssen, N.; Raemakers, I.; Kleijn, D. Insect pollination is at least as important for marketable crop yield as plant quality in a seed crop. Ecol. Lett. 2018, 21, 1704–1713. [Google Scholar] [CrossRef] [PubMed]
  3. Li, H.; Orr, M.C.; Luo, A.; Dou, F.; Kou, R.; Hu, F.; Zhu, C.; Huang, D. Relationships between wild bee abundance and fruit set of Camellia oleifera Abel. J. Appl. Entomol. 2020, 145, 277–285. [Google Scholar] [CrossRef]
  4. Cox-Foster, D.; Conlan, S.; Holmes, E.; Palacios, G.; Evans, J.; Moran, N.; Quan, P.; Briese, T.; Hornig, M.; Geiser, D.; et al. A metagenomic survey of microbes in honey bee colony collapse disorder. Science 2007, 318, 283–287. [Google Scholar] [CrossRef] [Green Version]
  5. Mattila, H.; Rios, D.; Walker-Sperling, V.; Roeselers, G.; Newton, I. Characterization of the active microbiotas associated with honey bees reveals healthier and broader communities when colonies are genetically diverse. PloS ONE 2012, 7, e32962. [Google Scholar] [CrossRef]
  6. Crotti, E.; Sansonno, L.; Prosdocimi, E.; Vacchini, V.; Hamdi, C.; Cherif, A.; Gonella, E.; Marzorati, M.; Balloi, A. Microbial symbionts of honeybees: A promising tool to improve honeybee health. New Biotechnol. 2013, 30, 716–722. [Google Scholar] [CrossRef]
  7. Engel, P.; Kwong, W.; McFrederick, Q.; Anderson, K.; Barribeau, S.; Chandler, J.; Cornman, R.; Dainat, J.; de Miranda, J.; Doublet, V.; et al. The Bee Microbiome: Impact on Bee Health and Model for Evolution and Ecology of Host-Microbe Interactions. mBio 2016, 7, e02164-15. [Google Scholar] [CrossRef] [Green Version]
  8. Anderson, K.; Ricigliano, V. Honey bee gut dysbiosis: A novel context of disease ecology. Curr. Opin. Insect Sci. 2017, 22, 125–132. [Google Scholar] [CrossRef]
  9. Martinson, V.; Danforth, B.; Minckley, R.; Rueppell, O.; Tingek, S.; Moran, N. A simple and distinctive microbiota associated with honey bees and bumble bees. Mol. Ecol. 2011, 20, 619–628. [Google Scholar] [CrossRef]
  10. Kwong, W.; Medina, L.; Koch, H.; Sing, K.; Soh, E.; Ascher, J.; Jaffé, R.; Moran, N. Dynamic microbiome evolution in social bees. Sci. Adv. 2017, 3, e1600513. [Google Scholar] [CrossRef]
  11. McFrederick, Q.; Thomas, J.; Neff, J.; Vuong, H.; Russell, K.; Hale, A.; Mueller, U. Flowers and Wild Megachilid Bees Share Microbes. Microb. Ecol. 2017, 73, 188–200. [Google Scholar] [CrossRef]
  12. Voulgari-Kokota, A.; Ankenbrand, M.; Grimmer, G.; Steffan-Dewenter, I.; Keller, A. Linking pollen foraging of megachilid bees to their nest bacterial microbiota. Ecol. Evol. 2019, 9, 10788–10800. [Google Scholar] [CrossRef] [Green Version]
  13. Lozo, J.; Berić, T.; Terzić-Vidojević, A.; Stanković, S.; Fira, D.; Stanisavljević, L. Microbiota associated with pollen, bee bread, larvae and adults of solitary bee Osmia cornuta (Hymenoptera: Megachilidae). Bull. Entomol. Res. 2015, 105, 470–476. [Google Scholar] [CrossRef]
  14. Voulgari-Kokota, A.; McFrederick, Q.; Steffan-Dewenter, I.; Keller, A. Drivers, Diversity, and Functions of the Solitary-Bee Microbiota. Trends Microbiol. 2019, 27, 1034–1044. [Google Scholar] [CrossRef]
  15. Voulgari-Kokota, A.; Grimmer, G.; Steffan-Dewenter, I.; Keller, A. Bacterial community structure and succession in nests of two megachilid bee genera. FEMS Microbiol. Ecol. 2019, 95, fiy218. [Google Scholar] [CrossRef] [Green Version]
  16. Rothman, J.; Andrikopoulos, C.; Cox-Foster, D.; McFrederick, Q. Floral and Foliar Source Affect the Bee Nest Microbial Community. Microb. Ecol. 2019, 78, 506–516. [Google Scholar] [CrossRef] [Green Version]
  17. Yuan, F.; Wei, Y.P.; Zhang, Y.L.; He, Z.X.; Huang, S.Z.; Yuan, J.G. A faunistic survey of Osmia bees (Hymenoptera: Megachilidae) in Shaanxi and their application. Entomotaxonomia 1992, 2, 148–152. [Google Scholar]
  18. Zhang, F.L.; Yuan, F. Study on the Influence of Meteorological Factors on Daily Activity of Osmia Excavata Alfken. China Agric. Meteorol. 1998, 19, 52–54. [Google Scholar]
  19. Liu, L.; Li, L.L.; Ouyang, F.; Li, C.; Yu, Y.; Qu, C.H.; Qu, Z.L.; Men, X.Y.; Ye, B.H. Fruit-setting and yield increase for pear pollination by Osmia excavata Alfken and evaluation of economic value in Shandong Province. Bull. Agricul. Sci. Technol. 2019, 8, 233–236. [Google Scholar]
  20. Liu, L.; Li, L.L.; Ouyang, F.; LI, C.; Yu, Y.; Qu, C.H.; Qu, Z.L.; Ye, B.H.; Men, X.Y. Fruit-setting, yield increase and economic value evaluation for cherry pollination by Osmia excavata Alfken in Shandong Province. Shandong Agricul. Sci. 2019, 51, 125–128. [Google Scholar]
  21. Wang, G.P.; Lin, L.H.; Xue, X.M.; Wang, J.Z.; Tao, J.H. Research and application progress of Osmia pollination techniques on apple in China. Deciduous Fruits 2018, 50, 25–28. [Google Scholar]
  22. Lim, H.; Chu, C.; Seufferheld, M.; Cameron, S. Deep sequencing and ecological characterization of gut microbial communities of diverse bumble bee species. PloS ONE 2015, 10, e0118566. [Google Scholar] [CrossRef] [PubMed]
  23. Edgar, R. Search and clustering orders of magnitude faster than BLAST. Bioinformatics 2010, 26, 2460–2461. [Google Scholar] [CrossRef] [PubMed] [Green Version]
  24. Wickham, H. ggplot2: Elegant Graphics for Data Analysis; Springer: New York, NY, USA, 2016; Available online: https://ggplot2.tidyverse.org (accessed on 22 August 2021).
  25. Quast, C.; Pruesse, E.; Yilmaz, P.; Gerken, J.; Schweer, T.; Yarza, P.; Peplies, J.; Glöckner, F. The SILVA ribosomal RNA gene database project: Improved data processing and web-based tools. Nucleic Acids Res. 2013, 41, D590–D596. [Google Scholar] [CrossRef] [PubMed]
  26. Chen, H.; Boutros, P. VennDiagram: A package for the generation of highly-customizable Venn and Euler diagrams in R. BMC Bioinform. 2011, 12, 35. [Google Scholar] [CrossRef]
  27. Coche, S.; Sprangers, B.; Van Laecke, S.; Weekers, L.; De Meyer, V.; Hellemans, R.; Castanares, D.; Ameye, H.; Goffin, E.; Demoulin, N.; et al. Recurrence and Outcome of Anti-Glomerular Basement Membrane Glomerulonephritis after Kidney Transplantation. Kidney Int. Rep. 2021, 6, 1888–1894. [Google Scholar] [CrossRef]
  28. Anderson, M.J. A new method for non-parametric multivariate analysis of variance. Austral. Ecol. 2011, 26, 32–46. [Google Scholar]
  29. Dixon, P. VEGAN, a package of R functions for community ecology. J. Veg. Sci. 2003, 14, 927–930. [Google Scholar] [CrossRef]
  30. He, W.Z.; Zhou, R.W. Effects of apple pollination on Osmia excavata Alfken, Apis mellifera L. and artificical pollination. Apicult. China 2009, 60, 9–11. [Google Scholar]
  31. Keller, A.; Grimmer, G.; Steffan-Dewenter, I. Diverse microbiota identified in whole intact nest chambers of the red mason bee Osmia bicornis (Linnaeus 1758). PLoS ONE 2013, 8, e78296. [Google Scholar] [CrossRef] [Green Version]
  32. McFrederick, Q.S.; Rehan, S.M. Characterization of pollen and bacterial community composition in brood provisions of a small carpenter bee. Mol. Ecol. 2016, 25, 2302–2311. [Google Scholar] [CrossRef]
  33. Elbein, A.; Pan, Y.; Pastuszak, I.; Carroll, D. New insights on trehalose: A multifunctional molecule. Glycobiology 2003, 13, 17R–27R. [Google Scholar] [CrossRef]
  34. Merzendorfer, H.; Zimoch, L. Chitin metabolism in insects: Structure, function and regulation of chitin synthases and chitinases. J. Exp. Biol. 2003, 206, 4393–4412. [Google Scholar] [CrossRef] [Green Version]
  35. Chari, A.; Oakeson, K.; Enomoto, S.; Jackson, D.; Fisher, M.; Dale, C. Phenotypic characterization of Sodalis praecaptivus sp. nov., a close non-insect-associated member of the Sodalis-allied lineage of insect endosymbionts. Int. J. Syst. Evol. Microbiol. 2015, 65, 1400–1405. [Google Scholar] [CrossRef] [Green Version]
  36. McFrederick, Q.; Rehan, S. Wild Bee Pollen Usage and Microbial Communities Co-vary across Landscapes. Microb. Ecol. 2019, 77, 513–522. [Google Scholar] [CrossRef]
  37. Diao, Y.X.; Li, J.Q.; Chen, Q.P.; Wng, H.B. Isolation and identification of Clostridum Colinum. Chin. J. Prev. Vet. Med. 2000, 4, 5–6. [Google Scholar]
  38. Yang, E.D.; Cui, D.X.; Wang, W.Y. Research progress on the genus Massilia. Microbiol. China 2019, 46, 1537–1548. [Google Scholar]
  39. Halpern, M.; Fridman, S.; Atamna-Ismaeel, N.; Izhaki, I. Rosenbergiella nectarea gen. nov., sp. nov., in the family Enterobacteriaceae, isolated from floral nectar. Int. J. Syst. Evol. Microbiol. 2013, 63, 4259–4265. [Google Scholar] [CrossRef]
  40. Lin, Y.; Ye, G.; Kuzyakov, Y.; Liu, D.; Fan, J.; Ding, W. Long-term manure application increases soil organic matter and aggregation, and alters microbial community structure and keystone taxa. Soil Biol. Biochem. 2019, 134, 187–196. [Google Scholar] [CrossRef]
  41. Huber, K.; Geppert, A.; Wanner, G.; Fösel, B.; Wüst, P.; Overmann, J. The first representative of the globally widespread subdivision 6 Acidobacteria, Vicinamibacter silvestris gen. nov., sp. nov., isolated from subtropical savannah soil. Int. J. Syst. Evol. Microbiol. 2016, 66, 2971–2979. [Google Scholar] [CrossRef]
  42. Hosokawa, T.; Kikuchi, Y.; Fukatsu, T. How many symbionts are provided by mothers, acquired by offspring, and needed for successful vertical transmission in an obligate insect-bacterium mutualism? Mol. Ecol. 2007, 16, 5316–5325. [Google Scholar] [CrossRef] [PubMed]
  43. Wei, Y.P.; Yuan, F.; Zhang, Y.L. The resistance and reproductive potential of Osima excavata Alfken. Chin. J. Appl. Entomol. 2001, 2, 122–124. [Google Scholar]
  44. Gilliam, M.; Buchmann, S.L.; Lorenz, B.J.; Schmalzel, R.J. Bacteria belonging to the genus Bacillus associated with three species of solitary bees. Apidologie 1990, 21, 99–105. [Google Scholar] [CrossRef] [Green Version]
  45. Inglis, G.D.; Yanke, L.J.; Goettel, M.S. Anaerobic bacteria isolated from the alimentary canals of alfalfa leafcutting bee larvae. Apidologie 1998, 29, 327–332. [Google Scholar] [CrossRef]
Figure 1. Venn diagram of OTUs assignments illustrating the number of taxa shared in and between gut, brood provision and nest soil.
Applsci 13 01524 g001
Figure 2. Bacterial community structure and relative abundance in gut (A); brood provision (B); and nest soil (C). The y-axis and x-axis represent the proportional abundance of bacterial OTUs and samples, respectively.
Applsci 13 01524 g002
Figure 3. The cluster analysis of larvae gut, brood provision and soil bacterial community composition of O. excavata in different plots ((A) SD; (B) CQ; (C) LN; and (D) XJ).
Applsci 13 01524 g003
Figure 4. LSD test of the ACE index (AC); and Simpson index (DF) of bacterial communities from the larval guts (A,D), brood provisions (B,E) and nest soils (C,F). Asterisks indicate significant differences between different samples. * p < 0.05, ** p < 0.01. The y-axis and x-axis represent the diversity index value and sample experimental plots, respectively.
Applsci 13 01524 g004
Figure 5. Nonmetric multidimensional scaling (NMDS) analysis of gut (A); brood provision (B); nest soil (C); and the above three groups in total (D).
Applsci 13 01524 g005
Table 1. O. excavata nest tube collection sample sites.
LocationExperimental PlotLatitude/LongitudeElevation (m)Sampling Environment
Tangwang Town, Jinan, ShandongSDN36.8193/E117.275826pear orchard
Huxi Street, Shapingba District, ChongqingCQN29.6145/E106.2994292semi-natural habitat
Sanrunbao Street, Dalian, LiaoningLNN38.9400/E121.170430cherry orchard
Shayidong Horticulture Farm, Bayinguoleng, XinjiangXJN41.7271/E86.0232921pear orchard
Table 2. Multiple comparisons of the ACE and Simpson index of larval gut, brood provision, and soil bacteria in different plots.
CategorySDCQLNXJ
ACE index
Gut89.75 ± 61.84 AB b28.39 ± 20.76 B c113.56 ± 34.06 A c109.64 ± 68.79 AB c
Brood provision97.71 ± 30.38 C b147.73 ± 71.23 BC b294.54 ± 44.62 A b231.67 ± 48.94 AB b
Soil408.55 ± 24.01 A a334.01 ± 24.46 A a425.92 ± 10.47 A a393.64 ± 28.61 A a
Simpson index
Gut0.09 ± 0.03 B c0.35 ± 0.19 A c0.23 ± 0.14 AB c0.16 ± 0.24 AB c
Brood provision0.83 ± 0.15 C b0.64 ± 0.11 B b0.96 ± 0.03 A b0.88 ± 0.01 A b
Soil0.99 ± 0.00 A a0.99 ± 0.00 AB a0.99 ± 0.01 A a0.96 ± 0.02 B a
The data in the table is organized as “Mean. ± std.”; The same capital letters after peer data indicate that the difference between samples is not significant (p > 0.05); The same lowercase letters after the same column of data indicate that the difference between samples is not significant (p > 0.05).
Table 3. Mantel correlations among Bray–Curtis distance matrices based on bacterial OTUs in gut, brood provision, and nest soil.
PlotSample 1Sample 2Mantel Statistics R *p-Value
SDGutBrood provision−0.018180.49167
GutSoil−0.52730.96667
Brood provisionSoil0.55150.14167
CQGutBrood provision0.39390.1
GutSoil0.26060.21667
Brood provisionSoil0.64850.05
LNGut Brood provision0.18790.31667
Gut Soil−0.45450.96667
Brood provisionSoil−0.054550.55833
XJGut Brood provision−0.26060.79167
Gut Soil0.03030.5
Brood provisionSoil−0.22420.70833
* The Mantel statistic R closes to 1 indicates that the positive correlation between the two matrices was stronger. It closes to −1 indicates the negatively correlation was stronger. Number of permutations: 999; Correlation coefficient: Spearman.
Disclaimer/Publisher’s Note: The statements, opinions and data contained in all publications are solely those of the individual author(s) and contributor(s) and not of MDPI and/or the editor(s). MDPI and/or the editor(s) disclaim responsibility for any injury to people or property resulting from any ideas, methods, instructions or products referred to in the content.