Article

Analysis and Determination of the Lateral Distance Parameters of Vehicles When Overtaking an Electric Bicycle from the Point of View of Road Safety

1
Academy of Professional Studies Sumadija, Department in Kragujevac, 34000 Kragujevac, Serbia
2
Faculty of Transport and Traffic Engineering, University of Belgrade, 11000 Belgrade, Serbia
3
Faculty of Mechanical Engineering, University of Montenegro, 81000 Podgorica, Montenegro
4
Faculty of Mechanical Engineering, University of Belgrade, 11000 Belgrade, Serbia
5
Faculty of Manufacturing Technologies with a Seat in Presov, Technical University of Kosice, 08001 Presov, Slovakia
*
Author to whom correspondence should be addressed.
Appl. Sci. 2023, 13(3), 1621; https://doi.org/10.3390/app13031621
Submission received: 17 December 2022 / Revised: 11 January 2023 / Accepted: 18 January 2023 / Published: 27 January 2023

Abstract

:
Recent years have witnessed an increasing number of electric bicycles on the roads and a rise in the number of road crashes involving e-bicyclists. There are various causes of road crashes involving e-bicyclists. Out of the total number of fatalities in traffic, bicyclists account for 9% in the Republic of Serbia. Road crashes occurring when motor vehicles overtake bicyclists make up 13% of the total number of road crashes involving bicyclists. Having in mind the above-mentioned, an experimental study has been conducted in order to analyze whether the use of helmets and reflective vests, different vehicle categories, and the speed of electric bicycles affect the lateral distance when overtaking e-bicycles. This research analyzed the lateral distance of 1228 vehicles overtaking an e-bicyclist. There are statistically significant differences in the lateral distance when overtaking an e-bicycle regarding helmet use, different vehicle categories overtaking the e-bicycle, and different speeds of the e-bicycle. The results showed that a faster speed of an e-bicycle led to a shorter lateral distance when overtaking it and that SUV drivers (along with motorcycle drivers) had the shortest lateral distance when overtaking e-bicycles.

1. Introduction

The use of e-bicycles in traffic is growing [1,2,3,4] because they are becoming increasingly popular in the transportation of passengers and goods [4,5,6]. In the previous literature, the authors most frequently mention the following advantages of using e-bicycles: the positive impact on the e-bicyclist’s health [7,8,9,10,11,12,13,14], the facilitation of cycling for the elderly and people with certain physical disabilities [7,8,10,14,15], less physical effort required for cycling [10,13], the introduction of physical activities in everyday life [3,8,9], travelling longer distances [10,13,16], the realization of a larger number of shorter trips in the city [16], as well as the faster movement speed [13], and the decrease in travel time [10].
The conducted studies mention certain disadvantages and obstacles regarding the use of e-bicycles: the change in traffic flow dynamics, which can result in a change in the modes of regulation and control traffic flow [5], sudden innovations/changes in urban transport development strategies and strong competition with other means of transport [17], compromising traffic safety [13,18], a negative impact on the environment in terms of the battery production and disposal [10,18,19,20], a limited operation range [13,21,22], low battery capacity [3], battery life [22], payload [21], high cost [3,10,13], maintenance [22], a heavy weight [3,13,22], risk of theft [3,13], lack of infrastructure [3], requirements related to safe parking [10], etc.
One specific form of the bicycle–vehicle interaction that warrants further investigation, is the overtaking behaviour of motorized vehicles relative to cyclists. According to research by Dozza [5,23], the minimum lateral clearance of a vehicle while overtaking a cyclist is a key indicator of cyclists’ safety. In Belgium, a minimum lateral clearance distance of 100 cm in the built-up area and 150 cm outside the built-up area has been included in the traffic Law. Different standards apply in different countries, so each country has to be looked at separately. For example, in France, the same standards as in Belgium are applied, but in the Netherlands and the UK, there are no standards, and in other countries such as Spain, 150 cm is used as the standard [24]. In the Republic of Serbia, the country where this research was conducted, the law does not define the minimum distance for vehicles when overtaking (e-)bicycles.
Hereafter, this study shows how the speed of e-bicycles and the lateral distance when overtaking (e-bicycles), as well as the use of a helmet and a reflective vest, affect the safety of e-cyclists. The review and analysis of the aforementioned items can provide insight relevant both for scientific and educational purposes and for identifying legal solutions, as well as for the development of traffic policies.

1.1. Effect of (Electric) Bicycle Speed

Today, e-bicycles are becoming increasingly popular for everyday use. Due to the fact that they can go faster than traditional bicycles, the road safety of e-bicyclists causes a lot of concern. Rodier et al. [25] conducted a study which did not indicate any difference between the collisions involving e-bicycles and the collisions involving bicycles at low speeds. It should be noted that, when it comes to e-bicycles, there were more recorded collisions with “heavy vehicles” (buses and trucks) and fewer collisions with “light” vehicles (automobiles and vans), than was the case for bicycles [5]. From the analytical perspective, road crashes between bicycles and other categories of road users are of interest since serious injuries and deaths occur frequently [5,26]. Examining e-bicyclist safety in China, Cherry [1] concluded that e-bicyclists had a somewhat higher fatality rate than bicyclists. In their study, Dozza et al. [5] state that e-bicycles “have conflicts” with motor vehicles more frequently than bicycles. These conflicts can be consequences of the driver’s error, i.e., incorrect expectations regarding the behaviour of other road users. These wrong expectations occur due to the fact that e-bicyclists resemble bicyclists but often travel at faster speeds. Drivers have less time to notice e-bicyclists and often underestimate their speed. In addition, the same study states that e-bicyclists cover larger distances than conventional bicyclists, while the number of “critical” situations is directly proportional to distance. Namely, a larger number of kilometres covered by an e-bicycle at faster speeds can explain a larger number of “critical” events [5] and a higher risk of participating in road crashes by e-bicyclists. Drivers of e-bikes have a considerably higher risk for serious single-vehicle collisions in road traffic compared to conventional bicycle drivers (according to Dozza et al. [5], 45.4 vs. 16.8 single-vehicle collisions with serious or fatal injury per one hundred million kilometres). The higher speed of e-bikes compared to bicycles might be an explanation for this result [5,27,28]. Schleinitz et al. [29] state that the error of the other participant was determined in 70% of road crashes including e-bicyclists. The error of the other participant amounted to 60% in road crashes involving bicyclists, which also confirms the fact that e-bicyclists have a higher risk of participating in road crashes. On the other hand, the degree of motorization is increasing, and the use of e-vehicles is increasing (which have better acceleration than traditional vehicles, on the one hand, while on the other hand, they have less noise, which reduces the possibility of perceiving the e-vehicles by other participants in traffic), while the promotion of e-bikes as a sustainable mode of transportation is a general trend in the world.
For these reasons, but also due to the trend of increasing use of e- bicycles, as well as due to the increasing speeds that e-bicycle develop (using improved batteries, aerodynamics, etc.), it is necessary to examine how motorists behave when overtaking e-bicycles (different speeds), from the aspect of lateral distance when overtaking.

1.2. Overtaking and Lateral Distance

According to the law of the country where the research was conducted (Serbia), overtaking in traffic represents the act of one road user passing the other road user travelling in the same direction on a road [30]. Road crashes involving motor vehicles overtaking bicyclists make up 13% of the total number of road crashes involving bicyclists [31]. Road crashes involving a motor vehicle and a bicyclist travelling in the same direction most frequently result in serious injuries [32]. The reports on road crashes, presented in the study of Walker and Jones [31], state that certain vehicle categories, particularly buses, were the most represented in road crashes involving bicyclists which happened while overtaking. In addition, Parkin and Meyers [33] showed that a motor vehicle’s overtaking lateral distance from a bicyclist depended on the vehicle type and that the marked cycle lanes on the road did not ensure a greater lateral distance between the overtaking motor vehicle and the bicyclist in all conditions. Overtaking lateral distance from the bicyclist was shorter in the case of passing motorcycles than in the case of cars and light goods vehicles, while the lateral stability of the bicyclists was weaker when they were overtaken by buses [34]. The results of Walker’s [35] study showed that the conducted research did not lead to the conclusion that bicyclists were safer if they drove closer to the edge of the road. If they drive close to the edge of the road, their safety could be additionally jeopardized by drainage grids, road cracks, car doors, etc.

1.3. Helmet and Reflective Vests

The research by Walker [35] showed that the lateral distance of motor vehicles overtaking bicyclists was significantly shorter when the bicyclists wore protective helmets than the lateral distance in the situations when bicyclists did not wear protective helmets. However, a repeated analysis of 2355 events of motor vehicles overtaking bicyclists, as described by Walker, included data regarding the bicyclist’s distance to the edge of the road, vehicle size and colour, observed city, period of the day, whether the overtaking occurred on cycle lanes, and whether the bicyclist wore a protective helmet. This re-analysis showed that there was no correlation between wearing a helmet and the close passing of motor vehicles [35,36]. Different countries have different legislation regarding obligatory helmet wearing while cycling. On the other hand, there is a lack of consensus in the research literature regarding bicycle helmet use, as described in recent studies [37,38].
In order to be more conspicuous, bicyclists should wear reflective vests or high-visibility bicycle clothing [39]. A study conducted by Lahrmann et al. [39] examined the impact of light-coloured clothing/vests on reducing the number of cyclists’ road crashes. The results showed that the vest contributes to the reduction of the number of road crashes by as much as 38% [39]. On the other hand, about 80% of cyclists believe that the use of bright-coloured bicycle jackets/vests increases their safety of participation in traffic [39,40]. At night, bicyclists are insufficiently visible to motor vehicle drivers since a small number of bicyclists wear reflective vests [41]. More than half of bicyclists believe that bicycle lights are more effective than reflective vests, which is their reported reason for not wearing reflective vests [42]. Wood et al. [41] studied the impact of reflective clothing on the conspicuity of bicyclists in traffic. The obtained results showed that cycling clothing, bicycle lights, and the age of drivers significantly affected the ability of drivers to recognize bicyclists in night-time driving conditions. Wood et al. [41] determined that wearing reflective vests and ankle and knee reflectors increased the conspicuity of bicyclists in traffic, i.e., made them visible at 5.9 times longer distance than when the bicyclists wore black clothing and at 3.1 times longer distance than when the bicyclists wore only reflective vests [41].

1.4. Traffic Safety Situation

In the Republic of Serbia, where this research was conducted, bicyclists make up 9% of all traffic fatalities [43]. In the Republic of Serbia, less than 1% of all trips are made by bicycle [44]. In Belgrade, where this experimental research was conducted, there are about 50,000 bicycles (Belgrade has about 1,400,000 inhabitants [45]). Due to the COVID-19 pandemic, bicycle traffic in this territory is becoming increasingly popular. As many as 9% of respondents who did not use a bicycle before the COVID-19 pandemic have the desire to switch to bicycle use [44,46]. The most frequent types of road crashes between motor vehicles and bicycles were crashes happening while travelling in the same direction (57%) and side collisions (28%) [43].
Having in mind the above-mentioned facts and issues, the aim of this paper was to examine the impact of different e-bicycle speeds on the lateral distance between the overtaking motor vehicle and the bicyclist. In addition, the paper studied the effect of wearing protective helmets and/or reflective vests on the lateral distance when overtaking an e-bicycle. The passing lateral distances of different motor vehicle categories when overtaking e-bicycles were separately analysed.

2. Materials and Methods

2.1. Conducting the Experiment

In this research, a KTM electric bicycle was used, and a Philips Harris ultrasonic sensor was mounted on its frame for measuring the overtaking lateral distance of vehicles when overtaking the e-bicycle. The display showing the read data was installed on the e-bicycle handlebar. There was an installed speedometer next to the display which helped the e-bicyclist control the travelling speed at any moment. The data were recorded using a GoPro camera (Country of purchase: Serbia, Country of production: China)(it features 5.3 K video and 27 MP photos, plus Emmy® Award-winning HyperSmooth 5.0 stabilization and dual LCD screens for framing shots) (Figure 1). The camera registered the required information and recorded the vehicles overtaking the e-bicyclist. In addition to the visual recording, the camera also recorded sound, so that the cyclist could verbally draw attention to important details while riding, which would help in data processing (current scenario of the experiment including speed, helmet, vest, etc.; deviation from the ideal trajectory, set speeds, etc.).
The method of conducting this research and the scenarios were carried out according to the methodology of the conducted studies [24,35]. As in the paper by Walker [35], in this research, the vehicles were also divided into seven groups (passenger cars, light goods vehicles, heavy goods vehicles, buses, motorcycles, SUVs, and taxis). It should be noted that no taxi vehicle belonged to the SUV category. The e-bicyclist travelled at 0.5 m from the right edge of the road. In our experiment, a laser fixed to the bicycle frame and pointed to the right edge of the road allowed the rider to maintain a constant lateral distance of 0.5 m between the right edge of the road and the bicycle’s centreline. The laser’s beam pointed to the 0.5 m distance. The Law on Road Traffic Safety forbids bicyclists in Serbia to cycle at distances farther than 1 m from the right edge of the road [30]. In the country where this research was conducted, there is no legally defined minimum lateral distance when overtaking a(n) (e-)bicycle. During the experiment, the largest part of the equipment was hidden from the rider’s visual field in order to obtain as realistic conditions as possible. The research was conducted in April in the middle of the working week (on Tuesday, Wednesday, and Thursday). The experiment took place during the period from 9 to 10 a.m. and from 5 to 6 p.m. in order to avoid peak traffic hours. The temperature was in the range of 16 °C to 28 °C. The outdoor light varied between 50,000 lux and 80,000 lux.
Measurement of the lateral distance of the vehicle overtaking the e-bicycle was performed when the bicyclist wore a helmet, when the bicyclist wore a reflective vest, and when the bicyclist wore neither a helmet nor a reflective vest [24,35]. In addition, three different speeds of electric bicycles were used in this study (25 km/h, 30 km/h, and 35 km/h). According to the Law on Traffic Safety, it is not compulsory to wear a protective helmet and a reflective vest when cycling in the Republic of Serbia.
The data regarding the moment of the bicyclist’s manoeuvring due to certain objects (potholes in the road, cars, and passengers) were not considered in the analysis. Similarly, other data which did not correspond to the defined methodology of the experiment (for example, inappropriate e-bicycle speed) were not taken into account. The same e-bicyclist was constantly used for the needs of the experiment. The study was not conducted on humans, so this study did not require IRB (Institutional Review Board) approval. During the experiment, the e-bicyclist experienced 5 situations in which he had to move in order to avoid road crashes. The collection of the data required for this research was conducted by means of a thorough and detailed analysis of the video material from the cameras used in the experiment. All the situations which did not correspond to the defined methodology of the paper were excluded from the total sample.

2.2. Location

The experiment was carried out in the territory of the city of Belgrade. Out of the analysed 6 potential sections for conducting the experiment, the section fulfilling all the requirements for conducting the experiment was selected (the requirements included the safety of participants, variety of vehicle categories in the traffic flow, and technical and operational characteristics of the road, i.e., there are no curves on sections of road). The section length is 7 km, and it is located in an inhabited part of the city, in the wider city centre area (Figure 2). The observed section is a two-lane road with one lane in each direction. The width of one traffic lane is 3 m and there is a shoulder between 0.2 and 1.5 m wide. The road with the specified width was tendentiously chosen so that motor vehicles would overtake the electric bicycle only in situations when there are no other vehicles from the opposite direction. In some places along the mentioned route, there is a sidewalk between 1.5 and 3 m wide. The carriageway is of good quality, and the road contains all the required elements of horizontal (broken and unbroken lines, etc.) and vertical signalization. The observed street is used by approximately 5000 vehicles daily (AADT). The speed limit on this section is 50 km/h.

2.3. Characteristics of the Electric Bicycle, Helmet, and Reflective Vest

The technical description of the characteristics of the driver’s protective equipment is shown in Table 1 and in Figure 3.

2.4. Collecting and Processing Data

The video camera recordings were analysed, and the data were entered in the statistical software package IBM SPSS Statistics v. 28. The analysis of the video recording was performed by three members of the team at the same time in order to reduce the possibility of error and to adjust all the data. The following data were extracted from the video material:
  • E-bicycle riding scenario (e-bicycle speed: categorical variable—25 km/h (NT = 375), 30 km/h (NT = 441), and 35 km/h (NT = 412); use of equipment: categorical variable—helmet (NT = 356), reflective vest (NT = 277), helmet and reflective vest (NT = 260), no equipment (NT = 335));
  • Vehicle categories (categorical variable: passenger cars (NT = 981), light goods vehicles (NT = 58), heavy goods vehicles (NT = 28), buses (NT = 34), motorcycles (NT = 25), SUVs (NT = 60), and taxis (NT = 42));
  • Lateral distance of the motor vehicle when overtaking the e-bicycle (continuous variable: units—meter and centimetre).
The normality of the distribution was tested using an inspection of histograms and the Kolmogorov–Smirnov test. Since the data for all the measured variables were normally distributed, parametric methods were used. The analysis of variance (ANOVA), three-way ANOVA, two-way ANOVA, and t-test were used to assess the significance of differences. The Bonferroni post hoc test was used for additional comparison between groups [47,48]. The main hypothesis (H0) was: There are no significant differences in the lateral distance between the e-bicycle and the overtaking vehicle depending on the equipment use and riding conditions. The alternative hypotheses (Ha) were:
Hypothesis 1 (H1). 
There are statistically significant differences in the lateral distance between the e-bicycle and the overtaking vehicle depending on the e-bicycle speed (25 km/h, 30 km/h, 35 km/h).
Hypothesis 2 (H2). 
There are statistically significant differences in the lateral distance between the e-bicycle and the overtaking vehicle depending on the e-bicyclist’s use of the protective helmet and reflective vest.
Hypothesis 3 (H3). 
There are statistically significant differences in the lateral distance between the e-bicycle and the overtaking vehicle depending on the e-bicyclist’s use of the protective helmet.
Hypothesis 4 (H4). 
There are statistically significant differences in the lateral distance between the e-bicycle and the overtaking vehicle depending on the e-bicyclist’s use of the reflective vest.
Hypothesis 5 (H5). 
There are statistically significant differences in the lateral distance between the e-bicycle and the overtaking vehicle depending on the category of the vehicle overtaking the e-bicycle.
The threshold for statistical significance (a) was set to 5%.

3. Results and Analysis of Results

This section provides an analysis of the experimental results in order to show the potential differences in the lateral distances when motor vehicles overtake e-bicycles in various situations. A total sample of 1384 vehicles was collected in the experiment. However, an additional 151 vehicles were excluded from the total sample due to traffic situations which deviated from the defined methodology (e.g., passing pedestrians, the presence of potholes in roads, uneven speed of the e-bicycle) as well as 5 vehicles due to situations where the driver had to deviate from the given movement paths. Thus, a sample of 1228 vehicles was used in the experiment. The average lateral distance at which motor vehicle drivers overtake e-bicyclists amounted to 1.30 m.

3.1. Electric Bicycle Speed

The results of the ANOVA showed statistically significant differences in the mean overtaking lateral distance between the overtaking motor vehicles and the e-bicycle depending on the e-bicycle speed (F = 121.731; p < 0.001). The Bonferroni post hoc test showed differences in the lateral distance of vehicles overtaking the electric bicycle in the different conditions including when the e-bicycle moved at the speeds of 25 km/h and 30 km/h (p < 0.001) and when the e-bicyclist travelled at the speeds of 25 km/h and 35 km/h (p < 0.001). In addition, there were statistically significant differences in the overtaking lateral distance of the vehicles passing the e-bicycle in the conditions when the e-bicycle moved at the speed of 30 km/h and 35 km/h (p = 0.032). The faster the e-bicyclist travelled, the shorter the lateral distance of the overtaking vehicles (for the test speeds 25 km/h, 30 km/h, and 35 km/h, the average lateral distance when overtaking the e-bicycle was 1.59 m, 1.23 m, and 1.17 m, respectively).

3.2. (Non) Use of Helmets and Reflective Vests

When the e-bicyclist used a helmet and a reflective vest, drivers overtook him at a lateral distance of 1.20 m. When the bicyclist wore neither a helmet nor a reflective vest, drivers overtook him at a greater lateral distance (1.51 m). The results of the t-test showed statistically significant differences between the lateral distance when overtaking an e-bicycle for the two mentioned situations (t = 4.165; p = 0.042).

3.2.1. Helmets

The results of the t-test showed statistically significant differences between the lateral distance when overtaking an e-bicycle and the use of helmets (t = 5.489; p = 0.019). When the e-bicyclist wore a helmet (the average lateral distance when overtaking e-bicyclists with helmets was 1.17 m), vehicles overtook him at shorter lateral distances than when he did not wear the protective helmet (the average lateral distance when overtaking e-bicyclists without helmets was 1.51 m).

3.2.2. Reflective Vest

Additional analyses were carried out to establish whether the use of a reflective vest had any impact on the lateral distance when overtaking an e-bicycle. Motor vehicle drivers overtook e-bicyclists wearing reflective vests at shorter lateral distances than the e-bicyclists not wearing reflective vests (the average lateral distance when overtaking an e-bicycle with a reflective vest and without a reflective vest amounted to 1.25 m and 1.51 m, respectively), but this finding did not reach statistical significance.

3.2.3. Summary Regarding Helmets and Reflective Vests

From the obtained results, it can be concluded that there are statistically significant differences between the non-use of the equipment and wearing a helmet only (t = 5.489; p = 0.019), as well as between the non-use of the equipment and wearing both a helmet and a reflective vest (t = 4.165; p = 0.042). These results apply to all speed testing and all vehicle categories. The results showed that if the cyclist used equipment of any type, the vehicles overtook him at a shorter lateral distance, while in situations when the cyclist did not use the equipment, the vehicles overtook him at a greater distance.

3.3. Vehicle Category

The analysis of the lateral distance when overtaking an e-bicycle per vehicle category showed that heavy goods vehicles had the greatest lateral distance when overtaking (2.06 m), followed by taxi vehicles (1.38 m) and passenger cars (1.32 m). Due to the motorcycle dimensions and smaller space required for overtaking, as it had been expected, motorcycle riders achieved a shorter average lateral distance when overtaking the e-bicycle (0.80 m) than the other vehicle categories. SUV drivers had a much shorter lateral distance (0.95 m) when overtaking the e-bicycle than the other vehicle drivers (Figure 4). The stated findings were confirmed using the ANOVA test results, which showed statistically significant differences in the lateral distance between different vehicle categories overtaking e-bicycles (F = 121.730; p < 0.001). The detailed results of the “post hoc” test per vehicle category are presented in Table 2.

3.4. Comprehensive Analysis of Factors

A three-factor analysis of variance for different groups (three-way ANOVA) examined the impact of the “speed of the e-bicycle (25 km/h, 30 km/h and 35 km/h)”, “use of the equipment (Helmet, Reflective vest, Helmet and reflective vest, without helmet and reflective vest)”, and “vehicle category (Passenger cars, Light goods vehicles, Bus, SUV, Motorcycle, Taxi, Heavy goods vehicles)”, on the lateral distance when overtaking an e-bicycle. There was a statistically significant individual impact of the vehicle category on the overtaking lateral distance (F = 15.11, p < 0.001) (Table 3). This impact was medium (Partial Eta2 = 0.07) [49]. The level of the bicyclists’ equipment and their speed had no impact on the overtaking lateral distance.
After the individual effects of the three variables had been examined, the impact of the interaction of these variables was studied. The interaction of the bicyclist’s speed and used equipment was statistically significant (F = 2.75, p = 0.012). The effect of this impact was small (Partial Eta2 = 0.014). In addition, the interaction between the speed and vehicle category was statistically significant (F = 2.02, p = 0.02), with a small effect on the speed (Partial Eta2 = 0.02). The interaction between the equipment and vehicle category had no statistically significant effect on the dependent variable, and neither did the interaction of speed, equipment, and vehicle category. In addition, the individual effect of speed and equipment was not statistically significant. The vehicle category, bicyclist’s speed and used equipment explained 27.2% of the variance of the dependent variable (Adjusted R2 = 0.272).
In order to show a more detailed interaction of the speed with the level of the equipment used by the e-bicyclist, as well as with the vehicle category, additional two-factor analyses of variance (two-way ANOVA) were conducted. Next, the results of the subgroups related to different speeds were considered. The results of the subgroup including e-bicycles travelling at the 25 km/h speed showed that, in this group, only the vehicle category had a statistically significant effect on the overtaking lateral distance (F = 7.29, p = 0.000), while the effect size was large (Partial Eta2 = 0.131). At the 25 km/h speed, heavy goods vehicles had the largest overtaking lateral distance (M = 2.15, SD = 0.67), while motorcycles had the smallest lateral distance (M = 0.84, SD = 0.13). The vehicle category also had an impact on the overtaking speed when observing the 30 km/h group (F = 4.58, p < 0.001), while the effect on the dependent variable was medium (Partial Eta2 = 0.062). At the speed of 30 km/h, heavy goods vehicles had the largest overtaking lateral distance (M = 1.80, SD = 0.01), while motorcycles had the smallest lateral distance (M = 0.82, SD = 0.14). Finally, at the 35 km/h speed, only the vehicle category had a statistically significant impact on the overtaking lateral distance (F = 6.05, p < 0.001), with a medium effect on the dependent variable (Partial Eta2 = 0.074). At the speed of 35 km/h, heavy goods vehicles also had the largest overtaking lateral distance (M = 2.12, SD = 0.01), while motorcycles had the smallest lateral distance (M = 0.78, SD = 0.31).

4. Discussion

The results obtained and presented in this study are rather worrying. The following alternative hypotheses were accepted:
Hypothesis 1 (H1). 
There are statistically significant differences in the lateral distance between the e-bicycle and the overtaking vehicle depending on the e-bicycle speed.
Hypothesis 2 (H2). 
There are statistically significant differences in the lateral distance between the e-bicycle and the overtaking vehicle depending on the e-bicyclist’s use of the protective helmet and reflective vest.
Hypothesis 3 (H3). 
There are statistically significant differences in the lateral distance between the e-bicycle and the overtaking vehicle depending on the e-bicyclist’s use of the protective helmet.
Hypothesis 5 (H5). 
There are statistically significant differences in the lateral distance between the e-bicycle and the overtaking vehicle depending on the category of the vehicle overtaking the e-bicycle.
On the other hand, the following alternative hypothesis was rejected:
Hypothesis 4 (H4) 
. There are statistically significant differences in the lateral distance between the e-bicycle and the overtaking vehicle depending on the e-bicyclist’s use of the reflective vest.
According to research by Ampe et al., the lateral clearance distance of a motorized vehicle while overtaking a cyclist is a key indicator of safety [24]. The results state that the faster speed of e-bicycles results in the shorter lateral distance of the vehicles overtaking them. They lead to the conclusion that the probability of traffic collision occurrence is higher if the lateral distance when overtaking an e-bicycle is shorter. If a traffic collision involving an e-bicycle and a motor vehicle occurs at faster speeds, the injuries of the e-bicyclist will be more serious, as confirmed in the study by Dozza et al. [5]. The stated results show that the increase of technical and operational characteristics of (electric) bicycles, i.e., increase in the e-bicycle speed, encourages motor vehicle drivers to regard e-bicycles as their equivalents in traffic and not perceive them as vulnerable road users. Moreover, the increase in the e-bicycle speed reduces the difference between the speeds of the motor vehicle and e-bicycle, so the motor vehicle driver requires more time and space for overtaking the e-bicycle. This might be one of the causes of the reduced lateral distance between the e-bicycle and the overtaking vehicle due to the increased e-bicycle speed.
In a study conducted by Ampe et al., the research results show that drivers of motor vehicles adjust their overtaking manoeuvre when overtaking cyclists carrying a child in the bicycle seat keeping larger and, therefore, safer lateral distances [24]. In addition, the results of the study show that motor vehicle drivers overtake e-bicycles at shorter lateral distances if e-bicyclists wear protective helmets, in comparison with the situations when e-bicyclists do not use helmets. These results are in concordance with the findings of Walker [35,36] regarding bicyclists. The difference in the lateral distance when overtaking e-bicycles depending on whether e-bicyclists wear helmets or not can be explained by the fact that motor vehicle drivers frequently believe that bicyclists wearing helmets are more serious, sensible, and predictable road users than the bicyclists not wearing helmets [37,39]. The same results were presented in the study conducted by Basford et al. [50]. However, a re-analysis of 2355 events of motor vehicles overtaking bicyclists described by Walker included the data regarding the bicyclist’s lateral distance from the edge of the road, vehicle size and colour, observed city, period of the day, whether the overtaking occurred on cycle lanes, and whether a bicyclist wore a protective helmet. This re-analysis showed that there was no correlation between helmet use and shorter lateral distances of passing motor vehicles [36]. The study conducted by Basford et al. [50] states that the decision regarding the (non)use of helmets affects the vehicle drivers’ perception of bicyclists. This perception might result in a behaviour change, and it may have an impact on increasing the lateral distance of motor vehicles when overtaking bicyclists. The results presented in our study are similar to the mentioned studies, although our results refer to e-bicycles. Namely, the results of our study show that there are statistically significant differences between the use of a helmet and the lateral distance when overtaking an e- bicycle. When an e-bicycle rider wears a helmet, vehicles overtake him at a shorter distance, unlike when he is not using a helmet.
The results of this paper show that the greatest lateral distance when overtaking the e-bicycle was recorded for heavy goods vehicles (2.06), taxi vehicles (1.38 m) and passenger cars (1.32 m). Motorcyclists had the shortest overtaking lateral distance (0.80 m) when passing the e-bicycle. In comparison to other vehicle drivers, SUV vehicle drivers (0.95 m) had much shorter lateral distances when overtaking the e-bicycle. The explanation for such behaviour of SUV drivers can be found in the studies by Coughenour et al. [51] and Lönnqvist et al. [52], who stated that drivers of expensive cars, which include SUV vehicles, are prone to unethical driving behaviour and are less tolerant of other road users. This vehicle category has been increasingly prevalent in traffic, so the results are worrying because of the probability of road crashes occurring due to these short overtaking lateral distances. The research by Walker [35] indicates that buses and heavy goods vehicles overtake bicyclists at short lateral distances, while the shortest lateral distance when overtaking the bicyclist was registered for SUVs. These results are not in accordance with the results obtained and presented in this study. There are numerous reasons for this, some of them being the 10-year difference between these two studies, differences in the research methodology and research area, as well as the potential differences arising from the research subject: bicycles and e-bicycles. In their study conducted in 2014, Walker et al. concluded that it was requisite to carry out infrastructural, educational, and legal measures in order to prevent overtaking bicyclists at short lateral distances. Educational measures are of great importance as their aim is ensuring safe overtaking of bicyclists, i.e., overtaking bicyclists at greater lateral distances. The mentioned findings and suggestions should be used and applied for the education of drivers of all vehicle categories regarding lateral distance when overtaking e-bicycles.

5. Conclusions

Based on the data collected and analysed, the conclusions of this research can be classified into three categories:

5.1. E-Bicycle Speed

The results obtained in this study show that there is a statistically significant difference between different e-bicycle speeds and the lateral distance when overtaking the e-bicycle by motor vehicles. The faster the speed of e-bicycles, the shorter the lateral distance between the overtaking motor vehicle and the e-bicycle being overtaken.

5.2. Helmet and Reflective Vests

The results showed that there is a statistically significant difference between the use of different protective equipment by the e-bicycle rider and the distance when overtaking the e-bicycle. First, the results showed that when an e-bicyclist wears a protective helmet, the lateral distance between the vehicles overtaking the e-bicycle and the e-bicycle decreases with the increase of the e-bicycle speed. In addition, there are differences in the lateral distance of the vehicles overtaking the e-bicycle between the situations when the e-bicyclist wears a helmet and a reflective vest and the situation when the e-bicyclist does not use this equipment. Motor vehicle drivers keep shorter lateral distances when the e-bicyclist wears a helmet and a reflective vest. As well, there are differences in the lateral distance of the vehicles overtaking the e-bicycle between the situations when the e-bicyclist wears a helmet and the situation when the e-bicyclist does not wear the protective helmet. When the e-bicyclist wears a helmet, the lateral distance between the e-bicycle and the overtaking vehicles is shorter than when the e-bicyclist does not wear a protective helmet. In a situation when the e-bicyclist wears a reflective vest, motor vehicle drivers keep shorter lateral distances when overtaking the e-bicyclist than in the situation when the e-bicyclist does not wear a reflective vest, but this finding did not reach statistical significance. Finally, when it comes to the (not)use of protective equipment, if the e-bicyclist does not use any equipment, vehicles kept greater lateral distances from the e-bicycle when overtaking it, as opposed to the situation when the e-cyclist uses certain pieces of equipment.

5.3. (Non) Use of Helmets and Reflective Vests

The results of the interaction between speed and the category of the vehicle overtaking the e-bicycle lead to the conclusion that for all three tested speeds, there are statistically significant differences between two vehicle categories: motorcycles (the shortest lateral distance) and heavy goods vehicles (the greatest lateral distance). On the other hand, the interactions between the protective equipment and vehicle category, speed, and protective equipment, as well as the interaction between speed, protective equipment, and vehicle category, show no statistically significant effect on the lateral distance when overtaking an e-bicycle.

5.4. Vehicle Categories

When it comes to lateral distance when overtaking an e-bicycle according to vehicle categories, the shortest lateral distance when overtaking an e-bicycle was registered for the drivers of motorcycles and SUVs, while the longest lateral distances were recorded for the drivers of heavy goods vehicles and taxi vehicles.

6. Recommendations

Earlier published research conducted on this topic presented a starting point for the preparation and conducting of this research. However, this research differs significantly from the previous research because they did not take into account the e-bicycle means of transportation. This is the first research that involves an e-bicycle as a means of transportation in this kind of experiment.
The obtained results, which primarily refer to the lateral distance obtained when the e-bicyclist wears the protective helmet, show that the lateral distance between the e-bicycle and the vehicle overtaking it decreases with the increase of the e-bicycle speed. Therefore, in the countries where the use of protective helmets is not compulsory, e-bicyclists should still wear them.
It should be mentioned that when it comes to e-bicycles, there are more “collisions” registered with “heavy” vehicles (buses and trucks) and fewer with “light” vehicles (cars and vans), than it is the case with bicycles [23,53]. In addition, the results of this study showed that the lateral distance when overtaking an e-bicycle was shorter when the e-bicycle speed was faster. Knowing that the e-bicycle speed and battery performance are constantly being improved, one can predict the serious problems related to the road safety of e-bicyclists. Therefore, the research on e-bicyclists and all other vehicle categories should be conducted on a regular basis. In addition, speed limit ranges for vehicles and e-bicycles should be carefully defined. These results are especially important for creating legal solutions regarding the speed limit of e-bicycles, both in settlements and outside settlements. This is extremely important for countries that do not have a specifically defined speed limit for e-bicycles in their laws (on the roads, restrictions for motor vehicles apply to e-cyclists, while there is no speed limit for e- bicycles on bicycle paths and bicycle lanes). One of those countries is the Republic of Serbia, the country where this research was conducted. On the other hand, the results should be promoted and analysed during the introduction of various transport policies, primarily in an effort to improve sustainable urban mobility. Moreover, drivers must be educated on the vulnerability of e-bicyclists. Although the results of this work are focused on the user perspective (e-bicycles speed, use of equipment, etc.), it is necessary to pay attention to the creation of infrastructure for a safe traffic system (e.g., construction of bicycle paths, lanes, shoulder, etc.), but also a system that supports e-mobility (for example, e-bicycles chargers, resorts, etc.). On the other hand, e-bicyclists should be informed about the potential dangers. At the same time, the use of e-bicycles should be constantly promoted due to their various benefits: apart from improving health and protecting the environment, their use reduces traffic congestion in the cities and crowds in car parks.

7. Future Research

Since this issue is affected by numerous factors, future research should include different test speed ranges (e.g., 15 km/h, 20 km/h, 40 km/h, 45 km/h, etc.), different road categories (with/without a median), different road weather conditions, as well as different helmets and cycling suit colours.

8. Limitation

One of the members of the research team, who has many years of experience in riding an e-bicycle, participated in the experiment as the only e-bicycle rider. The said driver was familiar with the paper methodology. The paper does not include an analysis of the results of the different characteristics of the cyclist (by experience, gender, and age). This choice is justified for security and methodological reasons.

Author Contributions

Conceptualization, A.T. and T.I.; methodology, A.T. and T.I.; software, A.T. and S.Č.; validation, S.S. and S.Č.; formal analysis, S.S.; investigation, S.S.; resources, T.I.; data curation, S.S.; writing—original draft preparation, S.S., T.I., S.Č., D.P., and A.T.; writing—review and editing, A.Z., T.I., A.T., D.D., J.D., and U.M.; visualization, A.T., T.I., and D.D.; supervision, S.S., A.Z., D.D., and J.D; funding acquisition, D.D. and J.D. All authors have read and agreed to the published version of the manuscript.

Funding

This research was supported by Cultural and Educational Grant Agency Ministry of Education, Science, Research and Sport of the Slovak Republic, grant no. KEGA 028TUKE-4/2021 “Transfer of new knowledge from the field of production technologies into teaching of technology-oriented subjects for the current needs of Slovak industry” and by Scientific Grant Agency Ministry of Education, Science, Research and Sport of the Slovak Republic and Slovak Academy of Sciences, grant no. VEGA 1/0431/21 “Research of light-technical parameters in production hall using digital er-gonomics tools”.

Institutional Review Board Statement

Not applicable.

Informed Consent Statement

Not applicable.

Data Availability Statement

Not applicable.

Conflicts of Interest

The authors declare no conflict of interest.

References

  1. Cherry, C.; Cervero, R. Use characteristics and mode choice behavior of electric bike users in China. Transp. Policy 2007, 14, 247–257. [Google Scholar] [CrossRef] [Green Version]
  2. Fishman, E.; Cherry, C. E-bikes in the Mainstream: Reviewing a Decade of Research. Transp. Rev. 2016, 36, 72–91. [Google Scholar] [CrossRef]
  3. Rose, G. E-bikes and urban transportation: Emerging issues and unresolved questions. Transportation 2012, 39, 81–96. [Google Scholar] [CrossRef]
  4. Simović, S.; Ivanišević, T.; Trifunović, A.; Čičević, S.; Taranović, D. What Affects the E-Bicycle Speed Perception in the Era of Eco-Sustainable Mobility: A Driving Simulator Study. Sustainability 2021, 13, 5252. [Google Scholar] [CrossRef]
  5. Dozza, M.; Francesco, G.; Piccinini, B.; Werneke, J. Using naturalistic data to assess e-cyclist behavior. Transp. Res. Part F 2016, 41, 217–226. [Google Scholar] [CrossRef] [Green Version]
  6. Schepers, J.P.; Fishman, E.; den Hertog, P.; Klein Wolt, K.; Schwab, A.L. The safety of electrically assisted bicycles compared to classic bicycles. Accid. Anal. Prev. 2014, 73, 174–180. [Google Scholar] [CrossRef]
  7. Gojanovic, B.; Welker, J.; Iglesias, K.; Daucourt, C.; Gremion, G. Electric bicycles as a new active transportation modality to promote health. Med. Sci. Sport. Exerc. 2011, 43, 2204–2210. [Google Scholar] [CrossRef] [Green Version]
  8. Sperlich, B.; Zinner, C.; Hébert-Losier, K.; Born, D.-P.; Holmberg, H.C. Biomechanical, cardiorespiratory, metabolic and perceived responses to electrically assisted cycling. Eur. J. Appl. Physiol. 2012, 112, 4015–4025. [Google Scholar] [CrossRef]
  9. Simons, M.; Van Es, E.; Hendriksen, I. Electrically assisted cycling: Anew mode for meeting physical activity guidelines? Med. Sci. Sports Exerc. 2009, 41, 2097–2102. [Google Scholar] [CrossRef] [Green Version]
  10. Plazier, P.A.; Weitkamp, G.; van den Berg, A.E. “Cycling was never so easy!” An analysis of e-bike commuters’ motives, travel behaviour and experiences using GPS-tracking and interviews. J. Transp. Geogr. 2017, 65, 37–45. [Google Scholar] [CrossRef] [Green Version]
  11. Hendriksen, I.; Engbers, L.; Schrijver, J.; van Gijlswijk, R.; Weltevreden, J.; Wilting, J. Elektrisch Fietsen. Marktonderzoek en Verkenning Toekomstmogelijkheden [E-Bikes. Market Research and Exploration of Future Possibilities]; TNO Kwaliteit van Leven: Leiden, The Netherlands, 2008. [Google Scholar]
  12. Theurel, J.; Theurel, A.; Lepers, R. Physiological and cognitive responses when riding an electrically assisted bicycle versus a classical bicycle. Ergonomics 2012, 55, 773–781. [Google Scholar] [CrossRef]
  13. Van Cauwenberg, J.; De Bourdeaudhuij, I.; Clarys, P.; De Geus, B.; Deforche, B. Older E-bike Users: Demographic, Health, Mobility Characteristics, and Cycling Levels. Med. Sci. Sport. Exerc. 2018, 50, 1780–1789. [Google Scholar] [CrossRef]
  14. Louis, J.; Brisswalter, J.; Morio, C.; Barla, C.; Temprado, J.J. The electrically assisted bicycle: An alternative way to promote physical activity. Am. J. Phys. Med. Rehabil. 2012, 91, 931–940. [Google Scholar] [CrossRef]
  15. Jones, T.; Harms, L.; Heinen, E. Motives, perceptions and experiences of electric bicycle owners and implications for health, wellbeing and mobility. J. Transp. Geogr. 2016, 53, 41–49. [Google Scholar] [CrossRef] [Green Version]
  16. Fyhri, A.; Fearnley, N. Effects of e-bikes on bicycle use and mode share. Transp. Res. Part Transp. Environ. 2015, 36, 45–52. [Google Scholar] [CrossRef] [Green Version]
  17. An, K.; Chen, X.; Xin, F.; Lin, B.; Wei, L. Travel Characteristics of E-bike Users: Survey and Analysis in Shanghai. In Proceedings of the 13th COTA International Conference of Transportation Professionals (CICTP 2013), Shenzhen, China, 13–16 August 2013. [Google Scholar]
  18. Campbell, A.A.; Cherry, C.R.; Ryerson, M.S.; Yang, X. Factors influencing the choice of shared bicycles and shared electric bikes in Beijing. Transp. Res. Part C Emerg. Technol. 2016, 67, 399–414. [Google Scholar] [CrossRef] [Green Version]
  19. Cherry, C.R.; Weinert, J.X.; Xinmiao, Y. Comparative environmental impacts of electric bikes in China. Transp. Res. Part D Transp. Environ. 2009, 14, 281–290. [Google Scholar] [CrossRef] [Green Version]
  20. Weiss, M.; Dekker, P.; Moro, A.; Scholz, H.; Patel, M.K. On the electrification of road transportation–A review of the environmental, economic, and social performance of electric two-wheelers. Transp. Res. Part D Transp. Environ. 2015, 41, 348–366. [Google Scholar] [CrossRef]
  21. Gruber, J.; Ehrler, V.; Lenz, B. Technical potential and user requirements for the implementation of electric cargo bikes in courier logistics services. In Proceedings of the 13th World Conference on Transport Research, Rio de Janeiro, Brazil, 15–18 July 2013. [Google Scholar]
  22. Haustein, S.; Møller, M. Age and attitude: Changes in cycling patterns of different e-bike user segments. Int. J. Sustain. Transp. 2016, 10, 836–846. [Google Scholar] [CrossRef] [Green Version]
  23. Dozza, M.; Schindler, R.; Bianchi-Piccinini, G.; Karlsson, J. How do drivers overtake cyclists? Accid. Anal. Prev. 2016, 88, 29–36. [Google Scholar] [CrossRef] [Green Version]
  24. Ampe, T.; de Geus, B.; Walker, I.; Serrien, B.; Truyen, B.; Durlet, H.; Meeusen, R. The impact of a child bike seat and trailer on the objective overtaking behaviour of motorized vehicles passing cyclists. Transp. Res. Part F Traffic Psychol. Behav. 2020, 75, 55–65. [Google Scholar] [CrossRef]
  25. Rodier, C.; Shaheen, S.A.; Chung, S. Unsafe at Any Speed?: What the Literature Says About Low-Speed Modes; Institute of Transportation Studies, University of California: Davis, CA, USA, 2003. [Google Scholar]
  26. Bíl, M.; Bílová, M.; Müller, I. Critical factors in fatal collisions of adult cyclists with automobiles. Accid. Anal. Prev. 2010, 42, 1632–1636. [Google Scholar] [CrossRef] [PubMed]
  27. Langford, B.C.; Chen, J.; Cherry, C.R. Risky riding: Naturalistic methods comparing safety behavior from conventional bicycle riders and electric bike riders. Accid. Anal. Prev. 2015, 82, 220–226. [Google Scholar] [CrossRef] [PubMed]
  28. Vlakveld, W.P.; Twisk, D.; Christoph, M.; Boele, M.; Sikkema, R.; Remy, R.; Schwab, A.L. Speed choice and mental workload of elderly cyclists on e-bikes in simple and complex traffic situations: A field experiment. Accid. Anal. Prev. 2015, 74, 97–106. [Google Scholar] [CrossRef] [Green Version]
  29. Schleinitz, K.; Petzoldt, T.; Krems, J.F.; Gehlert, T. The influence of speed, cyclists’ age, pedaling frequency, and observer age on observers’ time to arrival judgments of approaching bicycles and e-bikes. Accid. Anal. Prev. 2016, 92, 113–121. [Google Scholar] [CrossRef]
  30. Law on Road Traffic Safety. Official Gazette, Republic of Serbia, 41/2009, 53/2010, 101/2011, 32/2013, 2/2018, 87/2018, 23/2019 and 128/20. 2020. Available online: https://www.paragraf.rs/propisi/zakon_o_bezbednosti_saobracaja_na_putevima.html (accessed on 18 August 2022).
  31. Walker, I.; Jones, C. The Oxford and Cambridge Cycling Survey; Oxfordshire County Council: Oxfordshire, UK, 2005.
  32. Stone, M.; Broughton, J. Getting off your bike: Cycling accidents in Great Britain in 1990–1999. Accid. Anal. Prev. 2003, 35, 549–556. [Google Scholar] [CrossRef] [PubMed]
  33. Parkin, J.; Meyers, C. The effect of cycle lanes on the proximity between motor traffic and cycle traffic. Accid. Anal. Prev. 2010, 42, 159–165. [Google Scholar] [CrossRef] [Green Version]
  34. Chuang, K.H.; Hsu, C.C.; Lai, C.H.; Doong, J.L.; Jeng, M.C. The use of a quasi-naturalistic riding method to investigate bicyclists’ behaviors when motorists pass. Accid. Anal. Prev. 2013, 56, 32–41. [Google Scholar] [CrossRef]
  35. Walker, I. Drivers overtaking bicyclists: Objective data on the effects of riding position, helmet use, vehicle type and apparent gender. Accid. Anal. Prev. 2007, 39, 417–425. [Google Scholar] [CrossRef]
  36. Olivier, J.; Walter, S.R. Bicycle helmet wearing is not associated with close motor vehicle passing: A re-analysis of Walker, 2007. PLoS ONE 2013, 8, e75424. [Google Scholar] [CrossRef] [Green Version]
  37. Esmaeilikia, M.; Radun, I.; Grzebieta, R.; Olivier, J. Bicycle helmets and risky behaviour: A systematic review. Transp. Res. Part F Traffic Psychol. Behav. 2019, 60, 299–310. [Google Scholar] [CrossRef]
  38. Radun, I.; Radun, J.; Esmaeilikia, M.; Lajunen, T. Risk compensation and bicycle helmets: A false conclusion and uncritical citations. Transp. Res. Part F Traffic Psychol. Behav. 2018, 58, 548–555. [Google Scholar] [CrossRef] [Green Version]
  39. Lahrmann, H.; Madsen TK, O.; Olesen, A.V.; Madsen, J.C.O.; Hels, T. The effect of a yellow bicycle jacket on cyclist accidents. Saf. Sci. 2018, 108, 209–217. [Google Scholar] [CrossRef]
  40. Thedchanamoorthy, S.; Madsen, T.K.O.; Araghi, B.N.; Lahrmann, H. Projekt Cykeljakken, NOTAT, en SPØRGESKEMAUNDERSØGELSE [Project Bicycle Jacket, NOTES, A Questionnaire Survey]; DCE Techinical Reports No. 170; Department of Civil Engineering, Aalborg University: Aalborg, Denmark, 2014. [Google Scholar]
  41. Wood, J.M.; Tyrrell, R.A.; Marszalek, R.; Lacherez, P.; Carberry, T.; Chu, B.S. Using reflective clothing to enhance the conspicuity of bicyclists at night. Accid. Anal. Prev. 2012, 45, 726–730. [Google Scholar] [CrossRef] [Green Version]
  42. Vukšić, V.; Ivanisevic, T. Survey of cyclists attitudes regarding the use of protective equipment. In Proceedings of the V International Conference “Road Safety in Local Community”, Banja Luka, Republic of Srpska, Bosnia and Herzegovina, 13–16 April 2016. [Google Scholar]
  43. Road Traffic Safety Agency. Statistical Report on the State of Traffic Safety in the Republic of Serbia for the Year 2018; Road Traffic Safety Agency: Belgrade, Serbia, 2019.
  44. Ivanišević, T.; Trifunović, A.; Čičević, S.; Simović, S.; Vukšić, V. Does the geographical area of the respondents affect the perception of e-bicycle speed? In Proceedings of the 10th International Conference “Road Safety in Local Community”, Banja Luka, Bosnia and Herzegovina, 29–30 October 2020. [Google Scholar]
  45. Statistical Office of the Republic of Serbia. Estimated Number of Population in the Republic of Serbia; Statistical Office of the Republic of Serbia: Belgrade, Serbia, 2021.
  46. Simović, S.; Ivanišević, T.; Bradić, B.; Čičević, S.; Trifunović, A. What Causes Changes in Passenger Behavior in South-East Europe during the COVID-19 Pandemic? Sustainability 2021, 13, 8398. [Google Scholar] [CrossRef]
  47. Pešić, D.; Trifunović, A.; Ivković, I.; Čičević, S.; Žunjić, A. Evaluation of the effects of daytime running lights for passenger cars. Transp. Res. Part F Traffic Psychol. Behav. 2019, 66, 252–261. [Google Scholar] [CrossRef]
  48. Ivanišević, T.; Ivković, I.; Čičević, S.; Trifunović, A.; Pešić, D.; Vukšić, V.; Simović, S. The impact of daytime running (LED) lights on motorcycles speed estimation: A driving simulator study. Transp. Res. Part F Traffic Psychol. Behav. 2022, 90, 47–57. [Google Scholar] [CrossRef]
  49. Cohen, J. Statistical power analysis. Curr. Dir. Psychol. Sci. 1992, 1, 98–101. [Google Scholar] [CrossRef]
  50. Basford, L.; Reid, S.; Lester, T.; Thomson, J.; Tolmie, A. Drivers’ Perceptions of Cyclists; Department for Transport: London, UK, 2002; p. 42.
  51. Coughenour, C.; Abelar, J.; Pharr, J.; Chien, L.C.; Singh, A. Estimated car cost as a predictor of driver yielding behaviors for pedestrians. J. Transp. Health 2020, 16, 100831. [Google Scholar] [CrossRef]
  52. Lönnqvist, J.E.; Ilmarinen, V.J.; Leikas, S. Not only assholes drive Mercedes. Besides disagreeable men, also conscientious people drive high-status cars. Int. J. Psychol. 2019, 55, 572–576. [Google Scholar] [CrossRef]
  53. Čubranić-Dobrodolac, M.; Švadlenka, L.; Čičević, S.; Trifunović, A.; Dobrodolac, M. Using the interval Type-2 fuzzy inference systems to compare the impact of speed and space perception on the occurrence of road traffic accidents. Mathematics 2020, 8, 1548. [Google Scholar] [CrossRef]
Figure 1. Presentation of the ultrasonic sensor used in the experiment (a) and an example of the video recording (b).
Applsci 13 01621 g001
Figure 2. Location of the study area.
Applsci 13 01621 g002
Figure 3. E-bicycle rider with a protective helmet (a), with a helmet and vest (b), with a vest (c), as well as without equipment (helmet and vest) (d).
Applsci 13 01621 g003
Figure 4. Average lateral distance when overtaking an e-bicycle according to vehicle categories.
Applsci 13 01621 g004
Table 1. Description of the characteristics of the driver protective equipment.
Driver Protective EquipmentDescription
E-bicycleA KTM electric bicycle named “MACINA Moto 11” was used in the research. The frame of the e-bicycle is grey and made of aluminium; the motor is “Bosch drive unit 36 V–250 W”, the battery is “Powerpack 13.8 Ah—500 Wh”, and the wheel size is “29”. The bicycle has three riding modes: riding without using the electric motor, riding using the electric motor as an assistance to pedalling, and riding using the electric motor. The maximum speed of this e-bicycle is 45 km/h, while its maximum range of 80 km was used in the research.
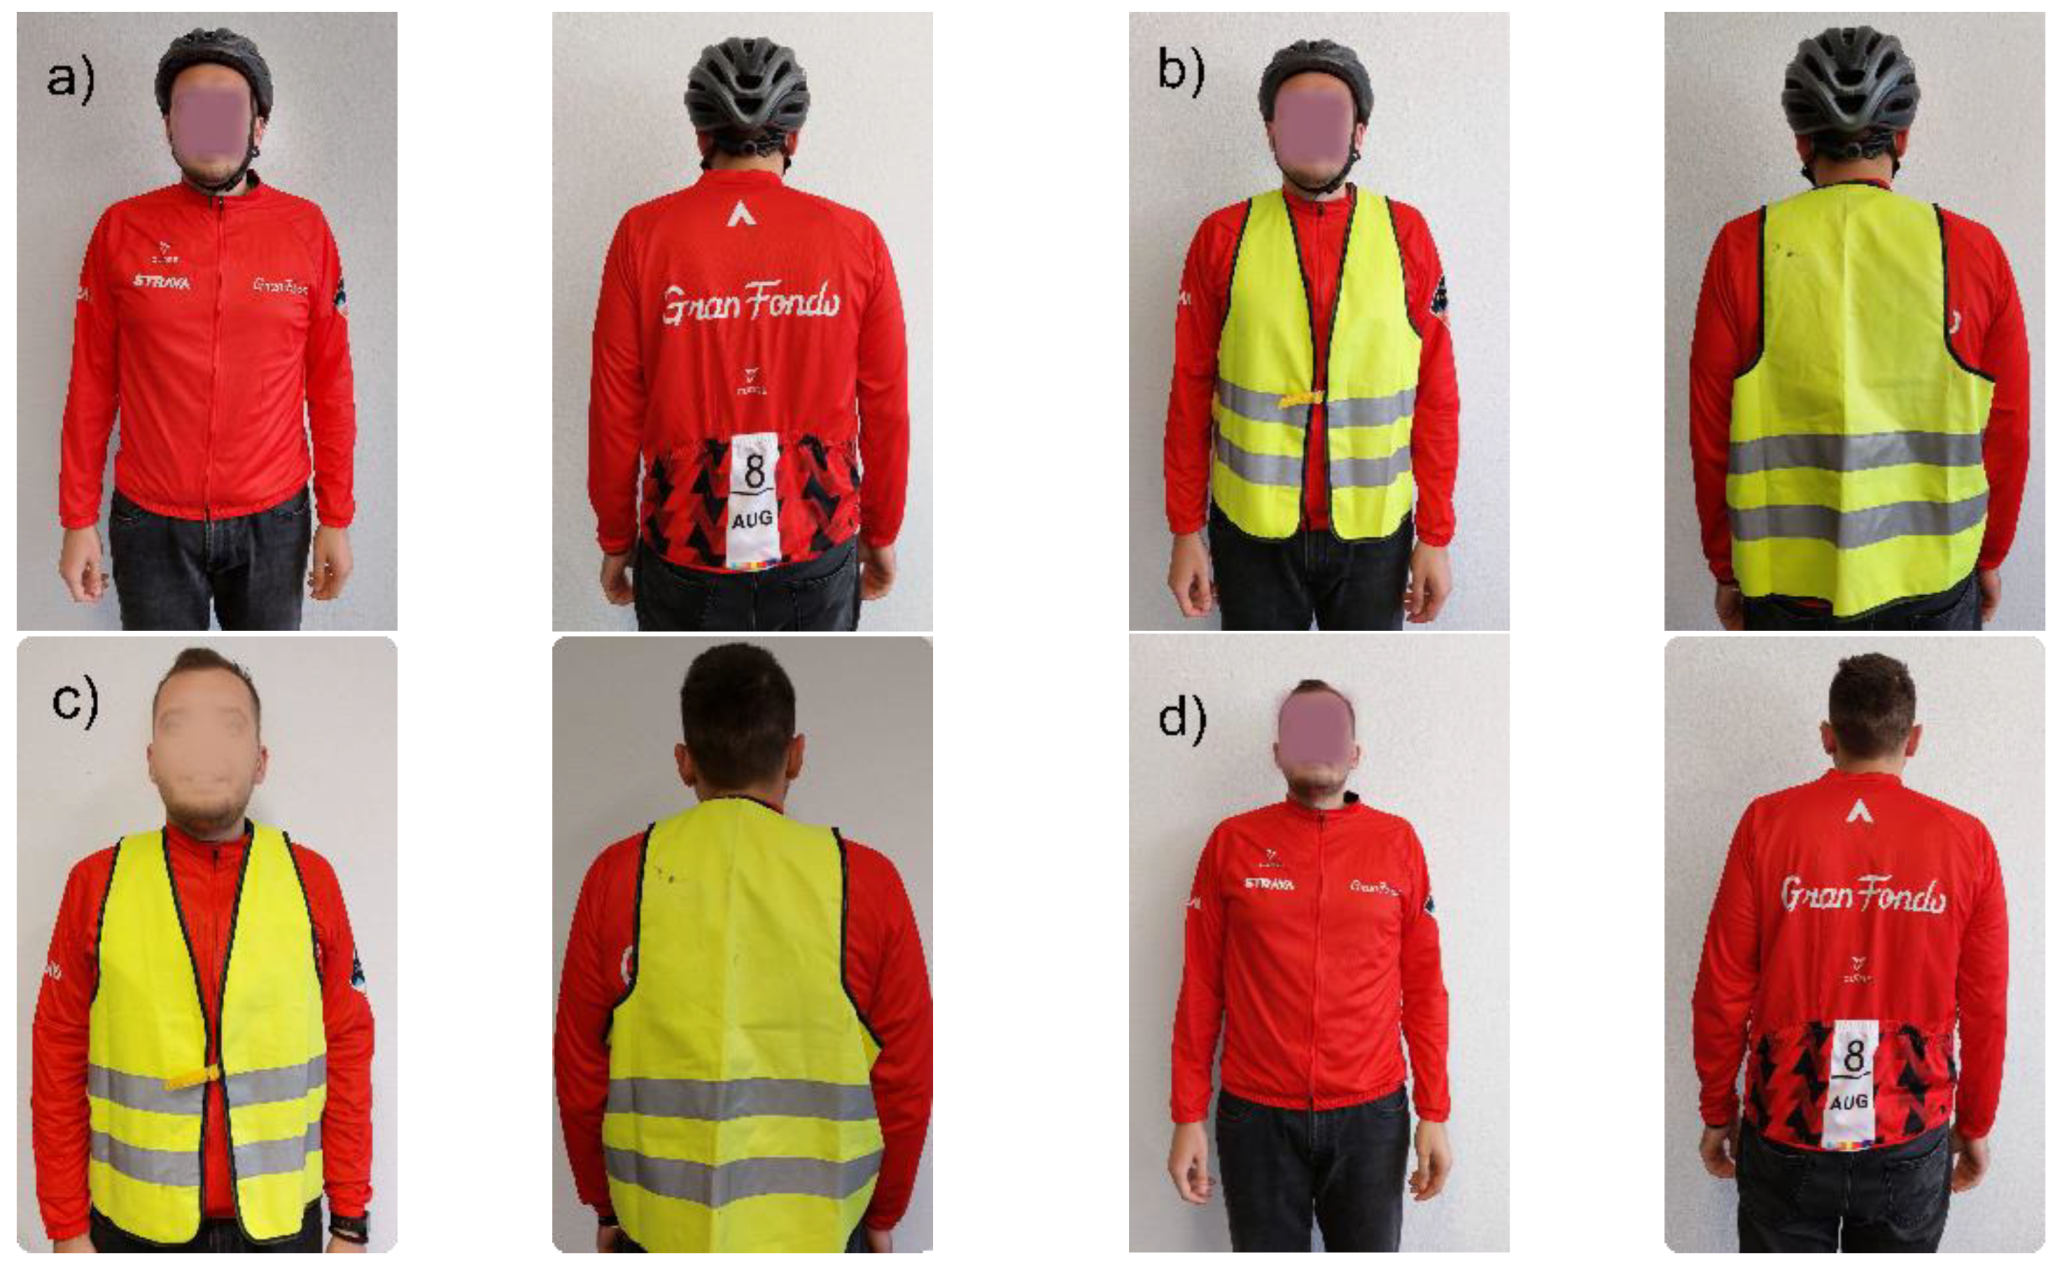
HelmetThe helmet used in this research is “Uvex City 9”, black, weighing 440 g, intended for e-bicycle users, made in accordance with the standard “EN 1078/NTA 8776:2016”, with reflective straps and logos.
Reflective vestThe test bicyclist wore a fluorescent yellow bicycling vest with silver retroreflective material on the shoulders and front and back totalling about 400 cm2 (Wood et al., 2012 [41]). Figure 3 shows an e-bicycle rider with a protective helmet, with a vest, with a helmet and vest, and without equipment (helmet and vest).
Table 2. Statistically significant results for lateral distance when overtaking an e-bicycle according to vehicle categories.
Categories of VehiclesSUVMotorcycleTaxiHeavy Goods Vehicles
Passenger cars0.001 *0.001 *
Light goods vehicles0.015 *0.002 *
Bus 0.001 *
SUV/ 0.002 *0.001 *
Motorcycle /0.001 *0.001 *
Taxi /0.002 *
Heavy goods vehicles /
*—The statistically significant results of the lateral distance when overtaking an e-bicycle for vehicle categories (p < 0.05).
Table 3. Results of the impact of protective equipment, e-bicycle speed, and vehicle category on the lateral distance when overtaking an e-bicycle, based on the three-way ANOVA.
dfFpPartial Eta2
E-bicycle speed21.0440.3520.002
Protective equipment31.8590.1350.005
Vehicle category615.1180.0000.073
E-bicycle speed * Protective equipment62.7520.0120.014
E-bicycle speed * Vehicle category122.0210.0200.020
Protective equipment * Vehicle category181.0660.3820.016
E-bicycle speed * Protective equipment * Vehicle category200.9860.4760.017
* combination of factors.
Disclaimer/Publisher’s Note: The statements, opinions and data contained in all publications are solely those of the individual author(s) and contributor(s) and not of MDPI and/or the editor(s). MDPI and/or the editor(s) disclaim responsibility for any injury to people or property resulting from any ideas, methods, instructions or products referred to in the content.

