Abstract
Tsavorite’s color is not only affected by its internal components, but also by external factors. This paper studies the neutral grey background and cutting on the impact on color. Under a 6504K fluorescent lamp, by changing the Munsell neutral gray backgrounds from N9.5 to N3, we discovered that N9.5 was the best background for tsavorite color grading. In this paper, the feasibility of taking color by photography is studied. The regression models R2 between the photogrammetry (PM) and the colorimeter (CM) were above 86.99% for all of the color parameters (L*, a*, b, C, and h*), allowing the PM data to be used to predict the CM color values. Photographs were taken before and after the cutting to document the color shift. Comparing the L* and C* before and after cutting, the color concentration score was 100–90 if both L* and C* were optimized, 80–70 if only one parameter was optimized, and 70–60 if neither was. The value of ΔL* in the color histogram serves as a measure of the gemstone’s color scintillation; the greater the value of ΔL*, the stronger the scintillation.
1. Introduction
Traditional mining locations for gem-quality green tsavorite in the Neoproterozoic Mozambique metamorphic belt (NMMB) include Tanzania, Kenya, and Madagascar [1,2,3]. Tsavorite is a solid solution between the dominant grossular and minor goldmanite, according to Switzer [4], who demonstrated that the green hue of grossular is caused by the substitution of aluminum by vanadium (and some chromium) at the octahedral site, following the formula Ca3(Al, V, Cr)2(SiO4)3. Tsavorites can be found intercalated with meta-evaporites in metasomatized graphitic rocks including graphitic gneiss and calc-silicates. Tsavorites are mostly found in either the contact metasomatic quartz vein (Type I) or the regional metamorphic nodules (Type II), both of which were created during the Pan-African orogeny movement (650–500 Ma). Sedimentary placers (Type III) are a secondary source of tsavorites [5].
According to Ma et al. [6], the hue tends to be blueish green and brightness L* and chroma C* decrease as vanadium content rises. There are other topics that can be researched outside the internal components of tsavorite’s color. The color of the sample’s background, the observer, the illuminance, and the color temperature of the light source can all have an impact on the color itself. Determining the colored gems’ grading environment is crucial for ensuring the accuracy of the grade. The majority of the original study in gemology on how backdrops affect gemstone color has centered on subjective descriptions, including using the naked eye and color chips to compare colors. According to the CIE1976 L*a*b* uniform color space system, Tang et al.’s [7] analysis of the color appearance of peridot using nine Munsell neutral grey backgrounds revealed that the peridot’s hues were considerably easier to discern in the background’s high lightness. We used the CIE1976 L*a*b* uniform color space system to quantitatively analyze the color of tsavorite on various backgrounds using all 27 Munsell neutral color chips, from N9.5 to N3 (glossy edition) as the test backgrounds in order to reduce the influence of subjective factors and increase the generalizability of the experimental results. This study identifies the ideal categorization background and examines the impact of the Munsell neutral grey backgrounds on the color of tsavorite.
The main methods of color measurement at the moment are through a color spectrophotometer or calculation by UV-VIS spectrum [8,9,10,11,12,13,14,15,16,17,18,19,20,21,22,23,24,25], but color spectrophotometer is limited by the size of the color measurement aperture, so that it cannot measure smaller gemstones. Furthermore, the UV spectrometer is not portable and the calculation is complicated, so it is very meaningful to explore a new quick color extraction method. In this paper, we use the method of taking photos to study the correlation between the data obtained from the photos and the color spectrophotometer, and we also discuss what needs to be unified in the process of taking photos (light source distribution, gem background, angles of photos taken, distance of photos taken). At present, the evaluation of cutting is only based on the standard of the colorless round diamond, but the cutting of colored gems is more important, which can, not only gather color, but also increase scintillation. The method of photography can allow for the study of the influence of cutting on the color of the facet gem, and can also judge the flicker of the facet gem, in order to achieve a more standard and objective evaluation of cutting, which cannot be carried out by color spectrophotometer.
This study used an X-Rite SP62 spectrophotometer to analyze the apparent color of the tsavorite on several Munsell neutral grey backgrounds in order to identify the best background for tsavorite color classification. The viability of photographic color extraction was investigated, and photography was used to investigate the facet colored gem’s cutting assessment standard.
2. Materials and Methods
2.1. Samples
In this study, 35 tsavorite diamonds from Tanzania and Kenya’s Neoproterozoic Mozambique metamorphic belt (NMMB) were examined. The gems’ faces are all roughly the same size, they range in weight from 0.83 to 1.52 carats (the average weight is 1.15 carats), and their hues range from muted to vibrant green. In Figure 1, a few of the samples are displayed.
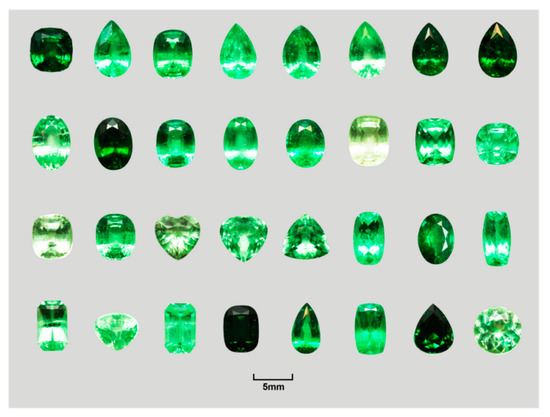
Figure 1.
Some of tsavorite samples with various tones used in this study.
Shaffre Miners Company gave out samples. Address of the store: Panyu Jewelry City, Panyu District, A53 Shaffre Miners, Guangzhou, Guangdong Province, China. Phone number: 18922465632.
2.2. Backgrounds
The backgrounds for the tsavorite gemstones were created using Munsell neutral grey color chips (glossy edition). These chips are made up of 37 shades of neutral gray that range in lightness from N0.5 to N9.5. Using a typical lighting box and a fluorescent lamp (CCT 6504K, PHILIPS MASTER TL-D90 DeLuxe18W/965, Amsterdam, The Netherlands), the color of tsavorite was measured on several neutral backgrounds.
2.3. Colorimetric Analysis
The reflected signals from the surface of the tsavorite on various neutral grey backgrounds were gathered by the integrating sphere in an X-Rite SP62 spectrophotometer (X-Rite, Grand Rapids, MI, USA) (Figure 2). The following is a summary of the test conditions: an observer view of 2°, a reflection that excludes specular reflection, a measuring range of 400–700 nm, a measurement period of less than 2.5 s, a voltage of 220 V, a frequency of 50–60 Hz, and a CIE standard illumination, D65. For testing, the final color values were averaged three times.
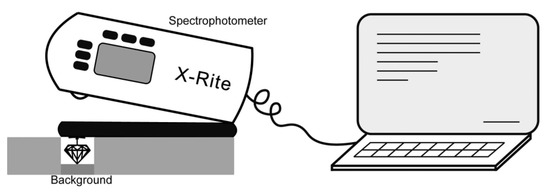
Figure 2.
The test-piece device. The tsavorite sample was placed on top of the background. The spectrophotometer gathered the color signals, and the color information was then sent to a computer for analysi.
2.4. CIE1976 Color Space
In order to express colors quantitatively, the International Commission on Illumination (CIE) developed the CIELAB (or CIE1976 L*a*b*) uniform space in 1976 [26]. L*, a*, b*, C* (chroma), and h (hue angle) are the color variables. The parameters a* (from negative green to positive red) and b* (from negative blue to positive yellow) are the chromaticity components, which range from 120 to +120. L* is the luminance component, which ranges from 0 to 100 (from black to white). C* and h are calculated from a* and b*:
The Euclidean distance between two points in the CIELAB color space, as measured by a CIE standard observer using the CIE standard light source D65, represents the color difference ∆E* of an item of the same size perceived in the same neutral environment. ∆E* is given by
where
PM: photography measurement, CM: colorimeter measurement.
∆L* = L*PM − L*CM
∆a* = a*PM − a*CM
∆b* = b*PM − b*CM
2.5. Photography Measurements
We used a standard illumination box with D65 international standard artificial daylight source (CCT 6504K, PHILIPS MASTER TL-D90 DeLuxe18W/965, Amsterdam, Netherlands), voltage 220 V/110 V. Canon EOS 760D camera (Canon, Tokyo, Japan), Canon Lens EF, Lens, 50 mm, 1:1.8, STM, θ49 mm. The photo parameters: aperture value f/3.5, exposure time 1/20 s, ISO speed ISO-200, focal length 100 mm, metering mode: pattern. The lens was kept perpendicular to the gemstone table and 35 cm from the gemstone (Figure 3).
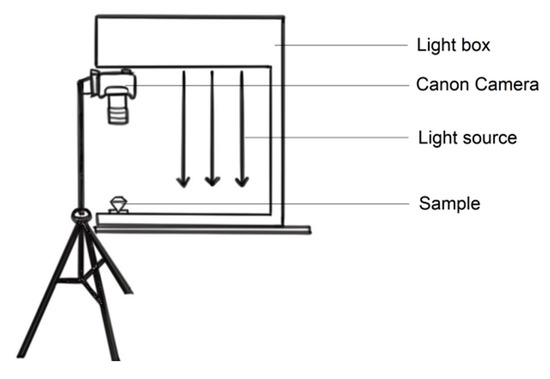
Figure 3.
Schematic diagram of the photography measurements (PMs).
3. Results
3.1. Effects of the Neutral Grey Backgrounds on Tsavorite Color
This study was carried out using a solitary fixed light source. The standard light source D65 (6504K), which is used as the standard light source for international color assessments, is meant to represent the typical sunlight in the northern hemisphere, according to the Chinese national standard GB/T 20146-2006 CIE Standard Illuminator for colorimetry [27]. Therefore, in this investigation, it served as the only source of light.
Under a 6504K fluorescent lamp, the hues of 35 samples of tsavorite were examined on 27 Munsell neutral backgrounds (N3 to N9.5). The colors were plotted using the CIE1976L* a*b* chromatic diagram (Figure 4a). We discovered that the range of a* and b* widened concurrently with the background’s reduction in grayscale, indicating that tsavorite’s hues scatter as background brightness increases. With a bright background, tsavorite’s hues are consequently much simpler to detect. As Munsell neutral gray background becomes brighter, a* decreases and the difference of a* value on Ni become greater. The value of b* increases and the difference of b* increases gradually, but it is smaller than a*. The value of L* increases and the difference of L * increases gradually (Figure 4b–d). With the increase of the background brightness, the brightness of the gemstones increases, and the hue shifts to yellow-green. The L*, a*, b* value difference between the different gemstones becomes larger, so it is easier to distinguish gemstones by naked eye on a brighter background.
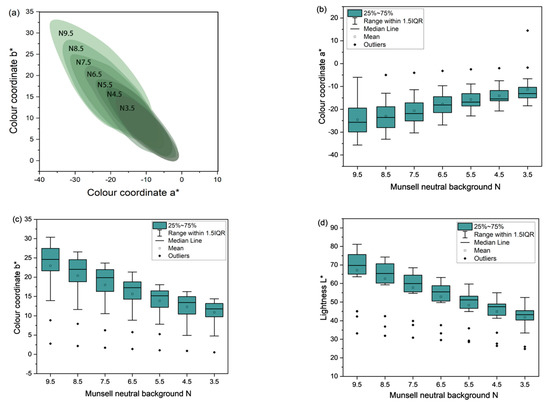
Figure 4.
(a) Distribution of a* and b* values of 20 samples using different Munsell backgrounds; (b–d) changes of a*, b* and L* using different backgrounds. Each box is the a* (b*, L*) value of all samples using that background.
Munsell neutral backdrops come in 37 different lightness categories, ranging from 0 to 100. The range of levels is N0.5 to N9.5. Each stone has its corresponding relationship between the color parameters and the background brightness factor. The stones of different L*a*b* will produce different changes with different backgrounds, as in Figure 5. The stones with different color parameters are affected by the background in a different way. The higher the gem’s lightness L* is, the greater the lightness change rates are, and the L* is more easily affected by the background (Figure 6a). The higher the b* value, the greater the change of the b* value, and the influence on b is more easily produced. The larger the a* value (with the N9.5 background), the smaller the change of the a* value (Figure 6b). In order to verify the above rules, we correlate the initial L*a*b*(with the N9.5 background) values of all samples with the change values ΔL*(L*N9.5 − L*N3), |Δa*|, Δb*. We found that the results are consistent with the above conclusions, the greater the L*, b* value of one gem, the greater the difference of L*, b* of one gemstone between different backgrounds, while the smaller the a* value, the greater the difference of a*, among which the correlation between a* and |Δa*| is the highest (R2 = 0.8378) (Figure 6c,d). The greater the brightness, the greener the color (relative to red), and the more yellow the color (relative to blue), the greater the influence of the background on the color of the gem.
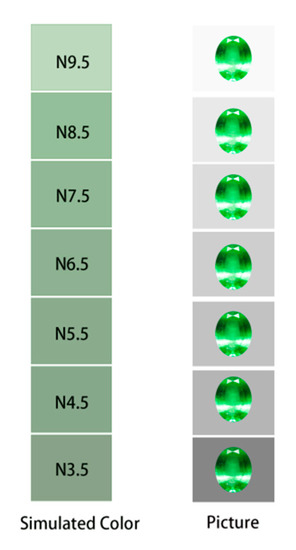
Figure 5.
The images of tsavorite with various backgrounds and the tsavorite color simulation.
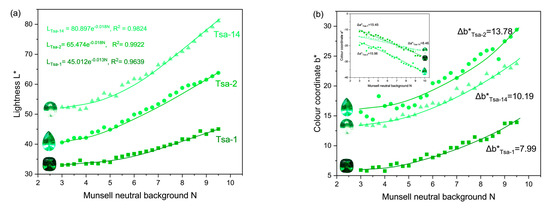
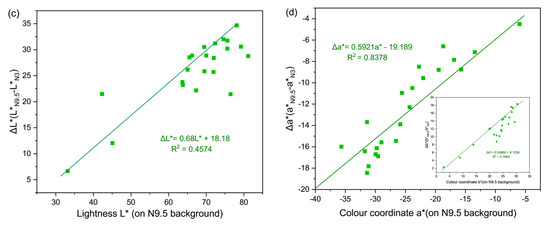
Figure 6.
(a) Lightness L* change of three samples with different colors under different Munsell neutral backgrounds; (b) color coordinate a* and b* changes of the three samples with different colors under different Munsell neutral backgrounds; (c) the correlation between L* (on N9.5 background) and ΔL* (L*N9.5 − L*N3); (d) the correlation between a*, b* (on N9.5 background) and Δa*, Δb*.
Tsavorite’s chroma increases as the background’s gray scales decrease, and at the same time, the range of a* and b* widens, suggesting that the tsavorite’s colors scatter as the background gets brighter. Therefore, N9.5 is the best background for tsavorite color grading.
3.2. Research on the Feasibility of Photographic Color Extraction
3.2.1. Color-Taking Process
It is necessary to ensure that there are no extra items (such as hands) in the picture, nor the appearance of any items that could affect the light and shade in the picture.
Due to the many reflective faces, the images will have a lot of bright and dark points. The color of the whole gem is very uneven. We use the pixel histograms to get the average value of the color. The color is divided into red, green and blue (the three primary colors). Each primary color is divided into 256 gray levels (0–255), the horizontal axis indicates the brightness value (0 is the darkest, 255 is the brightest), the vertical axis indicates the number of each pixel, and the pixel histogram of the three primary colors is obtained. The number of pixels corresponding to the brightness of each level is Ni and the brightness of each level is i. The average of the three primary colors is calculated using the following formula:
3.2.2. Comparison between the Colorimeter (CM) and Photography Measurement (PM) Results
We measured the 19 samples’ color data on the back of the facet gem, using a colorimeter and photography, respectively (because some samples are too small to be measured by colorimeter). ∆E* could be used to represent the color difference between the CM and PM. 19 samples had an average color difference of 9.7. The point at which the human eye detects a change in hue is ∆E* = 3. The human eye detects a color variation when ∆E* is between 3–6, yet this difference is tolerable. The color difference is unacceptable when ∆E* > 6 [28]. The average color difference between the samples was larger than six, indicating that the two systems’ measurements of the colors of the tsavorite samples were significantly different from what the human eye would see. Using simulated color blocks, the color difference between the two approaches was demonstrated in a more perceptible way (Figure 7).
Figure 7.
Simulated color blocks were used to more clearly illustrate the color discrepancy between photography data and the colorimeter result.
These differences may be due to the different light environments (the colorimeter uses an integral sphere and photography uses a plane light source) and the shooting angle influence (the colorimeter is vertical and the photography uses a 2 degree angle). If we unify the light environments, photo angles and camera parameters, as well as some other factors, we can establish a new photo color measurement system. As long as the data are measured using the same system, they are comparable. For the general evaluation and rating agencies, a plane light source is enough, but if you want to obtain the real color of the sample, you need an integral sphere environment for accurate testing.
The 9.7 color difference is easily visible with the unaided eye, and more over 95% of the PM photos are thought to be more like the genuine thing. Therefore, color pickups are a useful instrument for determining the color of colored gemstones.
Considering R2, Figure 8 shows the optimal regression of PMs and CMs. L*, a*, b*, C*, and h* all have R2 values more than 0.86, indicating a good fit. As a result, the PMs might forecast 86.99% or more of the color values determined by the CMs. So we can study tsavorite colors by taking pictures and picking out the colors.
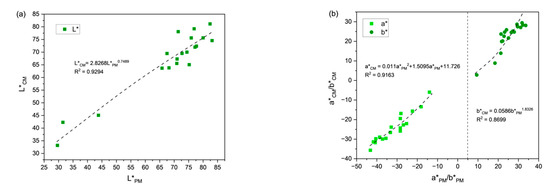
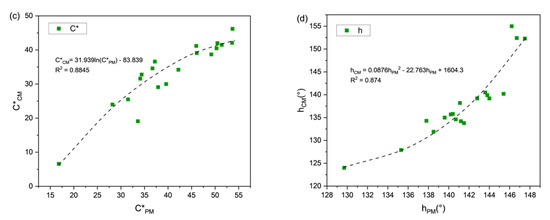
Figure 8.
Regression curve for L*, a*, b*, C*, and h*: (a) L*CM − L*PM; (b) a*CM − a*PM and b*CM − b*PM; (c) C*CM − C*PM; (d) h*CM − h*PM.
3.3. The Effect of Cutting Was Studied by Photographic Color Extraction
The evaluation criteria of the color gem cutting can be divided into four parts: color concentration improvement 30%, scintillation 30%, symmetry 30% and small facet precision 10%, the latter two are distinguished by the naked eye. We study the color concentration enhancement and scintillation by means of photography.
3.3.1. Color Concentration Improvement
On the one hand, the cutting directly affects the color of the gem by changing the bottom angle of the gem to concentrate on light. On the other hand, the fire colors caused by the small facet’s reflection also affect the gem color.
By sticking the gem onto plasticine, it changes the appearance of the fire color (The sticky plasticine makes the bottom small facet unreflective). This paper studies the effect of the fire color on the gem color, by comparing the presence of sticky plasticine. Then we study the direct impact of cutting on the color of the gem (excluding the influence of the fire color).
Three forms were selected for the photo, the first is the obverse side photographed, that is stuck to the plasticine, the second is photographed reverse side up to the plasticine and the third is photographed on the white cushions (Figure 9). And we tested 35 samples in three ways, as shown in Figure 10.
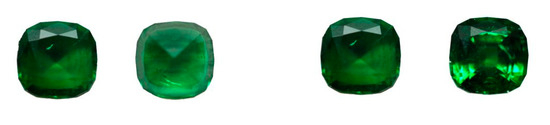
Figure 9.
(Left) the obverse and reverse of a stone without the fire color (both stuck to the plasticine); (Right) the obverse of a gem with or without the fire color (stuck to the plasticine and placed on the white cushion).
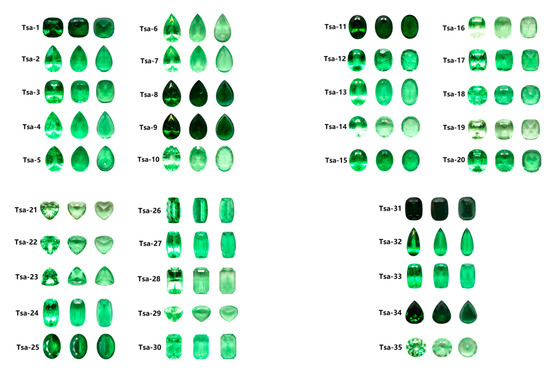
Figure 10.
Three kinds of photos of 35 samples are: the obverse side with the fire color, the obverse side without the fire color and the reverse side without the fire color.
In this study, we divide the cuttings into two parts. One is the “overall cutting”, by sharpening the bottom of the stone (by comparing the obverse and reverse of a stone without the fire color), and the other is the “small facet cutting” (by comparing the obverse of a gem with or without the fire color). The overall cutting has a major impact on the color change. By sharpening the bottom of the gem, the total reflection of light occurs and the luminous flux inside the gem increases. On the one hand, the increase of the light path makes more chromogenic ions release energy; on the other hand, the total reflection reduces the loss of light, which is equivalent to the increase of the light intensity. To stimulate more chromogenic ions to release energy, they can make the stone have a greater color saturation.
We compare the color change on the obverse and reverse sides of a stone without the fire color, that is, we study the impact of the overall cutting on the color. The average absolute values of C and L changes are 6.16 and 6.27. The change in h is very small, only 1.11, so we will not discuss further. The average color difference before and after cutting is 9.53, which means that there is an obvious color difference that can be distinguished by the naked eye. To judge whether the color is improved after cutting, we can see from the grading chart (Figure 11) that the larger the C value; the smaller the L value in this range (L is in the range of 30–60), the better the color. Following cutting, 88.57% of the gems’ L decreases (6 of gems are lower than 30), so 71.43% of the gems’ L* plays an optimization role, and 77.14% of the gems’ C* increases. Six gems’ L and C were not optimized after cutting, six samples’ L or C were optimized, and 23 gems’ L and C were both optimized (Table 1).
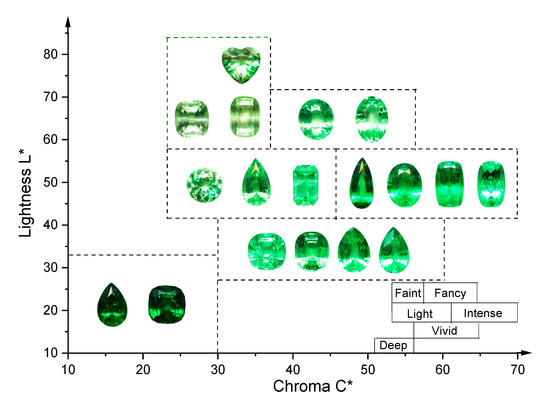
Figure 11.
Tsavorites’ color grading is divided into: deep, vivid, intense, fancy, light and faint. Color rating: intense > vivid > fancy > light > deep = faint.

Table 1.
Comparison between before and after two kinds of cutting (overall cutting and small facet cutting), including the color difference and the optimized samples’ numbers.
Comparing the obverse side of a gem with or without the fire color, the average color difference can be obtained by comparing the influence of the small facet (fire color) on the color with or without the paste. The color difference ΔE = 6.93 is also an obvious color difference that can be distinguished by the naked eye. The average value of L* change is 4.41, the average value of C* change is 4.56 and the average value of h change is 1.46. There are 19 gems’ L* that decrease after cutting (three gems are lower than 30), so 16 gems’ L* are optimized. Sixteen gems’ C increase after cutting. Five samples were optimized for both parameters (L* and C*)(Tsa-6, Tsa-21, Tsa-30, Tsa-33, Tsa-35), eight samples were not optimized for both parameters (Tsa-2, Tsa-4, Tsa-5, Tsa-10, Tsa-16, Tsa-17, Tsa-19, Tsa-20), and the other 16 samples were optimized for one parameter (L* or C*) (Table 1).
The evaluation criteria for this link are: two parameters are optimized to show that cutting has a significant effect on color concentration, one parameter is optimized to show that cutting has a moderate effect on color fineness, and neither parameter is optimized to show that cutting has no effect on color concentration. It can be seen that the color concentration of most bare stones is improved after overall cutting, and overall cutting plays a major role in the improvement of color concentration. Small facet cutting has no obvious effect on the color concentration convergence. In the case of the color concentration increase, the overall cutting weight is 80%, and the small facet cutting weight is 20%.
3.3.2. Scintillation
Gem scintillation is a kind of visual effect caused by the light changes of the different small facets. The greater the brightness, the greater the difference between light and dark, the stronger the scintillation degree of color. The scintillation is directly related to the L* value of the small facet, so when we study the scintillation of colored gemstones, the saturation is excluded and we only study the effect of the L* value on the scintillation.
First, we study the influence factors of the scintillation degree in the standard round drill cutting (Figure 12). Scintillation is shown as the strength of contrast in static photographs, so we use Photoshop to increase the contrast of the picture from the left to right by 50. As seen transversely in Figure 12a–c, the more to the right, the stronger the scintillation, the histogram shows the differences in L. Therefore, the larger the difference between the brightest value and the darkest value, the stronger the scintillation. We keep the number of pixels of different gray levels close to each other, if there are only a small number of bloom points, the overall scintillation is not strong. In the vertical contrasts of Figure 12a–c, we find that the higher the Laverage, the stronger the flicker perceived by the human eye. In conclusion, the higher the Laverage value and the ΔL value, the stronger the scintillation. In the brightness histogram, which counts the number of pixels under different L values, the image is divided into about 2 million pixels. To ensure that it is a suitable visual area, the value of ΔL begins with the value of L above 100 pixels.
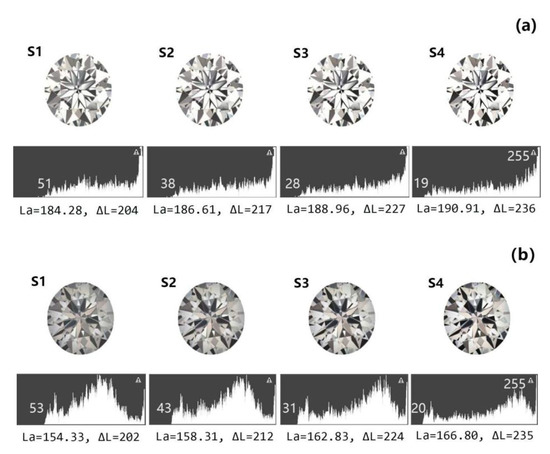
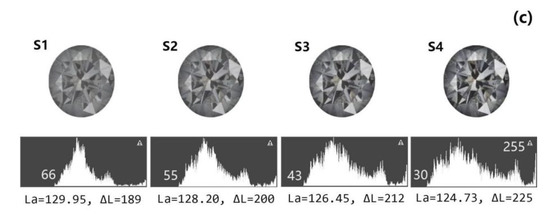
Figure 12.
Standard round drill cutting through the PS adjustment to simulate the change of the scintillation intensity. (a–c) from S1 to S4, gem scintillation increases with increasing contrast. From longitudinal comparison of S1 of (a–c) graphs, gem scintillation decreases with the decrease of lightness. La = average lightness, ΔL = Lmax − Lmin.
Then, we apply to tsavorite samples (Figure 13), Tsa-5, Tsa-29, and Tsa-31, that have ΔL values of 212, 162 and 125 in the histogram, respectively, and their scintillation decreases gradually.
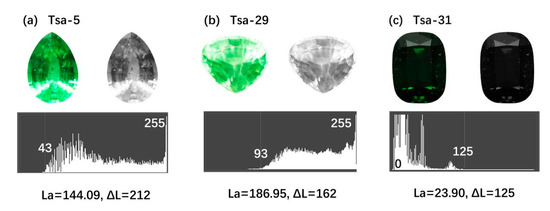
Figure 13.
Analysis of the scintillation of three gem samples (Tsa-5, Tsa-29, Tsa-31). The top is the sample photo and the sample photo excluding saturation, and the bottom is a luminance histogram of the sample excluding saturation. The bigger the ΔL, the stronger the flicker. Gem scintillation from strong to weak is: (a) > (b) > (c).
L* in colored gems can affect the color saturation, although when L* becomes higher, the flicker degree is stronger, but the color is lighter. The color saturation in colored gems is more important than the flicker degree, so for colored gems’ cuttings, we only judge ΔL, the L value is evaluated in the color rating section. We divide the scintillation into three grades, when ΔL < 130, the scintillation is weak, ΔL ∈ 130–190, the scintillation is excellent, and ΔL > 190, the scintillation is strong.
4. Conclusions
Under a 6504K fluorescent lamp, we found that the most effective background for tsavorite color grading was N9.5. In this paper, the feasibility of taking color by photography is studied, and all of the color parameters (L*, a*, b*, c*, h*) are found by comparing the color data obtained by photography and colorimeter. The regression model R2 obtained by both the photogrammetry (PM) and the colorimeter (CM) were above 86.99%, so the PM readings can be used to predict the color values measured by CM. We can evaluate the improvement of the color saturation and scintillation after cutting by taking photos. Comparing the L* and C* before and after cutting, if both L* and C* were optimized, the color concentration score was 100–90, only one parameter was optimized with the score of 80–70, and both were unoptimized with a score of 70–60. Colored gemstones’ scintillation is judged by the L*-difference in the color histogram, the higher the ΔL value, the stronger the scintillation.
Author Contributions
Methodology, Y.M.; Software, Y.M.; Investigation, Y.M.; Writing—review & editing, Y.M.; Supervision, Y.G. All authors have read and agreed to the published version of the manuscript.
Funding
This research received no external funding.
Institutional Review Board Statement
Not applicable.
Informed Consent Statement
Not applicable.
Data Availability Statement
Data are contained within the article.
Conflicts of Interest
The authors declare no conflict of interest.
References
- Feneyrol, J.; Giuliani, G.; Ohnenstetter, D.; Le Goff, E.; Malisa, E.P.J.; Saul, M.; Saul, E.; Saul, J.M.; Pardieu, V. Lithostratigraphic and structural controls of ‘tsavorite’ deposits at Lemshuku, Merelani area, Tanzania. Comptes Rendus Geosci. 2010, 342, 778–785. [Google Scholar] [CrossRef]
- Feneyrol, J.; Giuliani, G.; Ohnenstetter, D.; Saul, M.; Saul, E.; Saul, J.M. Le district minier à ‘tsavorite’ de Lemshuku, Tanzanie. Rev. Gemmol. A.F.G. 2010, 172, 11–22. [Google Scholar]
- Feneyrol, J.; Giuliani, G.; Ohnenstetter, D.; Galoisy, L.; Pardieu, V. Is the V/Cr ratio a fingerprint of the geographical origin of ‘tsavorite’ in the Mozambique Belt? In Proceedings of the General Meeting of the International Mineralogical Association: Acta Mineralogica Petrographica, Budapest, Hungary, 21–27 August 2010; p. 776. [Google Scholar]
- Switzer, G.S. Composition of green garnet from Tanzania and Keny. Gems Gemol. 1974, 14, 296–297. [Google Scholar]
- Feneyrol, J.; Giuliani, G.; Ohnenstetter, D.; Fallick, A.; Martelat, J.; Monié, P.; Dubessy, J.; Rollion-Bard, C.; Le Goff, E.; Malisa, E.; et al. New aspects and perspectives on tsavorite deposits. Ore Geol. Rev. 2013, 53, 1–25. [Google Scholar] [CrossRef]
- Ma, Y.; Guo, Y. Variation in Gemological Characteristics in Tsavorites with Different Tones from East Africa. Crystals 2022, 12, 1677. [Google Scholar] [CrossRef]
- Tang, J.; Guo, Y.; Xu, C. Metameric effects on peridot by changing background color. J. Opt. Soc. Am. A 2019, 36, 2030–2039. [Google Scholar] [CrossRef]
- Sun, Z.; Palke, A.; Renfro, N.; Breitzmann, H.; Hand, D.; Muyal, J. Discovery of color-change chrome grossular garnets from Ethiopia. Gems Gemol. 2018, 54, 33–236. [Google Scholar]
- Sun, Z.; Palke, A.C.; Renfro, N. Vanadium- and Chromium-Bearing Pink Pyrope Garnet: Characterization and Quantitative Colorimetric Analysis. Gems Gemol. 2016, 51, 345–369. [Google Scholar] [CrossRef]
- Schmetzer, K.; Bernhardt, H.-J.; Bosshart, G.; Hainschwang, T. color-change garnets from Madagascar: Variation of chemical, spectroscopic and colorimetric properties. J. Gemmol. 2009, 31, 235–282. [Google Scholar] [CrossRef]
- Krzemnicki, M.S.; Hanni, H.; Reusser, E. color change garnets from Madagascar: Comparison of colorimetric with chemical data. J. Gemmol. 2001, 27, 395–408. [Google Scholar] [CrossRef]
- Liu, Y.; Shigley, J.; Halvorsen, A. color hue change of a gem tourmaline from the Umba Valley, Tanzania. J. Gemol. Lond. 1999, 26, 386–396. [Google Scholar]
- Guo, Y. Quality evaluation of tourmaline red based on uniform color space. Clust. Comput. 2017, 20, 3393–3408. [Google Scholar] [CrossRef]
- Han, J.; Guo, Y.; Liu, S. Environmental Issues on Color Quality Evaluation of Blue Sapphire based on GemdialogueTM Col-orComparison Charts. Ekoloji Derg. Ekoloji 2018, 27, 1365–1376. [Google Scholar]
- Liu, Y.; Shigley, J.; Fritsch, E.; Hemphill, S. The “alexandrite effect” in gemstones. Color Res. Appl. 1994, 19, 186–191. [Google Scholar] [CrossRef]
- Tang, J.; Guo, Y.; Xu, C. Light pollution effects of illuminance on yellowish green forsterite color under CIE standard light source D65. Ekoloji 2018, 27, 1181–1190. [Google Scholar]
- Sun, Z.; Renfro, N.; Palke, A.C. Tri-color-change holmium-doped synthetic CZ. Gems Gemol. 2017, 53, 259–260. [Google Scholar]
- Liu, Y.; Shi, G.; Wang, S. Color Phenomena of Blue Amber. Gems Gemol. 2014, 50, 2–8. [Google Scholar] [CrossRef]
- Guo, Y.; Wang, H.; Du, H. The foundation of a color-chip evaluation system of jadeite-jade green with color difference control of medical device. Multimed. Tools Appl. 2016, 75, 14491–14502. [Google Scholar] [CrossRef]
- Guo, Y.; Wang, H.; Li, X.; Dong, S. Metamerism appreciation of jadeite-jade green under the standard light sources D65, A and CWF. Acta Geol. Sin. Engl. Ed. 2016, 90, 2097–2103. [Google Scholar] [CrossRef]
- Guo, Y. Quality grading system of Jadeite-Jade green based on three colorimetric parameters under CIE standard light sources D-65, CWF and A. Bulg. Chem. Commun. 2017, 49, 961–968. [Google Scholar]
- Guo, Y.; Zong, X.; Qi, M. Feasibility study on quality evaluation of Jadeite-jade color green based on GemDialogue color chip. Multimedia Tools Appl. 2018, 78, 841–856. [Google Scholar] [CrossRef]
- Guo, Y.; Zong, X.; Qi, M.; Zhang, Y.; Wang, H. Feasibility study on color evaluation of jadeite based on GemDialogue color chip images. EURASIP J. Image Video Process. 2018, 2018, 95. [Google Scholar] [CrossRef]
- Guo, Y.; Zhang, X.; Li, X.; Zhang, Y. Quantitative characterization appreciation of golden citrine golden by the irradiation of [FeO4]4−. Arab. J. Chem. 2018, 11, 918–923. [Google Scholar]
- Cheng, R.; Guo, Y. Study on the effect of heat treatment on amethyst color and the cause of coloration. Sci. Rep. 2020, 10, 14927. [Google Scholar] [CrossRef] [PubMed]
- ISO/CIE 11664-4:2019(E); Colorimetry—Part 4: CIE 1976 L*a*b* Colour Space. ISO: Geneva, Switzerland; CIE: Vienna, Austria, 2019.
- Lam, Y.-M.; Xin, J.H. Evaluation of the quality of different D65 simulators for visual assessment. Color Res. Appl. 2002, 27, 243–251. [Google Scholar] [CrossRef]
- Liao, N.F.; Shi, J.S.; Wu, W.M. An Introduction to Digital Color Management System; Beijing Institute of Technology Press: Beijing, China, 2009; p. 47. [Google Scholar]


Disclaimer/Publisher’s Note: The statements, opinions and data contained in all publications are solely those of the individual author(s) and contributor(s) and not of MDPI and/or the editor(s). MDPI and/or the editor(s) disclaim responsibility for any injury to people or property resulting from any ideas, methods, instructions or products referred to in the content. |
© 2023 by the authors. Licensee MDPI, Basel, Switzerland. This article is an open access article distributed under the terms and conditions of the Creative Commons Attribution (CC BY) license (https://creativecommons.org/licenses/by/4.0/).