Article

A Framework for Assessing the Interference from NGSO Satellite Systems to a Radio Astronomy System

1
Innovation Academy for Microsatellites of CAS, Shanghai 201203, China
2
University of Chinese Academy of Sciences, Beijing 100049, China
3
School of Information Science and Technology, ShanghaiTech University, Shanghai 201210, China
4
Shanghai Yuanxin Satellite Technology Co., Ltd., Shanghai 201600, China
*
Author to whom correspondence should be addressed.
Appl. Sci. 2023, 13(3), 1691; https://doi.org/10.3390/app13031691
Submission received: 28 December 2022 / Revised: 13 January 2023 / Accepted: 16 January 2023 / Published: 29 January 2023

Abstract

:
As the number of non-geostationary orbit (NGSO) satellites continues to grow, interference with other communication systems, including radio astronomy systems (RASs), is becoming increasingly critical. In this study, an interference simulation framework was developed to analyse the potential impact of NGSO systems on RAS in accordance with the relevant International Telecommunication Union (ITU) regulations and recommendations. In addition to the simulation of interference generated by individual NGSO satellite systems, the framework also supports the analysis of aggregate interference from multiple NGSO satellite systems. By inputting satellite system parameters, including constellation configuration, user distribution and beam scheduling strategy, the framework is able to obtain interference probability distributions for a typical RAS ground station at different latitudes and observation directions. The simulation results provide a reference for the analysis of interference from NGSO satellite systems to RASs, and can also be used to guide the development of strategies to mitigate harmful interference to RASs.

1. Introduction

Low earth orbit (LEO) constellations will be an integral part of 6G technology [1,2,3,4]. However, the increasing number of non-geostationary orbit (NGSO) satellite constellations has raised concerns about interference with other services such as geostationary orbit (GSO) fixed and mobile satellite services [5,6,7], ground-based services, and radio astronomy services. To avoid the negative impact of NGSO systems on radio astronomy services (RASs) [8,9,10], it is necessary to evaluate the interference of NGSO systems on radio astronomy telescopes, given that NGSO satellite systems often have frequency assignments that are adjacent to those of RASs. Interference analysis has become a crucial aspect of the design of satellite constellation systems.
As communication technology has advanced, the speed and coverage of connections have greatly improved. However, there are still many parts of the world that do not have network coverage. To address this demand for communication, a number of operators and emerging technology companies are working to design and build large-scale NGSO communication constellations [11,12,13,14] in the Ku, Ka, and Q/V frequency bands. These constellations aim to provide connectivity to areas that currently lack coverage.
To protect RASs from the interference of NGSO satellite systems with adjacent frequency bands, the International Telecommunication Union (ITU) has advocated to achieve the coexistence between them in Radio Regulations [15] and established limits on the allowable interference. To comply with these constraints, it is necessary to implement interference avoidance techniques such as steeper filters to reduce out-of-band emissions, improve power amplifiers to reduce the impact of third-order intermodulation, increase guard bands, and more effective beam scheduling strategies [16,17,18,19,20]. These measures can help reduce the interference caused by NGSO satellite systems to RASs.
To determine whether NGSO systems cause harmful interference to RASs, the ITU has developed several recommendations that outline protection criteria and allowable levels of interference. These recommendations include ITU Rec. RA.769-2 [21], which outlines thresholds for tolerated interference in different frequency bands for both continuum and spectral line observations by RASs; ITU Rec. RA.1513-2 [22], which describes the percentage of data loss that is allowable for RASs, including data loss caused by a single NGSO satellite system and multiple NGSO satellite systems; and ITU Rec. S.1586-1 [23], which outlines methods for calculating interference to RASs from NGSO fixed operational systems. Additionally, ITU Rec. RA.1631 [24] provides models of receiving antennas for different RAS frequency bands for compatibility analysis. In Ref. [10], the interference of NGSO systems to RASs in the 1610 MHz band was analysed, and in Ref. [9], Yucheng Dai proposed a new paradigm for combining NGSO satellite systems with RASs in order to address the conflict between the large scale of NGSO satellite systems and the high performance requirements of RASs. In Ref. [8], the interference of OneWeb and GSO satellite systems with LEO-satellite-based RASs was analysed.
The constantly changing positions of NGSO constellations relative to the Earth’s surface, coupled with the constantly changing beam pointing of user beams within their coverage areas, make it difficult to characterize the radio frequency interference of NGSO satellite systems in RASs. Additionally, the presence of multiple NGSO satellite systems on a global scale further complicates the analysis of aggregate interference in RAS. These factors make it challenging to accurately assess the impact of NGSO satellite systems on RASs.
This paper conducts a thorough study of the interference problem of NGSO constellations on RASs and develops a mathematical model and framework for analysing the interference between NGSO constellations and RASs. The interference characteristics of NGSO satellites are characterized by selecting a large number of representative pointings, and the field of view of the NGSO satellite is divided into cells. The cumulative probability distribution of the equivalent isotropic radiated power (EIRP) in each cell is obtained through the simulation of a large number of pointings. For the aggregate interference analysis, this paper utilizes the interference calculation methods outlined in ITU Rec. RA. 1323 [25] to convolve the probability density functions of the equivalent power flux density (EPFD) from different systems and obtain the probability density function of aggregate interference. The main contributions of this paper include:
  • A method is proposed for characterizing interference in the RAS band by partitioning the field of view of the NGSO satellite into cells and selecting representative pointings for each cell, and then determining the probability distribution of the EIRP in each cell by sampling a large number of beam pointings according to the user distribution.
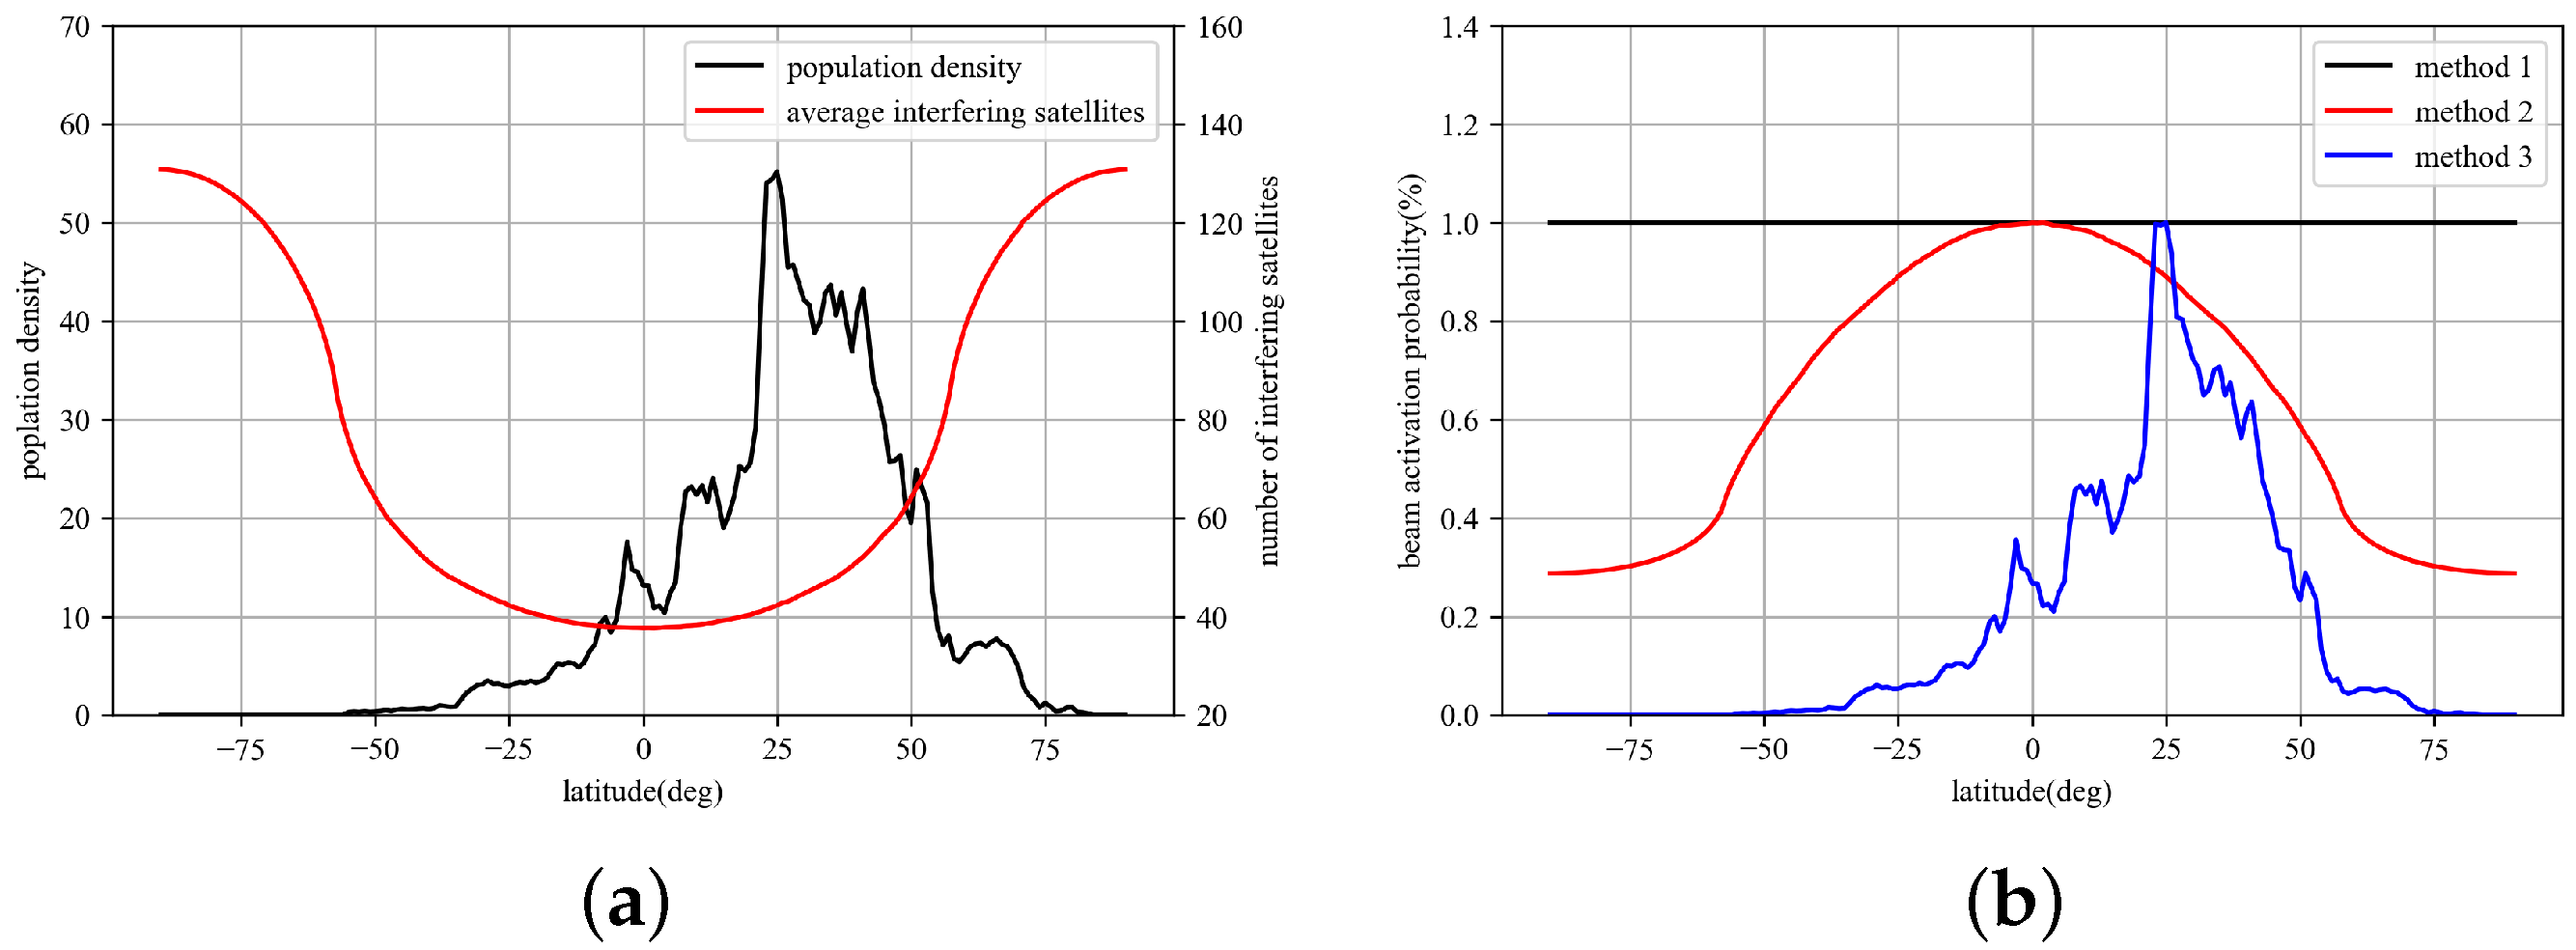
  • The concept of beam activation probability is introduced to account for the fact that satellite beams are not always active, and three definitions of beam activation probabilities are provided.
  • A new method for calculating the EPFD for RAS telescopes is proposed, which combines the probability density function of the EIRP in the field of view of the satellite with the activation probability of the satellite beams.
  • A method for calculating the aggregate interference from multiple NGSO constellations to the RAS is presented. The aggregate EPFD at the RAS receiver is obtained by summing the EPFDs of individual NGSO systems, and the interference generated by different NGSO systems is assumed to be independent of each other. The aggregate EPFD probability density function can be expressed as the convolution of the EPFD probability density functions of the NGSO systems.
The rest of the paper is organized as follows. In Section 2, the interference models of the NGSO constellation and RAS stations are presented, and the satellite models and radio astronomical telescopes are described in detail. In Section 3, the spatial distribution of the satellite’s EIRP and the activation probabilities of the satellite beams are presented, and the computational model of the EPFD provided by the ITU is modified on the basis of this model. Finally, a method to evaluate the total interference of multiple NGSO satellite constellations is given. In Section 5, a detailed and complete discussion of the interference is given.

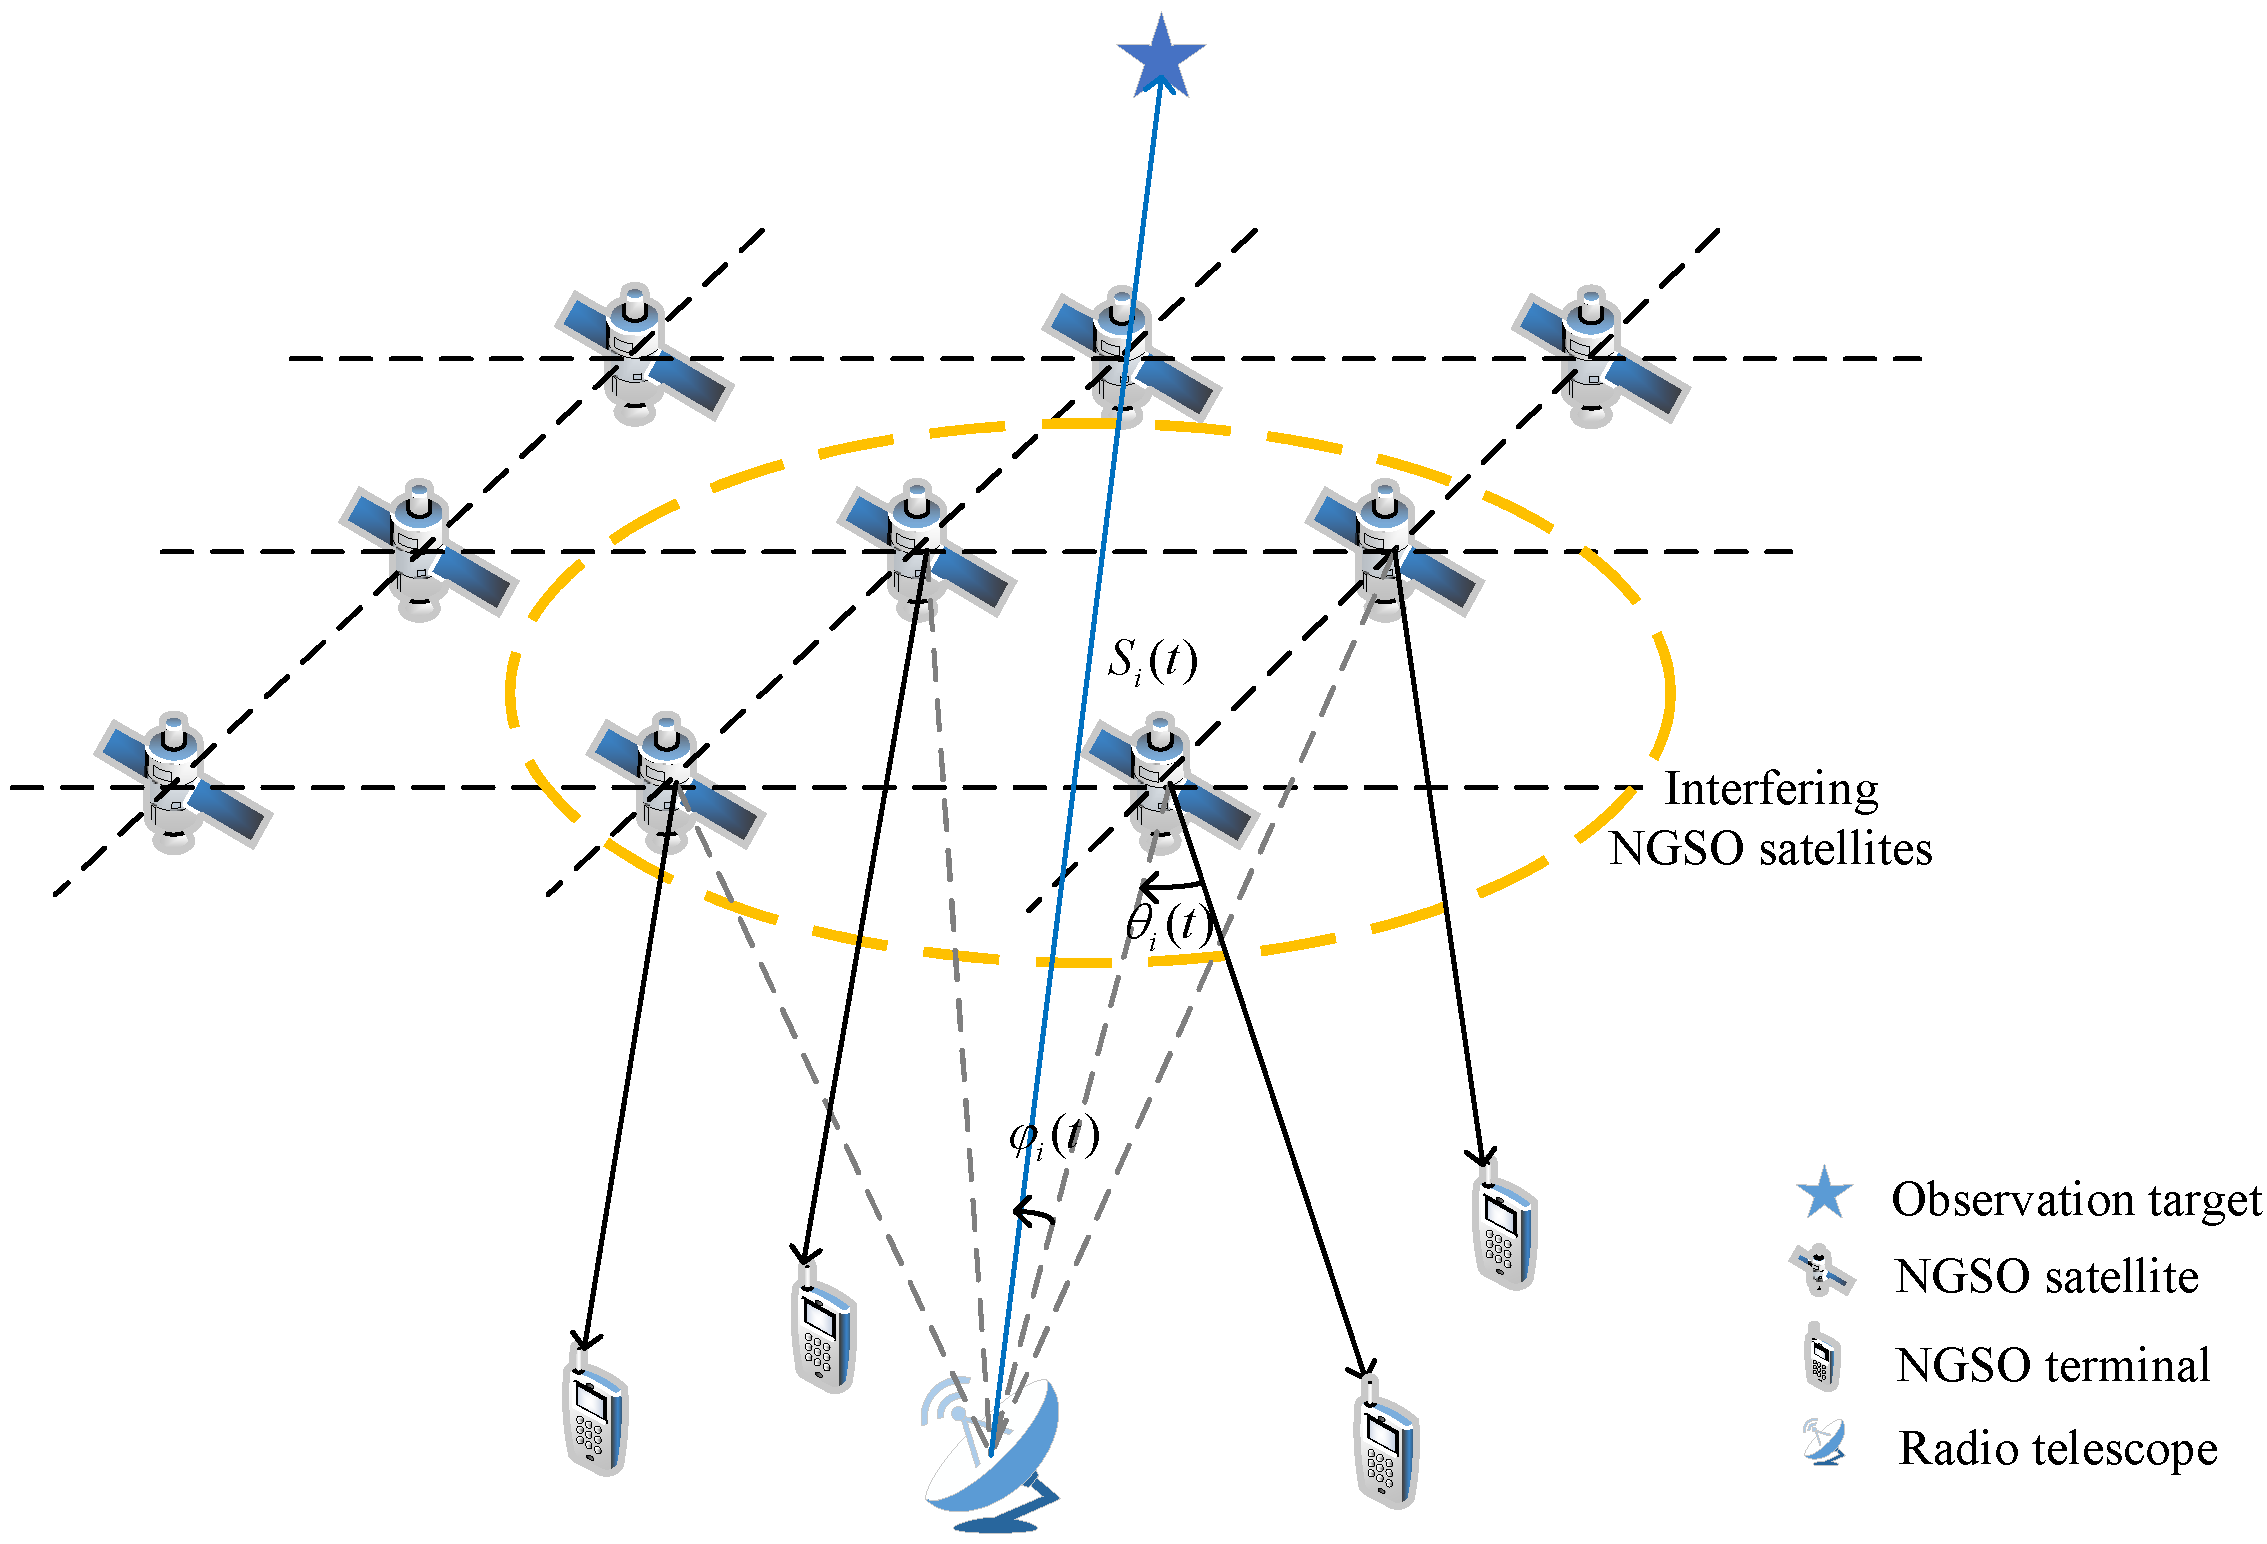
2. Model Description

In this section, we present a model for the interference between an NGSO constellation and a RAS telescope. We first introduce the segmentation of the field of view for both the NGSO satellite and the RAS telescope, and then provide a detailed description of the models for the satellite and the RAS telescope. The aim of this model is to understand and quantify the potential interference between these two systems in order to ensure the protection of the RAS band.

2.1. EPFD at the RAS Telescope
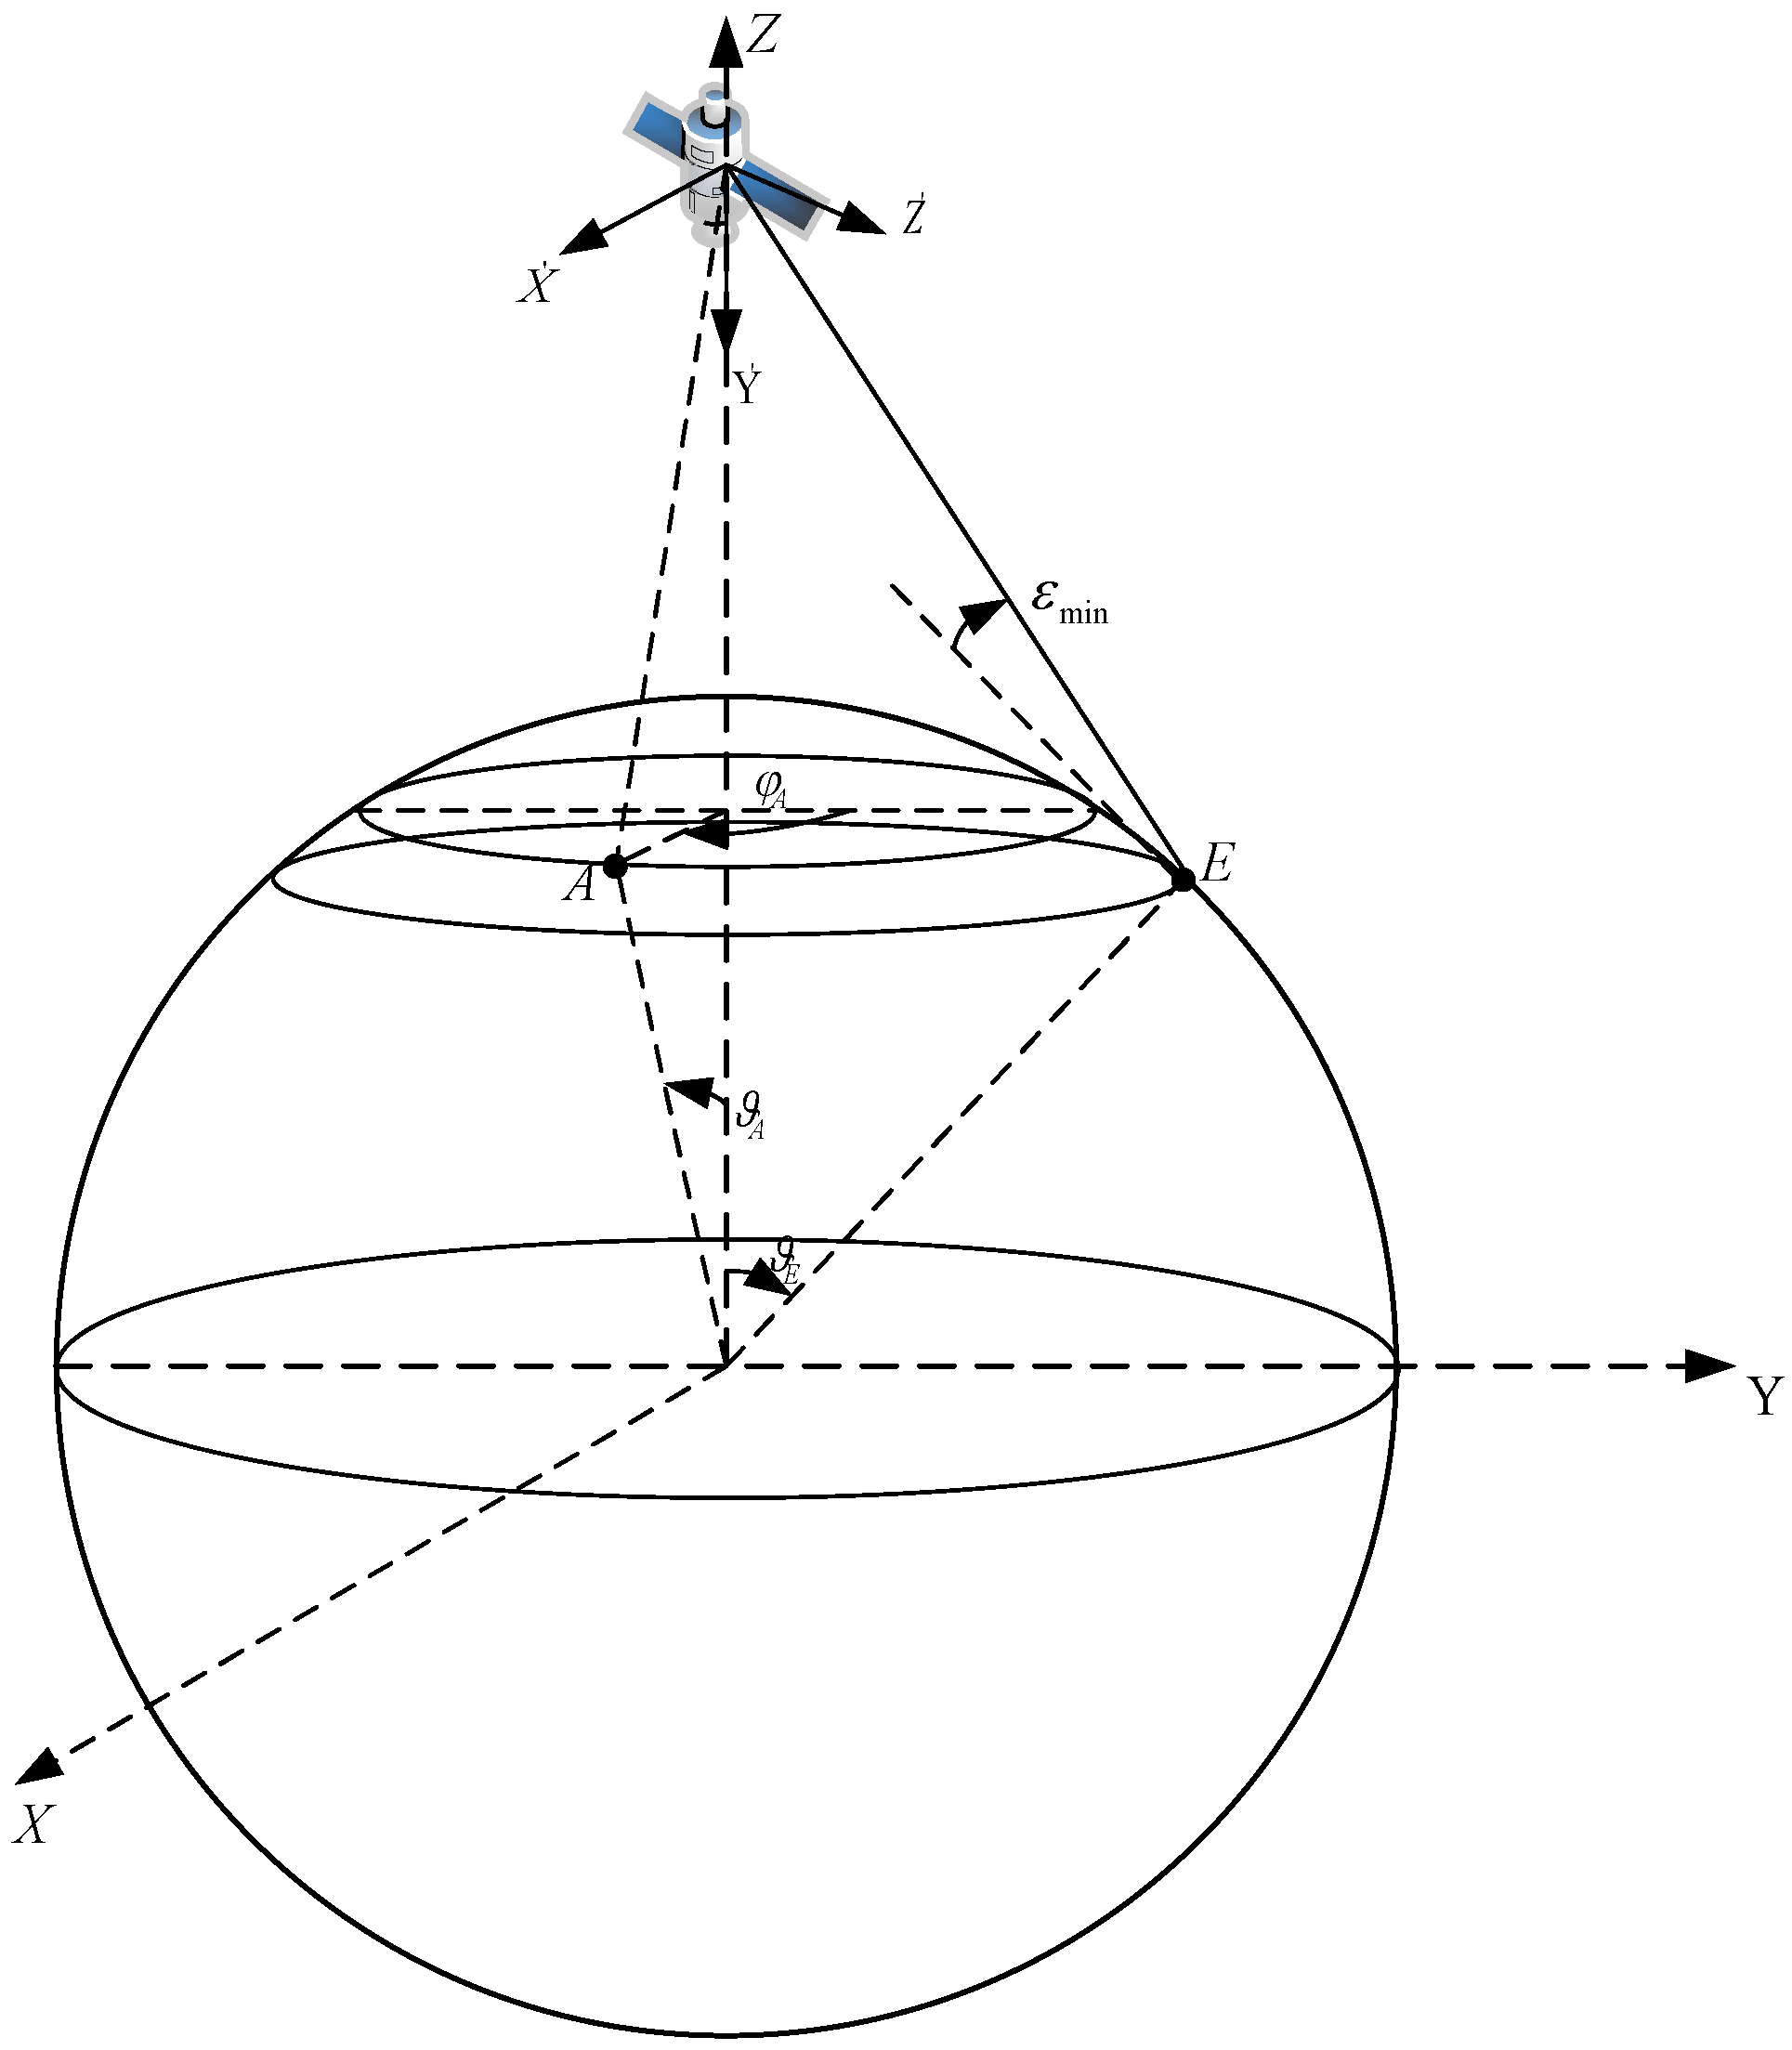
To calculate the interference of an NGSO fixed satellite service to an RAS telescope, the ITU-R M.1583 [26] gives a method based on the EPFD. Ensuring that the RAS telescope is not affected by harmful interference from NGSO satellite systems in any observation direction, the EPFD needs to be evaluated when the radio telescope is pointed in any direction. The model of the interference from the NGSO constellation to the RAS telescope is shown in Figure 1.
In broadband LEO constellation systems, satellites often use phased-array technology to provide internet access to ground users. These satellite beams provide access to users in a time-division manner. In order to simplify the analysis, we assumed that the number of NGSO satellite beams with the same frequency was 1, and that the user terminals were uniformly distributed on the ground, with their beams providing service to users in their coverage in an equal probability manner. The instantaneous EPFD for a single NGSO satellite can be expressed as follows:
E P F D i ( t ) = P t G t ( θ i ( t ) ) G r ( ϕ i ( t ) ) Δ G ( d i ( t ) ) 4 π d i 2 ( t )
where P t denotes the transmitting power of the NGSO satellite when its beam is pointed at the nadir, and θ t and ϕ t denote the off-axis angle of the satellite beam along the RAS telescope direction and the angle between the RAS observation direction and the direction of the NGSO satellite S t , respectively. d i ( t ) and d i ( t ) represent the distance between the NGSO satellite S i ( t ) and the RAS telescope, and the distance from the NGSO satellite S i ( t ) to its corresponding terminal, respectively. G t and G r denote the NGSO satellite transmit antenna gain and the RAS receive antenna gain, respectively. Δ G ( d i ( t ) ) is the compensation gain that maintains the same receive power of the terminal for longer paths as in the case of the subsatellite, which is given by the following equation:
G ( d i ( t ) ) = d i ( t ) 2 h 2
where h represents the orbit height of the NGSO satellite. If we assume that the number of interfering NGSO satellites visible to the RAS telescope at time step t is N t , and denote the set they constitute as C t , then the total EPFD that the RAS telescope experiences due to interference from all of these satellites within its field of view can be expressed as follows:
E P F D ( t ) = i = 1 N t P t G t ( θ i ( t ) ) G r ( ϕ i ( t ) ) Δ G ( d i ( t ) ) 4 π d i 2 ( t ) .
After the EPFD at time t has been calculated, it can be integrated over a period of Δ t . The resulting average EPFD corresponding to the RAS observation can then be calculated as follows:
E P F D ¯ ( t ) = 1 Δ t t s t s + Δ t S i ( t ) C t P t G t ( θ i ( t ) ) G r ( ϕ i ( t ) ) Δ G ( d i ( t ) ) 4 π d i 2 ( t ) d t .
where Δ t is the observation time of the RAS telescope. For a single observation, we need to randomly select multiple starting times of the integration for the average EPFD calculations. The more times we pick, the more accurate the simulation results will be. Then, the average EPFD cumulative probability density distribution of the system under this observation is counted. Assume that after K iterations, the probability of the average EPFD is less than l and can be approximated by the following expression,
P ( E P F D ¯ ( t ) < l ) 1 K k = 1 K I ( E P F D ¯ k ( t ) < l ) ,
where E P F D ¯ k ( t ) is the average EPFD in the kth simulation and I is an indicator function. The value of I is 1, if E P F D ¯ k ( t ) is less than l. Otherwise, the value of I is 0.

2.2. Sky Division

2.2.1. Division of RAS

To accurately analyse the interference between an NGSO constellation and an RAS telescope, it is necessary to consider a large number of representative pointings for both systems. The ITU Rec. S.1586-1 divides the entire sky visible to the RAS telescope into a finite number of pointings to represent the entire sky, with 30 rings parallel to the horizon and each ring subdivided into smaller cells with an approximate width of 90/30cos(elev), where elev is the elevation angle of the ring. There are 2334 cells in total.

2.2.2. Division of Satellite

To facilitate the partitioning of the field of view for NGSO satellites, we established a coordinate system for the satellite and introduced the definitions of the elevation and azimuth angles according to ITU Rec. S.1503-3 [27]. The elevation and azimuth angles are illustrated in Figure 2. In this coordinate system, the X-axis points to the east, the Y-axis points to the centre of the earth, and the Z-axis points to the north. The elevation angle of a pointing is defined as the angle between the pointing and the XOY plane, and the azimuth angle is defined as the angle between the projection of the pointing onto the XOY plane and the Y-axis. Given the vector of the pointing, p ( p = ( x , y , z ) T ), the expressions for the azimuth and elevation angles are as follows:
E l = a r c s i n ( z x 2 + y 2 + z 2 ) ,
A z = a r c t a n ( x y ) .
Since the interference from an NGSO satellite can potentially affect the entire visible surface of the Earth, the maximum azimuth and elevation angles can be expressed as a r c s i n ( R e R e + h ) , where R e is the radius of the Earth and h is the orbit height of the satellite. This corresponds to the pointing that is exactly tangent to the surface of the Earth.
Dividing the field of view of the NGSO satellite into cells with equal size elevation angle and azimuth angle gaps, the range of elevation and azimuth angles of cell G i j s a t are denoted as [ i × Δ E l E l m a x , ( i + 1 ) × Δ E l E l m a x ) and [ j × Δ A z A z m a x , ( j + 1 ) × Δ A z A z m a x ) , respectively, where Δ E l and Δ A z are the lengths of a cell in elevation and azimuth angle and i { 0 , 1 , , 2 E l m a x / Δ E l 1 } , j { 0 , 1 , , 2 A z m a x / Δ A z 1 } . In this paper, we considered the splitting scheme such that Δ E l and Δ A z were equal and the maximum elevation and azimuth angles were both a r c s i n ( R e R e + h ) .

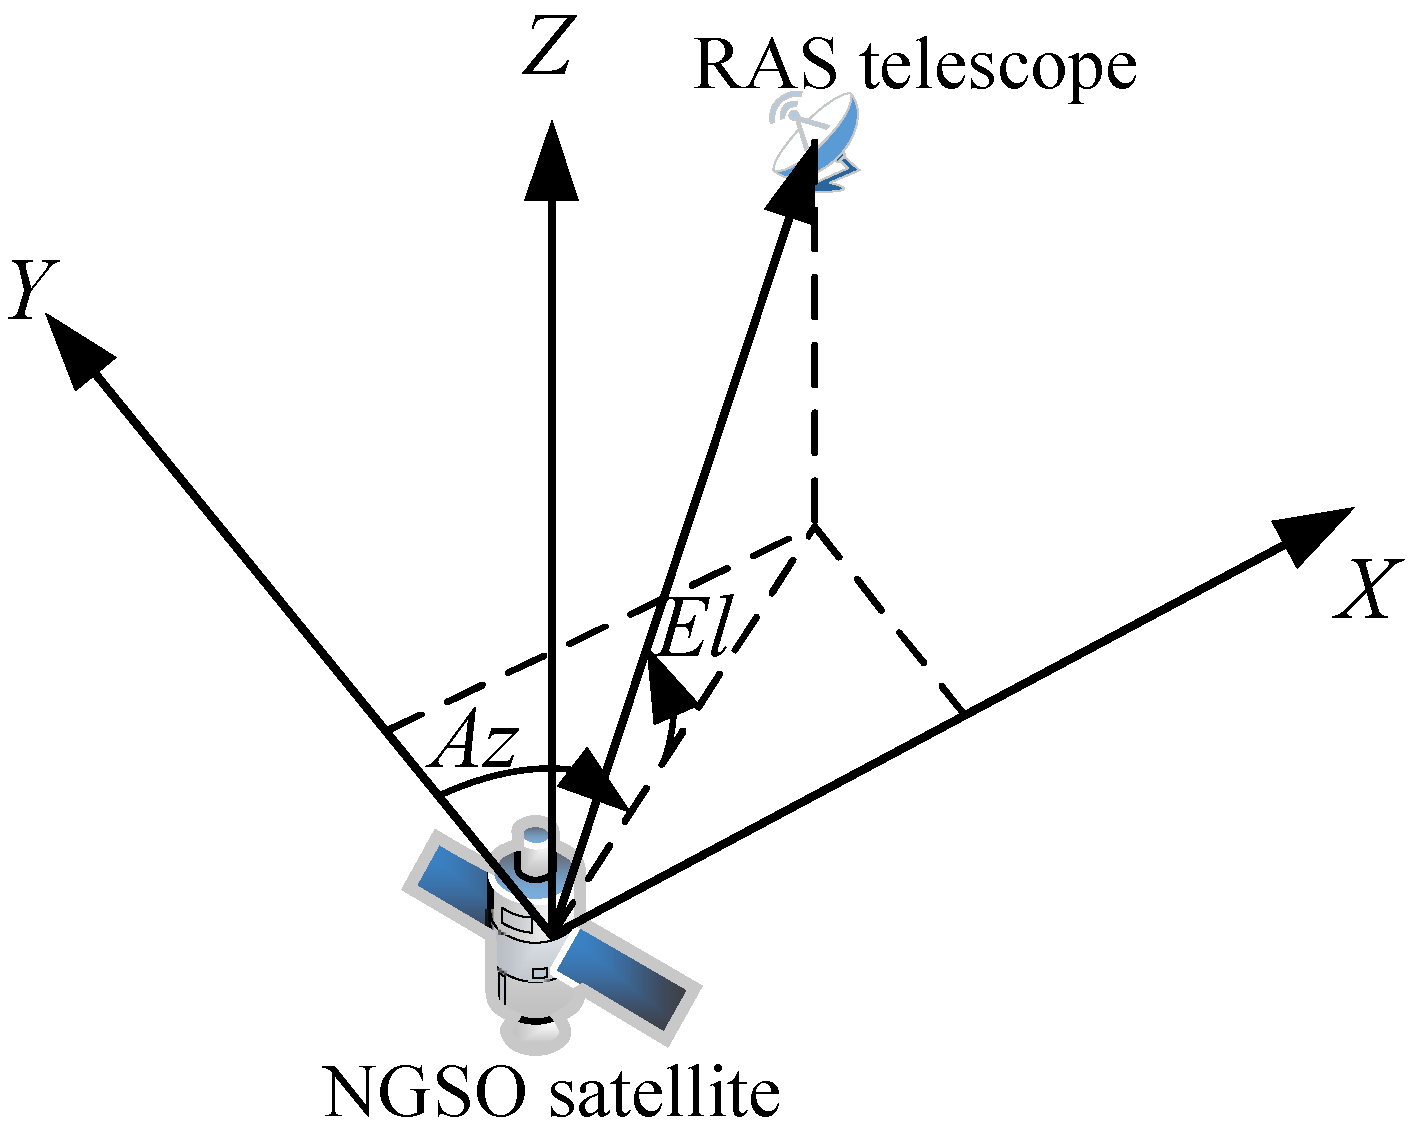
2.3. NGSO Satellite System Model

2.3.1. Constellation

The Walker constellation is the most common constellation configuration used by most NGSO constellation systems, where the position of one of the satellites is known so that the position of the other satellites can be deduced. The Walker constellation is a set circular orbits proposed by John Walker, which can be expressed by four parameters: orbital inclination (i), number of constellation satellites (N), number of orbital planes (P), and phase factor (F). The position states of all satellites in the configuration of Walker’s constellation can be determined using the following expressions:
Ω m , n = 2 π P ( m 1 ) + Ω 1 , 1 ,
M m , n = 2 π P ( n 1 ) + 2 π N F ( m 1 ) + M 1 , 1 ,
where Ω 1 , 1 and M 1 , 1 are the right ascension at the ascending node (RAAN) and mean anomaly of the reference satellites, respectively. The right ascension at the ascending node of the nth satellite in the mth plane is denoted as Ω m , n , and its mean anomaly is denoted as M m , n . According to the height of orbit h, the orbital velocity is G M R e + h , where the gravitational constant G = 6.67408 × 10 11 m 3 kg 1 s 2 , the mass of Earth M = 5.9722 × 10 24 kg and the radius of Earth R = 6.5478 × 10 6 m.

2.3.2. Constraints

The terminals of the NGSO constellation system are distributed in the satellite coverage. Due to the limit of the minimum elevation angle of a terminal, the maximum off nadir angle X m a x of a satellite beam could be represented by the following formula:
X m a x = a r c s i n ( R e R e + h c o s ϵ ) ,
where ϵ is the minimum elevation angle of a user terminal.
The communication systems with the same frequency as that of the NGSO system also include GSO satellite systems, and the NGSO satellite system needs to avoid the interference to GSO satellite systems according with the the requirement of radio regulation article 22. Most of the NGSO satellite systems adopt the angular isolation to avoid interference with GSO systems, among which OneWeb’s system adopts the progressive pitch to avoid interference, while the angle between Starlink satellites and the GSO arc needs to be larger than 22 degrees. Considering that the GSO exclusion zone could change the beam pointing distribution of NGSO satellites, the interference analysis of the RAS should also take the exclusion zone of GSO systems into consideration. Considering the satellite coverage and the GSO avoidance, the satellite beam pointing should meet the following constraints,
a r c c o s ( c o s A z c o s E l ) X m a x ,
α ( γ , A z , E l ) α t h ,
where E l and A z are the elevation and azimuth angles of the NGSO satellite beam, and γ is the latitude of the NGSO terminal. α is the GSO arc avoidance angle, which is the angle between an NGSO satellite and the GSO arc observed from the terminal, where the beam point to the terminal. α t h is the threshold of the GSO arc avoidance angle. Because of the geometry of the NGSO satellite, the GSO arc, and the terminal location, α is a function of the latitude of the satellite and the beam pointing.

2.3.3. Satellite Antenna Pattern

The antenna model proposed in ITU-R S.1528 [28] is used to analyse the interference from the NGSO satellite operating in the fixed-satellite service below 30 GHz. The logarithm of antenna gain G t ( θ ) is shown below
[ G t ( θ ) ] = G m a x 3 ( θ / θ b ) α 0 < θ a θ b G m a x + L N + 25 log ( z ) a θ b < θ 0.5 b θ b G m a x + L N 0.5 b θ b < θ b θ b X 25 log ( θ ) b θ b < θ Y L F Y < θ 90 L B 90 < θ 180 ,
where G m a x and θ b are the maximum gain in the mainlobe (dBi) and the one-half 3 dB beamwidth, respectively, X = G m a x + L N + 25 log ( b θ b ) , and Y = 10 0.04 ( G m a x + L N L F ) . The far-out side-lobe level and the back-lobe level of the main beam are denoted as L F and L B . For L N = 25 , the values of a, b, and α are 2.58 1 0.6 log z , 6.32 and 1.5 . The value of z is 1 for circular beam.

2.3.4. Out-of-Band Emission

For the NGSO satellite frequency bands adjacent to RAS bands, the out-of-band interference from satellite downlink beams needs to be evaluated. For example, 10.6∼10.7 GHz of the Ku band is assigned to the RAS as the primary service, and 10.7∼12.75 GHz of the Ku band includes the downlink of the NGSO satellite fixed service. The out-of-band interference from the NGSO satellite can affect the reception of the RAS telescope, and the out-of-band interference is mainly affected by the characteristics of filters and amplifiers. According to NTIA requirements, the out-of-band radiated power spectrum density (psd) needs to meet the following conditions:
p s d ( f ) = p s d m a x 10 S E M ( f o f f ) 10
S E M ( f o f f ) = m a x { 40 log 10 ( 2 f o f f B A ) 8 , 60 }
where p f d m a x is the power spectral density in the in-band of the NGSO satellite, f o f f is spectrum offset from the central frequency of the in-band, and B A is the bandwidth of NGSO satellite beam. According to the transmitting power of the NGSO satellite beam, the p f d m a x could be written as P t B A . Therefore, the maximum emission power in the RAS band, such as 10.6∼10.7 GHz, is formulated below.
P R A S = f l f u P t B A 10 S E M ( f f c ) 10 d f
where f l and f u are the upper and lower boundaries of the in-band of the NGSO satellite beam, and f c is its central frequency.

2.4. RAS Telescope Model

The interference characteristics of an RAS telescope depend not only on the characteristics of the interfering system but also on its own characteristics, such as the location of the RAS station and the receiving antenna model of the RAS telescope. The number of visible interfering satellites also varies depending on the location of the telescope, with the number of visible satellites increasing with latitude for the polar-orbiting constellation; the location of the RAS station also leads to a different density of user terminals around it, with more terminals requiring more beam resources in the area. The above characteristics lead to changes in the interference to which the RAS telescope is subjected. In this study, an in-depth analysis of the interference characteristics was carried out depending on the location of the RAS telescope and the user requirements around it. Based on ITU R RA.1631, the following mathematical model of the receiving antenna was used in the compatibility analysis between non-GSO systems and the RAS telescope at frequencies above 150 MHz.
[ G r ( ϕ ) ] = G m a x 2.5 × 10 3 ( D λ ϕ ) α 0 < ϕ ϕ m G 1 ϕ m < ϕ ϕ r 29 25 log 10 ϕ ϕ r < ϕ 10 34 30 log 10 ϕ 10 < ϕ 34.1 12 34.1 < ϕ 80 7 80 < ϕ 120 12 120 < ϕ 180 ,
where D and λ are the diameter of RAS telescope and the wavelength of the observation frequency band, respectively. The expressions of the parameters in Equation (17) are formulated below,
G m a x = 20 log 10 ( D λ ) + 20 log 10 π
G 1 = 1 + 15 log 10 D λ
ϕ m = 20 λ D G m a x G 1
ϕ r = 15.85 ( D λ ) 0.6
According to ITU Rec. RA.1631, the maximum antenna gain of a typical RAS telescope in the 10.6∼10.7 GHz band is 81 dB. The power flux density (PFD) threshold in the band at the RAS receiver is −160 dBW/m 2 /100 MHz. RAS telescopes are used to observe very faint celestial activity in the Universe and therefore the requirements for RAS interference protection are very stringent. The permissible percentage of individual NGSO satellite systems exceeding the PFD threshold is 2 percent, while the permissible percentage for all NGSO systems is 5 percent.

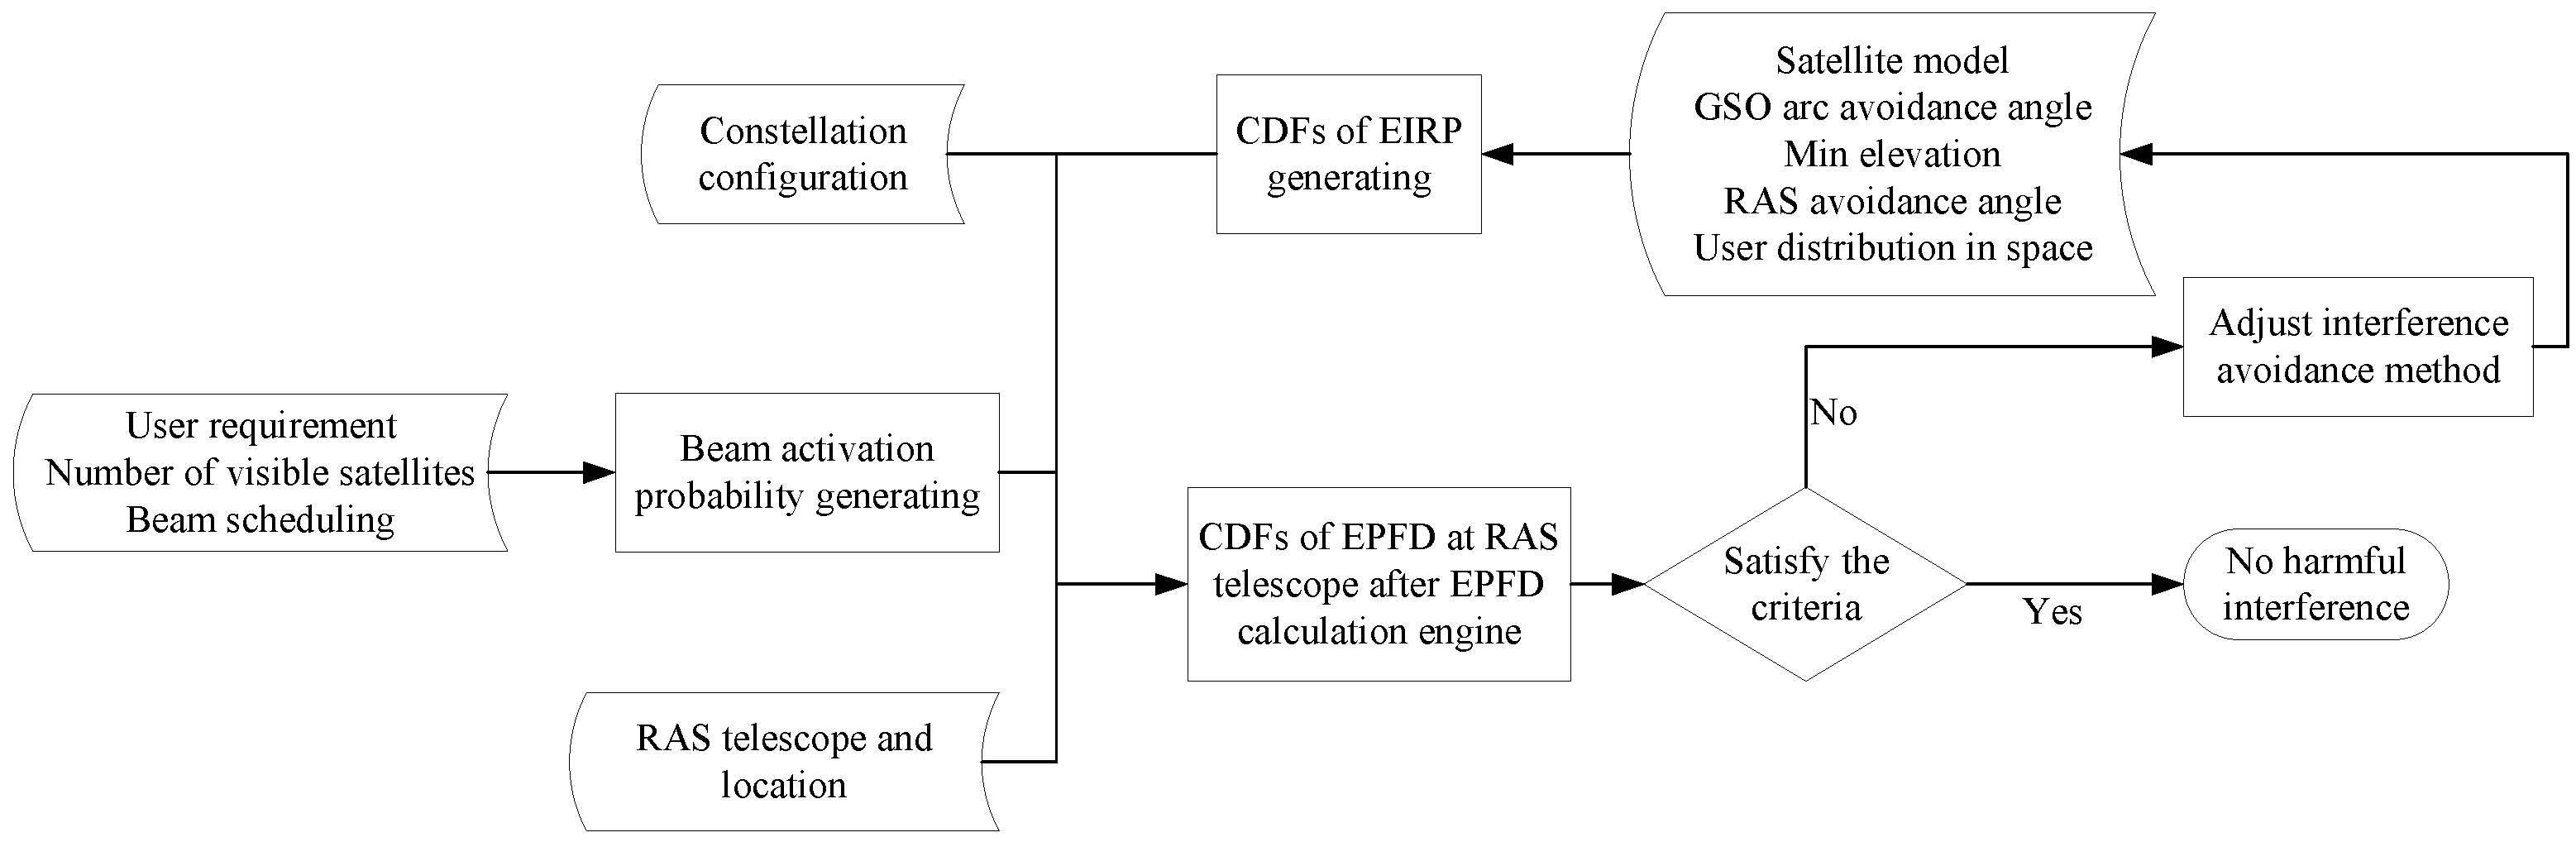
3. Framework of the Interference Analysis

In this section, we present a framework for evaluating the harmful interference that NGSO satellite systems may cause to RAS telescopes as shown in Figure 3. The framework includes steps for generating the cumulative distribution functions (CDFs) of out-of-band emissions from the NGSO satellites based on the distribution of users and interference avoidance strategies, determining the beam activation probability, and using an EPFD calculation engine to assess the EPFD for each cell of the RAS telescope. By considering the EPFD distributions from multiple NGSO satellite systems, we can calculate the aggregate EPFD distribution for the RAS telescope and assess the overall level of interference. These simulation results can be used to determine how to mitigate or manage the interference caused by the NGSO satellite systems to the RAS telescopes.

3.1. Space–Time Distribution of Satellite EIRP

Many NGSO satellite systems utilize advanced phased-array technology with a limited number of beams to provide high-speed internet access to terrestrial users through time-division multiplexing. Changes in the direction of the satellite beam can also result in changes to the interference experienced by RAS telescopes. In order to characterize the radiation of the satellite in different directions, this section proposes a model for the space–time distribution of the NGSO satellite radiation. The radiation of a satellite in a given direction is determined by the space random variable S, which is a two-dimensional vector consisting of the elevation and azimuth angles of the satellite beam pointing, and the time random variable T, which characterizes whether the beam is active or not. The probability of a beam activation is correlated with user demand and is equal to 1 if the beam is active for the entire duration of the satellite’s flight, which is proportional to the duration of activation.

3.1.1. Generating the CDFs of EIRP

To generate the CDFs for satellites’ EIRP, we need to model the spatial distribution of user terminals. There are different approaches that can be used to model the user distribution, depending on the specific characteristics of the distribution. In order to facilitate the interference analysis, this study assumed that users were uniformly distributed within the satellite coverage, which meant that the satellite beam was directed towards any point within the coverage area with equal probability. The coverage diagram of the satellite is depicted in Figure 4, where the boundary corresponds to the minimum elevation angle ϵ m i n and E represents a point on the edge.
The beam pointing of the NGSO satellite is subject to a uniform distribution on the cap. For a point A inside the cap, it can be expressed using ϑ A and φ A . Then, the probability that the geocentric angle between the NGSO satellite and point A is less than ϑ A can be expressed as the following formula:
P ( ϑ ϑ A ) = 2 π R e 2 ( 1 c o s ϑ A ) 2 π R e 2 ( 1 c o s ϑ E ) .
Since φ is subject to a uniform distribution in the range 0 , 2 π , its probability density function is 1 2 π . According to Equation (22), the probability density function is derived by taking its derivative. Therefore, the expression for the joint probability density function of ϑ A and φ A is as follows:
p ( ϑ A , φ A ) = s i n ϑ A 2 π ( 1 c o s ϑ E ) .
According to the geometry in Figure 4, the expressions of the elevation and azimuth angles regarding point A are derived below,
E l A s a t = π 2 a r c c o s ( s i n ϑ A c o s φ A s i n 2 ϑ A + ( 1 c o s ϑ ) + h R e 2 ) ,
A z A s a t = a r c c o s ( ( 1 c o s ϑ ) + h R e s i n 2 ϑ A s i n 2 φ A + ( 1 c o s ϑ ) + h R e 2 ) .
For the cell G i j s a t , the elevation and azimuth angles corresponding to the centre of the cell are ( i + 0.5 ) Δ E l E l m a x and ( j + 0.5 ) Δ A z A z m a x , respectively. If the satellite beam is directed towards point A, the EIRP expression at the centre of G i j s a t is denoted below,
E I R P i j A = P R A S G t ( ω i j ( E l A s a t , A z A s a t ) ) Δ G ( E l A s a t , A z A s a t )
where ω i j ( E l A s a t , A z A s a t ) is the off-axis angle with respect to cell G i j s a t and Δ G ( E l A s a t , A z A s a t ) is the compensation of the beam, which is expressed as
Δ G ( E l A s a t , A z A s a t ) = R e 2 ( s i n 2 ϑ A + ( 1 c o s ϑ ) + h R e 2 ) h 2 .
The expression of the off-axis angle ω i j ( E l i j s a t , A z i j s a t ) is shown as follows:
ω i j ( E l i j s a t , A z i j s a t ) = a r c c o s ( s i n E l i j s a t s i n E l A s a t + c o s E l i j s a t c o s E l A s a t c o s ( A z A s a t A z i j s a t ) ) .
By taking a large number of samples within the cap of the satellite coverage according to the probability density function, we were able to obtain a cumulative probability density function of the satellite’s radiated power within each cell.
ϑ A and φ A of the NGSO satellite can be seen as mutually independent random variables. Samples could be drawn according to their probability density functions. The samples of φ A were drawn subject to a uniform distribution in 0 ,   2 π , denoted as { φ A , 1 , φ A , 2 , , φ A , N } , where N is the number of samples. Regarding the samples of ϑ A , we drew U from the uniform distribution in 0 ,   1 , then we converted them by the following equation:
ϑ A = a r c c o s [ 1 ( 1 c o s ϑ E ) U ] ,
Assuming that the samples of ϑ were denoted as { ϑ A , 1 , ϑ A , 2 , , ϑ A , N } , by using expressions (24) and (25), we obtained the corresponding elevation and azimuth angles and removed those that did not satisfy the constraints of (11) and (12); the number of elevation–azimuth pairs was N . We obtained the sampling set of the elevation and azimuth angles, which are given by Equation (30) and furthermore, the EIRP for the nth sample in cell G i j s a t was denoted as E I R P i j A , n . Therefore, the probability that E I R P i j A was less than e could be represented as Equation (31).
S = { ( E l A , 1 s a t , A z A , 1 s a t ) , ( E l A , 2 s a t , A z A , 2 s a t ) , , ( E l A , N s a t , A z A , N s a t ) }
F i j ( e ) = P ( E I R P i j A < e ) = 1 N n = 1 N I ( E I R P i j A , n < e )
According to the above formulas, we obtained the cumulative probability density function E I R P i j A , which could be converted to a probability density function p i , j ( e ) .

3.1.2. Generating the Beam Activation Probability

The beam activation probability of an NGSO satellite system depends on the beam scheduling strategy, the available communication resources, and the user distributions. For the Walker constellation, the number of satellites visible to user terminals varies with its latitude, and the communication demand vary from region to region. In order to better match the actual NGSO satellite beam scheduling status, different beam activation probabilities should be set for satellites over different regions.
The NGSO satellites provide services to their users through an efficient allocation of time slots, which is shown in Figure 5. The diagram shows that a satellite is providing time slots to users within its coverage during a time window. The black squares indicate that the satellite is providing communication services to its corresponding user at this time, while the other time slots corresponding to other users are white. The diagram shows the NGSO satellite beam serving three user terminals in seven time slots. The beam is active in 5 slots and the probability of activation of the beam in this duration is 5 7 . Here, the concept of beam activation probability is introduced; however, the beam activation probability cannot be determined, as it needs to be determined by the satellite operator according to the actual situation of the satellite system.
Assuming that the activation probability of the satellite beam is P a , the expected EIRP of the for cell G i j can be expressed as the following equation,
E I R P ¯ i j = P a + e p i , j ( e ) d e .
The value of P a in the case of an overloaded user requirement is usually 1.

3.2. Beam Scheduling

It is important to consider that the beam is not active at all the time, as the activation probability of the beams has a significant impact on the analysis of interference. For example, when satellites are located at the poles or in remote oceanic areas, only a small number of beam resources are needed to satisfy the communication requirements due to the low density of users in these regions. In this study, we considered three different beam activation probabilities for various beam scheduling strategies. To facilitate the analysis, we defined the average number of visible satellites and population density at latitude γ as n ( γ ) and d ( γ ) , respectively. These quantities play a key role in determining the activation probability of the beams and, therefore, the level of interference experienced by the ground-based RAS.
In the first beam scheduling method, the beam activation probability was assumed to be 1 for all latitudes, which did not accurately reflect real-world beam scheduling policies. In particular, for polar orbits, the population density is very low while the number of satellites is relatively high. As a result, the activation probability of the beams in the polar region should be reduced to account for this imbalance. In the following beam scheduling policies, we considered both the number of visible satellites and human population density in determining the activation probability.
The second method assumed that the activation probability of the beam was 1 at the latitude γ n , m i n where the average number of visible satellites was minimal, which was denoted as n ( γ n , m i n ) . For another latitude γ , the beam activation probability should be adjusted according to the ratio of the average number of visible satellites at the latitude to the average minimum number of visible satellites, which is n ( γ m i n ) n ( γ ) .
For the third beam scheduling method, the beam activation probability was determined based on the population density at different latitudes. We assumed that the demand for communication services was proportional to the population density and set the beam activation probability at the latitude with the highest population density to 1. The beam activation probability at latitude γ was denoted as p ( γ ) , and could be expressed as follows:
p ( γ ) = m i n ( 1 , n ( γ d , m a x ) d ( γ ) n ( γ ) d ( γ d , m a x ) )
where γ d , m a x is the latitude with the largest population density, and γ d , m a x = a r g m a x γ d ( γ ) .

3.3. EPFD Calculation Engine

Based on the above EPFD calculation and the EIRP characteristics of the satellite emission, corresponding amendments needed to be made with respect to the ITU Recommendations. For a time step t, it was necessary to count the total EPFD generated by all interfering satellites at the RAS receiver. The instantaneous EPFD calculation at the receiver could be summarized as follows:
  • Determine the number of interfering satellites visible to the RAS receiver N r a s , calculate the elevation and azimuth of the RAS station relative to each satellite, where we denote the sets of interfering satellites, elevation and azimuth angles of RAS receiver, and interfering satellites as { I 1 ( t ) , I 2 ( t ) , , I N r a s ( t ) } , { ( E l 1 r a s ( t ) , A z 1 r a s ( t ) ) , ( E l 2 r a s ( t ) , A z 2 r a s ( t ) ) , , ( E l N r a s r a s ( t ) , A z N r a s r a s ( t ) ) } , and { ( E l 1 s a t ( t ) , A z 1 s a t ( t ) ) , ( E l 2 s a t ( t ) , A z 2 s a t ( t ) ) , , ( E l N r a s s a t ( t ) , A z N r a s s a t ( t ) ) } , respectively. The distance between each satellite and the RAS station also needs to be counted, whose set is denoted as { d 1 ( t ) , d 2 ( t ) , , d N r a s ( t ) } .
  • For the satellite I n ( t ) , n { 1 , 2 , , N r a s } , we need to determine in which cell in the satellite’s field of view the RAS station is located, and the expression for the expected EPFD for satellite I n ( t ) at the cell G c r a s of the RAS receiver is expressed as Equation (34), for c { 1 , 2 , , 2334 } :
    E P F D I n ( t ) c = i , j I ( ( E l n s a t , A z n s a t ) G i j s a t ) p ( γ I n ( t ) ) e p i , j ( e ) d e G r ( ϕ I n ( t ) c ) 4 π d n 2 ( t )
    where γ I n ( t ) is the latitude the subsatellite of satellite I n ( t ) and G r ( ϕ I n ( t ) c ) is the off-axis angle between the satellite I n ( t ) and the RAS observation within cell c. If E l n s a t [ i × Δ E l E l m a x , ( i + 1 ) × Δ E l E l m a x ) and A z n s a t [ j × Δ A z E l m a x , ( j + 1 ) × Δ A z E l m a x ) , I ( ( E l n s a t , A z n s a t ) G i j s a t ) equals to 1, otherwise it equals to 0.
  • Based on the above steps, the total EPFD is denoted as below,
    E P F D c ( t ) = n { 1 , 2 , , N r a s } i , j I ( ( E l n s a t , A z n s a t ) G i j r a s ) p ( γ I n ( t ) ) e p i , j ( e ) d e G r ( ϕ I n ( t ) c ) 4 π d n 2 ( t ) .
    Then, the average EPFD at cell c in a time interval Δ t with a start time t s can be expressed as the following:
    E P F D ¯ c ( t ) = 1 Δ t t s t s + Δ t E P F D c ( t ) d t
Repeating the above process multiple times, the CDF of the EPFD in every cell of the RAS telescope could be obtained according to Equation (5).

3.4. Aggregate EPFD

In practice, there are multiple NGSO satellite systems around the globe and the interference to an RAS telescope is the sum of these NGSO satellite systems. Assuming that there are total Z NGSO satellite systems in the globe, the expression for the aggregate EPFD for RAS telescope in cell c is given below
E P F D ¯ a g g c ( t ) = z = 1 Z E P F D ¯ z c ( t ) ,
where E P F D ¯ z c ( t ) is the EPFD contributed by the zth NGSO satellite system. Based on Equation (36), we are able to obtain the cumulative distribution function (CDF) generated by each NGSO system at cell c. Assuming that the interference of the NGSO satellite systems is independent of each other, the aggregate EPFD according to the ITU Rec. RA. 1323 is the convolution of all NGSO satellite systems. The power density function (PDF) of the aggregate EPFD is formulated as follows:
p a g g c ( e ) = p 1 c ( e ) p 2 c ( e ) p z c ( e ) p Z c ( e )
where ⊗ represents the convolution operator, and p z c ( e ) and p a g g c ( e ) are denoted as the PDF of the EPFD of the zth NGSO satellite system and the PDF of the aggregate EPFD, respectively.

4. Simulation Results

This section focuses on simulating the interference experienced by an RAS telescope from an NGSO satellite system. To do this, we first generated the CDFs of the NGSO satellite EIRP for all cells within its field of view based on the relevant radiation characteristics and geographic location. Then, we simulated the number of visible satellites for the RAS telescope according to the constellation configurations and obtained the activation probabilities for different beam scheduling strategies. Through these results, we could get the EPFD at the RAS receiver based on the beam activation probability. Finally, we obtained the EPFD distribution in each cell of the RAS telescope through multiple trials with random start times, each lasting for a duration of 2000 s.

4.1. Simulation Parameters

This section analyses the interference of the NGSO satellite constellation with the RAS telescope. The satellite constellation configuration was mainly based on the OneWeb constellation. The satellite constellation is a Walker constellation with an orbital inclination of 90 degrees. The detailed constellation parameters are shown in Table 1, and the RAAN of the first orbit is zero degrees.
In addition to the NGSO constellation configuration parameters mentioned above, other parameters were needed for the simulation. These included transmission parameters for the NGSO satellites, reception parameters for the RAS telescope, and protection criteria. The details of these parameters can be found in Table 2. The RAS telescope parameters were taken from ITU REC. RA 769 and included the interference thresholds and relevant RAS frequency bands. The 2 % allowable probability of exceeding the EPFD threshold is a protection criterion for a single NGSO satellite system, and for all NGSO satellite systems worldwide and other communications systems in adjacent frequencies, the probability of the aggregate EPFD exceeding the EPFD threshold does not exceed 5 % . Verifying that the aggregate EPFD protection criteria are met is very difficult and this paper currently only considered the protection criteria for individual NGSO satellite systems.

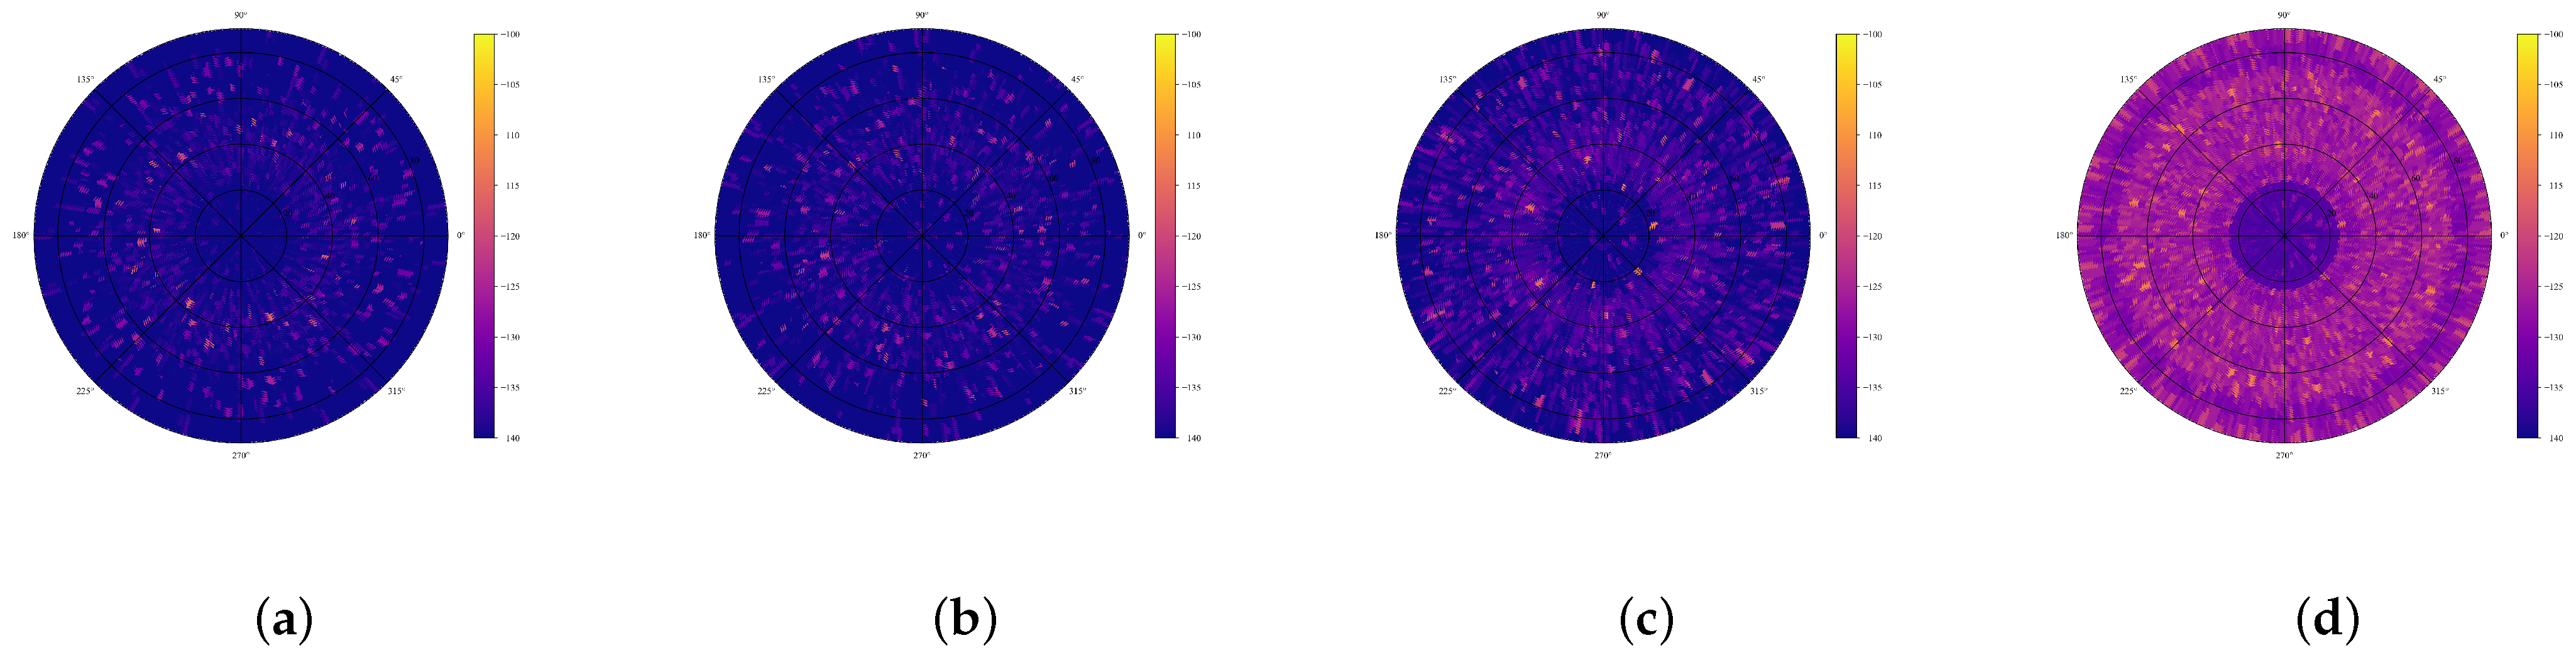
4.2. CDFs of Satellite EIRP

In order to avoid interference from NGSO satellite systems to an RAS telescope, it is necessary to carefully consider the CDF of the NGSO satellite’s EIRP. This function depends on various factors, including the satellite’s radiofrequency parameters, the spatial distribution of users, and the constraints on beam scheduling. To avoid interference, NGSO satellite systems may need to take measures such as ensuring that the GSO arc avoidance angle of the NGSO satellite beam is not less than 18 degrees, as shown in Table 2. The mean values of EIRP in the field of view of the NGSO satellite at different latitudes and the CDF curve of the EIRP at different azimuth and elevation angles are depicted in Figure 6 and Figure 7, respectively.
As the subsatellite point moves from low to midlatitudes, a belt can be observed in the centre of the satellite’s field of view. This belt shifts to higher elevations as the satellite’s latitude increases until it is no longer visible. The formation of these belts is largely due to the requirement that the GSO arc avoidance angle must be at least 18 degrees, which limits the mean EIRP by preventing the beam from pointing into the belts. The latitude of this belt is generally higher than the latitude of the subsatellite point, except at zero latitude, where the inline interference event has the same latitude as the subsatellite point.
The CDFs of the EIRP at different directions is given in Figure 7. In Figure 7a, the direction corresponding to the elevation and azimuth angles of −2.5 degrees and −2.5 degrees, respectively, is located in the exclusion zone of the GSO satellite system; the direction corresponding to the elevation and azimuth angles of 57.5 degrees and −2.5 degrees, respectively, is located outside the coverage area of the NGSO satellite. The EPFD levels corresponding to these two directions are small for the same probability. This is mainly due to the fact that the beam cannot be pointed to the directions and therefore, the radiated EIRP is small. From Figure 7a–d, the CDF curves become tighter with different directions. This is mainly due to the natural separation between the NGSO and GSO satellite systems at high latitudes. There is no need to take any interference avoidance measures and the beam pointing within the satellite coverage is uniformly distributed. Therefore, there are similar CDFs of the EIRP within the coverage.

4.3. Beam Activation Probability

The distribution of user requirements for communication resources can impact the allocation of beam resources, which can in turn affect the interference experienced by an RAS telescope. To account for this, we introduced the concept of beam activation probability, which reflected the likelihood that a beam would be used in a given location. We explored three methods of beam activation probabilities, with the third method combining the number of visible satellites and population density to more accurately represent the interference experienced in real-world scenarios. The left side of Figure 8 illustrates the distribution of the population density and the number of visible interfering satellites at different latitudes, while the right side shows the beam activation probabilities for each of the three methods. By processing the data from List of countries and dependencies by population in wikipedia, we obtained the variation of actual population density with latitude. In polar regions, where the population is sparse and communication needs are low, fewer beam resources are required. Conversely, in the midlatitude belt, where the majority of the population is concentrated in the northern hemisphere, the greatest demand for communication resources exists.
According to the above figures, less than one percent of the total global population is located above the latitude of 70 degrees, while the polar regions have the largest number of visible interference satellites. Based on the definitions of user beam activation probabilities presented in Section 3, the number of visible interfering satellites, and the human population density, we obtained the distribution of the three beam activation probabilities in the right-hand side of Figure 8.
For the polar orbit constellation, the highest number of interfering satellites is visible in the polar regions of the Earth. In the first method, a large number of beam resources are allocated to the polar regions. The second beam scheduling strategy tends to provide an equal quantity of beam resources for the entire globe. The third beam strategy allocates beam resources on demand, based on population density.

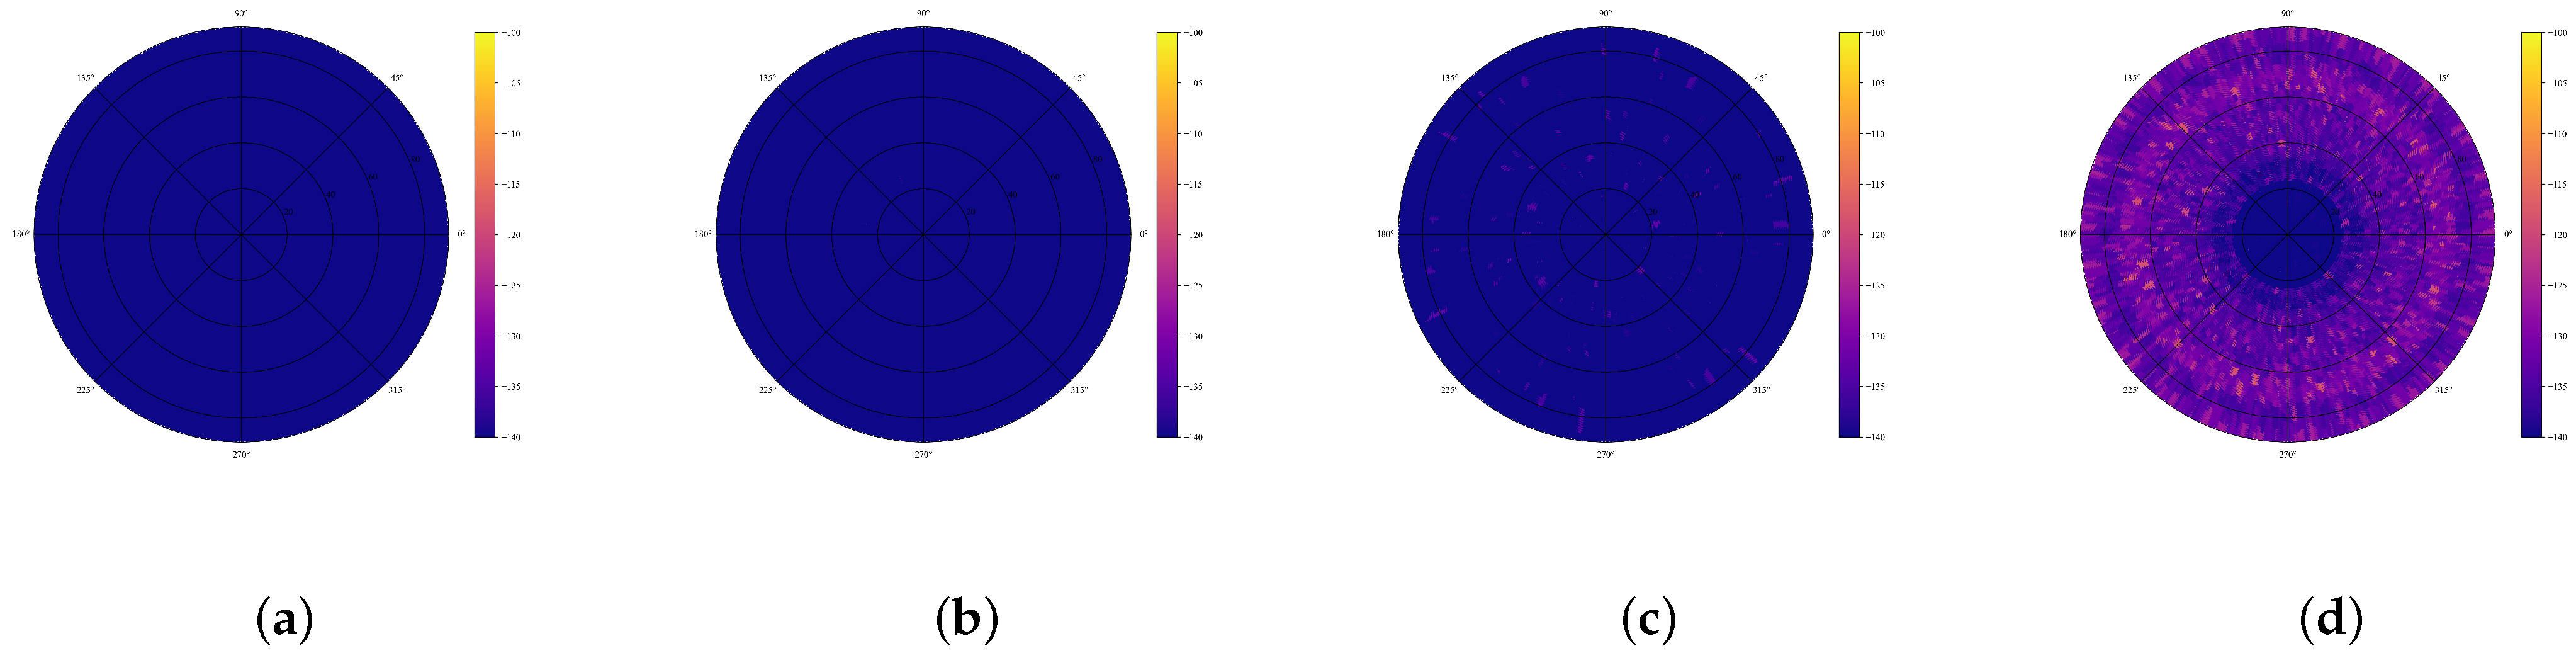
4.4. EPFD of RAS Telescope
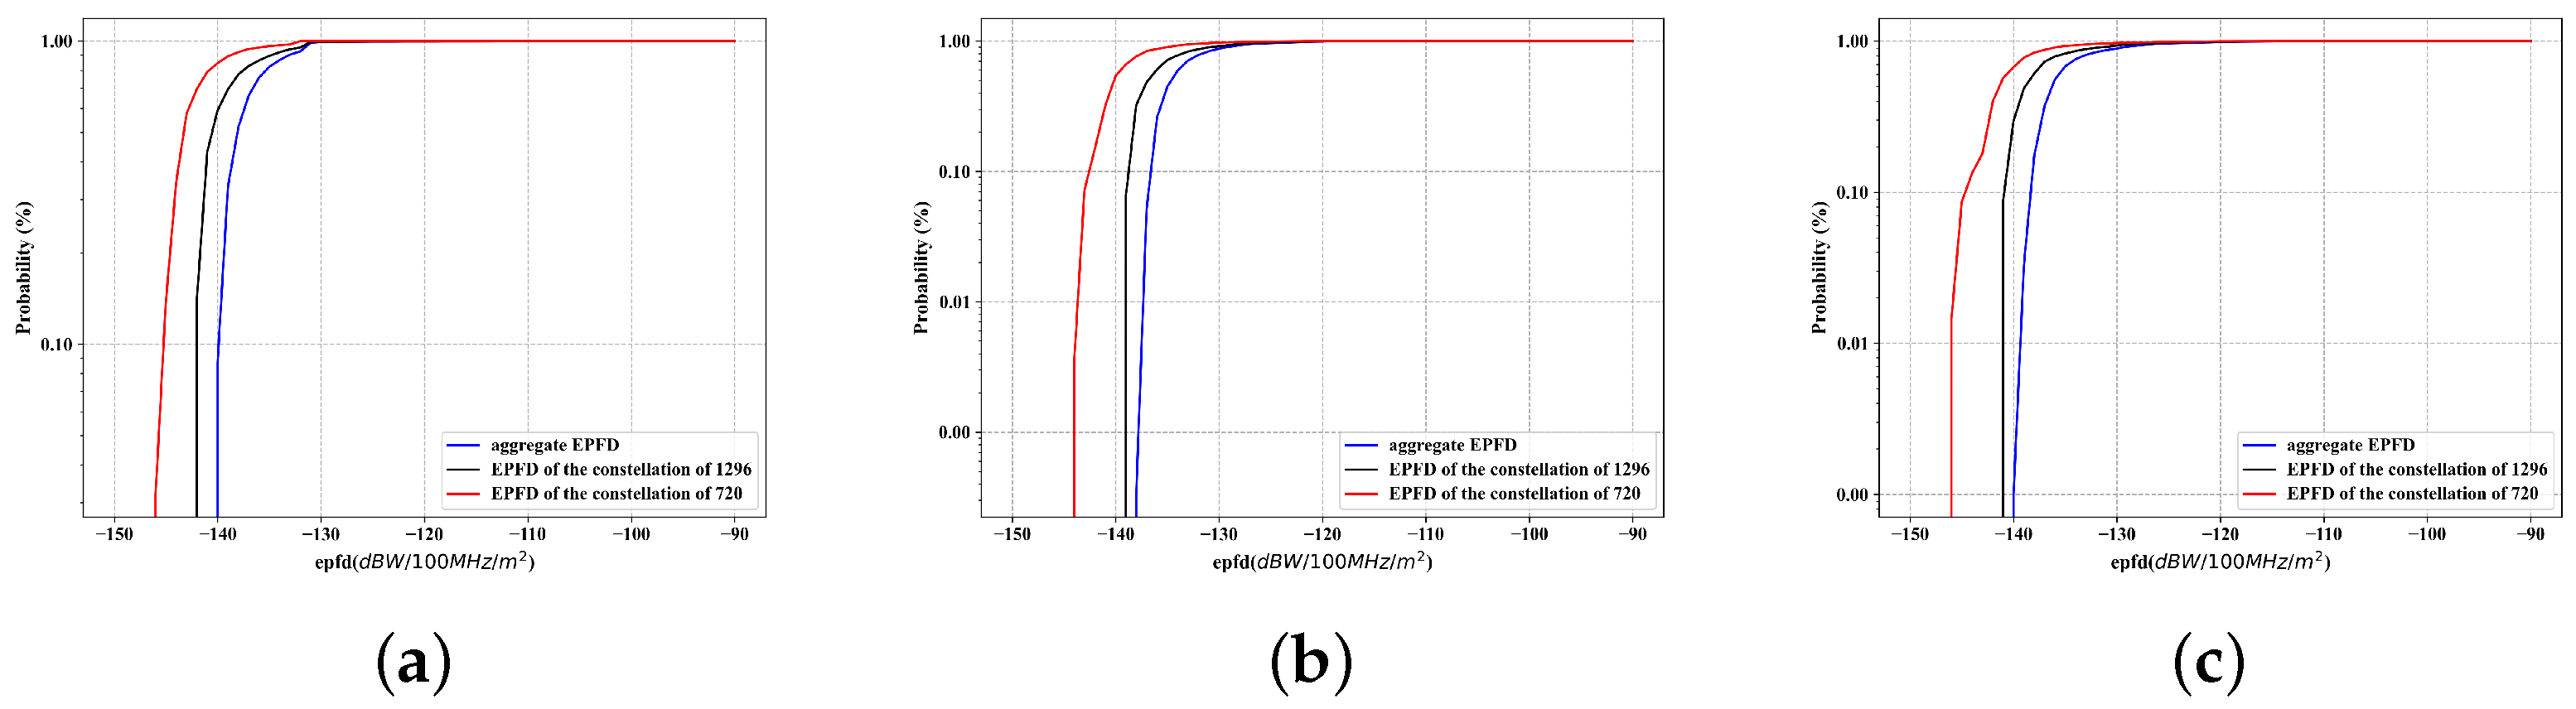
In order to assess the interference of the NGSO constellation with the RAS telescope, the EPFD distribution over the field of view needs to be taken into account. In the figures below, the EPFD distribution of the RAS telescope at different latitudes is given, where the EPFD was averaged over an integration time of 2000 s and a random start time was chosen for the integration. Based on the EPFD calculation method in Section 3, the CDFs of the satellite EIRP and the beam activation probability presented, we obtained the EPFD distribution of the RAS telescope by simulation. Due to the different beam activation strategies, the RAS telescope was subject to different types of interference. The simulation results for the three activation probabilities are shown in Figure 9, Figure 10 and Figure 11, respectively. These diagrams show the EPFD results of an RAS telescope in the northern hemisphere. The angle in the radial direction represents the residual angle of the elevation angle of the telescope, while the angle in the circumferential direction represents its azimuth. The angles were used to determine the orientation of the telescope relative to the horizon.
According to Figure 9, the density of red highlights in the plot increases from left to right. This indicates that as the latitude of the RAS telescope increased, the telescope experienced greater interference. This is likely due to the fact that in a constellation of polar-orbiting satellites, the higher the latitude, the greater the number of visible satellites and thus the stronger the interference with the RAS station.
According to Figure 10, the simulation results were similar to those of Figure 9. The higher the latitude of the RAS telescope, the stronger the interference was. Since the beam activation probability for method 2 was smaller than that of method 1. The simulation results were therefore slightly smaller than those in Figure 9, which was more obvious in the first two subfigures.
According to the simulation results in Figure 11, the interference to the RAS telescope was minimal. The interference to the RAS telescope in the first three subplots was insignificant. This is likely because the beam activation probability of method 3 was closely matched to the world population density distribution, which is lower at many latitudes, thus reducing the interference to the RAS station.
Based on the simulation results of the RAS telescope, it was clear that both the number of satellites and the probability of beam activation had a significant impact on the interference experienced by the RAS telescope. The concentration of satellites in polar orbits led to significant interference to RAS telescopes at higher latitudes. To mitigate this interference, the NGSO constellation beam scheduling strategy should be designed to reduce the probability of beam activation while still meeting user requirements. Careful planning and consideration of system parameters are essential for the successful coexistence of LEO satellite constellations and RASs.

4.5. Aggregate EPFD

Since there are different satellite operators around the globe, the interference to the RAS telescope is the aggregate interference of multiple NGSO systems. Assuming that the interference to the RAS telescope from different NGSO satellites was independent of each other, we obtained the distribution of the aggregate interference to the RAS telescope by the method in Section 3. To analyse the interference of multiple NGSO satellite constellations, we added a constellation of 1296 satellites to the analysis. The constellation configuration is shown in Table 3, the other radiofrequency parameters remained the same as in the previous satellite constellation, and the beam activation probability for both constellations was one at any latitude.
For the whole field of view of the RAS telescope, we selected three directions for the analysis, whose detailed parameters are shown in Table 4. The latitude and longitude of the RAS telescope were 30 degrees and 0 degrees, respectively.
In the previous EPFD simulation of the RAS telescope, the EPFD was calculated only once for all directions of it. In order to obtain the EPFD distribution of the observation directions, several trails were required. The number of trails for the EPFD calculation was 2000 in order to obtain an accurate EPFD distribution. In the following figures, we give the CDF curves of the EPFD of the two satellite constellations, respectively, as well as their aggregate EPFD. The specific results are shown in Figure 12.
Based on the simulation results presented above, we calculated the values of the EPFD at which the percentage of exceeding these values was at most 2 % . The results of this analysis are shown in Table 5.
From the above simulations, the minimum EPFDs of −131.22, −122.15, and −120.80 were larger than the EPFD threshold of −160 for the three constellation configurations, so the NGSO constellations in the Ku band would cause harmful interference to the RAS telescope without any interference protection measures. In order to avoid interference effectively, it was necessary to ensure that the interference at the RAS was further attenuated by approximately 39.2 dB. The following methods of interference avoidance could be adopted:
  • Increase the guard band between the RAS band and the band of the NGSO satellite beams.
  • Use filters with better cut-off characteristics and an amplifier with a better linearity to work in the linear region of amplification as far as possible.
  • Adopt the interference avoidance zone of the RAS telescope, as well as a sharper roll-off antenna of the NGSO satellites.
The above interference avoidance methods can reduce the interference of NGSO systems with RAS telescopes, thus further enabling coexistence between them.

5. Discussion and Conclusions

The spatial distribution of the EIRP in an NGSO satellite is based on the assumption of a uniform distribution of users within the satellite’s coverage area. However, in practice, the distribution of users is often uneven and may vary with longitude. To account for this, it is possible to modify the method presented in this paper to take into account the actual distribution of user resources. The spatial distribution of the EIRP is a function of the latitude and longitude of the satellite, and the probability of beam activation should be defined based on the actual demand for communication resources at a given location. The paper provided three methods for defining user demand, which can be used by satellite operators to determine the beam activation probability for their systems.
For satellite communication systems with beams that are fixed in relation to the satellite, it is not necessary to generate a spatial distribution of the EIRP. In this case, the EIRP distribution of the satellite is constant within its coverage area. The method for calculating the EPFD presented in this paper is also applicable to fixed beams, with the spatial distribution of the satellite’s EIRP replaced by the maximum EIRP of the beam, and the beam activation probability determined by the state of the beam. This would allow the simulation framework presented in the paper to be applied to mainstream NGSO satellite systems.
The method presented in this paper for calculating the aggregate interference of multiple NGSO satellite constellations was based on the assumption that the interference of each constellation was independent of the others. However, in practice, this may not always be the case. The method simplified the calculation of the aggregate interference by dividing the constellation into smaller subconstellations, which allowed for the simulation of very large NGSO systems. While this approach may not fully capture the complex interactions between different NGSO satellite constellations, it can provide a useful approximation and can help to identify potential strategies for mitigating interference.
The distribution of users within the satellite coverage area should be modelled according to the actual demand distribution rather than using a uniform distribution of users, as the actual demand distribution is often characterised by the hotspots in the ground. Multiple NGSO systems often need to coexist with each other, and individual NGSO systems should be designed to avoid interference with other NGSO systems. Interference generated by NGSO satellite systems is therefore often not independent of each other. The efforts in the future should focus on more accurate user modelling and updated methods for calculating the aggregate interference of multiple NGSO systems.
This paper proposed a refined interference simulation framework for the interference of NGSO satellite systems with an RAS telescope. It was also sufficient to provide a validation for NGSO satellite system parameters and support the design of interference avoidance methods. In the future, we will explore the impact of interference avoidance strategies on the interference by using the proposed methods.

Author Contributions

Conceptualization, C.Z., L.S. and Y.H.; methodology, C.Z., S.X., F.S. and L.S.; software, C.Z., H.W. and J.C.; validation, J.C., F.S. and H.W.; formal analysis, C.Z. and H.W.; investigation, C.Z. and J.C.; resources, Y.H. and G.L.; data curation, H.W. and F.S.; writing—original draft preparation, C.Z. and S.X.; writing—review and editing, H.W., J.C., F.S., L.S. and Y.H.; visualization, H.W., F.S. and L.S.; supervision, G.L.; project administration, G.L.; funding acquisition, G.L. and L.S. All authors have read and agreed to the published version of the manuscript.

Funding

This research was funded by the National special support plan for high-level talents (no. WRJH19DH01), National Science Foundation of China (no. U21A20443), and Shanghai Sailing Program (no. 19YF1446400).

Institutional Review Board Statement

Not applicable.

Informed Consent Statement

Not applicable.

Data Availability Statement

The data presented in this study are available on request from the corresponding author.

Conflicts of Interest

The authors declare no conflict of interest.

References

  1. Lin, X.; Cioni, S.; Charbit, G.; Chuberre, N.; Hellsten, S.; Boutillon, J. On the Path to 6G: Embracing the Next Wave of Low Earth Orbit Satellite Access. IEEE Commun. Mag. 2021, 12, 36–42. [Google Scholar] [CrossRef]
  2. Liu, S.; Gao, Z.; Wu, Y.; Ng, D.W.K.; Gao, X.; Wong, K.K.; Chatzinotas, S.; Ottersten, B. LEO satellite constellations for 5G and beyond: How will they reshape vertical domains? IEEE Commun. Mag. 2021, 59, 30–36. [Google Scholar] [CrossRef]
  3. Xie, H.; Zhan, Y.; Zeng, G.; Pan, X. LEO mega-constellations for 6G global coverage: Challenges and opportunities. IEEE Access 2021, 9, 164223–164244. [Google Scholar] [CrossRef]
  4. Kodheli, O.; Guidotti, A.; Vanelli-Coralli, A. Integration of Satellites in 5G through LEO Constellations. In Proceedings of the GLOBECOM 2017—2017 IEEE Global Communications Conference, Singapore, 4–8 December 2017; pp. 1–6. [Google Scholar]
  5. Su, Y.; Liu, Y.; Zhou, Y.; Yuan, J.; Cao, H.; Shi, J. Broadband LEO satellite communications: Architectures and key technologies. IEEE Wirel. Commun. 2019, 26, 55–61. [Google Scholar] [CrossRef]
  6. Oh, D.S.; Lee, S.M.; Ahn, D.S.; Kim, S. A study on the separation distance for frequency sharing between gso network and terrestrial network in Ka band. In Proceedings of the VTC Spring 2008—IEEE Vehicular Technology Conference, Singapore, 11–14 May 2008; pp. 2967–2971. [Google Scholar]
  7. Sharma, S.K.; Chatzinotas, S.; Ottersten, B. In-line interference mitigation techniques for spectral coexistence of GEO and NGEO satellites. Int. J. Satell. Commun. Netw. 2016, 34, 11–39. [Google Scholar] [CrossRef]
  8. Fan, Z.; Dai, Y.; Minn, H. Performance Analysis of Large-Scale NGSO Satellite-Based Radio Astronomy Systems. IEEE Access 2021, 9, 93954–93966. [Google Scholar] [CrossRef]
  9. Dai, Y.; Han, D.; Minn, H. Impacts of large-scale NGSO satellites: RFI and a new paradigm for satellite communications and radio astronomy systems. IEEE Tran. Conmmun. 2018, 67, 7840–7855. [Google Scholar] [CrossRef]
  10. Fan, Z.; Dai, Y.; Minn, H. RFI estimation from Non-GSO satellites based on two line element assisted equivalent power flux density calculations. In Proceedings of the 2018—International Symposium on Electromagnetic Compatibility (EMC EUROPE), Long Beach, CA, USA, 30 July–3 August 2018; pp. 17–21. [Google Scholar]
  11. Barnett, R.J. O3b Non-Geostationary Satellite System: Technical Information to Supplement Schedules—Attachment to Fcc Application sat-loi-20141029-00115; Technical Report SAT-LOI-20160428-00041; Federal Communications Commission: Washington, DC, USA, 2014.
  12. LeoSat. LeoSat Non-Geostationary Satellite System: Technical Information to Supplement Schedules—AttacLeoSathment to Fcc Application sat-PDR-20161115-00112; Technical Report SAT-PDR-20161115-00112; Federal Communications Commission: Washington, DC, USA, 2016.
  13. Mihai, A. Spacex Non-Geostationary Satellite System: Technical Information to Supplement Schedules—Attachment to Fcc Application sat-loa-20161115-00118; Technical Report SAT-LOA-20161115-00118; Federal Communications Commission: Washington, DC, USA, 2016.
  14. Barnett, R.J. OneWeb Non-Geostationary Satellite System: Technical Information to Supplement Schedules—Attachment to Fcc Application sat-loi-20160428-00041; Technical Report SAT-LOI-20160428-00041; Federal Communications Commission: Washington, DC, USA, 2016.
  15. Radio Regulations. 2020. Available online: https://www.itu.int/dms_pub/itu-r/opb/reg/R-REG-RR-2020-ZPF-E.zip (accessed on 1 December 2022).
  16. Umar, R.; Abidin, Z.; Ibrahim, Z.; Rosli, Z.; Noorazlan, N. Selection of radio astronomical observation sites and its dependence on human generated RFI. IOP Publ. Res. Astron. Astrophys. 2014, 14, 241. [Google Scholar] [CrossRef] [Green Version]
  17. Weber, R.; Faye, C.; Biraud, F.; Dansou, J. Spectral detector for interference time blanking using quantized correlator. Astron. Astrophys. Suppl. 1997, 126, 161–167. [Google Scholar] [CrossRef] [Green Version]
  18. Ford, J.M.; Buch, K.D. RFI mitigation techniques in radio astronomy. In Proceedings of the 2014 IEEE Geoscience and Remote Sensing Symposium, Quebec City, QC, Canada, 13–18 July 2014. [Google Scholar]
  19. Jeffs, B.D.; Li, L.; Warnick, K.F. Auxiliary Antenna-Assisted Interference Mitigation for Radio Astronomy Arrays. IEEE Trans. Signal Process. 2005, 53, 439–451. [Google Scholar] [CrossRef]
  20. Abdelgelil, M.E.; Minn, H. Non-linear interference cancellation for radio astronomy receivers with strong RFI. In Proceedings of the GLOBECOM 2017’2017 IEEE Global Communications Conference, Singapore, 4–8 December 2017. [Google Scholar]
  21. Protection Criteria Used for Radio Astronomical Measurements. 2003. Available online: https://www.itu.int/dms_pubrec/itu-r/rec/ra/R-REC-RA.769-2-200305-I!!PDF-E.pdf (accessed on 1 December 2022).
  22. Levels of Data Loss to Radio Astronomy Observations and Percentage-of-Time Criteria Resulting from Degradation by Interference for Frequency Bands Allocated to the Radio Astronomy Service on a Primary Basis. 2015. Available online: https://www.itu.int/dms_pubrec/itu-r/rec/ra/R-REC-RA.1513-2-201503-I!!PDF-E.pdf (accessed on 1 December 2022).
  23. Calculation of Unwanted Emission Levels Produced by a Non-Geostationary Fixed-Satellite Service System at Radio Astronomy Sites. 2003. Available online: https://www.itu.int/dms_pubrec/itu-r/rec/s/R-REC-S.1586-1-200701-I!!PDF-E.pdf (accessed on 1 December 2022).
  24. Reference Radio Astronomy Antenna Pattern to be Used for Compatibility Analyses between Non-GSO Systems and Radio Astronomy Service Stations Based on the Epfd Concept. Available online: https://www.itu.int/dms_pubrec/itu-r/rec/ra/R-REC-RA.1631-0-200305-I!!PDF-E.pdf (accessed on 1 December 2022).
  25. Maximum Permissible Levels of Interference in a Satellite Network (GSO/FSS; Non-GSO/FSS; Non-GSO/MSS Feeder Links) in the Fixed-Satellite Service Caused by Other Codirectional FSS Networks below 30 GHz. 2001. Available online: https://www.itu.int/dms_pubrec/itu-r/rec/s/R-REC-S.1323-2-200209-I!!PDF-E.pdf (accessed on 1 December 2022).
  26. Interference Calculations between Non-Geostationary Mobile-Satellite Service or Radionavigation-Satellite Service Systems and Radio Astronomy Telescope Sites. 2007. Available online: https://www.itu.int/dms_pubrec/itu-r/rec/m/R-REC-M.1583-1-200710-I!!PDF-E.pdf (accessed on 1 December 2022).
  27. Functional Description to Be Used in Developing Software Tools for Determining Conformity of Non-Geostationary-Satellite Orbit Fixed-Satellite Service Systems or Networks with Limits Contained in Article 22 of the Radio Regulations. 2018. Available online: https://www.itu.int/dms_pubrec/itu-r/rec/s/R-REC-S.1503-3-201801-I!!PDF-E.pdf (accessed on 1 December 2022).
  28. Maximum Permissible Levels of Interference in a Satellite Network (GSO/FSS; Non-GSO/FSS; Non-GSO/MSS Feeder Links) in the Fixed-Satellite Service Caused by Other Codirectional FSS Networks below 30 GHz. 2002. Available online: https://www.itu.int/dms_pubrec/itu-r/rec/s/R-REC-S.1528-0-200106-I!!PDF-E.pdf (accessed on 1 December 2022).
Figure 1. Interference from NGSO constellation to RAS telescope.
Applsci 13 01691 g001
Figure 2. The definitions of the elevation and azimuth angles of NGSO satellite.
Applsci 13 01691 g002
Figure 3. The flowchart for evaluating the harmful interference to an RAS telescope from an NGSO satellite system.
Applsci 13 01691 g003
Figure 4. The coverage diagram of an NGSO satellite.
Applsci 13 01691 g004
Figure 5. Time slots allocation of an NGSO satellite.
Applsci 13 01691 g005
Figure 6. The mean EIRP of the satellite: (a) the latitude of the satellite is 0 degrees; (b) the latitude of the satellite is 20 degrees; (c) the latitude of the satellite is 40 degrees; (d) the latitude of the satellite is 60 degrees.
Applsci 13 01691 g006
Figure 7. The CDFs of the EIRP at different azimuth and elevation angles: (a) the latitude of the satellite is 0 degrees; (b) the latitude of the satellite is 20 degrees; (c) the latitude of the satellite is 40 degrees; (d) the latitude of the satellite is 60 degrees.
Applsci 13 01691 g007
Figure 8. Beam scheduling of the NGSO satellite: (a) number of interfering satellites and human population density versus satellite latitude; (b) beam activation probabilities versus satellite latitude.
Applsci 13 01691 g008
Figure 9. The EPFD of an RAS telescope with the beam activation of method 1: (a) the latitude of the RAS telescope is 0 degrees; (b) the latitude of the RAS telescope is 30 degrees; (c) the latitude of the RAS telescope is 60 degrees; (d) the latitude of the RAS telescope is 90 degrees.
Applsci 13 01691 g009
Figure 10. The EPFD of the RAS telescope with the beam activation of method 2: (a) the latitude of the RAS telescope is 0 degrees; (b) the latitude of the RAS telescope is 30 degrees; (c) the latitude of the RAS telescope is 60 degrees; (d) the latitude of the RAS telescope is 90 degrees.
Applsci 13 01691 g010
Figure 11. The EPFD of the RAS telescope with the beam activation of method 3: (a) the latitude of the RAS telescope is 0 degrees; (b) the latitude of the RAS telescope is 30 degrees; (c) the latitude of the RAS telescope is 60 degrees; (d) the latitude of the RAS telescope is 90 degrees.
Applsci 13 01691 g011
Figure 12. The CDF of the EPFD at the RAS telescope with the beam activation of method 1: (a) direction 1; (b) direction 2; (c) direction 3.
Applsci 13 01691 g012
Table 1. Configuration of the NGSO constellation.
Number of SatellitesNumber of PlanesOrbit Inclination (deg)Phase FactorRange of RAAN (deg)
720189090∼180
Table 2. Simulation parameters.
ParameterValueUnit
Orbit height of NGSO satellite1200km
Orbit height of GSO satellite35,678km
Radius of the Earth6371km
Bandwidth of satellite beam250MHz
EIRP34.6dBW
Centre frequency10.725GHz
Diameter of satellite antenna0.4m
Max gain of satellite antenna32dBi
GSO arc avoidance angle18deg
Minimum frequency of RAS telescope10.6GHz
Maximum frequency of RAS telescope10.7GHz
EPFD threshold−160dBW/m 2 /100 MHz
Allowable probability of exceeding EPFD threshold 2 % -
Table 3. Configuration of NGSO constellation.
Number of SatellitesNumber of PlanesOrbit Inclination (deg)Phase FactorRange of RAAN (deg)
12963690180∼180
Table 4. Simulation parameters.
Directions of RASDirection 1Direction 2Direction 3
Elevation angle (deg)1.531.561.5
Azimuth angle (deg)1.51.732.95
Table 5. EPFD values corresponding to 2%.
ConfigurationConstellation of 720Constellation of 1296Constellation of 720 + 1296
EPFD of direction 1 (dBW/100 MHz/m 2 )−132.15−128.62−127.10
EPFD of direction 2 (dBW/100 MHz/m 2 )−131.73−124.22−123.26
EPFD of direction 3 (dBW/100 MHz/m 2 )−131.22−122.15−120.80
Disclaimer/Publisher’s Note: The statements, opinions and data contained in all publications are solely those of the individual author(s) and contributor(s) and not of MDPI and/or the editor(s). MDPI and/or the editor(s) disclaim responsibility for any injury to people or property resulting from any ideas, methods, instructions or products referred to in the content.

