Article

Effects of Entrance Shape and Blast Pocket on Internal Overpressure Mitigation for Protective Tunnels Exposed to External Detonation on the Ground

1
Department of Architectural Engineering, Catholic Kwandong University, Gangneung-si 25601, Republic of Korea
2
Department of Architecture, Kyungmin University, Uijeongbu 11618, Republic of Korea
3
Department of ICT Integrated Ocean Smart Cities Engineering, Dong-A University, Busan 49304, Republic of Korea
*
Author to whom correspondence should be addressed.
Appl. Sci. 2023, 13(3), 1759; https://doi.org/10.3390/app13031759
Submission received: 14 December 2022 / Revised: 13 January 2023 / Accepted: 26 January 2023 / Published: 30 January 2023

Abstract

:
This study presents a numerical analysis to reduce the overpressure inside protective tunnels for external detonations. A three-dimensional computational fluid dynamics model of a tunnel subjected to detonation for a hemispherical charge with a charge weight of 555 kg and a standoff distance of 7.6 m was established, based on a mesh sensitivity study to obtain an optimal element size, stability analysis of overpressure, and validation study to evaluate the accuracy of the numerical results based on Unified Facilities Criteria (UFC) 3-340-02. A parametric analysis was performed using the validated numerical model to investigate the effects of the entrance shape and blast pockets on the reduction in the maximum overpressure. The maximum overpressures were effectively reduced as the slope angle of the tunnel entrance decreased and the length of the blast pocket divided by the tunnel width decreased. An optimized shape of the tunnel was proposed based on the numerical results, where the peak overpressures were reduced by a maximum of 64.5%. This study aims to protect facilities, personnel, and equipment and further reduce construction costs by lowering the overpressure rating of blast valves in protective tunnels.

1. Introduction

Although protective design has been mainly considered for military facilities, it has recently been expanded to the data and backup centers that store various types of government and private data that are built underground, and safety designs for electromagnetic pulse (EMP) shielding, blast resistance, fire-weapon resistance, and chemical, biological (bacterial), and radiological (CBR) protection are in process [1,2].
Mitigation of overpressure inside protective tunnels against external detonations is one of the most recent issues of interest. When blast shock waves generated by an external ground explosion enter a protective tunnel, significant levels of blast overpressures can occur in underground facilities located at considerable distances from the tunnel entrance. This is because the blast waves cannot escape the tunnel while propagating; that is, the blast overpressures decrease with the increase in distance, but they are amplified simultaneously through repeated shock wave reflections from the inside walls of the tunnel [3,4,5,6,7,8,9], thus damaging the internal protective facilities. Accordingly, a protective design for the mitigation of blast overpressures propagating inward from the tunnel entrance is necessary to protect internal underground facilities.
A computer center is a representative underground protection facility, and hundreds of blast valves are installed on walls for ventilation and the protection of internal personnel and equipment against blast overpressures [7,10]. Since the cost of blast valves increases significantly depending on the pressure rating, measures to mitigate blast overpressures are required to reduce the construction cost [1,2].
The incident and reflected overpressures inside a tunnel for external detonation on the ground can be reduced using various methods. Regarding structural materials, it is possible to decrease blast overpressures by installing materials or devices that absorb the blast energy or by inducing the failure of structural components made of materials with lower strength and higher ductility, thereby protecting the primary structural members [11,12,13,14]. An alternative method is to use the geometric shape of the tunnel, which may lead to a more efficient and intuitive overpressure reduction compared to the use of the shock-absorbing materials. Hager and Birnbaum [15] proposed a method to reduce the maximum blast overpressure by diverting some of the blast waves using side chambers arranged along the tunnel. Zhao et al. [16] conducted a study to reduce the maximum blast overpressure through numerical analysis by increasing the volume of a certain space inside the tunnel, which was done by placing an expansion chamber on the tunnel path. As such, these mitigating blast overpressures in consideration of the tunnel shape methods can be effective but are somewhat restricted in terms of the detonation conditions and the shape of the structures. Other various methods for mitigation techniques of blast overpressures were reported by Isaac et al. [17], who summarized geometric designs for shock attenuation using perforated barriers, baffle plates, vertical barriers, smooth double wall duct tube, and so on. These methods can be selectively used for tunnel design compared to those presented in this study.
This study presents a numerical investigation of overpressure mitigation inside protective tunnels subjected to external surface explosions. A method of mitigating internal blast overpressures in protective tunnels using simple geometric techniques of external entrance shape and blast pocket was proposed. A numerical model of a protective tunnel for detonation on the ground was constructed using the commercial computational fluid dynamics (CFD) code Viper::Blast [18]. The tunnel was modeled as a rigid body based on the validation study of Shin et al. [19]. Studies on mesh sensitivity based on the h-refinement strategy [20] and overpressure stability have been performed to demonstrate the reliability of the numerical model. The CFD modeling methodology was validated in comparison with the empirical design chart in United Facilities Criteria (UFC) 3-340-02 [21], which is the U.S. Department of Defense (DoD) guideline for blast-resistant design, associated with blast parameters associated with TNT hemispherical surface bursts, noting that this design chart is based on the work of Kingery and his co-workers [22,23,24]. A simulation matrix for the design parameters related to the tunnel shape was established, and CFD analysis was performed using the validated model of the protective tunnel. An optimal shape of a protective tunnel for blast overpressure mitigation was proposed along with design recommendations based on the numerical results.

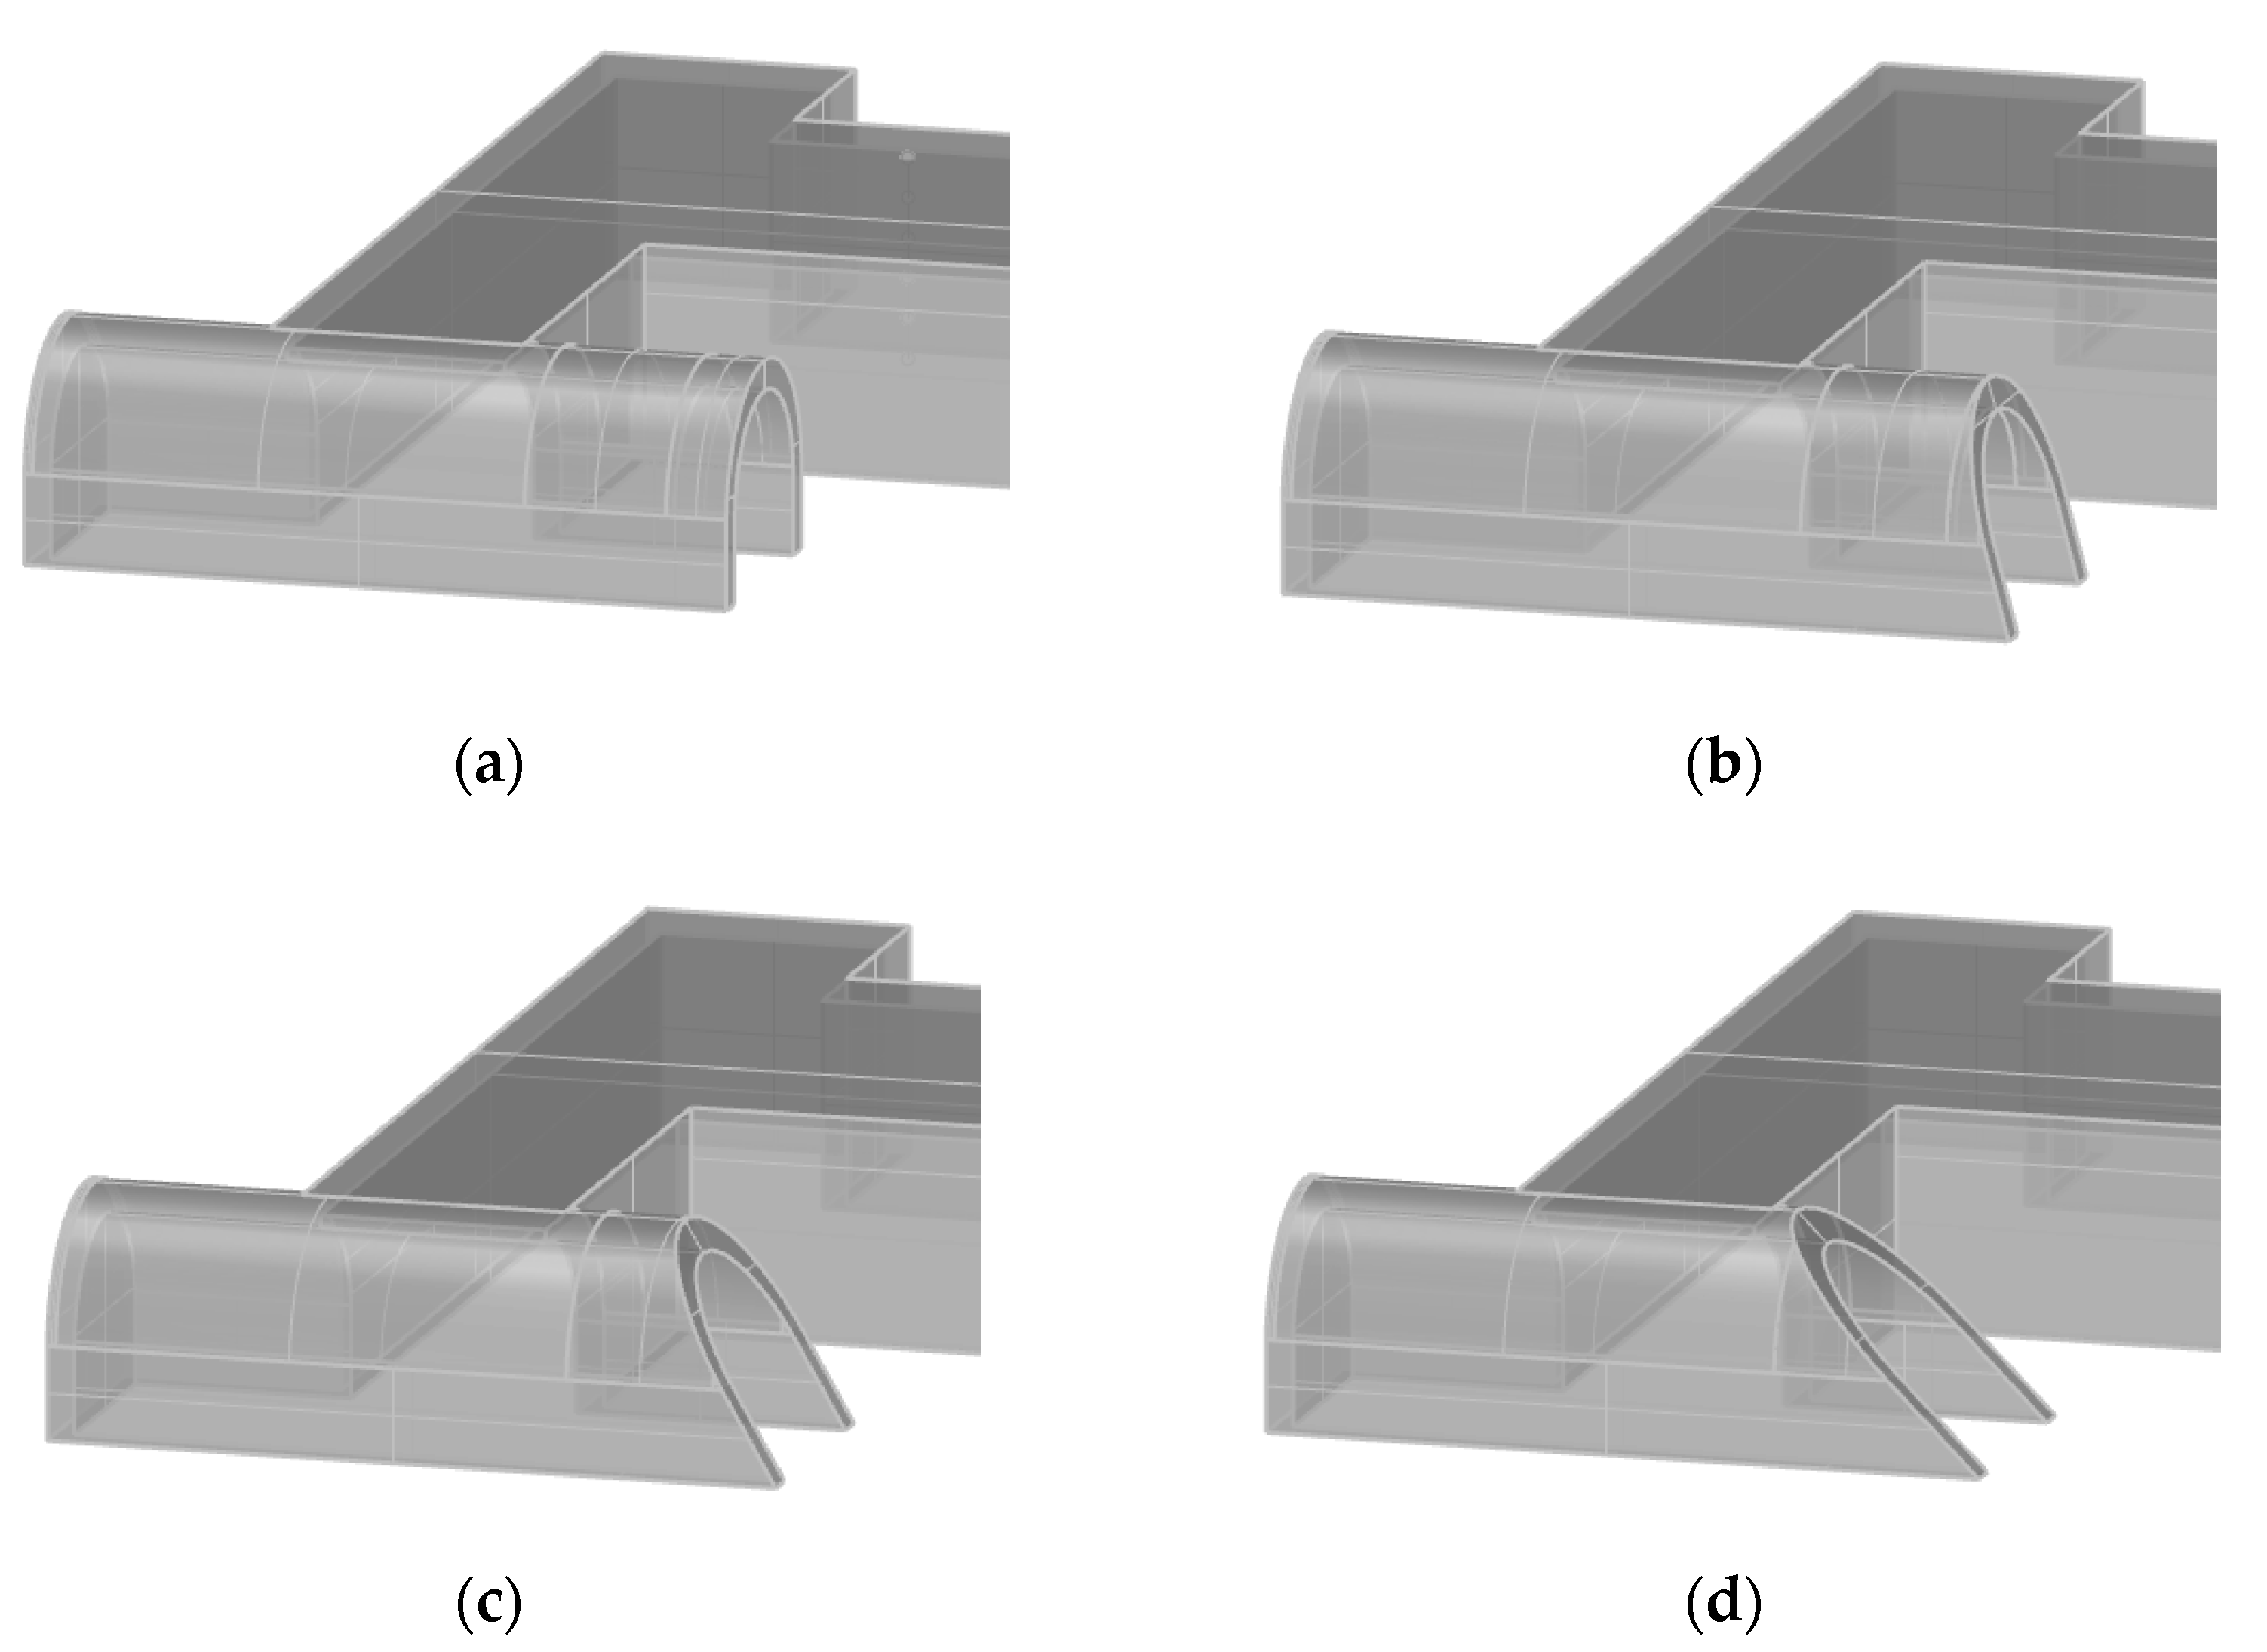
2. Protective Tunnel

2.1. Subsection

A protective tunnel with an arched entrance was considered, as shown in Figure 1. This tunnel consisted of an external tunnel entrance, entry space, and main tunnel. The height of the tunnel was 7.2 m for all of the parts. The wall thickness of the tunnel entrance was 1 m, and the outer and inner widths were 8.9 m and 6.9 m, respectively. The entry space had plane dimensions of 53.4 × 17.7 m and a wall thickness of 0.6 m. For the main tunnel, the wall thickness and length were 0.6 m and 56 m, respectively. This length was considered sufficient when considering the distance at which the blast waves stabilized after entering the main tunnel. Note that the wall thicknesses were required despite the tunnel model being rigid because the model should contain one or more volumes that are defined as watertight objects [18].

2.2. Overpressure Mitigation Inside the Main Tunnel

Two methods to mitigate blast overpressure inside the main tunnel were considered: the slope angle of the external tunnel entrance and blast pocket. Figure 2 shows the blast wave propagation when slope angles are α = 90°, α > 90°, and α < 90° to the bottom of the entrance. The distance from the lower end of the tunnel entrance to the center of detonation does not vary with the slope angle. The surrounding land was not considered, as this study is in the stage of fundamental research, not in the stage of practical application. Consider α = 90°, which is the standard external tunnel entrance. The blast waves start to propagate radially from the center of the detonation. Some of the blast waves enter the tunnel, and the remaining ones propagate out of it. For instance, Shock C enters the tunnel and is reflected from the top of the tunnel, increasing the internal overpressures, P1, whereas Shocks A and B do not affect P1, as shown in Figure 2a. As shown in Figure 2b, when α > 90°, Shocks B and C enter the tunnel, and only Shock A propagates outside it. This indicates that the internal overpressure increases with increasing slope angle α. For α < 90°, all the blast waves A, B, and C propagate out of the tunnel as shown in Figure 2c. Thus, it is expected that the maximum overpressure, P3, would be the smallest compared with the others, P1 and P2. The effect of the slope angle of the external tunnel entrance on the internal overpressures was numerically simulated, and the optimal slope angle for overpressure mitigation was proposed.
The second method to reduce blast overpressures inside the tunnel involves the use of a blast pocket at the corners where the direction of the blast waves changes. Figure 3 shows the blast wave propagations at the corners with and without a blast pocket. The blast waves initially propagate from region 1, are refracted, and then propagate into region 2 owing to the effect of shock-wave diffraction at the corner, as shown in Figure 3a. As shown in Figure 3b, when a blast pocket is applied to the corner, some of the initially propagated blast waves from region 1 (Shock 1) are refracted and propagated into region 2, whereas some (Shock 2) propagate after a while into region 2 via the blast pocket. Since Shock 2 propagates later, after Shock 1, the maximum overpressures at the front of Shock 1 can be mitigated compared to the case without the blast pocket. The effects of the blast pocket on the overpressure mitigation, along with the effects of the slope angle, were studied through numerical analysis.

3. Numerical Modeling

3.1. Blast Loading

Blast loading for an external detonation of a hemispherical charge on the ground was modeled with TNT, which is a common explosive often considered for blast-resistant design, with a charge weight of 555 kg (=1224 lb) and a distance of 7.6 m (=25 ft) from the external tunnel entrance. The charge weight of approximately 555 kg corresponds to the high explosive capacity (TNT equivalent) of the common improvised explosive device (IED) of a full-size sedan (455 kg (1000 lb)) based on the IED chart of explosive device evacuation distances [25], noting that IEDs are a common tool of terror used by non-state actors. A reflection factor of 1.8 was used to address the effect of instantaneous reflection of blast waves from the ground based on Kingery and Bulmash [23]; that is, the weight of the hemispherical charge of 555 kg is virtually identical to a spherical charge of 999 kg.
The blast overpressures from the hemispherical surface burst were defined using a scaled distance, Z (=R/W1/3), where R is the standoff distance from the center of charge, and W is the weight of charge [5,8]. For the considered charge weight, W, and standoff distance, R, the scaled distance, Z, was calculated to be 0.76 m/kg1/3.

3.2. CFD Modeling

The blast overpressures were simulated using a CFD code, Viper::Blast [18], where the numerical methodology was based on [26], and the AUSMDV numerical scheme [27] was used to simulate compressible flow problems. The numerical analysis for the surface detonation of TNT was conducted in two stages, considering the numerical accuracy and computational expense. The early stage of detonation of the combustion products was simulated in the one-dimensional (1D) domain, with radial symmetry until the blast shock waves reached the reflecting boundaries. These 1D data were then remapped into a three-dimensional (3D) domain in which the tunnel was modeled [28,29,30]. This remapping technique is efficient in terms of numerical accuracy and computational cost because it enables the use of a finer mesh for 1D analysis and a relatively larger mesh for 3D analysis.
The 1D model comprised a high TNT explosive and the surrounding air. Air was modeled using the ideal gas equation of state (EOS), and the TNT was modeled using the Jones–Wilkins–Lee (JWL) EOS [19,31]:
P = A 1 w R 1 V e R 1 V + B 1 w R 2 V e R 2 V + w E 0 V
where P is the blast overpressure; A, B, R1, R2, and w are the JWL constants; V is the relative volume; and, E0 is the specific internal energy. The values of the JWL EOS parameters were obtained from the LLNL Explosives Handbook in [32], as listed in Table 1. Afterburning was not modeled because it may not be realized due to the incomplete mixing of fuel with the available oxygen and a temperature less than the ignition temperature of the fuels (<1800 K) that makes up TNT [33].
Air was modeled in 3D to completely envelop the tunnel. The lower boundary of the air domain was the ground surface and was thus defined as a perfectly reflecting boundary. All other boundaries were defined using transmitting boundaries, such that no shock wave reflection occurred at these boundaries. The tunnel was modeled as a rigid body, and all surfaces of the model fully reflected the blast waves, which enabled complex behaviors of blast waves inside the tunnel, including repeated shock wave reflection and diffraction [19,34,35]. Modeling the tunnel as a rigid body ignores the interaction with structures, and there is a possibility that the blast overpressures reflected from the rigid structure may be calculated somewhat conservatively. However, the differences between the results for the rigid and deformable tunnels were considered insignificant because blast overpressures numerically calculated assuming the rigid body structures has been experimentally validated in many past studies [19,36]. Also, the numerical results were herein validated in comparison with empirical design charts in UFC 3-340-02 [21], superseding TM 5-1300 [36,37].

4. Validation of Numerical Model

A study for validation [38,39] was conducted to confirm the reliability of the numerical model of the protective tunnel, as previously described. This study deals with three parts: (1) a mesh sensitivity study to determine the converged cell size of the numerical model, (2) a stability analysis for overpressures inside the main tunnel, and (3) an evaluation of the accuracy of overpressures calculated using the converged cell size based on the design charts in UFC 3-340-02 [21]. Note that impulses for overpressures were not considered, as this study is focused on reducing the maximum overpressures on blast valves, and the level of the impulses do not affect the performance of blast valves [1,2].

4.1. Mesh Sensitivity Study

A mesh sensitivity study was achieved based on the h-refinement strategy [20], in essence, numerical calculations were considered converged when the results obtained using a mesh size by a factor of two changed by less than 10%. Three cell sizes of 100 mm, 200 mm, and 400 mm were considered. The overpressures were monitored at forty-two locations, G1 to G42, in the main tunnel, as shown in Figure 4. Monitoring locations G1 to G7 were placed at the entrance of the main tunnel, where these locations were equally spaced horizontally and vertically; the spacings were set to 1.925 m and 2.2 m, respectively. The inner width and height of the main tunnel were 7.7 m and 6.6 m, respectively. Other monitoring locations were made similarly at spacings of 5 m along the longitudinal direction, as shown in Figure 2b.
Figure 5 shows the results of overpressure histories calculated at forty-two monitoring locations for the mesh size of 100 mm. For monitoring locations, G1 to G7, the maximum overpressures were observed at the first peaks, namely near the shock front at approximately t = 0.13 s, as shown in Figure 5a. The overpressures thereafter fluctuate continuously due to repeated shock-wave reflections by the inside walls and diffractions at the corners. Similar observations for other monitoring locations were made, as shown in Figure 3b–f. The overpressure histories simulated for the cell sizes of 200 mm and 400 mm were similar to those for the 100-mm cell size, and these are not presented in this study.
Figure 6 shows the propagation of blast waves simulated using the cell size of 100 mm for the protective tunnel, where the upper and lower bounds in the overpressure range were fixed as 180 kPa and 48 kPa, respectively, to efficiently show the overpressure distribution as the blast waves propagate. The ground burst-induced blast waves enter the external tunnel entrance and propagate to the main tunnel through the entry space. Complex effects, including reflections and diffractions, were simulated effectively, while the blast waves propagate inside the tunnel. The diffractions with a vortex formed are observed at the first corner at t = 51 ms and the second at t = 113 ms, as shown in Figure 4a,b, respectively. Mach stems are also identified distinctly where reflected blast waves merge with incident shocks at t = 161 ms and 211 ms, as shown in Figure 4c,d, respectively.
The results of the mesh sensitivity study for cell sizes of 100 mm, 200 mm, and 400 mm are shown in Figure 7, where the values of the overpressures at the center on the ground at each distance from the entrance of the main tunnel, namely monitoring locations G2, G9, G16, G23, G30, and G37 (distances = 0 m, 5 m, 10 m, 15 m, 20 m, and 25 m, respectively), were used to evaluate the mesh sensitivity. For monitoring location G2 (distance = 0 m), the overall behaviors of the overpressures over time were similar for the three cell sizes. The maximum overpressures calculated for cell sizes of 100 mm and 200 mm were similar, with differences of less than 10%, whereas those for the 400-mm mesh appeared somewhat smaller. This was also observed for the other monitoring locations.
The maximum overpressures, PM, obtained in Figure 7 by varying the distance from the main tunnel entrance for cell sizes of 100 mm, 200 mm, and 400 mm are shown in Figure 8, and the differences in the maximum overpressures for cell sizes of 100 mm and 200 mm and those of 200 mm and 400 mm are shown in Figure 9. As shown in this figure, the results for cell sizes of 200 mm and 400 mm do not converge, with differences ranging from approximately 10% to 24%. For cell sizes of 100 mm and 200 mm, mesh converged results were obtained with differences of less than 10% for all distances. Based on the mesh sensitivity study, to obtain mesh convergence in the considered locations of the main tunnel, the cell size is recommended to be less than 200 mm, noting that the mesh sensitivity would be dependent on the size of the given tunnel model. The optimal mesh size for the numerical model of the protective tunnel was considered to be between 100 mm and 200 mm, considering the numerical accuracy and computational expense. The results of the mesh sensitivity analysis are listed in Table 2.

4.2. Stability of Blast Overpressures

The blast overpressures inside the considered protective tunnel can be unstable owing to the effects of shock wave reflection and diffraction while propagating through the tunnel. Since the aim of this study is the main tunnel’s overpressures, which can be substantially unstable owing to shock wave reflection and diffraction, especially at the entrance of the main tunnel, it is necessary to determine the distance from the entrance where the overpressures are stabilized. The locations where the differences between the seven overpressures at each distance were smaller than approximately 10% were considered to be the sections where the overpressures were stabilized.
The results of the stability analysis of the overpressure in the main tunnel are shown in Figure 10, which shows the maximum overpressures, PM, at seven monitoring locations as a function of the monitoring location and distance. The locations P1 to P7 correspond to the seven monitoring locations for each distance, that is, G1 to G7 for distance = 0 m and G8 to G14 at distance = 5 m. For distances of 0 m, 5 m, 10 m, and 15 m, the overpressures fluctuate significantly, indicating the zone where the overpressures are unstable. The overpressures were considered to be stabilized at distances of 20 m, 25 m, and 30 m. The overpressures in the main tunnel for the blast analysis presented in Section 5 were evaluated at distances greater than 20 m.

4.3. Accuracy of Numerical Calculations

The accuracy of the numerical model was assessed at the external tunnel entrance facing the outside based on the empirical design charts in UFC 3-340-02 [21]. Four cell sizes were considered: 50 mm, 100 mm, 200 mm, and 400 mm. The overpressures were monitored at locations GL, GC, and GR, as shown in Figure 11. The calculated overpressures were considered acceptable when the differences in the cell size were less than 10%, as in the mesh sensitivity study for the main tunnel.
The overpressure histories calculated at the monitoring location GC for the four cell sizes are shown in Figure 12. The maximum overpressures at the external tunnel entrance appeared to converge for the 50-mm and 100-mm meshes (1.76 MPa and 1.60 MPa, respectively). In addition, these two mesh sizes led to differences of 4% and 6%, respectively, compared with that (1.70 MPa) estimated using the UFC 3-340-02 chart. Therefore, the numerical model was considered to be validated.

4.4. Discussion

A validation study was performed to demonstrate the robustness of the proposed numerical model for a protective tunnel. Mesh convergence for the overpressures in the main tunnel was obtained for cell sizes of 100 mm and 200 mm. These overpressures were stabilized at distances greater than 20 m from the entrance of the main tunnel. For the external entrance of the tunnel facing the outside, the overpressures converged for cell sizes of 50 mm and 100 mm, and the accuracies of the numerical predictions were validated using empirical charts in UFC 3-340-02. A blast analysis was performed using a cell size of 100 mm and a distance of greater than 20 m from the main tunnel entrance to investigate the effects of the slope angle at the external tunnel entrance and blast pocket on the overpressure mitigation in the main tunnel.

5. Blast Analysis

5.1. Blast Scenario

A CFD analysis was performed using the validated numerical model of the protective tunnel to investigate the effects of the slope angle of the external tunnel entrance and blast pocket on overpressure mitigation, as described in Section 4. The blast scenario was established considering external entrance slope angles, αs, of 90°, 75°, 60°, and 45° and the ratios of blast pocket length to tunnel width, Lb/Lw, of 0.5, 1.0, 1.5, and 2.0, respectively. The shape of the external tunnel entrance was arched for all the models. The simulation matrix for the parametric study is presented in Table 3, where a total of seventeen cases were considered. Model Arch-90-0 is the original model of the protective tunnel used in Section 4 for model validation and has a slope angle, αs, of 90° and no blast pocket (Lb/Lw = 0). The maximum overpressures were monitored at a point 55 m inward from the entrance of the main tunnel, as shown in Figure 13; that is, the monitoring location was placed far enough away from the main tunnel entrance based on the stability analysis presented in Section 4.2.
The shapes of the external tunnel entrance varying the slope angle for Lb/Lw = 1.0 are shown in Figure 14, and these are the same for Lb/Lw = 0.5 and 1.5. The shapes of the tunnel model varying the ratio of blast pocket length, Lb, to the tunnel width, Lw, are shown in Figure 11. Three blast pockets were arranged where the direction of the blast waves changes; that is, at the corners, as shown in Figure 15b–d. Figure 16 shows the length of the blast pocket, Lb, and the tunnel width, Lw, for the blast pocket A with a ratio of 0.5.

5.2. Numerical Results

The overpressure histories calculated by varying the slope angle of the external tunnel entrance for ratios of the blast pocket, Lb/Lw, of 0.5, 1.0, 1.5, and 2.0, are shown in Figure 17, where the original model (Arc-90-0) was included for comparison. The overpressures fluctuate with time owing to the repeated reflection and diffraction of the shock waves. The maximum overpressure, PM, was identified among the first few peaks in most cases. They were effectively reduced compared to those of the original one because of the effects of the external entrance slope and blast pocket. Similar observations were made for the overpressure histories calculated by varying the blast-pocket ratio for slope angles, αs, of 90°, 75°, 60°, and 45°, as shown in Figure 18. The results of the maximum overpressure, PM, for all the parametric cases are summarized in Table 4. Model Arc-60-05 showed the greatest overpressure mitigation; that is, the maximum overpressure, PM, for the model was estimated to be 8.98 KPa and was reduced by 64.5% compared to the original (25.32 kPa). A more detailed discussion of the numerical results is presented in the following section.

6. Discussion on Blast Overpressure Reduction

The results obtained in the numerical analysis presented in the previous section are discussed in more detail regarding the influence of the slope angle at the external tunnel entrance and the blast pocket ratio on the mitigation of the maximum overpressure, PM. An optimized shape of the protective tunnel to effectively reduce the maximum overpressure, PM, was proposed based on these discussions.

6.1. Effect of the External Entrance Slope

Figure 19a shows the relationship between the maximum overpressures, PM, and slope angle, αs, for the considered blast-pocket ratios, Lb/Lw. The maximum overpressures, PM, tend to diminish with the decrease in the angle, αs, because the inclined entrance, compared to the vertical entrance, relieves the overpressures as much as the sloping portion. The maximum overpressures, PM, were the smallest at an angle, αs, of 60° for the ratios, Lb/Lw, of 0.5, 1.0, and 2.0, and αs of 45° for Lb/Lw of 1.5. The angles, αs, for the lowest points of the maximum overpressures, PM, differ slightly according to the ratios, Lb/Lw, because of the complex propagation of shock waves inside the tunnel. The overpressure mitigations with angle, αs, are shown in Figure 19b. The maximum overpressure, PM, was reduced by up to 64.5% for αs = 60° and Lb/Lw = 0.5, compared to the original model.
Figure 20a,b show the overpressure distributions for Model Arc-90-0 (original) at t = 73 ms and Model Arc-60-05 at t = 77 ms, respectively. Evidently, the overpressures for Model Arc-60-05 at the shock front and Mach stem were slightly smaller than those for the original because some of the shock waves propagated inward via the first blast pocket. This is similarly observed for the second blast pocket, as shown in Figure 20c,d. The blast overpressure reductions for all the numerical models are listed in Table 5.

6.2. Effect of Blast Pocket

The maximum overpressures, PM, and overpressure reduction as a function of the blast-pocket ratios Lb/Lw are shown in Figure 21a,b, respectively. The maximum overpressures, PM, tend to increase with increasing the ratio, Lb/Lw. For the considered ratios of the blast pocket, the smallest ratio, Lb/Lw, of 0.5 led to the greatest reduction in the maximum overpressure, PM, compared to the original model for all cases. For Lb/Lw of 0.5 and αs = 90°, PM occurred at the second peak (approximately t = 0.26 s) whereas PM for Lb/Lw of 1.0, 1.5, and 2.0 was observed at the fourth, third, and third peaks, respectively, (t = 0.42. 0.35, 0.36 s), as shown in Figure 18a. This indicates that PM for Lb/Lw of 0.5 was affected by blast waves near the shock front, but those for Lb/Lw of 1.0, 1.5, and 2.0 was by blast waves, following the shock front, that were reflected, diffracted, and amplified by the internal walls of the blast pockets. Similar observations were made for αs = 75°, 60°, and 45°, as shown in Figure 18b–d.
Figure 22 shows the overpressure distributions simulated for the original model (Arc-90-0) and Model Arc-60-05 at t = 120 ms. It is observed that for the identical ratio, Lb/Lw, of 0.5, Model Arc-60-05 with an angle, αs, of 60° resulted in slightly smaller overpressures at the front of the shock waves than the original model with the vertical tunnel entrance (αs = 90).

6.3. Limitation of This Study

Efforts to reduce the maximum overpressures inside protective tunnels are important for protecting facilities, personnel, and equipment located deep inside the tunnel. In addition, the construction cost can be reduced significantly depending on the pressure level of the blast valves. As this study is limited to the given conditions of detonation and structure, further study needs to be carried out in consideration of different charge types and weights, types of detonation (e.g., free-air burst, surface burst), various standoff distances, other types of protective tunnels, different tunnel widths and heights, dissimilar shapes of the tunnel entrance and blast pocket, and other modeling strategies for overpressure mitigation.

7. Conclusions

This study presented a numerical investigation of protective tunnels to propose a tunnel model for mitigating maximum internal overpressures. A computational fluid dynamics model of the protective tunnel was developed to predict the maximum overpressures. The effects of the slope angle of the external tunnel entrance and blast pockets were examined through a parametric study to reduce the maximum blast overpressure. The key findings and recommendations are as follows.
  • A numerical model to reasonably predict the internal overpressures of a protective tunnel subjected to an external detonation on the ground was established using a robust computational fluid dynamics code, Viper::Blast, which is specific to blast analysis. This numerical model was validated based on UFC 3-340-02 design charts, which are typically used for the determination of blast loading
  • The overpressures in the main tunnel stabilized at distances of 20 m and greater from the entrance. They were unstable at smaller distances because of repeated reflection and diffraction as the shock waves entered the entrance.
  • Cell sizes of 200 mm and smaller are recommended for obtaining mesh-converged results for the overpressures in the main tunnel of a given type of protective tunnel. For the external tunnel entrance facing the outside, the cell sizes to predict the overpressures should be less than 100 mm for a given standoff distance and charge weight.
  • The maximum overpressures in the tunnel tended to decrease with a decrease in the slope angle of the external tunnel entrance and blast pocket ratio. The maximum overpressures were reduced efficiently by up to 64.5% for an entrance angle of 60° and a blast pocket length of 0.5 times the tunnel width. It should be noted that increasing the blast pocket length can increase the maximum blast overpressures inside the tunnel due to the effect of shock wave reflection by the blast pocket walls with the increased surface areas.

Author Contributions

Conceptualization, J.S., S.P. and D.-K.K.; methodology, J.S. and S.P.; software, J.S.; validation, S.P. and D.-K.K.; formal analysis, J.S. and S.P.; investigation, J.S. and D.-K.K.; data curation, S.P.; writing—original draft preparation, J.S.; writing—review and editing, S.P. and D.-K.K.; visualization, S.P.; supervision, D.-K.K.; project administration, J.S. and D.-K.K.; funding acquisition, J.S. and S.P. All authors have read and agreed to the published version of the manuscript.

Funding

This work was supported by the Korea Agency for Infrastructure Technology Advancement (KAIA) grant funded by the Ministry of Land, Infrastructure and Transport (Grant 22CTAP-C163526-02).

Institutional Review Board Statement

Not applicable.

Informed Consent Statement

Not applicable.

Data Availability Statement

Data will be made available on request.

Acknowledgments

The authors gratefully acknowledge the Korea Agency for Infrastructure Technology Advancement (KAIA) grant funded by the Ministry of Land, Infrastructure and Transport (Grant 22CTAP-C163526-02).

Conflicts of Interest

The authors declare no conflict interest.

References

  1. Pang, S.; Shin, J.; Kim, W. Evaluation of pressure effects on blast valves for facility protection of underground computing center. J. Korean Soc. Geotherm. Hydrothermal Energy 2018, 14, 21–28. [Google Scholar]
  2. Pang, S.; Shin, J. Blast overpressure evaluation for blast valves in protective tunnels with Rectangular-shaped tunnel entrances. J. Korean Soc. Geotherm. Hydrothermal Energy 2021, 17, 79–90. [Google Scholar]
  3. Kinney, G.F. Explosive Shocks in Air; The Macmillan Company: New York, NY, USA, 1962. [Google Scholar]
  4. Kinney, G.F.; Graham, K.J. Explosive Shocks in Air, 2nd ed.; Springer: New York, NY, USA, 1985. [Google Scholar]
  5. Smith, P.D.; Hetherington, J.G. Blast and Ballistic Loading of Structures; Butterworth-Heinemann: Boston, MA, USA, 1994. [Google Scholar]
  6. Federal Emergency Management Agency (FEMA). Reference Manual to Mitigate Potential Terrorist Attacks Against Buildings (FEMA-426); Federal Emergency Management Agency: Washington, DC, USA, 2003.
  7. Krauthammer, T. Modern Protective Structures; CRC Press: Boca Raton, FL, USA, 2008. [Google Scholar]
  8. Dusenberry, D.O. (Ed.) Handbook for Blast-Resistant Design of Buildings; Wiley: Hoboken, NJ, USA, 2010. [Google Scholar]
  9. Shin, J.; Whittaker, A.S. Blast wave clearing for detonations of high explosives. J. Struct. Eng. 2019, 145, 04019049. [Google Scholar] [CrossRef]
  10. ASCE. Design of Structures to Resist Nuclear Weapons Effects, Manual 42; American Society of Civil Engineers: New York, NY, USA, 1985. [Google Scholar]
  11. Mullin, M.J. Finite Element Modeling of Energy-Absorbing Materials in Blast-Loaded Structures. Master’s Thesis, University of Nevada, Las Vegas, NV, USA, 2002. [Google Scholar]
  12. Yang, M.; Qiao, P. 4—High energy absorbing materials for blast resistant design. Blast Protection of Civil Infrastructures and Vehicles Using Composites. In Blast Protection of Civil Infrastructures and Vehicles Using Composites; Elsevier: Amsterdam, The Netherlands, 2010; pp. 88–119. [Google Scholar]
  13. Rahmani, M.; Oskouei, A.N.; Petrudi, A.M. Experimental and numerical study of the blast wave decrease using sandwich panel by granular materials core. Def. Technol. 2021, 17, 1660–1670. [Google Scholar] [CrossRef]
  14. Al-Rifaie, H.; Studzinski, R.; Gajewski, T.; Malendowski, M.; Sumelka, W.; Sielicki, P.W. A new blast absorbing sandwich panel with unconnected corrugated layers—Numerical study. Energies 2021, 14, 214. [Google Scholar] [CrossRef]
  15. Hager, K.; Birnbaum, N. Calculation of the internal blast pressures for tunnel magazine tests. In Proceedings of the 27th DoD Explosives Safety Seminar, Las Vegas, NV, USA, 22–26 August 1996. [Google Scholar]
  16. Zhao, B.I.; Cui, C.Y.; Chen, J.P.; Wang, Y. Numerical simulation about the effect of tunnel expansion chamber on the shock wave attenuation. In Proceedings of the 4th International Conference on Computer, Mechatronics, Control and Electronic Engineering (ICCMCEE 2015), Dordrecht, The Netherlands, 29–31 August 2014. [Google Scholar]
  17. Isaac, O.S.; Alshammari, O.G.; Pickering, E.G.; Clarke, S.D.; Rigby, S.E. Blast wave interaction with structures-an overview. Int. J. Prot. Struct. 2022, 1–47. [Google Scholar] [CrossRef]
  18. Stirling, C.G. Viper Blast User Manual and Examples for Version 1.20.0, Commercial in Confidence; Stirling Simulation Services Limited: Glasgow, UK, 2021. [Google Scholar]
  19. Shin, J.; Whittaker, A.S.; Cormie, D.; Wilkinson, W. Numerical modeling of close-in detonations of high explosives. Eng. Struct. 2014, 81, 88–97. [Google Scholar] [CrossRef]
  20. Cook, R.D. Concepts and Applications of Finite Element Analysis, 4th ed.; Wiley: New York, NY, USA, 2002. [Google Scholar]
  21. Department of Defense (DoD). Unified Facilities Criteria (UFC): Structures to Resist the Effects of Accidental Explosions (UFC 3-340-02); Departments of Defense: Washington, DC, USA, 2008.
  22. Kingery, C.N. Air Blast Parameters versus Distance for Hemispherical TNT Surface Bursts; Report No. 1344; Ballistic Research Laboratories: Aberdeen, MD, USA, 1966. [Google Scholar]
  23. Kingery, C.N.; Bulmash, G. Airblast Parameters from TNT Spherical Air Burst and Hemispherical Surface Burst; Report ARBRL-TR-02555; US Army Ballastic Research Laboratory: Aberdeen, MD, USA, 1984. [Google Scholar]
  24. Kingery, C.N.; Pannill, B.F. Peak Overpressure vs Scaled Distance for TNT Surface Bursts (Hemispherical Charges); BRL Memorandum Report 1518; Ballistic Research Laboratories: Aberdeen, MD, USA, 1964. [Google Scholar]
  25. US Army Training and Doctrine Command. A Military Guide to Terrorism in the Twenty-First Century: U.S. Army TRADOC G2 Handbook No. 1 (Version 5.0); US Department of the Army: Fort Leavenworth, KS, USA, 2007. [Google Scholar]
  26. Rose, T.A. An Approach to the Evaluation of Blast Loads on Finite and Semi-Infinite Structures. Ph.D. Thesis, Cranfield University, Swindon, UK, 2001. [Google Scholar]
  27. Wada, Y.; Liou, M.S. A Flux Splitting Scheme with High Resolution and Robustness for Discontinuities; NASA Technical Memorandum 106452; ICOMP-93-50; AIAA-94-0083. In Proceedings of the 32nd Aerospace Sciences Meeting and Exhibit, Reno, NV, USA, 10–13 January 1994. [Google Scholar]
  28. ANSYS. Remapping Tutorial, Revision 4.3; ANSYS Inc.: Canonsburg, PA, USA, 2005. [Google Scholar]
  29. Shin, J.; Lee, K. A numerical analysis for blast pressure and impulse from free-air burst. J. Korean Soc. Steel Constr. 2016, 28, 271–280. [Google Scholar] [CrossRef] [Green Version]
  30. Shim, K.B.; Lee, T.S. Design of frame type blast door reflecting explosion proof test. J. Korean Soc. Steel Constr. 2020, 32, 67–74. [Google Scholar] [CrossRef]
  31. Fickett, W.; Davis, W.C. Detonation: Theory and Experiment; Dover Publications Inc.: Mineola, NY, USA, 1979. [Google Scholar]
  32. Dobratz, B.M.; Crawford, P.C. LLNL Explosive Handbook: Properties of Chemical Explosives and Explosive Simulants; Report No.: UCRL-52997; Lawrence Livermore National Laboratory: Livermore, CA, USA, 1985. [Google Scholar]
  33. Shin, J.; Whittaker, A.S.; Cormie, D. Incident and normally reflected overpressure and impulse for detonations of spherical high explosives in free air. J. Struct. Eng. 2015, 141, 04015057. [Google Scholar] [CrossRef]
  34. Fedorov, A.V.; Kratova, Y.V.; Khmel, T.A. Numerical Study of Shock-Wave Diffraction in Variable-Section Channels in Gas Suspensions. Combust. Explos. Shock Waves 2008, 44, 76–85. [Google Scholar] [CrossRef]
  35. Skews, B.; Law, C.; Muritala, A.; Bode, S. Shear layer behavior resulting from shock wave diffraction. Exp. Fluids 2012, 52, 417–424. [Google Scholar] [CrossRef]
  36. Departments of the Army, the Navy and the Air Force. Structures to Resist the Effects of Accidental Explosions (with Addenda); Army Technical Manual (TM 5-1300), Navy Publication (NAVFAC P-397), Air Force Manual (AFM 88-22); Departments of the Army, the Navy and the Air Force: Washington, DC, USA, 1969.
  37. Departments of the Army, the Navy and the Air Force. Structures to Resist the Effects of Accidental Explosions (with Addenda); Army Technical Manual (TM 5-1300), Navy Publication (NAVFAC P-397), Air Force Manual (AFM 88-22), Revision 1; Departments of the Army, the Navy and the Air Force: Washington, DC, USA, 1990.
  38. ASME. Guide for Verification and Validation in Computational Solid Mechanics; American Society of Mechanical Engineers: New York, NY, USA, 2006. [Google Scholar]
  39. Shin, J.; Whittaker, A.S.; Cormie, D.; Aref, A.J. Verification and validation of a CFD code for modeling detonations of high explosives. In Proceedings of the 16th International Symposium for the Interaction of the Effects of Munitions with Structures. University of Florida, Gainesville, FL, USA, 9–13 November 2015. [Google Scholar]
Figure 1. Protective tunnel.
Applsci 13 01759 g001
Figure 2. Blast wave propagation varying angle of the entrance slope. (a) α = 90° (original shape); (b) α > 90°; (c) α < 90°.
Applsci 13 01759 g002aApplsci 13 01759 g002b
Figure 3. Blast wave propagations at corners with and without blast pocket. (a) No blast pocket; (b) With blast pocket.
Applsci 13 01759 g003
Figure 4. Monitoring locations inside the protective tunnel. (a) Entrance of main tunnel; (b) Along the main tunnel.
Applsci 13 01759 g004
Figure 5. Overpressure histories for monitoring locations G1 to G42 and mesh size = 100 mm. (a) G1 to G7; (b) G8 to G14; (c) G15 to G21; (d) G22 to G28; (e) G29 to G35; (f) G36 to G42.
Applsci 13 01759 g005
Figure 6. Blast wave propagation in the original protective tunnel for cell size = 100 mm. (a) t = 51 ms; (b) t = 113 ms; (c) t = 161 ms; (d) t = 211 ms.
Applsci 13 01759 g006
Figure 7. Overpressure histories depending on mesh sizes. (a) G2 (distance = 0 m); (b) G9 (distance = 5 m); (c) G16 (distance = 10 m); (d) G23 (distance = 15 m); (e) G30 (distance = 20 m); (f) G37 (distance = 25 m).
Applsci 13 01759 g007
Figure 8. Maximum overpressures by varying distances for cell sizes of 100 mm, 200 mm, and 400 mm.
Applsci 13 01759 g008
Figure 9. Maximum overpressure differences versus distance according to cell sizes.
Applsci 13 01759 g009
Figure 10. Stability of overpressure versus distance from the entrance of main tunnel; cell size = 100 mm.
Applsci 13 01759 g010
Figure 11. Monitoring locations at the external tunnel entrance for evaluation of numerical accuracy.
Applsci 13 01759 g011
Figure 12. Validation of numerical results in comparison to design charts in UFC 3-340-02.
Applsci 13 01759 g012
Figure 13. Monitoring location in the main tunnel.
Applsci 13 01759 g013
Figure 14. Shapes of tunnel entrance for different entrance slope for Lb/Lw = 1.0. (a) αs = 90° (original); (b) αs = 75°; (c) αs = 60°; (d) αs = 45°.
Applsci 13 01759 g014
Figure 15. Models varying the depth of blast pocket. (a) Arc-90 (original); (b) Arc-90-05; (c) Arc-90-15-10; (d) Arc-90-15.
Applsci 13 01759 g015aApplsci 13 01759 g015b
Figure 16. Definition of length for blast pocket A.
Applsci 13 01759 g016
Figure 17. Results varying the ratio of blast pocket. (a) Lb/Lw = 0.5; (b) Lb/Lw = 1.0; (c) Lb/Lw = 1.5; (d) Lb/Lw = 2.0.
Applsci 13 01759 g017
Figure 18. Results varying the depth of blast pocket. (a) αs = 90°; (b) αs = 75°; (c) αs = 60°; (d) αs = 45°.
Applsci 13 01759 g018aApplsci 13 01759 g018b
Figure 19. Maximum overpressures and reduction varying slope angle of external tunnel entrance for Lb/Lw = 0.5, 1.0, 1.5, and 2.0. (a) Maximum overpressure; (b) Overpressure reduction.
Applsci 13 01759 g019
Figure 20. Overpressure distributions for Model Arc-90-0 and Arc-60-05. (a) Model Arc-90-0 (original), t = 73 ms; (b) Model Arc-60-05, t = 77 ms; (c) Model Arc-90-0 (original), t = 158 ms; (d) Model Arc-60-05, t = 177 ms.
Applsci 13 01759 g020
Figure 21. Maximum overpressures and reduction varying Lb/Lw for slope angles of external tunnel entrance of 90°, 75°, 60° and 45°. (a) Maximum overpressure; (b) Overpressure reduction.
Applsci 13 01759 g021
Figure 22. Overpressure distributions for Model Arc-90-0 and Arc-60-05. (a) Model Arc-90-05, t = 120 ms; (b) Model Arc-60-05, t = 120 ms.
Applsci 13 01759 g022
Table 1. JWL EOS parameters of high explosives of TNT.
ParameterValue
Density, ρ (kg/m3)1630
CJ detonation speed, D (m/s)6930
CJ detonation pressure, PCJ (GPa)21
Constant, A (GPa)371.2
Constant, B (GPa)3.231
Constant, R14.15
Constant, R20.95
Constant, w0.3
Specific internal energy, E0 (MJ/m3)7000
Table 2. Result summary of mesh sensitivity study.
Distance(m)Mesh Size (mm)Difference (%)
100200400100–200200–400
037.135.328.34.820.0
542.638.329.410.023.3
1037.834.927.87.720.4
1531.628.323.110.318.4
2026.523.821.310.210.5
2524.522.720.47.510.1
3023.221.619.37.010.5
Table 3. Simulation matrix.
No.ModelEntrance ShapeαsLb/LwNote
1Arc-90-0Arch90°0Original
2Arc-90-05Arch90°0.5
3Arc-90-10Arch90°1.0
4Arc-90-15Arch90°1.5
5Arc-90-20Arch90°2.0
6Arc-75-05Arch75°0.5
7Arc-75-10Arch75°1.0
8Arc-75-15Arch75°1.5
9Arc-75-20Arch75°2.0
10Arc-60-05Arch60°0.5
11Arc-60-10Arch60°1.0
12Arc-60-15Arch60°1.5
13Arc-60-15Arch60°2.0
14Arc-45-05Arch45°0.5
15Arc-45-10Arch45°1.0
16Arc-45-15Arch45°1.5
17Arc-45-15Arch45°2.0
Table 4. Results calculated for maximum overpressures, PM.
No.ModelPM (kPa)Note
1Arc-90-025.32Original
2Arc-90-0513.62
3Arc-90-1016.68
4Arc-90-1517.96
5Arc-90-2019.72
6Arc-75-0510.72
7Arc-75-1016.10
8Arc-75-1518.42
9Arc-75-2017.50
10Arc-60-058.98
11Arc-60-1014.09
12Arc-60-1517.73
13Arc-60-2016.71
14Arc-45-059.89
15Arc-45-1015.73
16Arc-45-1513.09
17Arc-45-2017.29
Table 5. Overpressure reduction varying the slope of external tunnel entrance.
Slope Angle of
Tunnel Entrance, αs
Blast Overpressure Reduction (%)
Lb/Lw = 0.5Lb/Lw = 1.0Lb/Lw = 1.5Lb/Lw = 2.0
90°46.234.129.122.1
75°57.736.427.330.9
60°64.544.330.034.0
45°60.937.948.331.7
Disclaimer/Publisher’s Note: The statements, opinions and data contained in all publications are solely those of the individual author(s) and contributor(s) and not of MDPI and/or the editor(s). MDPI and/or the editor(s) disclaim responsibility for any injury to people or property resulting from any ideas, methods, instructions or products referred to in the content.

