Article

X-ray Particle Tracking Velocimetry in an Overflowing Foam

1
Institute of Fluid Dynamics, Helmholtz-Zentrum Dresden-Rossendorf, 01328 Dresden, Germany
2
Institute of Process Engineering and Environmental Technology, Technische Universität Dresden, 01062 Dresden, Germany
*
Authors to whom correspondence should be addressed.
Appl. Sci. 2023, 13(3), 1765; https://doi.org/10.3390/app13031765
Submission received: 12 January 2023 / Revised: 26 January 2023 / Accepted: 27 January 2023 / Published: 30 January 2023
(This article belongs to the Special Issue Advances in the Measurement and Application of Particle Tracking)

Abstract

:
In mineral processing, froth flotation is based on recovering valuable mineral particles by means of the overflowing froth. Industrial-scale froth flotation cells are typically equipped with optical measurement systems, which monitor the bubble sizes and flow velocities at the froth surface. However, the velocity profile of the overflowing froth underneath its free surface is not accessible by optical observation. The present study combines X-ray radiography and particle tracking velocimetry in a laboratory-scale experiment aiming to measure local flow velocities within an optically opaque foam at a weir, which here describes a one-sided horizontal overflow. For this purpose, we prepared custom-tailored tracer particles: small 3D-printed polymer tetrahedra with tiny metal beads glued to the tetrahedral tips. In parallel to the velocity measurements by means of X-ray particle tracking, we determined the liquid fraction of the overflowing foam by electric conductivity measurements using electrode pairs. The experiment was performed with aqueous foams of two different surfactant concentrations but similar bubble size range and superficial gas velocity, yielding around 10% liquid fraction near the weir. Employing the particles as tools for flow tracing in X-ray image sequences, we measured the velocity profile in vertical direction above the weir crest and found that the maximum velocity is reached underneath the free surface of the overflowing foam.

Graphical Abstract

1. Introduction

Particle tracking velocimetry (PTV) is a well-established optical method to measure velocities of individual objects along their motion paths [1]. In fluid dynamics research, these objects are usually small solid particles that are suspended and neutrally buoyant in an optically transparent fluid flow. By tracking individual particles over time, the fluid velocity field can be reconstructed. State-of-the-art PTV measurement arrangements make use of fluorescent particles illuminated by laser light. Two-dimensional measurements require a laser sheet, i.e., a thin quasi-2D illumination plane, whereas three-dimensional PTV measures particle motions in a truly 3D observation volume. Taking also the time component into account, time-resolved 3D-PTV is usually referred to as 4D-PTV [2].
Besides PTV, other optical methods employing particles dispersed in the fluid flow include, for example, laser Doppler velocimetry [3], particle image velocimetry [4], particle shadow velocimetry [5], or combinations of them [6]. However, these standard methods are not applicable for flow measurement in a liquid foam or froth, at least not in three-dimensional flow configurations. Optical observation is only commonly used for measurements at the free surface or close to a transparent wall. In contrast, the foam volume underneath the surface near foam bubbles is not accessible for optical measurements using visible light. The opacity of liquid foam is due to its complex three-dimensional structure: the liquid phase constitutes a continuous network of interconnected films between the gas bubbles, and the curved gas–liquid interfaces reflect visible light to a great extent.
Froth refers to a gas–liquid two-phase mixture that is additionally laden with small solid particles. At high solid fraction, the dispersed particles contribute significantly to the opacity of the froth. This is particularly the case in industrial applications, such as flotation de-inking during waste paper recycling [7] or froth flotation in mineral processing [8]: hydrophobic particles selectively attach to gas bubbles in flotation cells, forming a particle-laden froth phase on the top of the pulp. In this way, solid particles [9] and liquid [10,11] are transported with the overflowing froth and out of the flotation cell for further processing. In flotation plants for mineral processing, the overflowing froth employed for collecting, transporting, and recovering the valuable mineral particles is typically monitored only by optical observation, which is therefore limited to the the free surface of the froth phase.
Beyond optical measurements through transparent walls in quasi-two-dimensional configurations [12,13], ultrasound measurements gave insights into the bulk flow field in foam [14] and the local liquid fraction distribution [15,16]. Moreover, laboratory-scale investigations make use of imaging measurements with different kinds of radiation. This includes X-rays, neutrons, or positrons and gamma rays, which can pass through many liquid and solid materials that are opaque to visible light.
Positron emission particle tracking (PEPT) [17,18] was used for mapping the movement of particles in flotation froth [19], including the attachment of particles to bubbles in the pulp and their detachment in the froth [20], for both hydrophobic and hydrophilic particles [21]. For the purpose of visual verification, PEPT was combined with optical imaging [22,23]. Various experimental studies focusing on the tracer particles showcased that PEPT works out with fine tracer particles down to 50 μ m in diameter [24], larger tracers having either hydrophilic or hydrophobic surface coatings [25], and directly activated mineral particles [26]. With respect to the measurement principle, PEPT is limited to a very few tracer particles in order to distinguish between them [27], thus requiring repetitive measurements of the tracer motions in steady flow conditions [28]. Positron emission tomography (PET), i.e., without radioactive-labelled tracer particles but with radioactive liquid, was demonstrated for measuring the liquid fraction in an overflowing foam [29].
Transmission imaging with neutrons is particularly suitable for imaging the bubble-scale froth structure [30] and mapping the liquid fraction distribution in foam [31]. This is mainly because neutrons are strongly moderated by hydrogen, resulting in a high effective neutron attenuation coefficient of the liquid phase, which is usually an aqueous surfactant solution. Neutron radiography is also suitable for particle tracking in froth [32], especially with gadolinium-based particles, as this rare-earth metal has an outstanding high neutron attenuation coefficient. However, the tracking of individual particles is challenging because of the low contrast-to-noise ratio for small particle sizes imaged at high frame rate [33], which requires sophisticated image processing tools [34].
Using X-rays instead of neutrons, time-resolved tomographic imaging gave insights into the process of foaming in an aqueous solution [35,36] as well as in a liquid metal [37]. Further, fast X-ray micro-tomography was applied to resolve the three-dimensional liquid foam flow around a sphere [38] and through a cylindrical hopper [39]. Particle tracking measurements in X-ray image sequences require tracer particles that are opaque for X-rays. To this end, radiopaque composite particles are manufactured, in which one component or coating is a heavy metal with a high X-ray attenuation efficient, such as bismuth [40] or tungsten [41]. In combination with the much larger volume of a low-density material, e.g., polymer foam or hollow spheres, the desired effective density of the composite particle can be tailored to match with the density of the fluid.
For our previous experimental study on X-ray particle tracking velocimetry (X-PTV) in liquid foam flow [42], we prepared different types of tracer particles from steel and with three-dimensional shapes by selective laser melting. We demonstrated that the 3D-printed tracers with a foam-inspired shape stick to the bubble-scale foam structure and, thus, are able to follow the streamlines of the foam flow very well. They can be used as measurement tools in stable foam with less than approximately 5% liquid fraction, but they are slightly too heavy for X-PTV measurements in unstable foam at a higher liquid fraction.
In this work, aiming to reduce measurement uncertainties in X-PTV measurements in foam and froth flows with up to approximately a 10% liquid fraction, we have prepared composite tracer particles and standardised their shape, size, and mass. For testing purposes, we used these tracer particles in a laboratory-scale foam flow experiment, which was inspired by a froth flotation cell, and investigated the flow behaviour of an aqueous foam at a weir. Simultaneously with the X-ray imaging measurement, the liquid fraction of the overflowing foam was monitored by means of electric conductivity measurements using electrode pairs. Focusing on the velocity field at the weir, where the liquid is recovered from the foam, we researched how the tracer velocity depends on the vertical position above the weir crest, i.e., underneath the free surface of the overflowing foam.

2. Materials and Methods

The following subsections describe the experimental arrangement and the processing of the measurement data. The foam generation and flow development (Section 2.1) were monitored by a liquid fraction measurement using electrode pairs (Section 2.2). As sketched in Figure 1, the overflowing foam was carrying custom-tailored tracer particles (Section 2.3), and we used X-ray radiography (Section 2.4) to visualise and track them (Section 2.5).

2.1. Overflowing Foam

The flow experiment on the overflowing foam was performed in a laboratory-scale flow channel. Its design was motivated by the froth flow on the top of an industrial-scale froth flotation cell. In the view of the X-ray radiographic measurements, the flow channel had a square cross-sectional area of 100 mm × 100 mm and was entirely made of acrylic glass (PMMA) with a wall thickness of 10 mm . The X-rays had to penetrate the channel walls having a total thickness of d w = 2 · 10   m m = 20   m m perpendicular to the X-ray beam direction, thus reducing the X-ray intensity by approximately 30% (Section 2.4).
At the bottom of the flow channel, a bubble generator was submerged in a surfactant solution. The essential parts of the bubble generator were four tubes made of high-density polyethylene with a hydrophobic surface. The tubes had an outer diameter of 19 m m and a wall thickness of approximately 3 mm. Produced by sintering, the tube wall was porous, having a pore size of 60 μ m . Four sections of this tube, each 12.5   m m long, were aligned vertically and placed equidistantly on a 3D-printed basis, which served for feeding and distributing compressed air into these tube sections.
Charging the bubble generator with compressed air at a constant volumetric flow rate V ˙ = 0.05   L   s 1 by means of a mass flow controller (FMA-2608A, Omega) resulted in 0.5   c m   s 1 superficial gas velocity, which is comparable to industrial-scale froth flotation cells [43]. The bubbles were generated continuously and homogeneously distributed in the surfactant solution. Accordingly, above the liquid surface, the foam flow developed similar to a plug flow, i.e., no major inhomogeneity in the superficial gas velocity was visible. The fresh foam moved upwards in a vertical direction in the flow channel, then flowed off at a weir, i.e., at a one-sided horizontal overflow, and into the open surrounding. After passing the weir, the foam slid down at the outer channel wall, accelerated by gravity.
The filling level of the surfactant solution was 50 m m above the bubble generator and 250 m m below the weir. When the foam overflowed, liquid was transported out of the flow channel and, therefore, the filling level above the bubble generator was decreasing. At the given volumetric flow rate ( V ˙ = 0.05   L   s 1 ) and liquid fraction of the foam ( ϕ l 10 % , Section 2.2, Figure 3), the estimated decrease of the filling level equalled 15 m m during a 30 s measurement run. To slow down the decrease of the filling level, the flow channel was connected via a tube to a reservoir. Its cross-sectional area was approximately five times larger than the cross section of the flow channel, and, consequently, the filling level decreased by only a few millimetres per measurement run. Furthermore, the reservoir was placed on a laboratory lifting stage in order to re-adjust the filling level before starting each measurement run.
To prepare the surfactant solution, sodium dodecyl sulfate (SDS) was dissolved in tap water at room temperature ( θ = 20   C ). The SDS concentration was varied as listed in Table 1: either 1.0   g   L 1 or 0.5   g   L 1 . In both cases, the concentration was below the critical micelle concentration C M C = 2.3   g   L 1 [44]. This yielded a fairly unstable foam, which underwent bubble coalescence, had a high liquid fraction and, as desired, a high flowability in the region of interest, i.e., at the weir.
We used the SDS surfactant for three main reasons. First, laboratory-scale experiments frequently focus of SDS surfactant solutions for generating and studying foam and its flow behaviour in the absence of particles. Second, in our previous experimental study on X-ray particle tracking velocimetry in liquid foam flow [42], we had used a stable foam at an SDS surfactant concentration that was one order of magnitude above the critical micelle concentration. Third, depending on the SDS surfactant concentration lower than the critical micelle concentration, unstable foam can be generated in a well-controlled manner, which is important for the repeated measurement runs in this experimental study.
Regardless of the SDS surfactant concentration, the bubble size range at the weir was very similar on the basis of the constant pore size of the same bubble generator. In preliminary optical measurements, the Sauter mean diameter of the primary foam bubbles was determined as 0.2 m m to 0.3 m m . In consequence of bubble coalescence, some bubbles enlarged to almost 1.0   m m in diameter until the foam reached the weir (Figure 2).

2.2. Liquid Fraction Measurement

The liquid fraction ϕ l of the foam was monitored during all X-ray measurement runs in order to assess the reproducibility of the foam generation and flow measurement. For this purpose, three pairs of electrodes (Figure 1: EP1, EP2, EP3) measured the electrical conductivity of the liquid phase. The electrodes were made of stainless steel, had a circular contact area of 10 mm in diameter, and were embedded equidistantly in the left and right side wall of the flow channel at the level of the weir crest. Based on an empirical correlation between the liquid fraction and the relative electrical conductivity of the foam, i.e., related to the conductivity of the surfactant solution, the liquid fraction of dry or wet foams can be determined with less than 5% relative uncertainty [47]. Prior to the measurement, a calibration with the surfactant solution is required, which was carried out at the middle electrode pair (EP2). The conductivity measurement and determination of the liquid fraction of the foam were run with a measuring frequency of 2 Hz between all electrode pairs: EP1, EP2, and EP3. In Figure 3, the liquid fraction is exemplarily plotted for several measurement runs with a duration of 10 s each. In the case of the surfactant concentration c 1 = 1.0   g   L 1 (Figure 3a), the liquid fraction is approximately 10% in the middle of the flow channel (EP2), slightly lower far way from the weir (EP1: 8% to 10%), and shows the largest fluctuations between different measurement runs in the immediate vicinity of the weir (EP3). At lower concentration c 2 = 0.5   g   L 1 , shown in Figure 3b, the liquid fraction is on a slightly lower level, varying from approximately 6% to 9%, and the differences between the three measurement positions are less pronounced.

2.3. Tracer Particles

Custom-tailored tracer particles were designed and prepared for the X-ray particle tracking velocimetry measurements in the overflowing foam. As shown in Figure 4, each tracer particle consisted of a small polymer tetrahedron with four tiny metal beads at its four tips. The two material components had separate functions explained in the following.
The tetrahedron made of a polymer material by means of 3D printing was the main structural component. The tetrahedral shape was inspired by the bubble-scale foam structure, namely the four plateau boarders converging in one vertex. Owing to this highly symmetrical shape, the tracers were stuck between the surrounding foam bubbles and, consequently, carried well with the flowing foam. The edge length of the tetrahedron was (4.0 ± 0.1) mm on average (Figure 4a), which is approximately twice the diameter of the largest foam bubbles (Section 2.1, Figure 2). Thus, the polymer tetrahedron distributes the total weight of the tracer particle to the cluster of a few bubbles in the immediate vicinity.
The four metal beads glued to the four tetrahedral tips served as radiopaque features of the tracer particle. For this purpose, metal beads were utilised that are commonly known as solder balls: made of the binary lead-tin alloy Pb90Sn10, i.e., with a very high lead content of 90%. Lead as a heavy metal has an accordingly high X-ray attenuation coefficient ( μ X , P b 90 S n 10 > 10   c m 1 ) [48], which is approximately three orders of magnitude larger than the coefficient of foam (at 10% liquid fraction: μ X , f o a m 0.1   c m 1 ) in the X-ray photon energy range relevant for the measurements here (Section 2.4, Figure 5). Aiming for a suitable contrast between each individual metal bead and the surrounding liquid foam in the X-ray images, all metal beads had the same nominal size of 0.5   m m in diameter.
For the purpose of adding the tracer particles to the foam flow, small tubes were fitted in the middle section of the foam flow channel. These tubes were placed above the interface between the surfactant solution and the continuously generated foam bubbles but far apart from the region of interest at the horizontal weir, as shown by the X-ray image in Figure 1. A total of three tubes, each with an inner diameter of 5 m m , could be mounted in through-holes at various positions in the back wall of the flow channel. Using a custom-built linear drive system, the tracer particles were pushed through and out of the tubes, thus into the liquid foam. This was performed remotely controlled, while the foam generation and X-ray image acquisition were already running. Three tracer particles were added in each measurement run; to acquire a relevant amount of X-PTV data, several runs under the same conditions were performed and combined for the data analysis in Section 3.

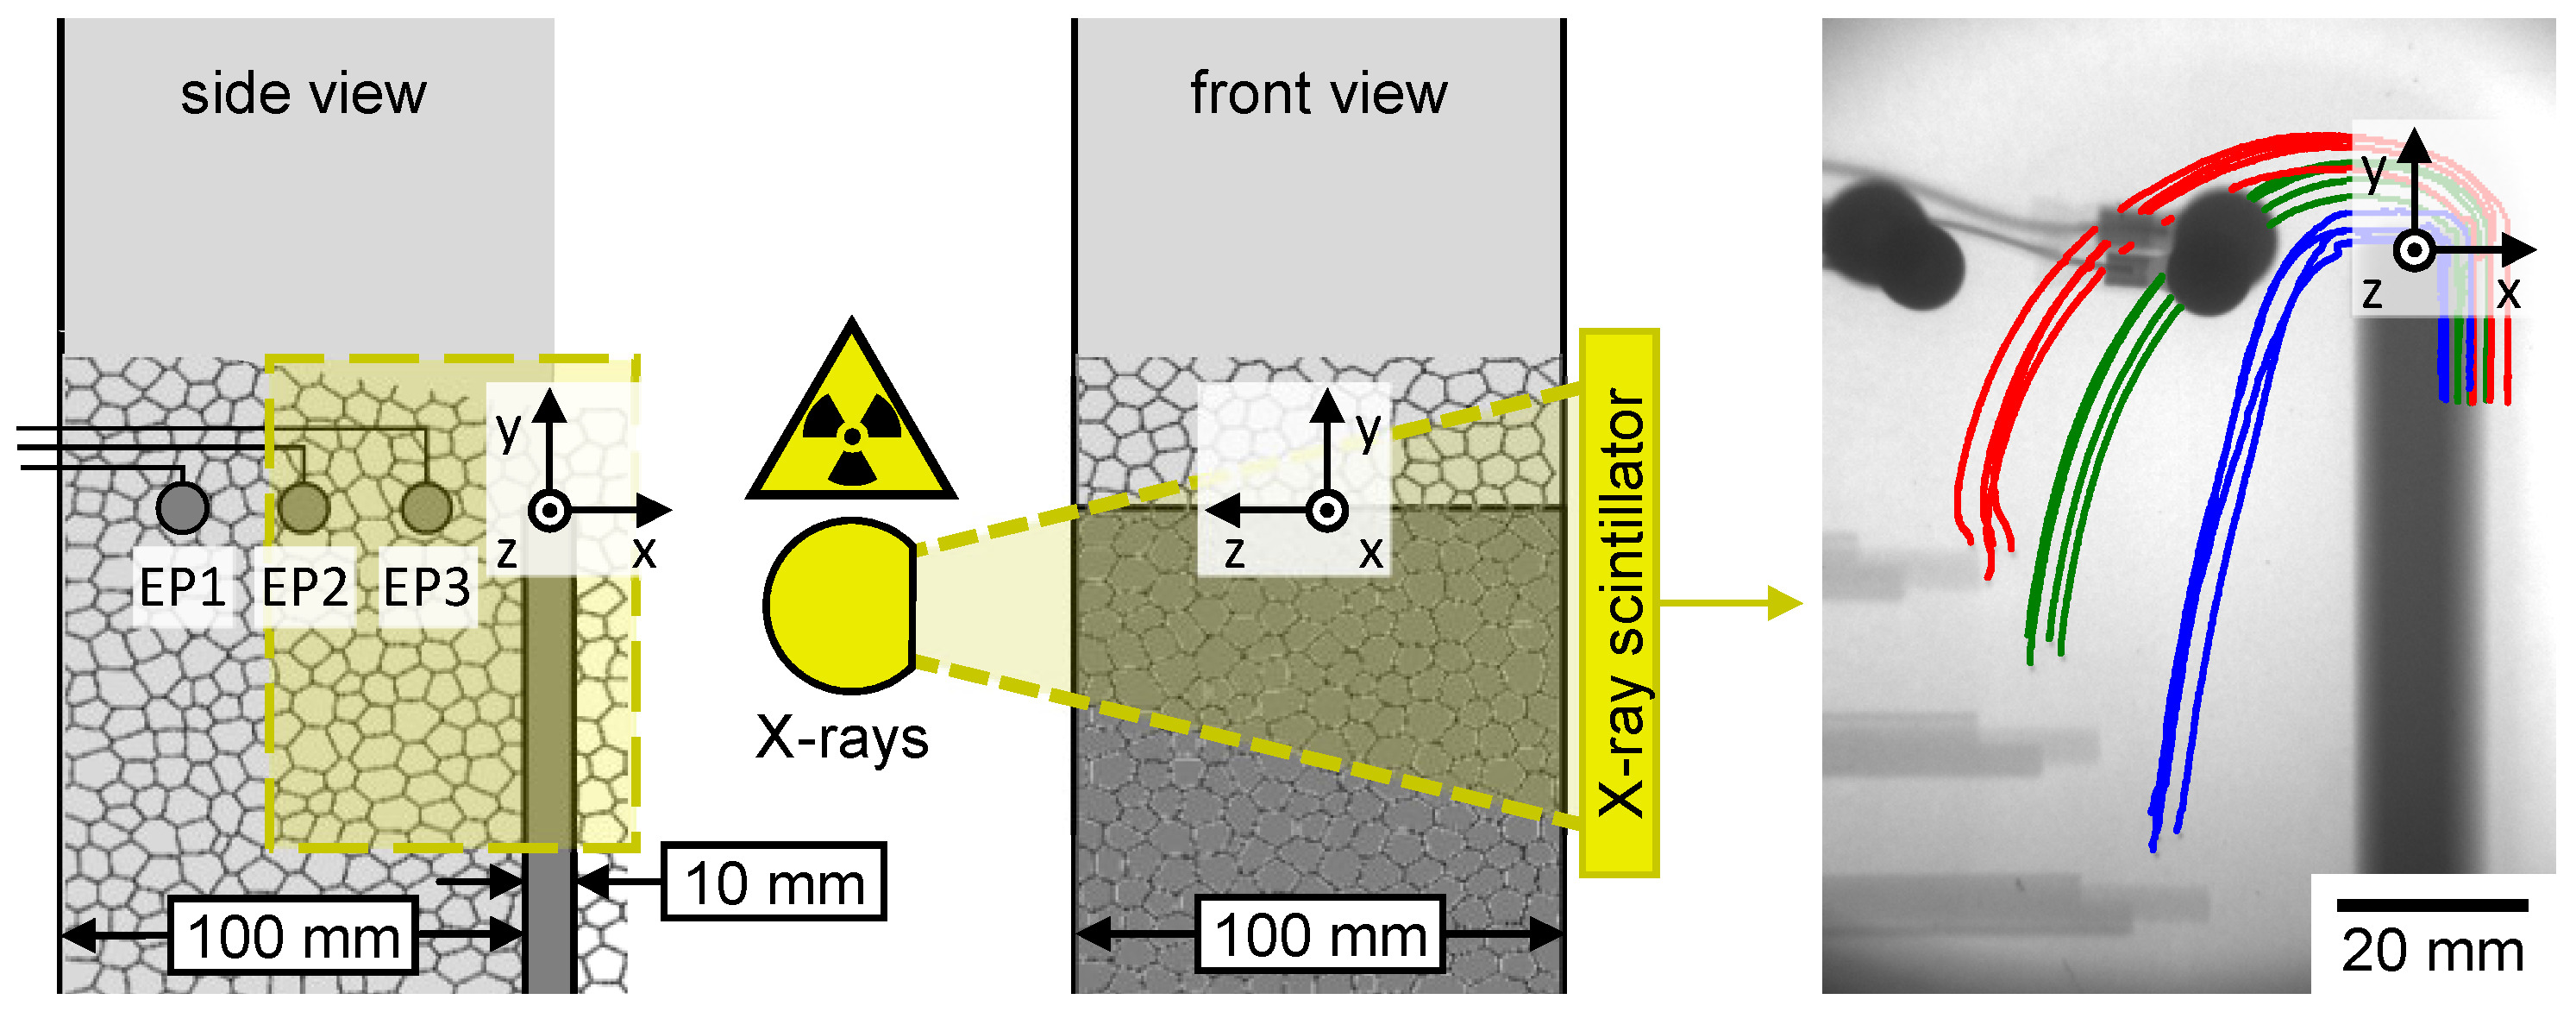
2.4. X-ray Radiography

The X-ray radiographic measurements were performed using a high-power X-ray tube (ISOVOLT 450M1/25-55, GE Sensing & Inspection Technologies), operated at 200 k V X-ray tube voltage and 22.5   m A tube current. Its 5.5   m m focal spot provides a continuous and divergent beam of polychromatic X-rays at a 40 emergent beam angle. The X-ray beam penetrated the foam flow channel in the region of interest around the weir, highlighted by the yellow rectangle in Figure 1. The transmitted X-rays impinged on a scintillation screen (SecureX HB, Applied Scintillation Technologies), which was positioned at a distance of approximately 55 c m from the X-ray source. In order to reduce undesirable effects arising from the two-dimensional X-ray tube focal spot and the beam divergence, the scintillation screen was mounted as close as possible to the back wall of the flow channel. However, a minimum distance of 1 c m was necessary because of the rear electrodes and their wiring. Upon X-ray impingement, the scintillation screen emitted visible light, which was further deflected by a mirror through a lens system (custom build, TSO Thalheim Spezialoptik) and finally captured by means of a sCMOS camera (pco.edge 5.5, PCO). Their field of view was set to approximately 7.8 cm × 13.8 c m . Discretised by 1438 px × 2560 px , this yielded an image pixel size of approximately 0.05   m m for objects located in the centre plane ( z = 0 ) of the flow channel. The X-ray image sequences were acquired with an imaging frame rate of 150 fps . The image exposure time was 3 m s for the purpose of achieving a suitable contrast-to-noise ratio [49] but without causing significant motion blurring of the tracer particles in the overflowing foam.
X-ray radiography is based on the measurement principle of transmission imaging, which can be described by Beer–Lambert’s law in the first-order approximation:
I = I 0 · e μ X · d z
with the linear X-ray attenuation coefficient μ X , the thickness d z , i.e., the distance along the X-ray beam direction, and the intensities I 0 and I of the incident and the transmitted X-rays, respectively. While passing through matter, the X-ray intensity decreases exponentially. The attenuation coefficient is element- or material-specific and also depends on the X-ray photon energy. Given the 200 k V X-ray tube voltage, the energy could not exceed 200 k e V . However, according to Dauvillier’s law [50], the intensity maximum of the continuous X-ray bremsstrahlung spectrum is assumed in the range from 130 keV to 150 keV. As this is a rough estimation, we consider a larger range 100   k e V < E X < 200   k e V in the following.
In liquid foam, the X-ray attenuation due to the gas phase can be neglected, because the attenuation coefficient of air is three orders of magnitude smaller than the coefficient of water [48]. As the concentration of the dissolved surfactant is low (Table 1), its contribution to the effective attenuation coefficient of the liquid phase can be neglected, too. According to Beer–Lambert’s law (Equation (1)) and its graphic representation in Figure 5, the liquid foam in the channel ( d z = 100 mm), here at a 10% liquid fraction (Figure 3a), reduces the X-ray transmittance by less than 20%. The left and right side walls of the foam channel, made of acrylic glass (PMMA, d z = 2 · 10   m m = 20   m m ), additionally reduce the transmittance by approximately 30%. For both the liquid foam and the PMMA channel walls, the blue and green graphs in Figure 5 suggest that the dependency on the X-ray photon energy is negligible in the considered range 100   k e V < E X < 200   k e V .
The X-ray images in Figure 4c–e show only the four metal beads belonging to each tracer particle, but the polymer tetrahedron is not visible. Its X-ray transparency is due to the combination of the small size, i.e., the low material thickness of less than 4 m m penetrated by the X-rays and the small X-ray attenuation coefficient being very similar to that of the PMMA channel walls. In contrast, the metal beads (Pb90Sn10, d z 0.5   m m ) served as radiopaque features of the tracer particles, and their transmittance significantly depended on the X-ray photon energy. They reduce the X-ray intensity by more than 60% at 150 k e V but by approximately 95% at 100 k e V . Consequently, in this energy range given by the tube voltage, a suitable X-ray image contrast can be expected between the metal beads of the tracers and the surrounding liquid foam.
According to Beer–Lambert’s law (Equation (1)), the intensity of the incident X-ray beam is reduced exponentially while penetrating through a single-component material. In the case of multiple components, the contribution of each component has to be considers. The total transmittance of one metal bead (index p for particle) in the liquid foam (index l for liquid) can be written as
I p I 0 = e [ μ p · d p + μ l · ( d l d p ) + μ w · d w ]
because the thickness d l of the liquid foam is shortened by the diameter d p of the metal bead. In the absence of the metal bead, Beer–Lambert’s law describes the X-ray transmittance of the foam-filled channel:
I l I 0 = e [ μ l · d l + μ w · d w ]
In both Equations (2) and (3), the PMMA channel walls (index w for wall) are also taken into account. Further, dividing Equation (2) by Equation (3) yields the ratio
I p I l = e [ ( μ p μ l ) · d p ]
which only depends on the X-ray attenuation coefficients μ l of the liquid foam and μ p of the metal bead and its diameter d p . Particularly, the difference term ( μ p μ l ) in Equation (4) points out that the intensity ratio depends on the absolute values of μ p and μ l , which, in turn, are material- and energy-specific. Additionally, in the case of liquid foam, μ l depends mainly on the liquid fraction. Thus, the X-ray tube voltage also determining the X-ray photon energy has an important effect on the intensity ratio in Equation (4) and the resulting X-ray image contrast between the metal beads and the surrounding liquid foam. More importantly, the difference term is multiplied with the diameter d p : to visualise metal beads that are as small as possible, they should be mainly made of heavy metals, such as lead or tungsten, which have a high X-ray attenuation coefficient. Beads from other materials, for example steel or light metals such as aluminium, are less suitable as radiopaque features, as their lower attenuation coefficient would have to be compensated by a larger diameter to achieve a similar intensity ratio and X-ray image contrast.
In the X-ray images of the tracer particles (Figure 4c–e), the transmitted X-ray intensity is projected in terms of grey-scale values. Figure 4f exemplarily plots the grey-scale values along the red line that is overlaid in the X-ray image of one tracer particle in Figure 4c. It should be noted that the absolute grey-scale values in the X-ray images and in the line profile plot have no defined physical meaning as the image histograms were rescaled in the same way for the purpose of visualisation. The projection of the metal bead can be clearly distinguished from the liquid foam, as the grey-scale value, especially in the centre of the metal bead, i.e., at the position s = 2.5   m m , is significantly lower. In addition, the projection of the metal bead contrasts strongly with the statistical image noise, which is due to inherent characteristics of the scintillator screen and sCMOS camera at the short image exposure time of 3 m s . All in all, the metal beads are imaged with a sufficiently high contrast-to-noise ratio for further image analysis and particle tracking.

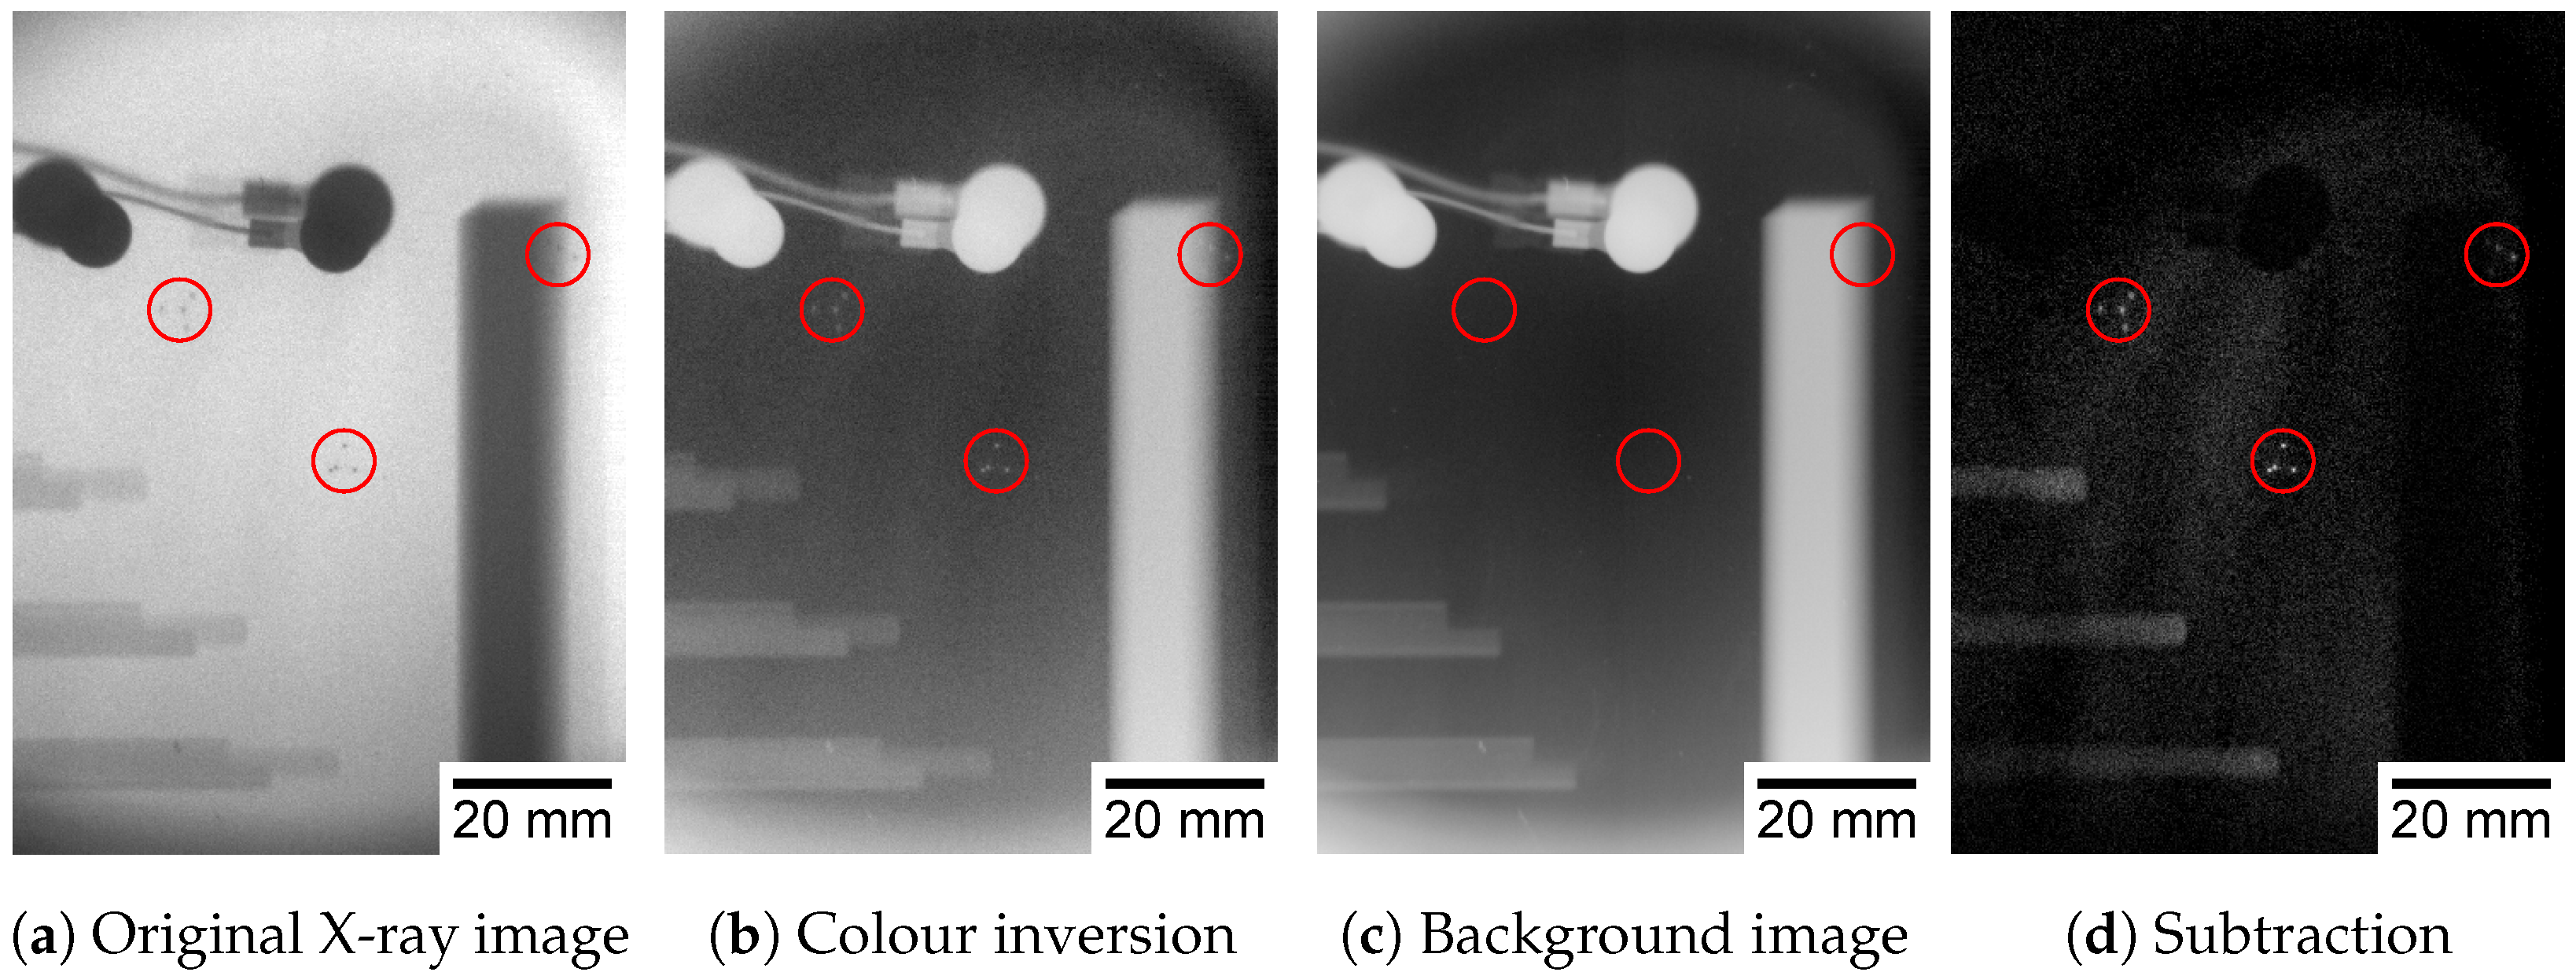
2.5. Image Processing and Particle Tracking

The image processing and data analysis is divided into three subroutines: first, the pre-processing of the X-ray images as illustrated in Figure 6, second, the detection of the tracer particles and their motion paths, and third, the calculation of the translational velocity of each tracer particle and its intrinsic rotation along the motion path.
The X-ray image sequences were pre-processed in order to display the metal beads of each tracer particle as bright spot on a dark background. To this end, the original grey-scale images (Figure 6a) were colour-inverted (Figure 6b) and next, a time-averaged background image (Figure 6c), acquired with the liquid foam but without any tracer particles, was subtracted from each frame of the X-ray image sequence. The background image sequence was recorded with the same imaging parameters at the beginning of the respective measurement run, i.e., before the foam carrying the tracer particles approached the region of interest at the weir. As the result of the background subtraction (Figure 6d) followed by histogram equalisation, the four metal beads of each tracer particle are displayed as bright objects. In addition, the three small rods in the tubes for adding the tracer particles into the foam flow are visible after subtracting the background. In addition, stream-like patterns of the foam flow are recognisable, suggesting that the liquid fraction of the foam could be quantified from the X-ray image sequences with high spatial and temporal resolution.
The Matlab Particle Tracking Code developed by Blair & Dufresne [51] was applied to the pre-processed X-ray images. The Matlab routine is an adaption of IDL Particle Tracking software originally developed by Crocker & Grier [52]. Using this software tool, the four metal beads of each tracer particle were detected in each single frame, and the found coordinates were linked to reconstruct the motion path of each metal bead in consecutive frames of the X-ray image sequences.
Continuing from the reconstructed motion paths of the four metal beads belonging to one tracer particle, its translational velocity and intrinsic rotation were determined. The coordinates X b i = ( x b i , y b i ) were given for each of the four metal beads b in the respective frames i. The coordinates X i = ( x i , y i ) of the tracer particle were determined as its centre of mass estimated from:
X i = 1 4 j = 1 4 X b i
Applying the central differencing scheme, the translation velocity U i = ( v x i , v y i ) of the tracer particle in the projection plane was calculated as
U i = X i + 1 X i 1 2 · Δ t
with Δ t = 1 / 2 · ( t i + 1 t i 1 ) = 1 / 150   s 1 0.0067   s time increments. Here, the tracer particle was assumed to stay in the same measuring plane z = c o n s t . , i.e., the translational velocity component v z perpendicular to the projection plane equals zero. In addition, the intrinsic rotation of each tracer particle around the z-axis, i.e., in the projection plane, was determined by connecting all metal beads b = 1 4 with straight lines g = 1 6 and calculating the angle α g i between each connecting line g and an arbitrary but fixed plane. Next, the angular velocity ω g i of each connecting line was calculated as the temporal change of α g i within Δ t = 1 / 150   s 1 0.0067   s time increments, applying the central differencing scheme again:
ω g i = α g i + 1 α g i 1 2 · Δ t
Finally, averaging of all ω g i yielded the intrinsic rotation of the tracer particle:
ω i = 1 6 g = 1 6 ω g i
In the rare case that the projections of two metal beads partially overlapped and, therefore, were not detected as two individual objects, the calculations of the translational motion of the tracer particle and its intrinsic rotation were performed with correspondingly less metal beads ( b = 1 3 ) and connecting lines ( g = 1 3 ), respectively.

3. Results

X-ray radiographic imaging was performed to measure the motion of tracer particles that were carried very well by the liquid foam flow, thus representing its local streamlines. The following subsections first introduce the different measuring planes in the three-dimensional configuration (Section 3.1), then mainly focus on the horizontal velocity component of the tracer particle motion at the weir (Section 3.2) and also consider the vertical velocity component past the weir (Section 3.3). Additionally, as a special feature of the tetrahedral tracer particles, their intrinsic rotation was analysed (Section 3.4), providing a more detailed insight into the foam flow field.

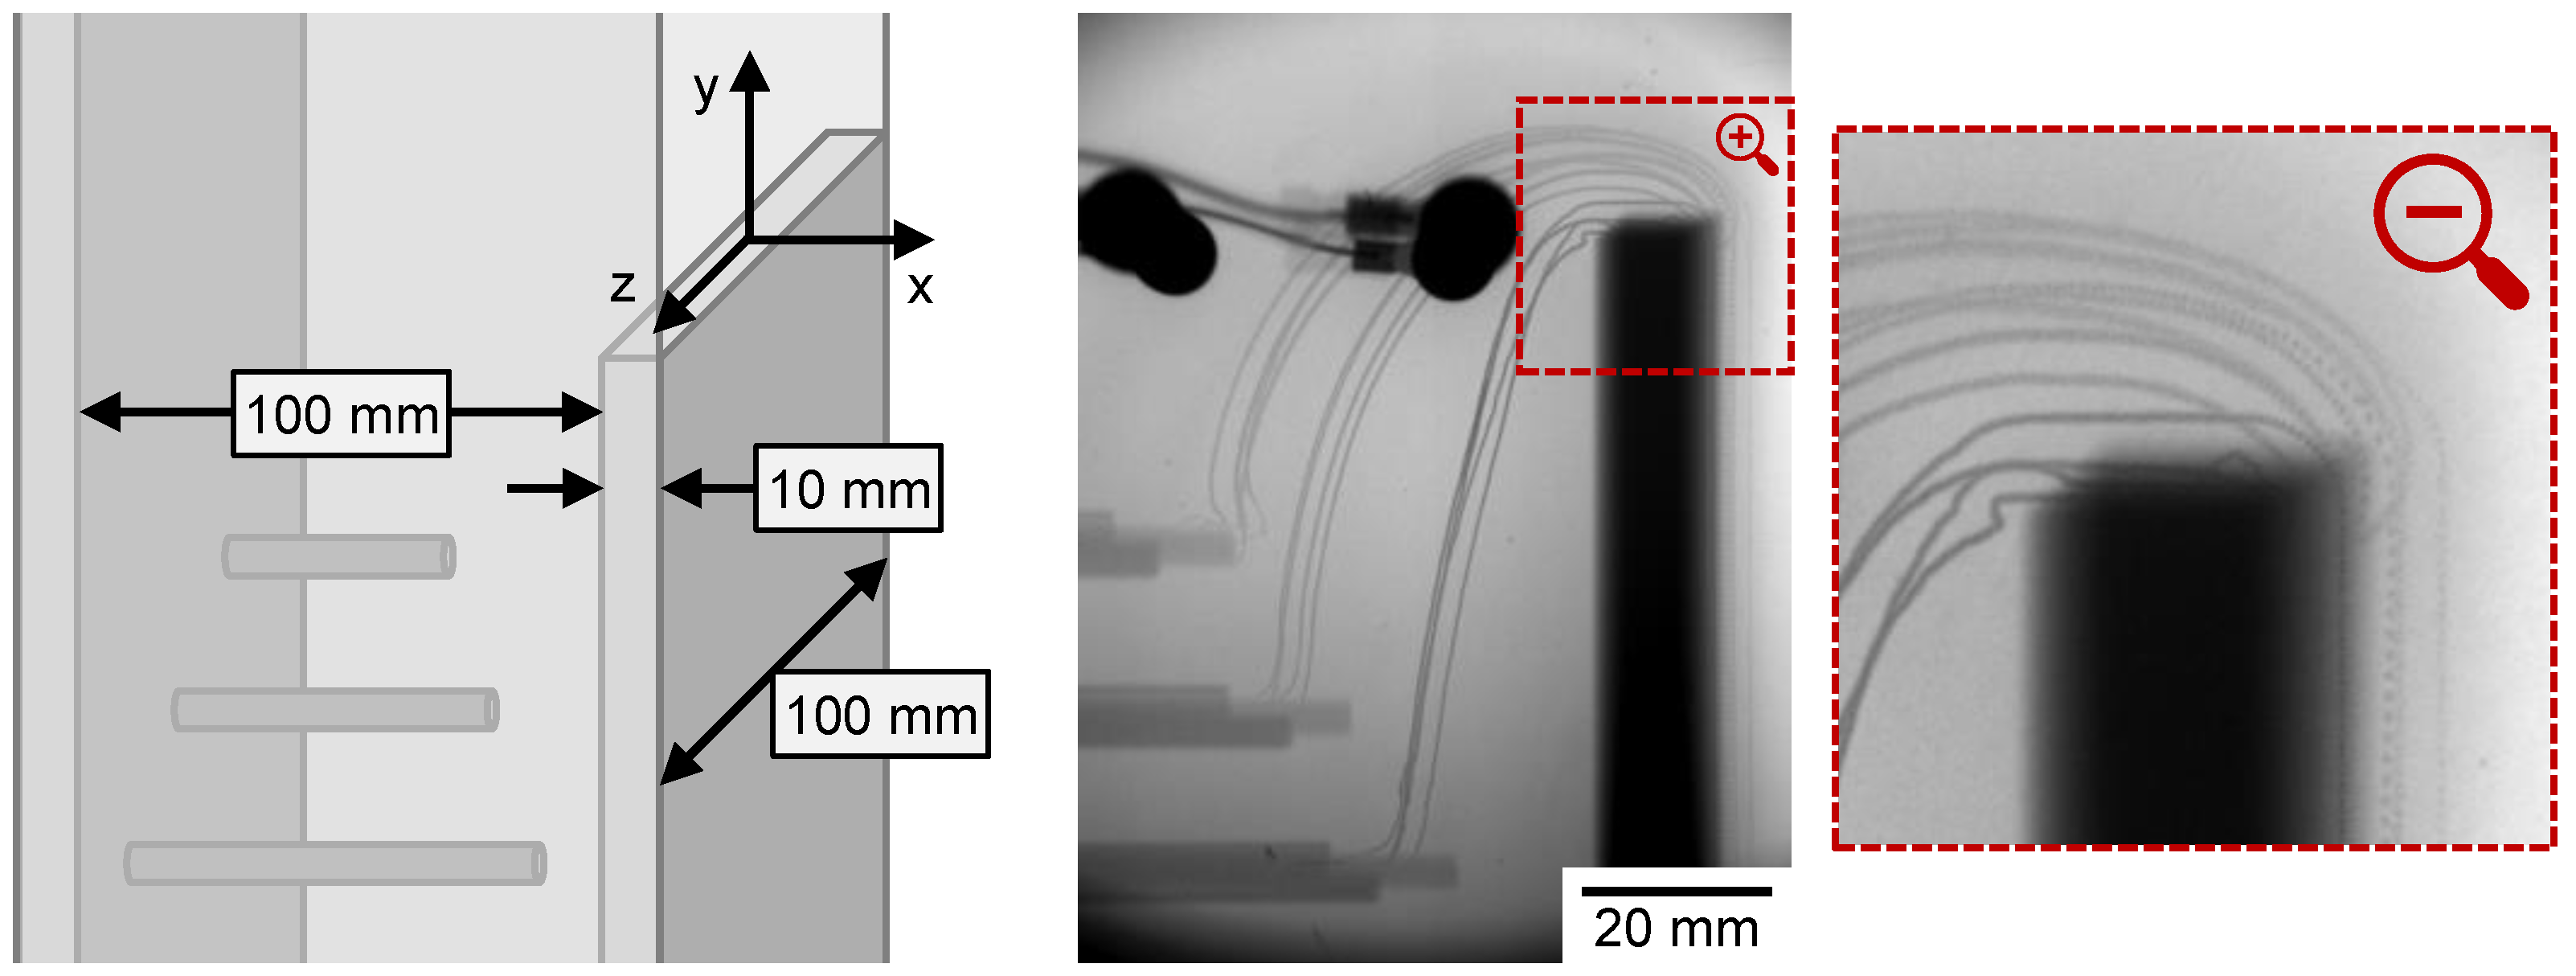
3.1. Motion Paths in Different Measuring Planes

In the X-PTV measurements, the tracer particles were added to the flowing foam at different but fixed positions ( x 0 , y 0 , z 0 ) by means of small tubes, as depicted in Figure 7. To perform X-ray particle tracking velocimetry in different measuring planes of the three-dimensional configuration, the starting coordinate z 0 along the X-ray beam direction was particularly important. Having different starting coordinates x 0 and y 0 also allows for distinguishing between the tracer particles and observing them at different heights, i.e., vertical positions y, above the weir crest. Three tracer particles were recorded in each measurement run. In order to generate the relevant amount of motion paths, measurement runs with the same foam parameters and flow conditions were repeated several times.
It should be noted here that the middle of the weir crest defines the origin of coordinates in the horizontal (x) and vertical direction (y) of the field of view. Along the X-ray beam direction, z = 0   m m was fixed in the central measuring plane of the foam flow channel. This definition applies to all plots in the following subsections.

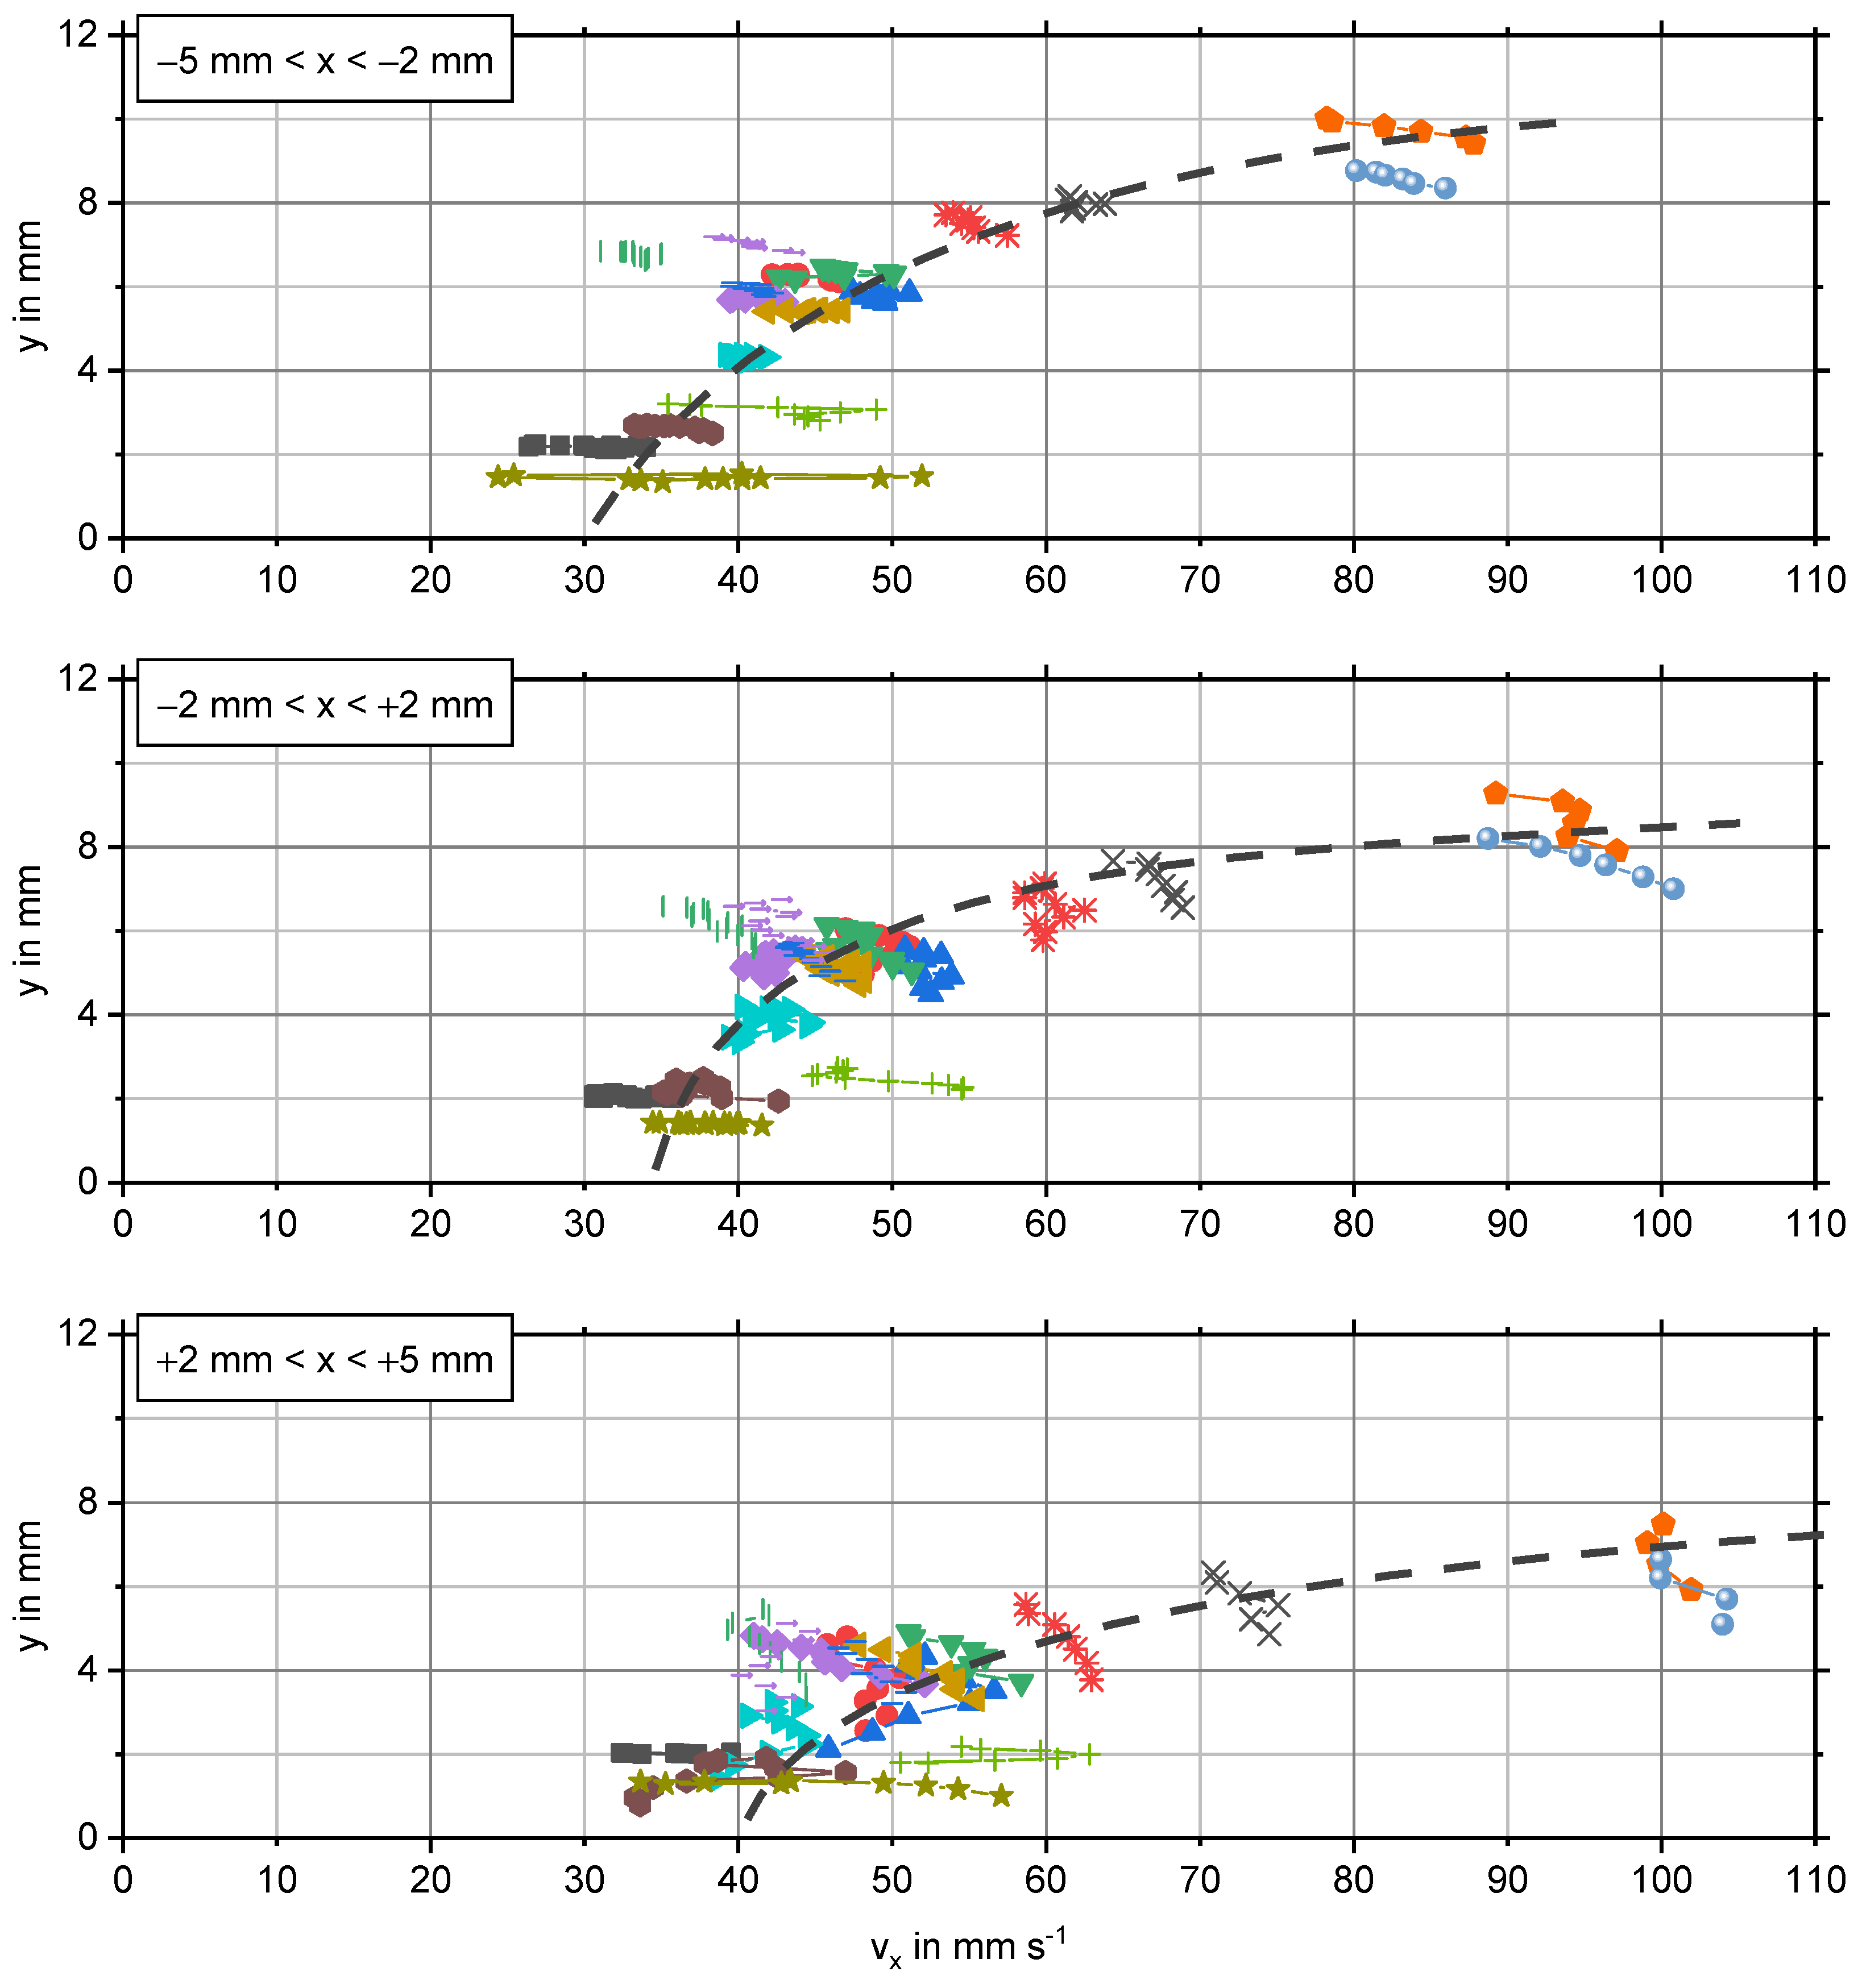
3.2. Horizontal Velocity Component at the Weir

The tracer particles were carried by the foam flow and followed its streamlines sufficiently well. This essential conclusion can be drawn from X-ray images with the entire field of view, as exemplarily shown in Figure 7 for three tracer particles in one measurement run: the motion paths from the starting positions towards the weir are running very smooth. Therefore, we assume in the following that the velocity of each tracer particle along its motion path corresponds to the local flow velocity with negligible uncertainty.
Figure 8 plots the short segments of the motion paths y i ( x i ) at the horizontal weir ( 5   m m < x < + 5   m m ) as well as the corresponding horizontal velocity component v x ( x ) for a total of 21 tracer particles, recorded in repeated measurement runs at the surfactant concentration c 1 = 1.0   g   L 1 . All of these tracers started at slightly different distances in the horizontal ( x 0 ) and vertical ( y 0 ) directions from the weir but in the same central measuring plane ( z 0 = 0   m m ). As the expected flow profile was similar to a plug-flow, we assume that the tracer particles did not move significantly along the X-ray beam direction ( v z 0   m m / s ) and stayed very close to this measuring plane ( z 0   m m ) when approaching and passing the weir.
The tracer particles passed the weir at different heights between y 1   m m and a maximum of 10 m m . On the one hand, the motion paths of tracer particles moving close to the weir crest ( y 2   m m ) run almost horizontally. On the other hand, with increasing height y, the motion paths are characterised by a parabola-like shape at a higher velocity level on average. The horizontal velocity component v x of the different tracer particles is between approximately 30 m m   s 1 and a maximum of 100 m m   s 1 . Most tracer particles, particularly those with parabola-like motion paths, are slightly accelerated as they pass the weir. The strong fluctuations in v x of the tracer particle having the lowest height at the weir ( y 1   m m , indicated by the olive-green star symbol in Figure 8) are most likely due to the fact that this tracer particle slightly touched the weir crest several times.
To emphasise the correlation between the height or vertical position y above the weir and the horizontal velocity component v x along the motion paths from Figure 8, they are plotted against each other in Figure 9, and additionally the region of interest is split into three segments in the horizontal direction.
The correlations suggested by the two plots in Figure 8 become very clear from Figure 9: in general, the horizontal velocity component v x increases in the horizontal direction x while passing the weir as well as in the vertical direction y above the weir crest. However, the velocity gradient d v x / d y in the vertical direction is much more pronounced than d v x / d x in the horizontal direction. Measurement data at y 0   m m , i.e., near the weir crest, are lacking, as the plotted data points represent the centre of mass of each tracer particle. Nevertheless, considering the millimetre-sized tracer particles, we conclude that foam bubbles being in direct contact with the weir also have a horizontal velocity component larger than zero. This was confirmed by supporting optical observation with the naked eye for foam bubbles at the transparent side wall of the foam flow channel.
Figure 10 extends Figure 9 by plotting the horizontal velocity component v x over the vertical position y in four further measuring planes, which are close ( z 0 = ± 35   m m ) and very close ( z 0 = ± 45   m m ) to the left and right side walls of the foam flow channel, for both surfactant concentrations c 1 = 1.0   g   L 1 (plots on the left) and c 2 = 0.5   g   L 1 (on the right).
At the higher surfactant concentration, the findings obtained for the central measuring plane z 0 = 0   m m can be partly transferred to the other planes closer to the side walls. We identified a positive velocity gradient d v x / d y above the weir for tracer particles starting from z 0 = 35   m m . Very close to the left side wall ( z 0 = 45   m m ), the gradient is less pronounced. For z 0 = + 35   m m and z 0 = + 45   m m , v x and y do not correlate clearly, although a symmetrical flow configuration would be expected.
In addition to the velocity gradient d v x / d y within the respective measuring plane z 0 , Figure 10 reveals a gradient d v x / d z between the different planes, which is caused by the side walls. While the highest velocities of up to 100 m m   s 1 were measured in the central plane ( z 0 = 0   m m ), the tracer particles closer to the side walls moved much slower, with less than 50   m m   s 1 . The velocity gradient between the two measuring planes close to the wall on each side, i.e., between z 0 = ± 35   m m and z 0 = ± 45   m m , is smaller and difficult to estimate, particularly as measurement data at y > 6   m m in z 0 = ± 45   m m are lacking.
The plots on the right in Figure 10 show v x against y in the five different measuring planes at the lower surfactant concentration c 2 = 0.5   g   L 1 . In direct comparison to the higher concentration, the velocity level is generally lower. Particularly in the central plane ( z 0 = 0   m m ), v x is less than 50 m m   s 1 . Further, neither a velocity gradient d v x / d y within the respective measuring plane nor a gradient d v x / d z between the planes is clearly visible. Very close to the side walls ( z 0 = ± 45   m m ), v x is in a similar range for both concentrations.
All in all, the X-PTV measurements indicate the symmetry of the flow field at the weir with respect to the central measuring plane. However, it should be noted that the velocity of each tracer particle along its motion path represents a snapshot of the overflowing foam, and the accumulated data were acquired in repeated measurement runs.

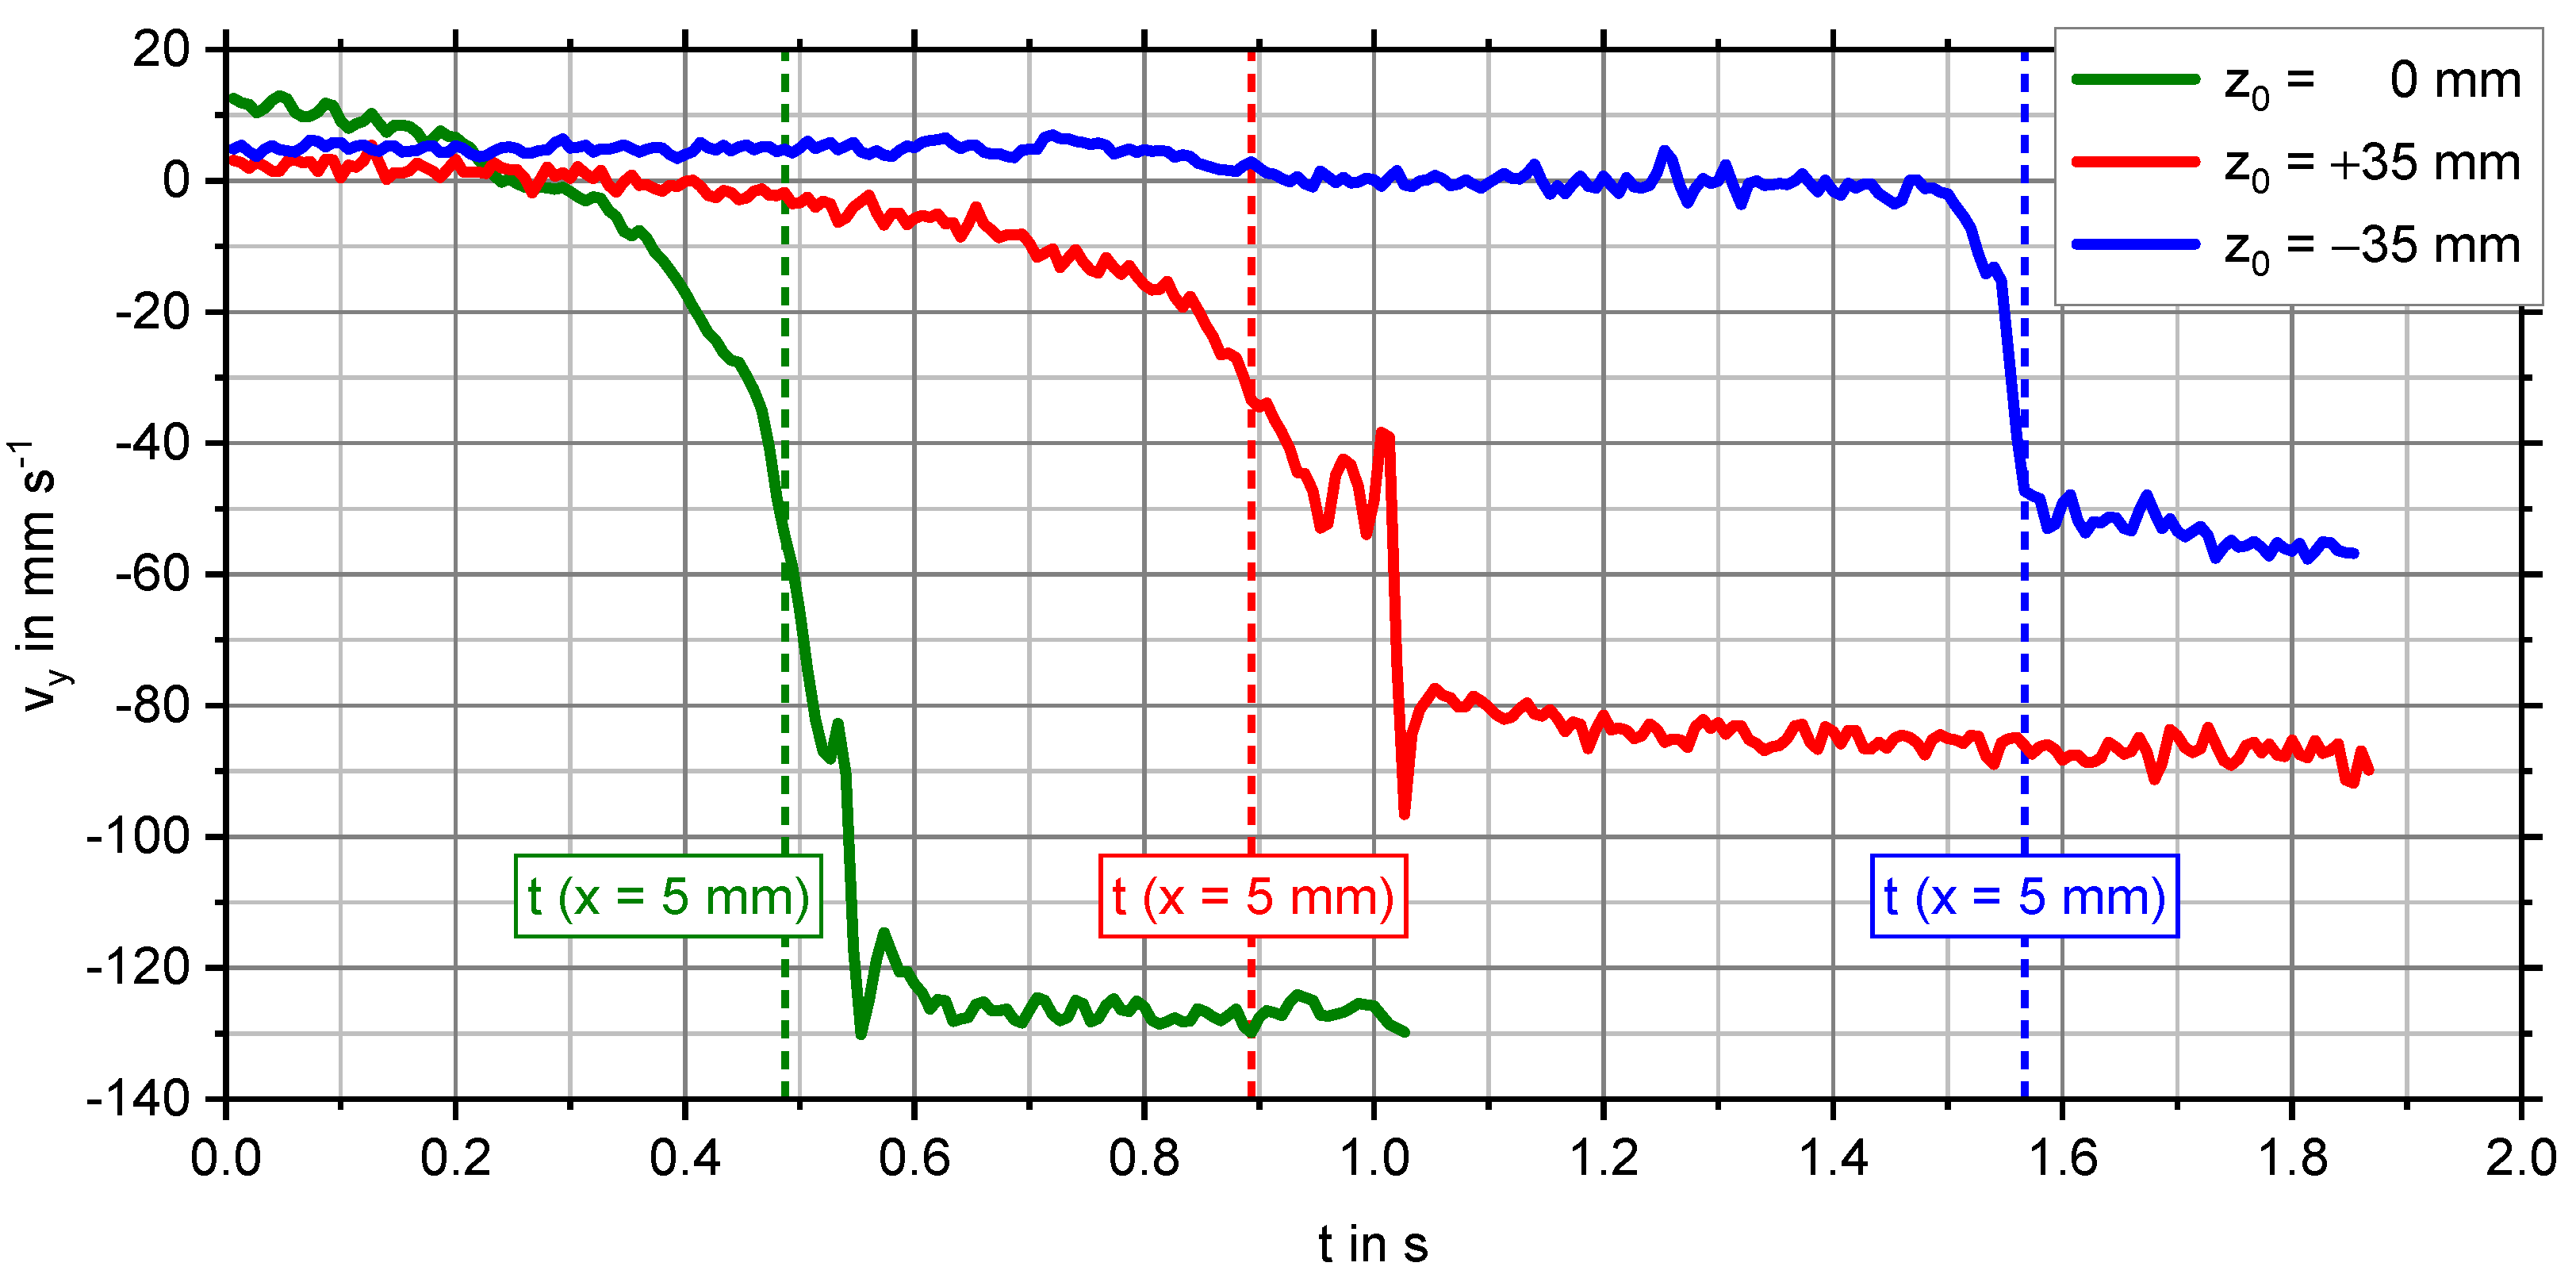
3.3. Vertical Velocity Component Past the Weir

After passing the horizontal weir ( x > 5   m m ), the liquid foam carrying the tracer particles was accelerated by gravity, i.e., in the negative vertical direction. In Figure 11, the vertical velocity component v y over the time t is plotted exemplarily for three tracer particles in different measuring planes during the same measurement run. The maximum magnitude of v y far below the weir, referred to as the terminal velocity in the following, depends on the measuring plane and the previous motion path of the respective tracer particle above the weir. The tracer particle in the central plan ( z 0 = 0   m m ) had the highest terminal velocity, and X-PTV measurements point towards significantly smaller terminal velocities in both the positive and negative z direction, similar to the velocity gradient d v x / d z above the weir. The liquid foam was flowing downwards along the outside of the channel wall, which might be comparable to a film flow. However, reliable X-PTV measurement data are lacking in this region because the projections of many tracer particles were hidden by the projection of the weir, as visible from the X-ray image in Figure 7.

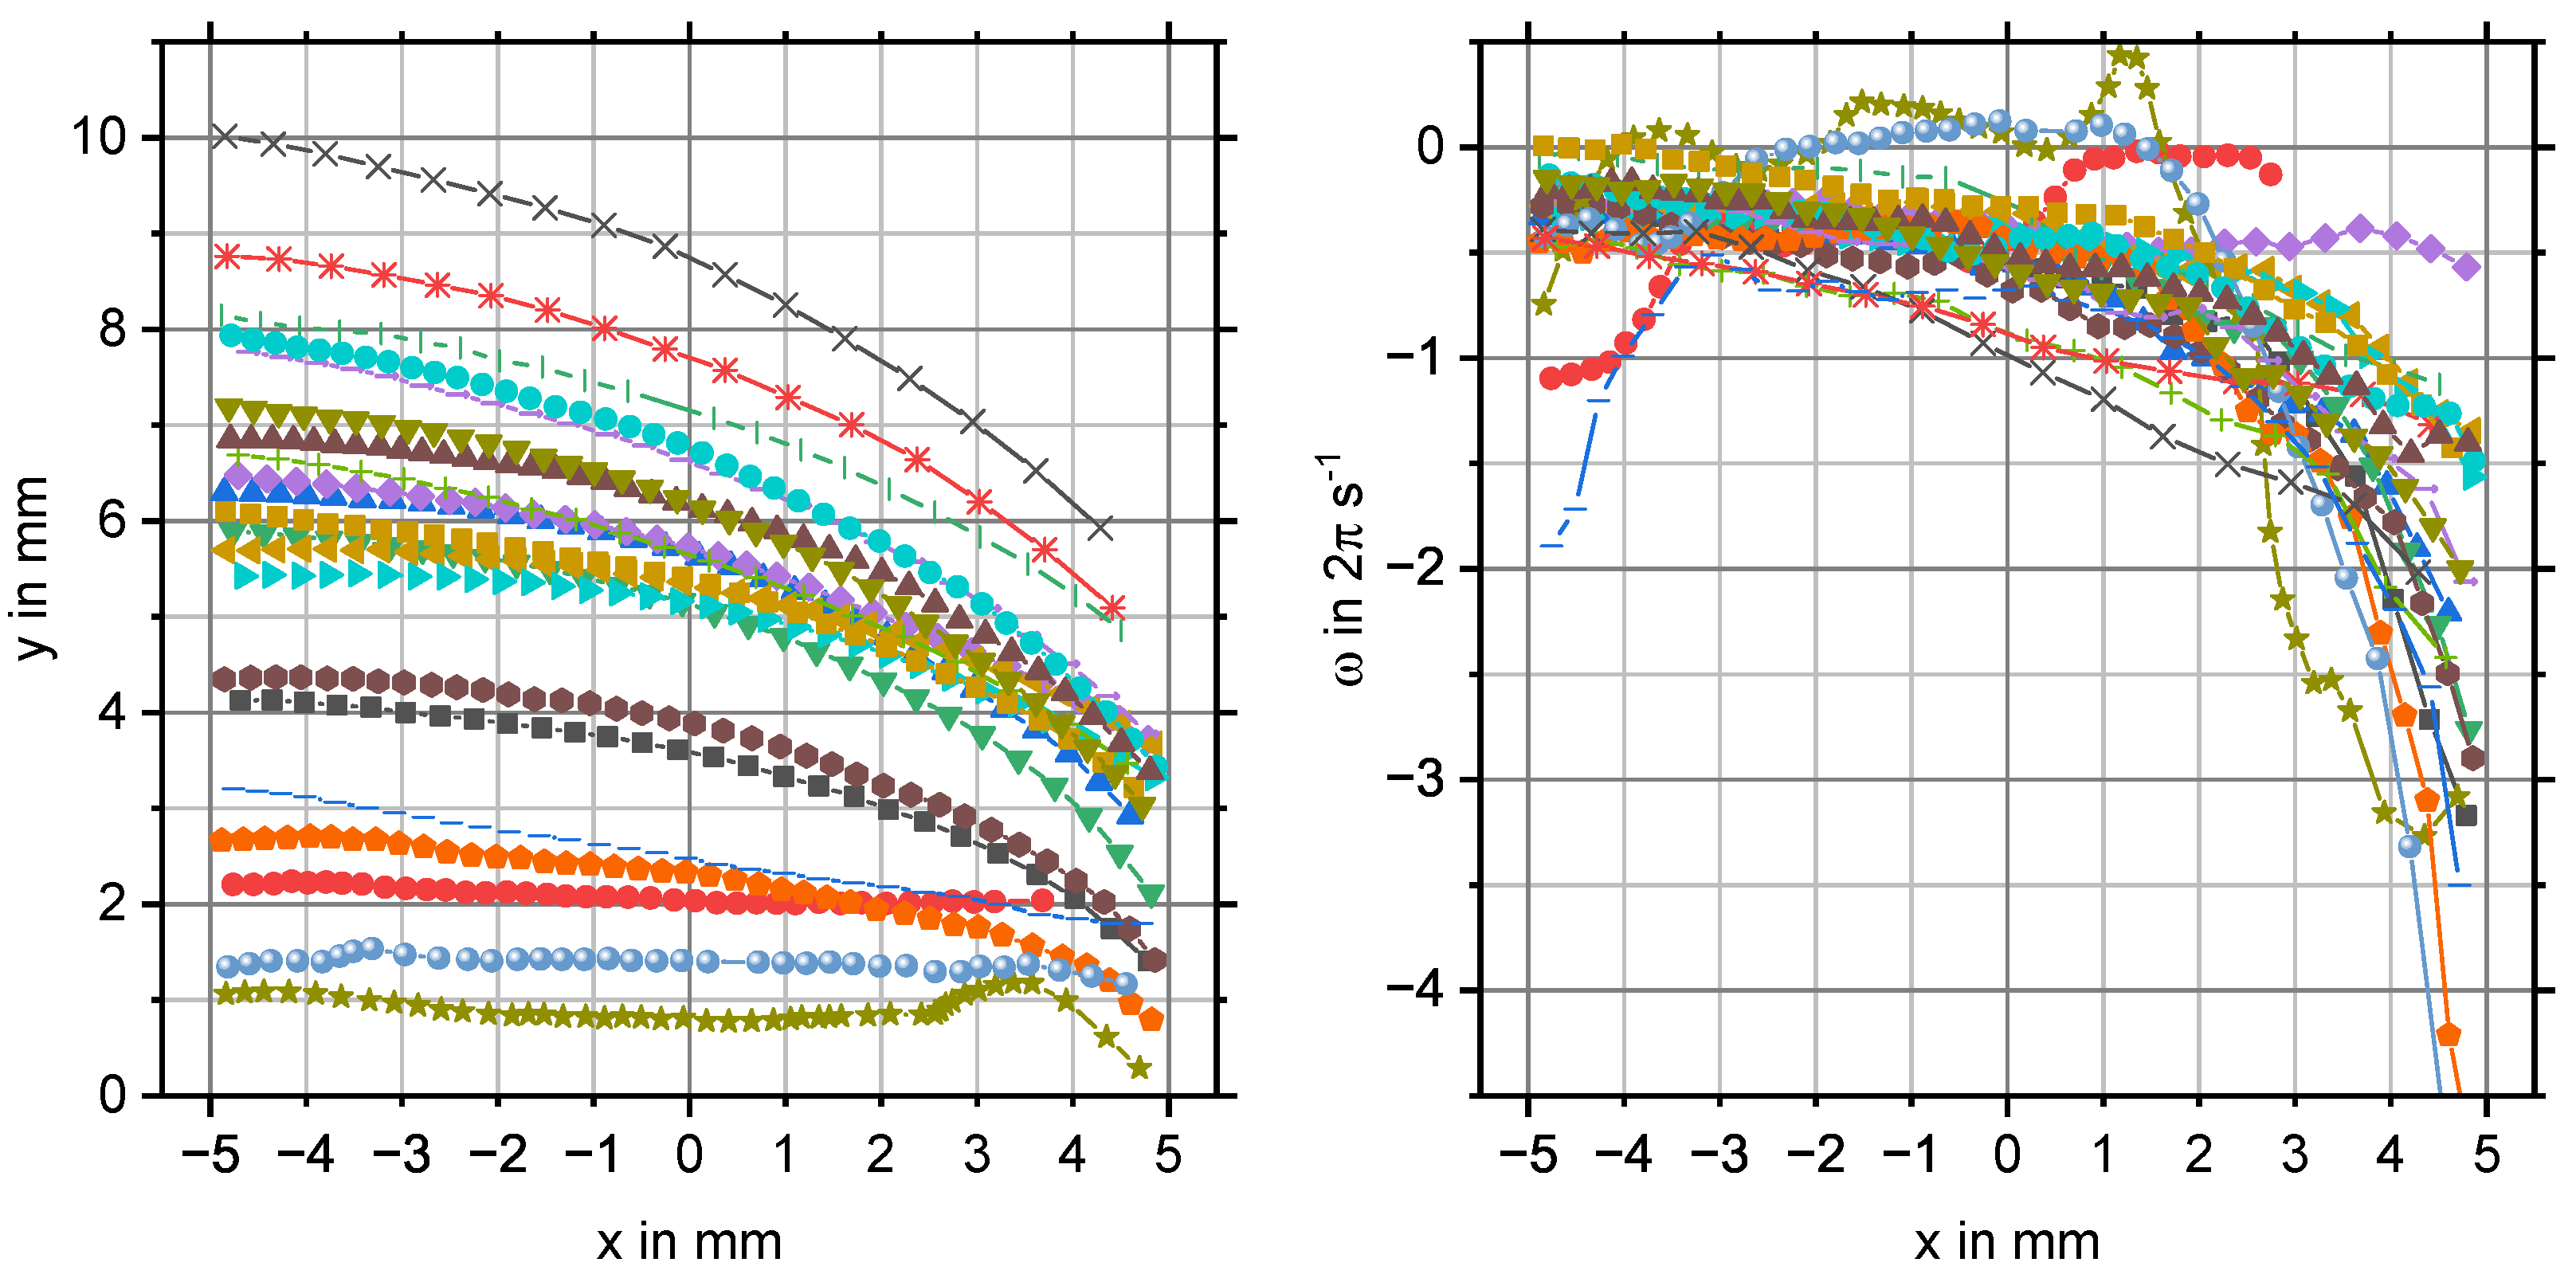
3.4. Intrinsic Rotation at the Weir

Besides particle tracking, the tetrahedral shape of the tracer particles allows for measuring their intrinsic rotation around the z-axis, i.e., in the projection plane. The angular velocity of the intrinsic rotation can support the conclusions drawn from the translational motions of the tracer particles on the foam flow characteristics.
Figure 12 plots the motion paths of the same tracer particles as in Figure 7 and the corresponding angular velocity ω of the intrinsic rotation above the weir. For most tracer particles, the magnitude of their angular velocity increased while passing the weir. This is most likely because of the increasing magnitude of the vertical velocity component v y , as Figure 11 indicates. In addition, there might be a minor contribution of the velocity gradient d v x / d y observed above the weir, causing the tracer particle to slightly rotate in a clockwise direction. This argument requires that the surrounding foam bubbles were smaller than the tracer particle, which holds true according to Figure 2.
The intrinsic rotation is caused by the non-vanishing vorticity × u of the velocity field u = ( u , v , w ) of the flowing foam, i.e., the z-component yields v / x u / y 0 . As seen above, u / y is larger than zero, and therefore, × u is negative.

4. Discussion

In the following, we discuss the relevant properties of the tracer particles as tools for X-ray particle tracking velocimetry (X-PTV) measurements (Section 4.1), also considering the X-ray beam characteristics (Section 4.2). Further, the X-PTV technique is compared with positron emission particle tracking (PEPT) (Section 4.3). Last, we elaborate on the X-PTV measurements for studying foam and froth flows in flotation experiments (Section 4.4).

4.1. Tracer Particles

This experimental study investigates the liquid foam flow over a horizontal weir, where the velocity field was measured by means of X-PTV using custom-tailored tracer particles. Their ability to follow the overflowing foam as well as their visibility in the X-ray images were the key for reliable flow measurements.
Each tracer particle was composed of a polymer tetrahedron with 4.0   m m edge length and four metal beads, 0.5   m m in diameter and made of the lead–tin alloy Pb90Sn10. Because of the high mass density of the main alloying element lead, the mass of one metal bead equaled approximately 0.7   m g . In combination with the given diameter and the spherical shape, the ratio of the weight to the projected area yielded approximately 35 N   m 2 . The yield stress of a liquid foam at 10% liquid fraction is typically in a similar range, i.e., around 40 N   m 2 as reported in [53], and reduces with increasing liquid fraction. As a result, an individual metal bead is likely to fall through the liquid foam [54] and, depending on its contact angle with the foam film, may cause film rupture [55]. In contrast, the total mass of one tracer particle, as shown in Figure 4b, equalled (10.0 ± 0.4) mg on average, meaning that the mass fractions of the four metal beads and the polymer tetrahedron including the glue were less than 30% and more than 70%, respectively. The weight-to-area ratio of such a tracer particle was approximately 14 N   m 2 , thus lower than the estimated yield stress of the liquid foam, which consequently was able to carry the tracer particle well. In our previous X-PTV study [42], we used tracer particles that were 3D-printed completely from metal. They had a comparable weight-to-area ratio of 15 N   m 2 . However, their shape was less symmetrical, and for this reason, they could have preferential directions to stick to the bubble-scale foam structure. In addition, as that was the first approach, we focused on very stable liquid foams with a surfactant concentration above the critical micelle concentration, yielding less than approximately a 5% liquid fraction.
In addition to the tracer particles used for the X-PTV measurements reported here, Table 2 lists three more combinations regarding the sizes of the polymer tetrahedron and the metal beads as well as the resulting weight-to-area ratio of the tracer particle.
Shortening the edge length of the polymer tetrahedra from 4 m m to 2 m m while keeping the diameter of the metal beads constant at 0.5   m m has no beneficial effect on the weight-to-area ratio. Using smaller metal beads of 0.3   m m in combination with a polymer tetrahedron of 4 m m or 2 mm edge length yields a weight-to-area ratio slightly above or below 10 N   m 2 . However, apart from the more challenging preparation and handling of smaller tracer particles, Figure 5 illustrates that metal beads smaller than 0.5   m m would attenuate the X-rays to a lesser extent, thus reducing the contrast between the projections of each metal bead and the surrounding liquid foam in the X-ray images. In addition, in the case of tracer particles having an edge length of 2 m m , the distances between the projections of the metal beads in the X-ray image would be smaller, and a partial overlap of the projections becomes more likely. As a further consequence, measurement uncertainties may increase.

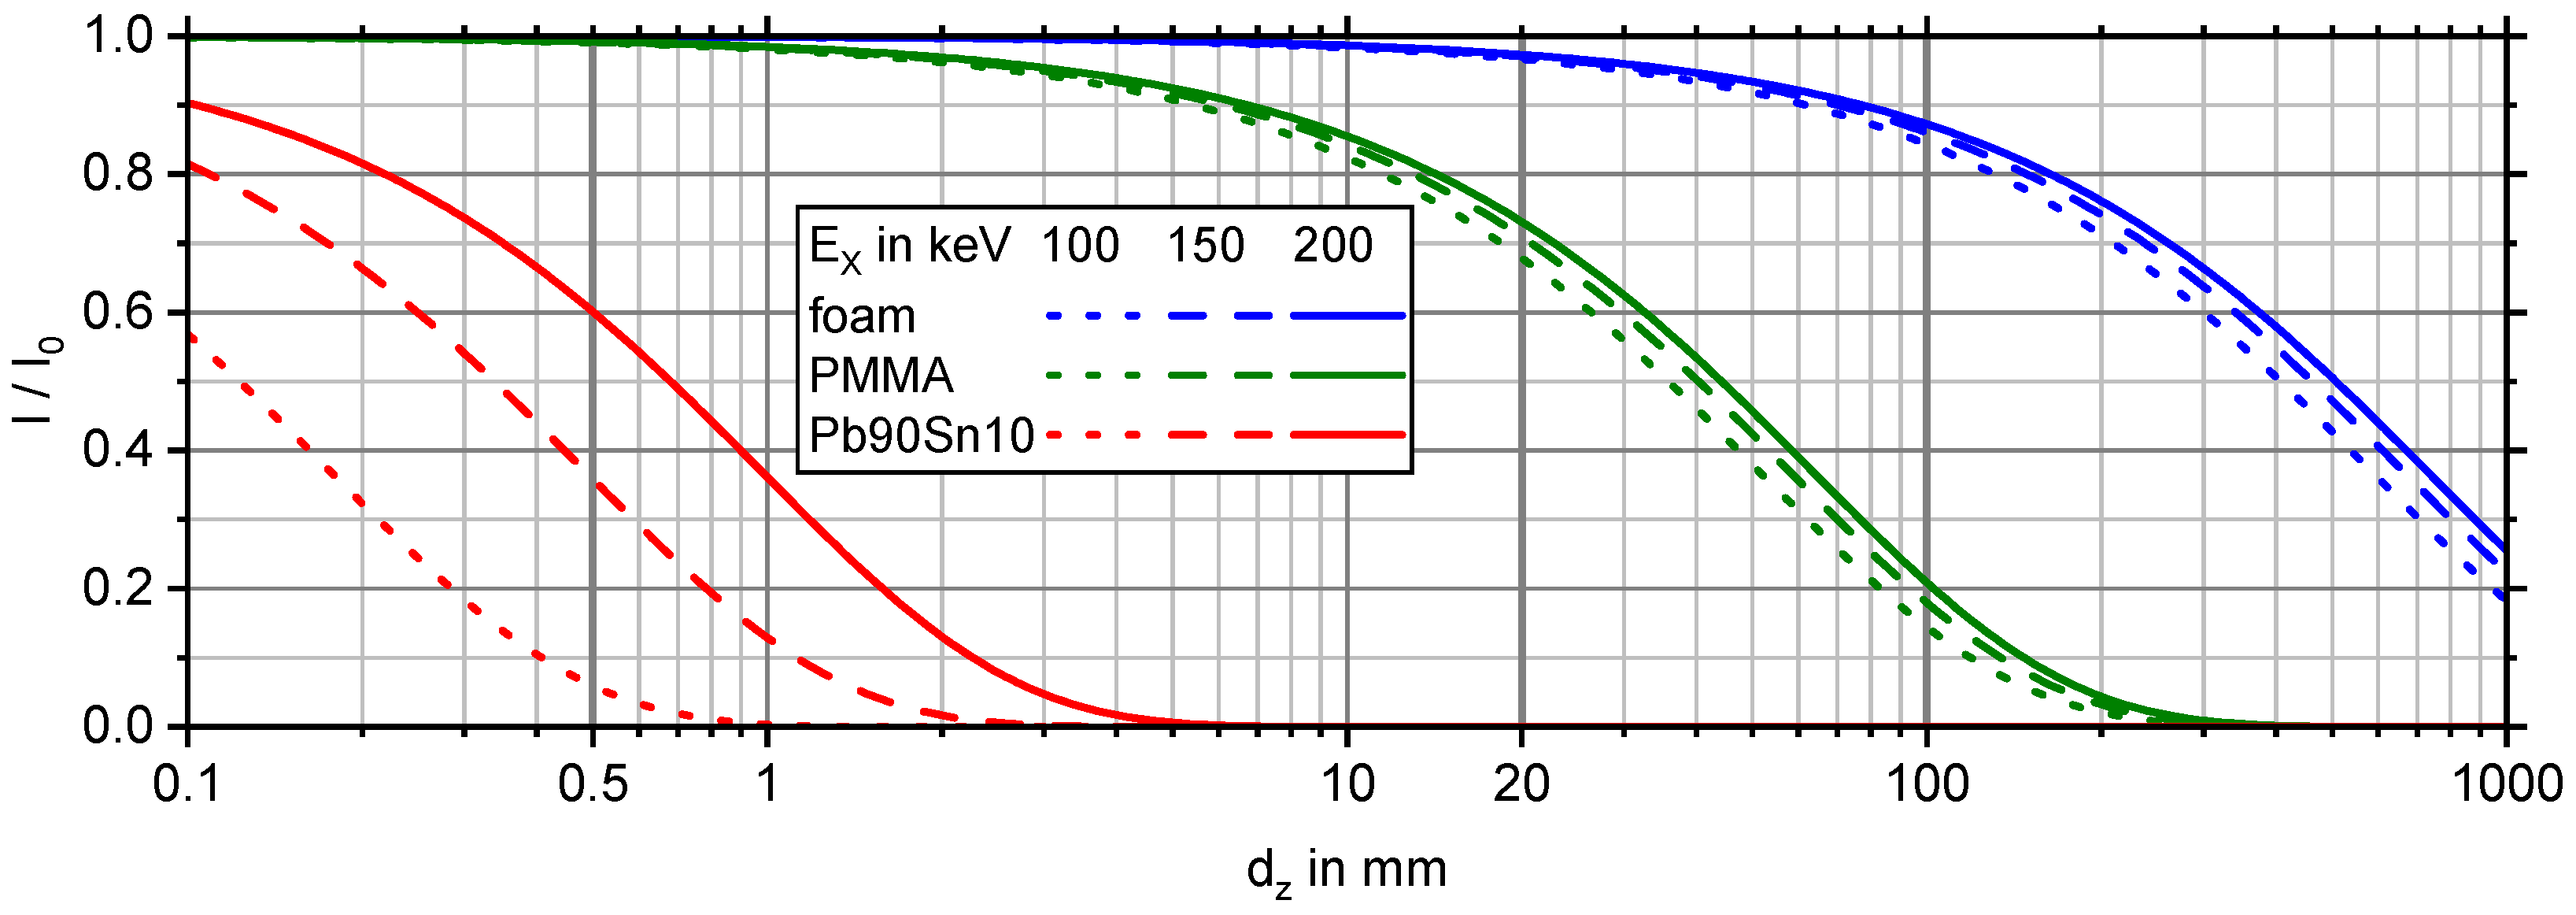
4.2. X-ray Beam Characteristics

X-ray radiography was used for visualising the metal beads as radiopaque features of the tracer particles carried by the flowing foam, thus determining the translational velocity and intrinsic rotation of each tracer particle along its motion path. In this regard, measurement uncertainties mainly arise from the X-ray beam characteristics and the principle of transmission imaging in combination with the three-dimensional measurement volume.
The tracer particles shown in Figure 4c–e were recorded in the same measurement run, of which the X-ray images in Figure 1, Figure 6 and Figure 7 show a snapshot. As these tracer particles were imaged at different positions ( x i , y i ) in the field on view, the image background stemming from the X-ray attenuation by the liquid foam is slightly different in each case. Moreover, the tracer particles were added into the flowing foam at different positions z 0 , i.e., along the X-ray beam direction, by means of small tubes in the bottom left part of the foam channel, which are also visible in Figure 1, Figure 6 and Figure 7. The projections of the metal beads in the X-ray images are affected by geometrical unsharpness: compared to the metal beads of tracer particles that were as close as possible to the scintillation screen (Figure 4d: z 0 = 45   m m ), the blurring is more pronounced the further the tracer particles are away from the scintillation screen (Figure 4c: z 0 = 0   m m , Figure 4e: z 0 = + 45   m m ).
Geometrical unsharpness is caused by the two-dimensional extension of the X-ray tube focal spot, which cannot be considered as a point-like source. The z-position of the tracer particle in the measurement volume mainly determines the geometrical unsharpness; it is reduced if the distance between the tracer particle and the scintillation screen becomes smaller. This basically means that a certain geometrical unsharpness is unavoidable when X-PTV measurements are performed in three-dimensional configurations. However, considering the X-ray tube and the radiography arrangement, the geometrical unsharpness can be reduced by a small focal spot and a large distance to the scintillation screen. Here, using the measurement arrangement as described in Section 2.4, the estimated geometrical unsharpness ranges from approximately 0.05   m m (at z = 50   m m , i.e., closest to the scintillation screen) to almost 0.7   m m (at z = + 50   m m , i.e., furthest from the scintillation screen), which is comparable to the image pixel size and the metal bead diameter, respectively.
As a further consequence of the typical geometrical unsharpness in the X-ray images, the coordinates X b i of the metal beads and X i of the corresponding tracer particle along its motion path cannot be effectively determined with sub-pixel resolution. Achieving a sub-pixel resolution would be the key to the precision of the angle ω i , which describes the intrinsic rotation of the tracer particles and could be used as a direct measure of the vorticity of the foam flow. Another option would be to adapt Equation (8) by weighting ω g i with the distance between the respective metal beads. As a result, the cases where the projections of the metal beads are very close to each other and the angular rotation ω g i is determined to be rather imprecise would have less significance.
Aside from the two-dimensional focal spot leading to geometrical unsharpness, the X-ray tube emits a divergent beam instead of parallel X-rays. The beam divergence causes a magnified projection of the tracer particles the further they are apart from the scintillation screen, whereas tracer particles that are very close to the scintillation screen are projected in their actual size. Similarly, the projected length of the displacement vector of a tracer particle in consecutive frames depends on its z-position with respect to the scintillation screen. To estimate and evaluate the systematic measurement deviation regarding the velocities of the tracer particles, we define the central plane ( z = 0   m m ) as the reference. In other measuring planes, the velocities are either systematically underestimated ( z < 0   m m , i.e., close to the scintillation screen) or overestimated ( z > 0   m m , i.e., far from the scintillation screen). Considering a tracer particle directly at the side wall ( z = ± 50   m m ), the relative systematic deviation of its velocity is ± 10 % at the maximum. This is not significant in comparison to the random uncertainty in various experimental runs in the same measuring plane, as for example shown in Figure 10.
Taking advantage of the X-ray beam divergence, the spatial position of a tracer particle, i.e., also in z-direction along the X-ray beam, could be reconstructed from the projected size of the tracer particle. For this purpose, the projected diameter of the metal beads and/or the projected distance between the metal beads have to be determined and correlated with the z-position. The distances between the metal bead projections of each tracer particle are given by the length of the connecting lines g constructed for determining the intrinsic rotation (Section 2.5), assuming that any rotation out of the projection plane, i.e., around the x- and y-axis, is negligible. Measuring the projected diameter of the metal beads would require different image processing steps (e.g., blurring, edge detection, thresholding, and circle Hough transform) than the employed particle tracking code for X-PTV.

4.3. X-PTV Compared with PEPT

X-ray particle tracking velocimetry (X-PTV) competes with positron emission particle tracking (PEPT), as both measurement techniques employ tracer particles and make use of X-rays or gamma rays for flow visualisation in laboratory-scale experiments with optically opaque fluids such as liquid foam and froth.
PEPT offers the outstanding advantage that very different particles can be prepared as radioactive-labelled tracers, for example small tracer particles in the size range typical for froth flotation in mineral processing [24], composite particles with a coating as surface functionalisation [25,28], or directly activated mineral particles [26]. In the case of PEPT tracer particles made from haematite or quartz, having a size of approximately 0.1   m m in diameter, the estimated weight-to-area is smaller than 10 N   m 2 and, therefore, lower than that of the X-PTV tracer particles used here (Section 4.1, Table 2).
Because of the inherent measurement principle of positron emission tomography (PET) scanners, the spatial resolution in PEPT measurements is typically in the order of 1 m m , and the total number of tracer particles in the measurement volume is limited to a very few. Usually, only one or two tracer particles should be in the region of interest at the same time in order to detect and distinguish them from each other. Using tracer particles with sufficiently different activities, up to three of them have been tracked at once [27].
X-PTV is based on particle tracking algorithms established for optical measurements. Compared to PET scanners for PEPT measurements, X-ray imaging instruments are in wide use in different fields, such as medicine, material science, and engineering, thus more easily available and accessible. For X-PTV measurements in liquid foam and froth, custom-tailored tracer particles are required. Progressing from our first prototypes of fully metallic tracer particles [42], here we used composite particles consisting of a small polymer tetrahedron with tiny metal beads at its tips. The tetrahedral base body is characterised by a high symmetry and, therefore, does not have a distinct preferential direction to stick to the bubble-scale foam structure. The metal beads serving as radiopaque features have the same diameter and distance from each other, which facilitates the image processing and makes the data analysis more robust, thus reducing random measurement uncertainties.
Compared to PEPT measurements, X-PTV is able to provide a higher spatial resolution but needs larger and heavier tracer particles. In the X-PTV measurements presented here, the effective spatial resolution was 0.1 mm to 0.2 mm, which is between the image pixel size of approximately 0.05   m m and the metal bead diameter of 0.5   m m . However, because of the measurement principle of transmission imaging, this spatial resolution is achieved only in measuring planes perpendicular to the X-ray beam direction. Along the beam direction, the position of the tracer particles has to be estimated from the projected size of the metal beads in the X-ray images, yielding a similar spatial resolution in this direction as commonly reported for PEPT measurements.
Depending on the foam properties and flow conditions, the total mass of the composite tracer particles has to be considered. X-PTV with these tracers may come to its limit in unstable foam at high liquid fraction, i.e., if the yield stress of the foam is lower than the weight-to-area ratio of a tracer particle. At high flow velocities, the tracer particles may be affected by their inertia and not able to follow the streamlines of the foam flow very well.
Similar to PEPT measurements, the total number of X-PTV tracer particles in the measurement volume is limited in order to detect and distinguish them without having overlapping projections of the metal beads in the X-ray images. Here, we tracked only three tracer particles in each measurement run, but the total number can be increased if the region of interest, i.e., the measurement volume in the x- and y-direction, is larger.
Simultaneously with the X-PTV measurement for determining the flow velocity, X-ray radiography may allow for liquid fraction measurements. According to Beer–Lambert’s law, the effective X-ray attenuation coefficient depends on the liquid fraction, which therefore has a small but measurable effect on the resulting X-ray transmittance of the foam in the measurement volume. Extending the image processing and analysis of the acquired X-ray images, we will map the liquid fraction distribution of the overflowing foam and track its evolution over time. While the electrode pairs allow for point-wise measurements at a certain distance to the weir, the liquid fraction mapping is expected to provide a more detailed insight into the same measurement volume at the weir as the X-PTV measurements.

4.4. Overflowing Foam

The X-PTV measurements at the weir of the foam flow channel revealed velocity gradients in different directions. The horizontal velocity component v x increased in the horizontal direction ( 5   m m < x < + 5   m m ), i.e., while the tracer particles were carried with the overflowing foam from the channel over the weir into the open surrounding (Figure 9). More importantly, v x also increased in the vertical direction ( y > 0   m m ), i.e., with increasing height above the weir crest (Figure 10). The maximum velocity was measured underneath the free surface of the foam and reached up to 100 m m   s 1 . However, based on the optical observation with the naked eye, the surface velocity is expected to be lower.
In contrast to optical measurements in a quasi-two-dimensional case [13], X-PTV allows for the flow characterisation in a real three-dimensional measurement volume, whose dimensions in all three spatial directions, including in 50   m m < z < + 50   m m along the X-ray beam direction, is significantly larger than the foam bubble size (≲ 1 m m ). We found that the horizontal velocity component v x also has gradients in the z direction at the weir (Figure 10). While the highest velocities were measured in the central plane ( z 0 = 0   m m ), the velocities of tracer particles close to the left ( z 0 = + 45   m m ) and right side wall of the foam channel ( z 0 = 45   m m ) were lower. The difference was more pronounced in the case of the higher surfactant concentration c 1 = 1.0   g   L 1 , but for c 2 = 0.5   g   L 1 , the velocities were at a generally lower level.
The lower surfactant concentration results in a lower foam stability. As a consequence, a certain fraction of the constant volumetric flow rate of the compressed air escaped into the environment, which reduced the volumetric flow rate of foam over the weir accordingly. In addition, the coarser foam at the weir has less drainage resistance. Foam with a lower liquid fraction is characterised by a higher stress yield [53]. Because of this, hydrostatic forces are reduced, and the foam is more likely to show a plug-like flow behaviour including wall slip.
The average flow velocity of the foam across the weir can be roughly estimated based on the constant volumetric flow rate ( V ˙ = 0.05   L   s 1 ) and the weir geometry (rectangular cross section: 100 m m width). Assuming 10 m m total foam height and neglecting the liquid fraction of the foam as well as bubble rupture at the free surface, the average velocity equals 50 m m   s 1 . As visible from Figure 9, this is in good agreement with the velocity range measured by means of X-PTV.
To the best of the authors’ knowledge, experimental or numerical studies on the velocity field of an overflowing foam or froth have not been reported yet for three-dimensional configurations. The shortage of experimental data in such configurations may stem from the lack of measurement techniques that are applicable to foam and froth flows. X-ray micro-tomography is able to image three-dimensional liquid foam flows [38,39] but only allows for flow investigation in a small millimetre-sized measurement volume and at low flow velocity of less than 0.1   m m   s 1 . Boucher et al. [26] used positron emission particle tracking to determine the velocity field in a laboratory-scale flotation cell equipped with an impeller and baffles. The measurement focused on the particle motion in the pulp and near the pulp–froth interface, but an overflow of the froth phase was not desired; thus it was prevented in this PEPT study. Cole et al. [13] reported optical measurements of an overflowing foam in a 5 m m thin, i.e., quasi-two-dimensional Hele–Shaw type column. Foam bubbles were tracked to reconstruct the flow streamlines in an approximately 150 mm × 300 m m area of interest, which unfortunately did not include the foam overflow across the weir. Consequently, based on these previous experimental studies reported in the literature, a direct comparison with and validation of the X-PTV results reported here are not feasible. In this regard, our experimental study on overflowing foam may support the validation of other measurement techniques or foam flow models in the future.
Summing up, the X-PTV measurements presented here provide a unique insight into the three-dimensional velocity field of the overflowing foam at the weir. For comparison purposes, we will perform further optical flow measurements with the same foam parameters and flow conditions, aiming to determine the velocity of the foam bubbles visible through the transparent side wall as well as at the free surface of the liquid foam. The X-PTV technique extends the measurement possibilities for characterising the foam or froth phase in laboratory-scale flotation cells. On a larger scale, froth cameras are commonly used for monitoring and extracting visual features in industrial flotation processes [56]. However, optical measurements aiming for a very detailed characterisation of the overflowing foam or froth are lacking. In particular, a three-dimensional reconstruction of the froth surface in combination with X-PTV measurements is needed to further investigate effects and deepen the understanding of the froth phase on particle recovery in flotation processes.

5. Conclusions

In this experimental study, we characterised the three-dimensional velocity field of an aqueous foam freely overflowing a horizontal weir. We measured the velocity profile above the weir: the local velocity increased in the vertical direction, reaching the maximum value underneath the free surface of the liquid foam. Just above the weir crest, the local velocity was not equal to zero, as one would have expected in the case of Newtonian fluids. The flow measurements were performed in a laboratory-scale flow channel with foam at an approximately 10% liquid fraction, which was inspired by froth flotation for mineral processing. As liquid foam is not transparent for visible light, the measurement volume underneath the free surface was not accessible for optical observation. Instead, we applied X-PTV, which combines X-ray radiography and particle tracking velocimetry, employing tracer particles that were custom-tailored for foam flows. These particles served as tools for flow tracing and local velocity measurements in time-resolved X-ray image sequences.
Extending our first approach [42], we standardised the tracer particles regarding their shape, size, and mass: four tiny metal beads acted as radiopaque features at the four tips of a small polymer tetrahedron. We showcased that the liquid foam at relatively high liquid fraction carries these tracer particles very well, meaning that the velocity of the tracer particles along their motion paths represents the local flow velocity along the stream lines of the foam flow. Additionally, the tetrahedral shape of the tracer particles allows us to determine the flow vorticity directly. Such tracer particles, slightly resized if necessary with respect to the foam bubble size and liquid fraction, are suitable measurement tools for flow tracing in different three-dimensional and therefore optically opaque configurations. These include foam flows in benchmark flow configurations, such as a jet or cylinder flow, or overflowing froth laden with mineral particles in froth flotation experiments. Beyond that, the X-PTV approach with custom-tailored tracer particles may be applicable for flow measurements in high-viscosity fluids, such as optically opaque suspensions with a high solid fraction, crude oil, polymer melts, or complex fluids in food production.
The further experimental investigation of the overflowing foam at the horizontal weir will focus on the comparison between the X-PTV measurement reported here and optical flow measurements through the transparent channel wall as well as at the free surface of the liquid foam. In addition, X-ray radiography may provide a mapping of the liquid fraction distribution in the foam channel and particularly at the weir, which would extend the point-wise liquid fraction measurement by means of the electrode pairs. In sum, X-ray radiography and supporting optical measurements are expected to give a comprehensive insight into the local flow velocity and liquid fraction of the foam beneath its free surface.

Author Contributions

T.L., D.H., and J.S. performed the experiments, processed and analysed the measurement data; M.Z. set up the liquid fraction measurement; N.S., S.E., and K.E. provided the experimental resources and supported the discussion on the approach and feasibility of the study; S.H. acquired funding, conceptualised, and supervised the study. T.L. and D.H. prepared the original draft. All authors contributed to reviewing and editing the original draft. All authors have read and agreed to the published version of the manuscript.

Funding

This research was funded by the German Research Foundation, grant number HE 7529/3-1, and by the German Federal Ministry of Education and Research, grant number 03HY123E.

Institutional Review Board Statement

Not applicable.

Informed Consent Statement

Not applicable.

Data Availability Statement

The data presented in this study are available on reasonable request from the corresponding authors.

Acknowledgments

We gratefully acknowledge Peggy Jähnigen and Robin Michak for their technical assistance in preparing the foam experiments and X-ray measurements. Further thanks are due to Ekaterina Zamaraeva for the initial test measurements in the frame of her summer student project and to Julius Weber for measuring and analysing the foam bubble size during his student internship.

Conflicts of Interest

The authors declare no conflict of interest.

Abbreviations

The following abbreviations are used in this manuscript:
EPelectrode pair
CMCcritical micelle concentration
SDSsodium dodecyl sulfate
PEPTpositron emission particle tracking
PETpositron emission tomography
PTVparticle tracking velocimetry
X-PTVX-ray particle tracking velocimetry

References

  1. Dracos, T. Particle Tracking Velocimetry (PTV). In Three-Dimensional Velocity and Vorticity Measuring and Image Analysis Techniques; Hutchinson, P., Rodi, W., Dracos, T., Eds.; Springer: Dordrecht, The Netherlands, 1996; Volume 4, pp. 155–160. [Google Scholar] [CrossRef]
  2. Sommer, A.E.; Nikpay, M.; Heitkam, S.; Rudolph, M.; Eckert, K. A novel method for measuring flotation recovery by means of 4D Particle Tracking Velocimetry. Miner. Eng. 2018, 124, 116–122. [Google Scholar] [CrossRef]
  3. Tropea, C.; Yarin, A.L.; Foss, J.F. (Eds.) Springer Handbook of Experimental Fluid Mechanics; Springer: Berlin/Heidelberg, Germany, 2007. [Google Scholar]
  4. Raffel, M.; Willert, C.E.; Scarano, F.; Kähler, C.J.; Wereley, S.T.; Kompenhans, J. Particle Image Velocimetry: A Practical Guide; Springer International Publishing: Cham, Switzerland, 2018. [Google Scholar]
  5. Estevadeordal, J.; Goss, L. PIV with LED: Particle shadow velocimetry (PSV) technique. In Proceedings of the 43rd AIAA Aerospace Sciences Meeting and Exhibit, Reno, NV, USA, 10–13 January 2005; American Institute of Aeronautics and Astronautics: Reno, NV, USA, 2005. [Google Scholar] [CrossRef]
  6. Sommer, A.E.; Rox, H.; Shi, P.; Eckert, K.; Rzehak, R. Solid-liquid flow in stirred tanks: “CFD-grade” experimental investigation. Chem. Eng. Sci. 2021, 245, 116743. [Google Scholar] [CrossRef]
  7. Vashisth, S.; Bennington, C.P.; Grace, J.R.; Kerekes, R.J. Column Flotation Deinking: State-of-the-art and opportunities. Resour. Conserv. Recycl. 2011, 55, 1154–1177. [Google Scholar] [CrossRef]
  8. Subrahmanyam, T.; Forssberg, E. Froth stability, particle entrainment and drainage in flotation—A review. Int. J. Miner. Process. 1988, 23, 33–53. [Google Scholar] [CrossRef]
  9. Neethling, S.; Cilliers, J. Solids motion in flowing froths. Chem. Eng. Sci. 2002, 57, 607–615. [Google Scholar] [CrossRef]
  10. Neethling, S.J.; Lee, H.T.; Cilliers, J.J. The recovery of liquid from flowing foams. J. Phys. Condens. Matter 2003, 15, 1563–1576. [Google Scholar] [CrossRef]
  11. Stevenson, P.; Stevanov, C.; Jameson, G. Liquid overflow from a column of rising aqueous froth. Miner. Eng. 2003, 16, 1045–1053. [Google Scholar] [CrossRef]
  12. Li, X.; Wang, X.; Evans, G.M.; Stevenson, P. Foam flowing vertically upwards in pipes through expansions and contractions. Int. J. Multiph. Flow 2011, 37, 802–811. [Google Scholar] [CrossRef]
  13. Cole, K.; Brito-Parada, P.; Xu, C.; Neethling, S.; Cilliers, J. Experimental studies and numerical model validation of overflowing 2D foam to test flotation cell crowder designs. Chem. Eng. Res. Des. 2012, 90, 2196–2201. [Google Scholar] [CrossRef]
  14. Nauber, R.; Büttner, L.; Eckert, K.; Fröhlich, J.; Czarske, J.; Heitkam, S. Ultrasonic measurements of the bulk flow field in foams. Phys. Rev. E 2018, 97, 013113. [Google Scholar] [CrossRef]
  15. Emmerich, H.; Schaller, L.; Nauber, R.; Knüpfer, L.; Heitkam, S.; Czarske, J.; Büttner, L. Linear, spatio-temporally resolved ultrasound measurement of the liquid fraction distribution in froth. tm-Tech. Mess. 2021, 88, 562–570. [Google Scholar] [CrossRef]
  16. Emmerich, H.; Knupfer, L.; Heitkam, S.; Starke, E.; Trtik, P.; Schaller, L.; Weik, D.; Czarske, J. Ultrasound imaging of liquid fraction in foam. IEEE Trans. Instrum. Meas. 2022, 72, 6500211. [Google Scholar] [CrossRef]
  17. Langford, S.; Wiggins, C.; Tenpenny, D.; Ruggles, A. Positron emission particle tracking (PEPT) for fluid flow measurements. Nucl. Eng. Des. 2016, 302, 81–89. [Google Scholar] [CrossRef]
  18. Cole, K.; Barker, D.J.; Brito-Parada, P.R.; Buffler, A.; Hadler, K.; Mackay, I.; Mesa, D.; Morrison, A.J.; Neethling, S.; Norori-McCormac, A.; et al. Standard method for performing Positron Emission Particle Tracking (PEPT) measurements of froth flotation at PEPT Cape Town. MethodsX 2022, 9, 101680. [Google Scholar] [CrossRef] [PubMed]
  19. Waters, K.; Rowson, N.; Fan, X.; Parker, D.; Cilliers, J. Positron emission particle tracking as a method to map the movement of particles in the pulp and froth phases. Miner. Eng. 2008, 21, 877–882. [Google Scholar] [CrossRef]
  20. Waters, K.; Rowson, N.; Fan, X.; Parker, D.; Cilliers, J. The use of positron emission particle tracking as a method for tracking particles in flotation froths. Philos. Mag. Lett. 2008, 88, 735–739. [Google Scholar] [CrossRef]
  21. Waters, K.E.; Rowson, N.A.; Fan, X.; Cilliers, J.J. Following the path of hydrophobic and hydrophilic particles in a Denver Cell using positron emission particle tracking. Asia-Pac. J. Chem. Eng. 2009, 4, 218–225. [Google Scholar] [CrossRef]
  22. Cole, K.; Waters, K.; Parker, D.; Neethling, S.; Cilliers, J. PEPT combined with high speed digital imaging for particle tracking in dynamic foams. Chem. Eng. Sci. 2010, 65, 1887–1890. [Google Scholar] [CrossRef]
  23. Cole, K.; Waters, K.; Fan, X.; Neethling, S.; Cilliers, J. Combining Positron Emission Particle Tracking and image analysis to interpret particle motion in froths. Miner. Eng. 2010, 23, 1036–1044. [Google Scholar] [CrossRef]
  24. Cole, K.; Buffler, A.; van der Meulen, N.; Cilliers, J.; Franzidis, J.P.; Govender, I.; Liu, C.; van Heerden, M. Positron emission particle tracking measurements with 50 micron tracers. Chem. Eng. Sci. 2012, 75, 235–242. [Google Scholar] [CrossRef]
  25. Cole, K.; Buffler, A.; Cilliers, J.; Govender, I.; Heng, J.; Liu, C.; Parker, D.; Shah, U.; van Heerden, M.; Fan, X. A surface coating method to modify tracers for positron emission particle tracking (PEPT) measurements of froth flotation. Powder Technol. 2014, 263, 26–30. [Google Scholar] [CrossRef]
  26. Boucher, D.; Jordens, A.; Sovechles, J.; Langlois, R.; Leadbeater, T.W.; Rowson, N.A.; Cilliers, J.J.; Waters, K.E. Direct mineral tracer activation in positron emission particle tracking of a flotation cell. Miner. Eng. 2017, 100, 155–165. [Google Scholar] [CrossRef]
  27. Wiggins, C.; Santos, R.; Ruggles, A. A novel clustering approach to positron emission particle tracking. Nucl. Instrum. Methods Phys. Res. Sect. A Accel. Spectrometers Detect. Assoc. Equip. 2016, 811, 18–24. [Google Scholar] [CrossRef]
  28. Sommer, A.E.; Ortmann, K.; Van Heerden, M.; Richter, T.; Leadbeater, T.; Cole, K.; Heitkam, S.; Brito-Parada, P.; Eckert, K. Application of Positron Emission Particle Tracking (PEPT) to measure the bubble-particle interaction in a turbulent and dense flow. Miner. Eng. 2020, 156, 106410. [Google Scholar] [CrossRef]
  29. Cole, K.; Brito-Parada, P.; Morrison, A.; Govender, I.; Buffler, A.; Hadler, K.; Cilliers, J. Using Positron Emission Tomography (PET) to determine liquid content in overflowing foam. Chem. Eng. Res. Des. 2015, 94, 721–725. [Google Scholar] [CrossRef] [Green Version]
  30. Heitkam, S.; Rudolph, M.; Lappan, T.; Sarma, M.; Eckert, S.; Trtik, P.; Lehmann, E.; Vontobel, P.; Eckert, K. Neutron imaging of froth structure and particle motion. Miner. Eng. 2018, 119, 126–129. [Google Scholar] [CrossRef]
  31. Ziauddin, M.; Schleicher, E.; Trtik, P.; Knüpfer, L.; Skrypnik, A.; Lappan, T.; Eckert, K.; Heitkam, S. Comparing wire-mesh sensor with neutron radiography for measurement of liquid fraction in foam. J. Phys. Condens. Matter 2023, 35, 015101. [Google Scholar] [CrossRef]
  32. Heitkam, S.; Lappan, T.; Eckert, S.; Trtik, P.; Eckert, K. Tracking of particles in froth using neutron imaging. Chem. Ing. Tech. 2019, 91, 1001–1007. [Google Scholar] [CrossRef]
  33. Lappan, T.; Sarma, M.; Heitkam, S.; Trtik, P.; Mannes, D.; Eckert, K.; Eckert, S. Neutron radiography of particle-laden liquid metal flow driven by an electromagnetic induction pump. Magnetohydrodynamics 2020, 56, 167–176. [Google Scholar] [CrossRef]
  34. Birjukovs, M.; Zvejnieks, P.; Lappan, T.; Sarma, M.; Heitkam, S.; Trtik, P.; Mannes, D.; Eckert, S.; Jakovics, A. Particle tracking velocimetry in liquid gallium flow around a cylindrical obstacle. Exp. Fluids 2022, 63, 99. [Google Scholar] [CrossRef]
  35. Solórzano, E.; Pardo-Alonso, S.; de Saja, J.; Rodríguez-Pérez, M. Study of aqueous foams evolution by means of X-ray radioscopy. Colloids Surfaces A Physicochem. Eng. Asp. 2013, 438, 159–166. [Google Scholar] [CrossRef]
  36. García-Moreno, F.; Kamm, P.; Neu, T.; Heim, K.; Rack, A.; Banhart, J. In situ X-ray tomography of aqueous foams: Analysis of columnar foam generation. Colloids Surfaces A Physicochem. Eng. Asp. 2017, 534, 78–84. [Google Scholar] [CrossRef] [Green Version]
  37. García-Moreno, F.; Kamm, P.H.; Neu, T.R.; Bülk, F.; Mokso, R.; Schlepütz, C.M.; Stampanoni, M.; Banhart, J. Using X-ray tomoscopy to explore the dynamics of foaming metal. Nat. Commun. 2019, 10, 3762. [Google Scholar] [CrossRef] [PubMed] [Green Version]
  38. Raufaste, C.; Dollet, B.; Mader, K.; Santucci, S.; Mokso, R. Three-dimensional foam flow resolved by fast X-ray tomographic microscopy. Europhys. Lett. 2015, 111, 38004. [Google Scholar] [CrossRef] [Green Version]
  39. Schott, F.; Dollet, B.; Santucci, S.; Claudet, C.; Argentina, M.; Raufaste, C.; Mokso, R. Three-dimensional liquid foam flow through a hopper resolved by fast X-ray microtomography. Soft Matter 2023. [Google Scholar] [CrossRef]
  40. Drake, J.B.; Kenney, A.L.; Morgan, T.B.; Heindel, T.J. Developing tracer particles for X-ray particle tracking velocimetry. In Proceedings of the ASME-JSME-KSME 2011 Joint Fluids Engineering Conference: Volume 1, Symposia—Parts A, B, C, and D, Hamamatsu, Japan, 24–29 July 2011; ASMEDC: Hamamatsu, Japan, 2011; pp. 2685–2692. [Google Scholar] [CrossRef] [Green Version]
  41. Parker, J.T.; DeBerardinis, J.; Mäkiharju, S.A. Enhanced laboratory X-ray particle tracking velocimetry with newly developed tungsten-coated O(50 μm) tracers. Exp. Fluids 2022, 63, 184. [Google Scholar] [CrossRef]
  42. Lappan, T.; Franz, A.; Schwab, H.; Kühn, U.; Eckert, S.; Eckert, K.; Heitkam, S. X-ray particle tracking velocimetry in liquid foam flow. Soft Matter 2020, 16, 2093–2103. [Google Scholar] [CrossRef]
  43. Neethling, S.; Brito-Parada, P. Predicting flotation behaviour – The interaction between froth stability and performance. Miner. Eng. 2018, 120, 60–65. [Google Scholar] [CrossRef]
  44. Dominguez, A.; Fernandez, A.; Gonzalez, N.; Iglesias, E.; Montenegro, L. Determination of critical micelle concentration of some surfactants by three techniques. J. Chem. Educ. 1997, 74, 1227. [Google Scholar] [CrossRef]
  45. Mysels, K.J. Surface tension of solutions of pure sodium dodecyl sulfate. Langmuir 1986, 2, 423–428. [Google Scholar] [CrossRef]
  46. Hernáinz, F.; Caro, A. Variation of surface tension in aqueous solutions of sodium dodecyl sulfate in the flotation bath. Colloids Surfaces A Physicochem. Eng. Asp. 2002, 196, 19–24. [Google Scholar] [CrossRef]
  47. Feitosa, K.; Marze, S.; Saint-Jalmes, A.; Durian, D.J. Electrical conductivity of dispersions: From dry foams to dilute suspensions. J. Phys. Condens. Matter 2005, 17, 6301–6305. [Google Scholar] [CrossRef]
  48. Seltzer, S. Tables of X-ray Mass Attenuation Coefficients and Mass Energy-Absorption Coefficients, NIST Standard Reference Database 126. 1995. Available online: http://www.nist.gov/pml/data/xraycoef/index.cfm (accessed on 10 December 2022).
  49. Lappan, T.; Sarma, M.; Heitkam, S.; Mannes, D.; Trtik, P.; Shevchenko, N.; Eckert, K.; Eckert, S. X-ray and neutron radiographic experiments on particle-laden molten metal flows. In Materials Processing Fundamentals 2021; Lee, J., Wagstaff, S., Anderson, A., Tesfaye, F., Lambotte, G., Allanore, A., Eds.; The Minerals, Metals & Materials Series; Springer International Publishing: Cham, Switzerland, 2021; pp. 13–29. [Google Scholar]
  50. Spieß, L.; Teichert, G.; Schwarzer, R.; Behnken, H.; Genzel, C. Moderne Röntgenbeugung; Vieweg+Teubner: Wiesbaden, Germany, 2009. [Google Scholar]
  51. Blair, D.; Dufresne, E. The Matlab Particle Tracking Code Repository. Available online: https://site.physics.georgetown.edu/matlab/index.html (accessed on 10 December 2022).
  52. Crocker, J.C.; Grier, D.G. Methods of Digital Video Microscopy for Colloidal Studies. J. Colloid Interface Sci. 1996, 179, 298–310. [Google Scholar] [CrossRef] [Green Version]
  53. Rouyer, F.; Cohen-Addad, S.; Höhler, R. Is the yield stress of aqueous foam a well-defined quantity? Colloids Surfaces A Physicochem. Eng. Asp. 2005, 263, 111–116. [Google Scholar] [CrossRef]
  54. Cox, S.J.; Davies, I.T. Bubble entrainment by a sphere falling through a horizontal soap foam. EPL 2020, 130, 14002. [Google Scholar] [CrossRef]
  55. Morris, G.; Neethling, S.; Cilliers, J. Modelling the self orientation of particles in a film. Miner. Eng. 2012, 33, 87–92. [Google Scholar] [CrossRef]
  56. Zhao, L.; Peng, T.; Xie, Y.; Gui, W.; Zhao, Y. Froth stereo visual feature extraction for the industrial flotation process. Ind. Eng. Chem. Res. 2019, 58, 14510–14519. [Google Scholar] [CrossRef]
Figure 1. Overflowing foam is imaged in a laboratory-scale experiment by means of X-ray radiographic measurements employing customised tracer particles. Local flow velocities are determined using X-ray particle tracking velocimetry. Near the weir, the liquid fraction of the foam is monitored by measuring its electric conductivity between three different electrode pairs (EP1, EP2, EP3). The red, green and blue lines highlighted in the X-ray image on the right indicate the motion paths of three different tracer particles, particularly their radiopaque features.
Applsci 13 01765 g001
Figure 2. Foam bubbles at the weir, imaged through the transparent side wall: for both SDS surfactant concentrations in (a,b), the bubble size range spans from approximately 0.2   m m to 1.0   m m .
Applsci 13 01765 g002
Figure 3. Liquid fraction ϕ l of the foam for the two different SDS concentrations, determined from the electrical conductivity between the left (EP1), middle (EP2), and right electrode pair (EP3), measured in several measurement runs over a measurement time of 10 s each. Liquid fraction data from EP1, EP2, and EP3 in the same measurement run are indicated by the same colour and symbol.
Applsci 13 01765 g003
Figure 4. Custom-tailored tracer particles: (a) based on the CAD concept, small tetrahedra were 3D-printed from polymer material and (b) small metal beads were glued to the tips of each tetrahedron. (ce) In the X-ray images, only the four metal beads per tetrahedron are visible, (f) which can be clearly distinguished from the surrounding liquid foam and from the statistical image noise.
Applsci 13 01765 g004
Figure 5. X-ray attenuation characteristics, calculated by Beer–Lambert’s law (Equation (1)): the X-ray transmittance I / I 0 depends on the penetrated material, i.e., its X-ray attenuation coefficient μ X and thickness d z along the X-ray beam direction. In the case of the metal beads (Pb90Sn10, d z 0.5   m m ) serving as radiopaque features of the tracer particles in the foam at 10% liquid fraction, the X-ray photon energy E X also has a significant effect on the X-ray transmittance.
Applsci 13 01765 g005
Figure 6. Image pre-processing before detecting the tracer particles, particularly the four metal beads of each tracer: (a) the original grey-scale image (b) was colour-inverted and (c) the background image acquired without tracer particles (d) was subtracted. The positions of the three different tracers are highlighted by the red circles in each image.
Applsci 13 01765 g006
Figure 7. Tracking of tracer particles carried by the overflowing foam in different measuring planes z of the three-dimensional configuration: using small tubes, three tracer particles were added into the foam flow at different but fixed starting positions ( x 0 , y 0 , z 0 ) in each measurement run in order to distinguish them from each other. The X-ray image, here a minimum intensity projection over time, visualises the motions paths of the three tracer particles during one measurement run. The focus was on the horizontal weir of the foam flow channel. As indicated in the three-dimensional sketch, the side walls at z = ± 50   m m were transparent for both visible light and X-rays to a large extent.
Applsci 13 01765 g007
Figure 8. Tracer particles carried by the overflowing foam ( c 1 = 1.0   g   L 1 ) in the central measuring plane ( z 0 = 0   m m ) at the weir: along their motion paths, the horizontal velocity component v x is plotted over the horizontal position x. The same tracer particle is indicated by the same symbol and colour in both plots.
Applsci 13 01765 g008
Figure 9. Tracer particles in the central measuring plane ( z 0 = 0   m m ) at the weir: the horizontal velocity component v x is plotted against the vertical position y above the weir. The overall velocity level is slightly increasing, while the liquid foam ( c 1 = 1.0   g   L 1 ) with the tracer particles approaches the weir crest ( 5   m m < x < 2   m m , plot on the top), flows over it ( 2   m m < x < + 2   m m , plot in the middle), and moves on ( + 2   m m < x < + 5   m m , plot on the bottom). More importantly, v x increases in vertical direction y by tendency, emphasised by the grey dashed trend line in each plot. The same tracer particle is indicated by the same symbol and colour in all three plots.
Applsci 13 01765 g009
Figure 10. Tracer particles in different measuring planes z 0 at the weir: the horizontal velocity component v x is plotted against the vertical position y above the weir. In the case of the foam at the higher surfactant concentration ( c 1 = 1.0   g   L 1 , plots on the left), the velocity gradients from the centre of the flow channel ( z 0 = 0   m m ) towards its left ( z 0 = + 45   m m ) or right side wall ( z 0 = 45   m m ) are more pronounced than at the lower concentration ( c 2 = 0.5   g   L 1 , plots on the right). The positive velocity gradient d v x / d y > 0 in the vertical direction, which was clearly identified in the measuring planes z 0 = [ 0 mm ; 35 mm ; 45 mm ] at c 1 = 1.0   g   L 1 , is emphasised by the grey dashed trend line in the respective plots. Each symbol and colour indicates one tracer particle.
Applsci 13 01765 g010
Figure 11. Tracer particles in different measuring planes z 0 while passing and past the weir: the vertical velocity component v y is plotted over time t. When the liquid foam ( c 1 = 1.0   g   L 1 ) flowed into the open surrounding ( x > 5   m m ), accelerated by gravity, the tracer particle in the central plane ( z 0 = 0   m m ) reached a higher terminal velocity than those closer to the left ( z 0 = + 35   m m ) or right side wall of the flow channel ( z 0 = 35   m m ). This is exemplarily shown for three tracer particles.
Applsci 13 01765 g011
Figure 12. Tracer particles carried by the overflowing foam ( c 1 = 1.0   g   L 1 ) in the central measuring plane ( z 0 = 0   m m ) at the weir: along their motion paths (as already shown on the left in Figure 8), the angular velocity ω of the intrinsic rotation is plotted over the horizontal position x. The same tracer particle is indicated by the same symbol and colour in both plots.
Applsci 13 01765 g012
Table 1. Surfactant solution of sodium dodecyl sulfate (SDS) in tap water: concentration c i and in relation to the critical micelle concentration C M C = 2.3   g   L 1 [44] as well as the corresponding surface tension σ i  [45,46] at room temperature ( θ = 20   C ).
i c i c i / CMC σ i
1 1.0   g   L 1 0.43 0.05   N   m 1
2 0.5   g   L 1 0.22 0.06   N   m 1
Table 2. Characteristics of the tracer particles used for the X-PTV measurement (No. 1) and further feasible combinations of the edge length of the polymer tetrahedron and the diameter of the metal beads, as well as the resulting weight-to-area ratio of one tracer particle.
Combination No.1234
polymer tetrahedron: edge length4 m m 2 m m 4 m m 2 m m
metal beads: diameter 0.5   m m 0.5   m m 0.3   m m 0.3   m m
tracer particle: weight-to-area ratio14 N   m 2 21 N   m 2 11 N   m 2 N   m 2
Disclaimer/Publisher’s Note: The statements, opinions and data contained in all publications are solely those of the individual author(s) and contributor(s) and not of MDPI and/or the editor(s). MDPI and/or the editor(s) disclaim responsibility for any injury to people or property resulting from any ideas, methods, instructions or products referred to in the content.

