Abstract
A large amount of wet-discharged fly ash has caused serious harm to the ecological environment, so the utilization of fly ash has received attention. This paper analyzes the formation of products of fly ash–lime system under the autoclave process by X-ray diffraction (XRD) analysis and thermogravimetric–differential thermal (TG-DSC) analysis. The hydrothermal reaction product generation was quantitatively analyzed using the hydrochloric acid selective dissolution method to quantify the degree of reaction of fly ash in the pressure evaporation specimens in combination with the reaction degree of lime in the autoclave specimens. The hydrothermal reaction products were calcined and hydrated, and the mineral composition of the calcined products and the mechanical and microstructure of the hydrated products were analyzed. The results show that hydrothermal reactions occur in the fly ash–lime pressure evaporation system to produce C2SH, C3AH6, C3ASH4, and other products. The optimum ratio of lime is 22%, and the appropriate autoclave parameter is 140 °C for 8 h. Under this condition, the reaction degree of fly ash is 15.39%, the reaction degree of CaO is 78.63%, and its f-CaO value is 4.93%. The formation of C2SH in the hydrothermal reaction ranged from 14.33% to 18.53%, and the formation of C3ASH4 ranged from 14.06% to 15.26%. The hydrothermal reaction products were calcined at 850 °C for 1.5 h to produce new gelling materials with gelling phases, such as C12A7, α’L-C2S, β-C2S, and C2AS. The compressive and flexural strengths of the new gelling materials reached 34.4 MPa and 6.4 MPa, respectively, at the age of 180 days.
1. Introduction
Silicate cement production is characterized by high power consumption and high CO2 emissions. The production of 1 ton of cement consumes 110 kWh of electricity [1] and emits 800 kg of CO2 [2]. Several surveys have found that the cement industry consumes about 14% of total energy and contributes 8% of global carbon emissions [3]. Carbon dioxide emissions contribute to climate change and global warming. Cement demand is expected to grow from 12% to 23% by 2050 due to population growth and future urbanization challenges [4]. Scientists attribute this primarily to anthropogenic CO2 emissions and global warming. Therefore, there is a need to find a low-energy consumption and low-emission method for producing gelling materials. Fly ash is one of the world’s most significant industrial by-products in terms of emissions. Figure 1a,b show the wet-discharged fly ash site and storage plant, respectively. Global coal-fired power generation generates more than 750 Mt coal ash annually, but the utilization rate is less than 50% of the world output [5,6]. Although the utilization rate of fly ash increases yearly, a large amount of fly ash is still accumulated yearly due to excessive annual emissions, which seriously harms the ecological environment [7,8,9].
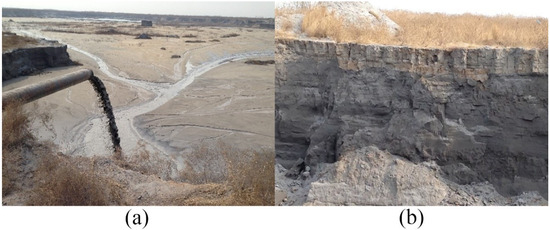
Figure 1.
(a) Wet fly ash discharge site; (b) fly ash storage yard.
In recent years, researchers have begun to investigate the use of industrial solid waste to obtain the cementitious phase using synthetic hydrothermal calcination [10,11,12,13,14]. For some fly ash with low activity, it is not suitable to be used in concrete as an admixture, which will reduce the strength of the concrete. This kind of fly ash can be used as alkali-activated material [15,16], or mixed with high limestone content and used in the hydrothermal reaction process at low temperatures, and the fly ash will undergo a pozzolanic reaction and generate hydraulic precursors [17,18,19,20]. Calcination products are related to the amount of water used, reaction temperature, reaction pressure, treatment time in the hydration process, and treatment temperature and time in the calcination process [21,22,23]. The high hydration activity of the mineral structure of belite under low-temperature calcination is due to the high number of defects in the mineral structure of belite, which differs significantly from the properties of belite in conventional cement [24]. However, the low early strength of fly ash belite cement is an obstacle to their further development [25,26]. The compressive strengths of the 1 cm × 1 cm × 1 cm mortar specimens were only 11–30 MPa [27], and the highest strength of the 4 cm × 4 cm × 16 cm mortar specimen wet-cured at 40 °C for 28 days was only 15 MPa [28], as reported by Guerrero et al. Compared with ordinary Portland cement, its raw material is solid waste, with lower calcination temperature and lower counterfeiting cost.
As the reaction conditions of hydrothermal treatment determine the type and content of reaction products, they also impact the content of hydraulic minerals such as belite and calcium aluminate in calcined fly ash belite cement. Therefore, studying the reaction degree of reactants in a hydrothermal reaction system and the formation process of hydrothermal reaction products is essential. This paper’s hydrothermal reaction degree and products of fly ash are quantitative. The influence of the content of fly ash and lime and the change in autoclave process parameters on the formation of products is discussed to propose the process parameters of the autoclave process for preparing new cementitious materials.
2. Experimental Section
2.1. Raw Materials
The raw fly ash used in the experiments was from Hebei, with a 45 μm sieve allowance of 6.88%. Table 1 shows the chemical composition of fly ash. The mineral compositions of fly ash are shown in Figure 2. The strength activity index of the experimental fly ash was 68.90% according to GB/T 1596-2017 “Fly ash for use in cement and concrete” [29]. Lime (CaO) and gypsum (CaSO4·2H2O) are purchased as analytically pure chemical reagents.

Table 1.
Chemical composition of fly ash/ wt%.
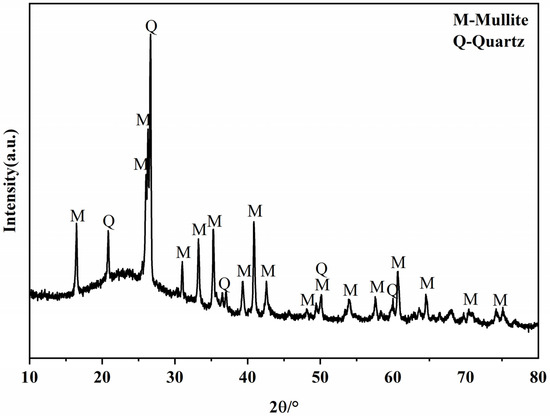
Figure 2.
XRD patterns of the fly ash.
2.2. Hydrothermal Synthesis Process
The orthogonal experiment was carried out with three factors and three levels of lime dosing, hydrothermal reaction temperature, and reaction time. The orthogonal design scheme is shown in Table 2.
Table 2.
Orthogonal experiment table-L9 (34).
Fly ash and lime were mixed according to the different ratios in the orthogonal test protocol, added water, and mixed well to form a cube of 20 mm × 20 mm × 20 mm. The cubes were placed in an autoclave and subjected to hydrothermal reactions at different autoclave temperatures at different times. After the autoclave had cooled to room temperature, the cubes were removed, crushed, and placed in bottles containing anhydrous ethanol to terminate the hydration and storage. The reaction products were removed from the anhydrous ethanol, dried at 60 °C, and then powdered to obtain test samples.
2.3. Calcination System
The fly ash–lime system under the optimal autoclave system was taken as the research object. Calcination temperatures of 800 °C, 850 °C, and 900 °C were chosen [30,31], and calcination times of 0.5 h, 1.0 h, 1.5 h, and 2.0 h were chosen for the calcination tests.
2.4. Test Methods
2.4.1. Fly Ash Reaction Degree Test
The hydrochloric acid selective dissolution method was used to determine the degree of reaction of fly ash. After drying and grinding the autoclave samples, weigh 0.5 g of the samples, place them in a 300 mL beaker, add 40 mL of 2 mol/L HCl solution, thermostat at 80 °C for 20 min in a water bath, and stir continuously. The solution was filtered through medium-speed quantitative filter paper and washed three times with hot water at 80 °C, three times with 2% Na2CO3 solution at 80 °C, and three times with hot water at 80 °C. The residue and filter paper were placed in a constant temperature crucible at 950 °C for 30 min and weighed after cooling. The formula for calculating the chemically insoluble amount of a specimen is as follows [32]:
where β is the chemically insoluble amount of the specimen, wt%; G is the mass after acid treatment and calcination, g; and G0 is the original mass of the specimen, g.
When investigating the degree of reaction of fly ash in the cement slurry, the researchers [33,34] corrected the β values to take into account the difference in the amount of chemically bound water H at different ages, i.e., introduced β0 in the calculation of the degree of reaction of fly ash (β0 is the chemically insoluble amount of the sample taken 1–2 h after forming). For the characteristics of this study system, considering that the chemical reaction will occur after the mixture of fly ash and lime, β0 is taken as the undissolved chemical amount of fly ash and lime mixture before autoclaving in this experiment, so the reaction rate of fly ash after autoclave of the specimen is calculated as follows:
where is the reaction rate of fly ash, %; β0 is the chemical insolubility of the unpressurised mixture, wt%; β is the chemical insoluble amount of the sample under different ratio and autoclave conditions, wt%; and γ is the ratio of the dry mixture,%.
2.4.2. f-CaO Testing
The f-CaO content in the autoclaved sample was determined using the ethylene glycol-ethanol method in GB/T 176-2017 “Method for the chemical analysis of cement” [35].
3. Results and Discussion
3.1. Hydrothermal Synthesis System Analysis
3.1.1. Reaction Products Analysis
Figure 3 shows the XRD patterns of the specimens with different autoclave conditions. It can be seen from Figure 3 that the autoclave specimens contain mullite (A3S2) and quartz (SiO2) in fly ash, and the newly formed substances are Ca(OH)2, C2SH, C3AH6, and C3ASH4. Ca(OH)2 is formed by the autoclave system’s reaction between calcium oxide and water. Due to the different conditions of the autoclave process, the content of each newly formed mineral composition varies.
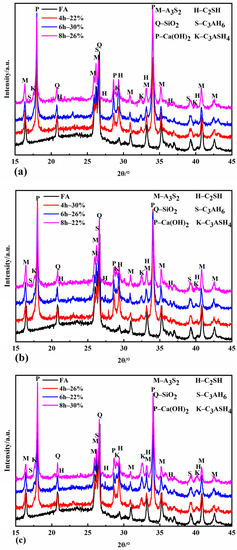
Figure 3.
XRD patterns of autoclaved samples at 120 °C (a), 140 °C (b), and 160 °C (c).
Figure 3a demonstrates that C2SH has started to form when the autoclave temperature is 120 °C for 4 h. When the autoclaving time is extended to 6 h, the C2SH diffraction peak is enhanced, but when the autoclaving time reaches 8 h, the intensity of its diffraction peak decreases instead. This is because C2SH is a kind of hydration product easily generated under a high calcium–silica ratio [36]. When the autoclaving time is short, the amount of dissolved silicon and aluminum in fly ash is less, the calcium–silica ratio in the system is higher at this time, and C2SH starts to form and gradually increases. With the extension of the autoclaving time, the amount of silicon and aluminum in the fly ash continues to dissolve in large quantities, the calcium–silica ratio decreases, and the stability of C2SH decreases and gradually decomposes to form CSH gel [37]. The dispersion peak of 2θ between 25° and 30° is evident in the XRD pattern at this time. The intensity of the C2SH diffraction peaks was maximized at four hours when the autoclave temperature was increased to 140 °C and 160 °C, indicating that the formation of C2SH was accelerated by the rapid dissolution of silicon and aluminum from fly ash under a high temperature and pressure, and by the strengthening of the hydrothermal reaction driving force due to the high temperature. The intensity of the C2SH diffraction peaks was maximized at four hours when the steaming temperature was increased to 140 °C and 160 °C, indicating that the formation of C2SH was accelerated by the rapid dissolution of silicon and aluminum from fly ash under a high temperature and pressure, and by the strengthening of the hydrothermal reaction driving force due to the high temperature.
C3AH6 diffraction peaks appeared in the XRD patterns of all the specimens. C3AH6 diffraction peaks appeared in the XRD patterns of all the evaporated specimens. C3AH6 is an easily formed and relatively stable compound in the CaO-Al2O3-H2O system between 20 °C and 225 °C [38]. The C3ASH4 diffraction peaks gradually increased with the pressure evaporation time at the same pressure evaporation temperature. When the autoclave temperature was increased to 160 °C, the intensity of the C3ASH4 diffraction peaks increased more obviously compared with the autoclave temperature of 120 °C and 140 °C, indicating that the longer the autoclaving time in the high-temperature environment, the more thoroughly the calcium hydroxide in the autoclave system reacts with the silica and alumina continuously dissolved in the fly ash, and the higher the produced amount is.
Figure 4a shows that the diffraction peak of C2SH gradually enhanced with the increase in the autoclave temperature when the autoclaving time was four hours. The intensity of the C2SH diffraction peaks was most significant at 120 °C when the autoclaving time was six and eight hours. The intensity of the C2SH diffraction peaks decreased as the autoclave temperature increased. This is because, under the autoclave time conditions of six and eight hours, the amount of silicon and aluminum dissolved in the fly ash was already high, and a large amount of C2SH was formed. With the increase in the autoclave temperature, the dissolution of silica and aluminum in fly ash further reduces the calcium-to-silica ratio in the system, and C2SH starts to decompose, and its content gradually decreases. The intensity of the C3ASH4 diffraction peak gradually increased with the increase in the autoclave temperature at the same autoclave time. When the autoclaving time was extended to 8 h, the intensity of the C3ASH4 diffraction peak became more evident, indicating that the higher the autoclave temperature was, the stronger the hydrothermal reaction driving force promoted the formation of C3ASH4 at the same autoclave time. The hydrothermal reaction mechanism in the fly ash–lime system under pressure steaming conditions can be derived into the following:
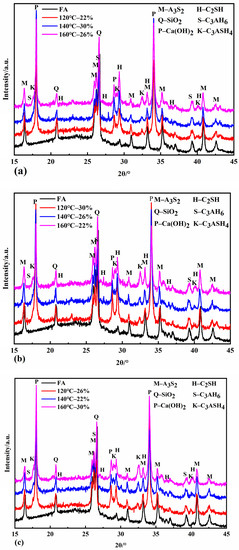
Figure 4.
XRD patterns of samples autoclaved for 4 h (a), 6 h (b), and 8 h (c).
3.1.2. CaO Reaction Degree Analysis
Figure 5 shows the specimens’ DSC thermal analysis measurements and TG curves for different pressure evaporation conditions. The DSC curves show sharp heat absorption peaks around 120 °C, 350 °C, 450 °C, 560 °C, and 750 °C. The TG curves all show an accompanying uniform weight loss from 0 °C to 100 °C, mainly due to the removal of adsorbed water from the pressure evaporation products as well as gel water and interlayer water in the form of water molecules. The heat absorption effect that occurs near 120 °C is due to the dehydration of C2SH. A prominent heat absorption peak was found near 450 °C, deep and wide, accompanied by a significant weight loss in the TG curve. This region mainly removes crystalline water from Ca(OH)2 in the product. The reaction generating C3AH6 also produced three heat absorption peaks in the DSC curve, accordingly [39], with a slight heat absorption effect at 350 °C and 560 °C. C3AH6 crystals each shed part of their crystalline water, and when the temperature continued to rise to about 750 °C, the dehydration reaction of C3AH6 crystals was complete, accompanied by the dehydration and weight loss of C3ASH4 [40].
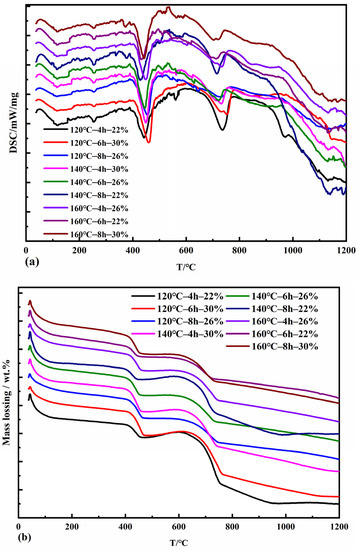
Figure 5.
DSC (a) and TG (b) curves of autoclaved samples with fly ash.
The DSC curve was extrapolated to determine the start and end points of the Ca(OH)2 absorption peak dehydration reaction temperature, and the Ca(OH)2 weight loss in the TG profile was combined to calculate the amount of CaO consumed during the pressure evaporation reaction. The degree of calcium oxide reaction in the compressed steam specimen is the consumption of CaO as a percentage of the initial mass fraction of CaO during the compressed steam reaction, so the degree of calcium oxide reaction during the compressed steam process in terms of the scorch base is calculated by the following formula:
where f(CaO) is the degree of calcium oxide reaction during the autoclave process,%; is the weight loss of Ca(OH)2 in the TG plot, wt%; n is the initial mass fraction of CaO in the system before autoclave,%; LOI is the loss on burning of fly ash, wt%; 18 is the relative molecular mass of H2O; and 56 is the relative molecular mass of CaO.
The results of calculating the degree of reaction of calcium oxide in different specimens are shown in the Table 3. The degree of CaO reaction in two groups of autoclaved samples at 140 °C–8 h—22% and 160 °C–6 h—22% reached more than 75%. When the lime content is the same, the degree of CaO reaction increases with the autoclave temperature and time increase. At 22% lime dosing, the CaO reaction in the autoclaved samples reached over 70% and was significantly greater than that of the autoclaved samples at 26% and 30% lime dosing.
Table 3.
Mass fraction of Ca(OH)2 and CaO reaction degrees of different autoclaved samples.
3.1.3. Fly Ash Reaction Degree Content
Table 4 shows data on the degree of reaction of fly ash in different pressure-distilled specimens using the hydrochloric acid selective dissolution method. The reaction rate of fly ash is 10.26% for the autoclaved sample with a 78% fly ash ingredient ratio when the autoclaved parameter is 120 °C for four hours. When the autoclaved parameter is increased to 160 °C for six hours, the reaction rate of fly ash is 15.39%, which is increased by 50%. With the increase in autoclave temperature and time, the Si4+ and Al3+ in fly ash are further dissolved, and the reaction with Ca2+ is more likely to produce hydration products, and the reaction degree of fly ash is increased. However, the reaction rate of fly ash did not change much or even decrease when the autoclaving time was extended to six and eight hours under the same autoclave temperature, because the hydrated calcium silicate gel, formed after the reaction of fly ash with Ca(OH)2, would wrap around the surface of fly ash particles and prevent the further reaction of Ca(OH)2 with unreacted SiO2 in fly ash [41].
Table 4.
Fly ash reaction degrees of different autoclaved samples.
3.1.4. Quantitative Analysis of Reaction Products
Following the law of conservation of mass, according to the chemical reaction equation in Equations (3)–(5), assuming that the total mass of reactants is 100 g, set the production amounts of the three hydration products C2SH, C3AH6, and C3ASH4 as x/g, y/g, and z/g, respectively, and solve for the range of values of x, y, and z, respectively, according to the calculation equation in Equations (7)–(10), i.e., to obtain the range of the production contents of each of the three reaction products C2SH, C3AH6, and C3ASH4 in the fly ash–lime system under the conditions of the autoclave process. This provides a basis for exploring the effect of changes in the autoclave process parameters on the formation and content of the products. The results of the calculations are shown in Table 5.
where m(CaO) is the mass of the calcium oxide reaction, g; and m(FA) is the mass of the fly ash reaction, g.
Table 5.
Content of hydration products of different autoclaved samples.
Increasing the steam autoclave reaction temperature and extending the reaction time is beneficial to improve the reaction degree of calcium oxide and fly ash and can also effectively reduce the free calcium oxide content. When the amount of fly ash is 22%, and the reaction temperature is 140 °C for eight hours, the reaction rate of calcium oxide is the highest at 78.63%, and the reaction rate of fly ash is 15.39% at this time. With the increase in reaction time and temperature, the amount of C2SH formation is gradually increased. The content of C3ASH4 increased gradually with the increase in the reaction temperature. The reaction rate and product content of each raw material are similar when the reaction temperature is 140 °C and 160 °C, so the reaction temperature is chosen to be 140 °C for the reason of energy saving. Considering the above analysis, the best lime dosing ratio is 22%, and the steam autoclave reaction temperature is 140 °C for eight hours.
3.2. Calcination System Analysis
3.2.1. The Effect of Calcination Temperature on the Formation of Calcined Minerals
Figure 6 shows the XRD patterns of the reaction specimens at calcination temperatures of 800 °C, 850 °C, and 900 °C for different calcination times. At calcination temperatures of 800 °C and 850 °C, the newly formed minerals include CaO, C12A7, and α’L-C2S. C12A7 accelerates the rate of hydration of the cementitious material, shortens the setting time, and increases its early strength and water demand. α’L-C2S disappears at a calcination temperature of 900 °C with the simultaneous production of β-C2S and C2AS. The activity of β-C2S is lower than that of α’L -C2S. The rate of hydration and early strength of the clinker is more adversely affected when there is more β-C2S. The hydrothermal activity of the newly generated C2AS is low, so it was determined that the appropriate calcination temperature should be below 900 °C to avoid the formation of C2AS.
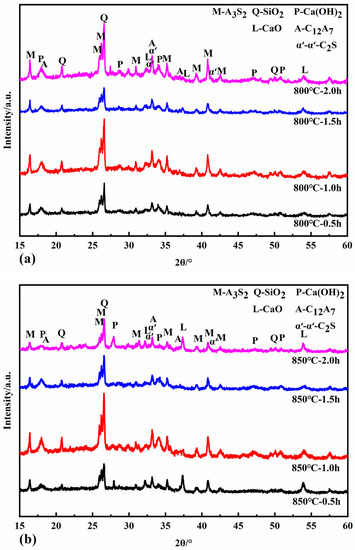
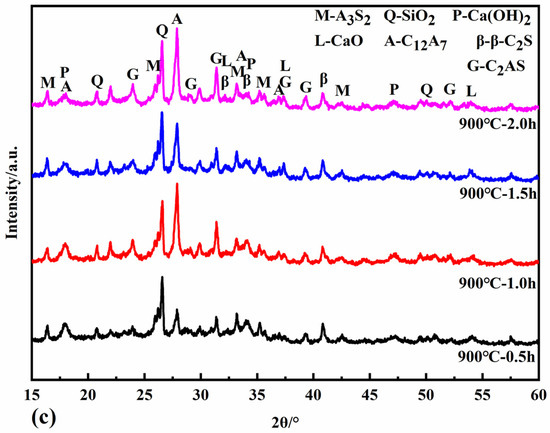
Figure 6.
XRD patterns of samples calcined at 800 °C (a), 850 °C (b), and 900 °C (c).
3.2.2. The effect of Calcination Time on the Formation of Calcined Minerals
The minerals CaO, C12A7, and α’L-C2S all begin to form at a calcination temperature of 800 °C for half an hour. The intensity of the diffraction peaks of each mineral increases when the calcination is extended to 1 h and 1.5 h. When the calcination time is two hours, the intensity of the diffraction peaks of CaO decreases. In contrast, the diffraction peaks of C12A7 and α’L-C2S minerals increase, probably because the C-S-H gel generated in the hydrothermal reaction can react with Ca(OH)2 in the calcination system in the solid phase to form C2S. At the same time, the active CaO decomposed from the hydrothermal reaction products reacts with the dissolved fly ash to form C12A7 and C2S minerals. At the same time, the active CaO from the hydrothermal reaction products reacts with the active SiO2 and Al2O3 dissolved in the fly ash to form C12A7 and C2S minerals. When calcined at 850 °C for one hour, the hydrothermal reaction products are entirely decomposed, and the diffraction peak intensity of CaO reaches its maximum. When the calcination time is 1.5 h, the CaO is heavily involved in the solid phase reaction, and the content decreases. The formation of C12A7, C2S, and C2AS increased with the increase in calcination time when the calcination temperature was 900 °C.
Table 6 shows the f-CaO content in different calcined specimens using the ethylene glycol ethanol method. When the calcination time is the same, the f-CaO content decreases with increasing calcination temperature. The conclusion from Section 3.2.1 requires the control of calcination temperatures below 900 °C to avoid the formation of C2AS. The content of f-CaO in the specimens was the lowest at 850 °C for 1.5 h of calcination. Therefore, calcination at 850 °C for 1.5 h was determined to be the optimum calcination condition.
Table 6.
Content of calcined sample f-CaO.
3.3. Properties of Wet Fly Ash Cementitious Material
The new cementitious material was prepared by mixing the self-made cement and CaSO4•2H2O at the ratio of 0.95:0.05 after grinding. The mortar specimens used in the experiments were 40 mm × 40 mm × 160 mm in size. The water–cement ratio is set as 0.56 when the fluidity is about 18 mm.
3.3.1. Compressive and Flexural Strength
Figure 7 shows the compressive and flexural strength of the mortar after hydration of the calcined test block powder. The compressive strengths of the self-made cement at 3 days, 7 days, 28 days, 90 days, and 180 days were 8 MPa, 11.8 MPa, 19 MPa, 22.2 MPa, and 34.4 MPa, respectively. The early compressive strength of self-made cement mortar is relatively low, and the strength is only 19 MPa at the age of 28 days. For the 90-day and 180-day ages, the compressive strength still increases, and the 180-day strength increases by 81.1% compared with the 28-day compressive strength. The flexural strength of self-made cement at 3 days, 7 days, 28 days, 90 days, and 180 days are 3.1 MPa, 3.7 MPa, 5.7 MPa, 6.3 MPa, and 6.4 MPa, respectively. The flexural strength increase in the 90-day and 180-day curing age is insignificant compared with the 28-day curing age, which is 10.1% and 12.3%, respectively.
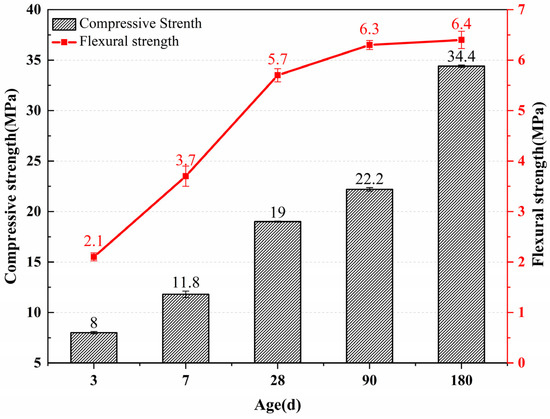
Figure 7.
Compressive and flexural strength of the self-made cement mortar.
3.3.2. Hydration Products
Figure 8 shows the XRD patterns of hydration samples of certified materials prepared under the optimal calcination process at different ages. In addition to the mullite and quartz contained in the fly ash, there are also incomplete α’L-C2S and the formation of calcium vanadate (AFt), and the content of Ca(OH)2 in the hydration products is little or none. It can be seen from the XRD pattern of slurry hydration for 3 days that Ca(OH)2 still exists, but the intensity of the diffraction peak is weak. However, Ca(OH)2 is consumed after 28 days, 90 days, and 180 days of hydration of the slurry. This is because the hydration rate of C12A7 is fast, and it has been entirely hydrated in the early stage of hydration, and Ca(OH)2 is consumed in a large amount.
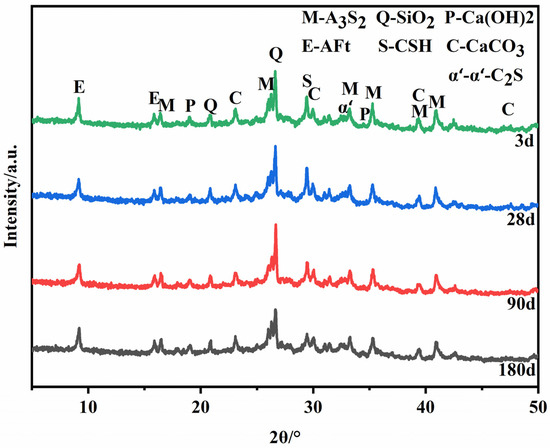
Figure 8.
XRD patterns of hydration products of the samples.
There are differences in the cement clinker mineral’s structure and the hydration products’ properties. The hydration rate and contribution to the strength of each mineral are also different. C12A7 is a cementitious mineral with a fast hydration rate and rapid strength development. Therefore, no C12A7 diffraction peaks were found to be present in the plots of the slurry hydrated at three days. The hydration rate of C2S is relatively slow, and the hydration reaction generates C-S-H gel. Thus, the diffraction peaks of the unhydrated C2S are still present in the diffraction pattern of the slurry at 90 days of hydration. The diffraction peak intensity of the C-S-H gel increases with age, with C2S playing a pivotal role in the later compressive strength growth.
3.3.3. Surface Morphology Analysis
Figure 9a,b show SEM photographs of hydrated samples of specimens at the age of three days. The figure shows hexagonal sheets of Ca(OH)2 due to a large amount of Ca(OH)2 generated by mineral hydration at the initial stage of hydration. Hexagonal flakes of Ca(OH)2 were not found in the specimen, mainly due to the rapid hydration rate of the main mineral C12A7 in Figure 9c,d and the simultaneous consumption of Ca(OH)2, increasing the formation of needle- and rod-shaped calcium vanadinite. It can be seen from Figure 9e,f that a large number of hydration products gather together, and the hydration products cross-climb each other, causing the structure of the slurry to become more compact, and there is a significant increase in the formation of thin sheets of hydrated calcium silicate.
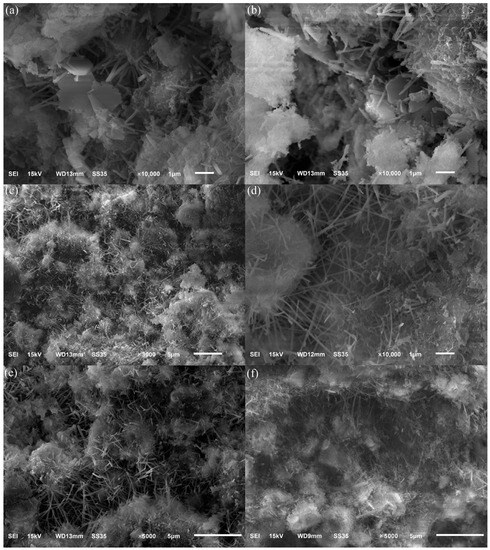
Figure 9.
SEM images of hydration pastes cured for 3 days (a,b), 28 days (c,d), and 90 days (e,f).
4. Conclusions
(1) This work focused on preparing cementing materials with wet-discharged fly ash. It is concluded, based on the results from the experiments during the study, that the optimum lime mixing ratio is 22%, and the steam autoclave reaction temperature is 140 °C for eight hours.
(2) Under the condition of the autoclave process, the active SiO2 and Al2O3 in fly ash react with CaO to produce C2SH, C3AH6, C3ASH4, and other products in the fly ash–lime-water system.
(3) Increasing the autoclave reaction temperature and prolonging the autoclave reaction time can improve the reaction degree of CaO and fly ash in the autoclave system and effectively reduce the content of f-CaO.
(4) The newly formed minerals in the calcined sample include CaO, C12A7, and α’L-C2S. The optimum calcination condition is determined to be 850 °C for 1.5 h, under which no C2AS was formed and the content of f-CaO was the lowest.
(5) The main minerals in the hydrated slurry of the new cementitious material were mullite, quartz, calcium vanadinite, and incompletely hydrated α’L-C2S. The compressive and flexural strengths of the new cementing cement at the age of 28 days were 19 MPa and 5.7 MPa, respectively.
Author Contributions
P.S.; Conceptualization, Methodology, Validation, Writing—original draft preparation. B.H.; Conceptualization, Methodology, data curation. All authors have read and agreed to the published version of the manuscript.
Funding
We are grateful to the financial support from National Key Research and Development Program of China (2021YFB3802002).
Institutional Review Board Statement
Not applicable.
Informed Consent Statement
Not applicable.
Data Availability Statement
Not applicable.
Acknowledgments
We are grateful for the financial support from the National Key Research and Development Program of China (2021YFB3802002).
Conflicts of Interest
The authors declare no conflict of interest.
References
- Shen, L.; Gao, T.; Zhao, J.; Wang, L.; Wang, L.; Liu, L.; Chen, F.; Xue, J. Factory-level measurements on CO2 emission factors of cement production in China. Renew. Sustain. Energy Rev. 2014, 34, 337–349. [Google Scholar] [CrossRef]
- Turner, L.K.; Collins, F.G. Carbon dioxide equivalent (CO2-e) emissions: A comparison between geopolymer and OPC cement concrete. Constr. Build. Mater. 2013, 43, 125–130. [Google Scholar] [CrossRef]
- Andrew, R.M.; Global, C.O. Emissions from cement production, 1928–2018. Earth Syst. Sci. Data 2019, 11, 1675–1710. [Google Scholar] [CrossRef]
- Khan, K.; Salami, B.A.; Iqbal, M.; Amin, M.N.; Ahmed, F.; Jalal, F.E. Compressive Strength Estimation of Fly Ash/Slag Based Green Concrete by Deploying Artificial Intelligence Models. Materials 2022, 15, 3722. [Google Scholar] [CrossRef]
- Izquierdo, M.; Querol, X. Leaching behaviour of elements from coal combustion fly ash: An overview. Int. J. Coal Geol. 2012, 94, 54–66. [Google Scholar] [CrossRef]
- Khan, K.; Ahmad, A.; Amin, M.N.; Ahmad, W.; Nazar, S.; Arab, A.M.A. Comparative Study of Experimental and Modeling of Fly Ash-Based Concrete. Materials 2022, 15, 3762. [Google Scholar] [CrossRef]
- He, Y.; Luo, Q.; Hu, H. Situation Analysis and Countermeasures of China’s Fly Ash Pollution Prevention and Control. Procedia Environ. Sci. 2012, 16, 690–696. [Google Scholar] [CrossRef]
- Tiwari, M.K.; Bajpai, S.; Dewangan, U.K.; Tamrakar, R.K. Suitability of leaching test methods for fly ash and slag: A review. J. Radiat. Res. Appl. Sci. 2015, 8, 523–537. [Google Scholar] [CrossRef]
- Amin, M.N.; Hissan, S.; Shahzada, K.; Khan, K.; Bibi, T. Pozzolanic Reactivity and the Influence of Rice Husk Ash on Early-Age Autogenous Shrinkage of Concrete. Front. Mater. 2019, 6, 150. [Google Scholar] [CrossRef]
- Ávalos-Rendón, T.L.; Chelala, E.A.P.; Escobedo, C.J.M.; Figueroa, I.A.; Lara, V.H.; Palacios-Romero, L.M. Synthesis of belite cements at low temperature from silica fume and natural commercial zeolite. Mater. Sci. Eng. B Solid-State Mater. Adv. Technol. 2018, 22, 979–985. [Google Scholar] [CrossRef]
- Rungchet, A.; Poon, C.S.; Chindaprasirt, P.; Pimraksa, K. Synthesis of low-temperature calcium sulfoaluminate-belite cements from industrial wastes and their hydration: Comparative studies between lignite fly ash and bottom ash. Cem. Concr. Compos. 2017, 83, 10–19. [Google Scholar] [CrossRef]
- Han, Y.; Lin, R.; Wang, X.Y. Performance and sustainability of quaternary composite paste comprising limestone, calcined Hwangtoh clay, and granulated blast furnace slag. J. Build. Eng. 2021, 43, 102655. [Google Scholar] [CrossRef]
- Antoni, M.; Rossen, J.; Martirena, F.; Scrivener, K. Cement substitution by a combination of metakaolin and limestone. Cem. Concr. Res. 2012, 42, 1579–1589. [Google Scholar] [CrossRef]
- Singh, N.B. Hydrothermal synthesis of β-dicalcium silicate (β-Ca2SiO4). Prog. Cryst. Growth Charact. Mater. 2006, 52, 77–83. [Google Scholar] [CrossRef]
- Amin, M.N.; Khan, K.; Javed, M.F.; Aslam, F.; Qadir, M.G.; Faraz, M.I. Prediction of Mechanical Properties of Fly-Ash/Slag-Based Geopolymer Concrete Using Ensemble and Non-Ensemble Machine-Learning Techniques. Materials 2022, 15, 3478. [Google Scholar] [CrossRef]
- Khan, K.; Ashfaq, M.; Iqbal, M.; Khan, M.A.; Amin, M.N.; Shalabi, F.I.; Faraz, M.I.; Jalal, F.E. Multi Expression Programming Model for Strength Prediction of Fly-Ash-Treated Alkali-Contaminated Soils. Materials 2022, 15, 4025. [Google Scholar] [CrossRef]
- Guerrero, A.; Goñi, S.; Macías, A.; Luxán, M.P. Effect of the starting fly ash on the microstructure and mechanical properties of fly ash-belite cement mortars. Cem. Concr. Res. 2000, 30, 553–559. [Google Scholar] [CrossRef]
- Guerrero, A.; Goñi, S.; Macías, A.; Luxán, M.P. Hydraulic activity and microstructural characterization of new fly ash-belite cements synthesized at different temperatures. J. Mater. Res. 1999, 14, 2680–2687. [Google Scholar] [CrossRef]
- Guerrero, A.; Goñi, S.; Campillo, I.; Moragues, A. Belite cement clinker from coal fly ash of high Ca content. Optimization of synthesis parameters. Environ. Sci. Technol. 2004, 38, 3209–3213. [Google Scholar]
- Goñi, S.; Guerrero, A.; De Luxan, M.P.; Macıas, A. Dehydration of pozzolanic products hydrothermally synthesized from flyash: Microstructure evolution. Mater. Res. Bull. 2000, 35, 1333–1344. [Google Scholar] [CrossRef]
- Singh, N.B.; Sarita, R.; Neelam, S. Highly reactive—Dicalcium silicate. J. Am. Ceram. Soc. 2002, 85, 2171–2176. [Google Scholar] [CrossRef]
- Mazouzi, W.; Kacimi, L.; Cyr, M.; Clastres, P. Properties of low temperature belite cements made from aluminosilicate wastes by hydrothermal method. Cem. Concr. Compos. 2014, 53, 170–177. [Google Scholar] [CrossRef]
- Georgescu, M.; Tipan, J.; Badanoiu, A.; Crisan, D.; Dragan, I. Highly reactive dicalcium silicate synthesised by hydrothermal processing. Cem. Concr. Compos. 2000, 22, 315–319. [Google Scholar] [CrossRef]
- Nanru, Y. Research progress in hydrothermal synthesis of β-C2S. J. Build. Mater. 2011, 14, 145–154. [Google Scholar]
- Yonghao, F.; Liqing, C.; Yongfan, G.; Wenjuan, Y. Research Status and Prospect of Fly Ash Belite Cement. J. Silic. 2015, 43, 165–173. [Google Scholar]
- Guerrero, A.; Goni, S.; Allegro, V.R. Durability of class c fly ash belite cement in simulated sodium chloride radioactive liquid waste: Influence of temperature. J. Hazard. Mater. 2008, 162, 1099–1102. [Google Scholar] [CrossRef]
- Guerrero, A.; Goñi, S.; Macıas, A.; Luxán, M.P. Mechanical properties, pore size distribution, and pore solution of fly ash-belite cement mortars. Cem. Concr. Res. 1999, 29, 1753–1758. [Google Scholar] [CrossRef]
- Guerrero, A.; Goñi, S.; Moragues, A.; Dolado, J.S. Microstructure and Mechanical Performance of Belite Cements from High Calcium Coal Fly Ash. J. Am. Ceram. Soc. 2005, 88, 1845–1853. [Google Scholar] [CrossRef]
- GB/T 1596-2017; Fly Ash for Use in Cement and Concrete. National Standard of the People’s Republic of China: Beijing, China, 2017.
- Gong, Y.; Fang, Y. Preparation of belite cement from stockpiled high-carbon fly ash using granule-hydrothermal synthesis method. Constr. Build. Mater. 2016, 111, 175–181. [Google Scholar] [CrossRef]
- Pimraksa, K.; Hanjitsuwan, S.; Chindaprasirt, P. Synthesis of belite cement from lignite fly ash. Ceram. Int. 2009, 35, 2415–2425. [Google Scholar] [CrossRef]
- GB/T 12960-2019; Quantitative Determination of Cement Components. National Standard of the People’s Republic of China: Beijing, China, 2019.
- Peirong, Z.; Shuqing, Z.; Xueli, W.; Shiyuan, H. Effect advantages of grade I fly ash used in the three gorges project and its contribution to the strength of cement mortar. Compr. Util. Fly Ash 2001, 03, 5–9. [Google Scholar]
- Shiyuan, H.; Zhi, L.; Cheng, H.; Ping, J. Reaction kinetics in fly ash-Ca(OH)2•2H2O system. J. Silic. 1986, 02, 191–197. [Google Scholar]
- GB/T 176-2017; Method for the Chemical Analysis of Cement. National Standard of the People’s Republic of China: Beijing, China, 2017.
- Changjun, K.; Jun, W. Structure of Common Hydrated Products in Autoclaved Silicate Products. Build. Mater. Technol. Appl. 2007, 1, 17–20. [Google Scholar]
- Xiaoqin, P.; Xiaohan, Y.; Lijuan, H. Study on Preparation of Ultrafine Powder Materials from Fly Ash by Hydrothermal Synthesis. J. Shenyang Jianzhu Univ. Nat. Sci. Ed. 2005, 21, 333–337. [Google Scholar]
- Guokuang, S.; Yuping, Z. Study on Hydrated Products Related to Autoclaved Products in System CaO-SiO2-Al2O3•H2O. J. Silic. 1983, 02, 149–158. [Google Scholar]
- Nanru, Y. Preliminary Study on Low Carbon Cement with C2S as the Main Mineral Composition. Cem. Technol. 2010, 4, 20–25. [Google Scholar]
- Peng, Z.; Caizhen, Y. Reaction Mechanism of Extracting Alumina from Fly Ash by Autoclave Reaction and Low Temperature Calcination. Coal Eng. 2009, 05, 82–84. [Google Scholar]
- Kuijie, Z. Study on Reaction Kinetics of Fly Ash-Ca(OH)2 System under Steam Curing Condition. J. Harbin Jianzhu Univ. 2001, 2, 90–93. [Google Scholar]


Disclaimer/Publisher’s Note: The statements, opinions and data contained in all publications are solely those of the individual author(s) and contributor(s) and not of MDPI and/or the editor(s). MDPI and/or the editor(s) disclaim responsibility for any injury to people or property resulting from any ideas, methods, instructions or products referred to in the content. |
© 2023 by the authors. Licensee MDPI, Basel, Switzerland. This article is an open access article distributed under the terms and conditions of the Creative Commons Attribution (CC BY) license (https://creativecommons.org/licenses/by/4.0/).