Effective Frequency Range and Jump Behavior of Horizontal Quasi-Zero Stiffness Isolator

Abstract
:1. Introduction
2. Isolator Subjected to Base Excitation
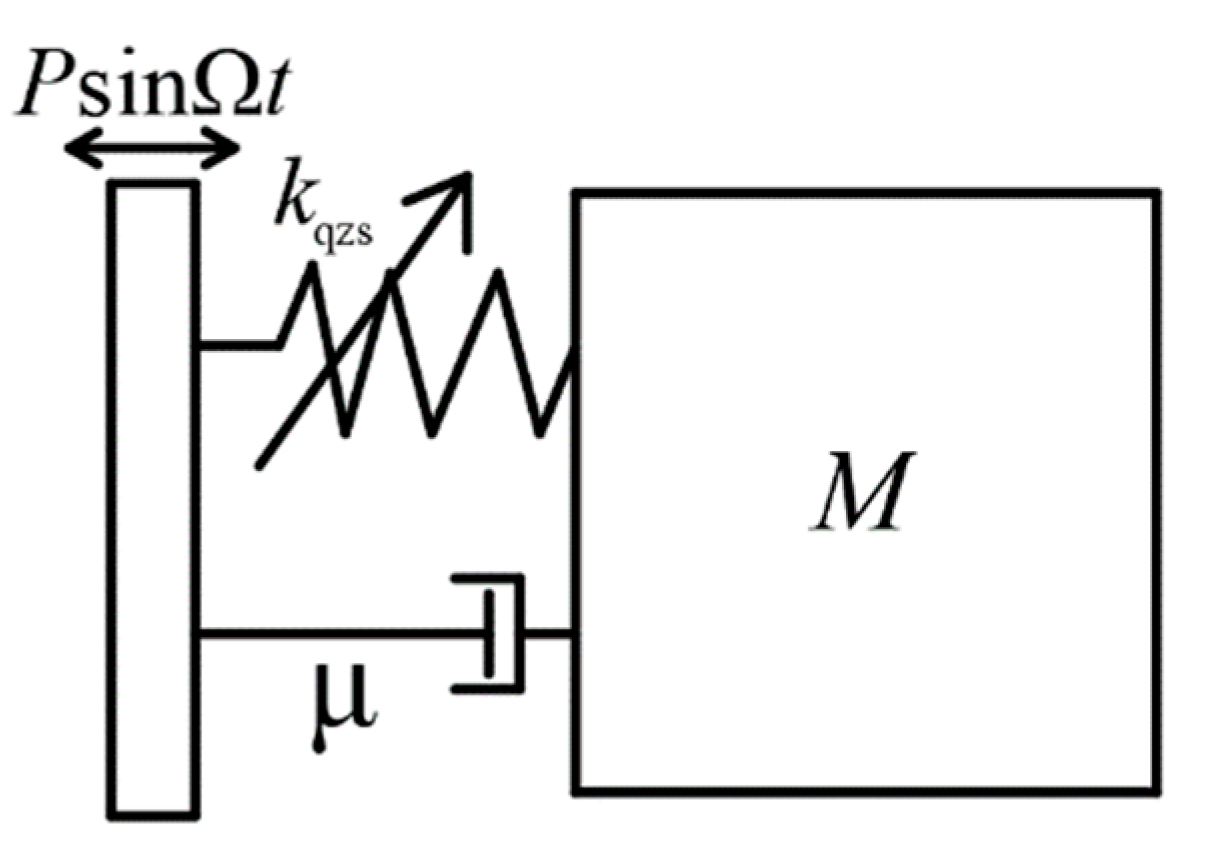
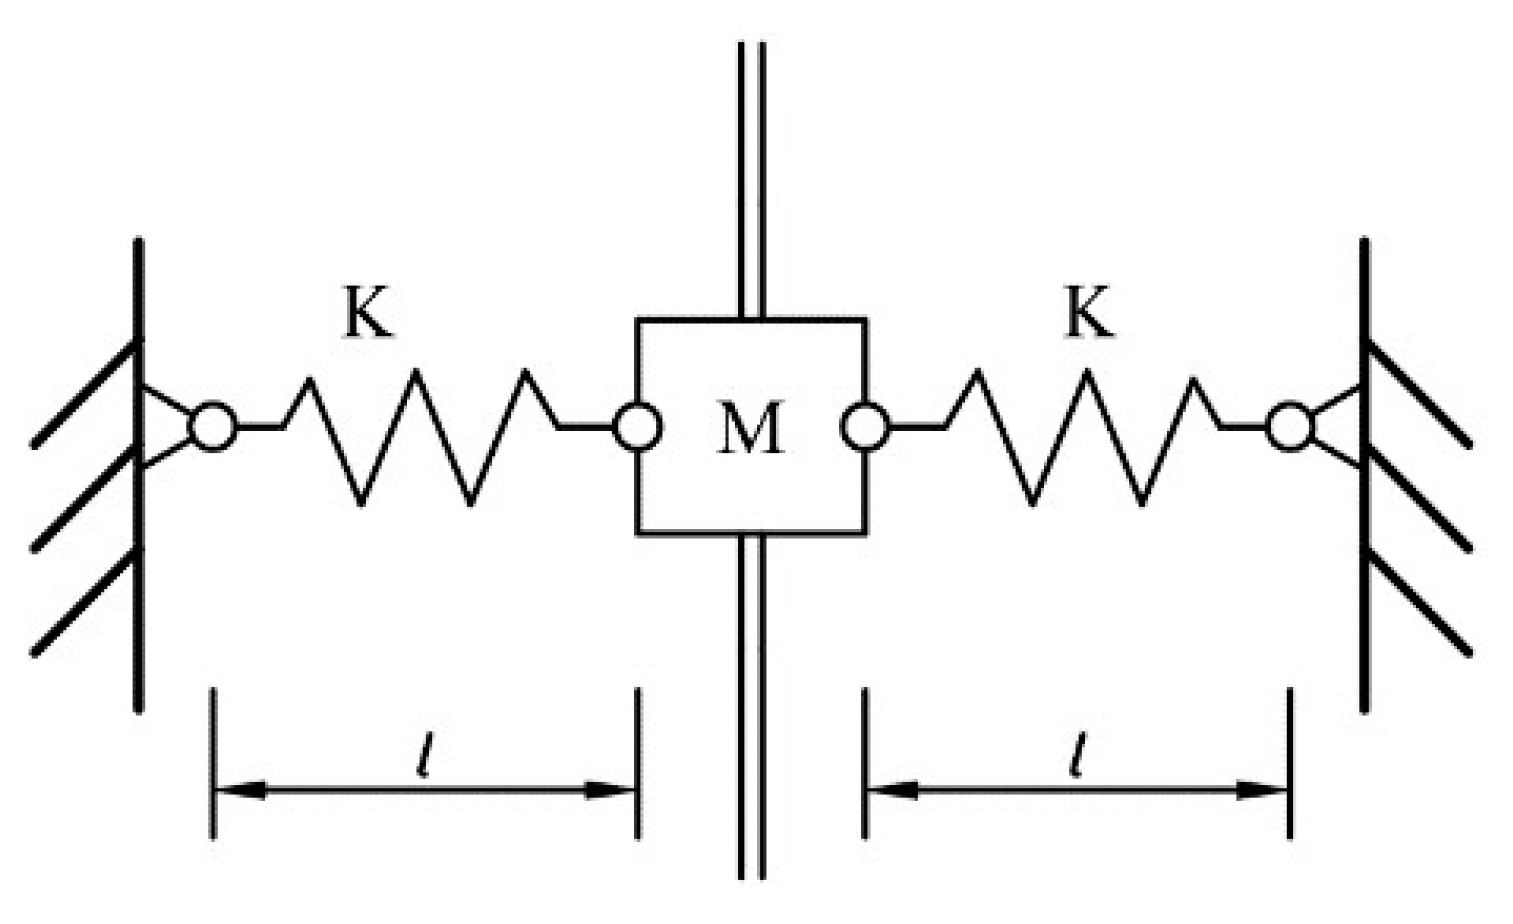
2.1. Dynamic Model
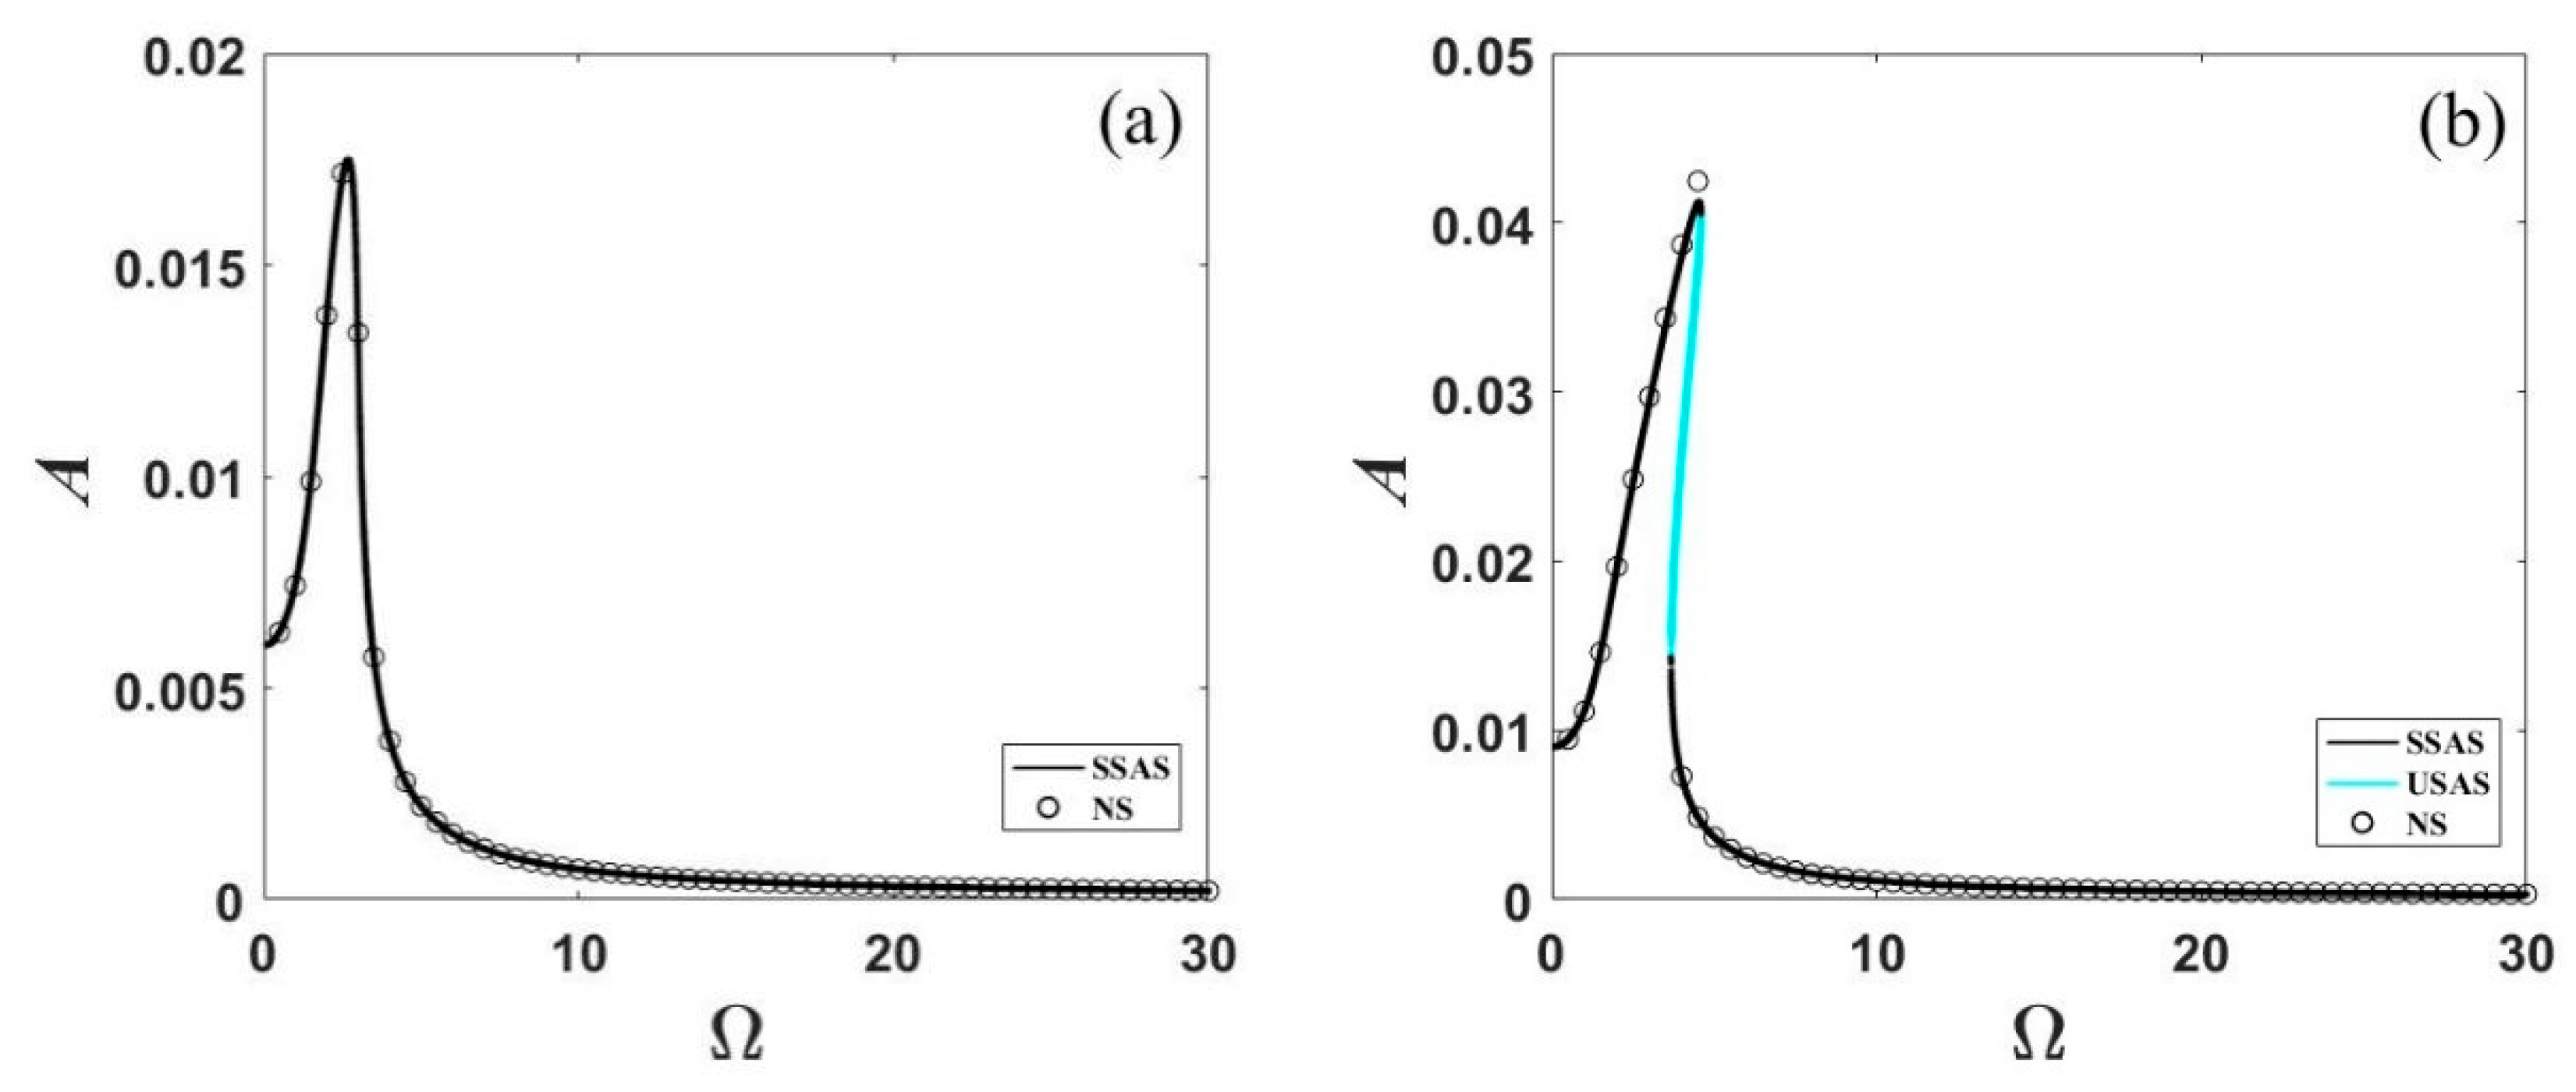
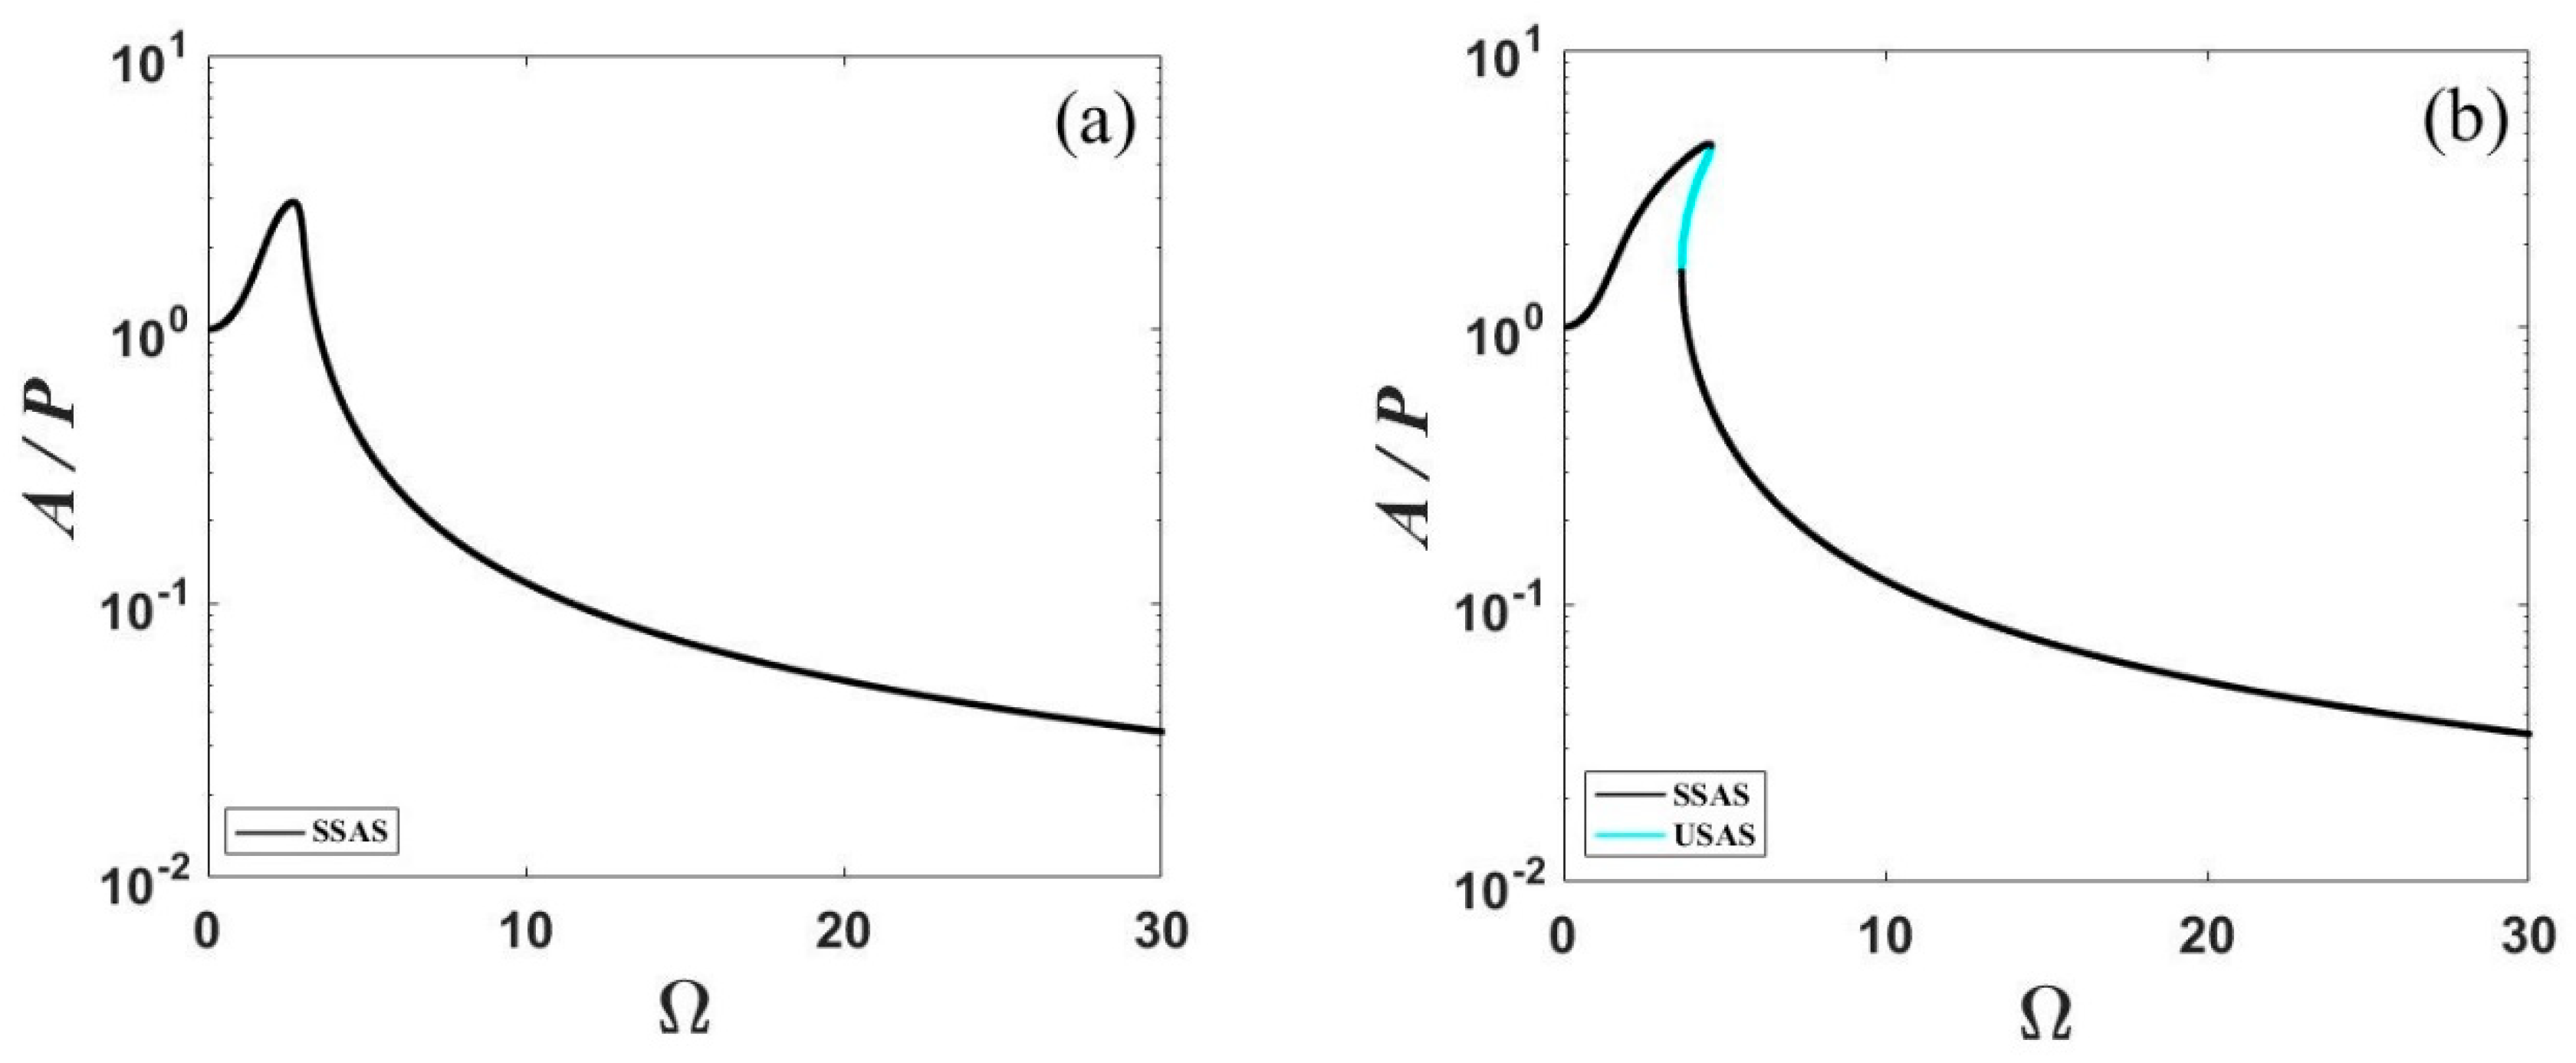
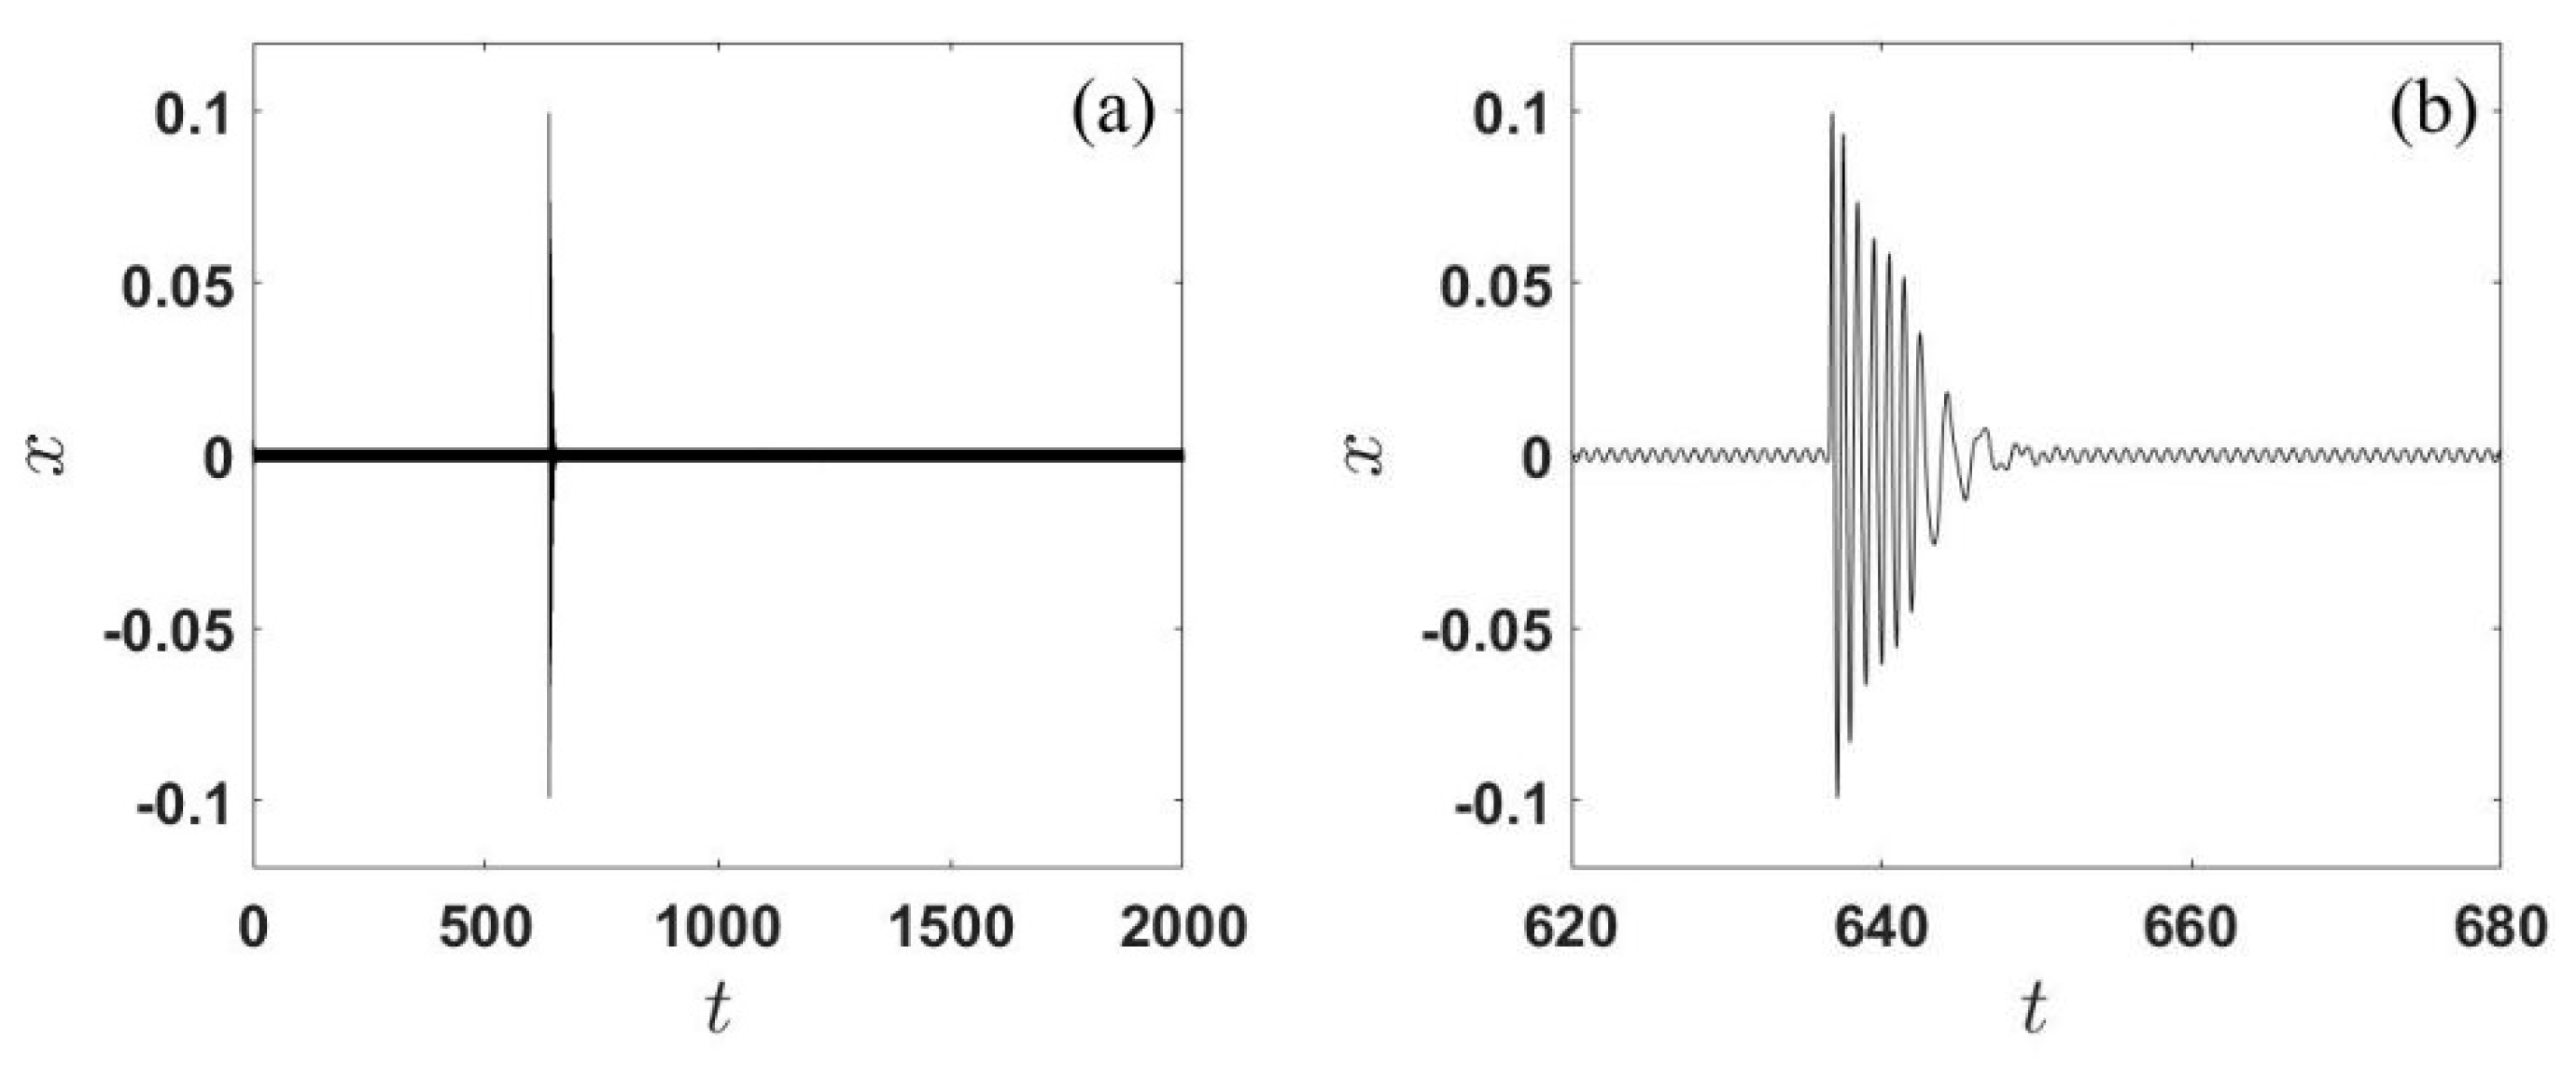
2.2. Jump Behavior
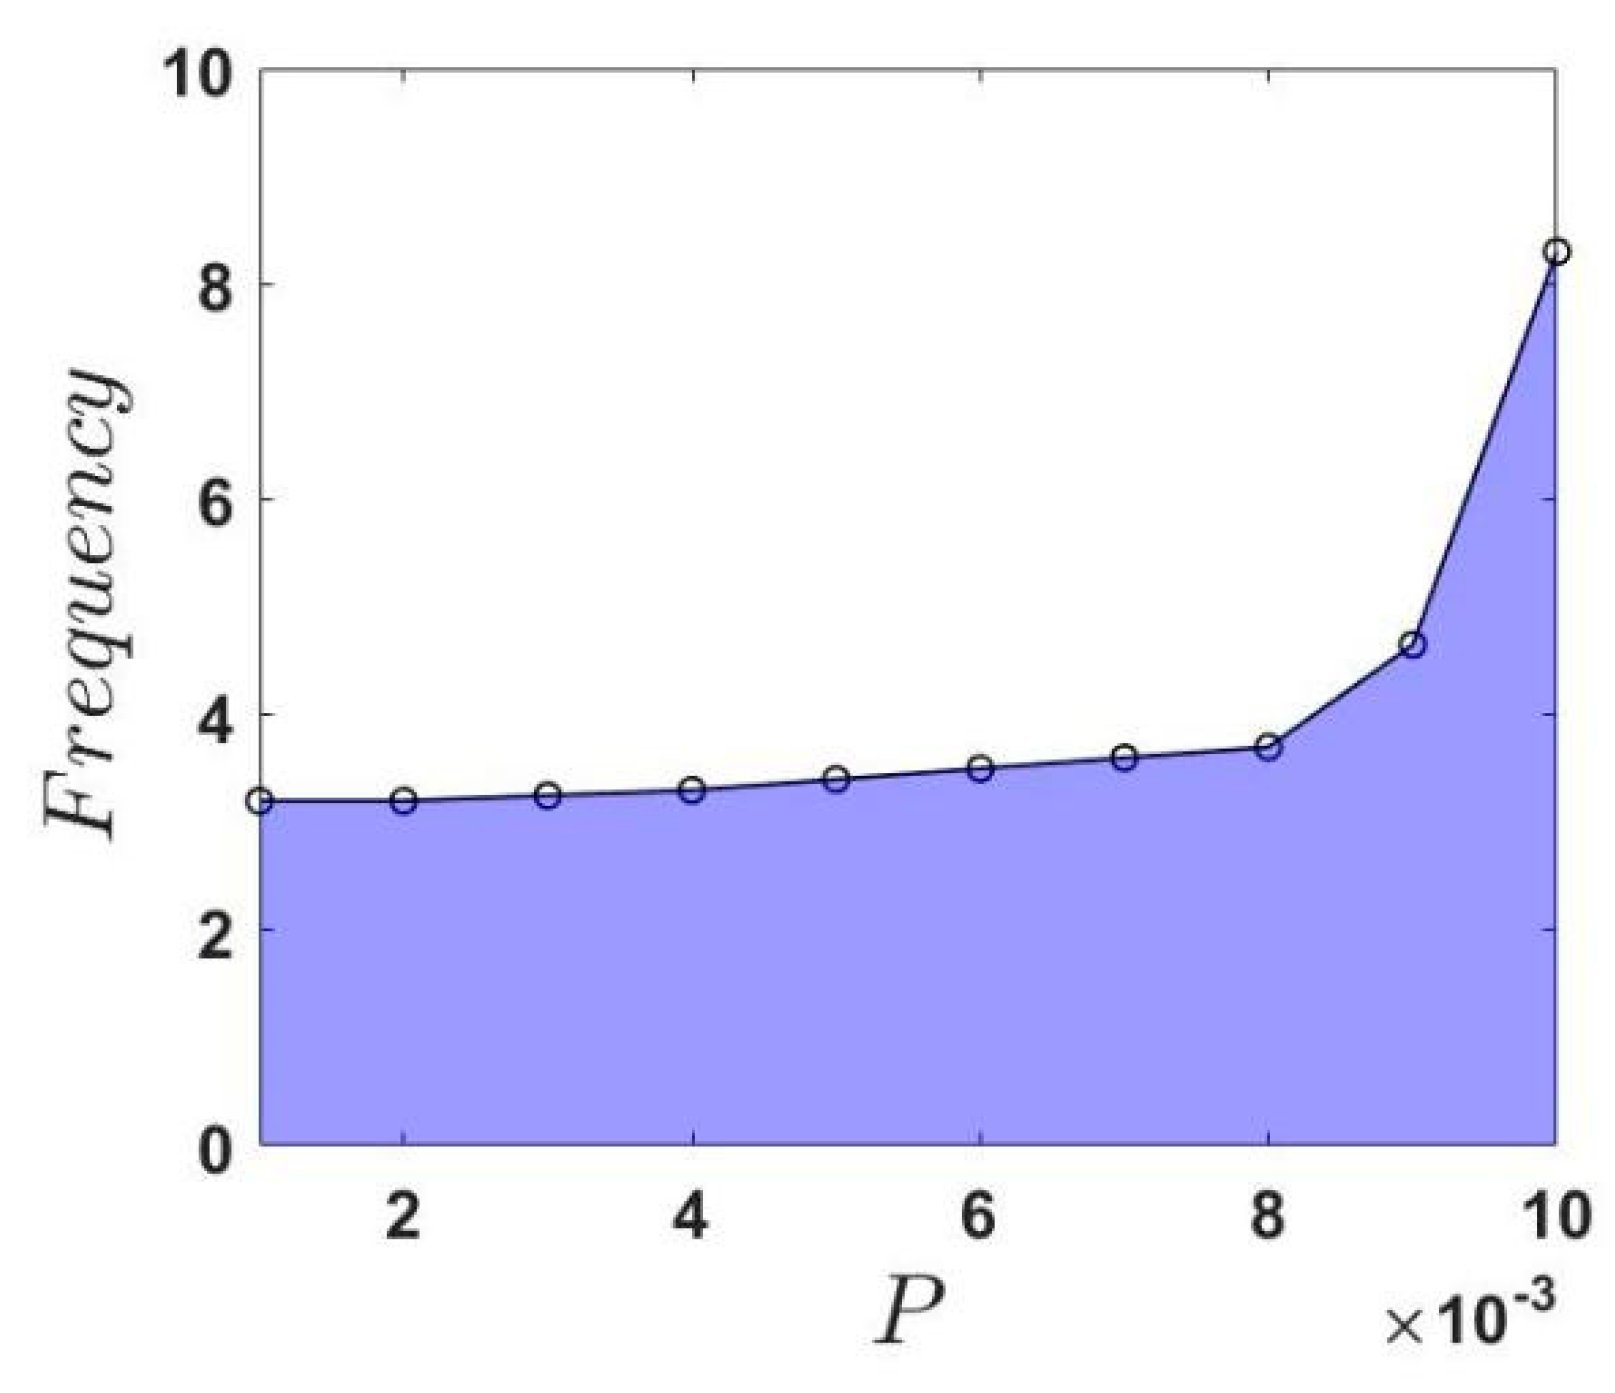
2.3. Parametric Study of the Effective Frequency Range
3. Isolator Installed on Linear Structure
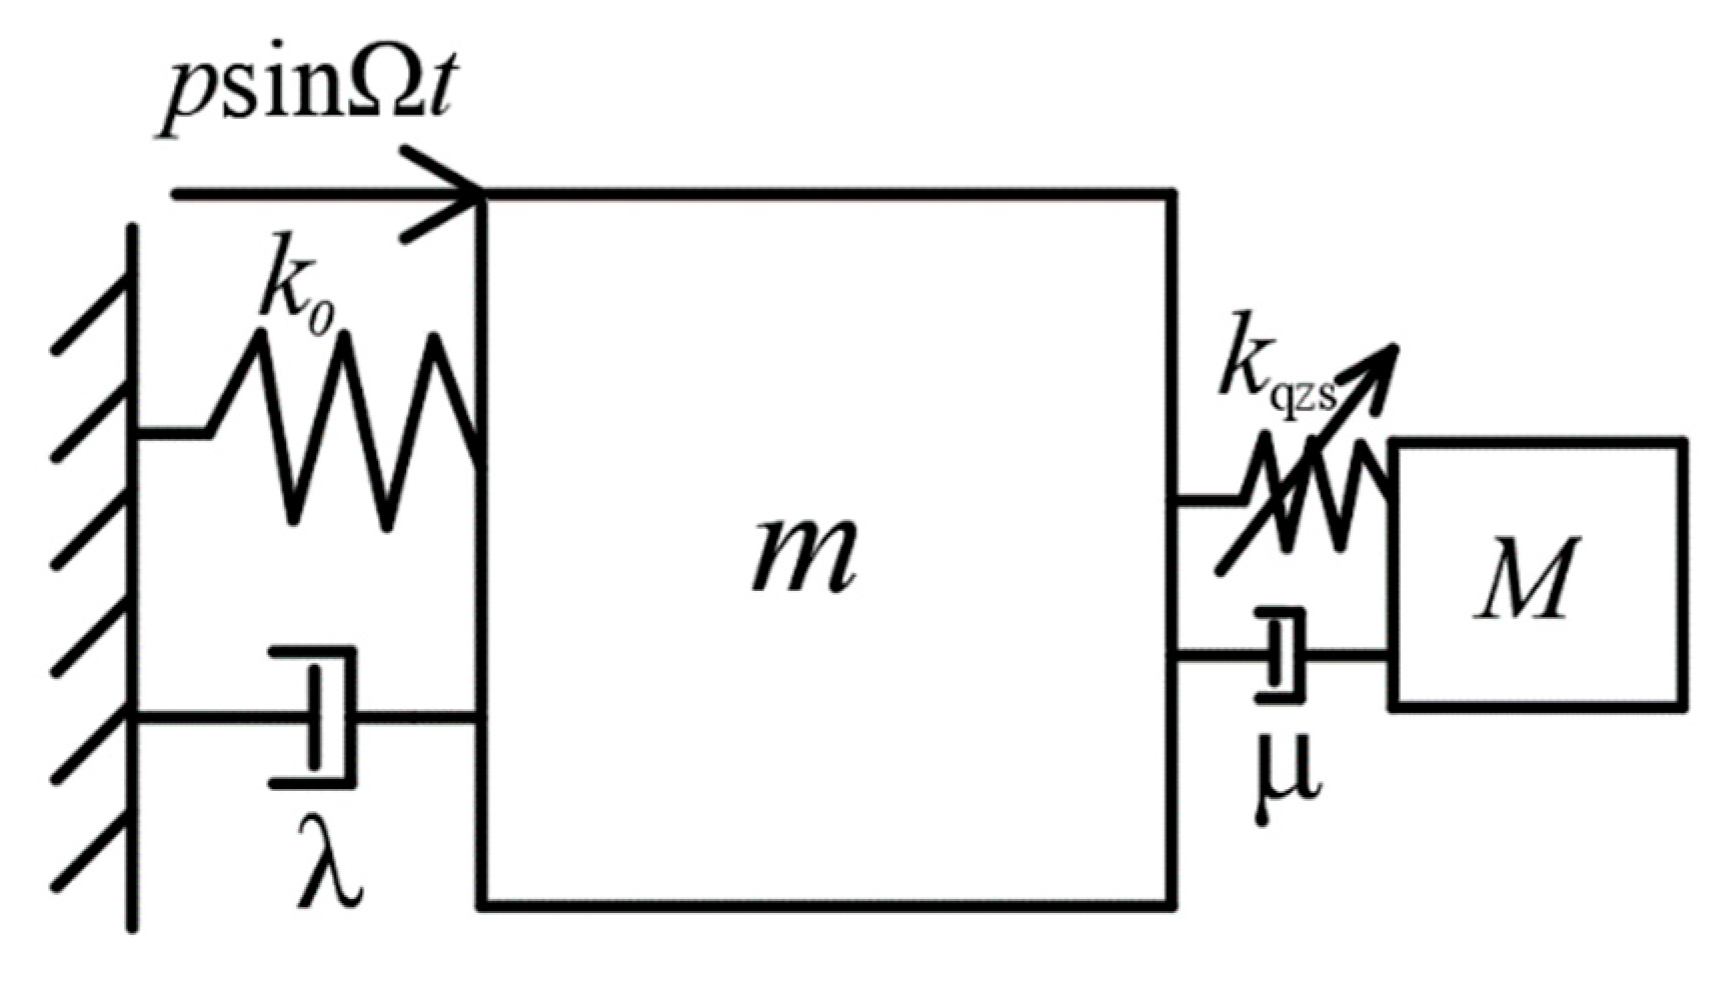
3.1. Dynamic Model
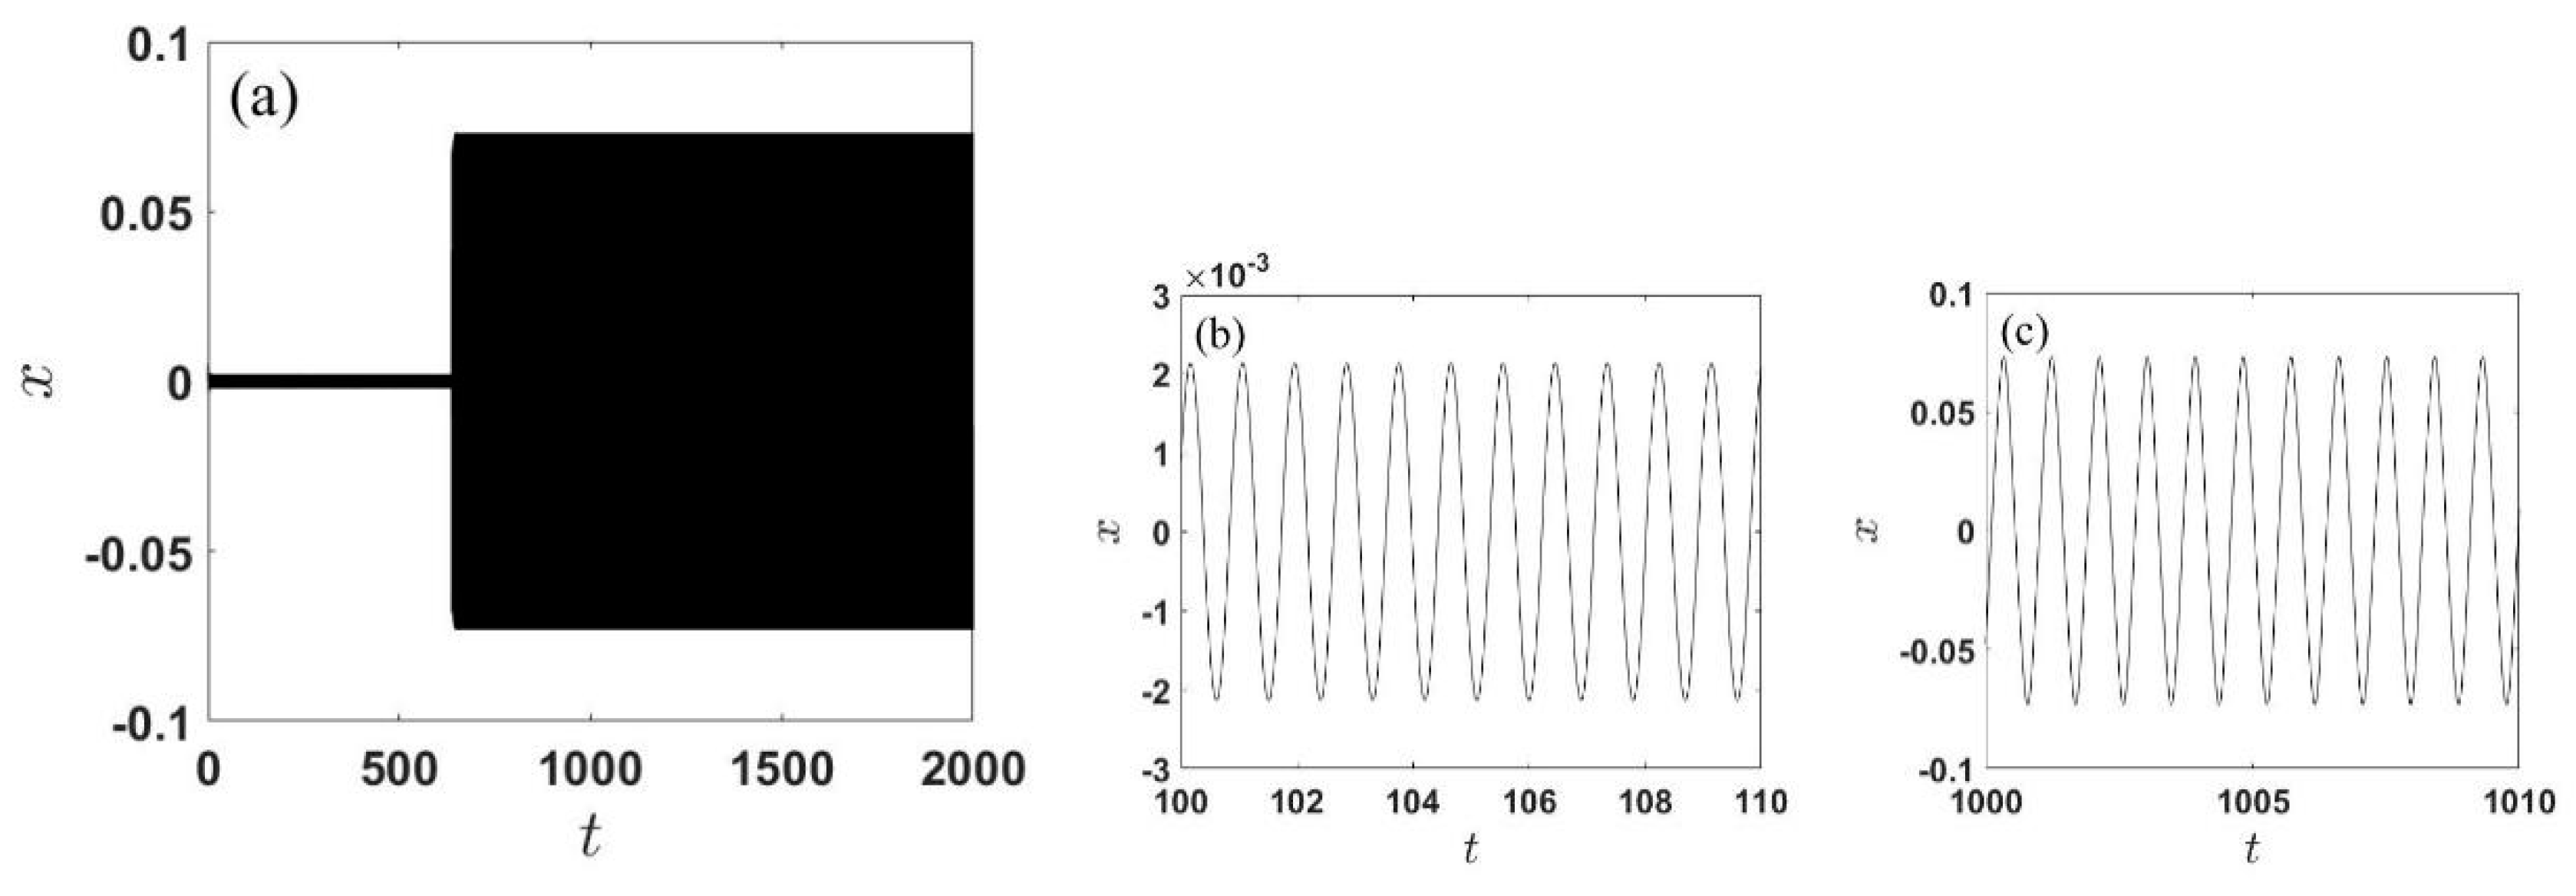
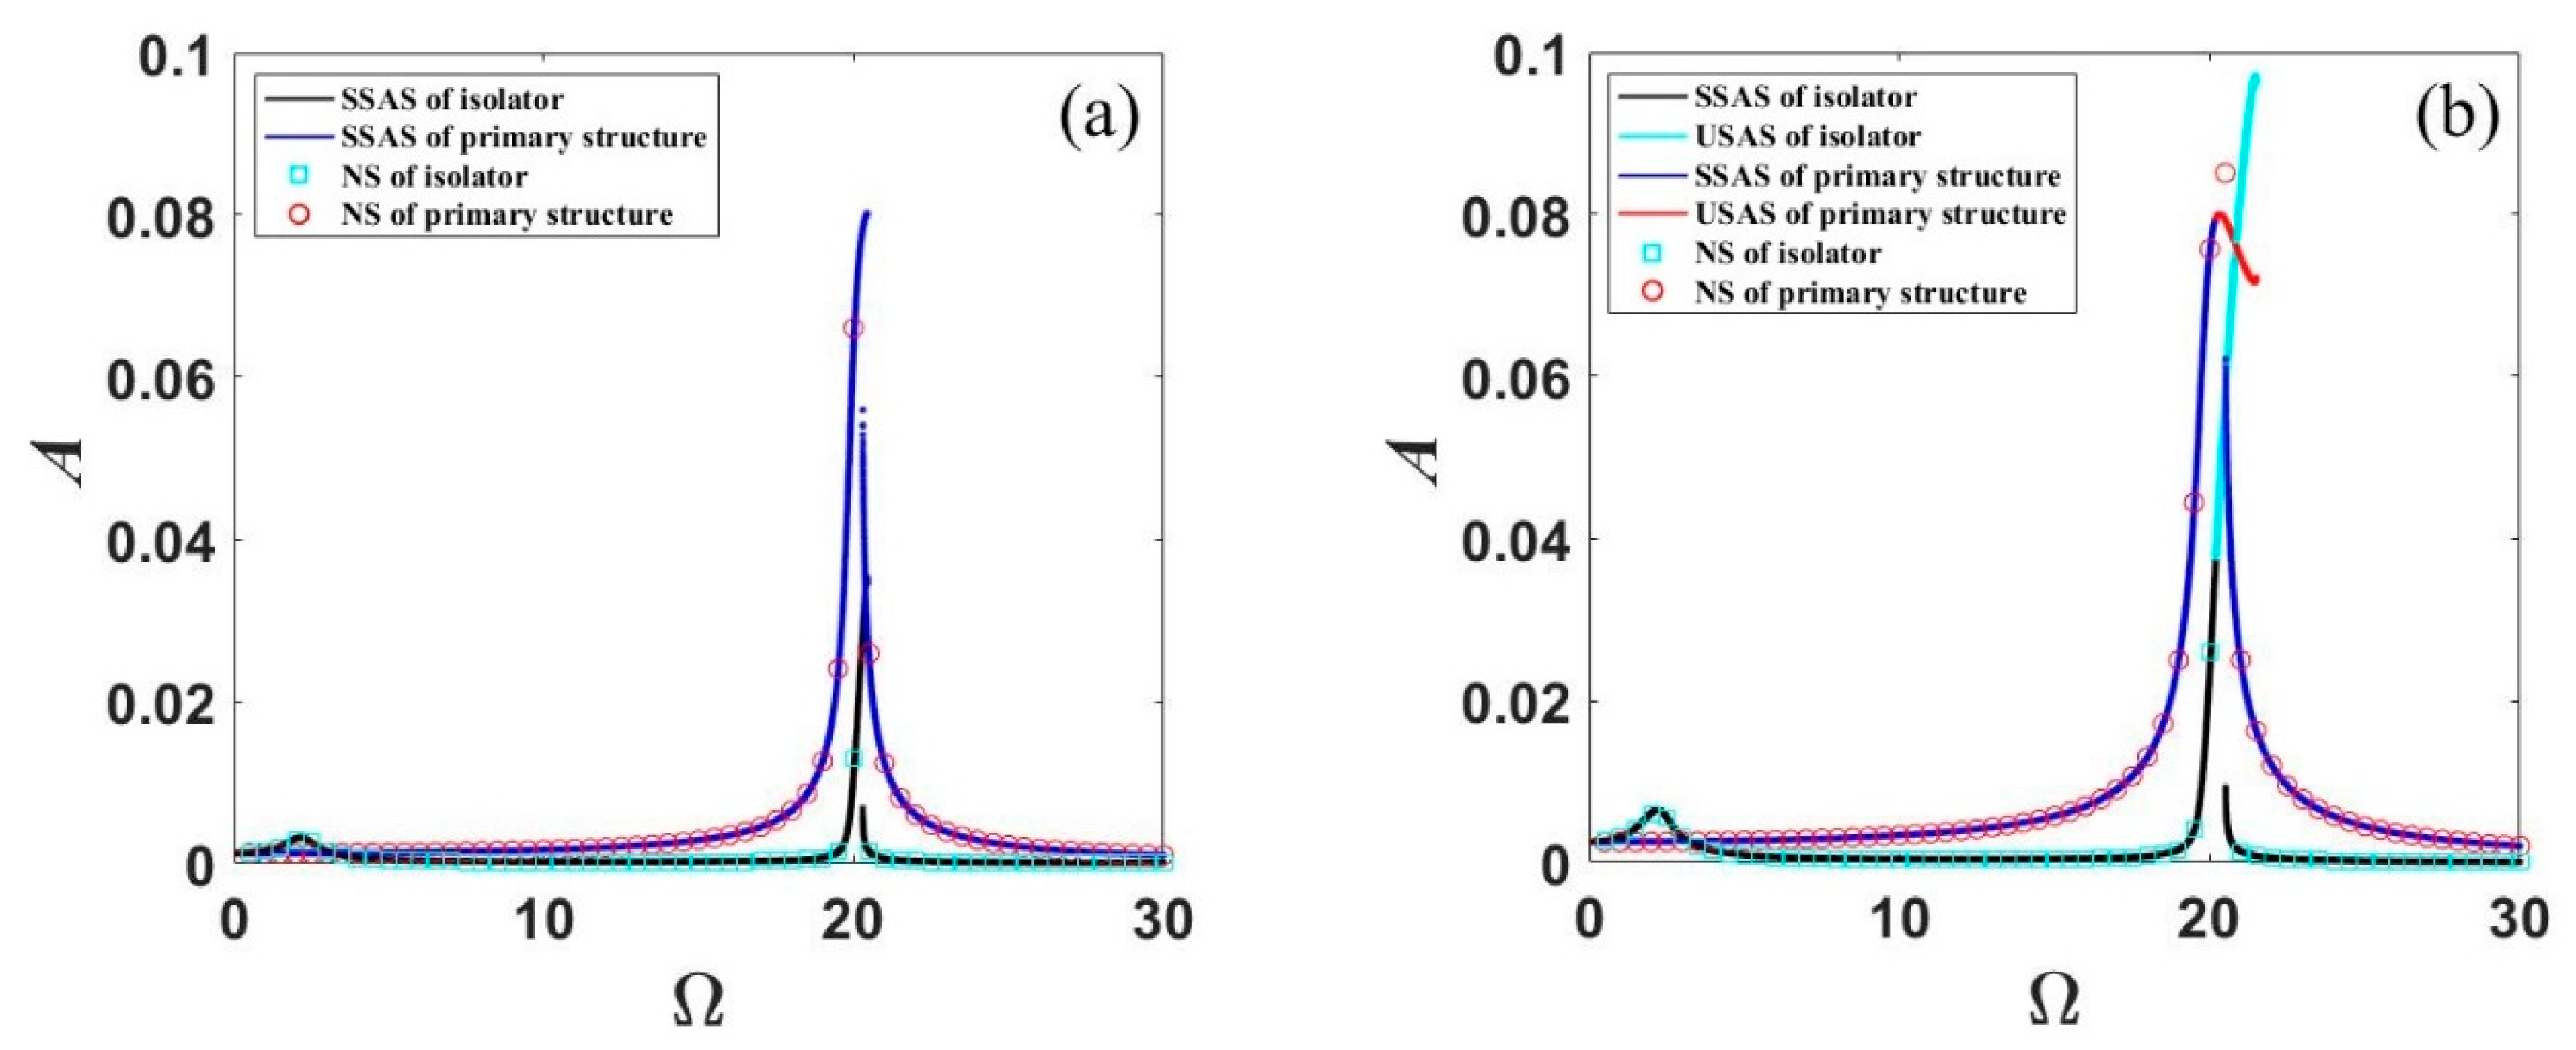
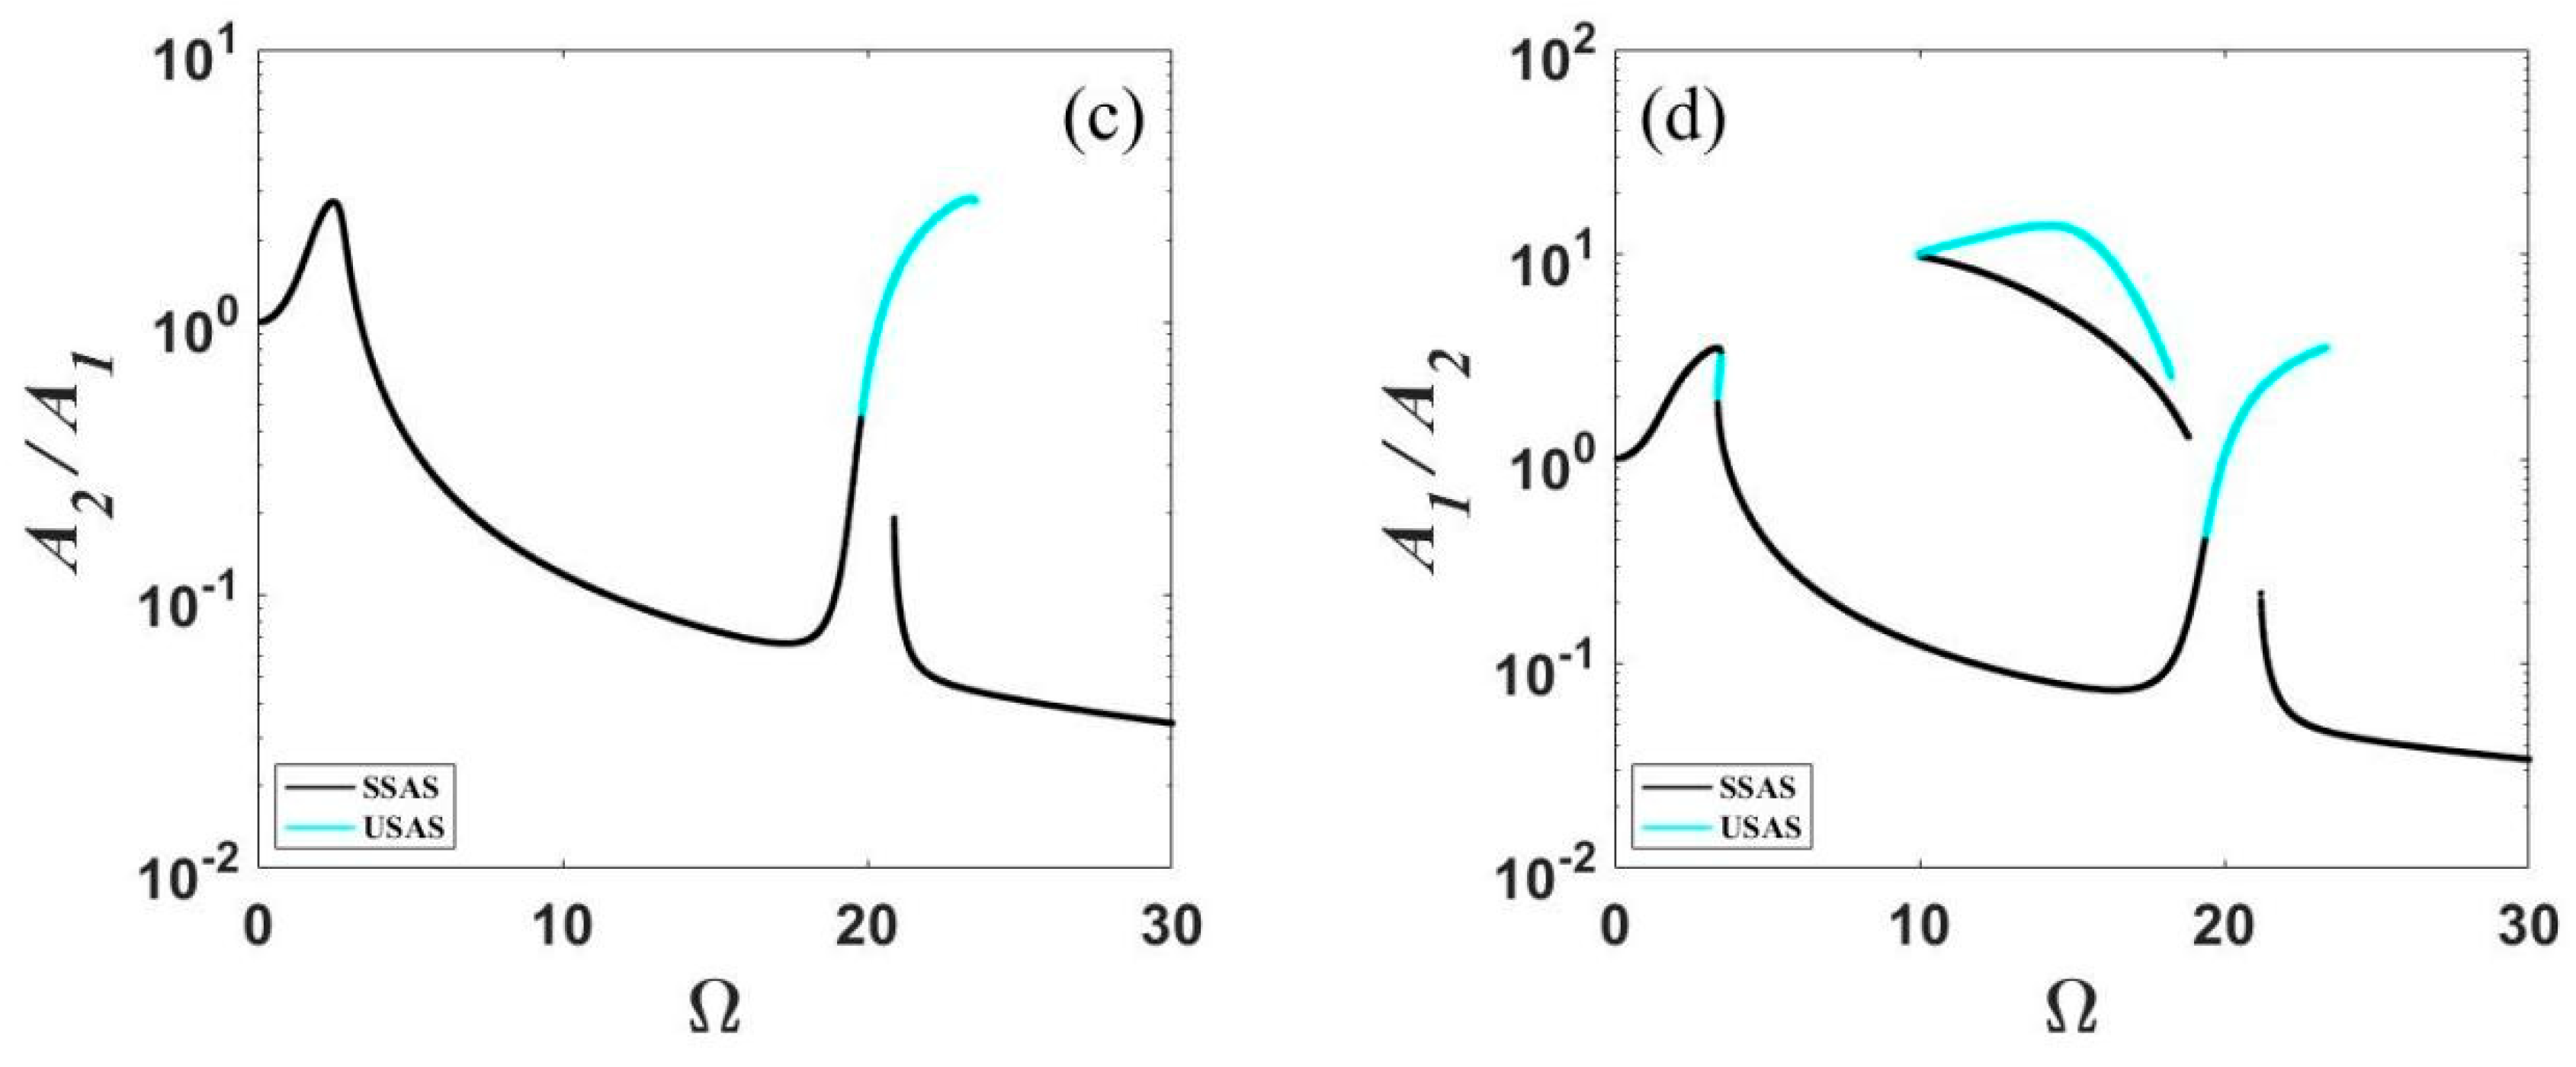
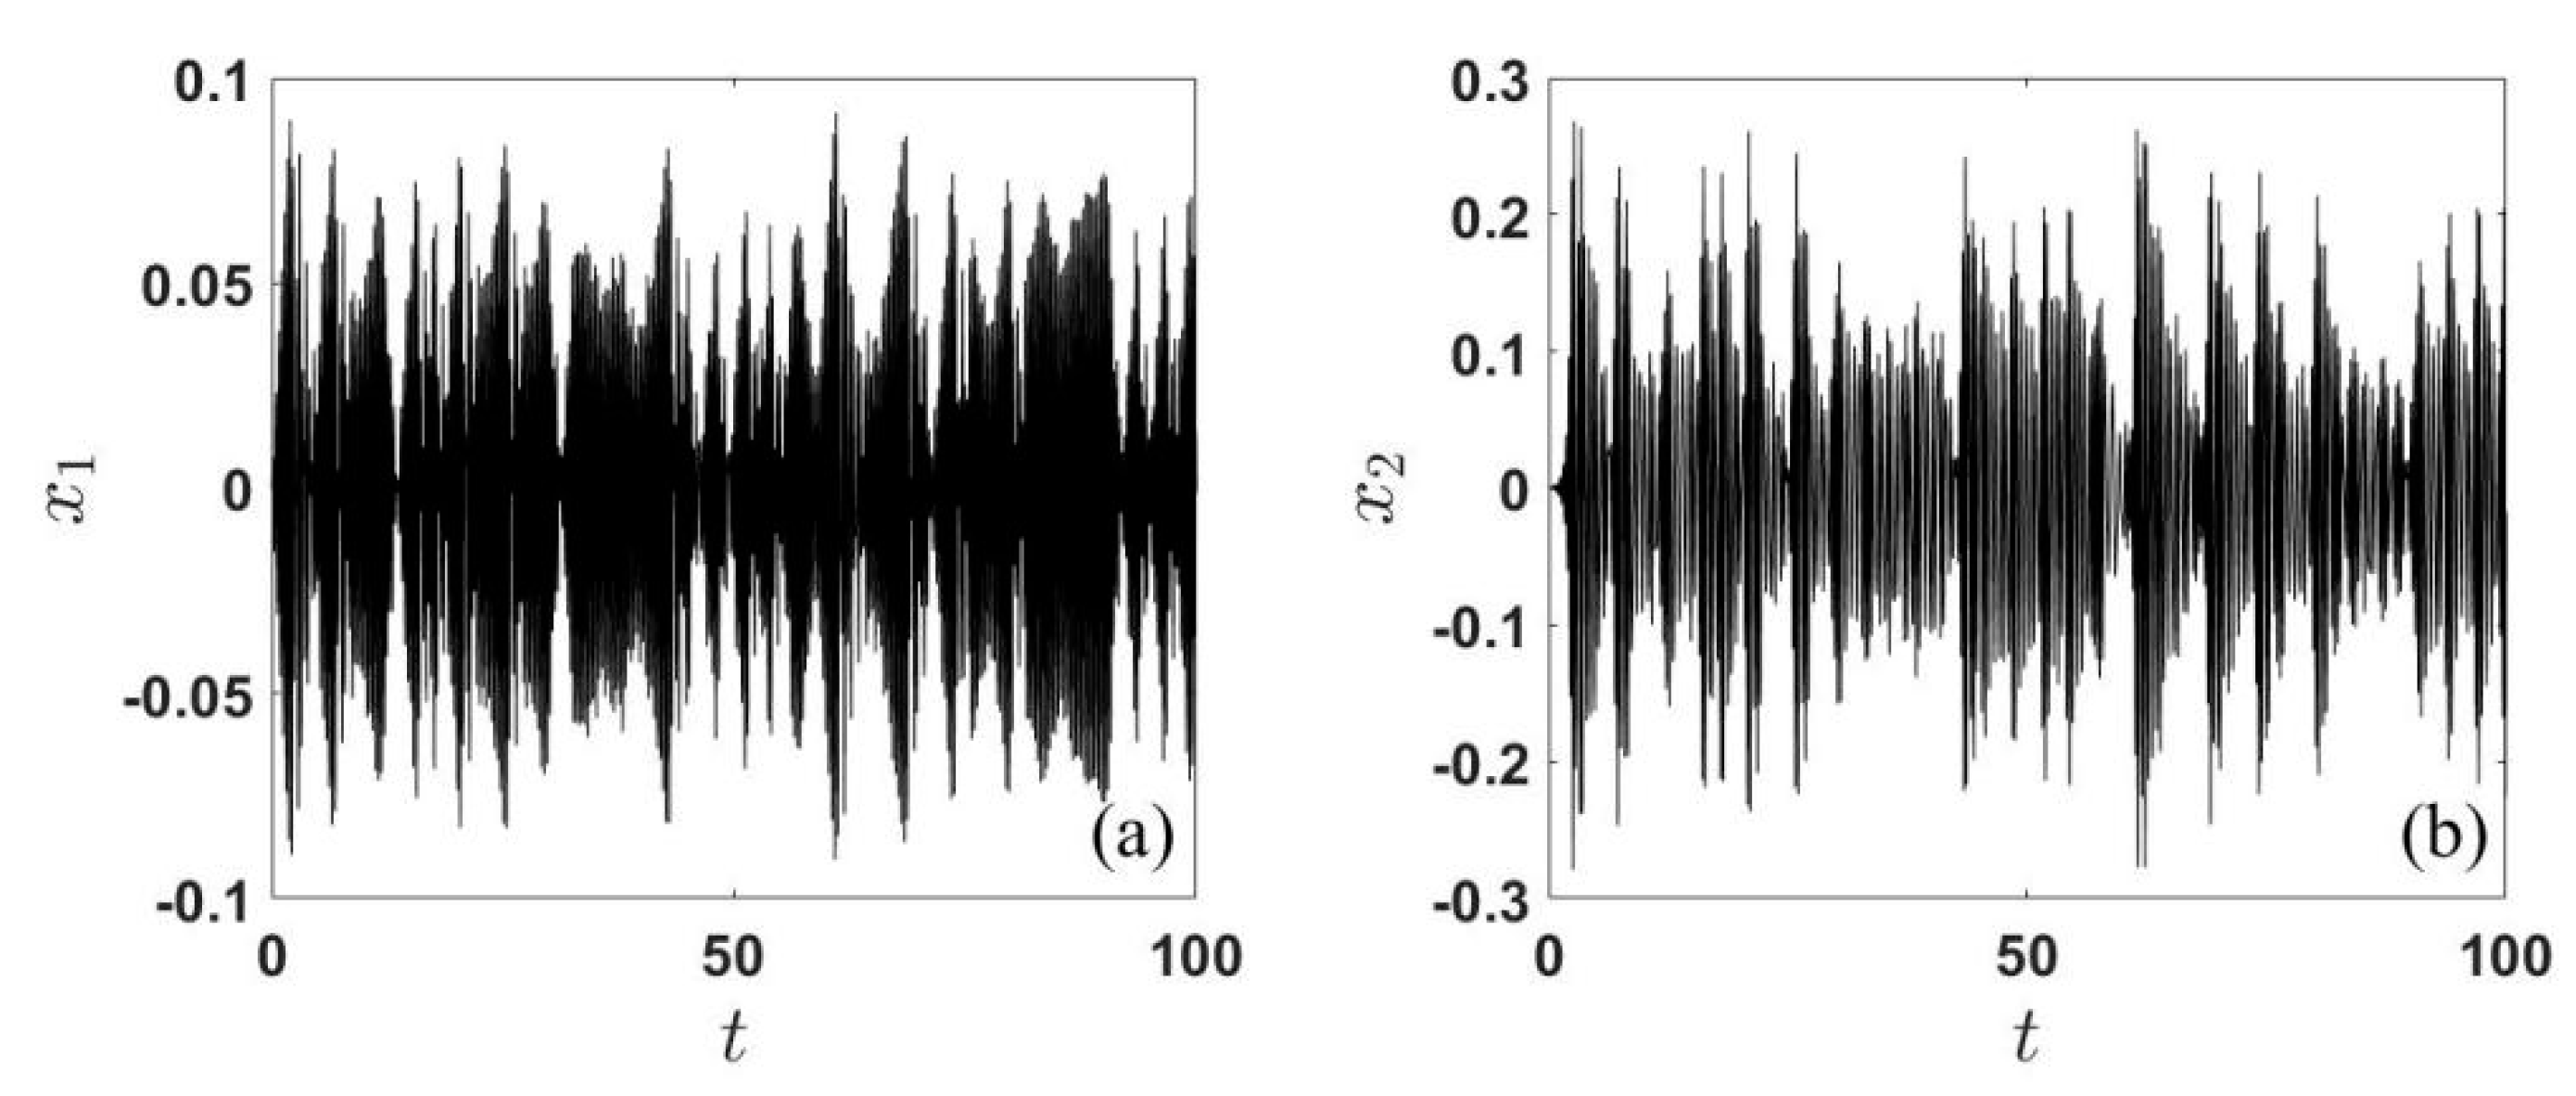
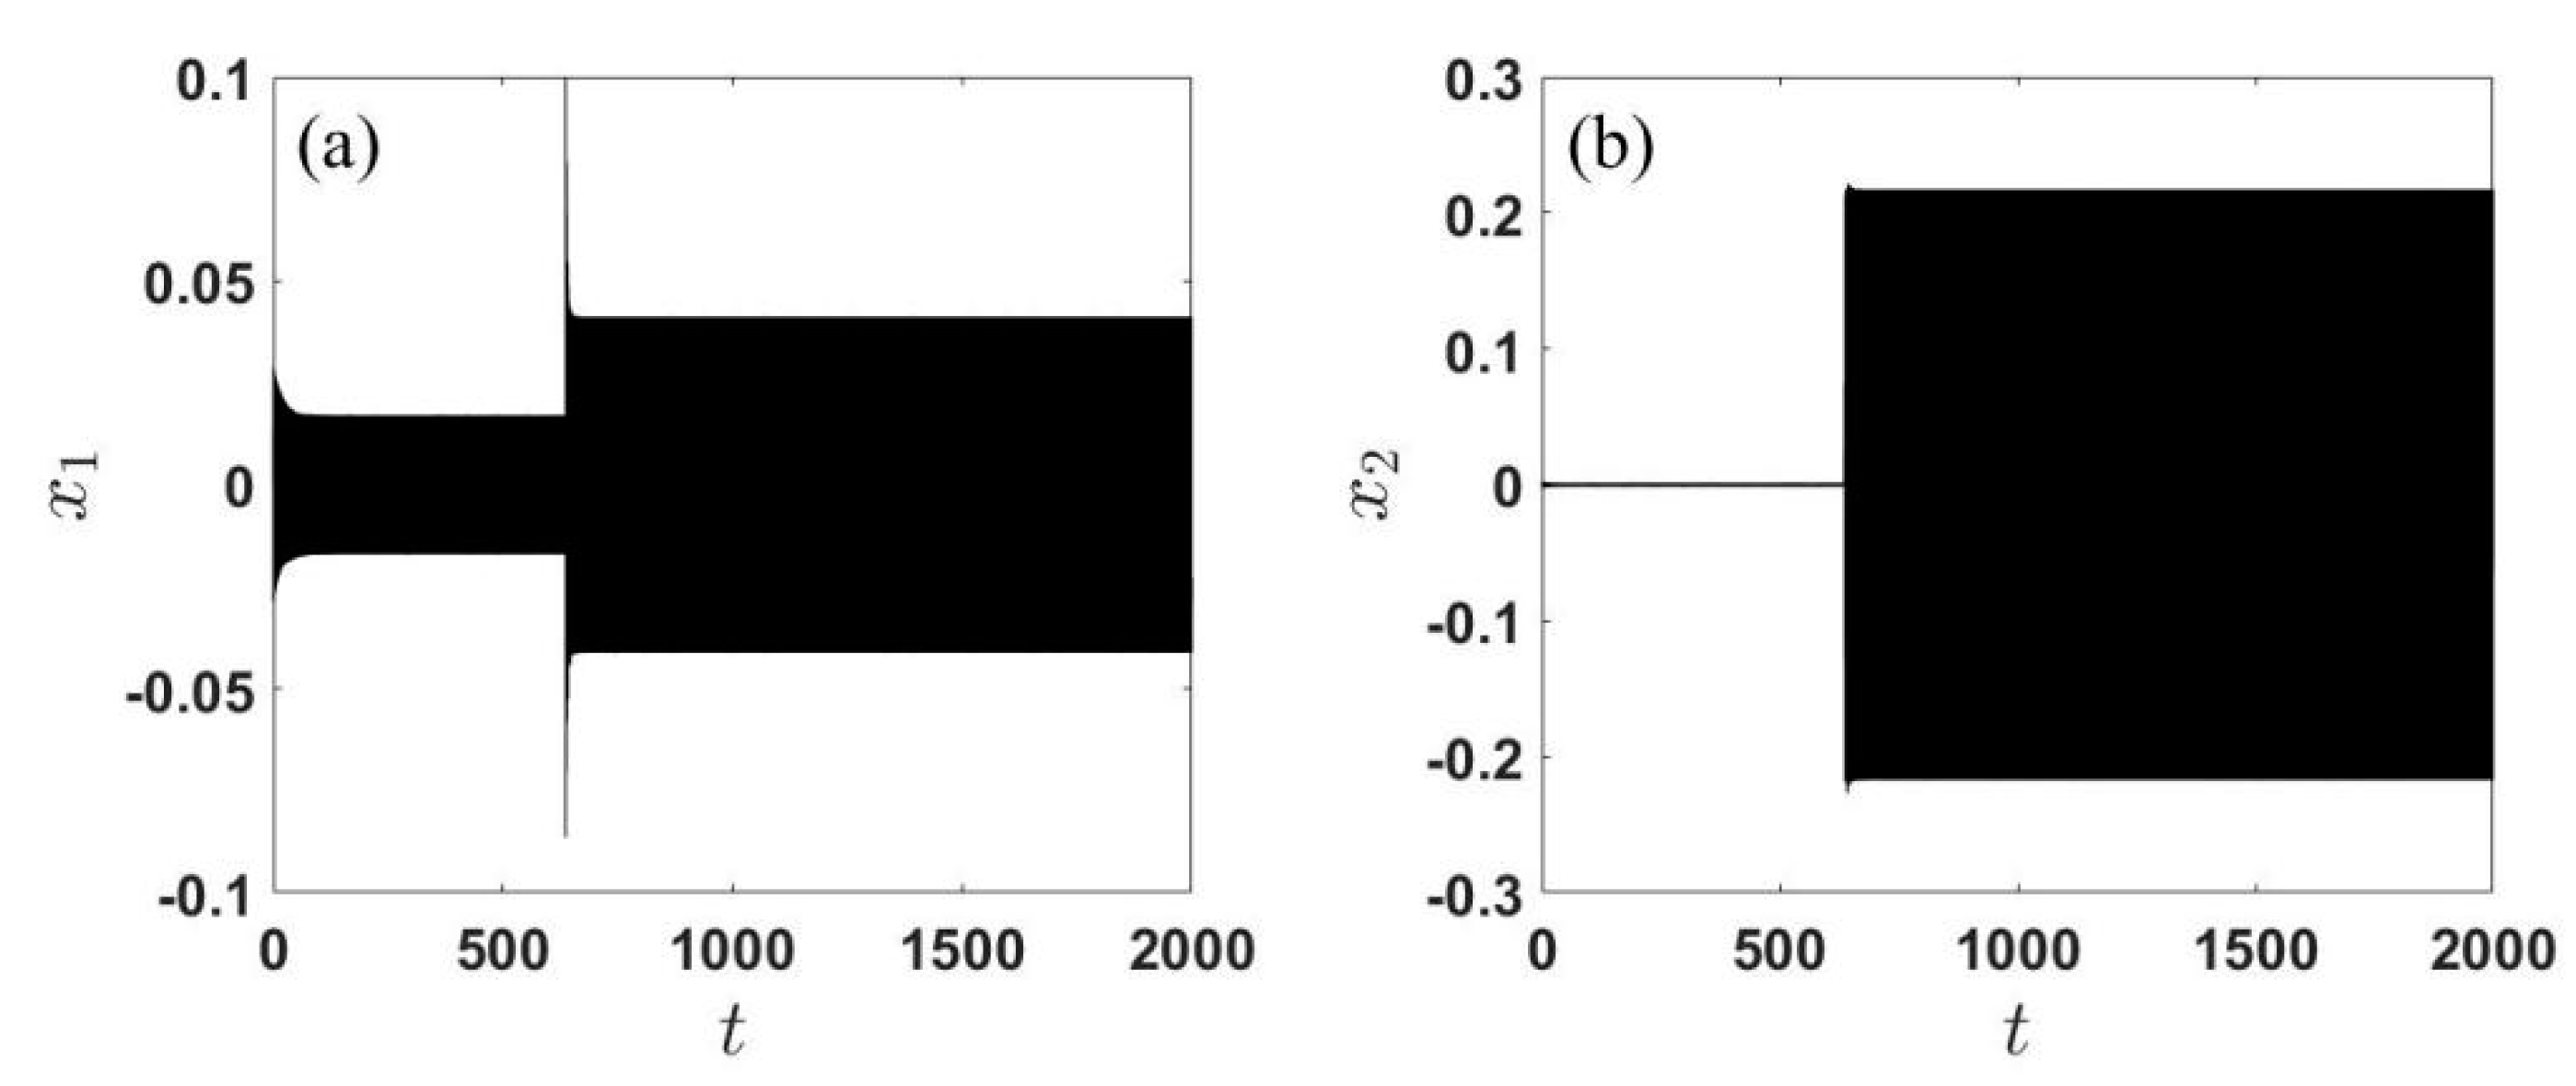
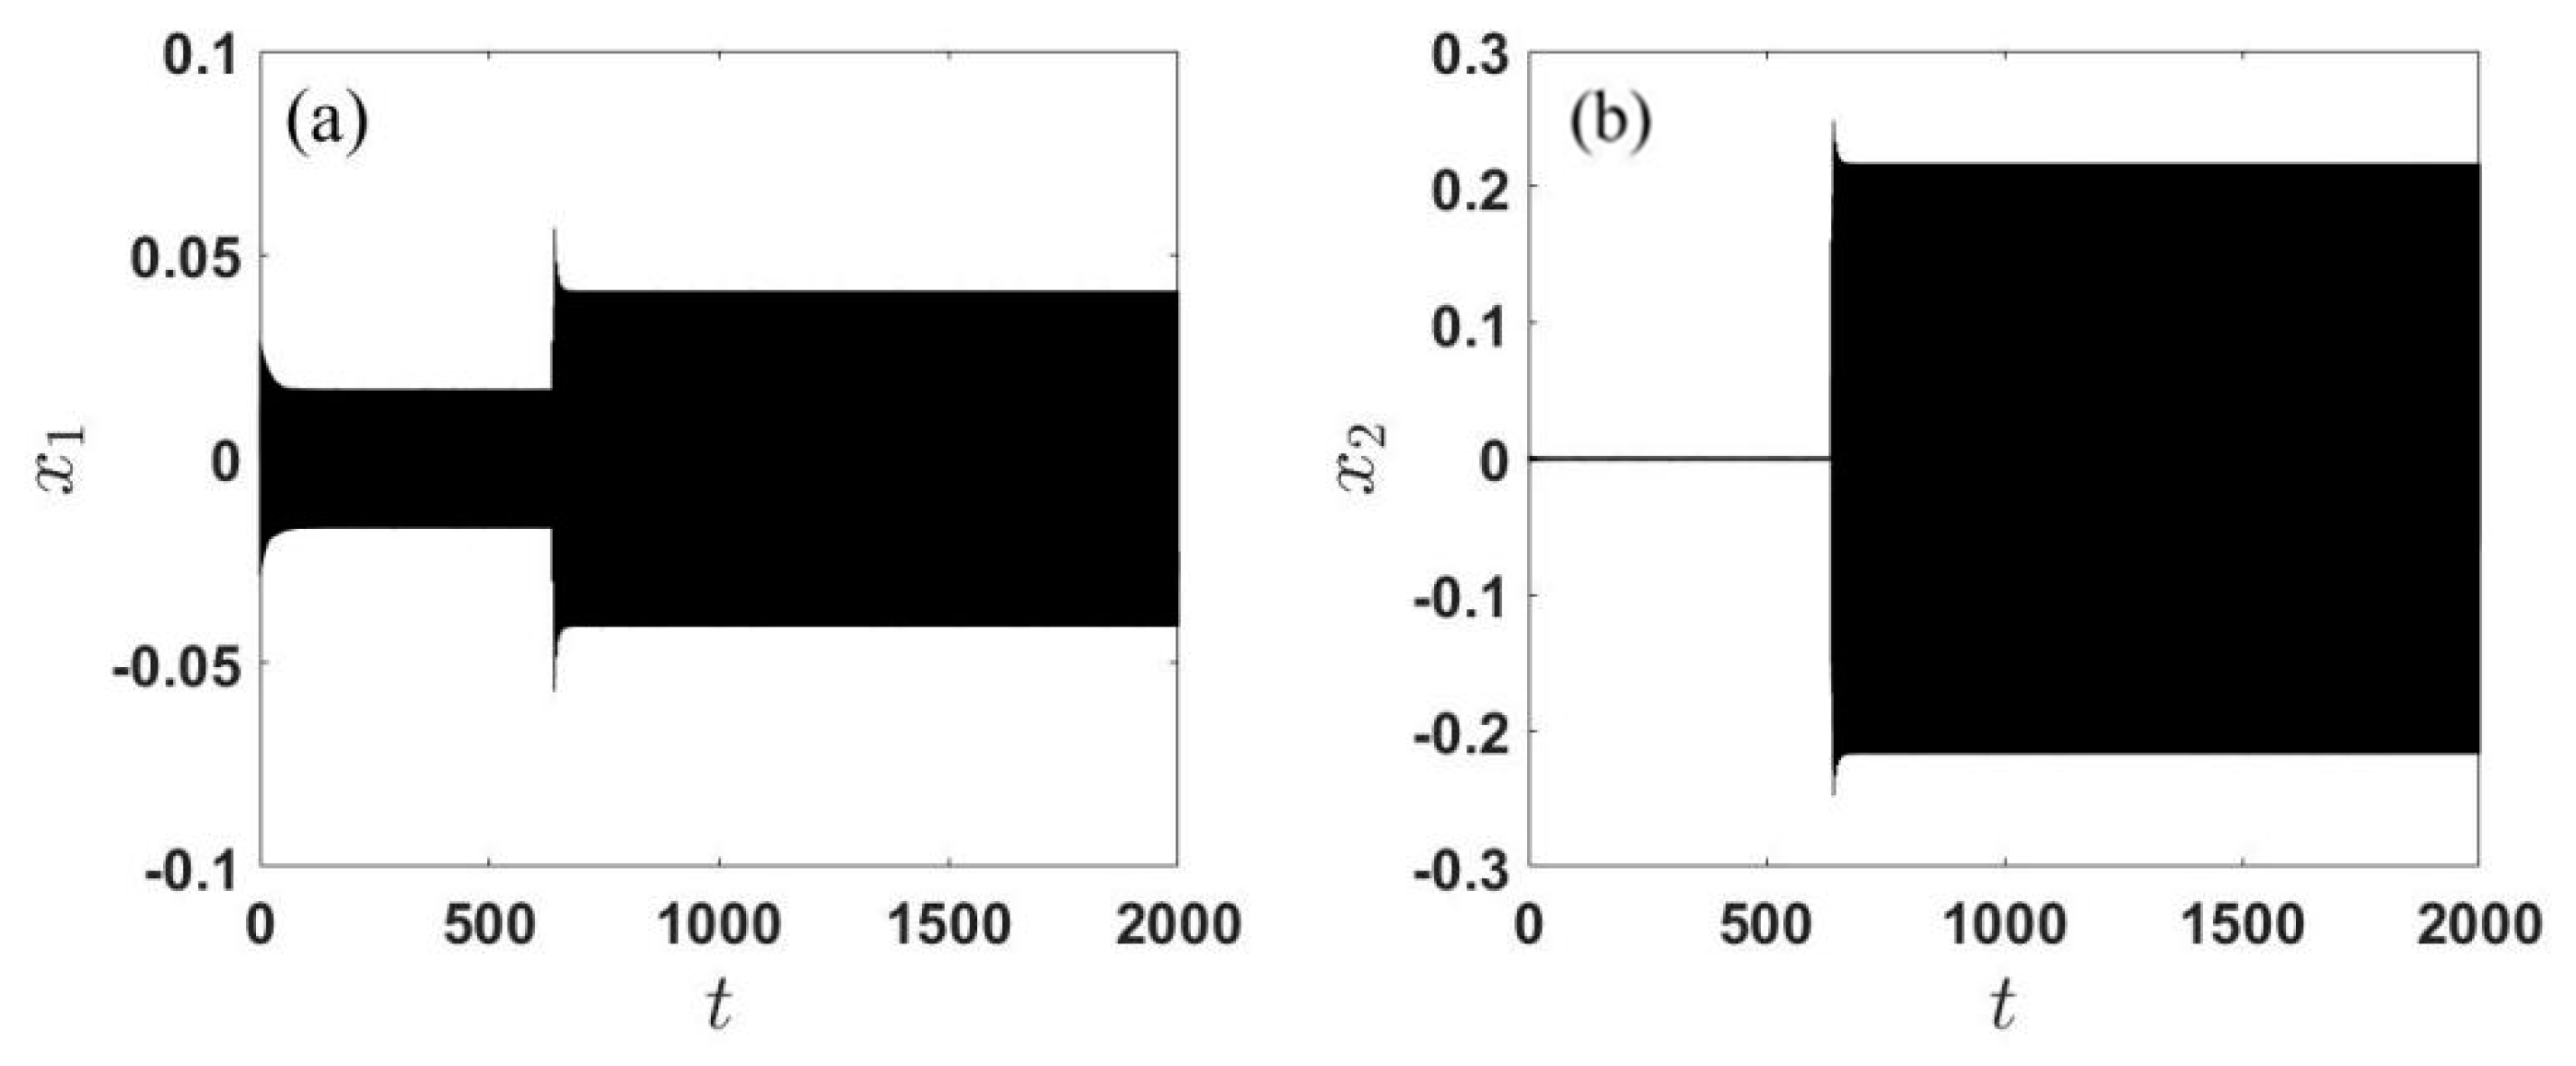
3.2. Jump Behavior
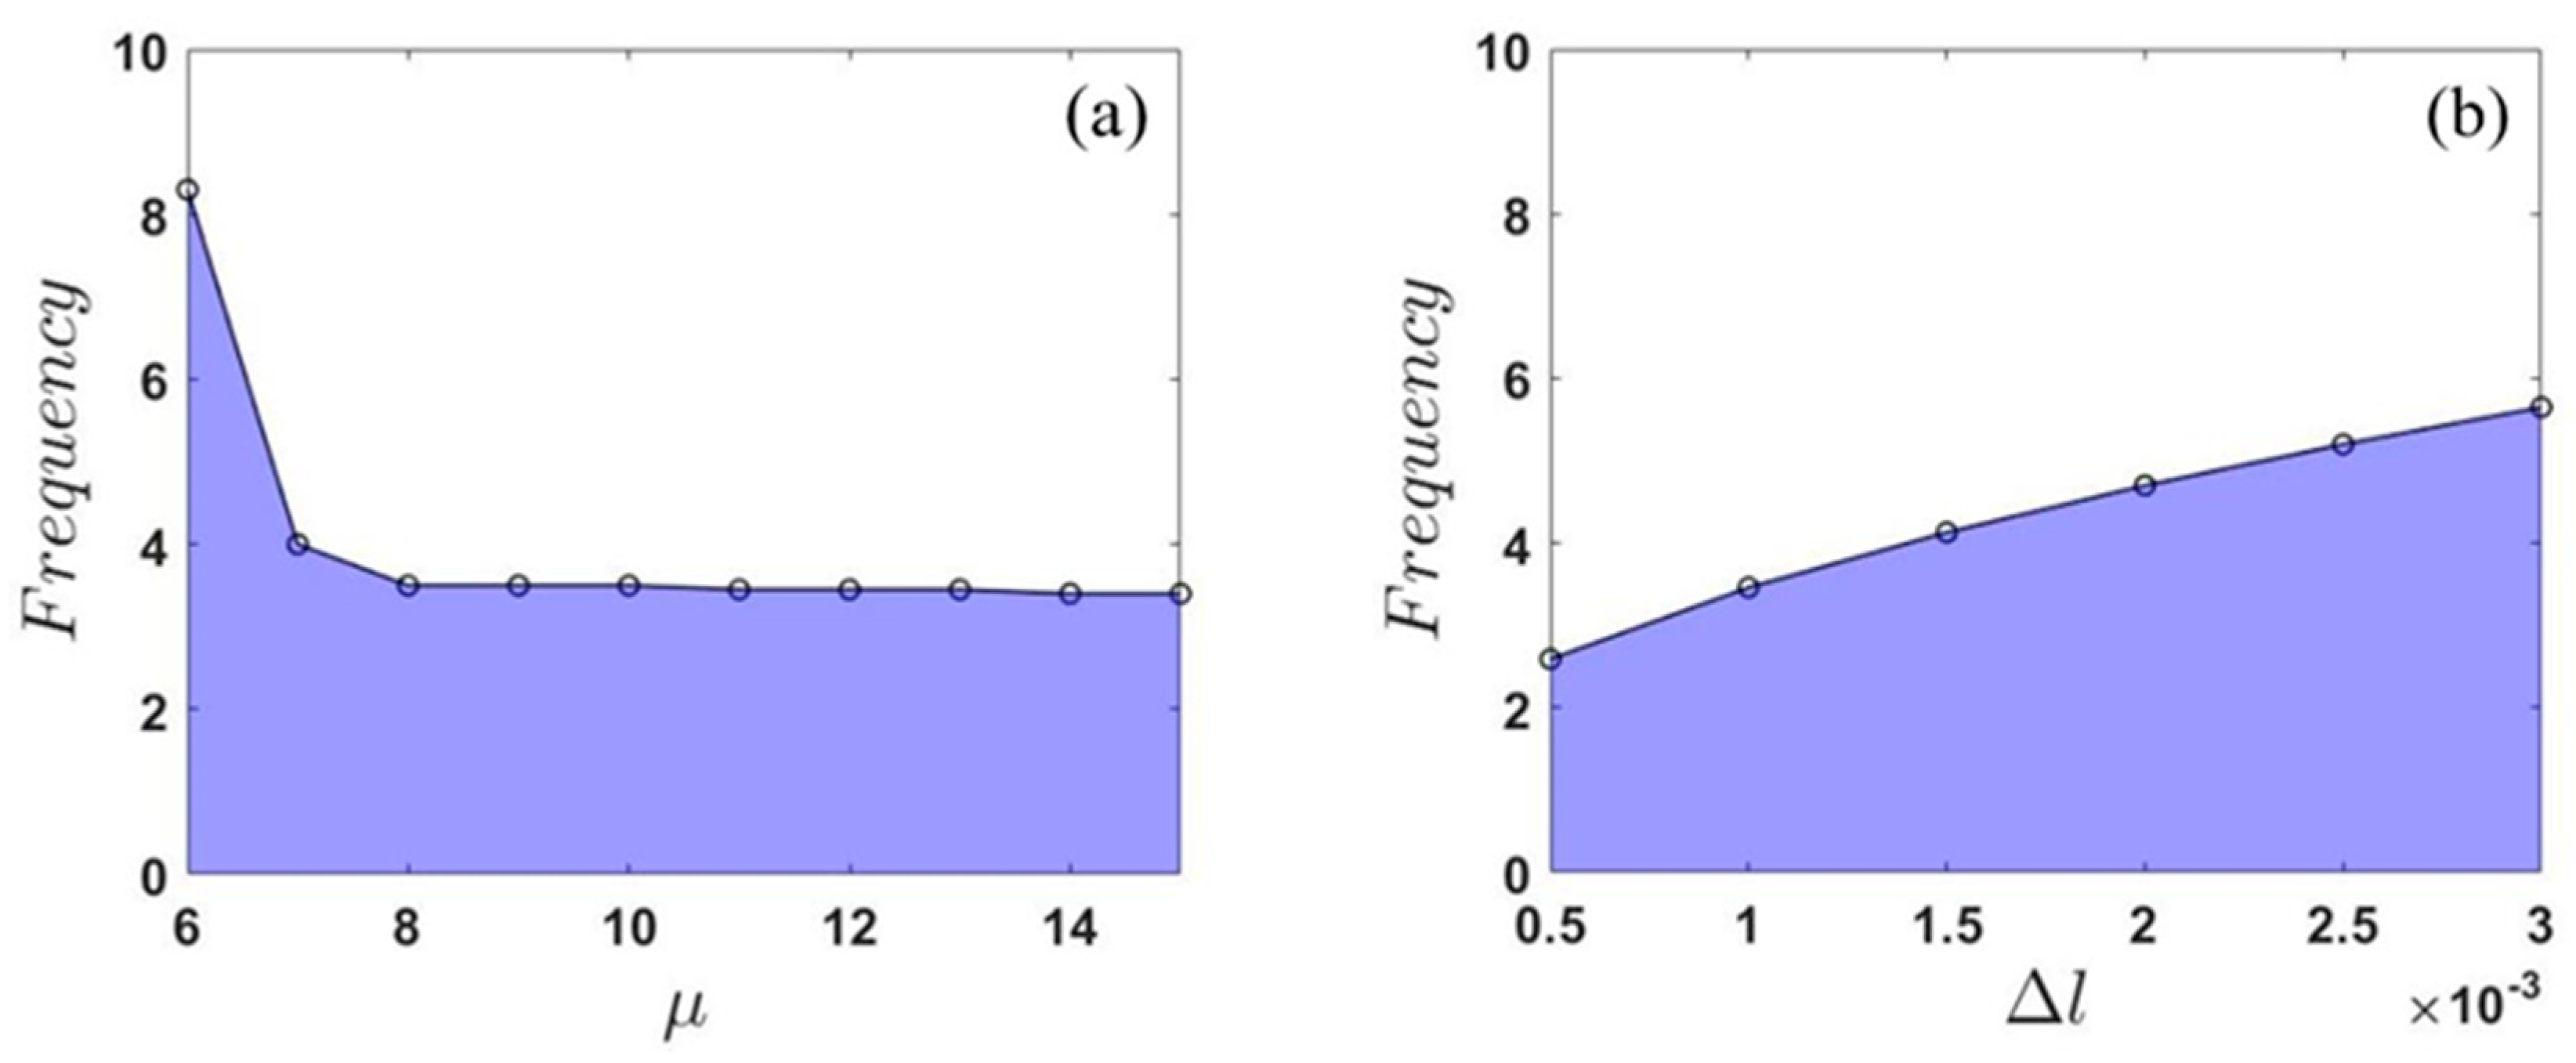
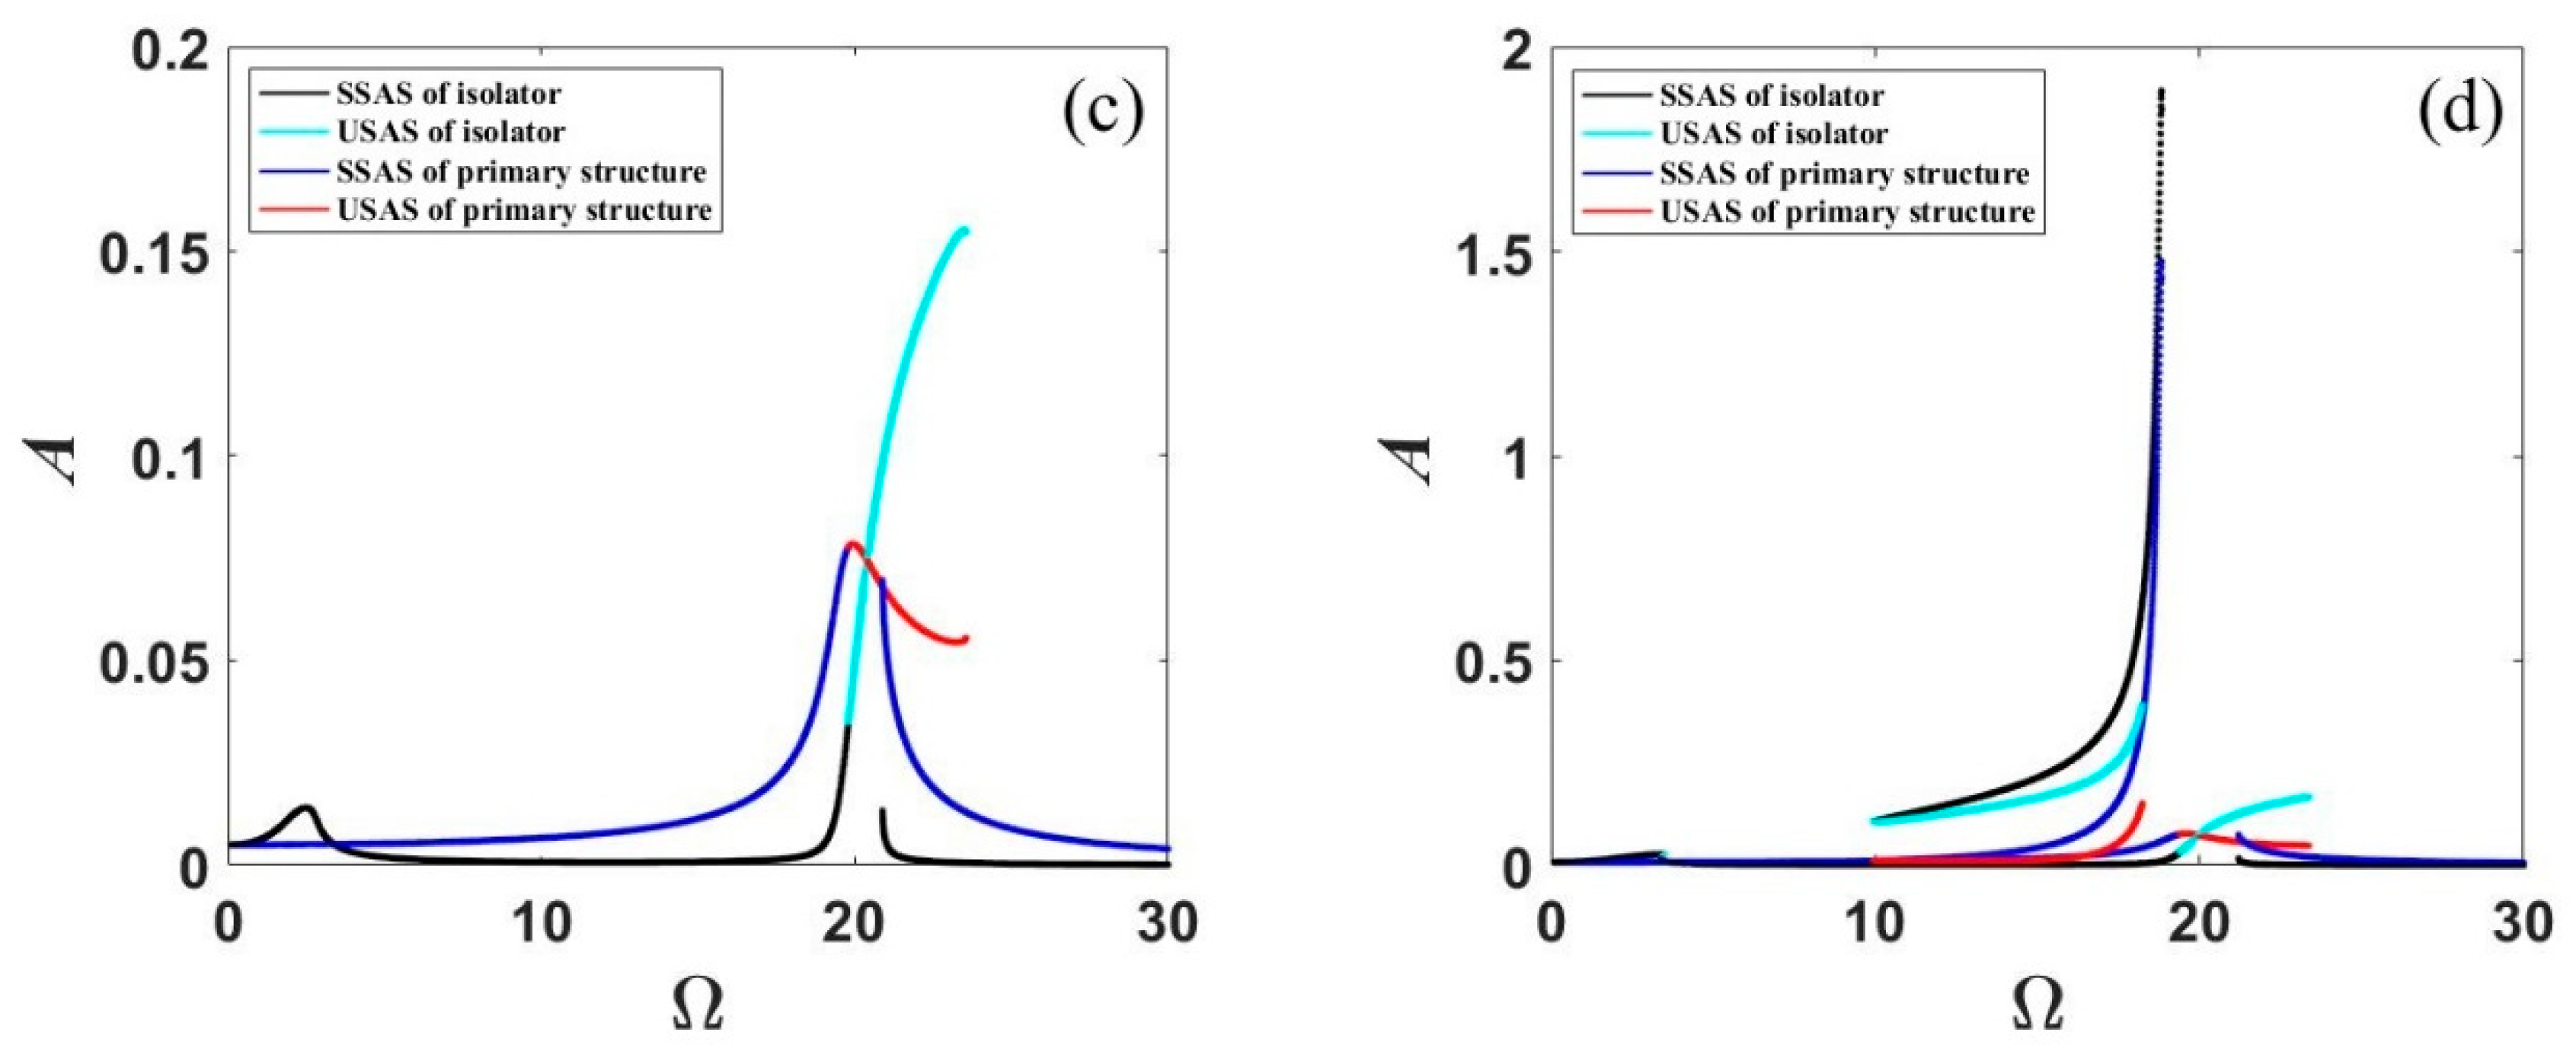
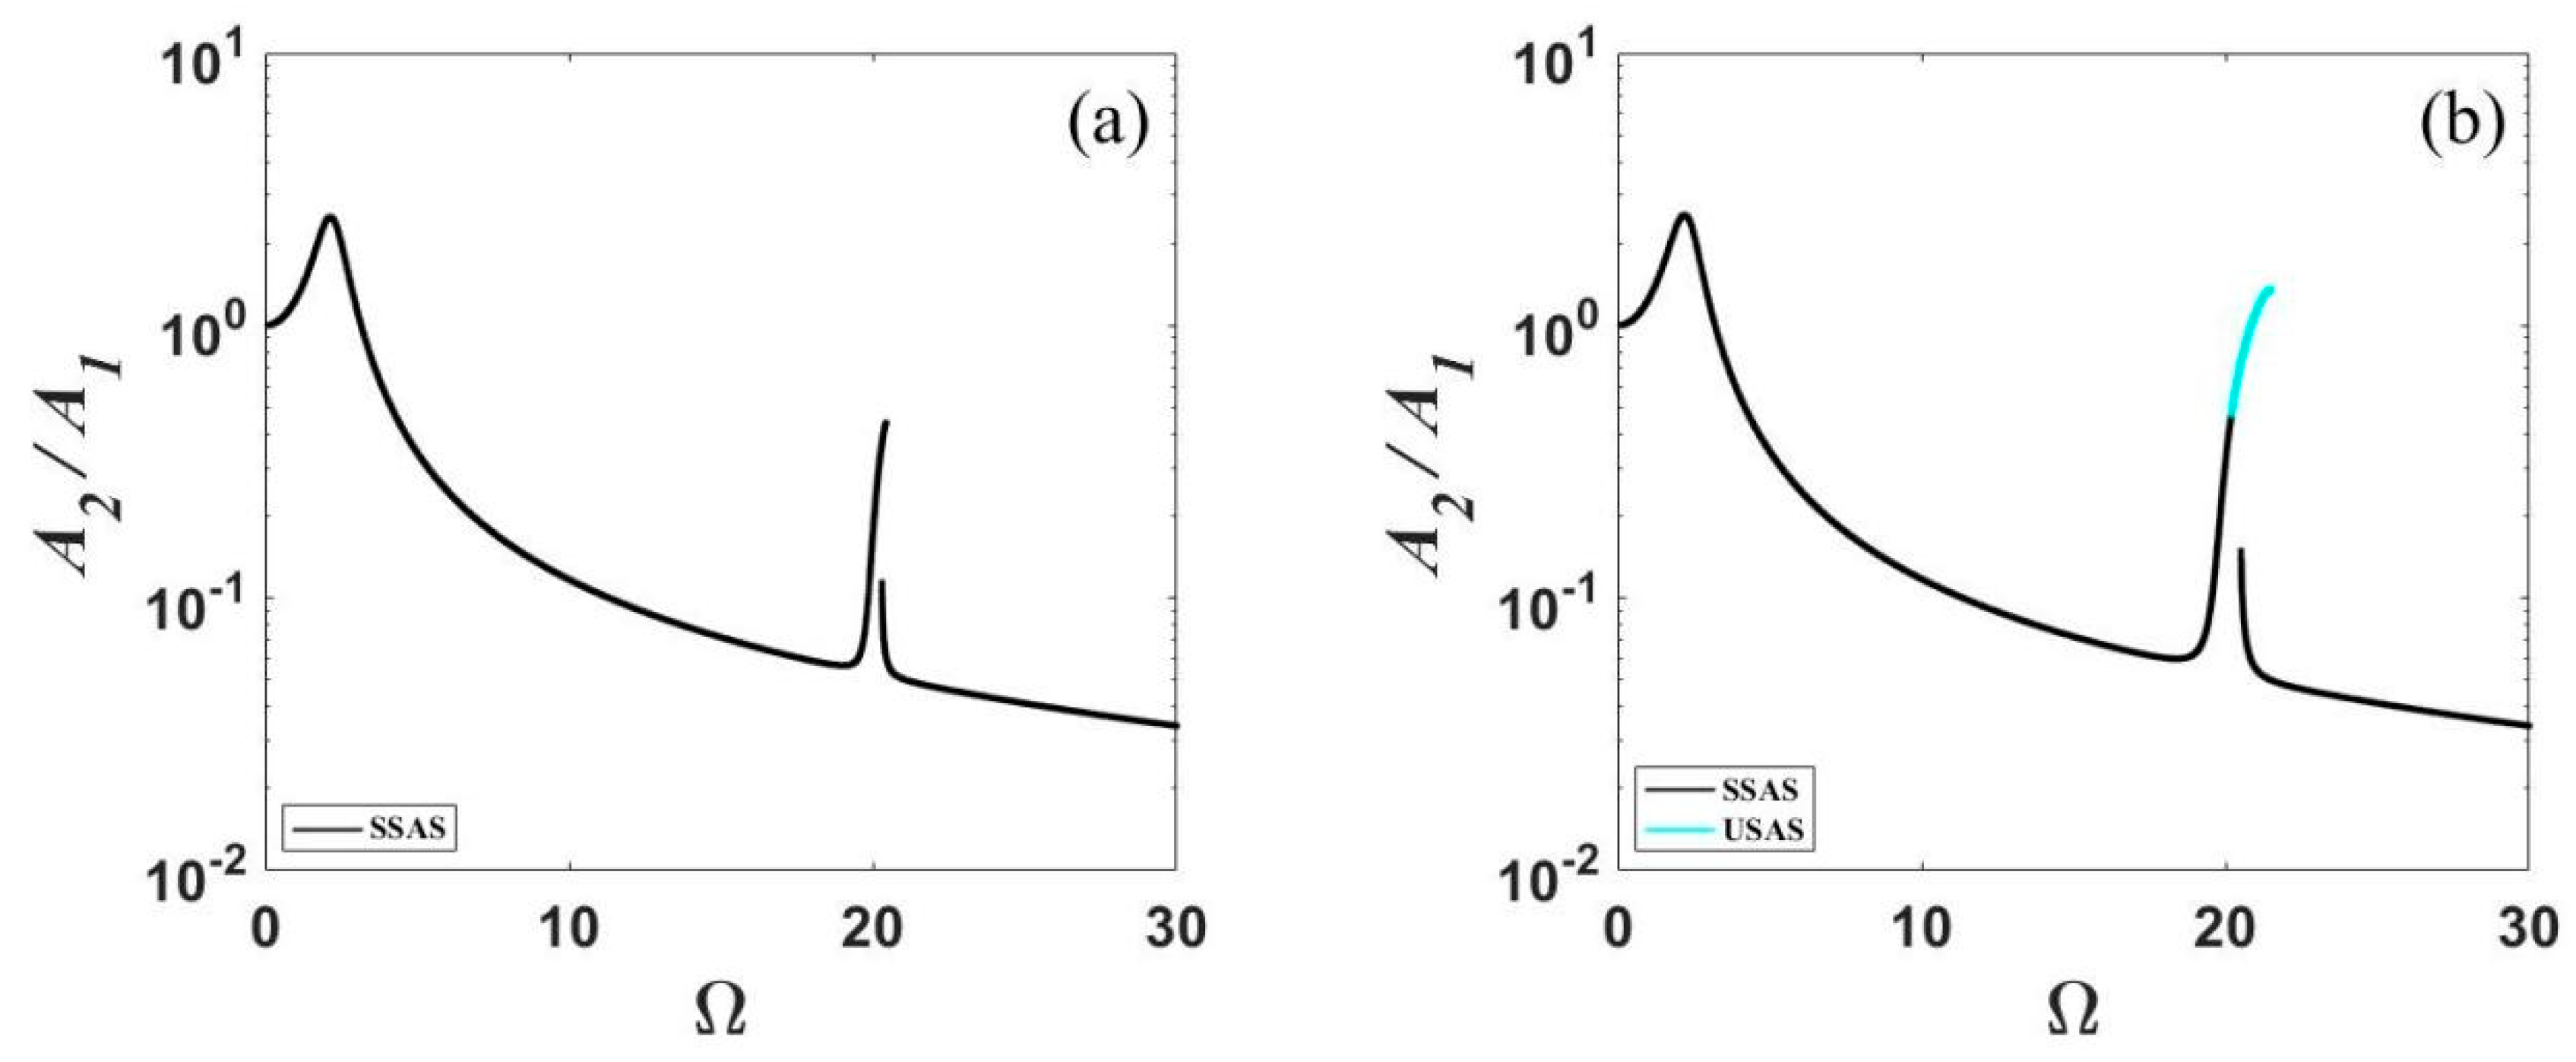
3.3. Parametric Study for Effective Frequency Range
4. Conclusions
Author Contributions
Funding
Institutional Review Board Statement
Informed Consent Statement
Data Availability Statement
Acknowledgments
Conflicts of Interest
References
- Zhang, Y.T.; Cao, Q.J.; Huang, W.H. Bursting oscillations in an isolation system with quasi-zero stiffness. Mech. Syst. Signal Process. 2021, 161, 107916. [Google Scholar] [CrossRef]
- Balaji, P.S.; SelvaKumar, K.K. Applications of nonlinearity in passive vibration control: A review. J. Vib. Eng. Technol. 2021, 9, 183–213. [Google Scholar] [CrossRef]
- Zhang, Y.T.; Cao, Q.J. The recent advances for an archetypal smooth and discontinuous oscillator. Int. J. Mech. Sci. 2022, 214, 106904. [Google Scholar] [CrossRef]
- Xu, D.L.; Yu, Q.P.; Zhou, J.X.; Bishop, S.R. Theoretical and experimental analyses of a nonlinear magnetic vibration isolator with quasi-zero-stiffness characteristic. J. Sound Vib. 2013, 33, 3377–3389. [Google Scholar] [CrossRef]
- Wang, Q.; Zhou, J.X.; Wang, K.; Xu, D.L.; Wen, G.L. Design and experimental study of a compact quasi-zero-stiffness isolator using wave springs. Sci. China-Technol. Sci. 2021, 64, 2255–2271. [Google Scholar] [CrossRef]
- Zhou, J.X.; Wang, X.L.; Xu, D.L.; Steve, B. Nonlinear dynamic characteristics of a quasi-zero stiffness vibration isolator with cam-roller-spring mechanisms. J. Sound Vib. 2015, 346, 53–69. [Google Scholar] [CrossRef]
- Liu, X.T.; Huang, X.C.; Hua, H.X. On the characteristics of a quasi-zero stiffness isolator using Euler buckled beam as negative stiffness corrector. J. Sound Vib. 2013, 332, 3359–3376. [Google Scholar] [CrossRef]
- Yu, C.Y.; Fu, Q.D.; Zhang, J.R.; Zhang, N. The vibration isolation characteristics of torsion bar spring with negative stiffness structure. Mech. Syst. Signal Process. 2022, 180, 109378. [Google Scholar] [CrossRef]
- Sun, X.T.; Wang, F.; Xu, J. Analysis, design and experiment of continuous isolation structure with local quasi-zero-stiffness property by magnetic interaction. Int. J. Non-Linear Mech. 2019, 116, 289–301. [Google Scholar] [CrossRef]
- Ding, B.X.; Li, X.; Li, Y.M. Configuration design and experimental verification of a variable constant-force compliant mechanism. Robotica 2022, 40, 3463–3475. [Google Scholar] [CrossRef]
- Lu, R.B.H.Z.Q.; Ding, H.; Chen, L.Q. A nonlinear vibration isolator supported on a flexible plate: Analysis and experiment. Nonlinear Dyn. 2022, 108, 941–958. [Google Scholar]
- Carrella, A.; Brennan, M.J.; Waters, T.P.; Lopes, V., Jr. Force and displacement transmissibility of a nonlinear isolator with high-static-low-dynamic-stiffness. Int. J. Mech. Sci. 2012, 55, 22–29. [Google Scholar] [CrossRef]
- Yang, T.; Cao, Q.J.; Hao, Z.F. A novel nonlinear mechanical oscillator and its application in vibration isolation and energy harvesting. Mech. Syst. Signal Process. 2021, 155, 107636. [Google Scholar] [CrossRef]
- Ding, H.; Ji, J.C.; Chen, L.Q. Nonlinear vibration isolation for fluid-conveying pipes using quasi-zero stiffness characteristics. Mech. Syst. Signal Process. 2019, 121, 675–688. [Google Scholar] [CrossRef]
- Palomares, E.; Morales, A.L.; Nieto, A.J.; Chicharro, J.M.; Pintado, P. Improvement of comfort in suspension seats with a pneumatic negative stiffness system. Actuators 2020, 9, 126. [Google Scholar] [CrossRef]
- Yan, B.; Yu, N.; Wu, C.Y. A state-of-the-art review on low-frequency nonlinear vibration isolation with electromagnetic mechanisms. Appl. Math. Mech.-Engl. Ed. 2022, 43, 1045–1062. [Google Scholar] [CrossRef]
- Xiong, Y.H.; Li, F.M.; Wang, Y. A nonlinear quasi-zero-stiffness vibration isolation system with additional X-shaped structure: Theory and experiment. Mech. Syst. Signal Process. 2022, 177, 109208. [Google Scholar] [CrossRef]
- Sun, X.T.; Jing, X.J.; Xu, J.; Cheng, L. Vibration isolation via a scissor-like structured platform. J. Sound Vib. 2014, 333, 2404–2420. [Google Scholar] [CrossRef]
- Mao, X.Y.; Yin, M.M.; Ding, H.; GENG, X.F.; Shen, Y.J.; Chen, L.Q. Modeling, analysis, and simulation of X-shape quasi-zero-stiffness-roller vibration isolators. Appl. Math. Mech. Engl. Ed. 2022, 43, 1027–1044. [Google Scholar] [CrossRef]
- Wang, Y.; Jing, X.J. Nonlinear stiffness and dynamical response characteristics of an asymmetric X-shaped structure. Mech. Syst. Signal Process. 2019, 125, 142–169. [Google Scholar] [CrossRef]
- Shi, X.J.; Chen, T.K.; Zhang, J.H.; Su, B.; Cong, Q.; Tian, W.J. A review of bioinspired vibration control technology. Appl. Sci. 2021, 11, 10584. [Google Scholar] [CrossRef]
- Li, J.Q.; Chen, Y.; Feng, X.D.; Feng, J.; Sareh, P. Computational modeling and energy absorption behavior of thin-walled tubes with the Kresling origami pattern. J. Int. Assoc. Shell Spat. Struct. 2021, 62, 71–81. [Google Scholar] [CrossRef]
- Xiang, X.M.; Lu, G.; You, Z. Energy absorption of origami inspired structures and materials. Thin-Walled Struct. 2020, 157, 107130. [Google Scholar] [CrossRef]
- Chen, Y.; Lu, C.H.; Yan, J.Y.; Feng, J.; Sareh, P. Intelligent computational design of scalene-faceted flat-foldable tessellations. J. Comput. Des. Eng. 2022, 9, 1765–1774. [Google Scholar] [CrossRef]
- Jalali, E.; Soltanizadeh, H.; Chen, Y.; Xie, Y.M.; Sareh, P. Selective hinge removal strategy for architecting hierarchical auxetic metamaterials. Commun. Mater. 2022, 3, 97. [Google Scholar] [CrossRef]
- Ji, J.C.; Luo, Q.T.; Ye, K. Vibration control based metamaterials and origami structures: A state-of-the-art review. Mech. Syst. Signal Process. 2021, 161, 107945. [Google Scholar] [CrossRef]
- Lu, Z.Q.; Zhao, L.; Ding, H.; Chen, L.Q. A dual-functional metamaterial for integrated vibration isolation and energy harvesting. J. Sound Vib. 2021, 509, 116251. [Google Scholar] [CrossRef]
- Rifaie, M.A.; Abdulhadi, H.; Mian, A. Advances in mechanical metamaterials for vibration isolation: A review. Adv. Mech. Eng. 2022, 14, 16878132221082872. [Google Scholar] [CrossRef]
- Schenk, M.; Guest, S.D.; Herder, J.L. Zero stiffness tensegrity structures. Int. J. Solids Struct. 2007, 44, 6569–6583. [Google Scholar] [CrossRef] [Green Version]
- Zhang, P.; Fan, W.Y.; Chen, Y.; Feng, J.; Sareh, P. Structural symmetry recognition in planar structures using convolutional neural networks. Eng. Struct. 2022, 260, 114227. [Google Scholar] [CrossRef]
- Ding, B.X.; Zhao, J.Y.; Li, Y.M. Design of a spatial constant-force end-effector for polishing/deburring operations. Int. J. Adv. Manuf. Technol. 2021, 116, 3507–3515. [Google Scholar] [CrossRef]
- Li, Z.X.; Cao, Q.J.; Wiercigroch, M.; Leger, A. Analysis of the periodic solutions of a smooth and discontinuous oscillator. Acta. Mech. Sin. 2013, 29, 575–582. [Google Scholar] [CrossRef]
- Zhong, R.; Chen, J.E.; Ge, W.M.; Liu, J.; Wang, X.F. Vibration absorption efficiency and higher branches elimination of variable-stiffness nonlinear energy sink. J. Harbin Inst. Technol. 2020, 27, 76–84. [Google Scholar]
- Chen, J.E.; Sun, M.; Hu, W.H.; Zhang, J.H.; Wei, Z.C. Performance of non-smooth nonlinear energy sink with descending stiffness. Nonlinear Dyn. 2020, 100, 255–267. [Google Scholar] [CrossRef]
- Kerschen, G.; Kowtko, J.J.; McFarland, D.M.; Bergman, L.A.; Vakakis, A.F. Theoretical and experimental study of multimodal targeted energy transfer in a system of coupled oscillators. Nonlinear Dyn. 2007, 47, 285–309. [Google Scholar] [CrossRef] [Green Version]
- Chen, J.E.; He, W.; Zhang, W.; Yao, M.H.; Liu, J.; Sun, M. Vibration suppression and higher branch responses of beam with parallel nonlinear energy sinks. Nonlinear Dyn. 2018, 91, 885–904. [Google Scholar] [CrossRef]
- Gourc, E.; Michon, G.; Seguy, S.; Berlioz, A. Experimental investigation and design optimization of targeted energy transfer under periodic forcing. J. Vib. Acoust. 2014, 136, 021021. [Google Scholar] [CrossRef]
- Li, X.; Ding, H.; Chen, L.Q. Effects of weights on vibration suppression via a nonlinear energy sink under vertical stochastic excitations. Mech. Syst. Signal Process. 2022, 173, 109073. [Google Scholar] [CrossRef]


Disclaimer/Publisher’s Note: The statements, opinions and data contained in all publications are solely those of the individual author(s) and contributor(s) and not of MDPI and/or the editor(s). MDPI and/or the editor(s) disclaim responsibility for any injury to people or property resulting from any ideas, methods, instructions or products referred to in the content. |
© 2023 by the authors. Licensee MDPI, Basel, Switzerland. This article is an open access article distributed under the terms and conditions of the Creative Commons Attribution (CC BY) license (https://creativecommons.org/licenses/by/4.0/).
Share and Cite
Xu, L.; Dai, K.; Hao, H.; Zeng, H.; Chen, J. Effective Frequency Range and Jump Behavior of Horizontal Quasi-Zero Stiffness Isolator. Appl. Sci. 2023, 13, 1795. https://doi.org/10.3390/app13031795
Xu L, Dai K, Hao H, Zeng H, Chen J. Effective Frequency Range and Jump Behavior of Horizontal Quasi-Zero Stiffness Isolator. Applied Sciences. 2023; 13(3):1795. https://doi.org/10.3390/app13031795
Chicago/Turabian StyleXu, Lixin, Kaili Dai, Hongyu Hao, Huizhou Zeng, and Jianen Chen. 2023. "Effective Frequency Range and Jump Behavior of Horizontal Quasi-Zero Stiffness Isolator" Applied Sciences 13, no. 3: 1795. https://doi.org/10.3390/app13031795