Abstract
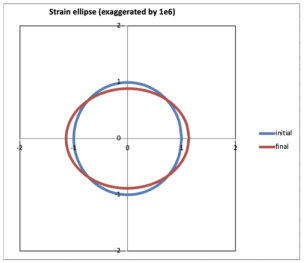
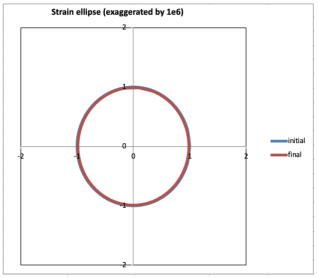
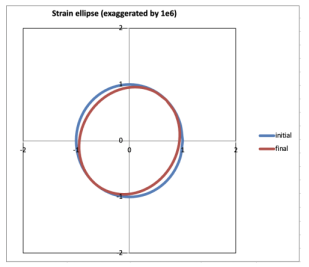
After the Gyeongju earthquake in 2016 and the subsequent one in Pohang the following year, there is an imminent necessity to evaluate the risk of earthquakes accurately as well as respond to the risks on the Korean peninsula. For this purpose, the existence and movement of a fault should be investigated in the area. In this study, we calculated the displacement of the crust around the mass production fault using GNSS (Global Navigation Satellite System) data and analyzed the deformation characteristics by applying the method of stress calculation. The Yangsan Fault Zone has been analyzed with a total of 24 GNSS stations between 2018 and 2021. Data processing was conducted with Bernese GNSS Software, which requires high-precision orbit, satellite clock, ionosphere information for high-precision position estimation. By accumulating daily solutions over the three years to produce the final solution with the velocity of the stations, the Yangsan Fault Zone moved about 32 mm per year southeast on average. Based on the results, the movements of the stations on either side of the Faults are almost the same. Stress analysis of the Yangsan Fault Zone showed a large east–west expansion during 2018–2019 but decreased in stress afterwards, thus it is evaluated to be relatively stable compared to the past. However, due to the nature of crustal variation continuous monitoring research with long-term data processing should be followed, which will be discussed in further research.
1. Introduction
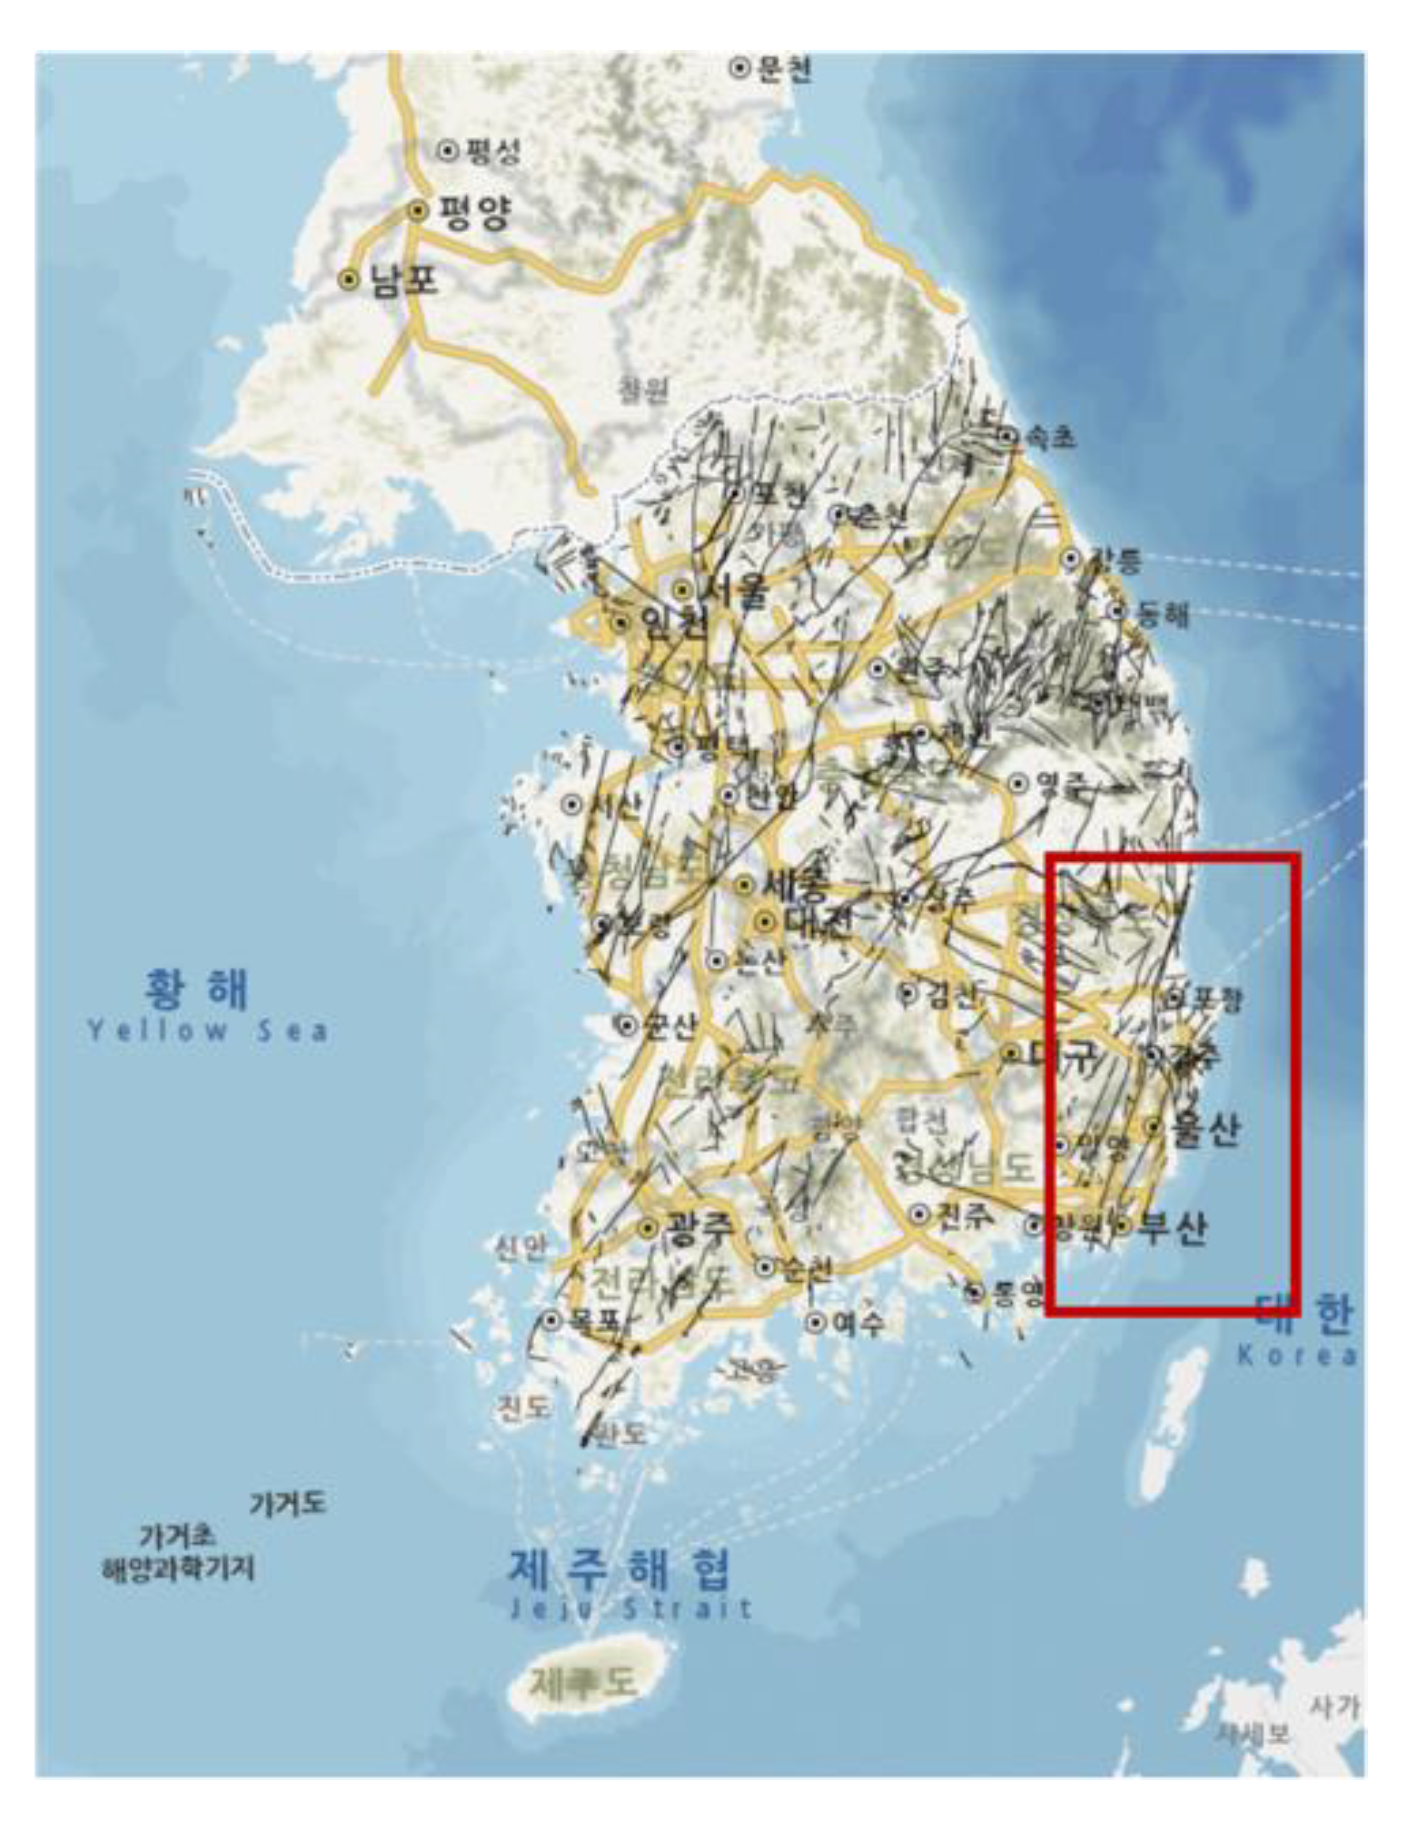
The Korean Peninsula is in the southeastern part of the Eurasian Plate that is hundreds of kilometers away from the plate boundary [1]. In this region, earthquakes have rarely exceeded magnitude 5.0 since the monitoring of instrument seismic earthquakes in 1978. Based on the historic records and instrumental earthquakes it shows that they were concentrated in the southeastern part of the Korean Peninsula [2,3,4]. In addition, it has been reported since the 1990s that the existence of the quaternary faults is suspected and might be active on the Korean Peninsula. The quaternary faults were found in the inland areas, such as Pohang, Gyeongju, and Ulsan, mostly located in the southeastern area [4]. Recently, in this area, the Gyeongju earthquake with a magnitude of 5.8 (a foreshock of 5.1) occurred on 12 September 2016 [5]. The seismic fault is known as the subsidiary fault in the NNE–SSW direction within the Yangsan Fault Zone [6]. Almost 14 months later (15 November 2017), a 5.4 magnitude earthquake occurred again in Pohang. Therefore, it is assumed that frequent earthquakes in that area are related to the activity of the Yangsan Fault Zone. It is a large-scale fault that develops about 170–200 km (Busan–Yangsan–Gyeongju–Pohang–Yeongdeok from south; see Figure 1).
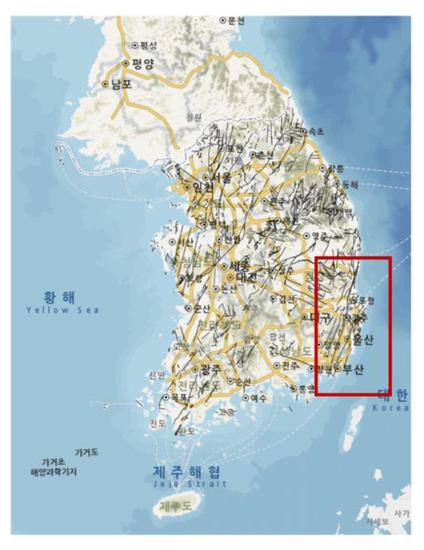
Figure 1.
Yangsan Fault Zone marked in the red box.
Most geological disasters, such as earthquakes and volcanoes, are caused by fault motion, and it is important to determine the exact distribution and kinetic characteristics of the fault, and its activity to forecast and identify geological disasters. The geodynamical processes are an important factor in analyzing and understanding the active tectonic deformation. Most of the prior research has steadily been conducted to analyze the movement and deformation of the crust through GPS [7,8,9,10,11]. Therefore, many countries around the world have established and been operating systems to precisely measure and monitor displacement of crustal deformation, which uses geophysical and geological methods and geodetic technologies. With recent developments in remote sensing technology, for example GPS (Global Positioning System) and InSAR (Interferometric Synthetic Aperture Radar), it has been widely used for linear structural analysis for tracking and investigation of active faults [12,13]. The GNSS is used as fundamental data for global scale tectonic movement and local deformations that are not detected by seismometers. In the case of the USGS (United States Geological Survey), GPS is used to monitor periodic earthquakes in the San Andreas Fault (in the vicinity of Parkfield). The seismic pattern, formed along the fault near Parkfield and Chollaim in California, showed a distinct change over 50 km, which was investigated to detect displacement by sampling 13 nearby GPS data (1 to 30 s intervals). This allows for the detection of large creep events outside the creepmeter range (10~30 mm) and/or large seismic displacements, the enhancement of existing measurements due to afterslip [14]. In Italy, GPS systems allow for the estimation of Castrovilari displacement from a series of GPS data obtained in networks across active faults, and studies have been conducted to forecast seismic magnitudes of active faults [15]. It is also possible to measure the displacement that may occur during an earthquake or volcanic eruption from the coordinates accurately calculated from the collected GNSS data. In addition, GNSS can be used to observe seismic deformation processes that have not released seismic energy yet, such as interseismic strain, movement of magma, afterslip, postseismic relaxation, and creep [16]. Immediately after a major earthquake, it is known that the stress around the epicenter is redistributed over the years (or even decades) after an immediate stress change occurs. Earthquakes generally causes a long-term post-seismic displacement after the co-seismic displacement. Thus, the Tohoku earthquake might have been affected by a prior earthquake and the accompanying post-seismic tectonic movements. Therefore, the analysis of the stress change acting on the crust after the earthquake makes it possible to forecast potential earthquakes by detecting the precursor phenomenon of earthquakes due to the stress change [17]. According to active fault studies [18], Korea also has about 50 active faults, and it was confirmed that there was a large-scale earthquake during the quaternary period. There is a possibility of a large earthquake in Korea, so preparation for this is necessary. Therefore, the movement direction of the active fault was analyzed in this paper using GNSS data near the Yangsan Fault Zone, and the strain rate was calculated to monitor the fault.
2. Materials
2.1. GNSS Data
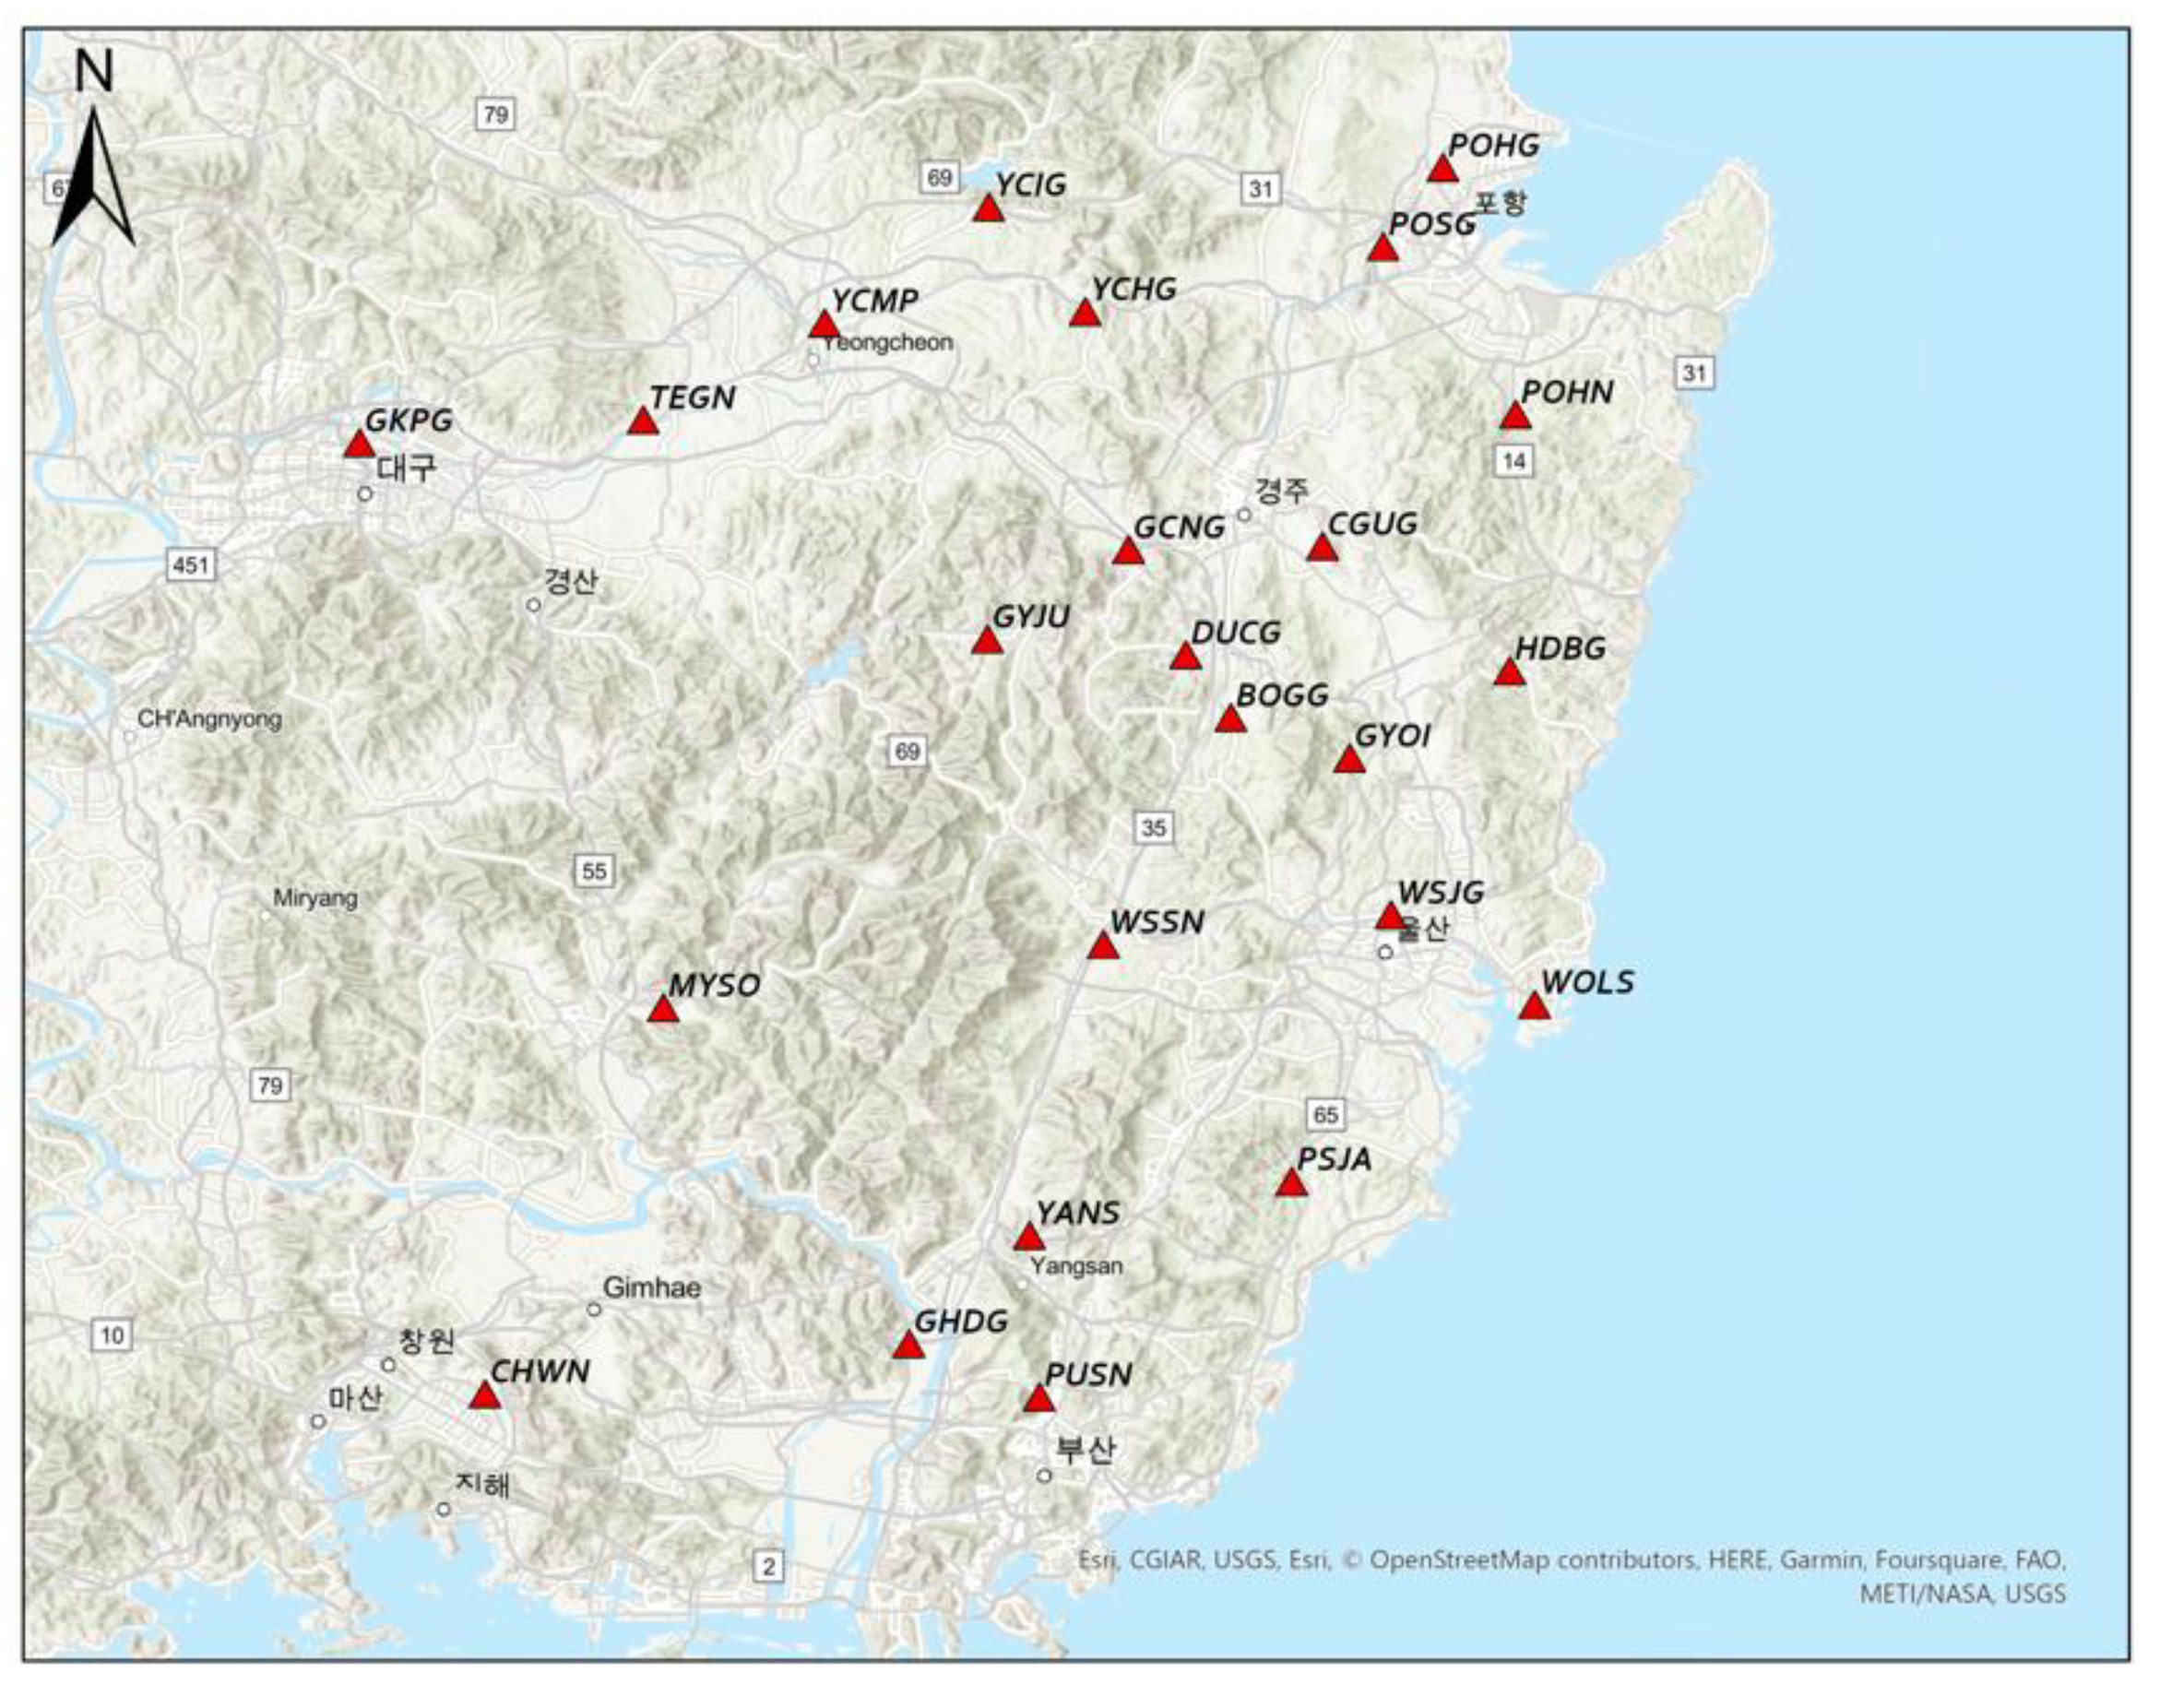
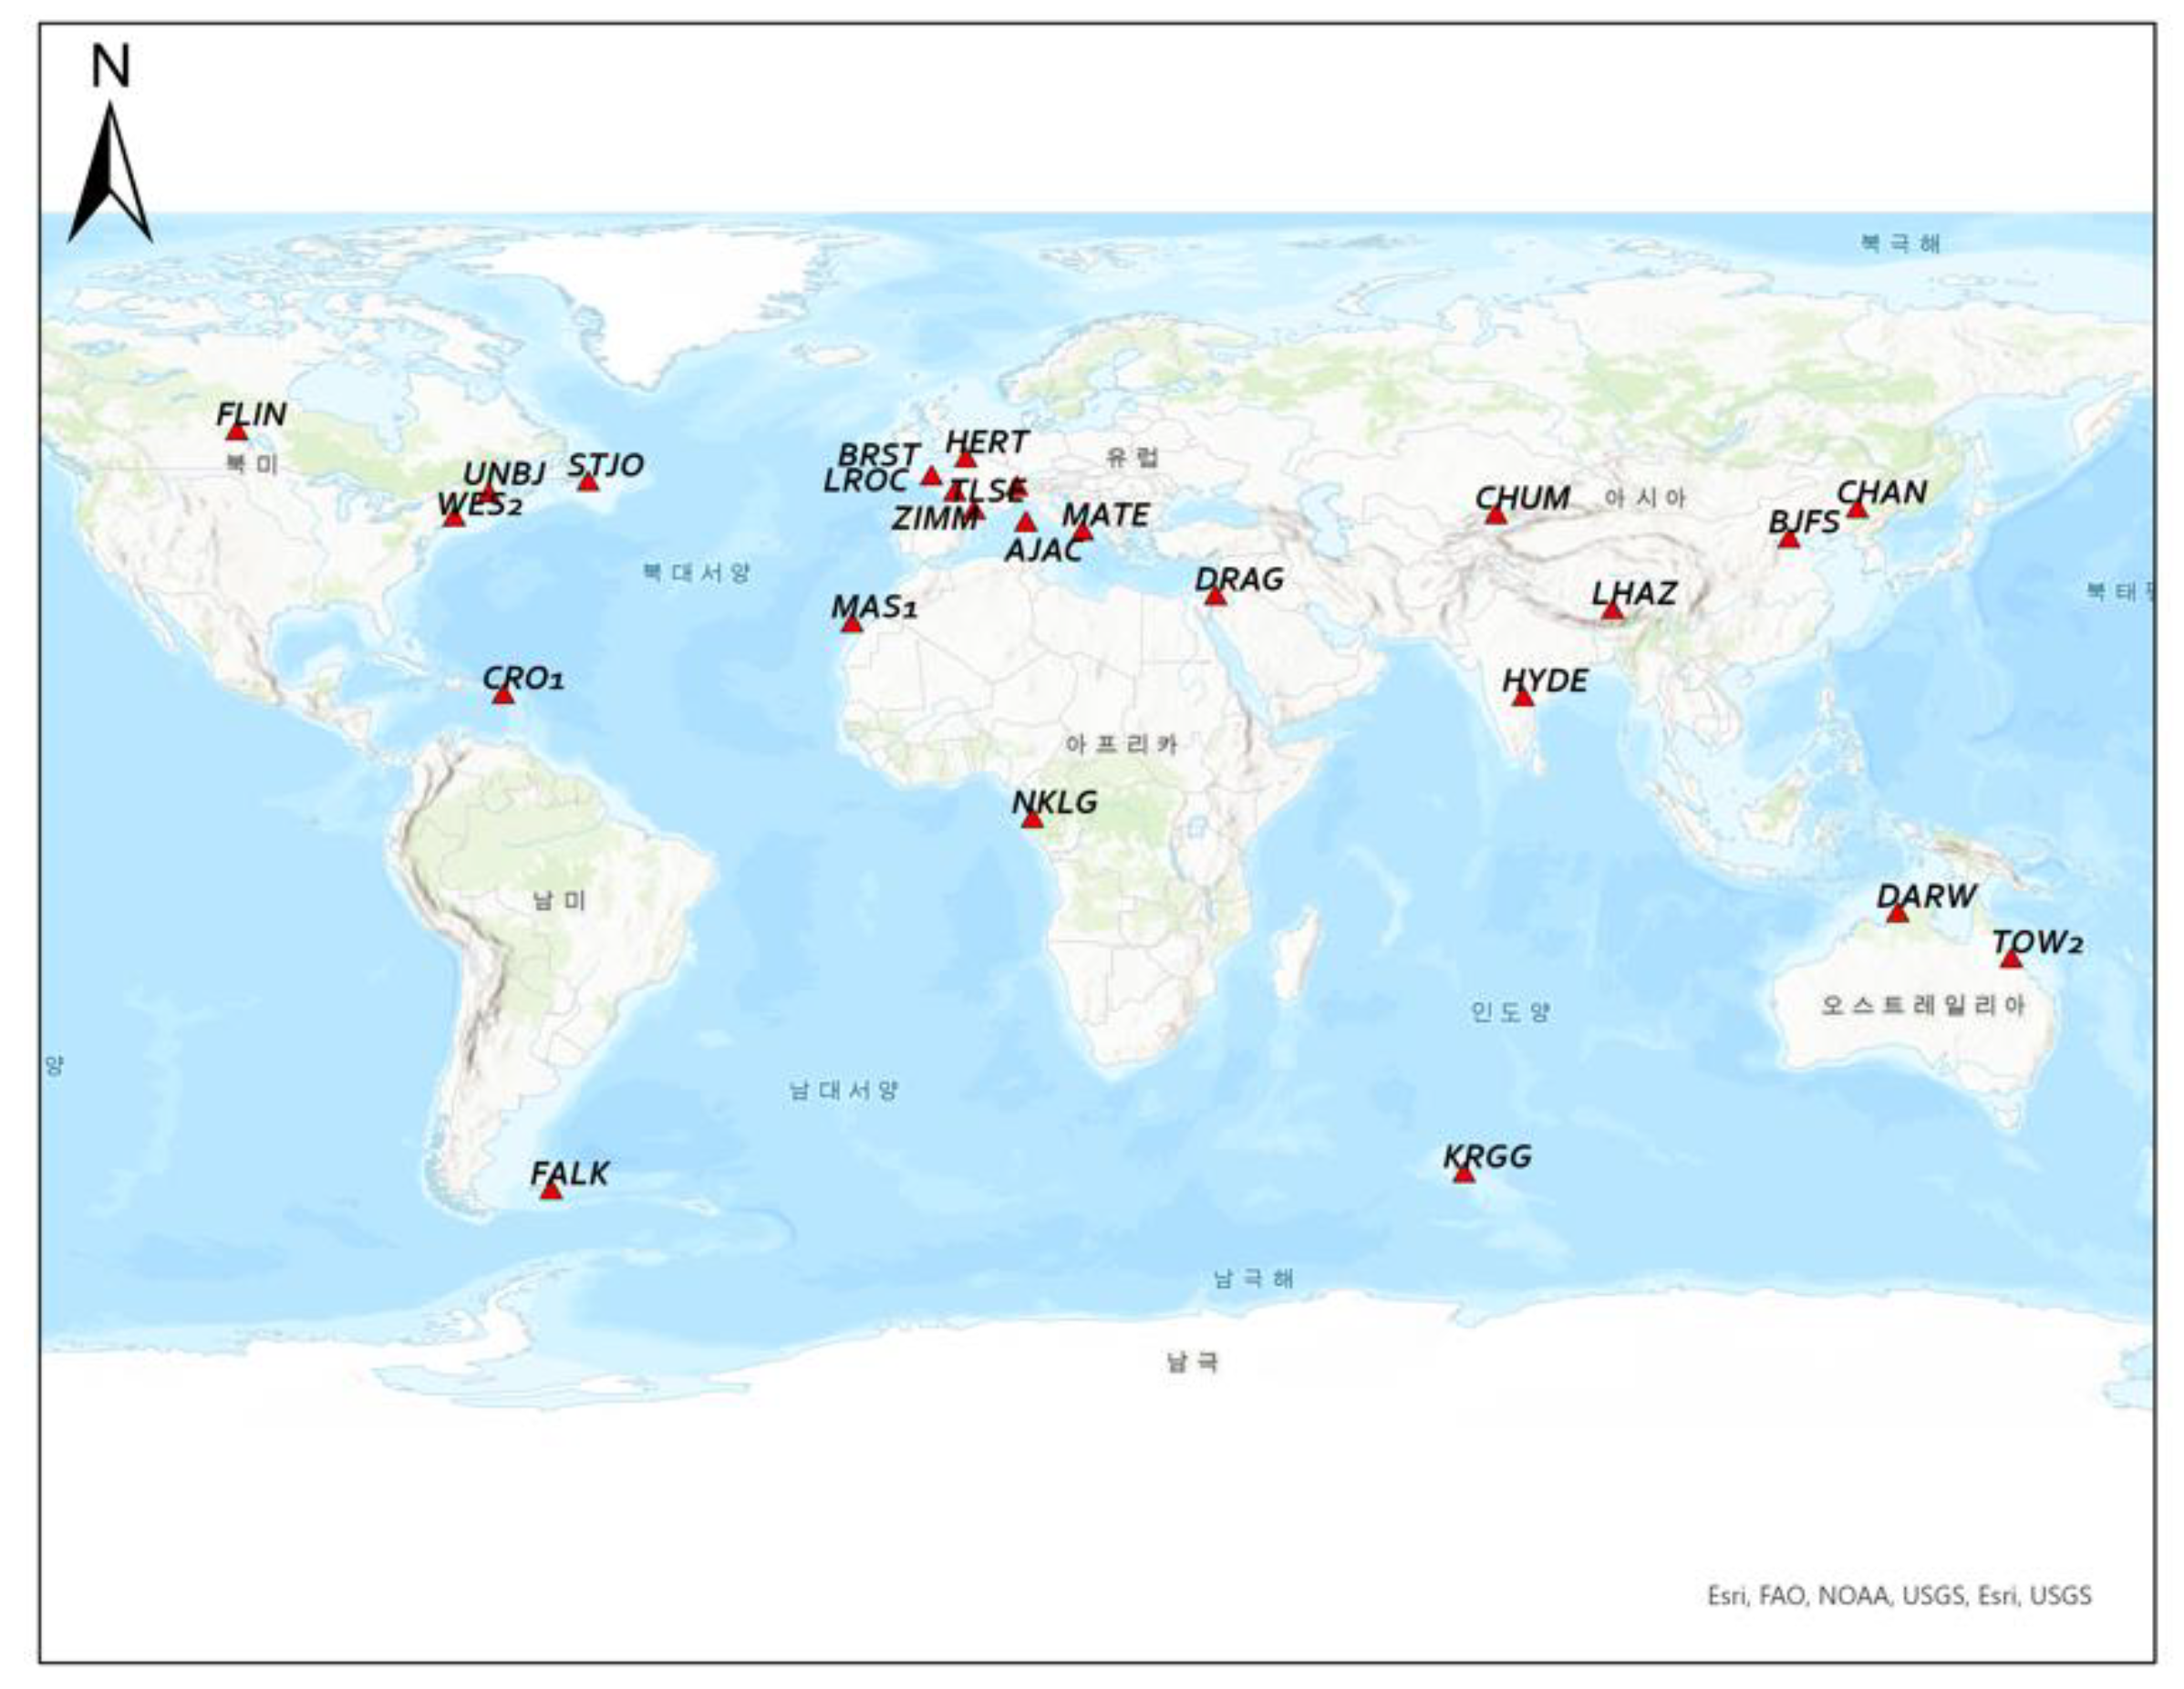
Table 1 shows the list of domestic GNSS stations used in this study for data, and a global network of IGS (International GNSS Service) stations is summarized in Table 2. The location maps of stations are plotted in Figure 2 and Figure 3 (domestic and IGS stations, respectively). A total of 24 domestic observation stations were collected from 17 July 2018, to 31 December 2021, which was obtained from the National Geographic Information Institute (NGII, 15 stations) and Korea Institute of Geoscience and Mineral Resources (KIGAM, 9 stations). In addition, the IGS stations were selected to be evenly spread all around the world (a total of 25 stations), which were used as a reference to be aligned with the global reference frame by minimally constraining to the known coordinates. The GNSS data are provided in a Receiver INdependent EXchange (RINEX) format for 24 h at 30-second intervals.

Table 1.
A list of domestic GNSS stations.

Table 2.
The list of IGS stations.
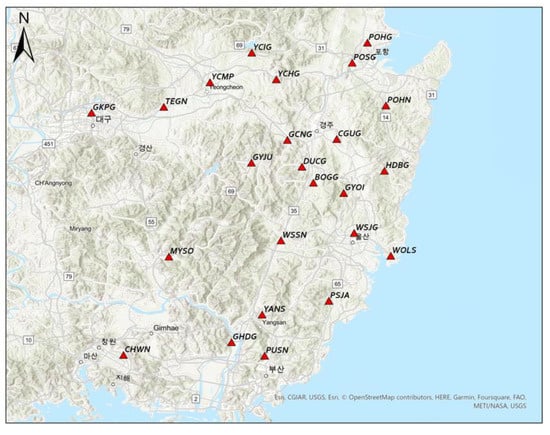
Figure 2.
The 24 domestic stations used in the paper. The area around the Yangsan Fault; 7 are operated by KIGAM and 15 are operated by NGII.
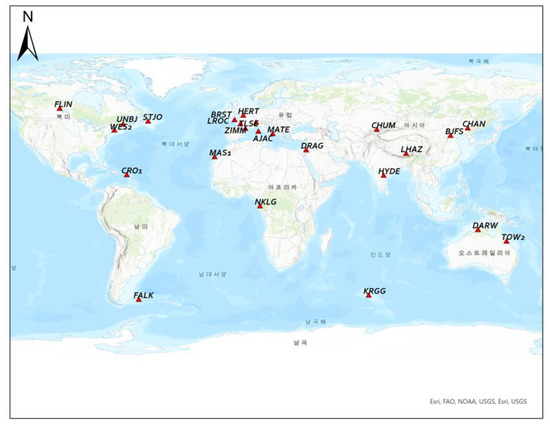
Figure 3.
The 25 geometrically distributed IGS stations used in the paper.
2.2. Data Processing Software
Precision baseline analysis is made up of a various combination of factors, such as satellite orbits, tropospheric and ionospheric delays, and strategies on resolving the unknown integer ambiguities, etc. Therefore, most advanced scientific software should be adopted for GNSS baseline results with high precision; for example, GAMIT of Massachusetts Institute of Technology (MIT), GIPSY-OASIS developed by NASA’s Jet Propulsion Laboratory (JPL), and Bernese GNSS Software developed by the Astronomical Laboratory of the University of Bern (AIUB), Switzerland. In this paper, data were processed using Bernese GNSS Software V5.2, which enables high-precision GNSS output. Bernese can accurately determine the ambiguity parameters for long-baseline (up to thousands of kilometers). In addition, Bernese Processing Engine (BPE) has been developed to automatically perform complex processes and large amounts of data. In this study, the optimally configured baselines were analyzed by connecting 24 domestic stations and 25 of IGS stations.
The resulting coordinates with millimeter level accuracy are essential to analyze the crustal movement using GNSS. For this end, various correction models should be used to minimize difference sources of errors in the observation data. Table 3 summarizes the important options used for the Bernese data processing. The raw measurements were obtained from one of the IGS analysis centers, the Center for Orbit Determination in Europe (CODE), and the Crustal Dynamics Data Information System (CDDIS). IGS products were used for the satellite’s orbital force and clock information, and the movement of the Earth’s rotation axis. The most accurate final orbit in SP3 format was used for better solution. The crust fluctuation is influenced by ocean loading, which should be accounted for to minimize the positioning errors. The FES2004 model, recommended by IGS, was used in this study.

Table 3.
Option of the Bernese Software V5.2.
3. Methodology
GNSS data processing is composed of both relative and absolute positioning. The precise point positioning (absolute positioning) is a method to determine the position of an observation point independently using direct signals from GNSS satellites, which is used for initial approximation of the receiver with an accuracy of several centimeters in this study. Relative positioning is a method of determining the coordinates of an unknown point with respect to the base, usually at millimeter-level accuracy. The time series analysis of the daily solution was performed through the baseline analysis. The normal equation generated because of the daily processing was accumulated to calculate the velocity of displacement over a specific period as well as the final solution.
The resulting daily three-dimensional Cartesian coordinates were converted into a local reference frame to break the coordinates down to north, east, and up components. We analyzed the results in three ways to figure out the movement of the Yangsan Fault Zone. First, the relative movement of the Yangsan Fault Zone was calculated based on the IGS stations to understand the global movement. The latest IGS14 was used for the reference coordinates and velocity information for the IGS stations. In the second method, baseline analysis was performed using the GKPG station located near the Yangsan Fault as a known point to confirm the distortion of the crust. Thus, all coordinates are calculated as a relative displacement with respect to GKPG in the Yangsan Fault based on.
Lastly, the pattern on the changes in principal strain and/or stress acting on the fault was investigated together, which was accomplished by the Matlab code provided by UNAVCO. Since the degrees of stress on the fault and crust are essential for fault monitoring, we analyzed the characteristics and changes of stress on the crust around the Yangsan Fault Zone in this study.
4. Results—Discussion
4.1. Time Series
4.1.1. Daily Solution
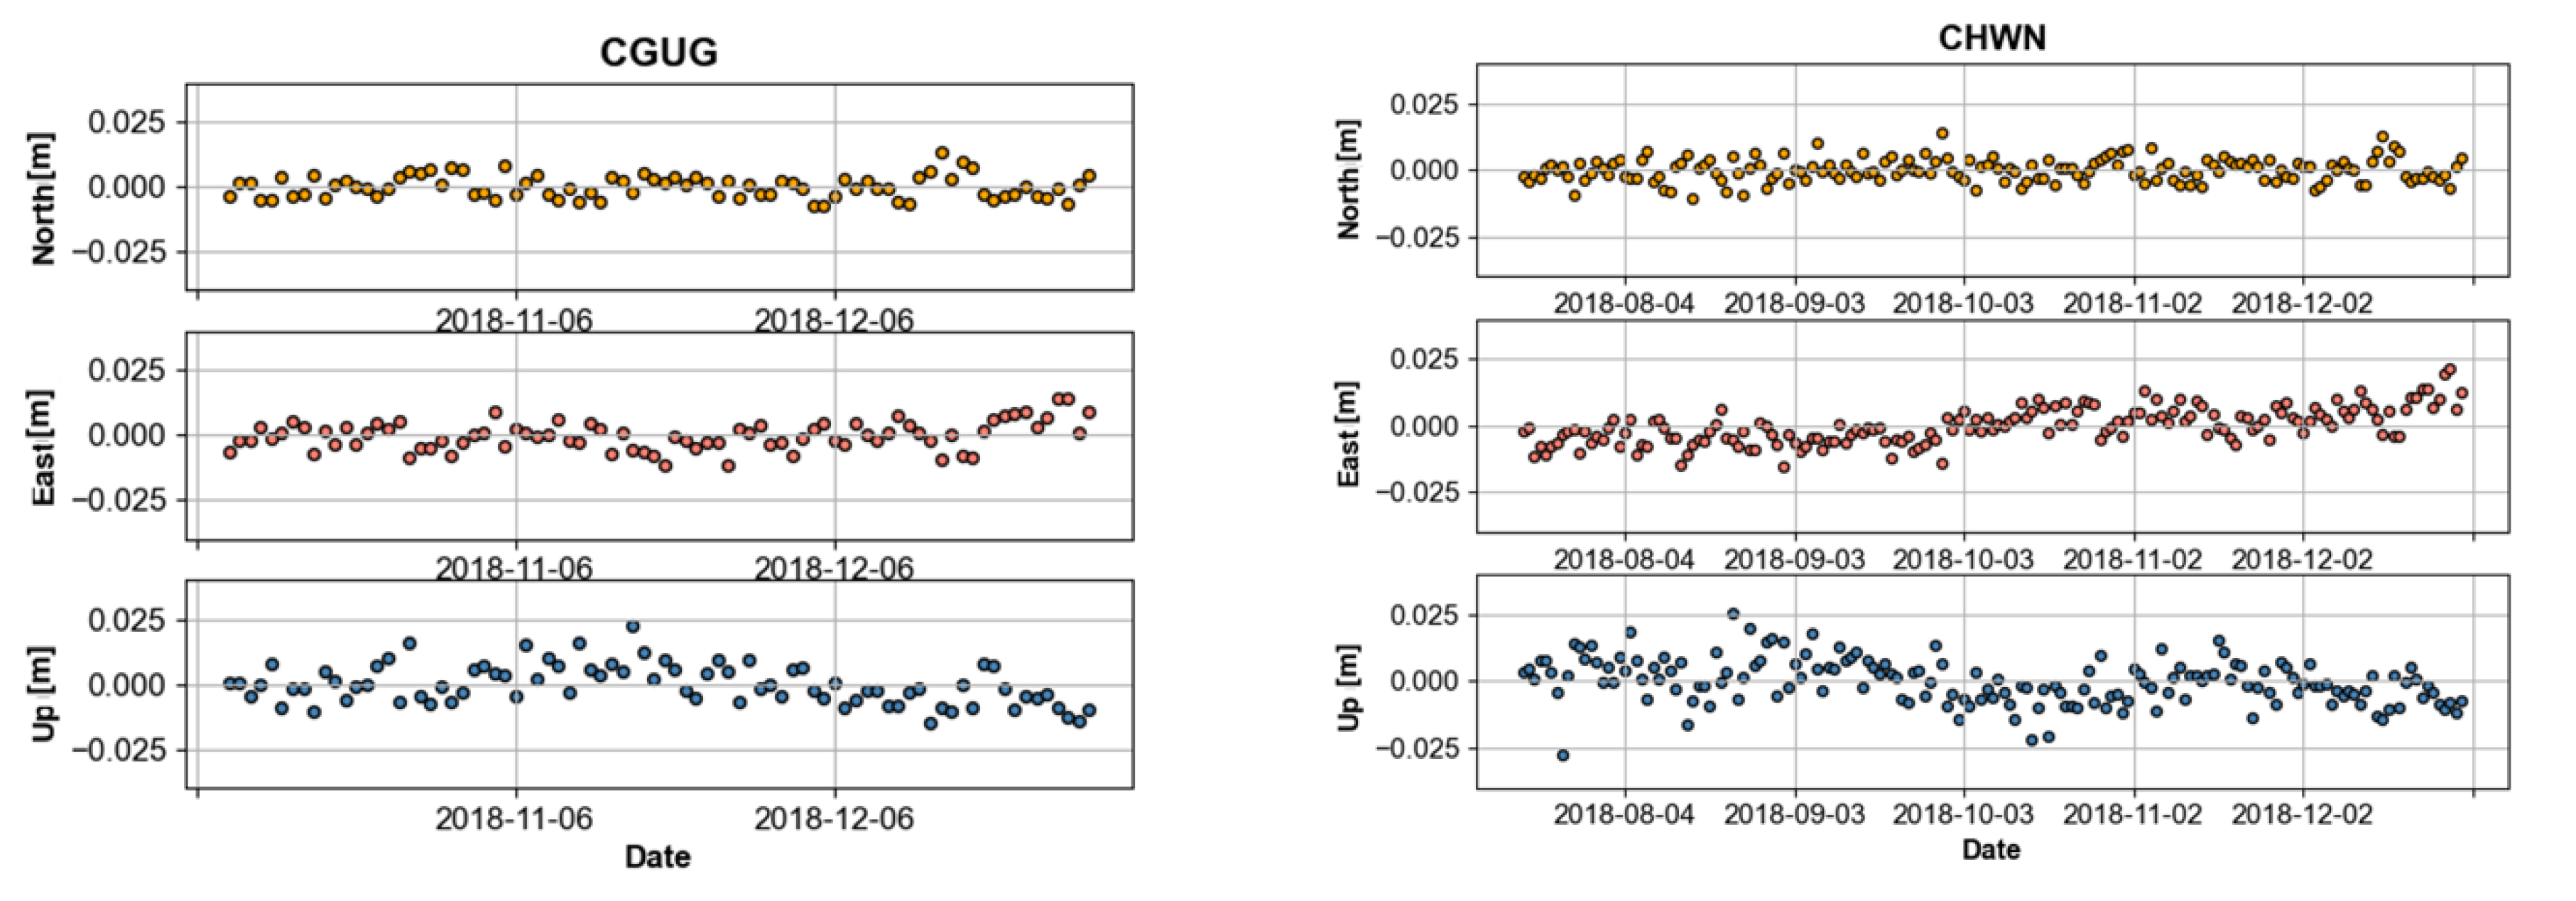
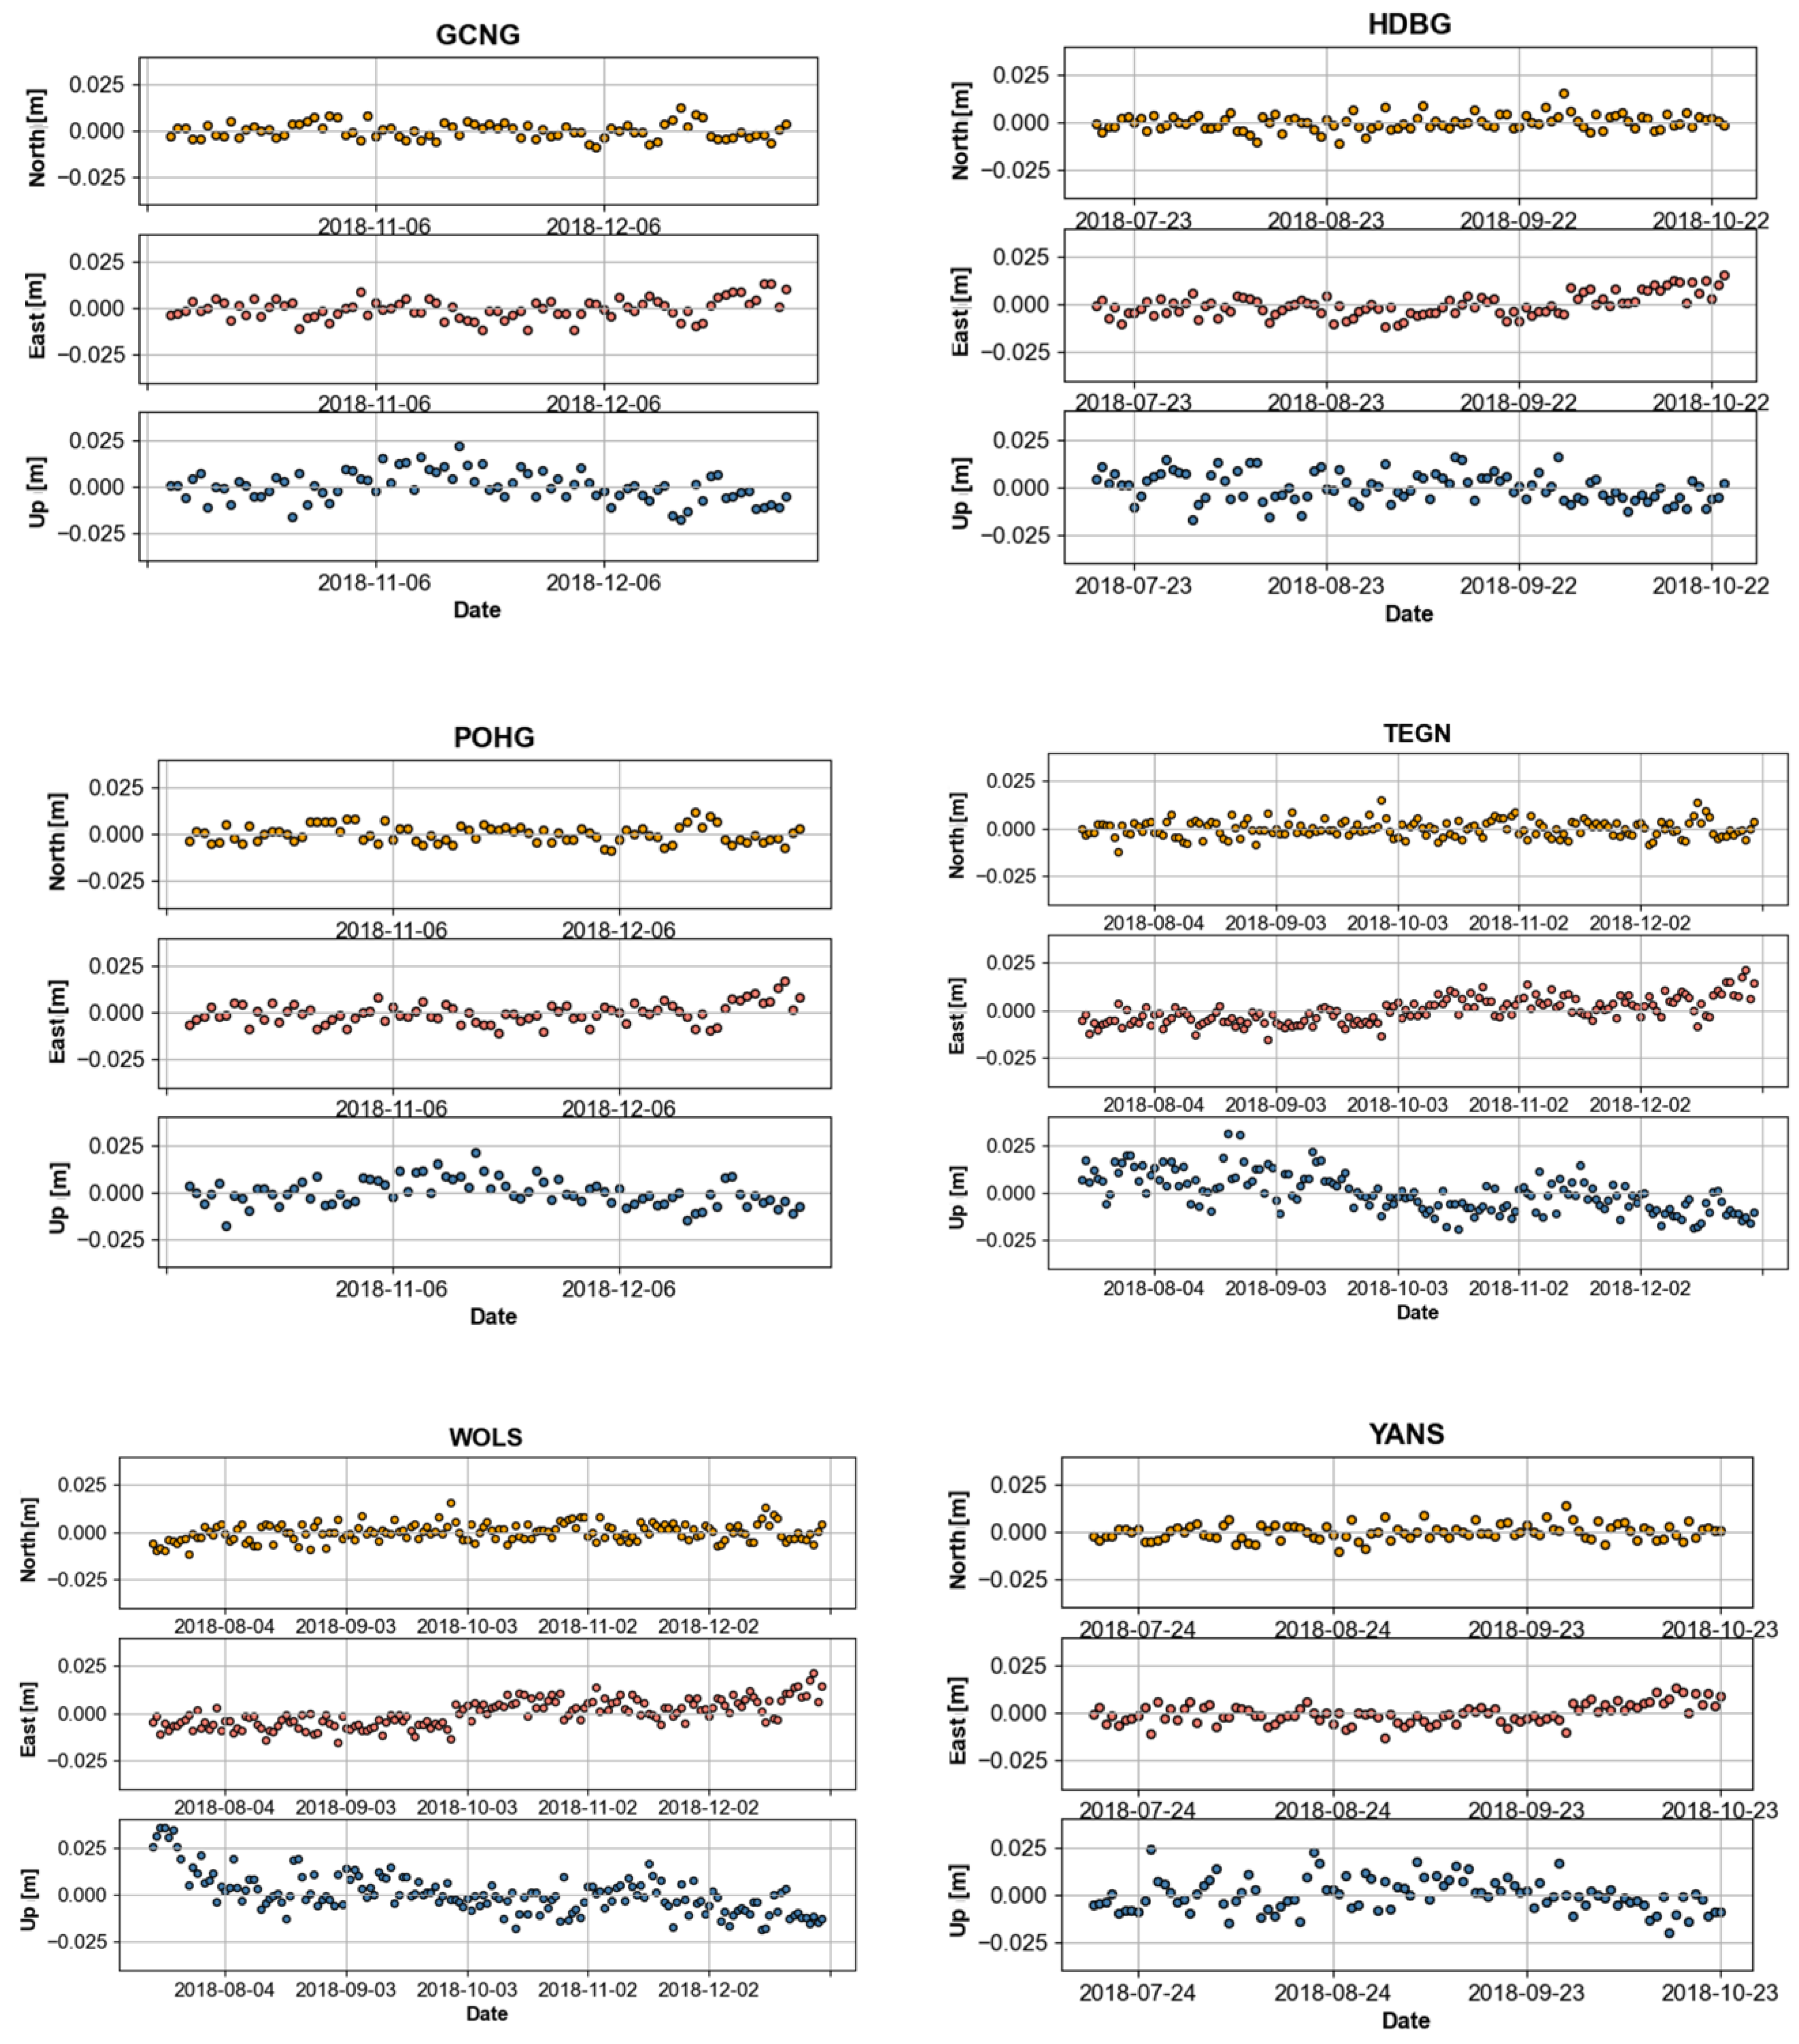
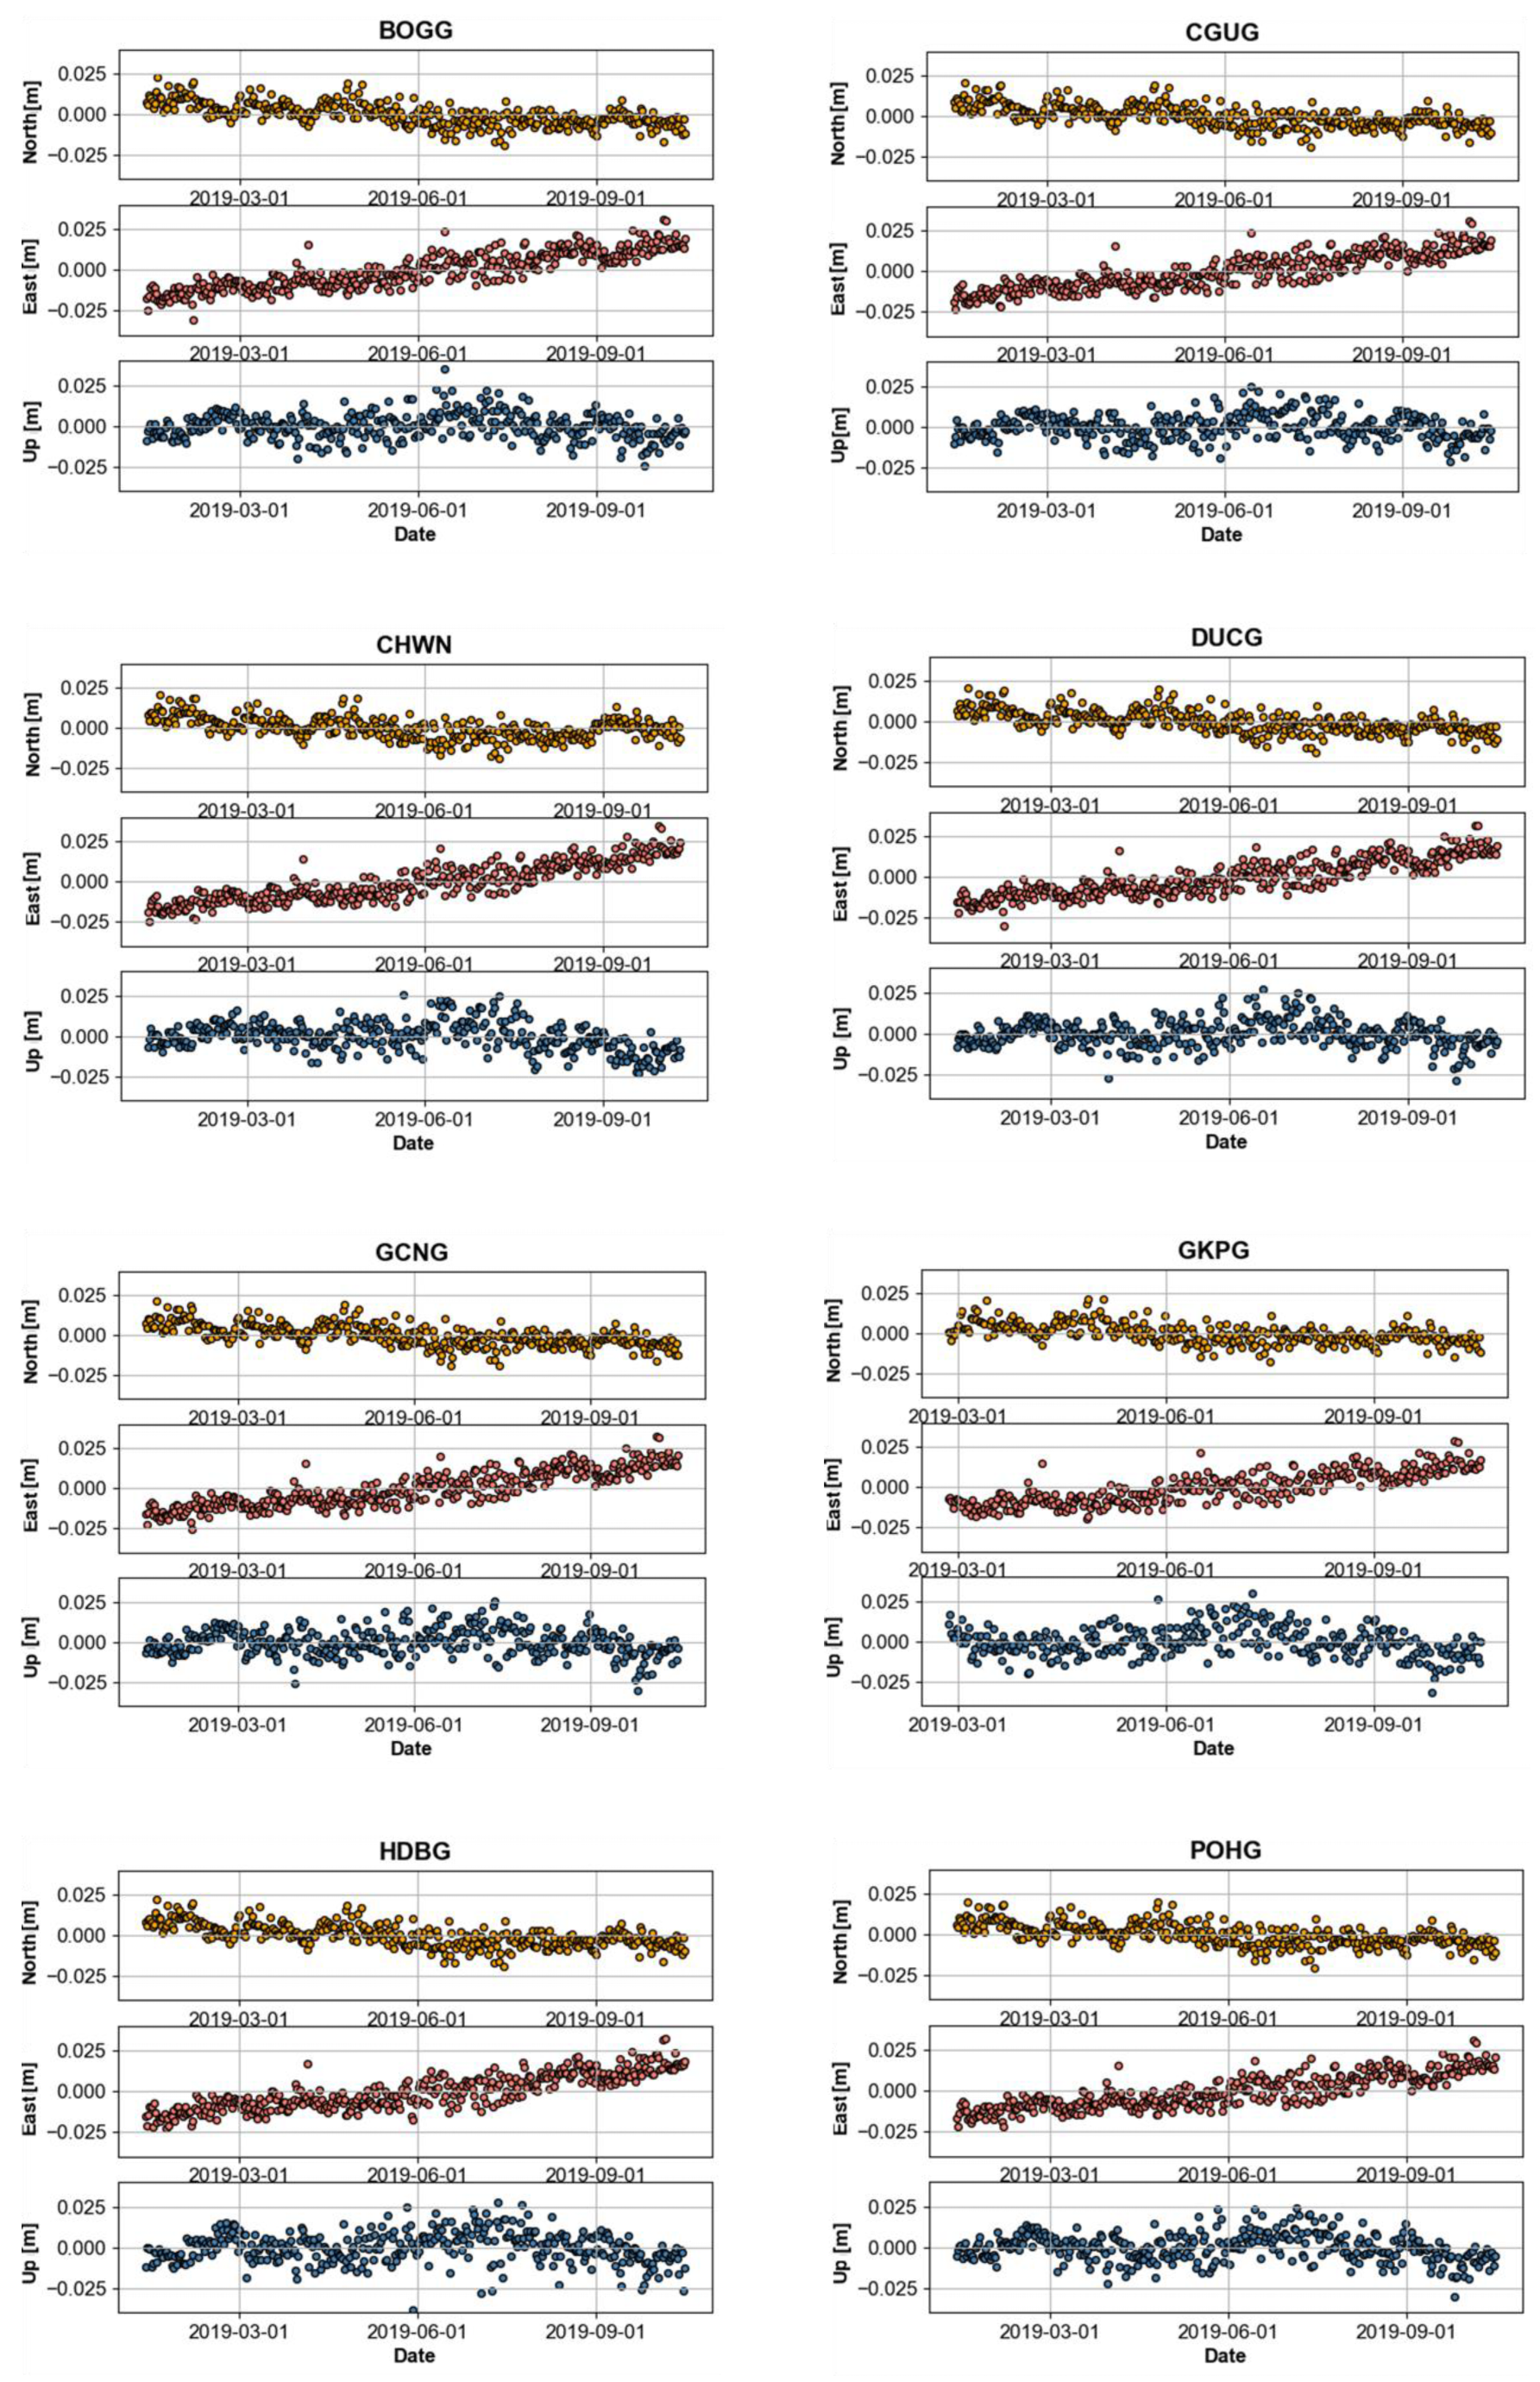
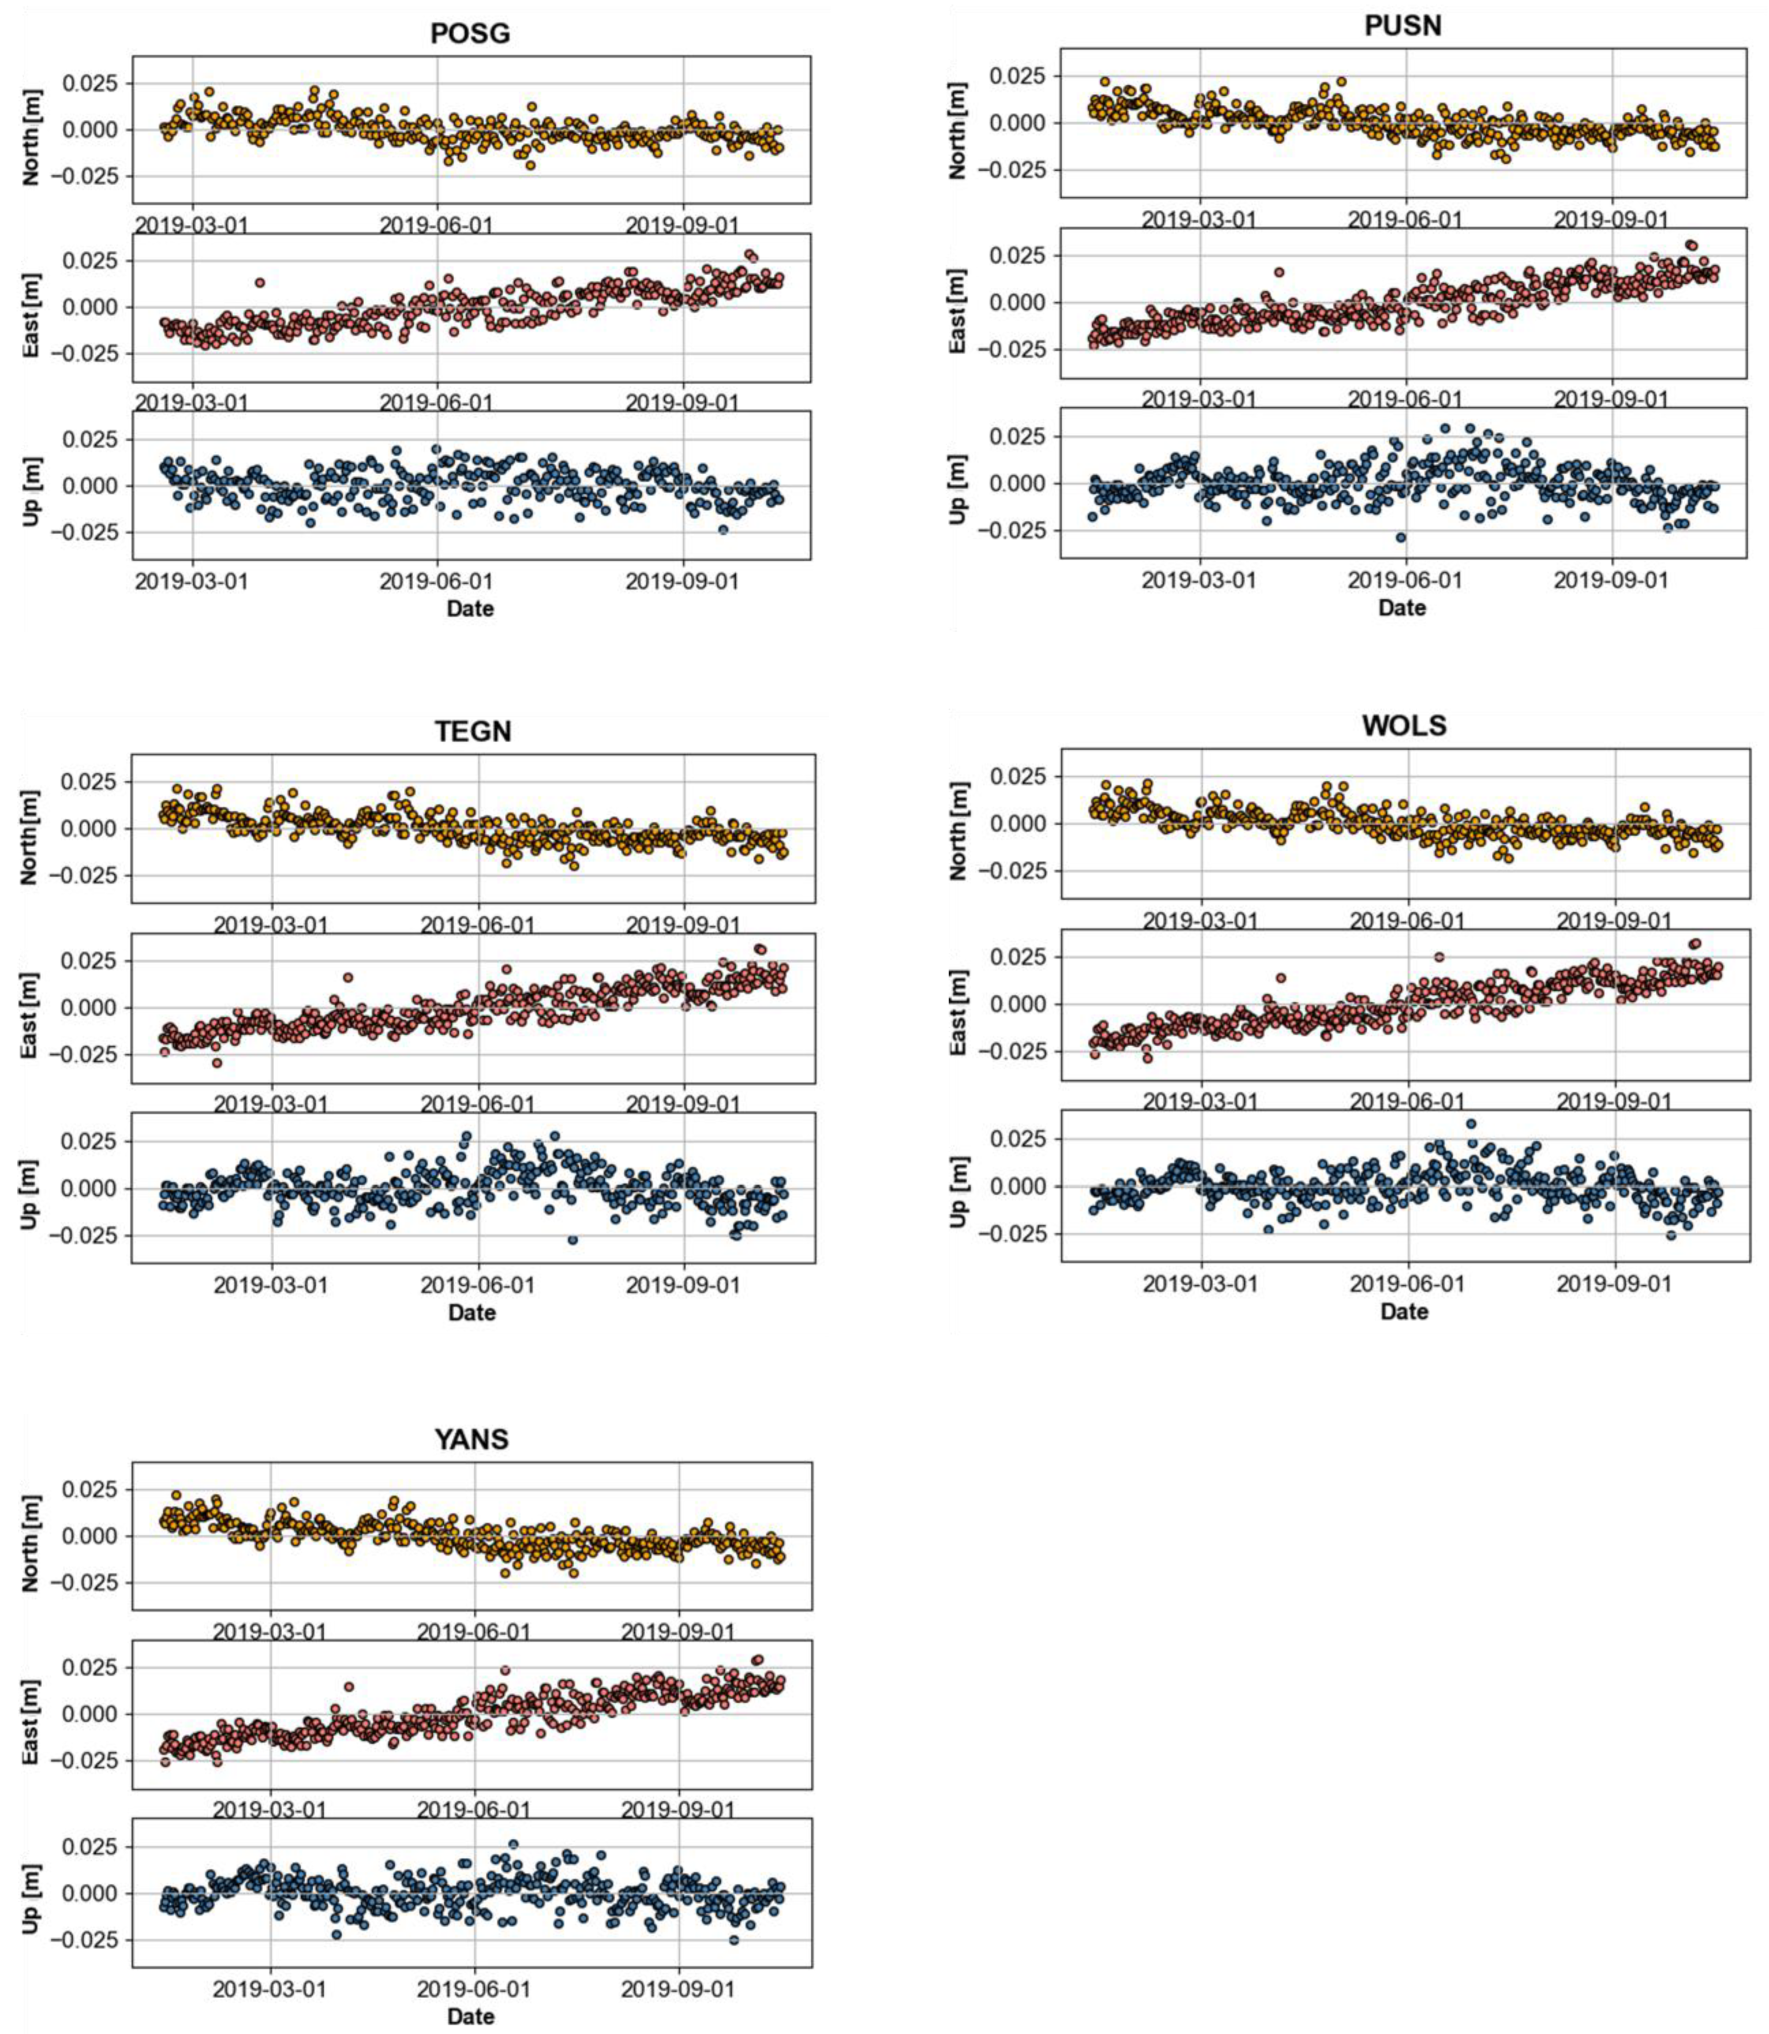
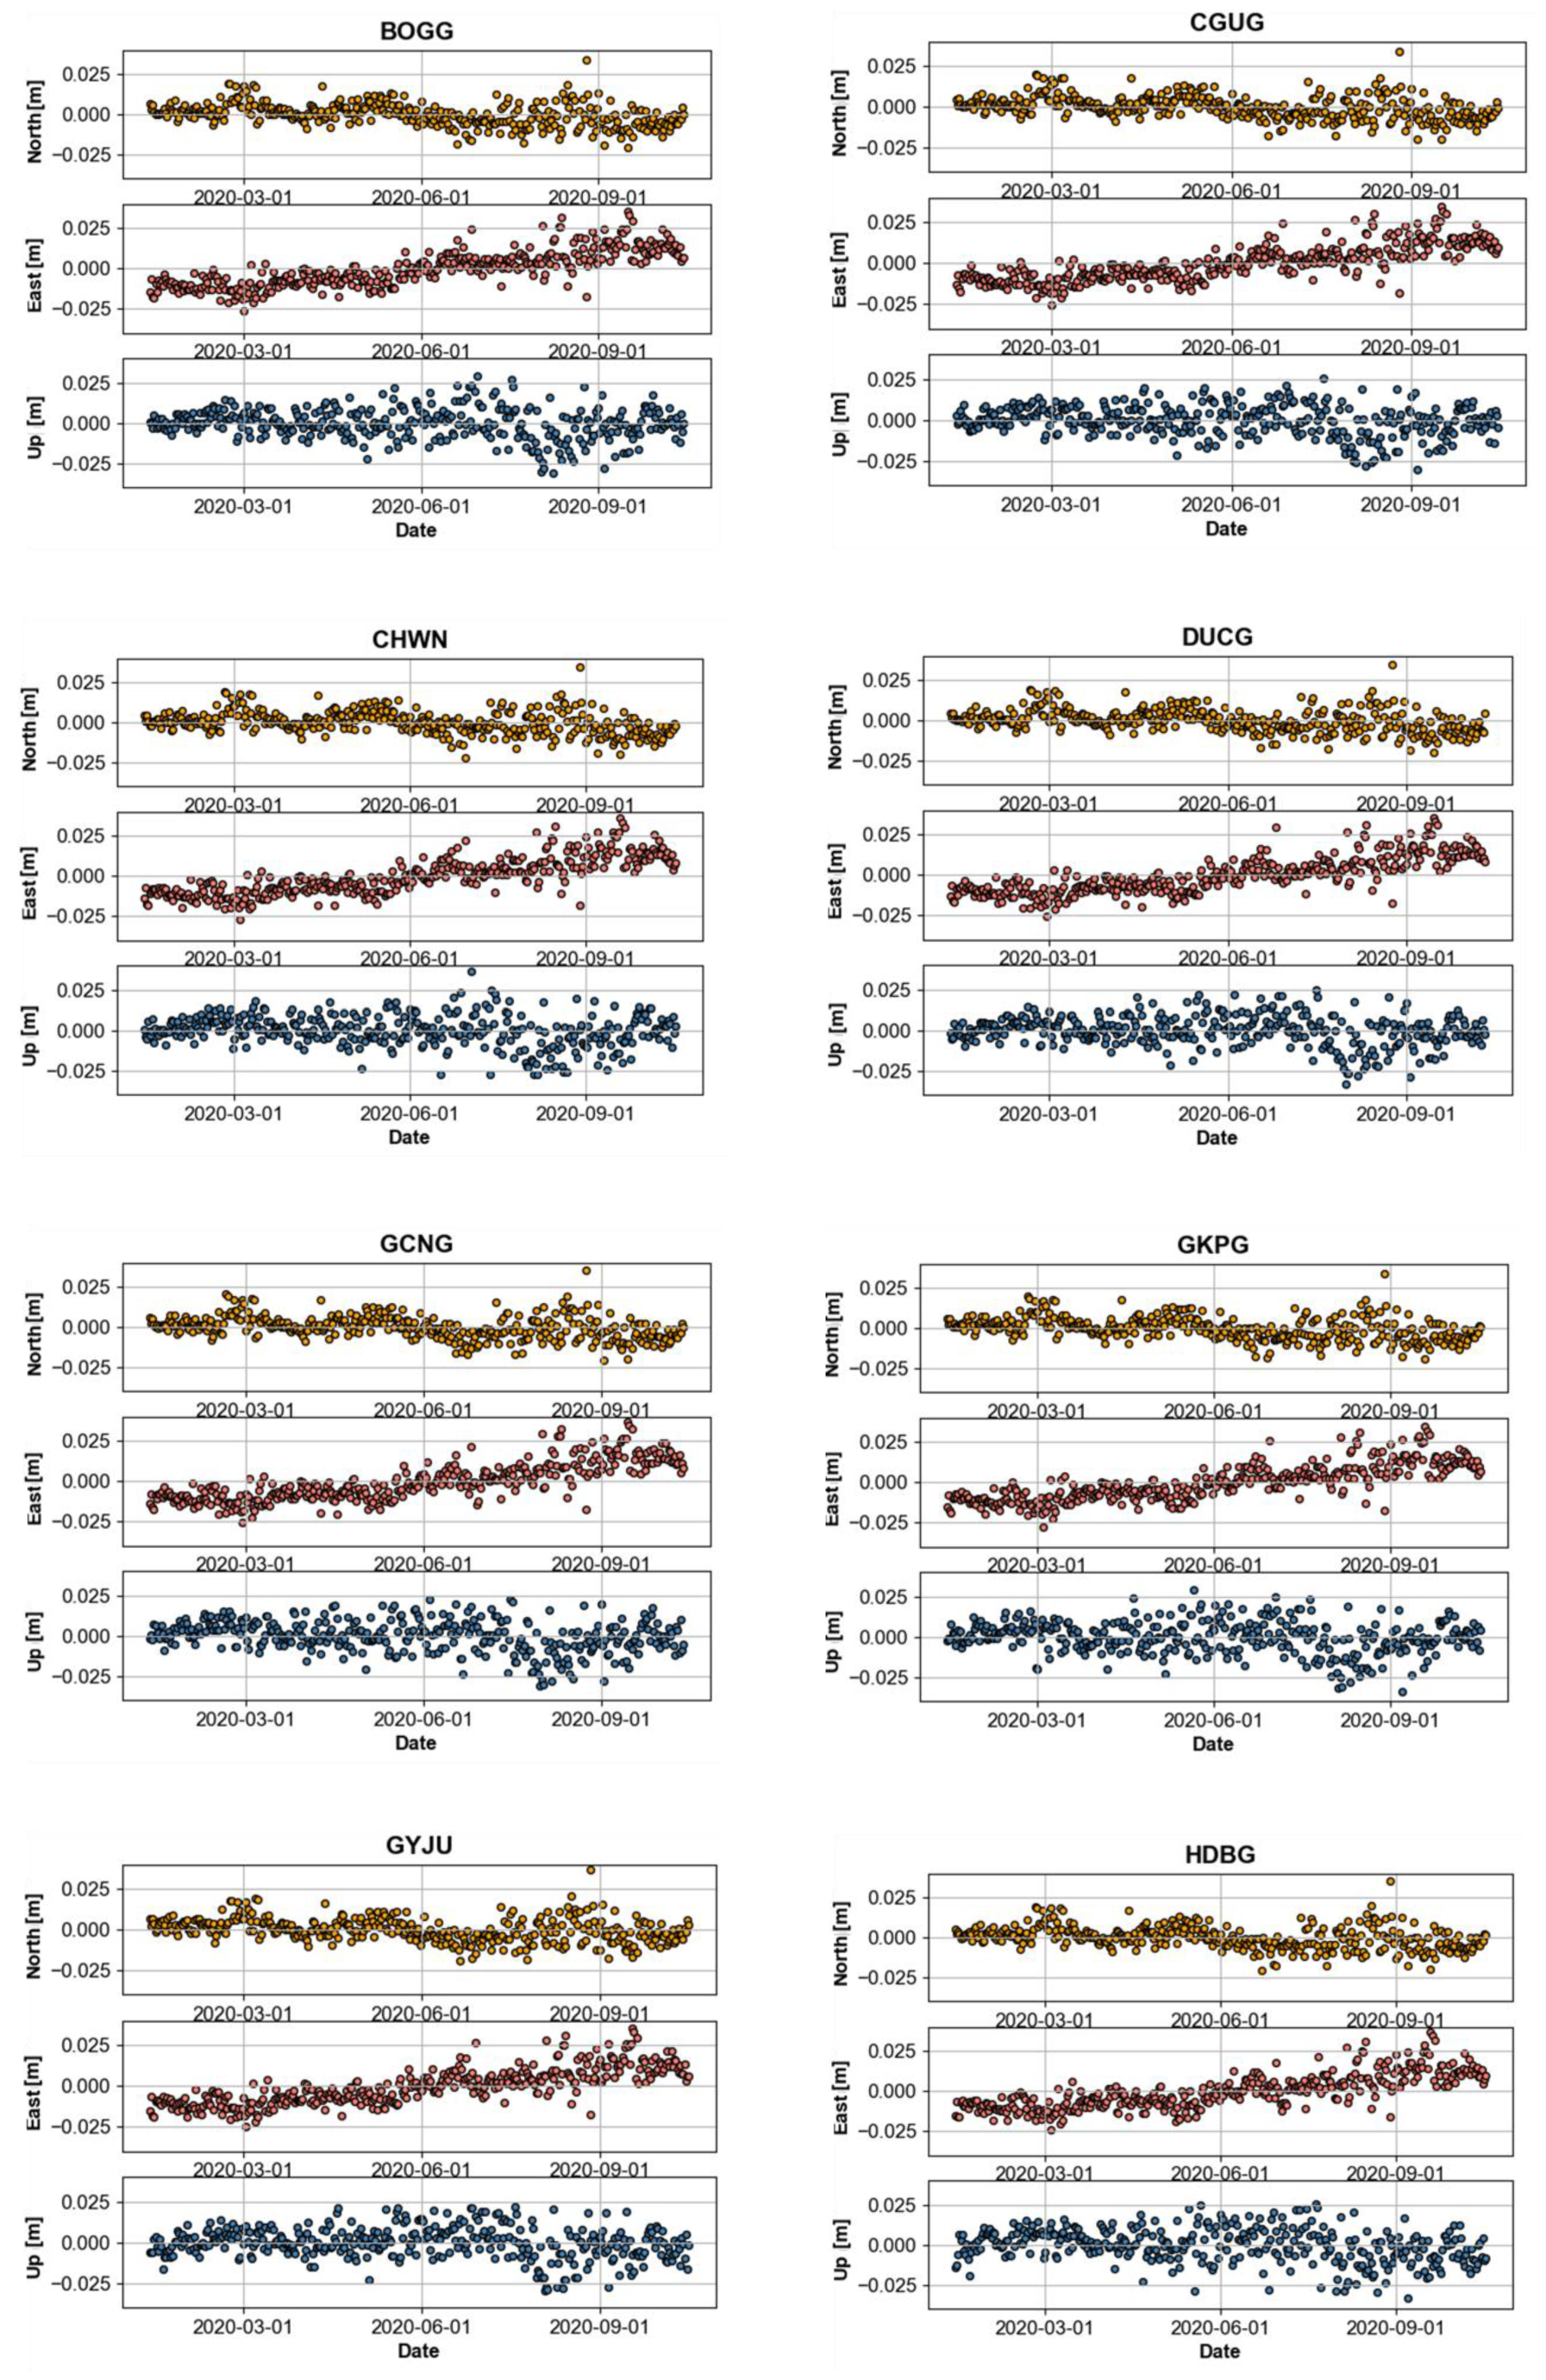
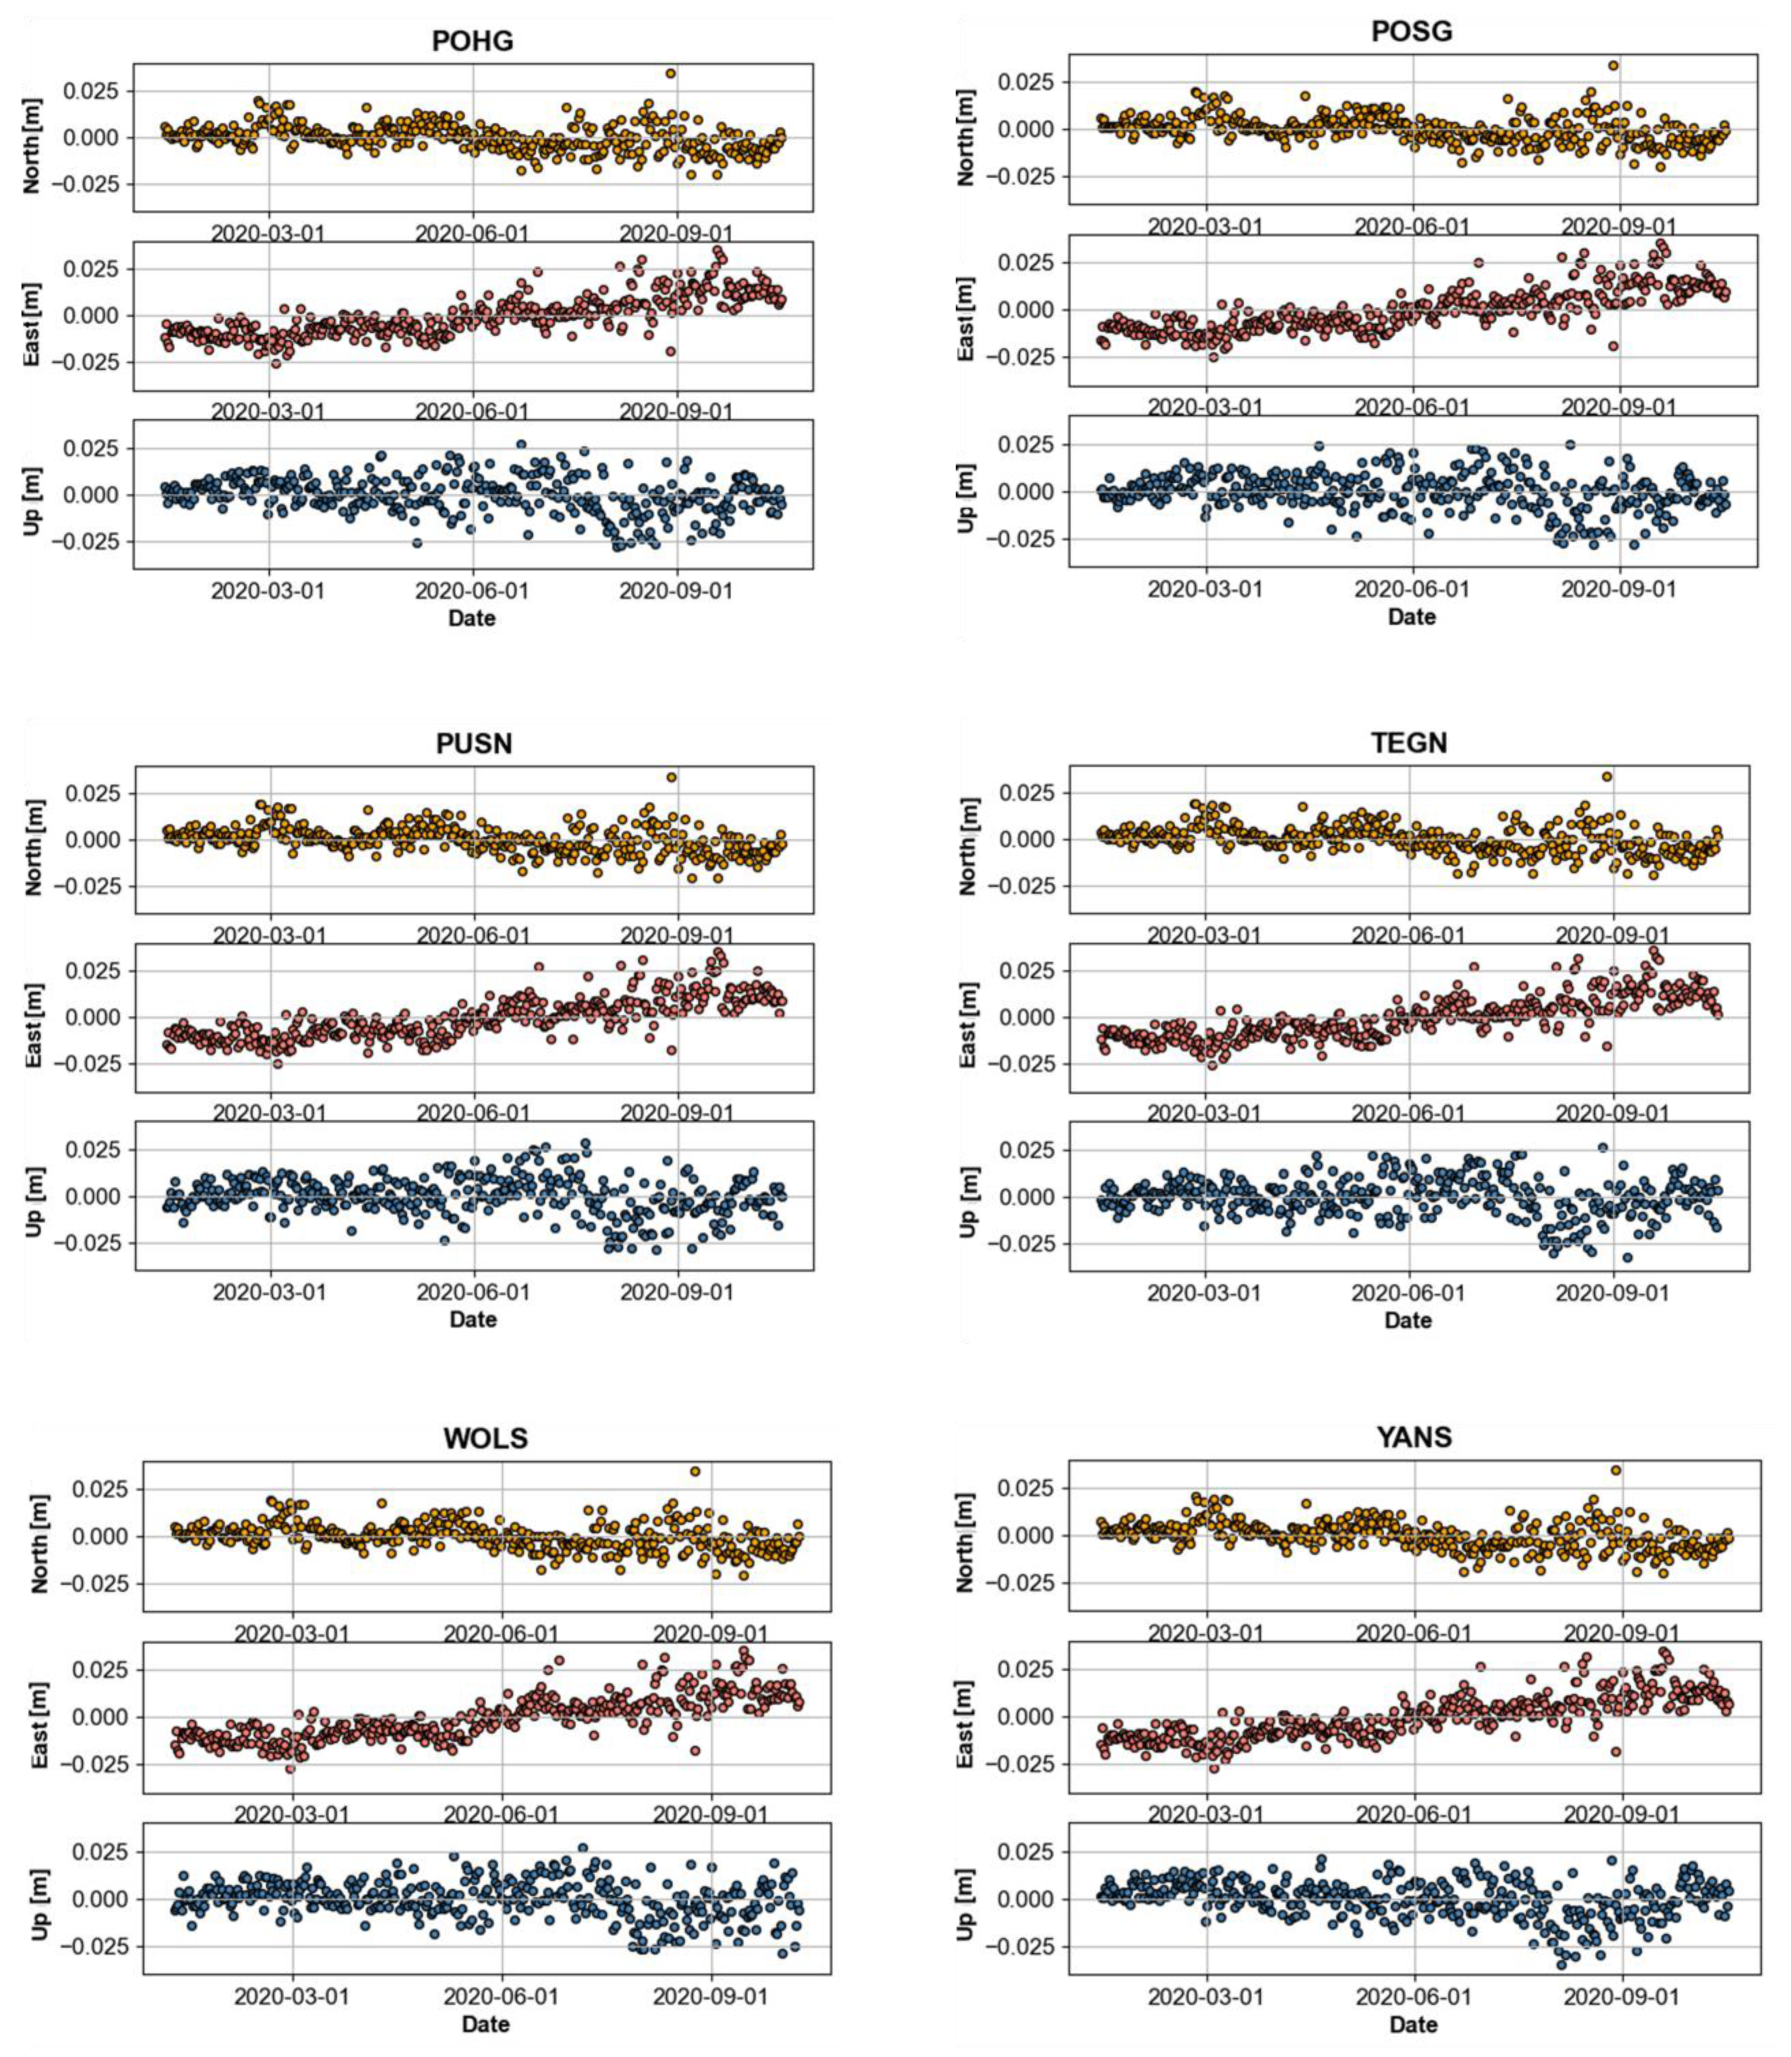
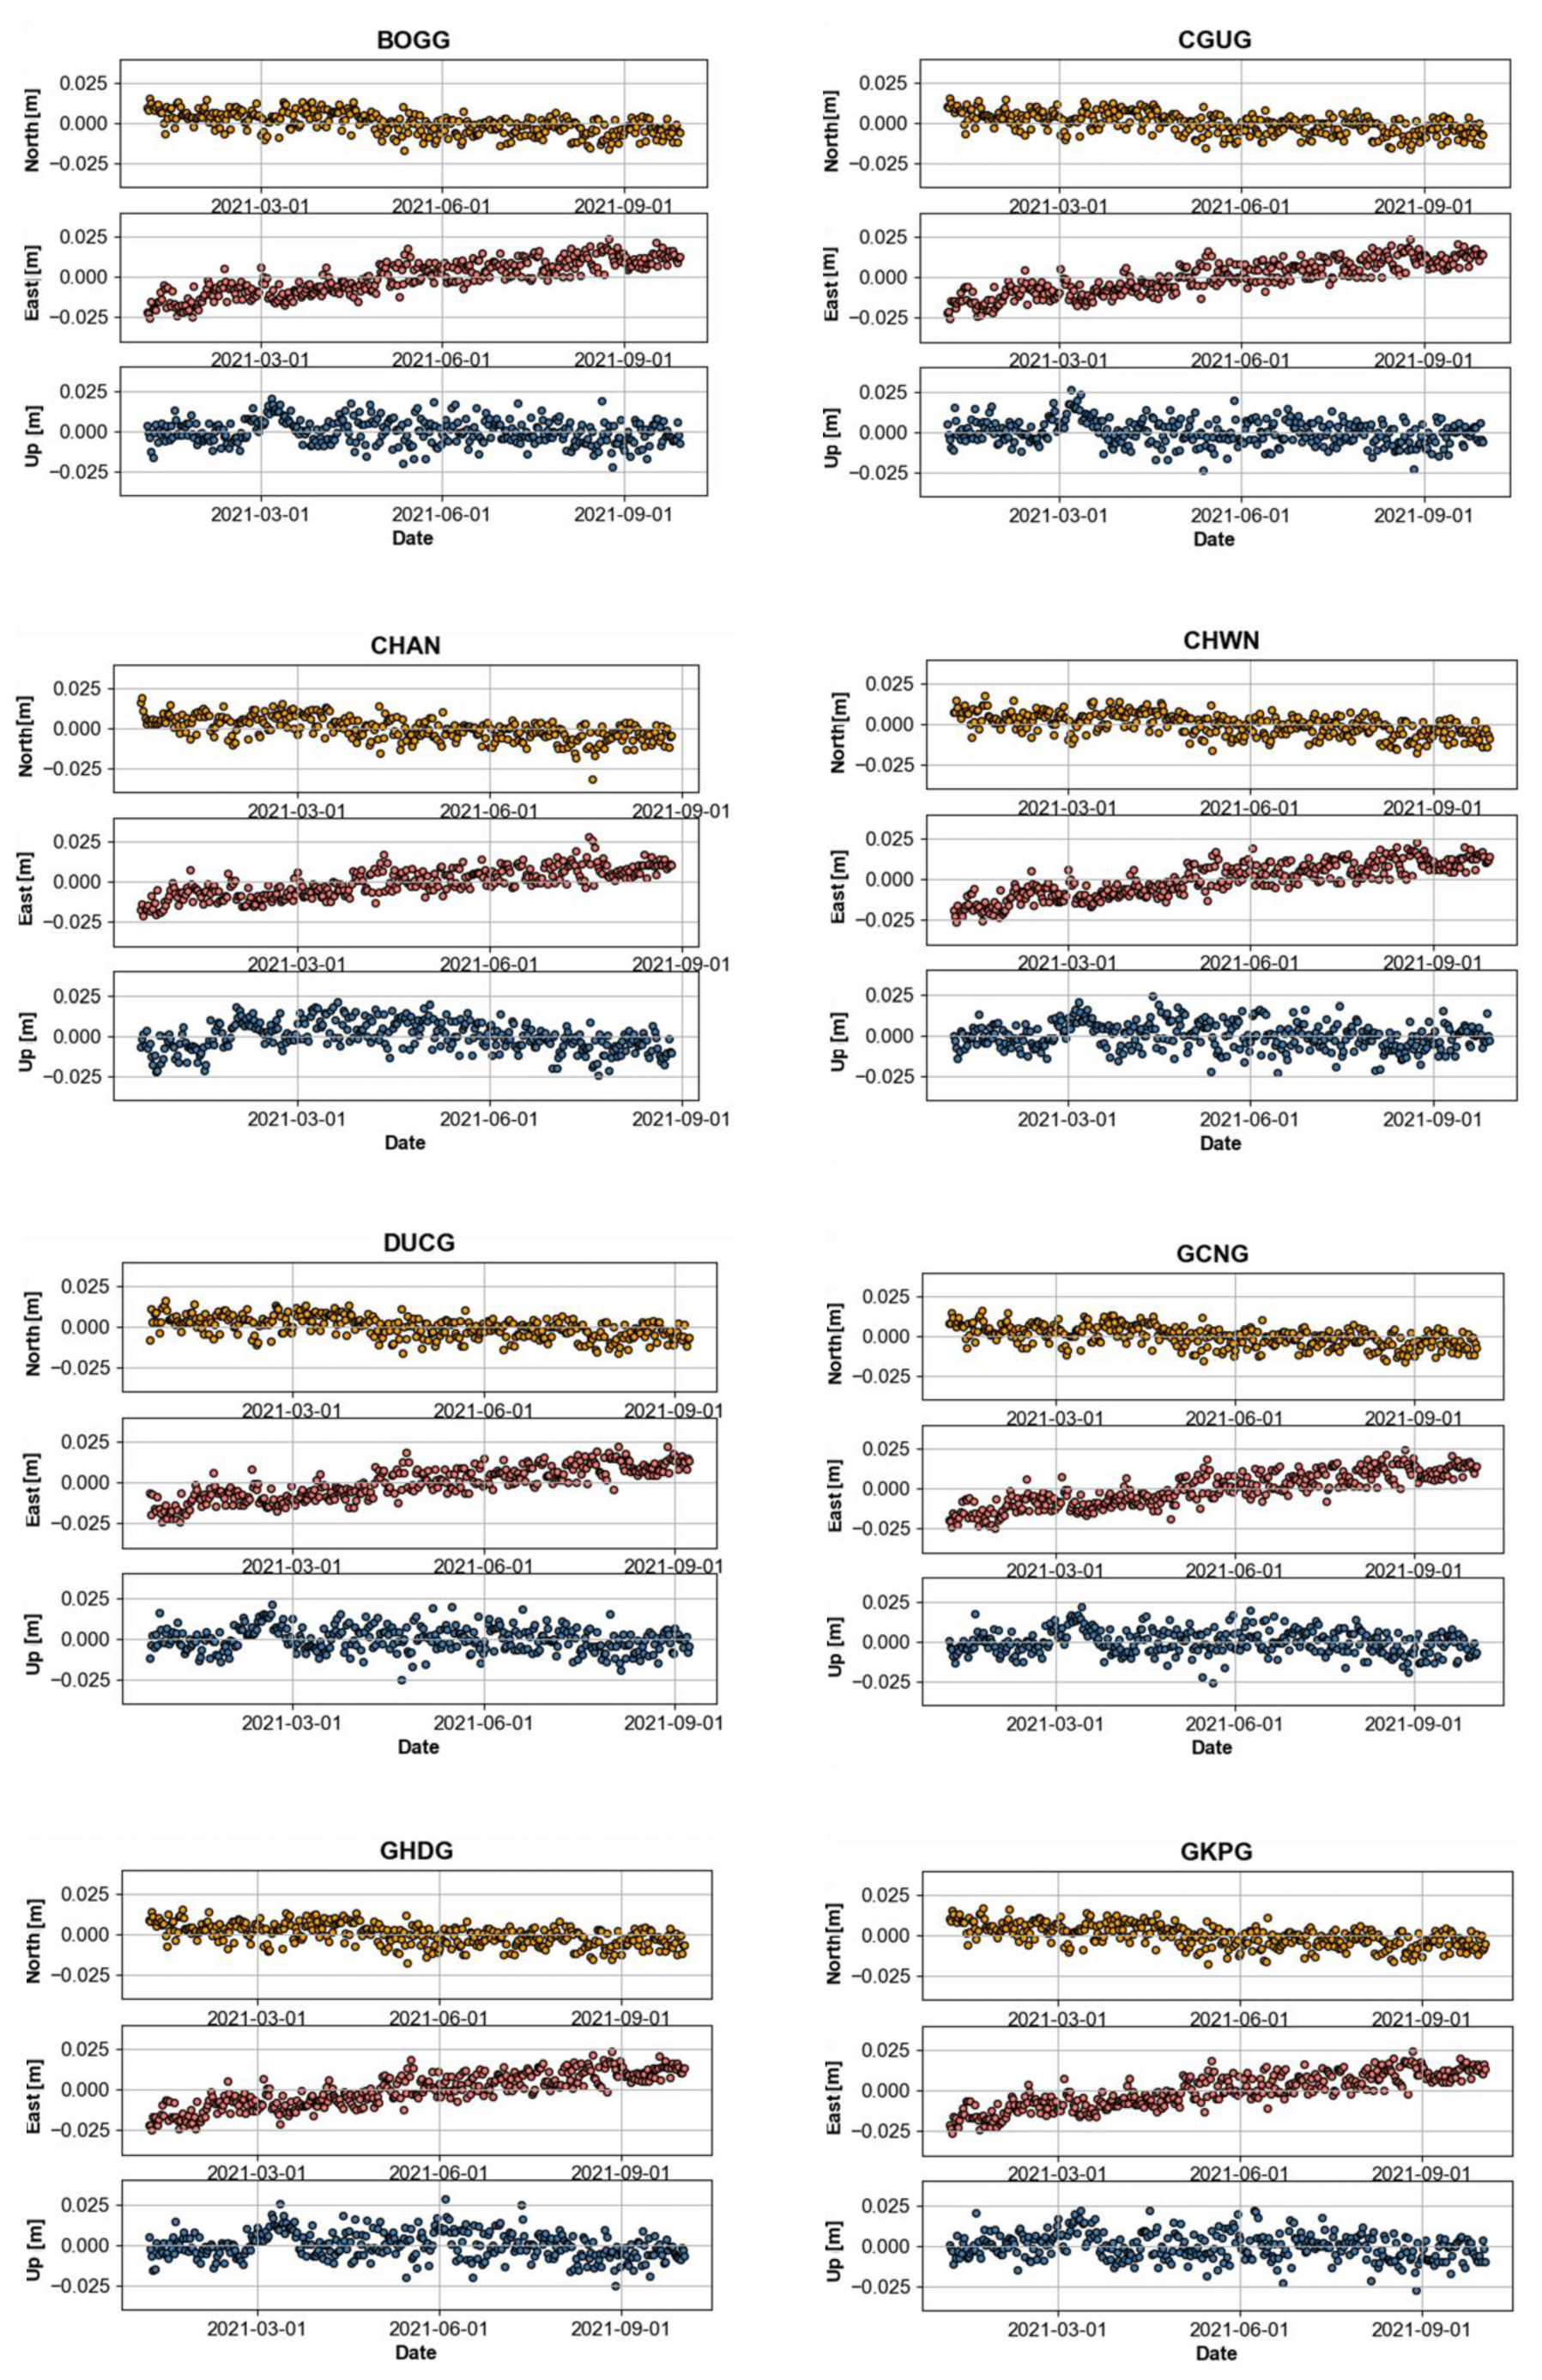
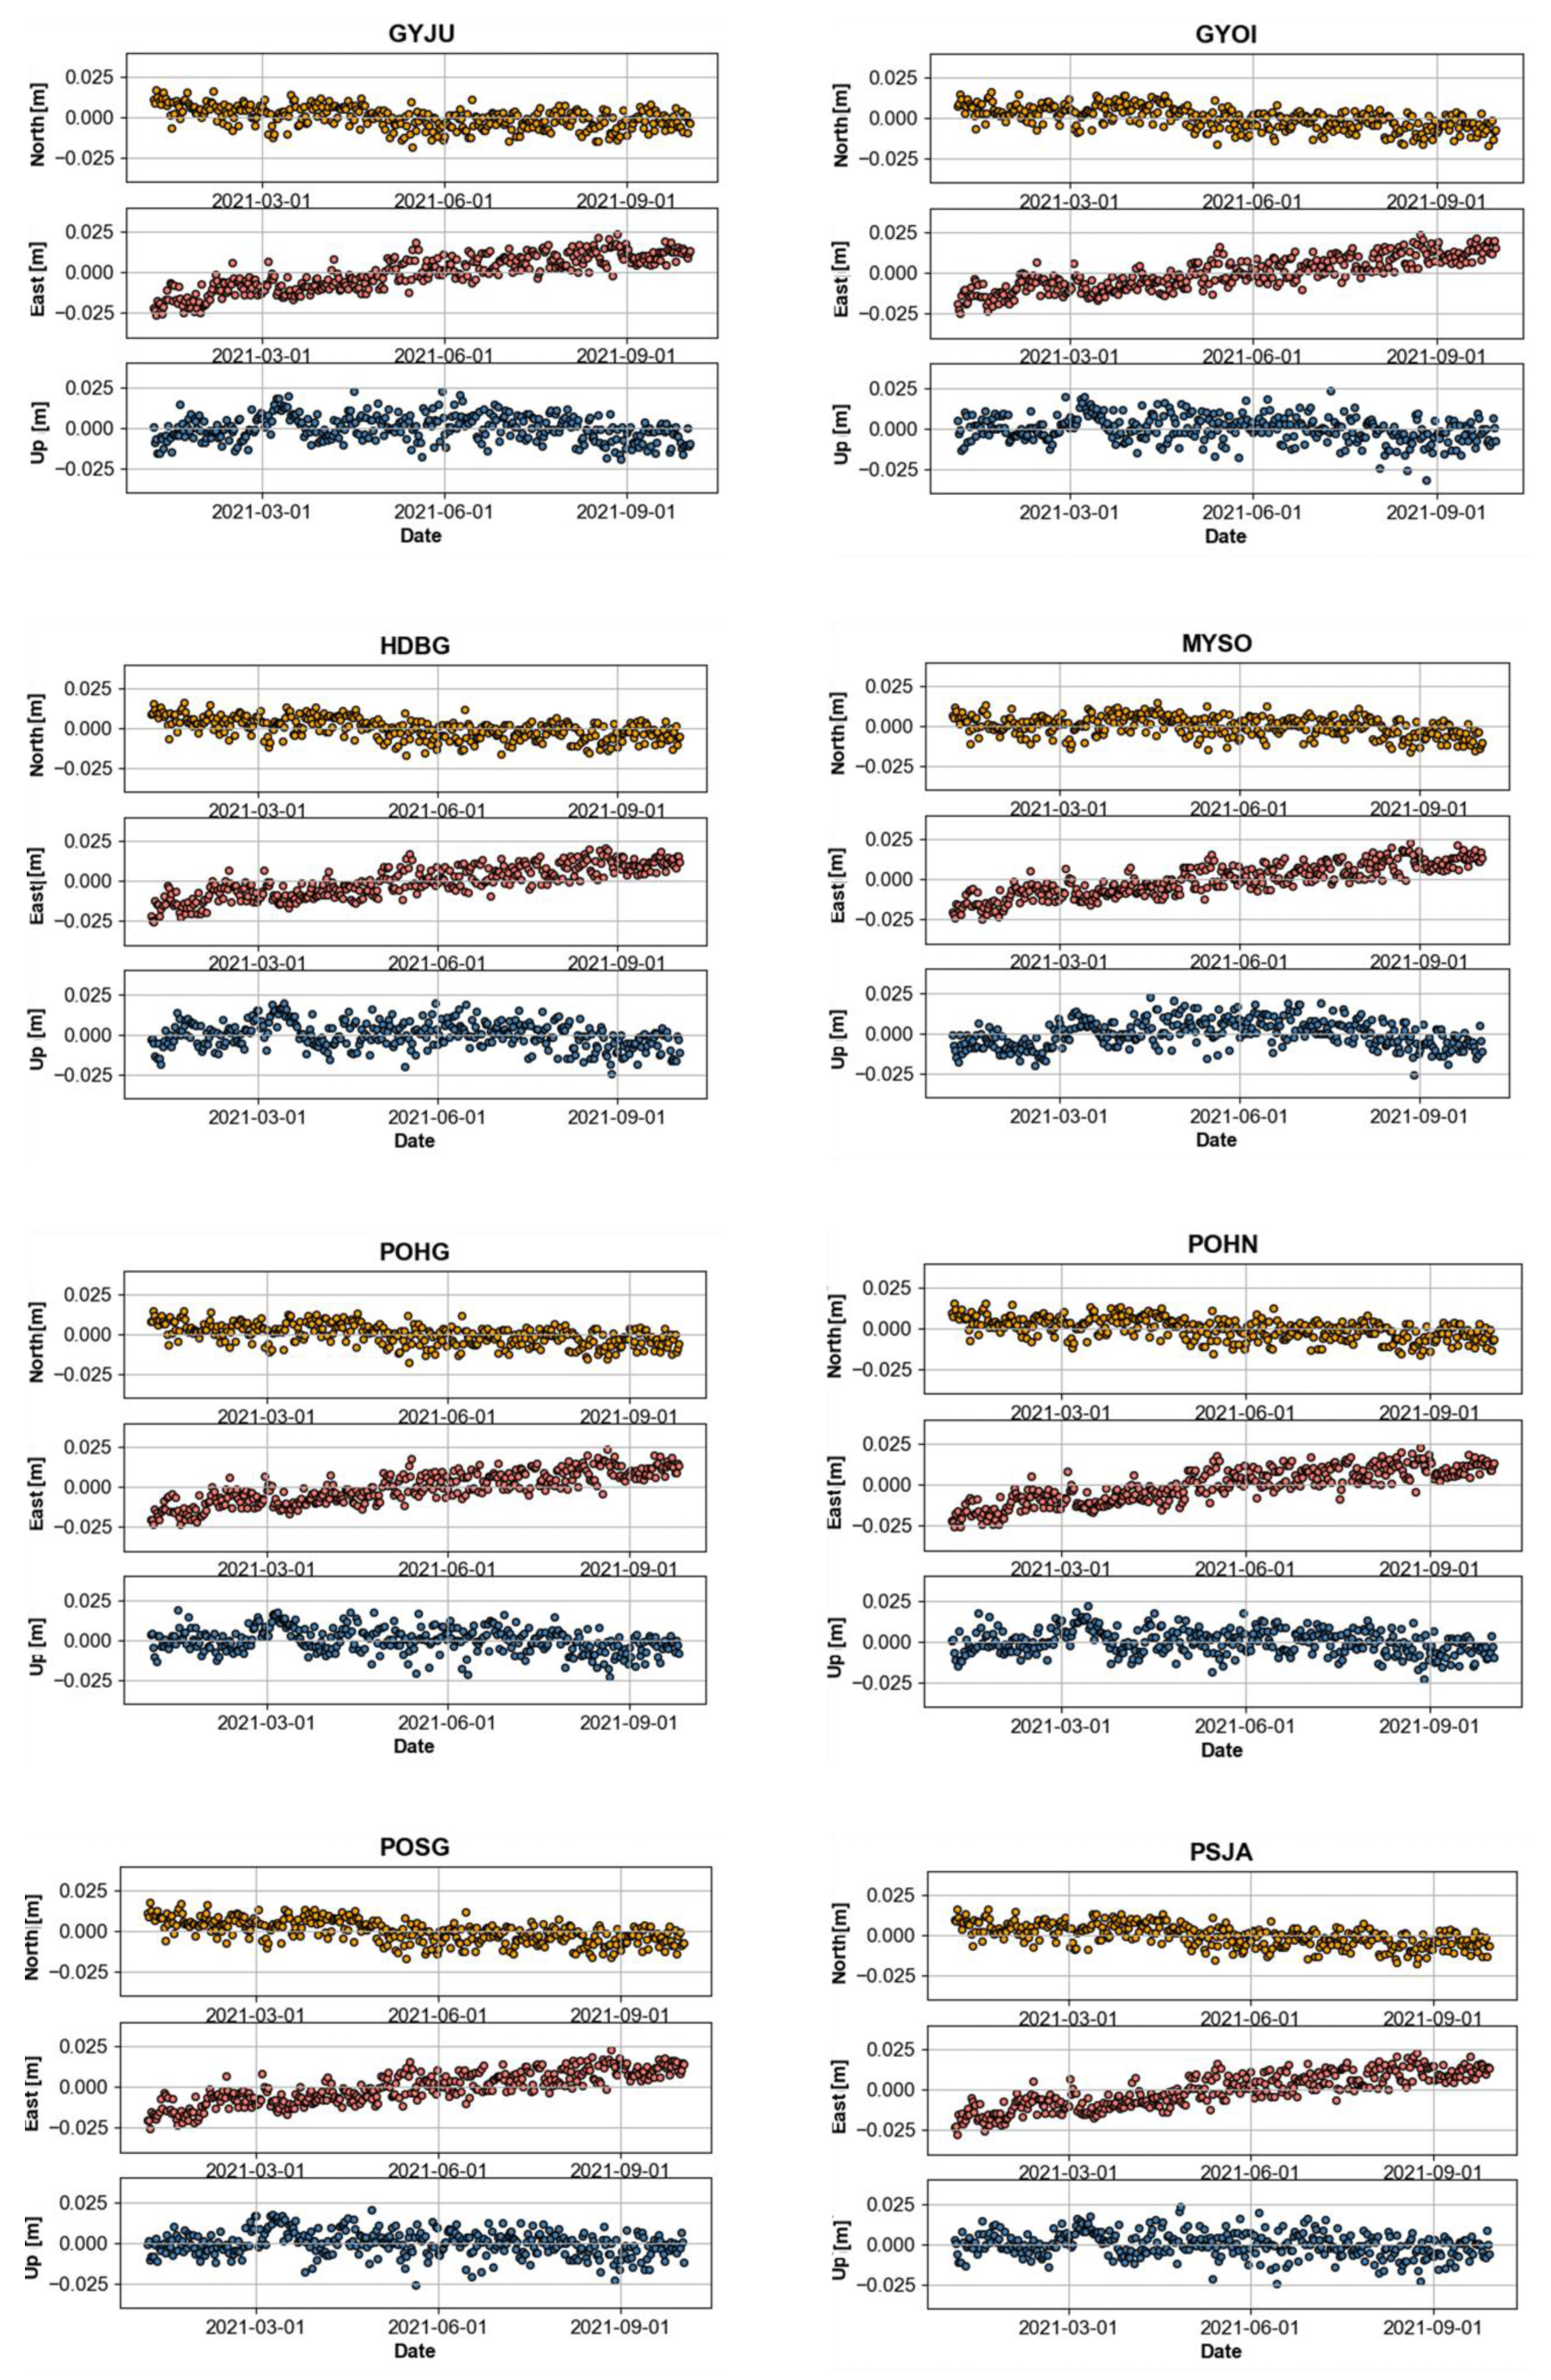
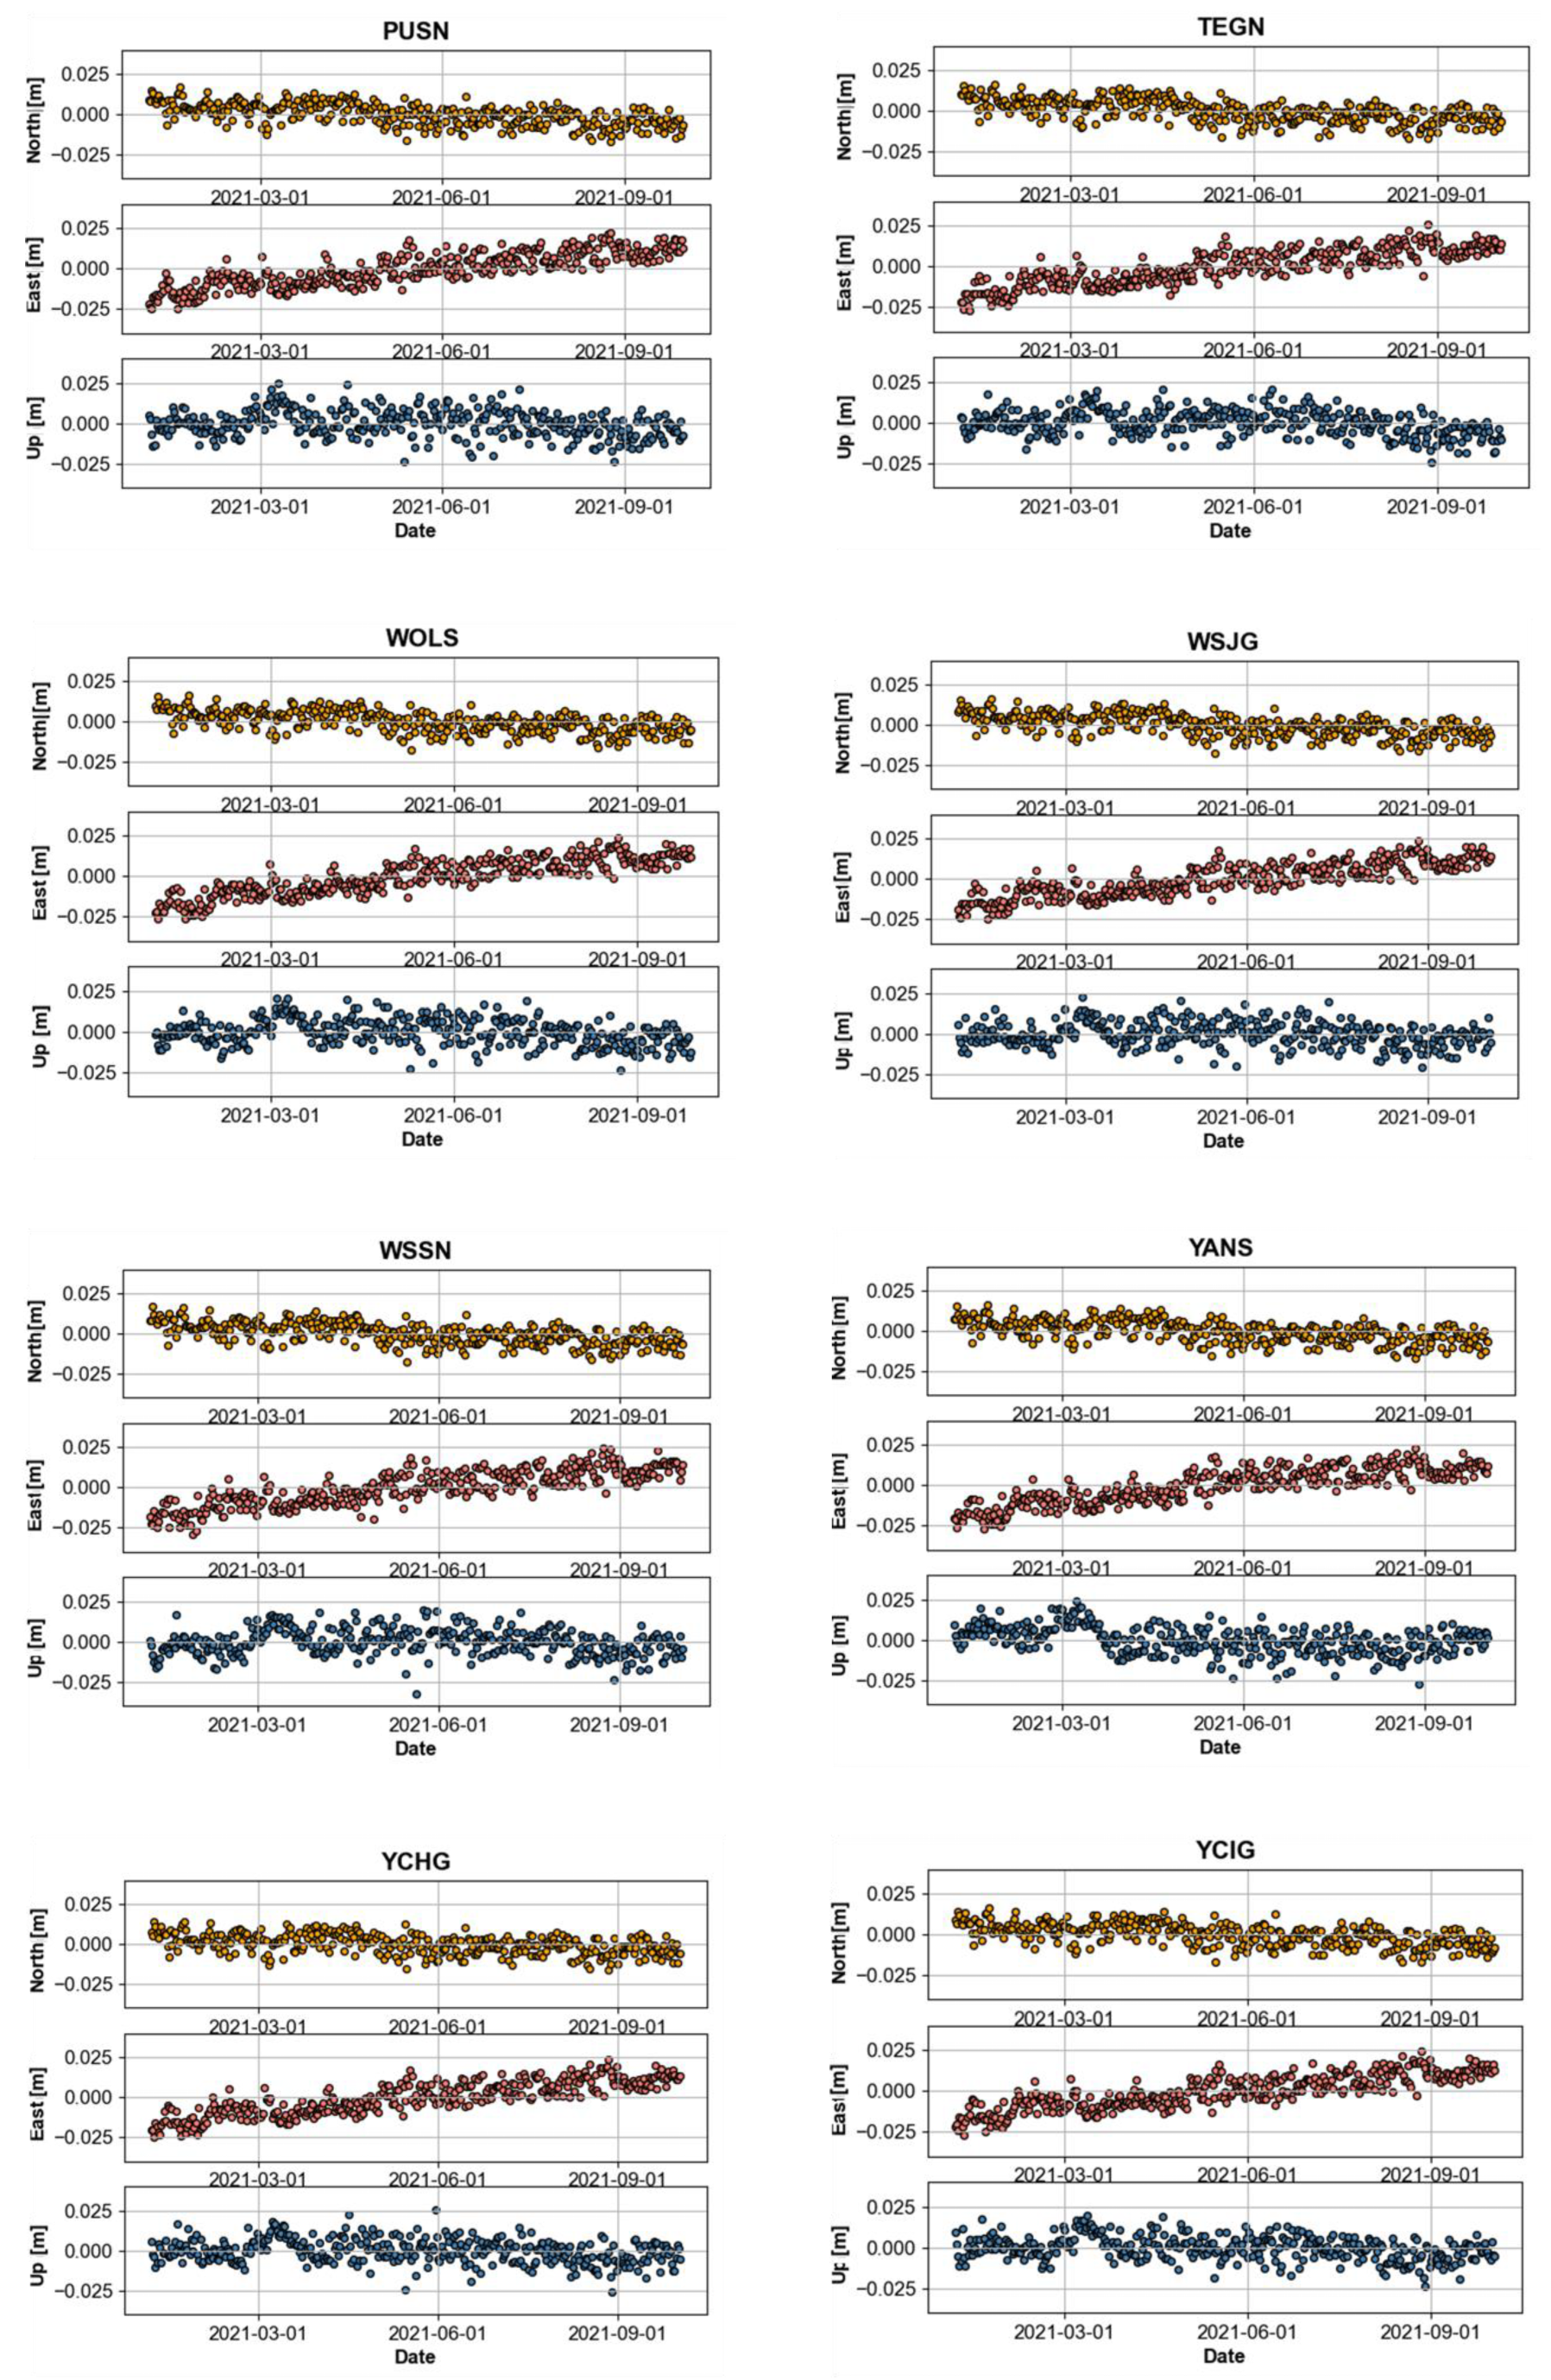
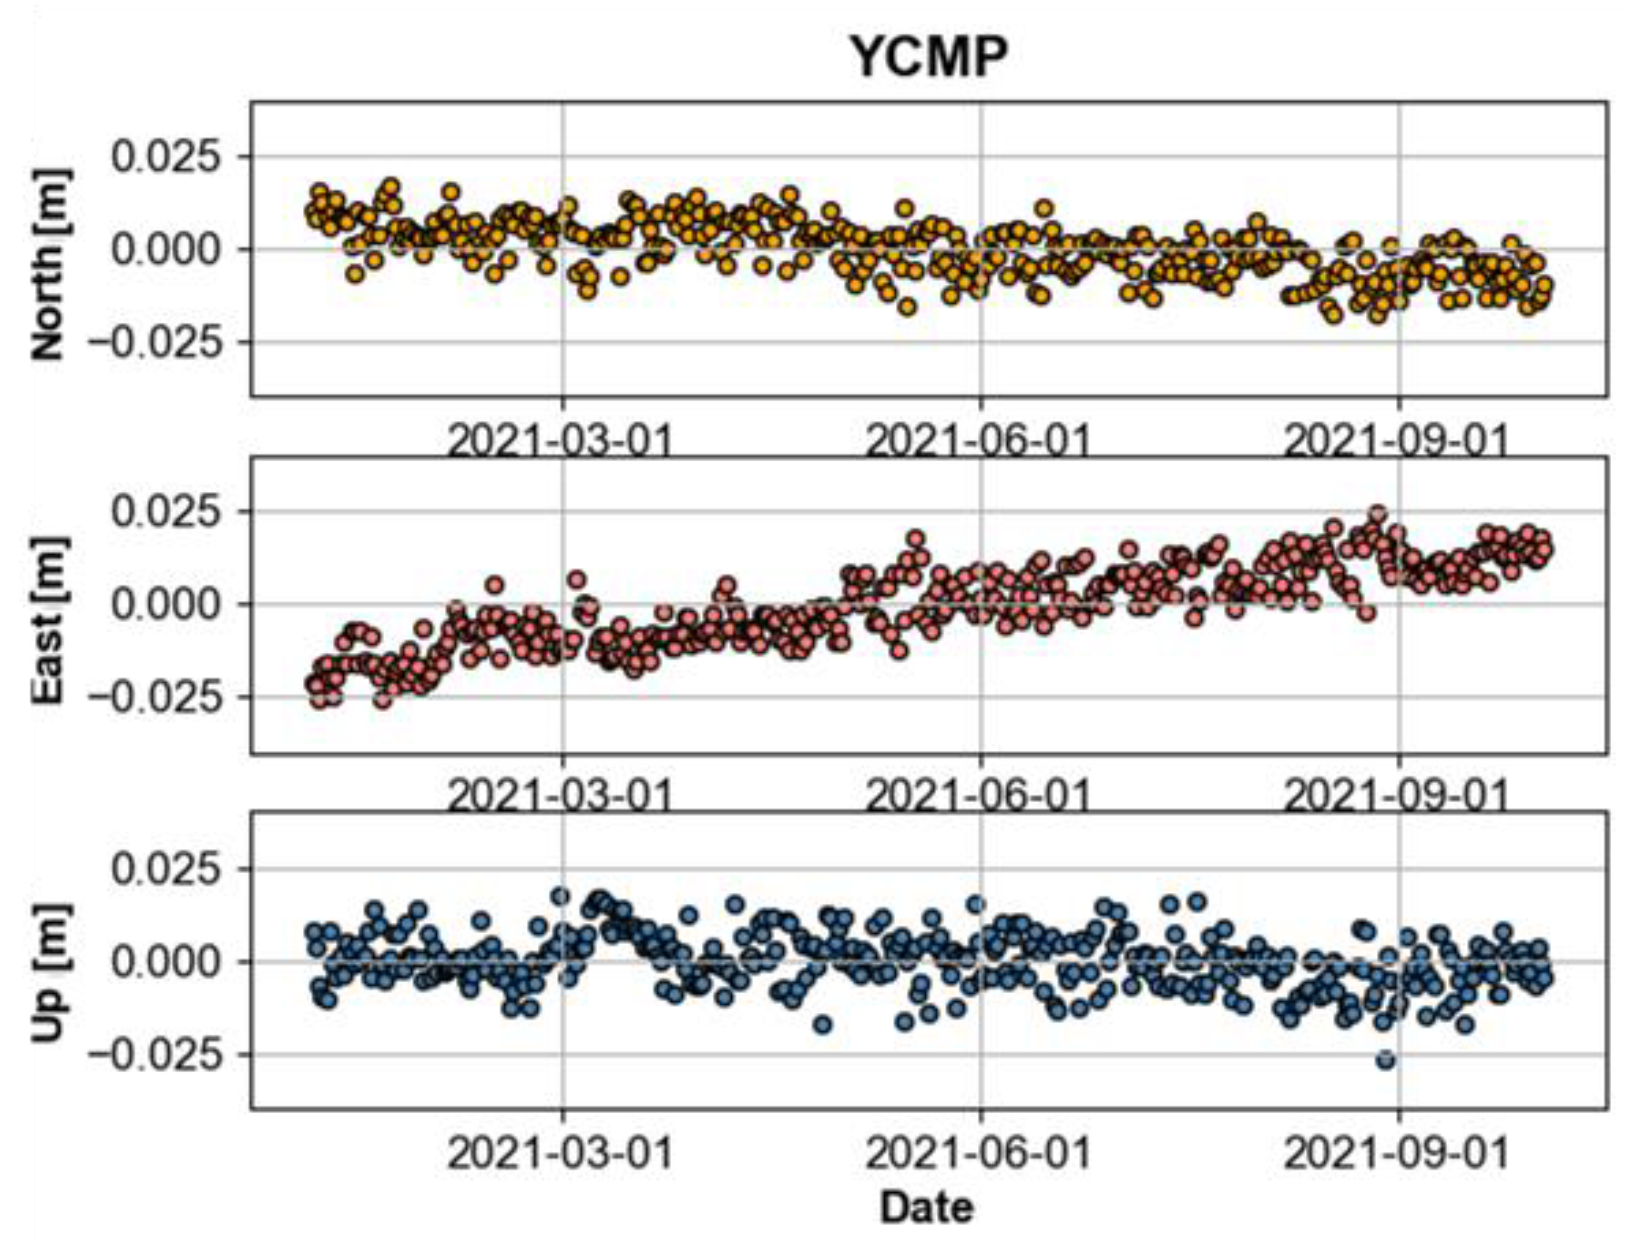
From 17 July 2018, to 31 December 2021, the daily solution was estimated through high-precision baseline analysis using the IGS stations, resulting in the three-dimensional time series coordinates of each corresponding station. Appendix A, Appendix B, Appendix C, and Appendix D are time series representations of the coordinates for each observing station, which shows that the movement in the southeast direction is dominant in that area. This is consistent with the fact that the crust of the Korean Peninsula is known to move in the southeast direction at a rate of about three centimeters every year.
In the case of the vertical (up) component, there was no tendency in the movement of the station, and this is because the magnitude of vertical change is smaller than the accuracy of GNSS positioning. Due to the geometric limitations of satellites, it is known that the accuracy in the vertical component is always 2–3 times worse than that in the horizontal (north, east) direction.
4.1.2. Yearly Solution
Using the ADDNEQ2 module of Bernese Software V5.2, two separate final solutions with global constraints were calculated by combining the movements, one for 2018 to 2019 (Solution 1) and the other for 2020 to 2021 (Solution 2). The result for relative movement with respect to GKPG follows:
- Absolute Velocity with IGS Constrained
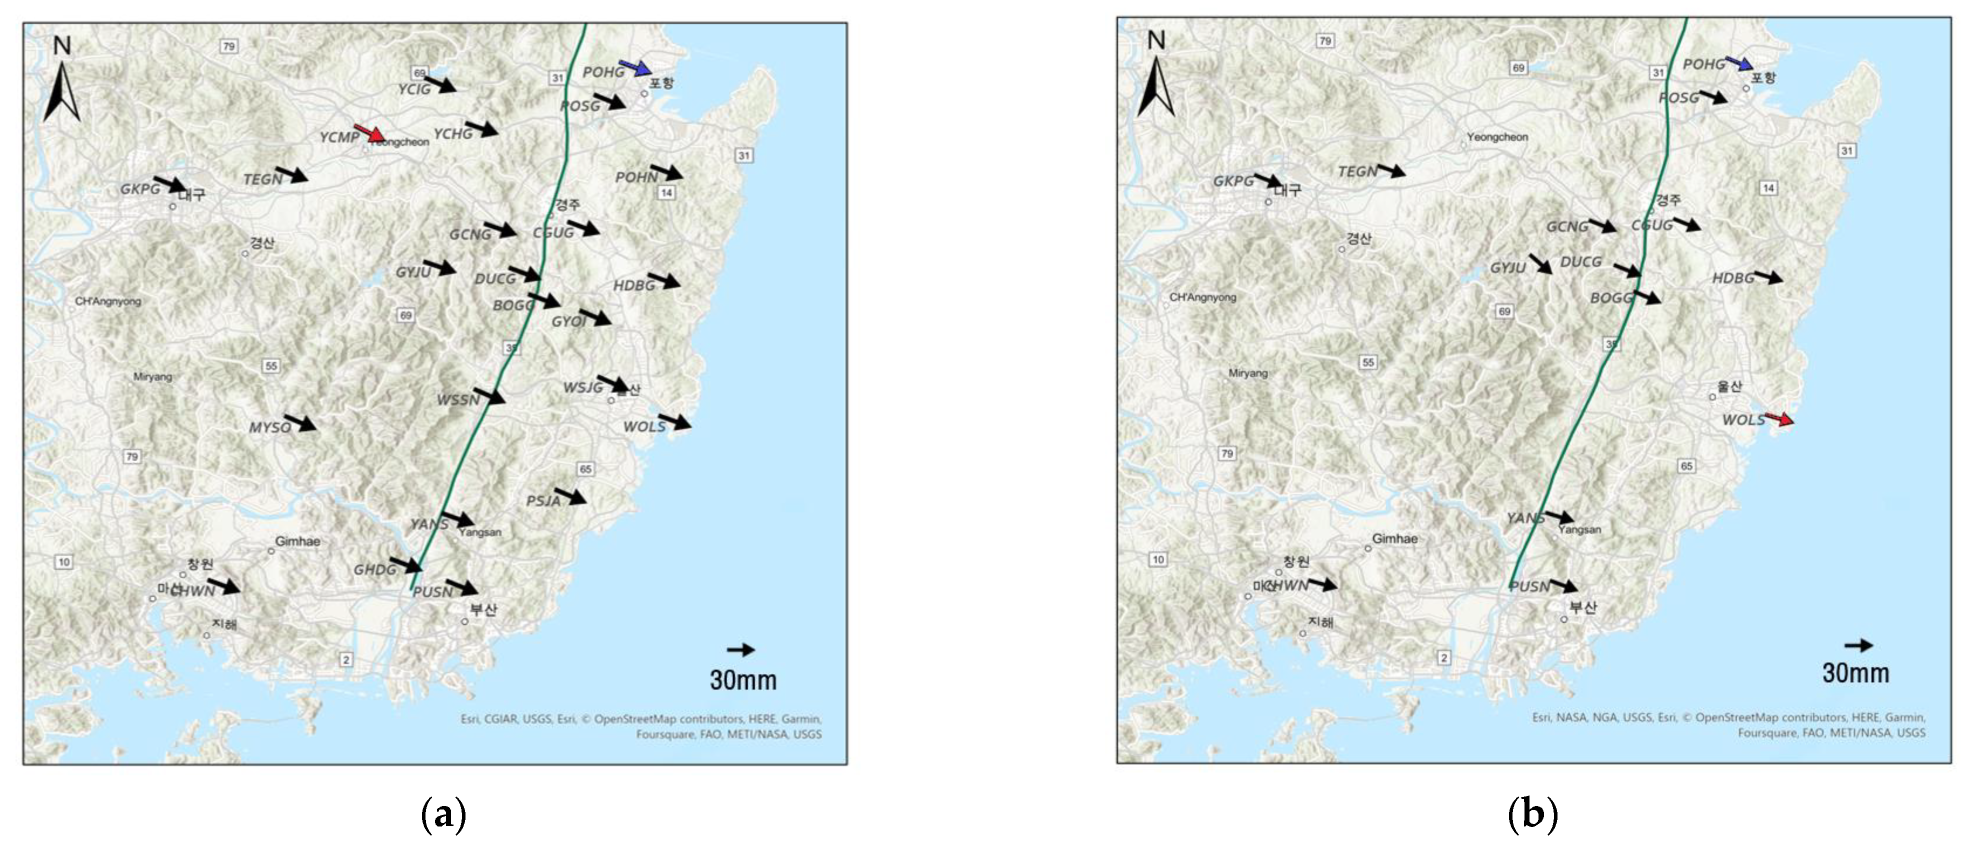
The IGS stations were fixed to analyze the trend of the movement of the Yangsan Fault Zone for each period (see Figure 4).
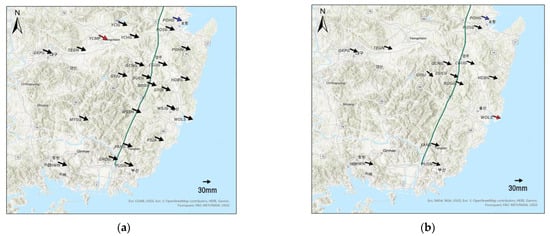
Figure 4.
(a) Displacement of station in 2018–2019; (b) displacement of station in 2020–2021. Red is the largest station moved, and blue is the least moved station.
The crust around the Yangsan Fault Zone Solution has a displacement ranging from 32.0 mm to 37.6 mm in the southeast direction in Solution 1. During this period, the POHG station moved the least while the maximum movement occurred at WOLS station. From 2020 to 2021 (Solution 2), the movement direction is similar to Solution 1 with the displacement from 31.9 mm to 34.6 mm (POHG and GCNG are the minimum and the maximum, respectively, see Table 4). This is close to the result of annual movement of the Korean Peninsula [19,20]. In addition, as a result of comparison for the velocity and direction on each side of the Yangsan Fault Zone, there seems to be no significant difference between two regions. Therefore, it might be concluded that the area around the Yangsan Fault Zone is stable at the moment.

Table 4.
Difference between velocities and directions.
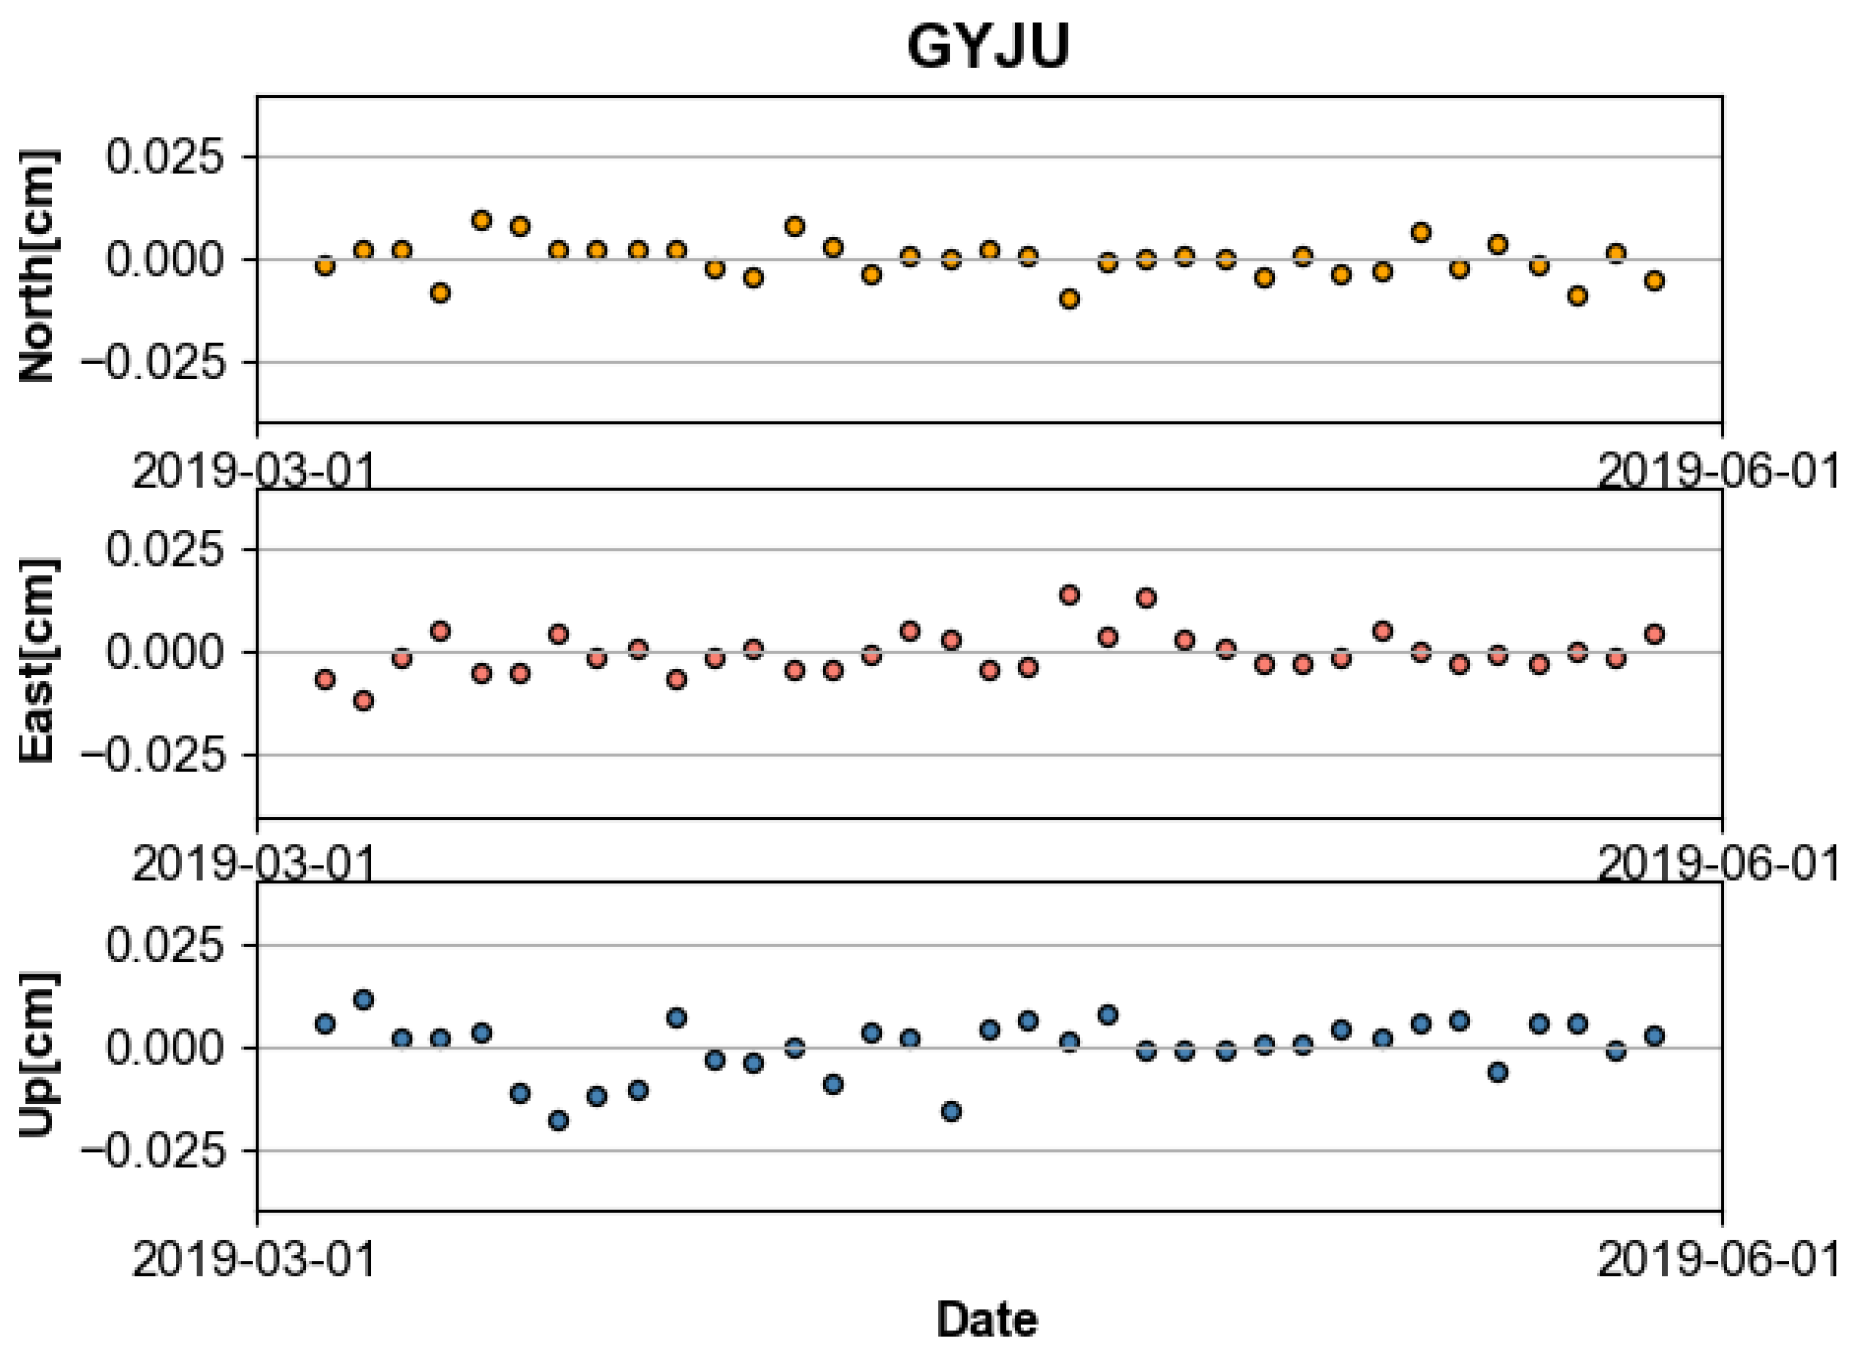
Among the velocity vectors between 2018 and 2019, the GYJU station moved with a magnitude of about 73.9 mm/year in the direction of 132.0° (in azimuth). This was excluded from the calculation because there might be a potential error with the scale and direction of movement because the observation data were too small (see Figure 5).
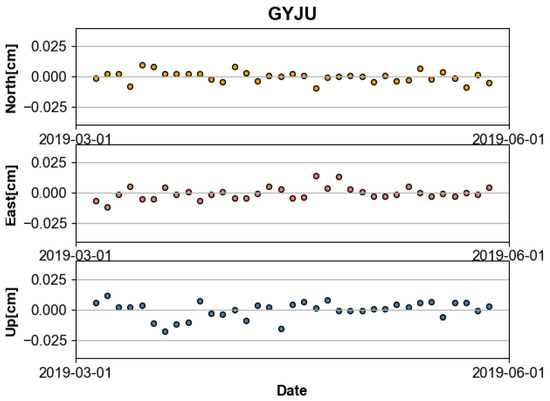
Figure 5.
Time series of GYJU Station.
- 2.
- Relative Velocity with respect to GKPG
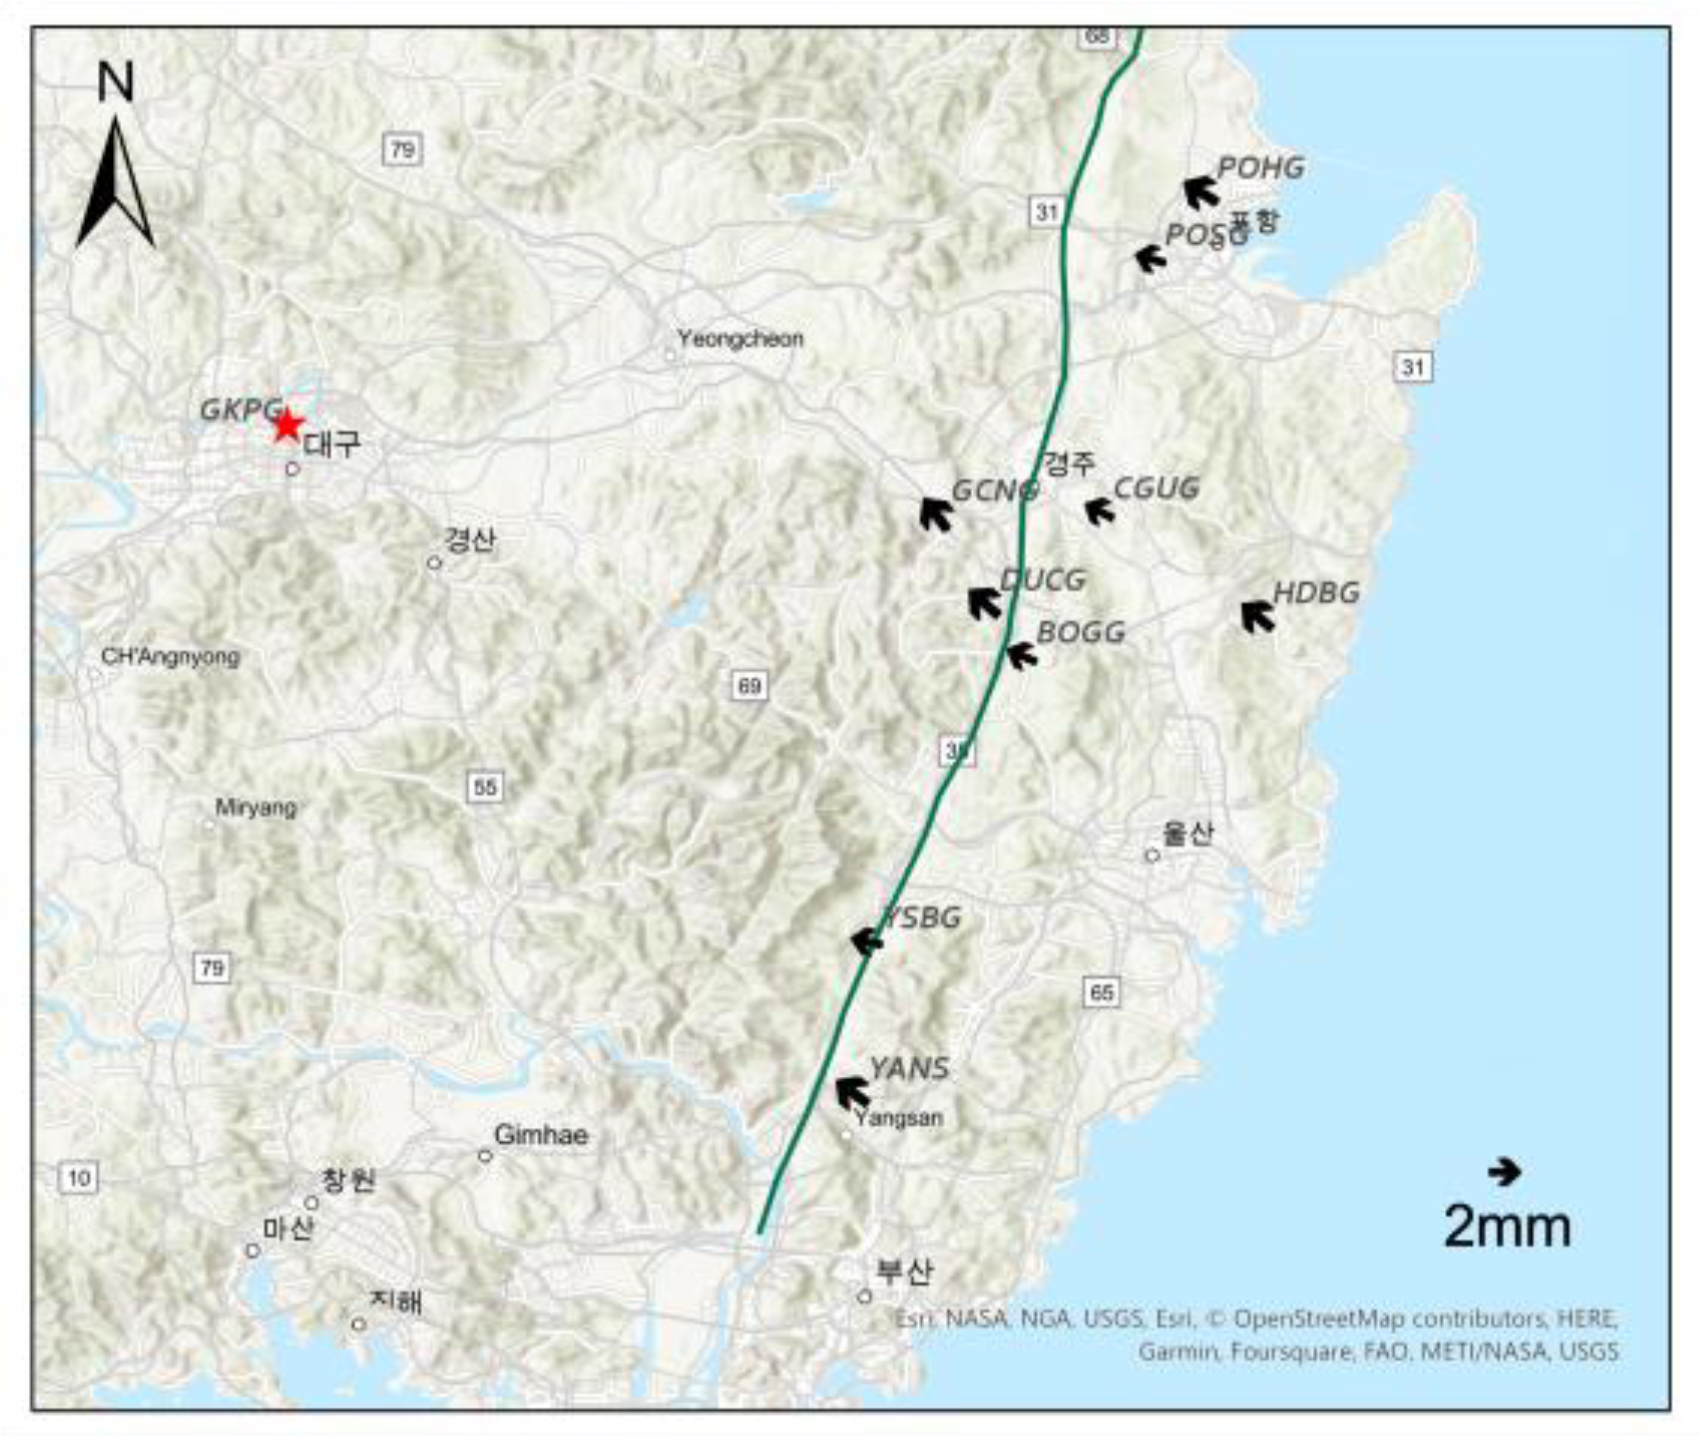
As a result of the previous study, the displacement of the Yangsan Fault appears to have no significant change in terms of magnitude and direction of the crustal movement. Nevertheless, there might be an internal distortion that is potentially more important in the analysis of the crustal movement. Therefore, additional analysis was performed to clearly confirm the distortion inside the tomography. It was analyzed by calculating the relative displacement of the crust around the Yangsan Fault based on the GKPG station. This study used data from 25 February 2019, to 31 December 2021. The reason for the difference in the study period is that the data of the GKPG, which is a fixed point, were not available for outside the above period.
Figure 6 shows the results of the baseline analysis with GKPG station (red star) fixed in millimeters, which is the displacement calculated excluding the movement of the GKPG station. As a result, most stations around the Yangsan Fault move in the northwest direction at an average of about 0.18 cm. Considering that most stations move in the same direction and magnitude, it is judged that there is no distortion of the crust inside the Yangsan Fault. Based on the results of this study, it is not possible to conclude whether the Yangsan Fault is active or not. This is because the period analyzed in this study is relatively short to conclude. However, it would be possible to confirm the activity of the fault if continuous research with a longer data span is conducted in this regard.
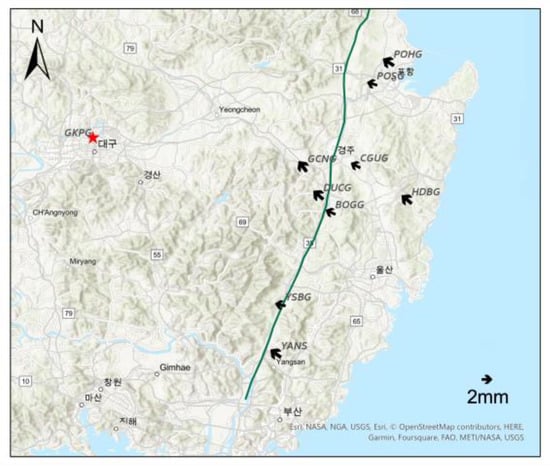
Figure 6.
Displacement of station that GKPG fixed.
4.1.3. Stress and Strain Analysis
The GNSS based approach has an edge over past geological analysis methods for active fault analysis in that it is possible to accurately measure the crustal movement. In this paper, the Yangsan Fault Zone was monitored based on the triangulation network to analyze the stress and strain caused by crustal movement. Therefore, in this study, based on the results of 3 years of precise coordinates, the deformation in stress acting on the Yangsan Fault Zone was analyzed using the triangular network analysis method. To perform this, it is necessary to assume that the target area is deformed on a two-dimensional plane rather than a curved surface. Triangular network analysis calculates the rate of change of a baseline connecting three points of stations as each vertex of a triangle. The formula for calculating the planar strain by trilateration is given as follows:
where and represent the annual axial strains, represents the annual shear strain, is determined through GNSS stations as the distance change rate of each side, and the symbols are the azimuth of the geodesic line.
A Delaunay triangular network is composed of the GNSS stations around the Yangsan Fault Zone, which is used to calculate the baseline change rate based on the time series coordinates. Neglecting the curvature of the earth, the triangular network was assumed to be a two-dimensional plane. No triangle’s circumcircle contains any other points except the three vertices of the triangle in this method. The stress strain and area strain of the triangular network was calculated using the baseline distance change rate between the stations.
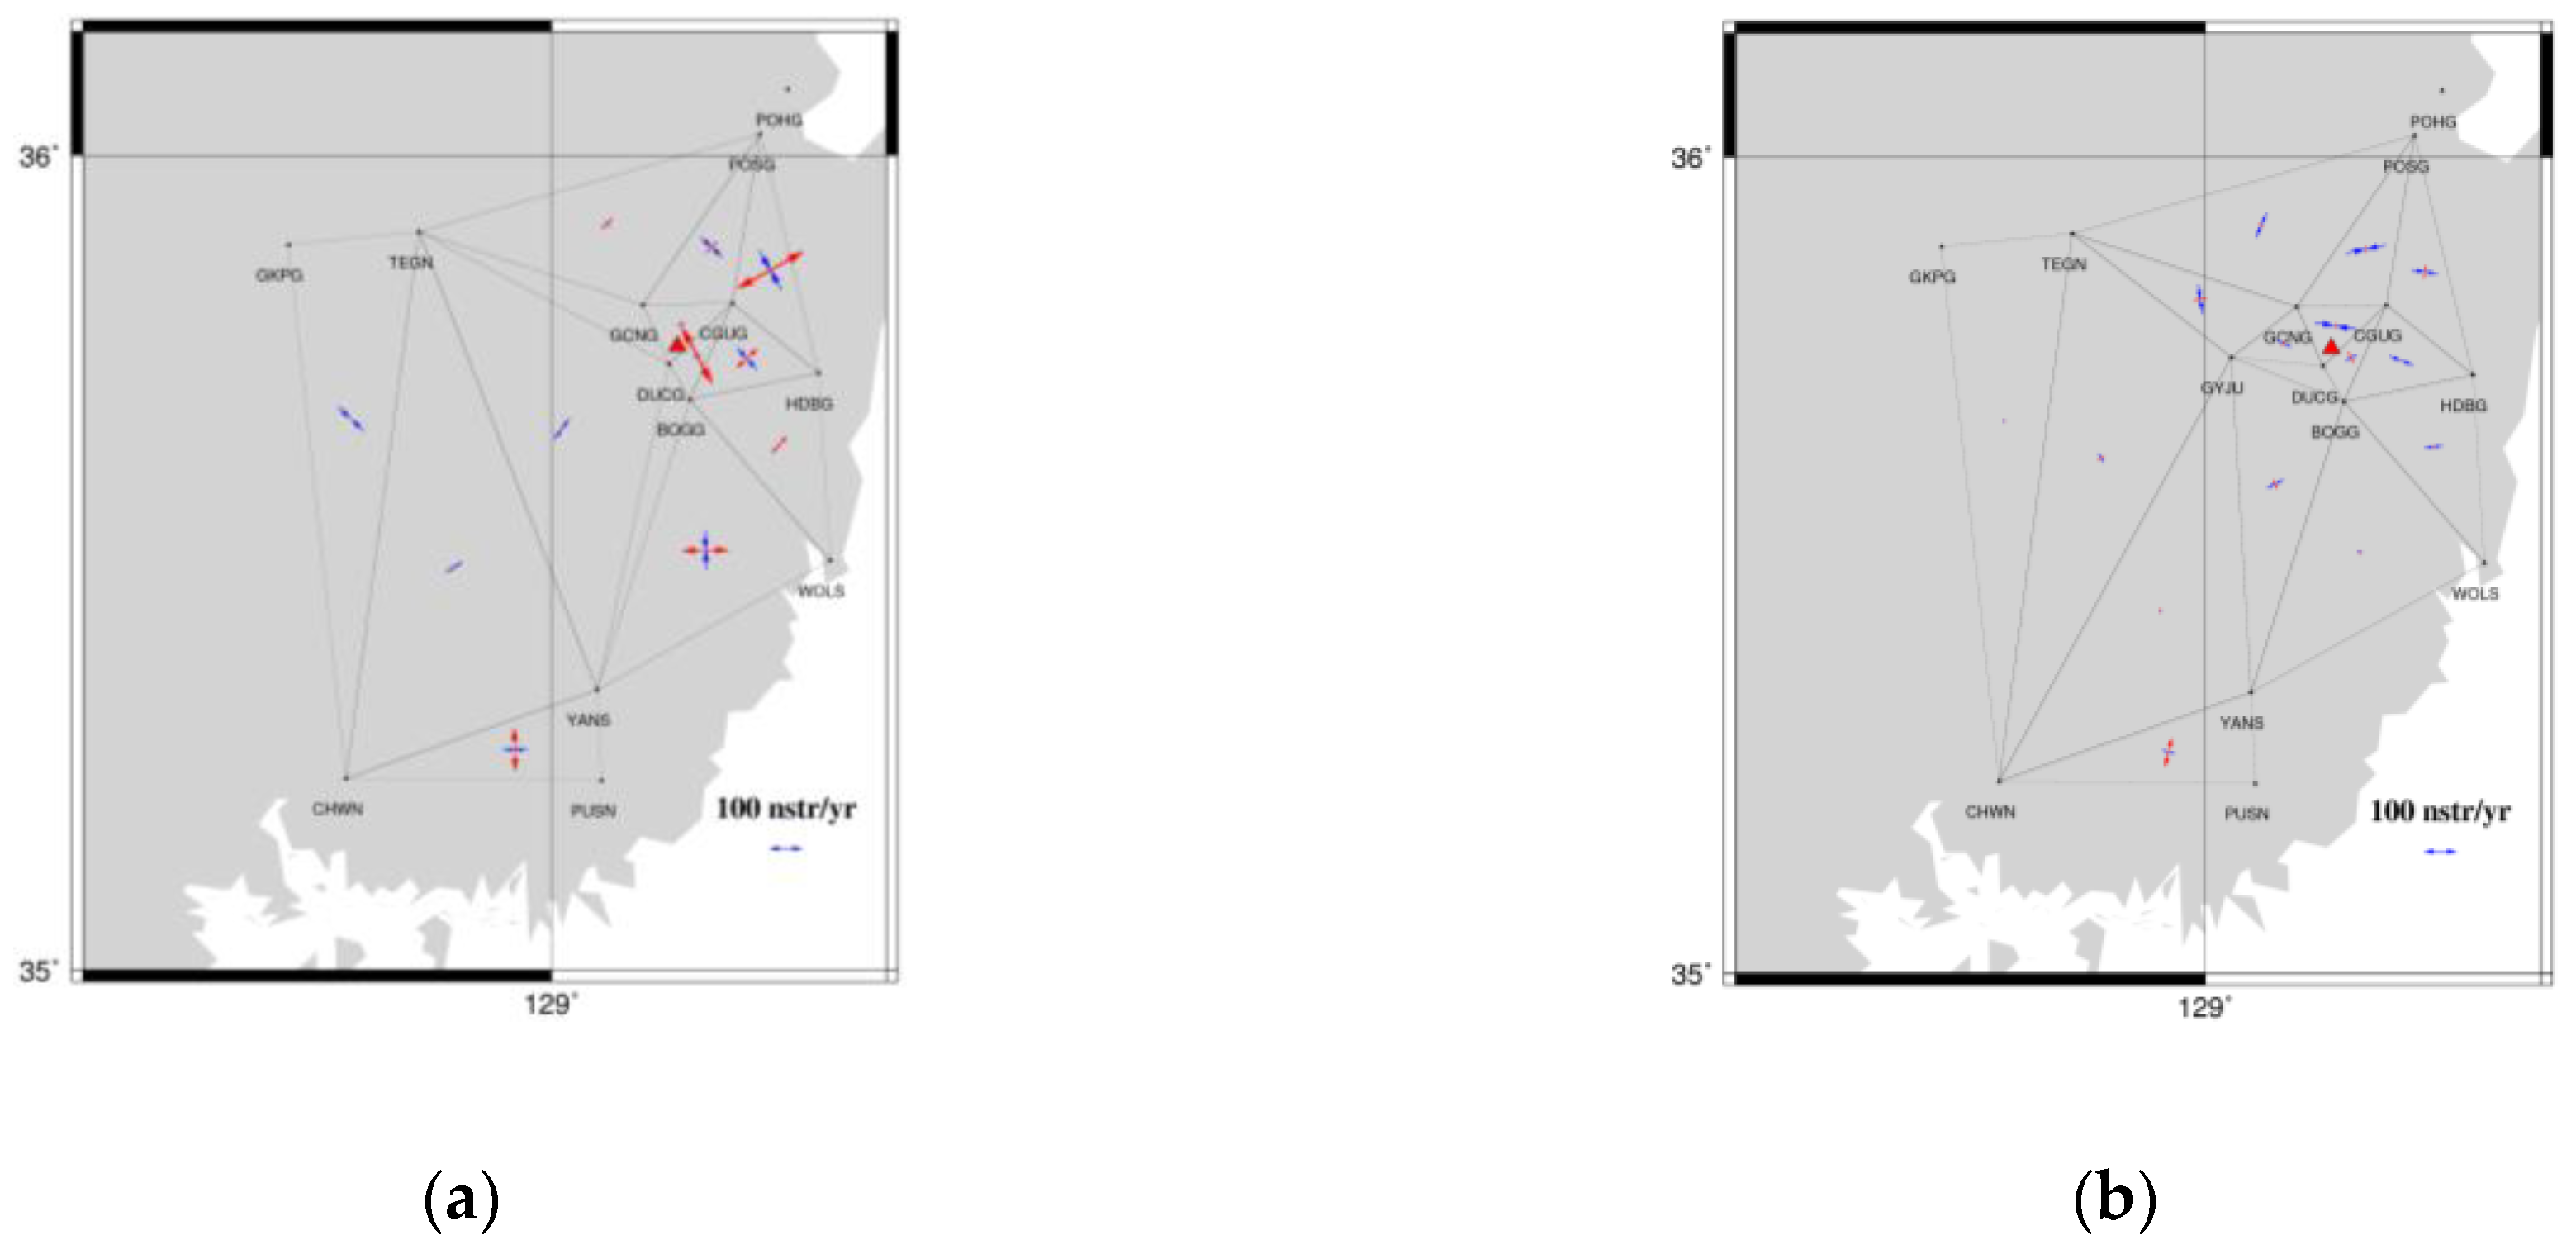
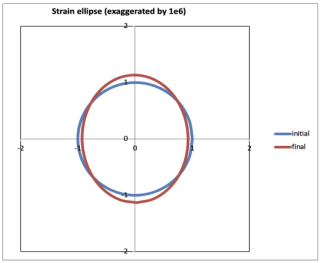
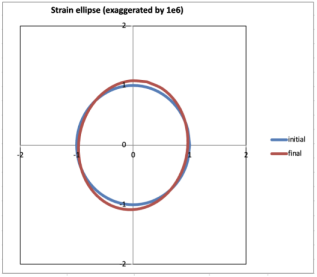
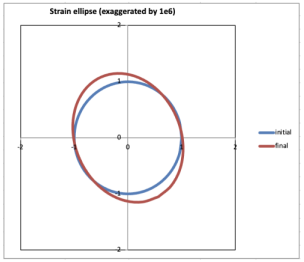
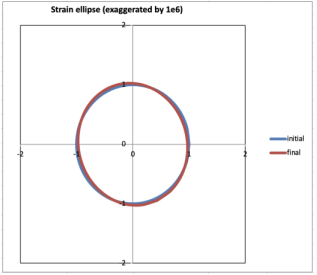
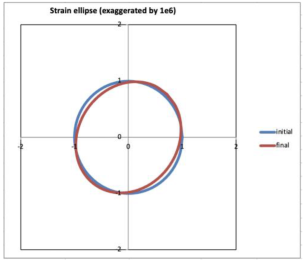
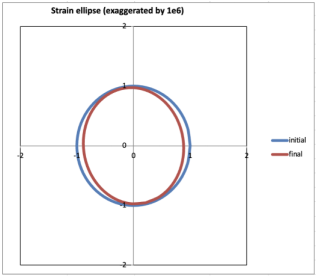
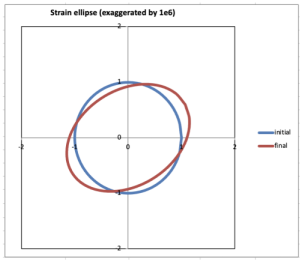
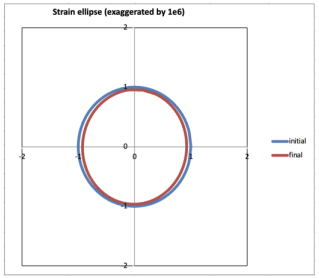
Figure 7 show the stress strain rate for each triangle network calculated for each period. Table 5 shows the calculated principal strain, maximum shear strain, and area strain of the triangle network. From 2018 to 2019, there is a total of four triangles with a maximum shear strain of 200 nstr or more in absolute sense. The triangle with a maximum shear strain is CGUG-HDBG-POSG with the magnitude of 356.5 nstr/year. In addition, the triangular network of BOGG-CGUG-DUCG shows the largest area strain with a scale of 167.2 nstr/year. On the contrary, there was no triangle with a maximum shear strain of 200 nstr or more in the result of 2020 to 2021, but the CGUG-DUCG-GCNG triangle was the largest at 140.2 nstr/year during this period. This triangular network (CGUG-DUCG-GCNG) includes the area where the Gyeongju earthquake, the largest earthquake since the instrumental earthquake, occurred on the Korean Peninsula. According to previous studies, after the Tohoku Earthquake occurred in 2011, the principal stress acting on the Korean Peninsula contracted in the north–south direction and expanded in the east–west direction [21]. Since then, the scale has decreased. Most of the results of this study showed that the stress strain becomes smaller during the period. During the period between 2018 and 2019, many expanding triangles were observed in the network, but the scale has decreased significantly afterwards. Thus, it can be concluded that the stress of the crust around the Yangsan Fault Zone decreases over time based on the results from 2018 to 2021, which might be evidence of a stable state (here, nano-strain is 10−9 mm/mm and symbolized as nstr).
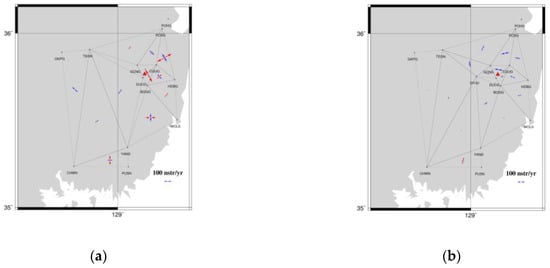
Figure 7.
(a) Stress strain of the triangular network in 2018–2019; (b) stress strain of the triangular network in 2020–2021. The red triangle represents the epicenter of the earthquake that occurred on 12 September 2016.

Table 5.
Stress strain by triangular network.
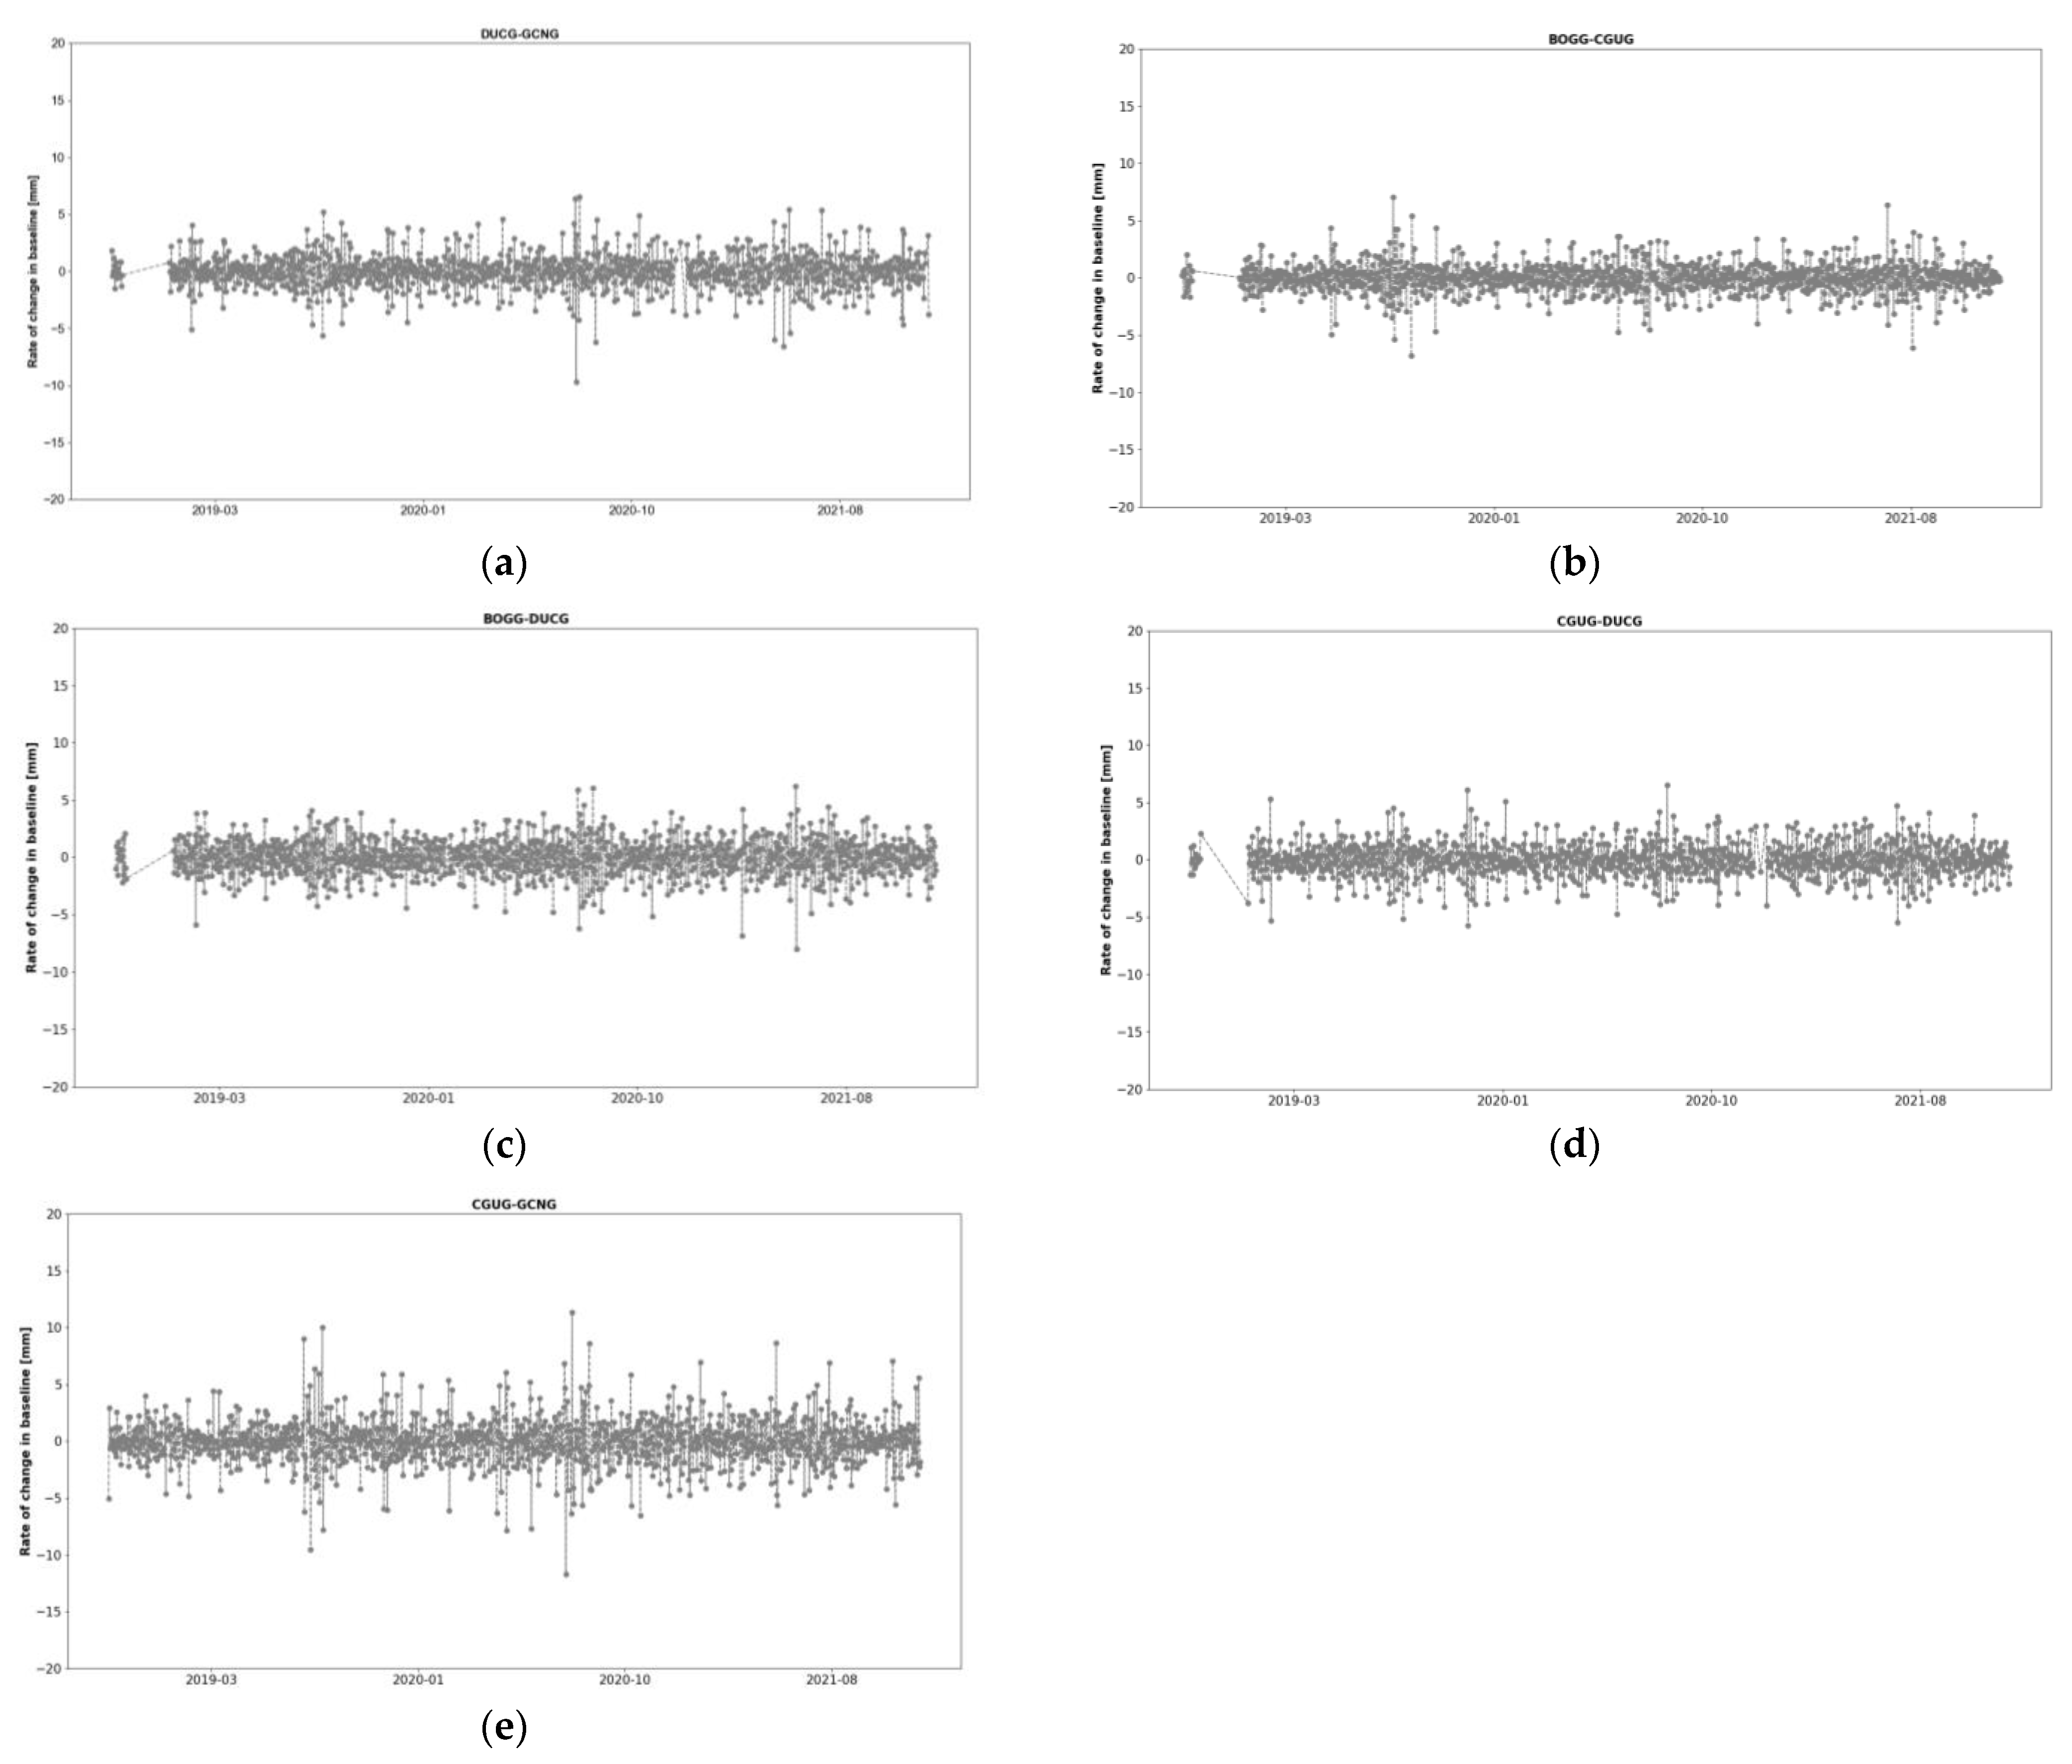
The triangular network with Cheongun (CGUG), Deokcheon (DUCG), and Bonggye (BOGG) as vertices has the maximum area strain, and an earthquake occurred in the CGUG-DUCG-GCNG triangle. In this study we computed a daily baseline between each station in the area with the largest stress strain and close to the earthquake epicenter. The rate of change in the baseline distance was calculated using the processed time series. Figure 8 shows the baseline change rate between stations based on the daily time series. As a result, the rate of change is negligible in its magnitude, reaching about ±2 mm in the range with no significant bias. From these results, it seems that there was no evident displacement or deformation in the surrounding area where the earthquake occurred.
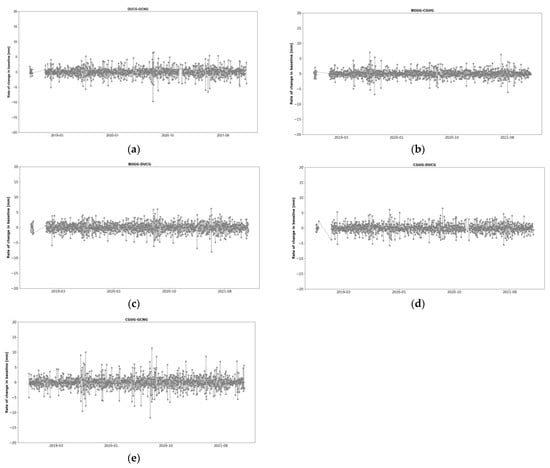
Figure 8.
Rate of change in baseline (a) DUCG-GCNG, (b) BOGG-CGUG, (c) BOGG-DUCG, (d) CGUG-DUCG, (e) CGUG-GCNG.
5. Conclusions
In this paper, we analyzed the crustal displacement and stress change for the purpose of confirming and monitoring the stabilization of the crustal movement of the Yangsan Fault, using observation data collected from 24 GNSS observation stations in Korea for about 3 years.
- Based on the results of this study, the Yangsan Fault Zone is moving about 30 mm per year to the southeast. This is like the annual movement of the Korean Peninsula. The period was subdivided to see trends the tectonic movement. When divided into two periods, both the magnitude and direction of crustal movement were similar for two sub-periods: between 2018 and 2019, and between 2020 and 2021. The stations on both sides, east and west, divided by the Yangsan Fault Zone, moved with similar scale and direction.
- Internal deformation was monitored to analyze the stability of the fault in more detail. As a result, most of the stations around the study area moved in the northwest direction with respect to GKPG at a very small magnitude, average of about 1.8 mm/year. Considering that all of them are very small and move in the same direction, it is judged that there is no clear distortion of the crust inside the Yangsan Fault. Since the scale is close to the average values of the Korean Peninsula, it is considered stable at the moment. However, the internal distortion is very important to understand the movement of the region, which should be further investigated in near future.
- The stress of the fault was computed through GNSS data. Based on the calculated stress, the scale of the east–west expansion during the period decreased over time. In addition, the stress strain of the area of interest is larger than that of surrounding triangular networks. However, based on the rate of change in the baseline distance, the area that is expected to have crustal deformation appears to be stable at present, which is additional evidence that the study area is in a stable state.
Due to the nature of crustal displacement, continuous research and monitoring through long-term data processing is necessary. In addition, further research is needed on the relationship of whether the fault is the primary reason for the earthquakes occurring in that region or not. The method proposed in this study can be applied to other zones in Korea to analyze the stress of the fault. It is also believed that the stress analysis is a beneficial source of data for earthquake prediction.
Author Contributions
Conceptualization, H.-U.K. and T.-S.B.; methodology, H.-U.K.; software, H.-U.K.; validation, H.-U.K. and T.-S.B.; formal analysis, H.-U.K.; investigation, H.-U.K.; resources, H.-U.K.; data curation, H.-U.K.; writing—original draft preparation, H.-U.K.; writing—review and editing, H.-U.K.; visualization, H.-U.K.; supervision, T.-S.B.; project administration, T.-S.B.; funding acquisition, T.-S.B. All authors have read and agreed to the published version of the manuscript.
Funding
This research was supported by a grant from National R&D Project “Development of ground-based centimeter-level maritime precise PNT technologies” funded by the Ministry of Oceans and Fisheries (1525012253).
Institutional Review Board Statement
Not applicable.
Informed Consent Statement
Not applicable.
Data Availability Statement
Not applicable.
Acknowledgments
The authors would like to thank the National Geographic Information Institute (NGII) of Korea for providing the observation data used in this experiment.
Conflicts of Interest
The authors declare no conflict of interest.
Appendix A
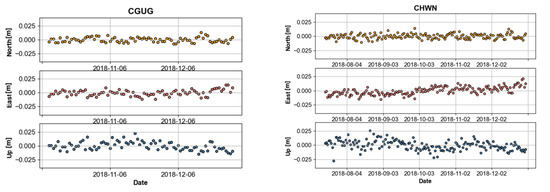
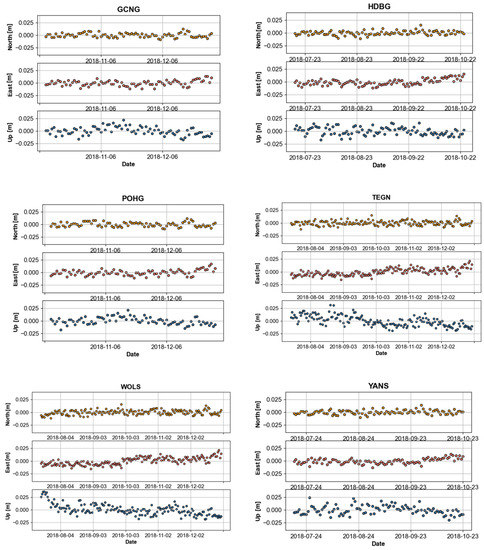
Figure A1.
Time series GNSS Station in 2018.
Figure A1.
Time series GNSS Station in 2018.
Appendix B
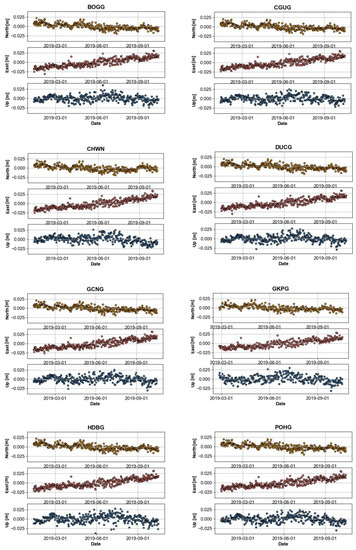
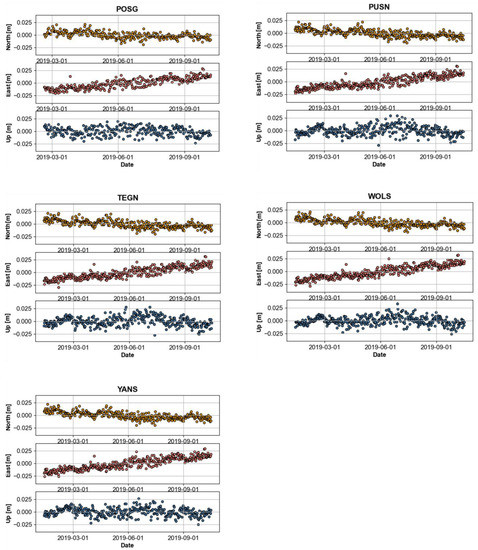
Figure A2.
Time series GNSS Station in 2019.
Figure A2.
Time series GNSS Station in 2019.
Appendix C
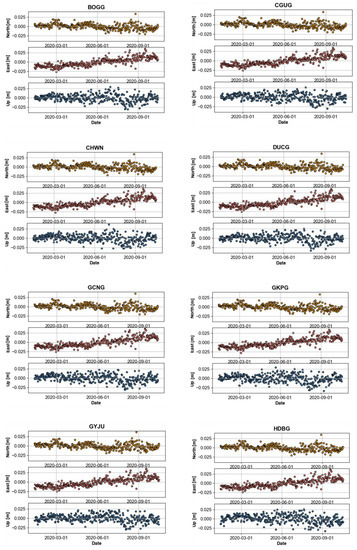
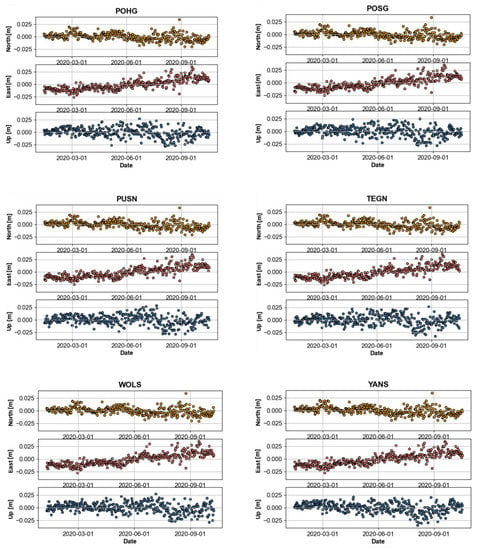
Figure A3.
Time series GNSS Station in 2020.
Figure A3.
Time series GNSS Station in 2020.
Appendix D
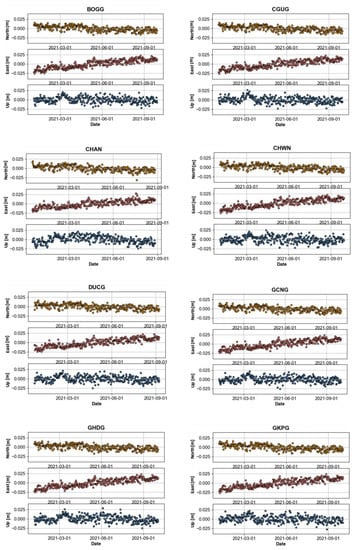
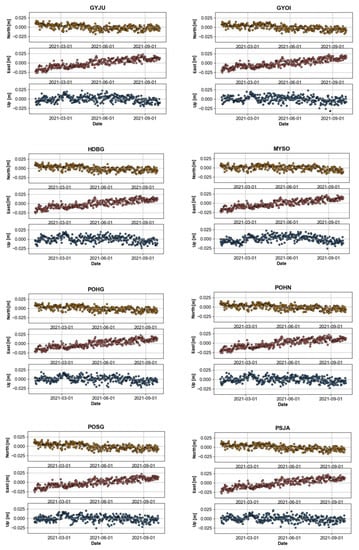
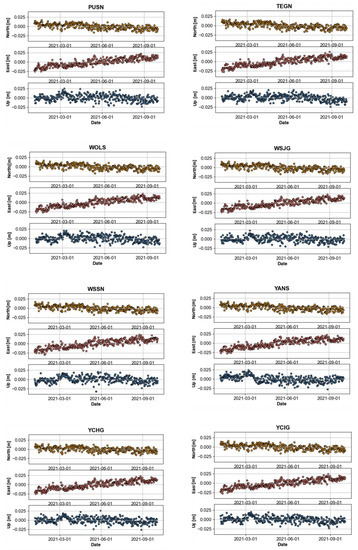
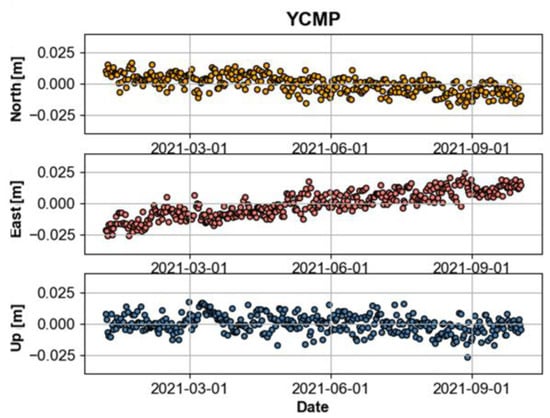
Figure A4.
Time series GNSS Station in 2021.
Figure A4.
Time series GNSS Station in 2021.
References
- Jun, M.-S.; Jun, J.-S. Focal mechanism in and around the Korean Peninsula. Korea Soc. Earth Explor. Geophys. 2021, 13, 198–202. [Google Scholar]
- Choi, S.-J.; Jeon, J.-S.; Choi, J.-H.; Kim, B.-K.; Ryoo, C.-R.; Hong, D.-G.; Chwah, U. Estimation of possible maximum earthquake magnitudes of Quaternary faults in the southern Korean Peninsula. Quat. Int. 2014, 344, 53–63. [Google Scholar] [CrossRef]
- Lee, J.; Rezaei, S.; Hong, Y.; Choi, J.-H.; Choi, J.-H.; Choi, W.-H.; Rhee, K.-W.; Kim, Y.-S. Quaternary fault analysis through a trench investigation on the northern extension of the Yangsan fault at Dangu-ri, Gyungju-si, Gyeongsanbuk-do. J. Geol. Soc. Korea 2015, 51, 471–485. [Google Scholar] [CrossRef]
- Kim, M.-C.; Jung, S.; Yoon, S.; Jeong, R.-Y.; Song, C.-W.; Son, M. Neotectonic crustal deformation and current stress field in the Korean Peninsula and their tectonic implications: A review. J. Petrol. Soc. Korea 2016, 25, 169–193. [Google Scholar] [CrossRef]
- Jeon, Y.S.; Park, E.H.; Lee, D.K. 9.12 Earthquake Response Report; Korea Meteorological Administration: Seoul, Republic of Korea, 2017; 139p. [Google Scholar]
- Son, M.; Cho, C.-S.; Shin, J.-S.; Rhee, H.-M.; Sheen, D.-H. Spatiotemporal distribution of events during the First Three Months of the 2016 Gyeongju, Korea, Earthquake Sequence. Bull. Seismol. Soc. Am. 2018, 108, 210–217. [Google Scholar] [CrossRef]
- Hollenstein, C.; Müller, M.D.; Geiger, A.; Kahle, H.G. Crustal motion and deformation in Greece from a decade of GPS measurements, 1993–2003. Tectonophysics 2008, 449, 17–40. [Google Scholar] [CrossRef]
- Lazos, I.; Sboras, S.; Chousianitis, K.; Kondopoulou, D.; Pikridas, C.; Bitharis, S.; Pavlides, S. Temporal evolution of crustal rotation in the Aegean region based on primary geodetically-derived results and palaeomagnetism. Acta Geod. Et Geophys. 2022, 57, 317–334. [Google Scholar] [CrossRef]
- Müller, M.D.; Geiger, A.; Kahle, H.G.; Veis, G.; Billiris, H.; Paradissis, D.; Felekis, S. Velocity and deformation fields in the North Aegean domain, Greece, and implications for fault kinematics, derived from GPS data 1993–2009. Tectonophysics 2013, 597, 34–49. [Google Scholar] [CrossRef]
- Nyst, M.; Thatcher, W. New constraints on the active tectonic deformation of the Aegean. J. Geophys. Res. Solid Earth 2004, 109. [Google Scholar] [CrossRef]
- Wilkinson, M.W.; McCaffrey, K.J.; Jones, R.R.; Roberts, G.P.; Holdsworth, R.E.; Gregory, L.C.; Iezzi, F. Near-field fault slip of the 2016 Vettore Mw 6.6 earthquake (Central Italy) measured using low-cost GNSS. Sci. Rep. 2017, 7, 4612. [Google Scholar] [CrossRef] [PubMed]
- Choi, S.-J.; Ghim, Y.-S.; Cheon, Y.; Ko, K. The first discovery of Quaternary fault in the Western part of the South Yangsan fault-Sinwoo site. Econ. Environ. Geol. 2019, 52, 251–258. [Google Scholar]
- Oh, J.-S.; Kim, D.-E. Lineament extraction and its comparison using DEMs based on LiDAR, digital topographic map, and aerial photo in the central segment of Yangsan Fault. J. Korean Geogr. Soc. 2019, 54, 507–525. [Google Scholar]
- Langbein, J.; Bock, Y. High-rate real-time GPS network at Parkfield: Utility for detecting fault slip and seismic displacements. Geophys. Res. Lett. 2014, 31. [Google Scholar] [CrossRef]
- Barrile, V.; Meduri, G.M.; Bilotta, G. Monitoring and GPS controls, over time, of the active fault in Castrovillari. In Proceedings of the 7th International Conference on Environmental and Geological Science and Engineering (Eg’14), Salerno, Italy, 3–5 June 2014; pp. 169–175. [Google Scholar]
- Langbein, J.; Murray, J.R.; Snyder, H.A. Coseismic and initial postseismic deformation from the 2004 Parkfield, California, earthquake, observed by Global Positioning System, electronic distance meter, creepmeters, and borehole strainmeters. Bull. Seismol. Soc. Am. 2006, 96, S304–S320. [Google Scholar] [CrossRef]
- Ozawa, S.; Nishimura, T.; Munekane, H.; Suito, H.; Kobayashi, T.; Tobita, M.; Imakiire, T. Preceding, coseismic, and postseismic slips of the 2011 Tohoku earthquake. J. Geophys. Res. 2012, 117, B7. [Google Scholar]
- Kim, Y.-S.; Jin, K.-M.; Choi, W.-H. Understanding of active faults: A review for recent researches. J. Geol. Soc. Korea 2011, 47, 723–752. [Google Scholar]
- Kim, H.-U.; Hwang, E.-H.; Lee, H.-S.; Lee, D.-K. A study on the analysis of crust deformation on the Korean Peninsula after the Tohoku Earthquake using GNSS observation. J. Korean Soc. Surv. Geod. Photogramm. Cartogr. 2020, 38, 689–696. [Google Scholar]
- Kim, S.-K. Establishing a Dynamic National Geodetic Reference Frame considering Discontinuity of Crustal Movement. Master’s Thesis, Sejong University, Seoul, Republic of Korea, 2013. [Google Scholar]
- Kim, D.-S. Geodetic Studies of Post-Seismic Crustal Deformations Occurring in the Southern Korean Peninsula due to the Tohoku-oki Earthquake. Ph.D. Thesis, Inha University, Incheon, Republic of Korea, 2015. [Google Scholar]
Disclaimer/Publisher’s Note: The statements, opinions and data contained in all publications are solely those of the individual author(s) and contributor(s) and not of MDPI and/or the editor(s). MDPI and/or the editor(s) disclaim responsibility for any injury to people or property resulting from any ideas, methods, instructions or products referred to in the content. |
© 2023 by the authors. Licensee MDPI, Basel, Switzerland. This article is an open access article distributed under the terms and conditions of the Creative Commons Attribution (CC BY) license (https://creativecommons.org/licenses/by/4.0/).

