
Monitoring of Possible Activities of Yangsan Fault Zone Using GNSS


Abstract
:1. Introduction
2. Materials
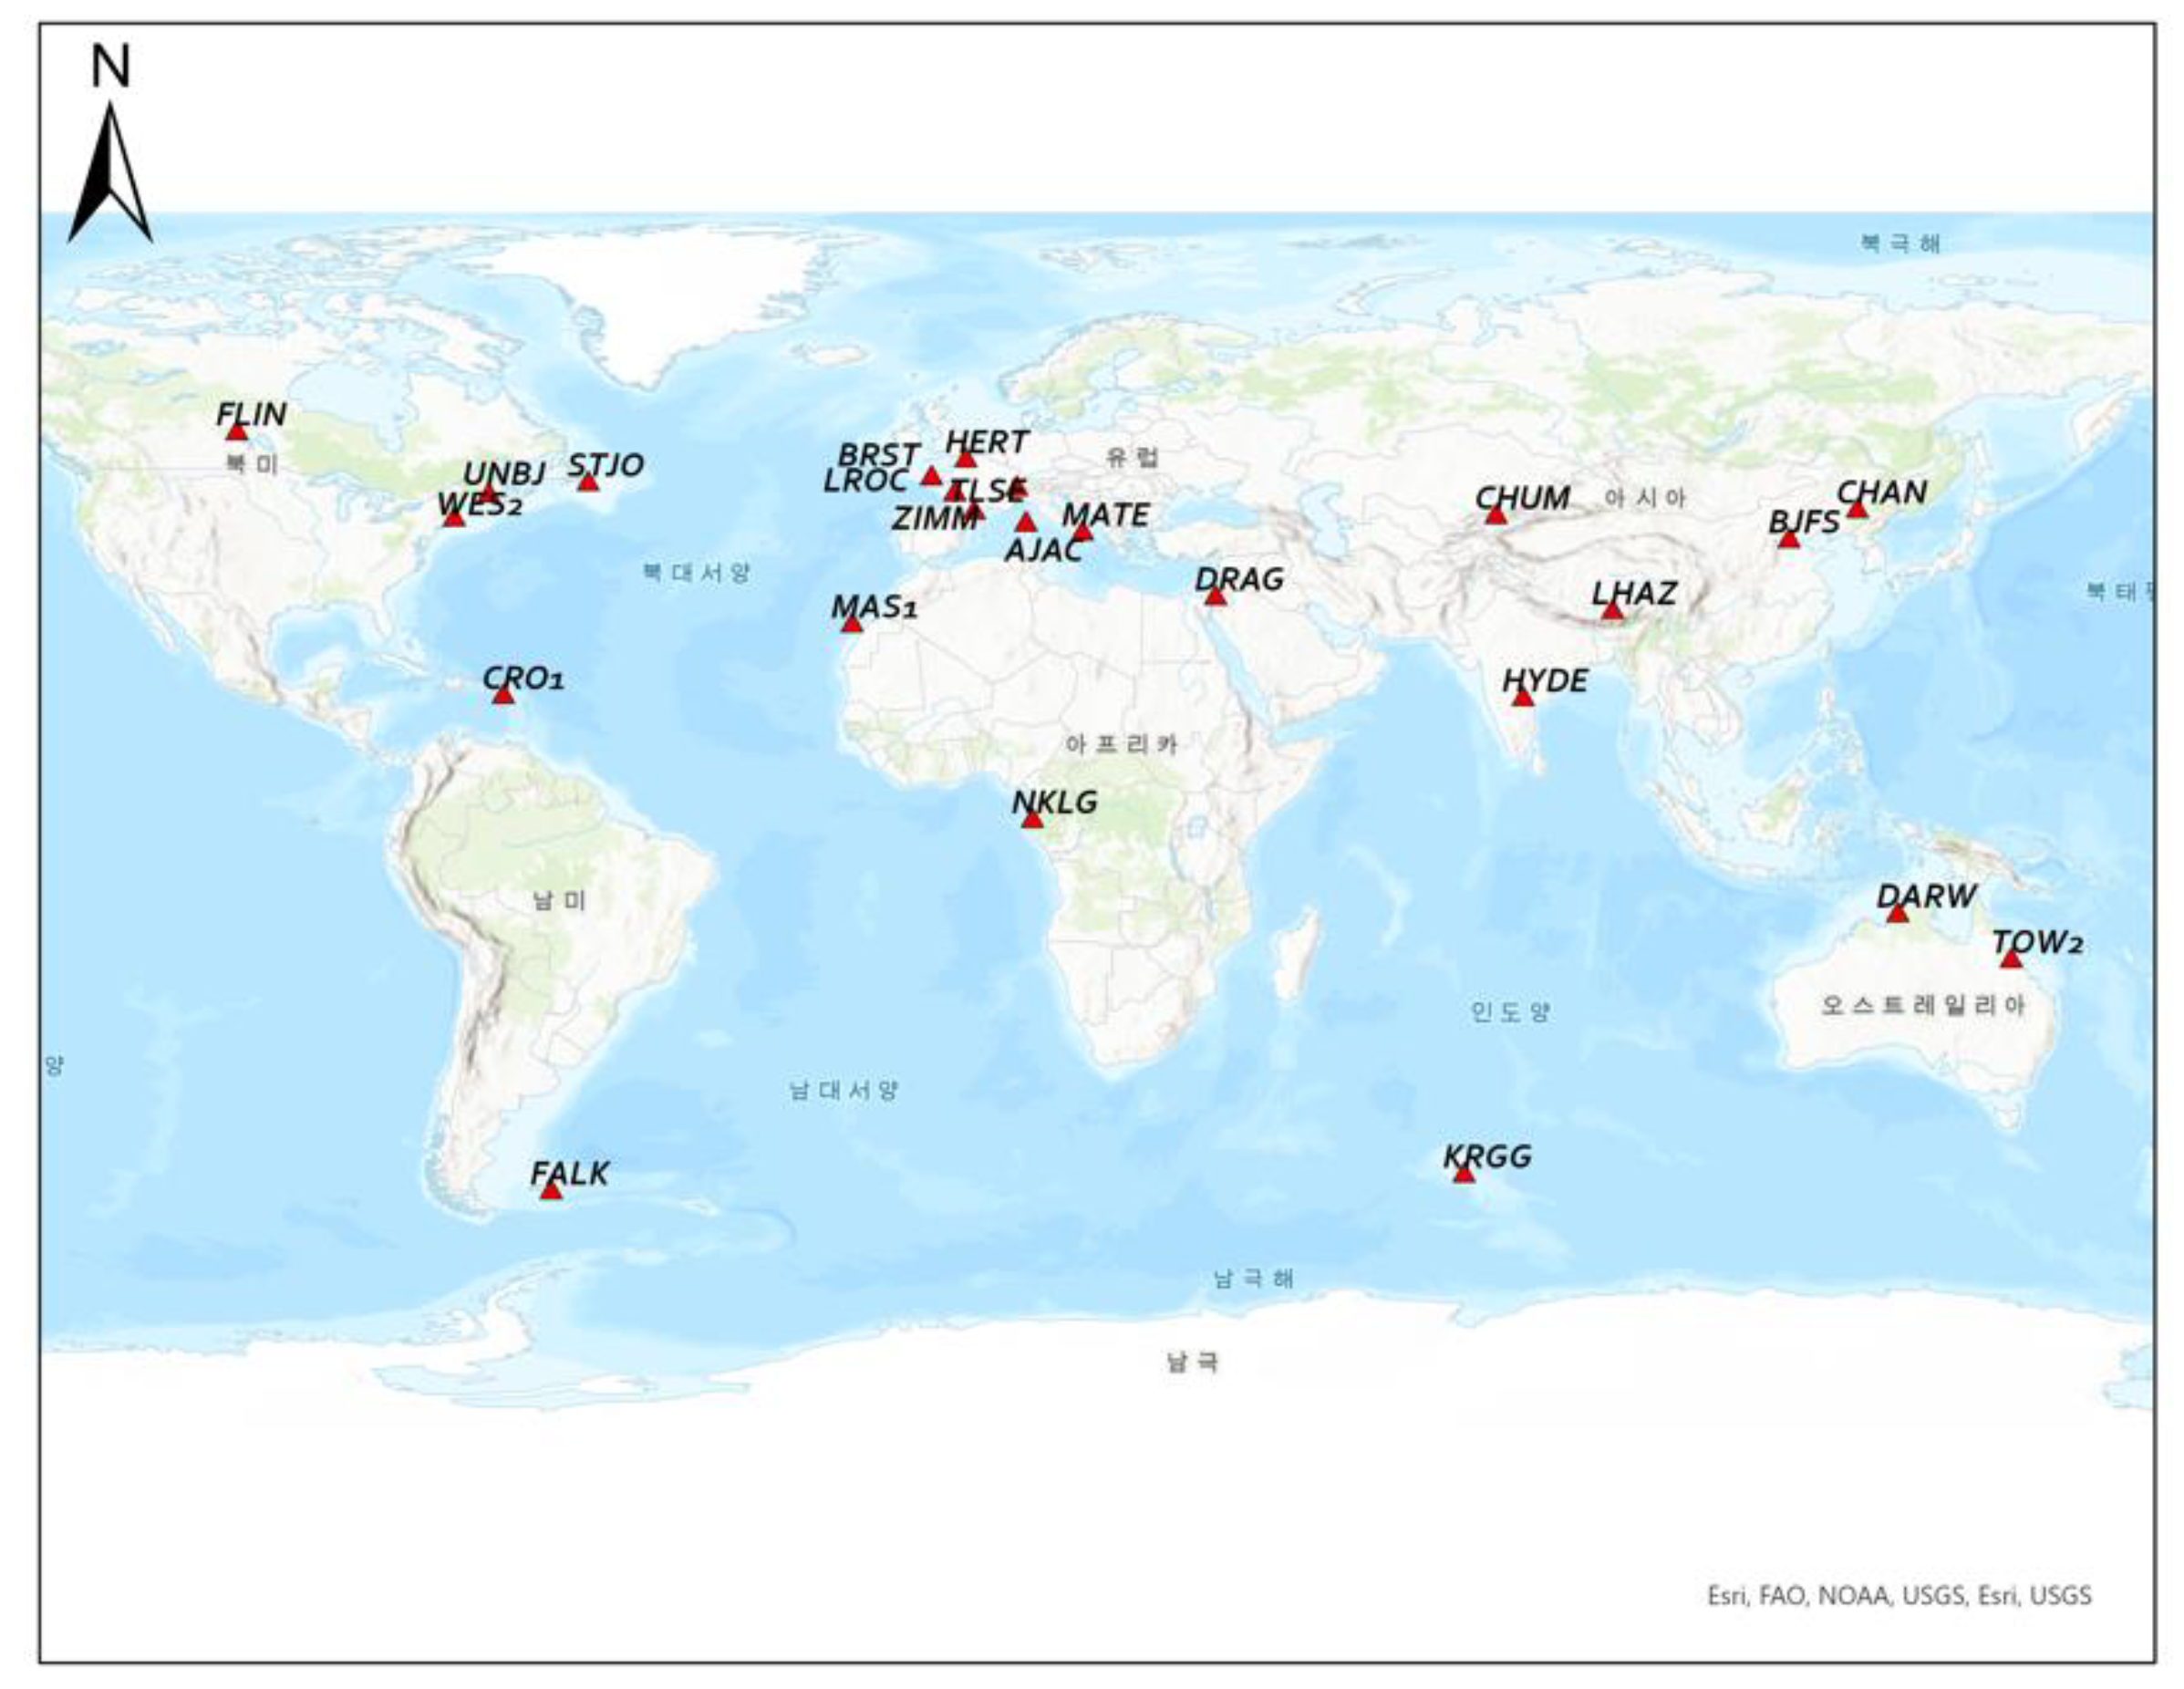
2.1. GNSS Data
2.2. Data Processing Software
3. Methodology
4. Results—Discussion
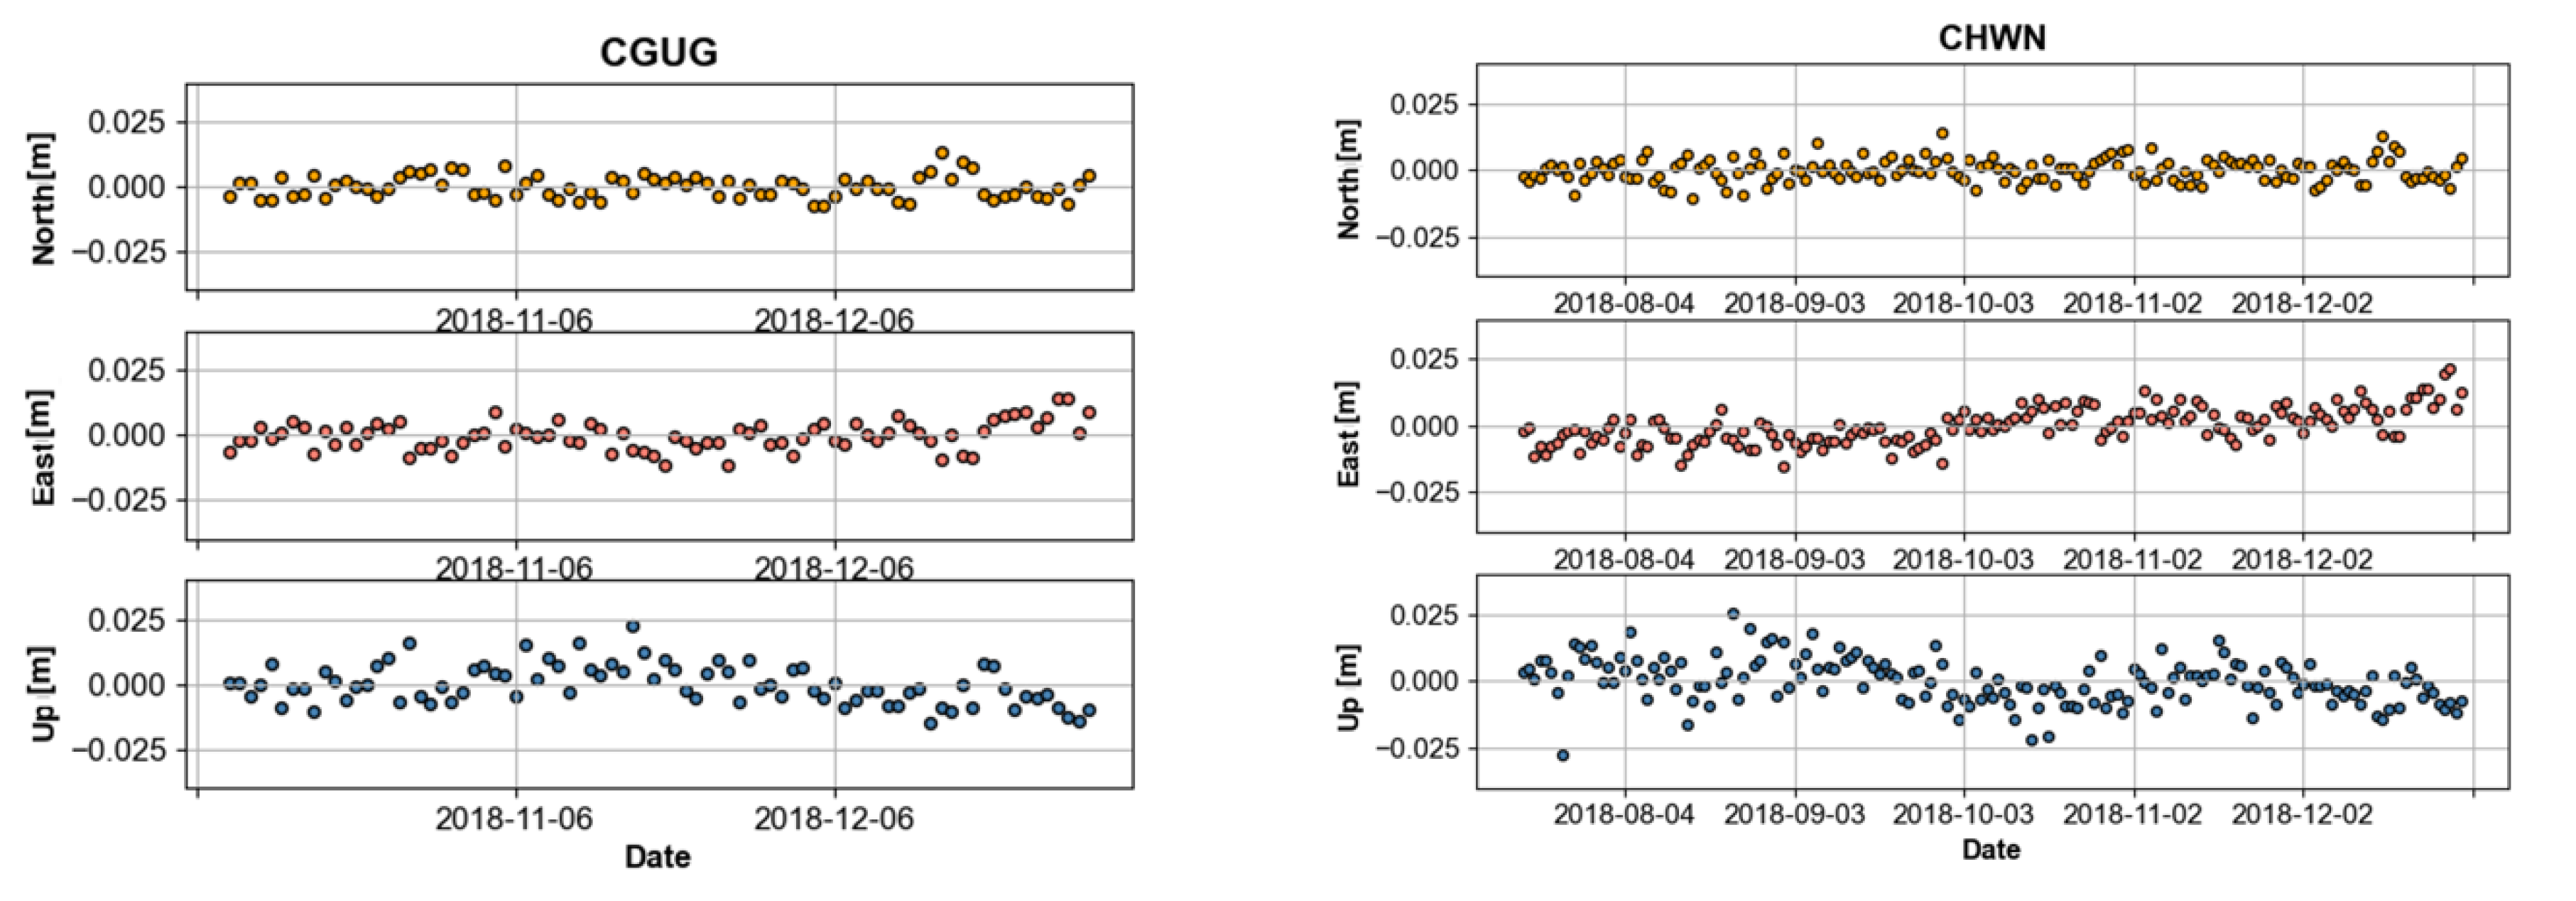
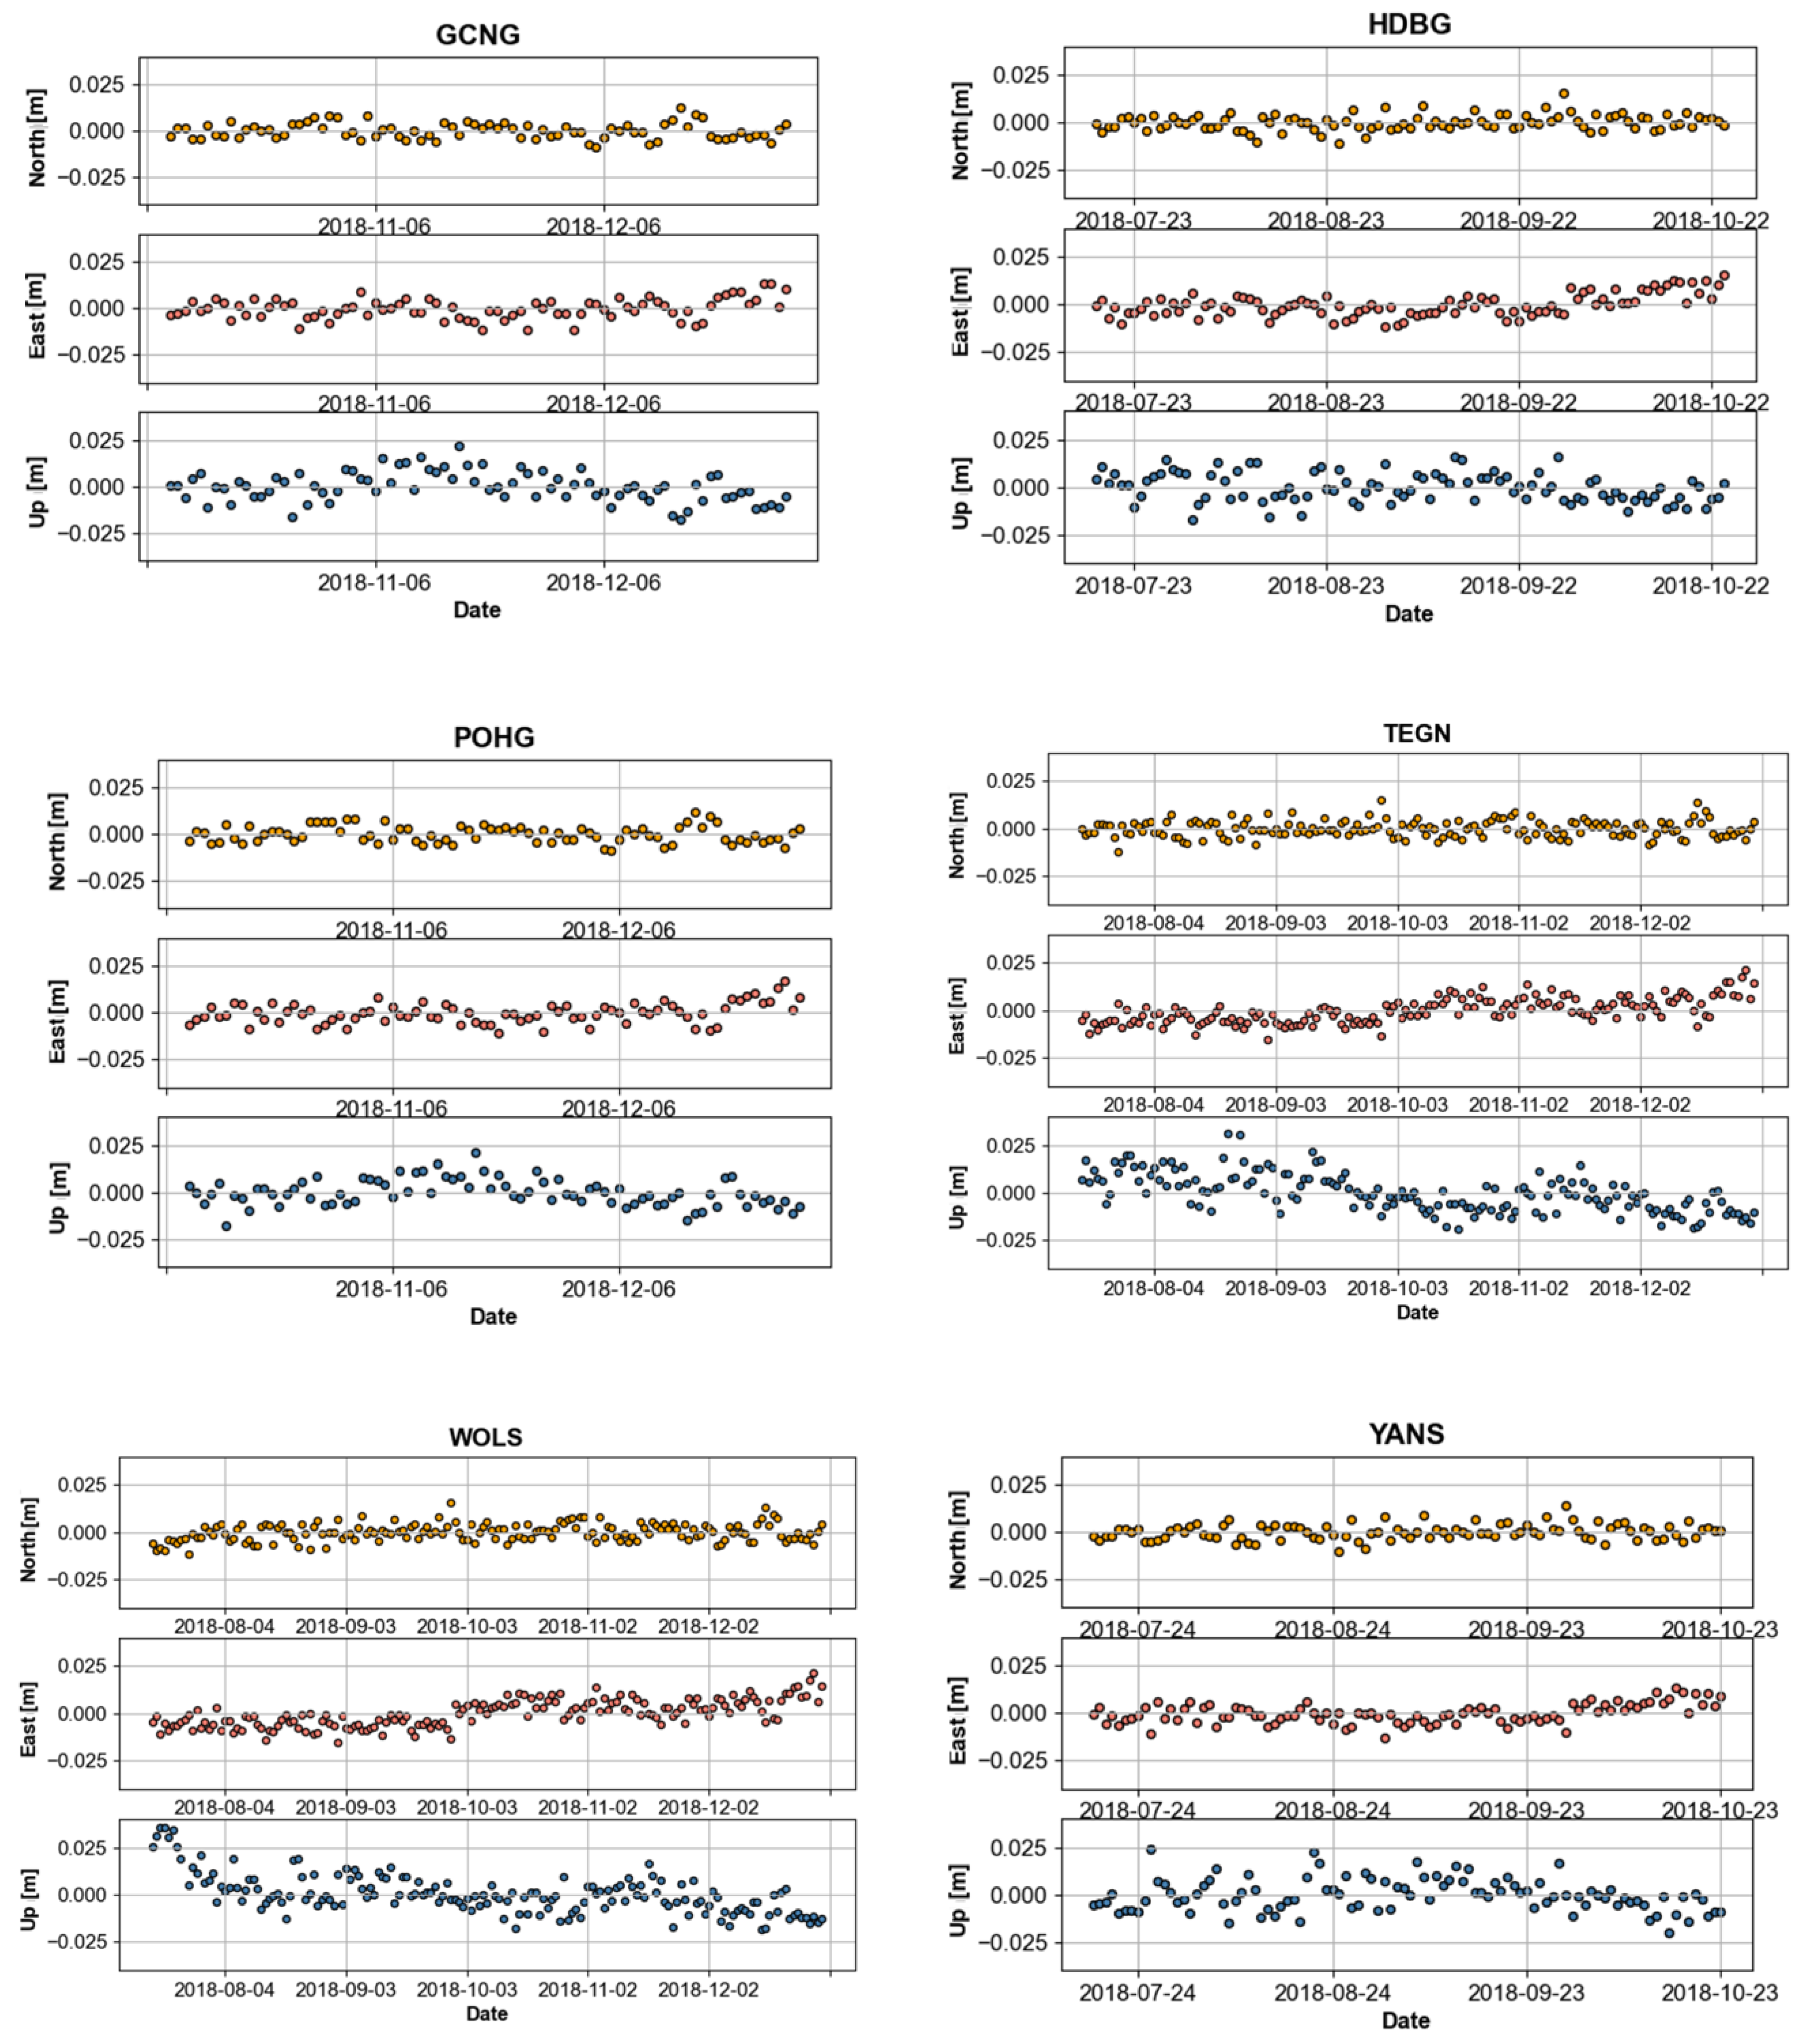
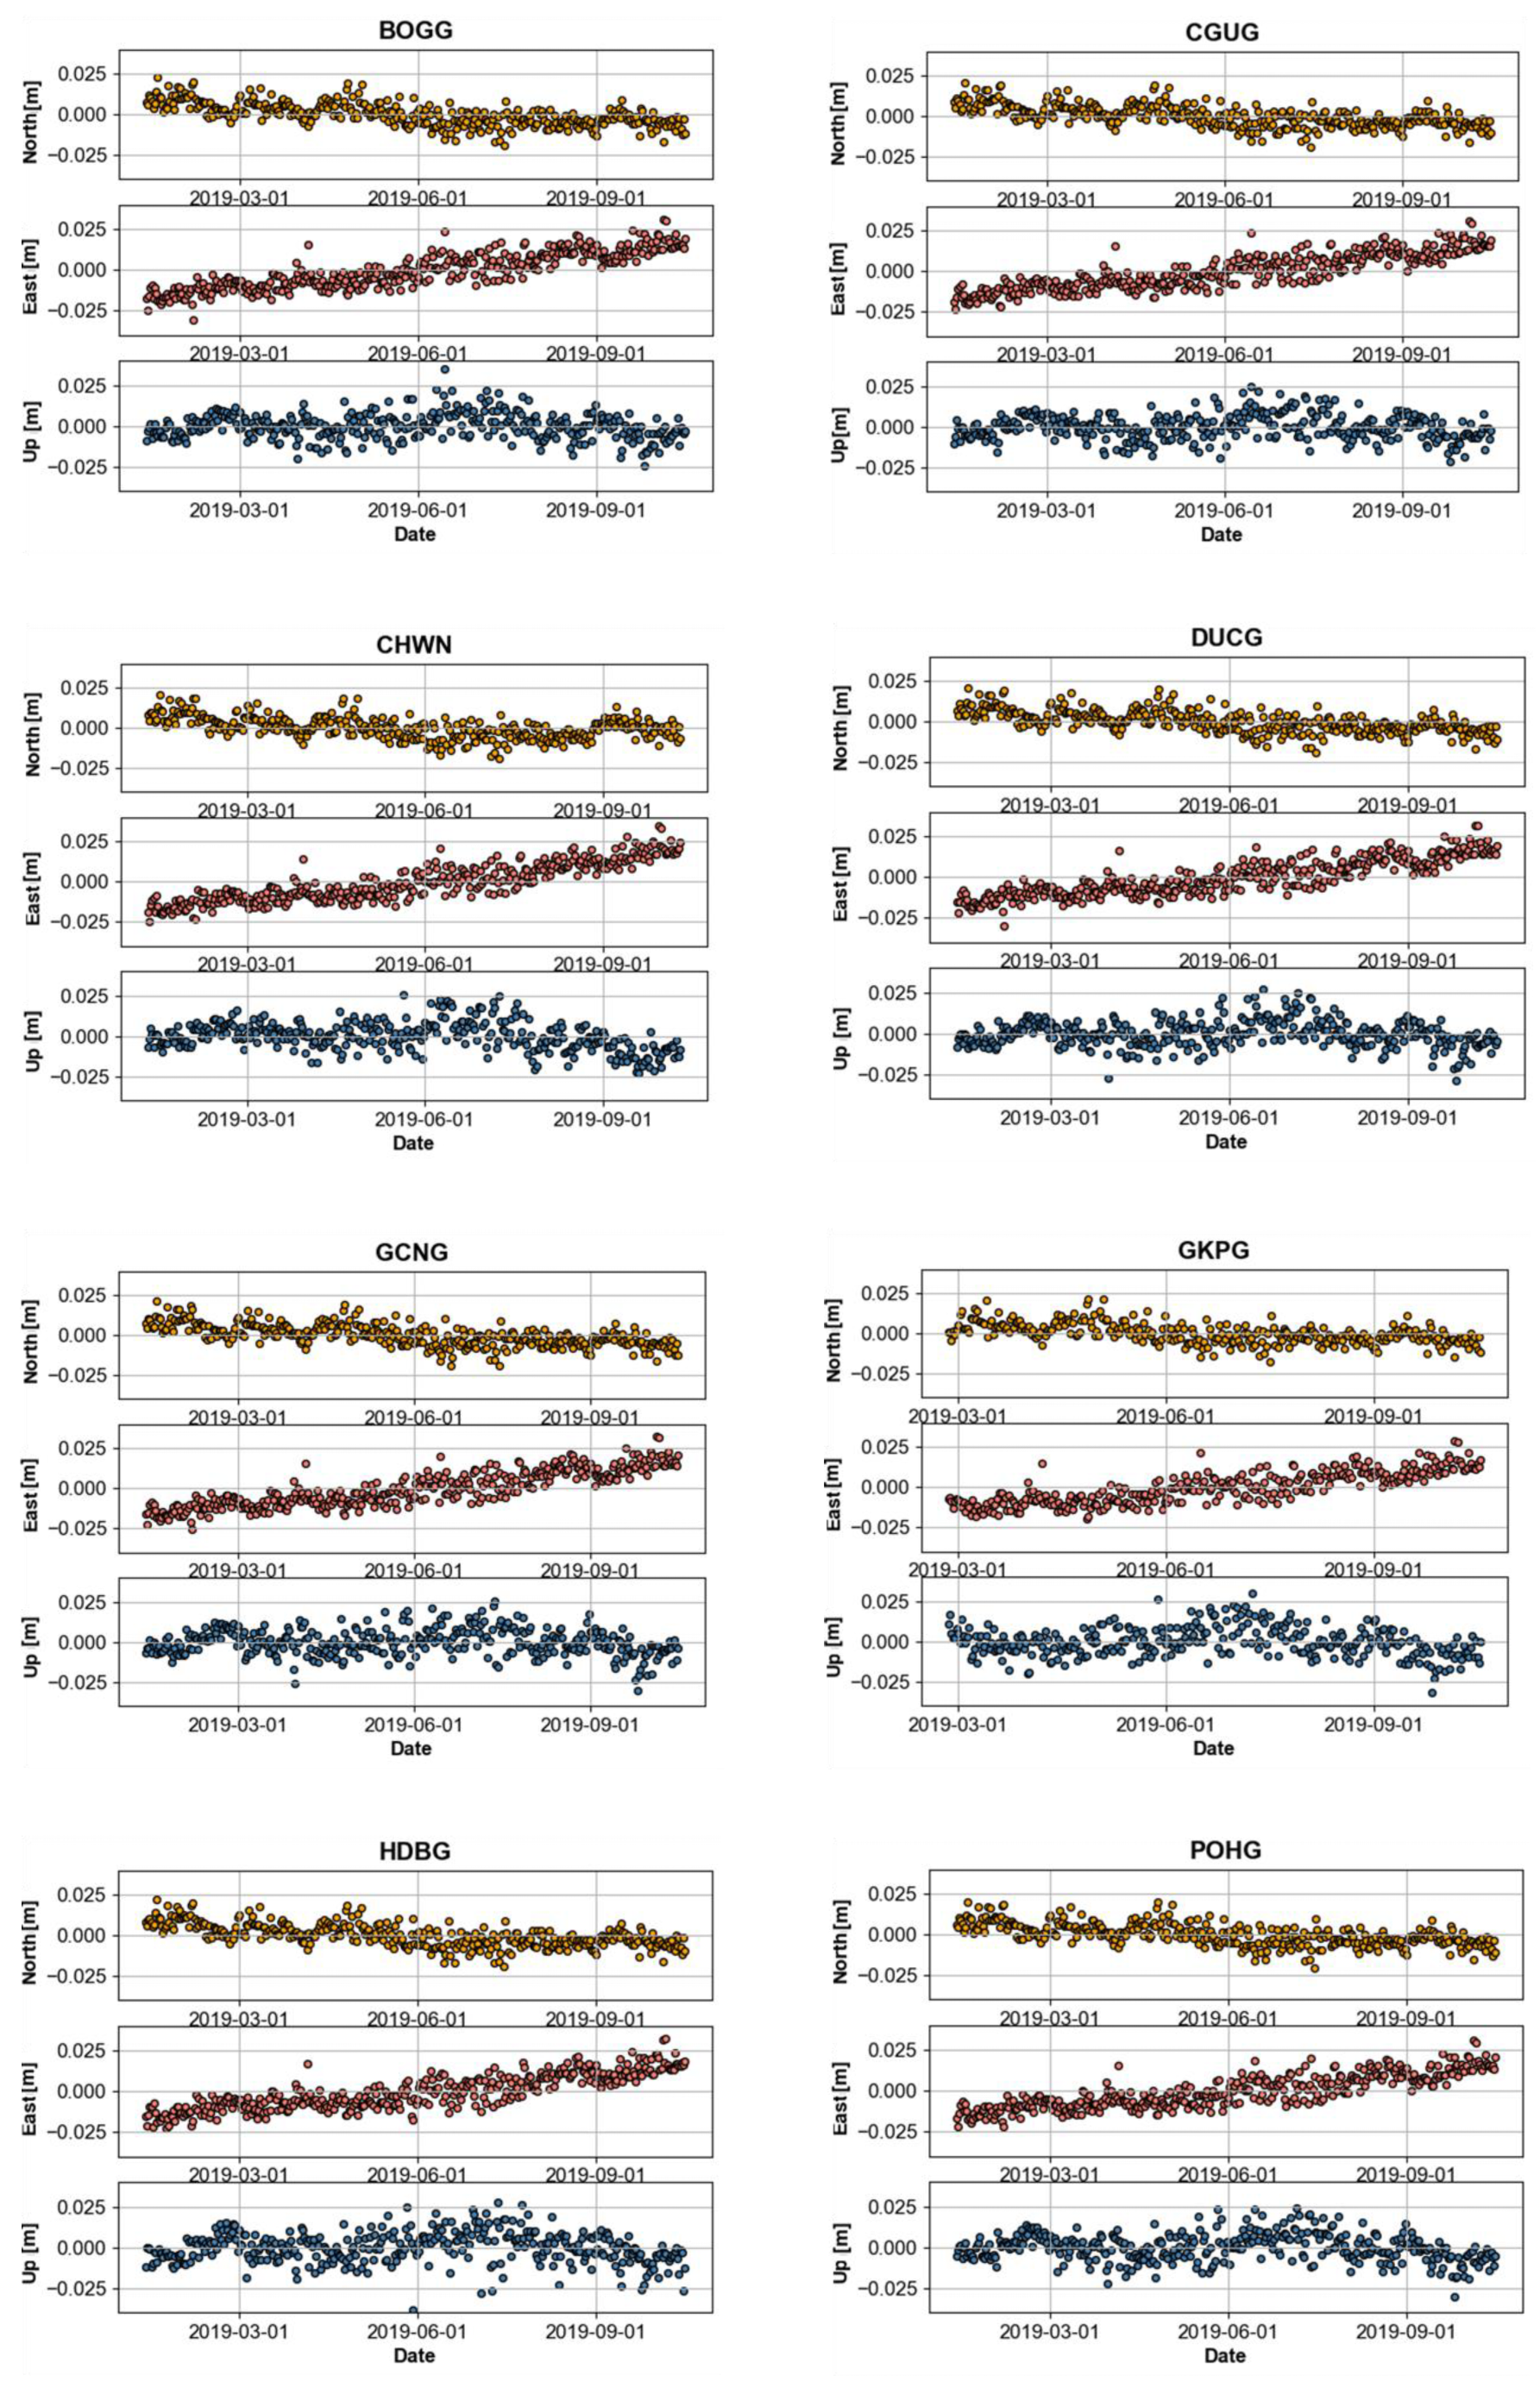
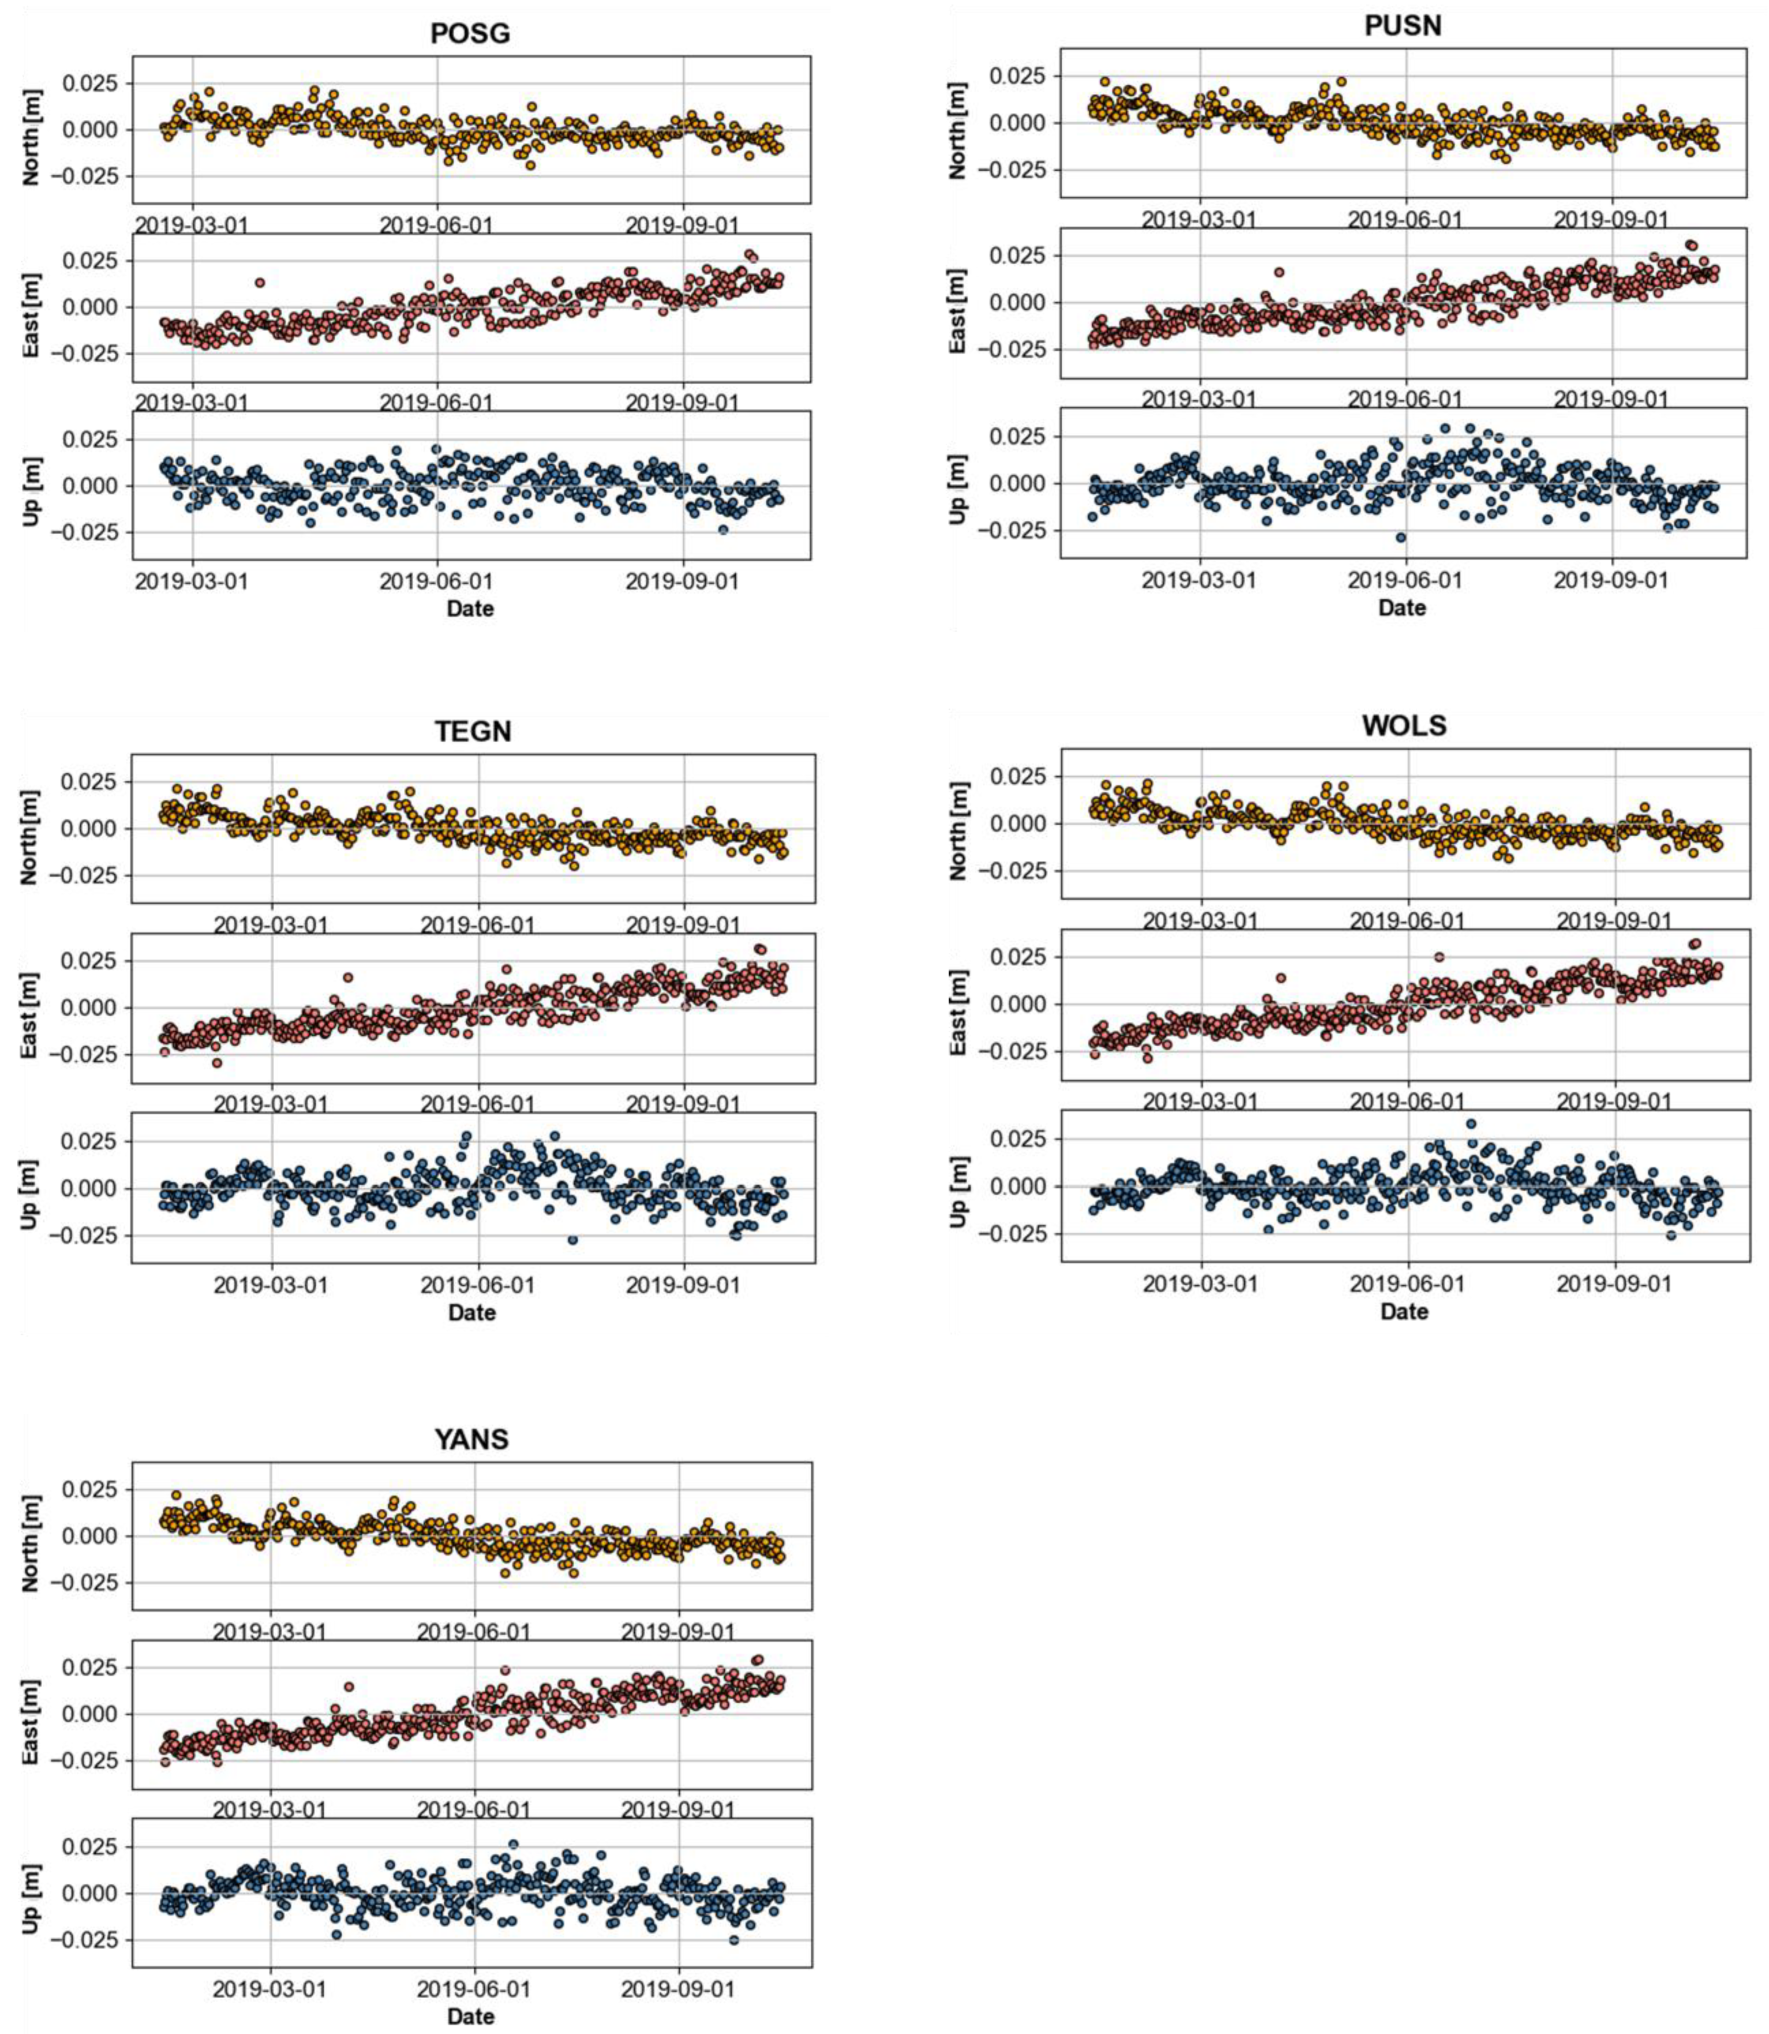
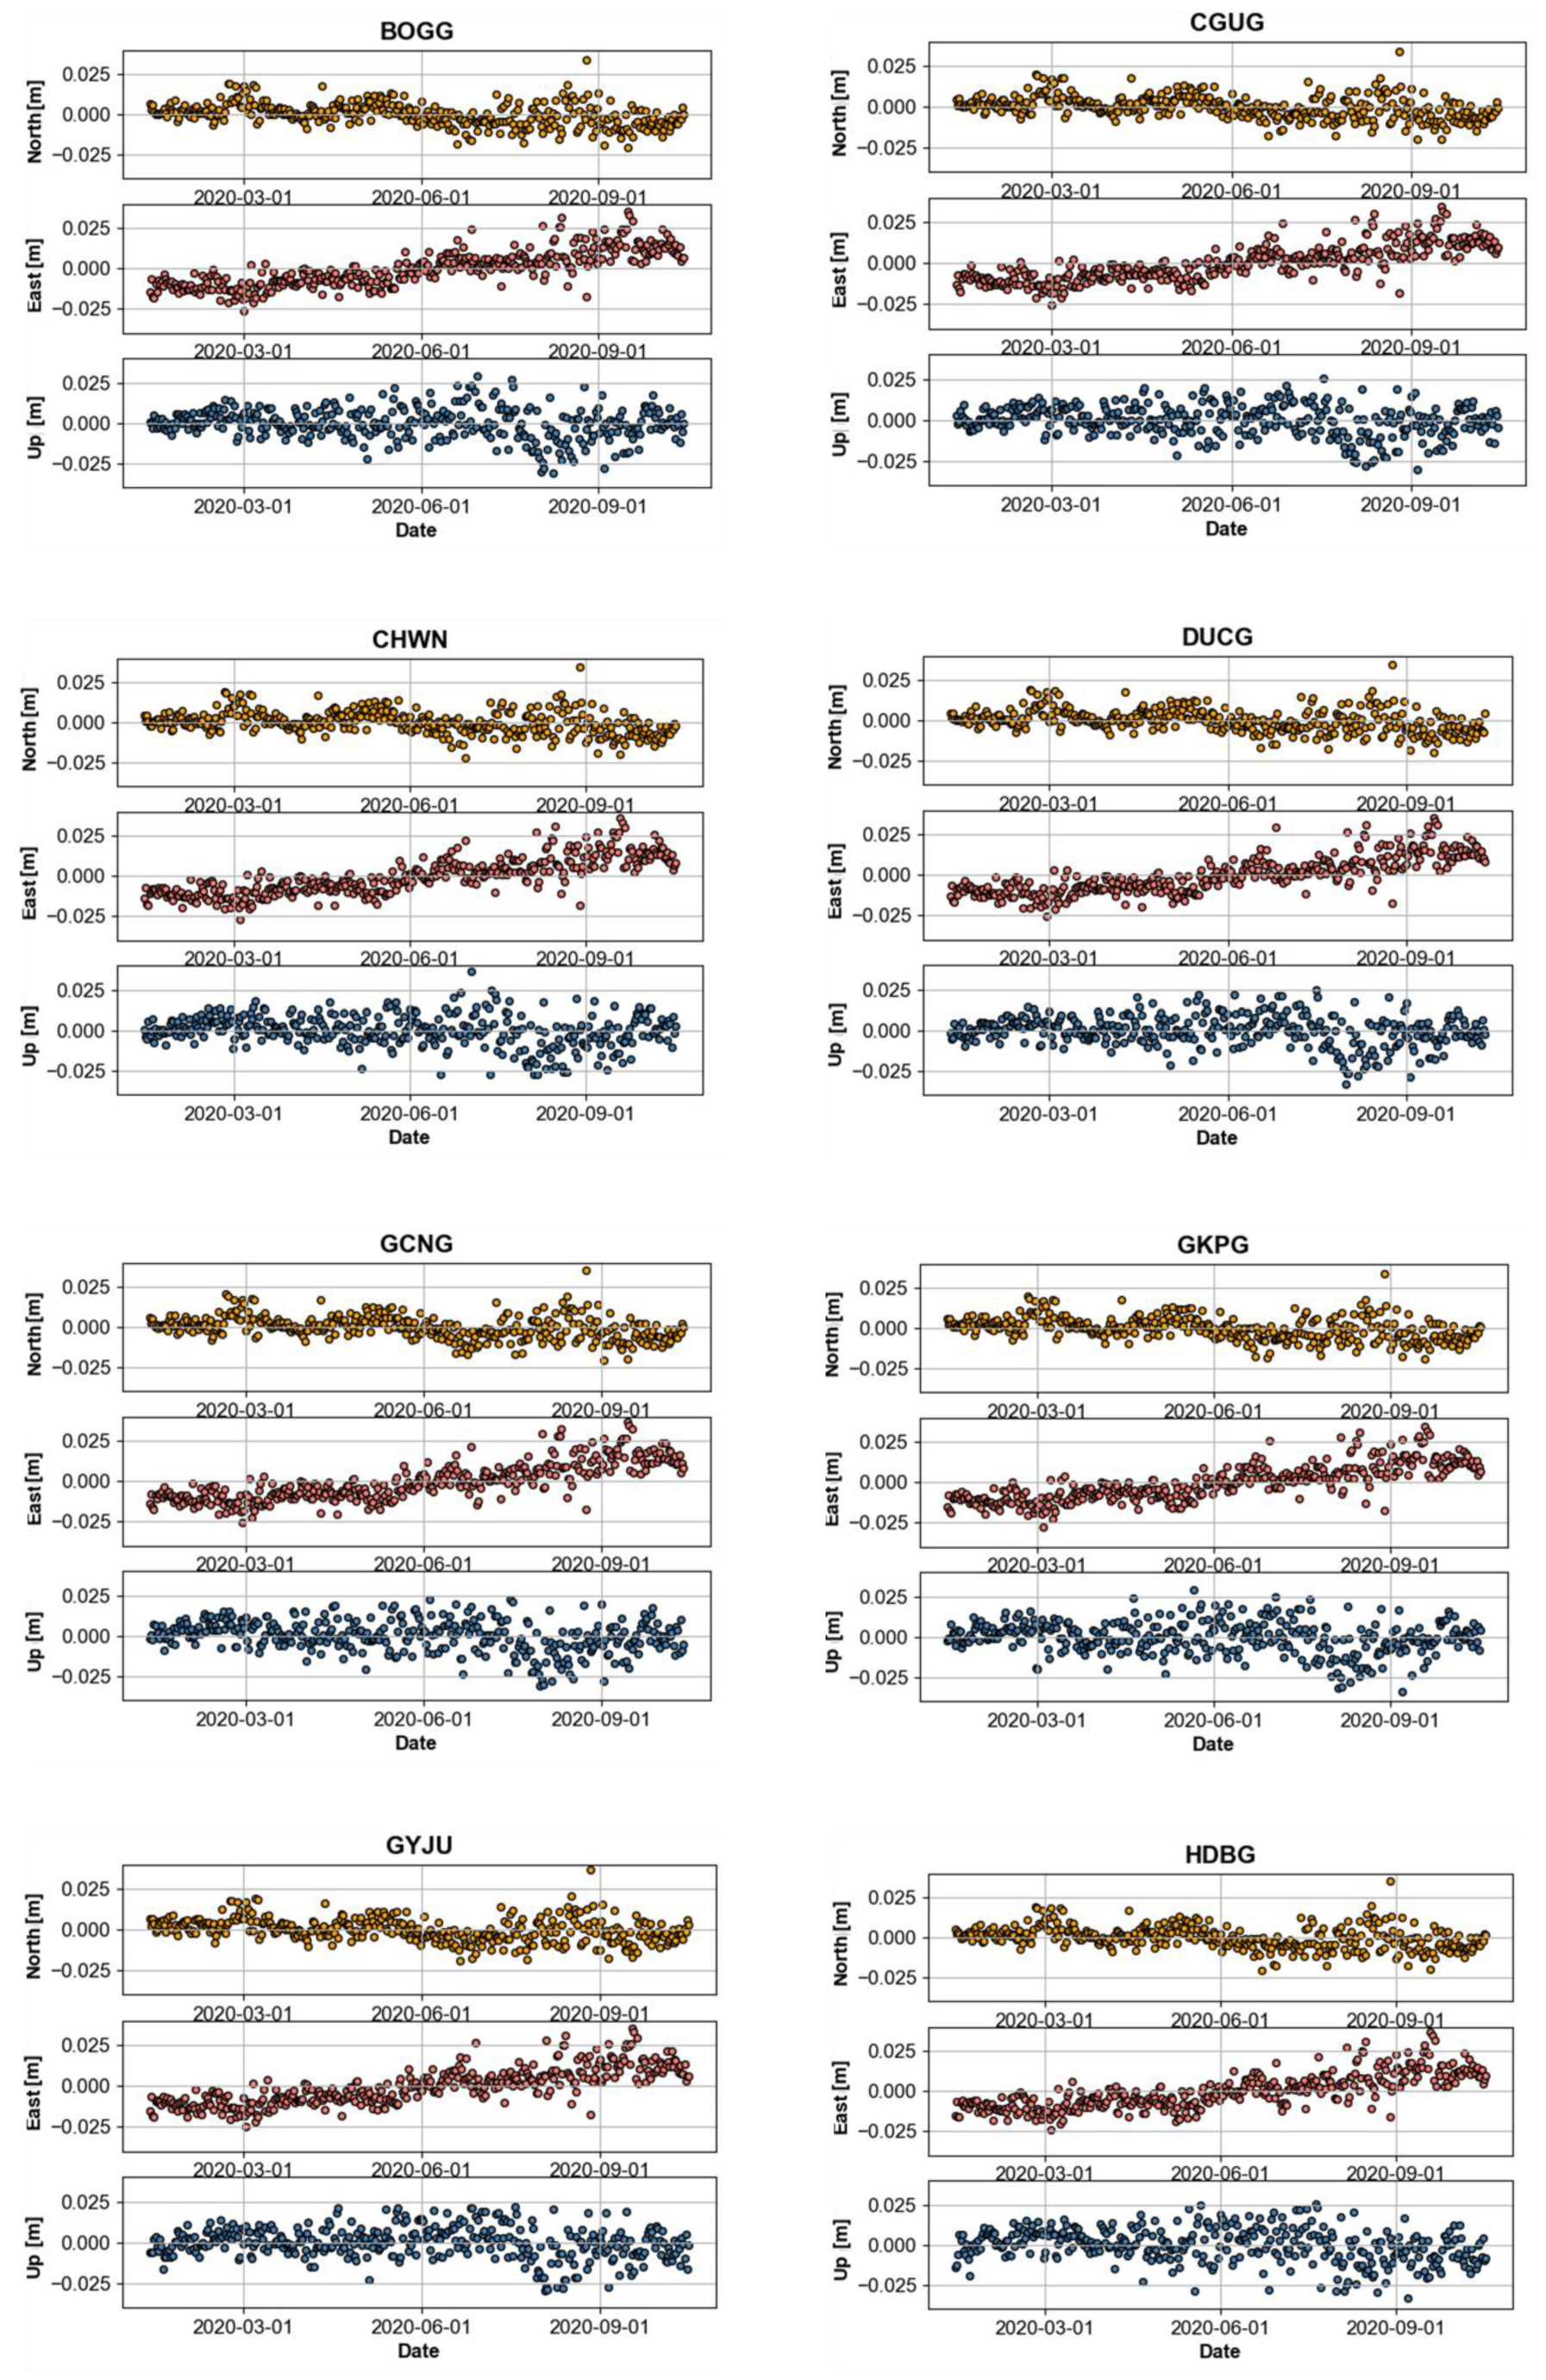
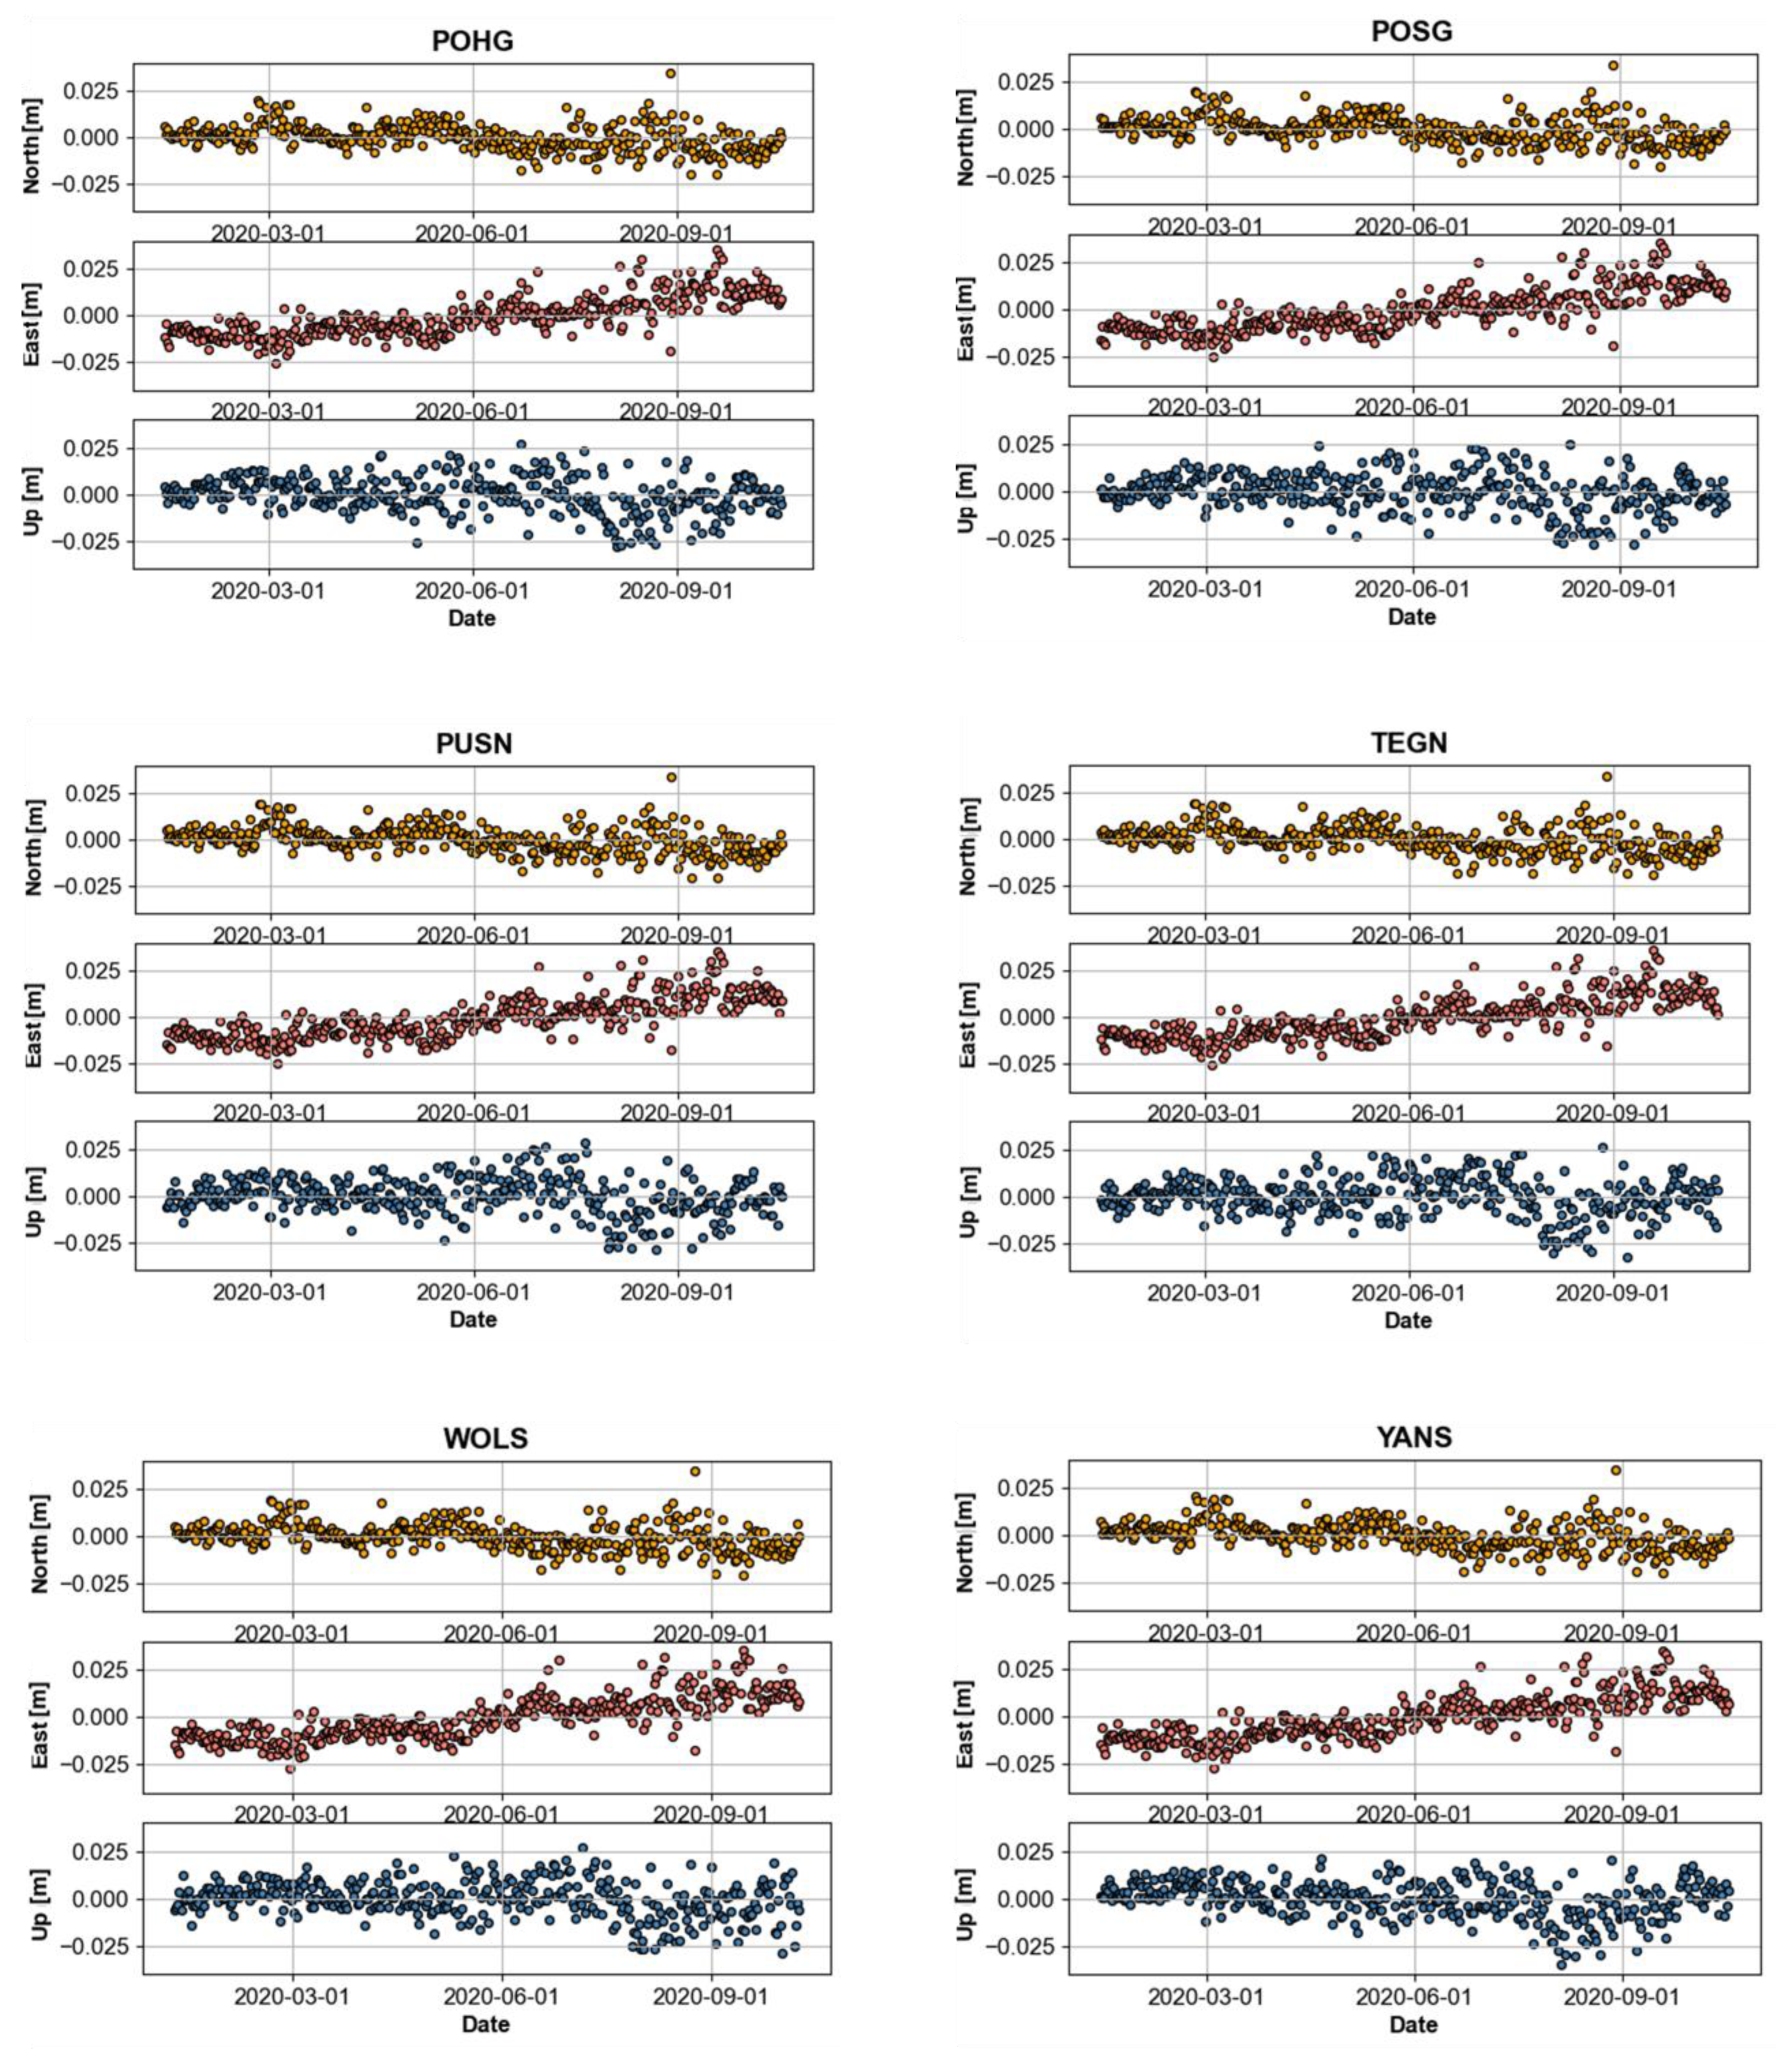
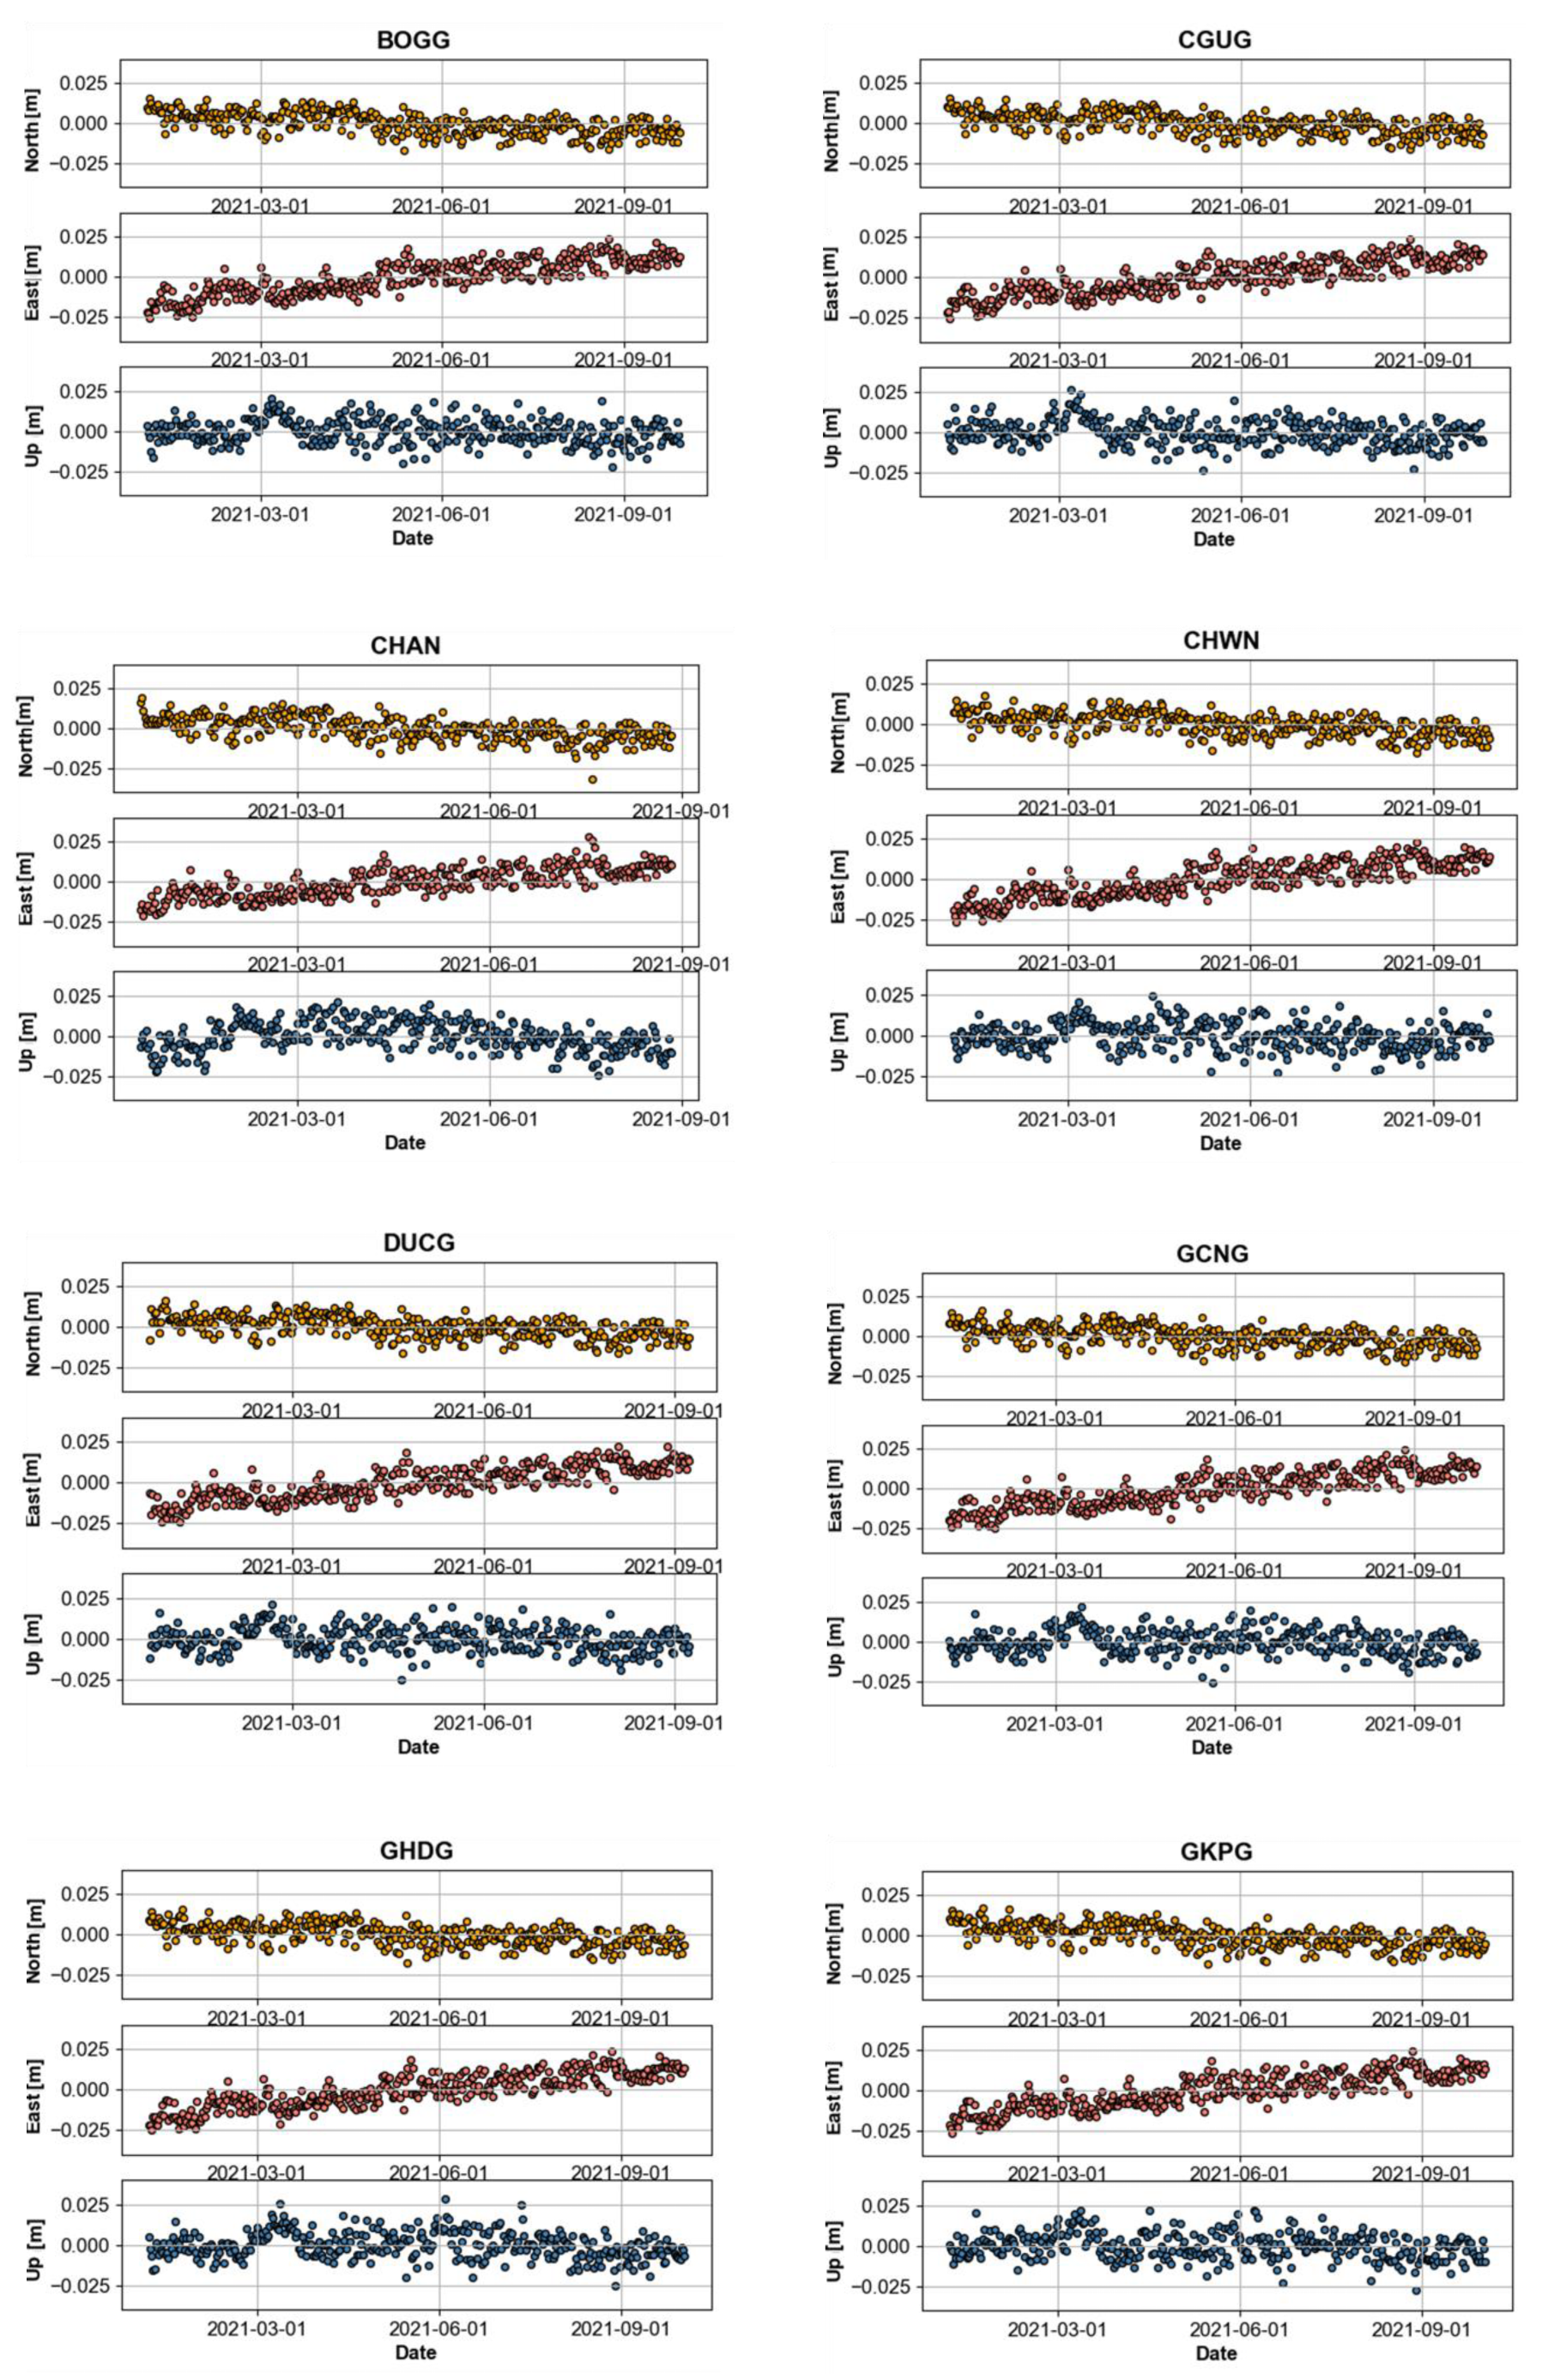
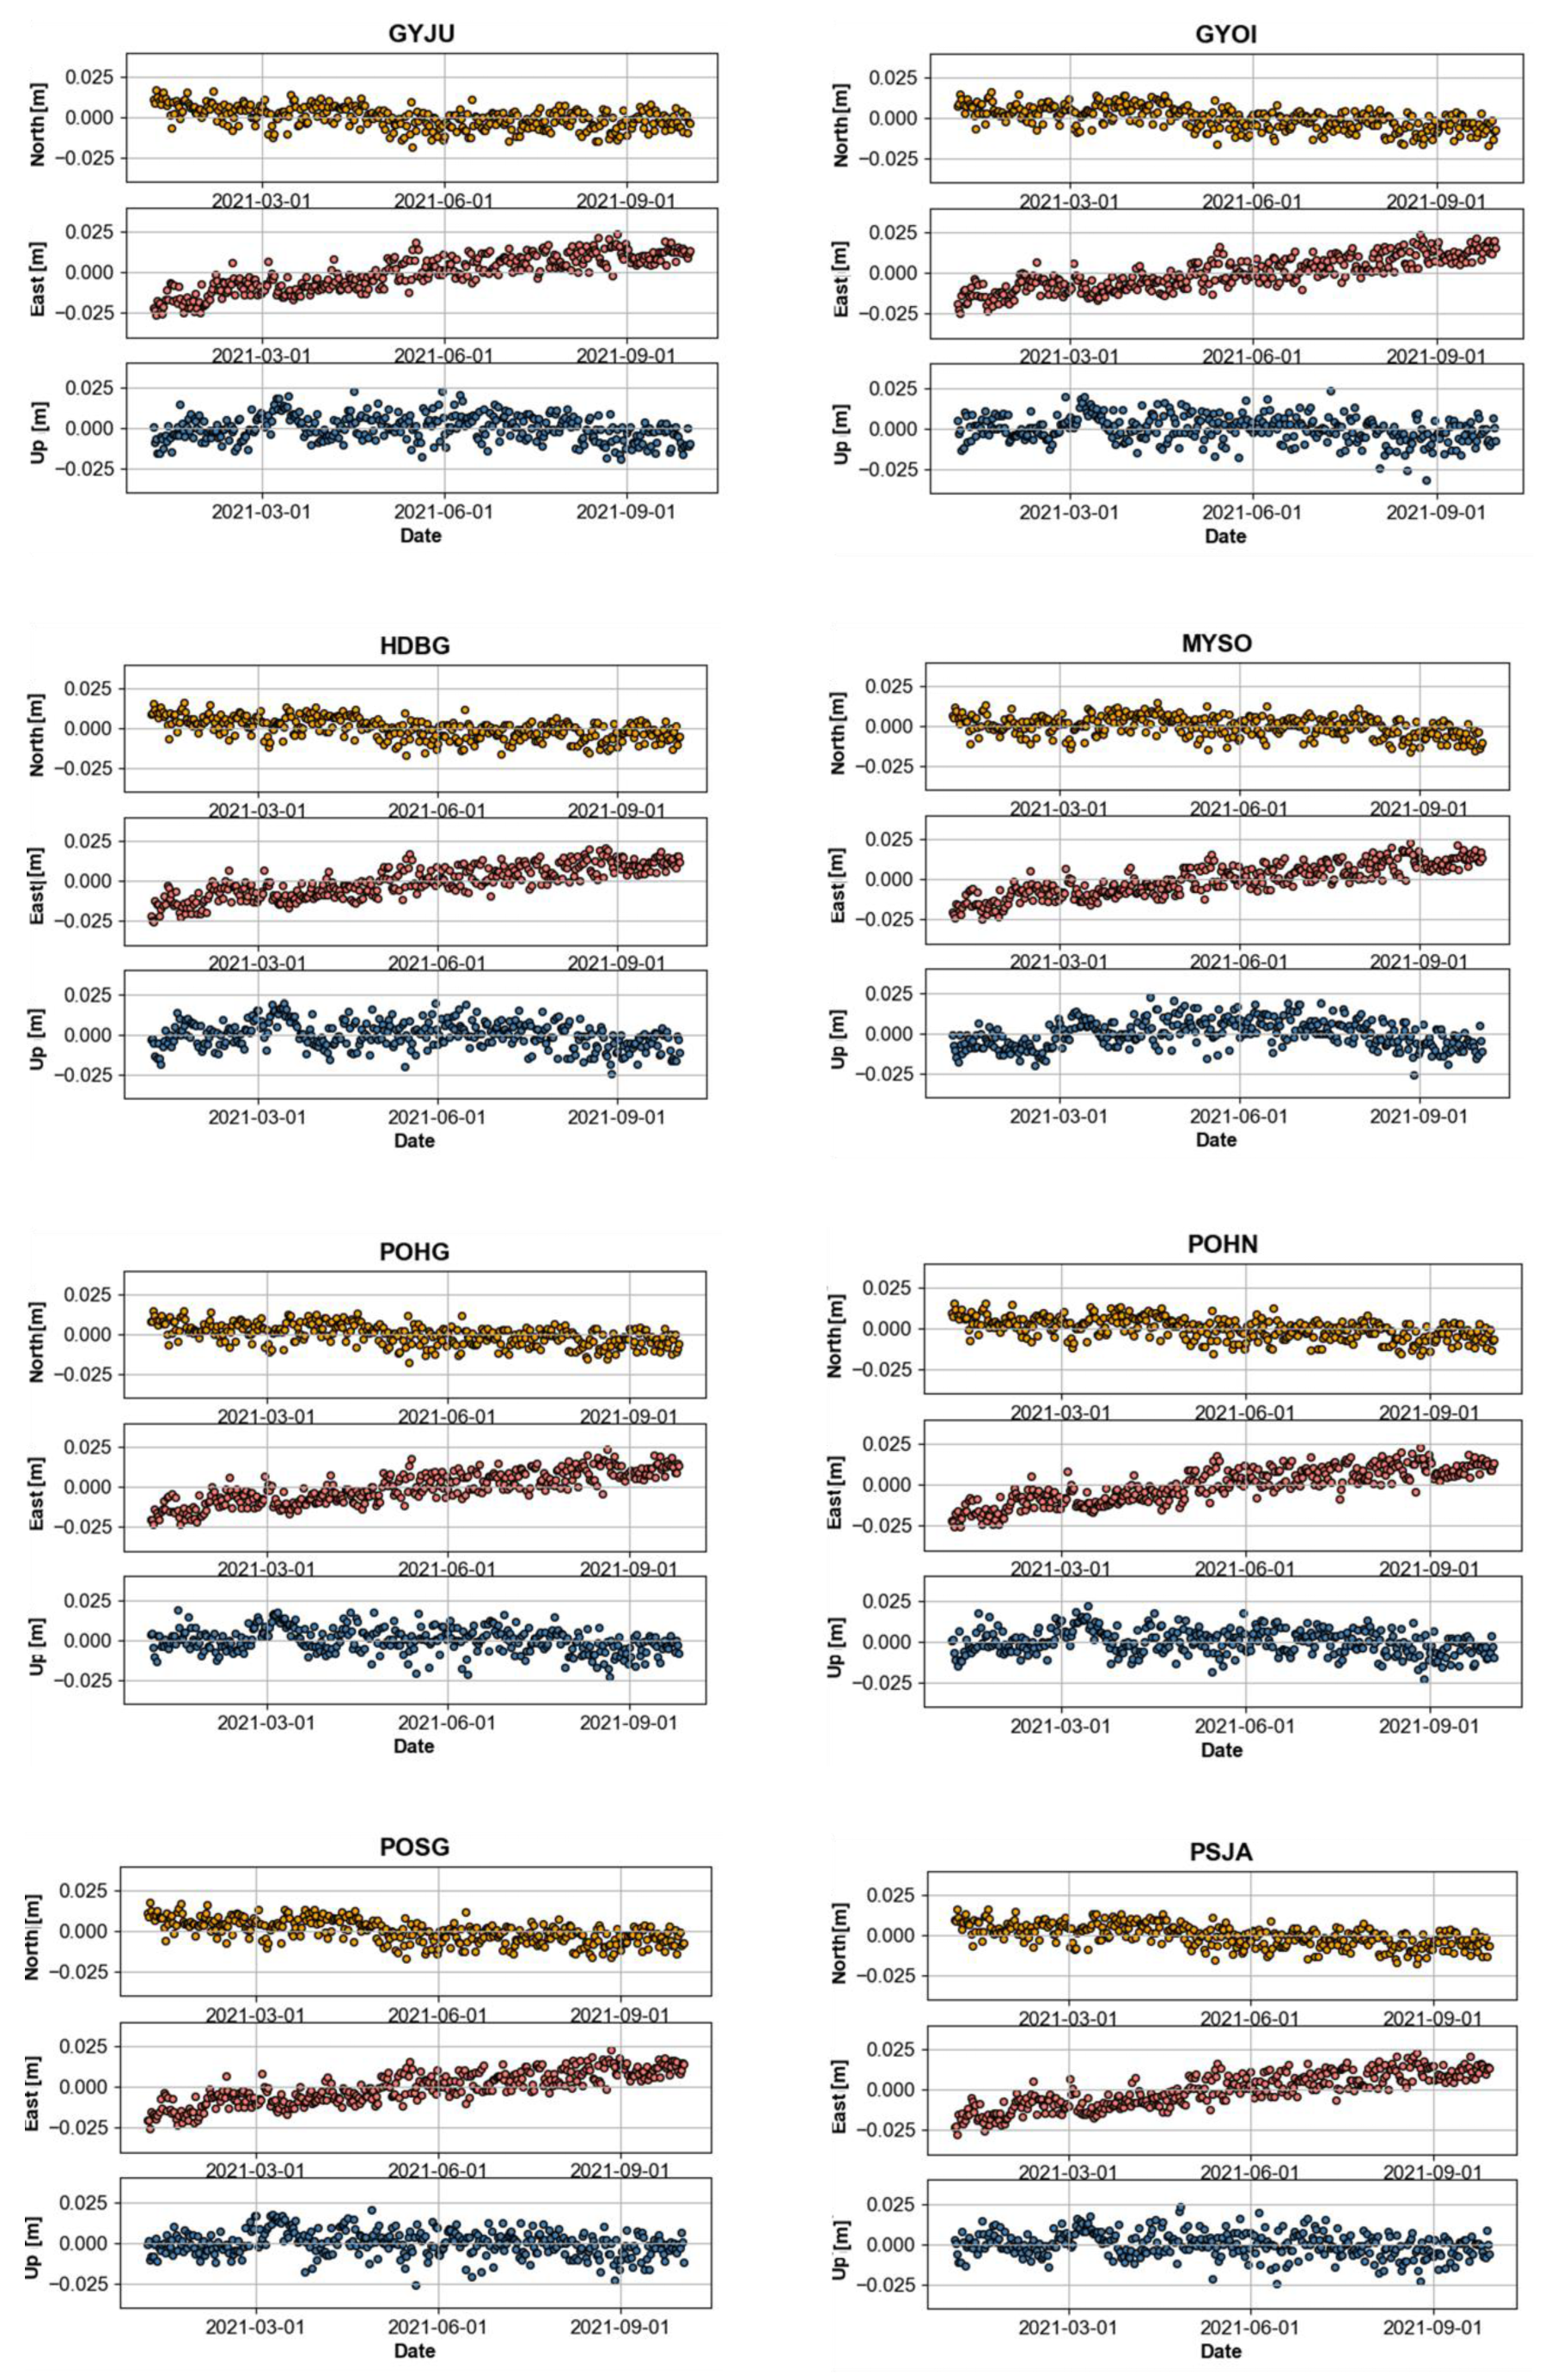
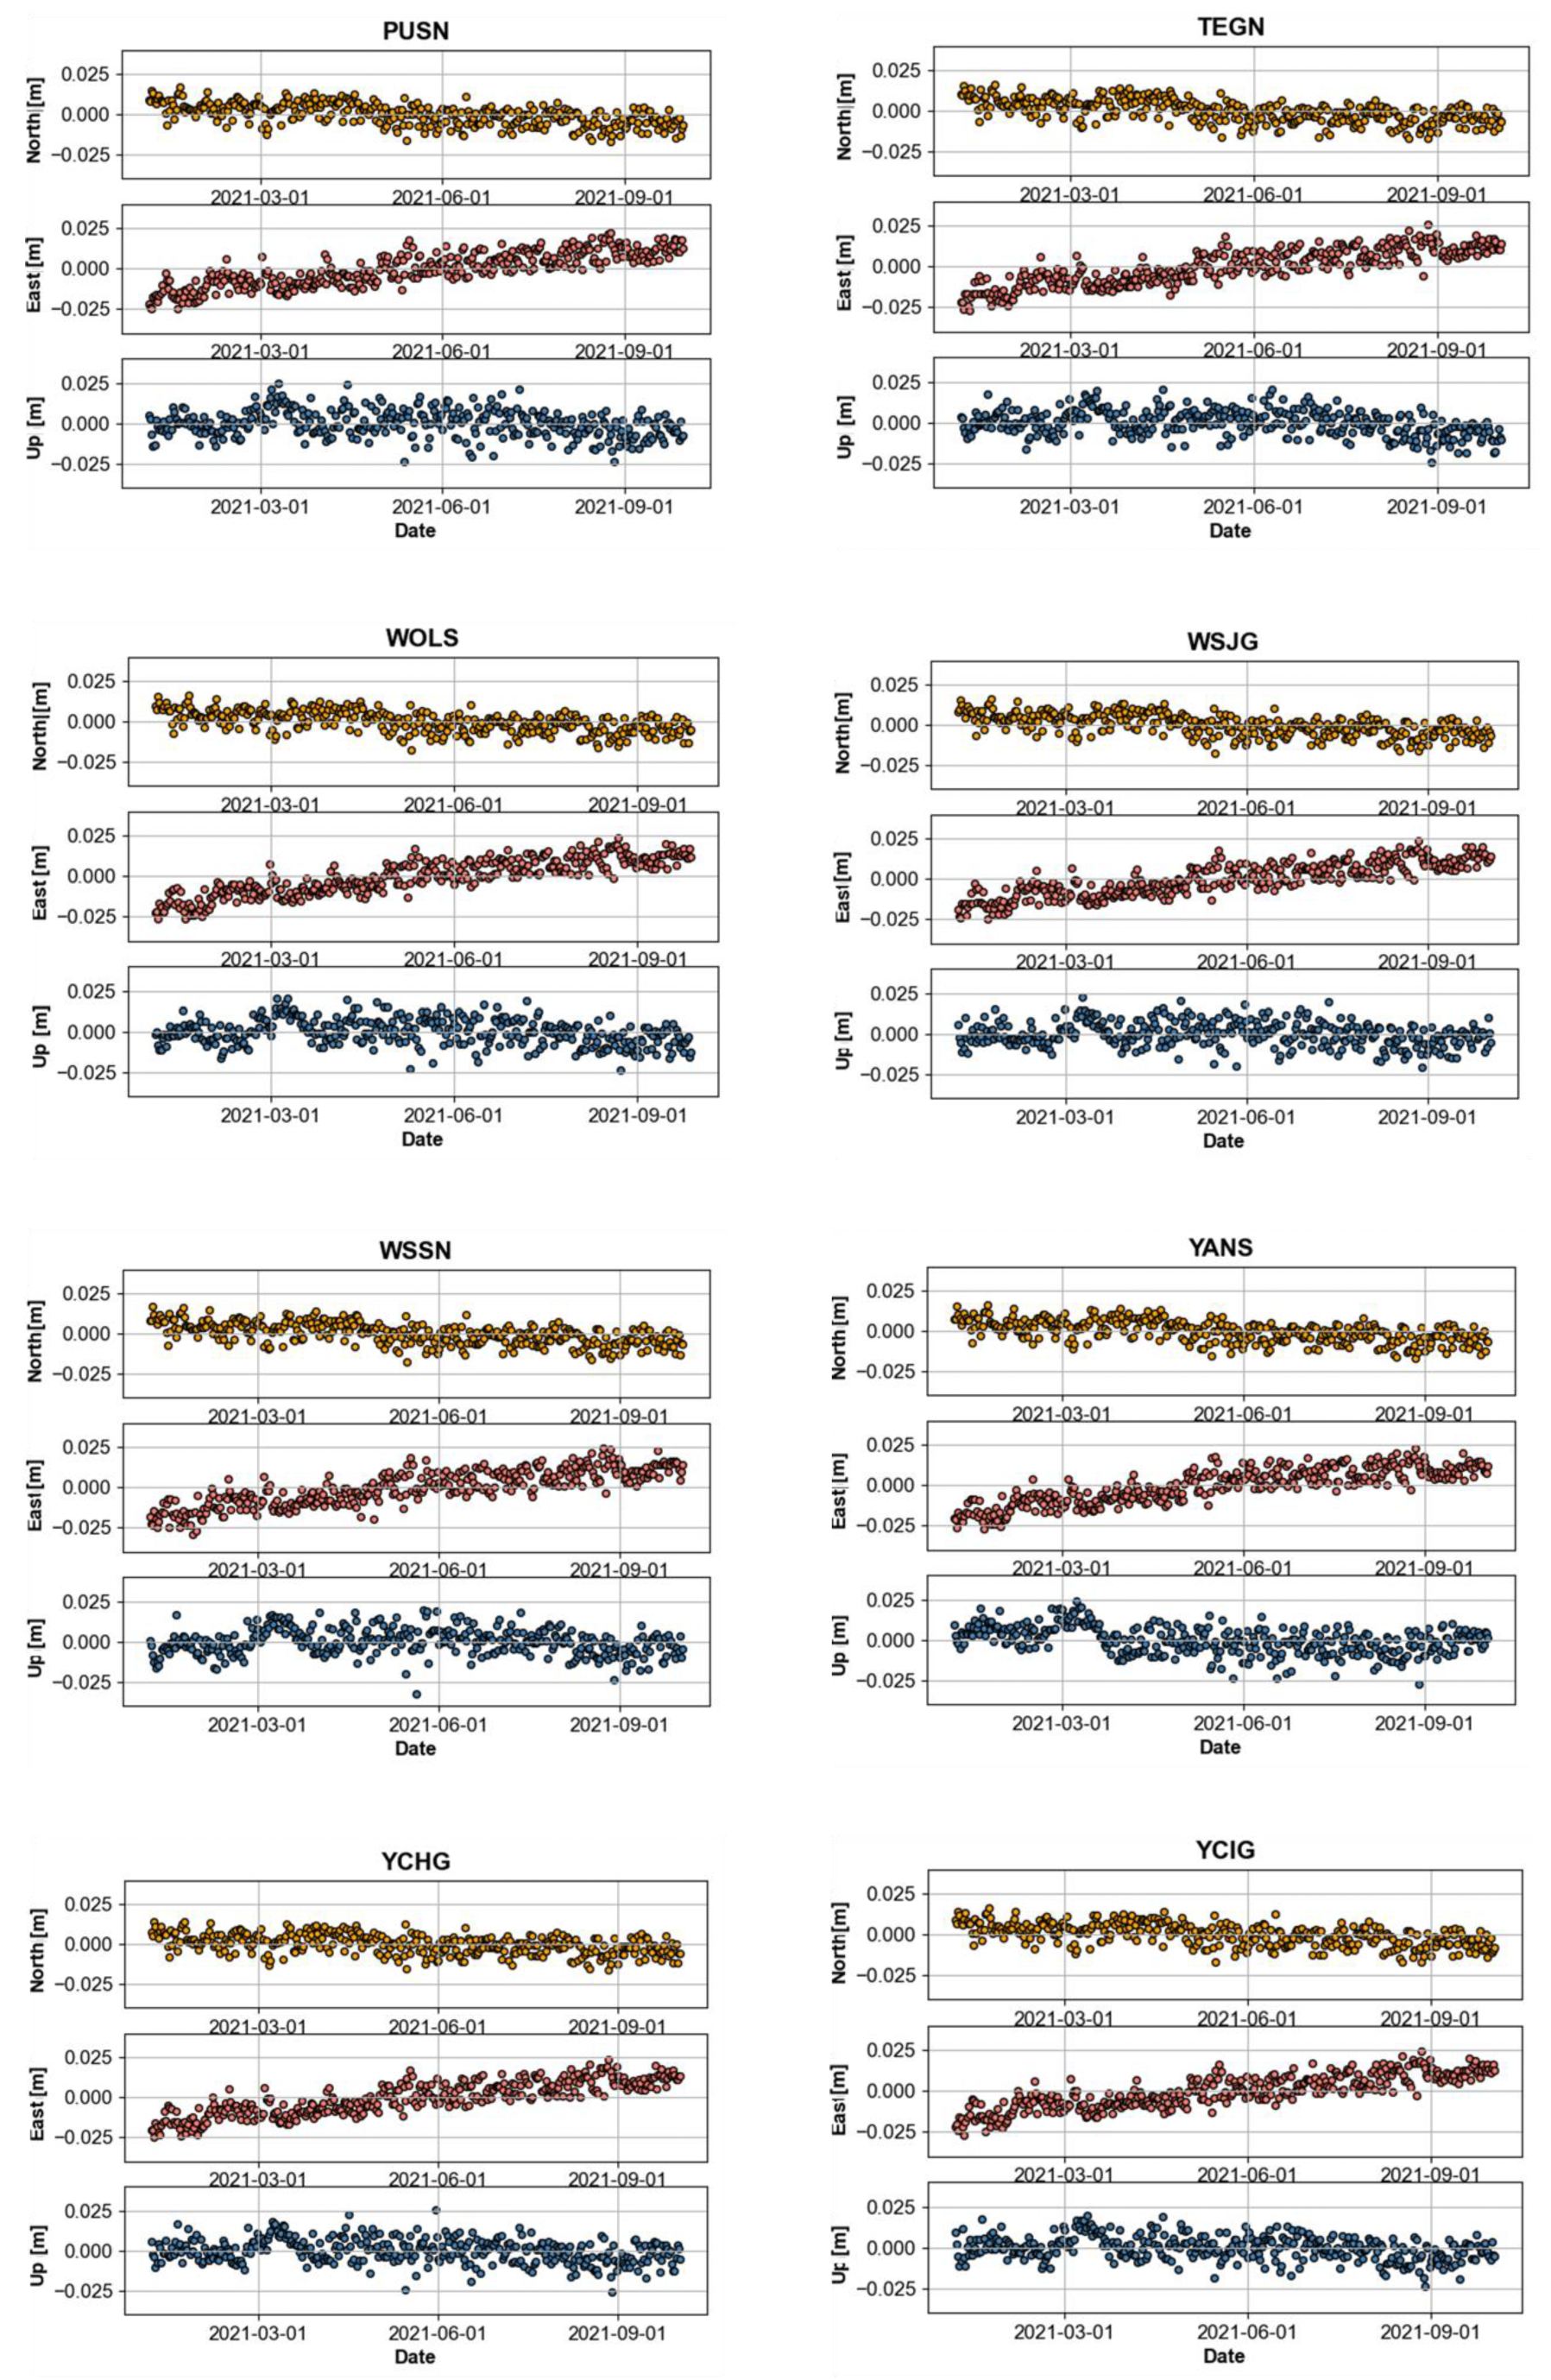
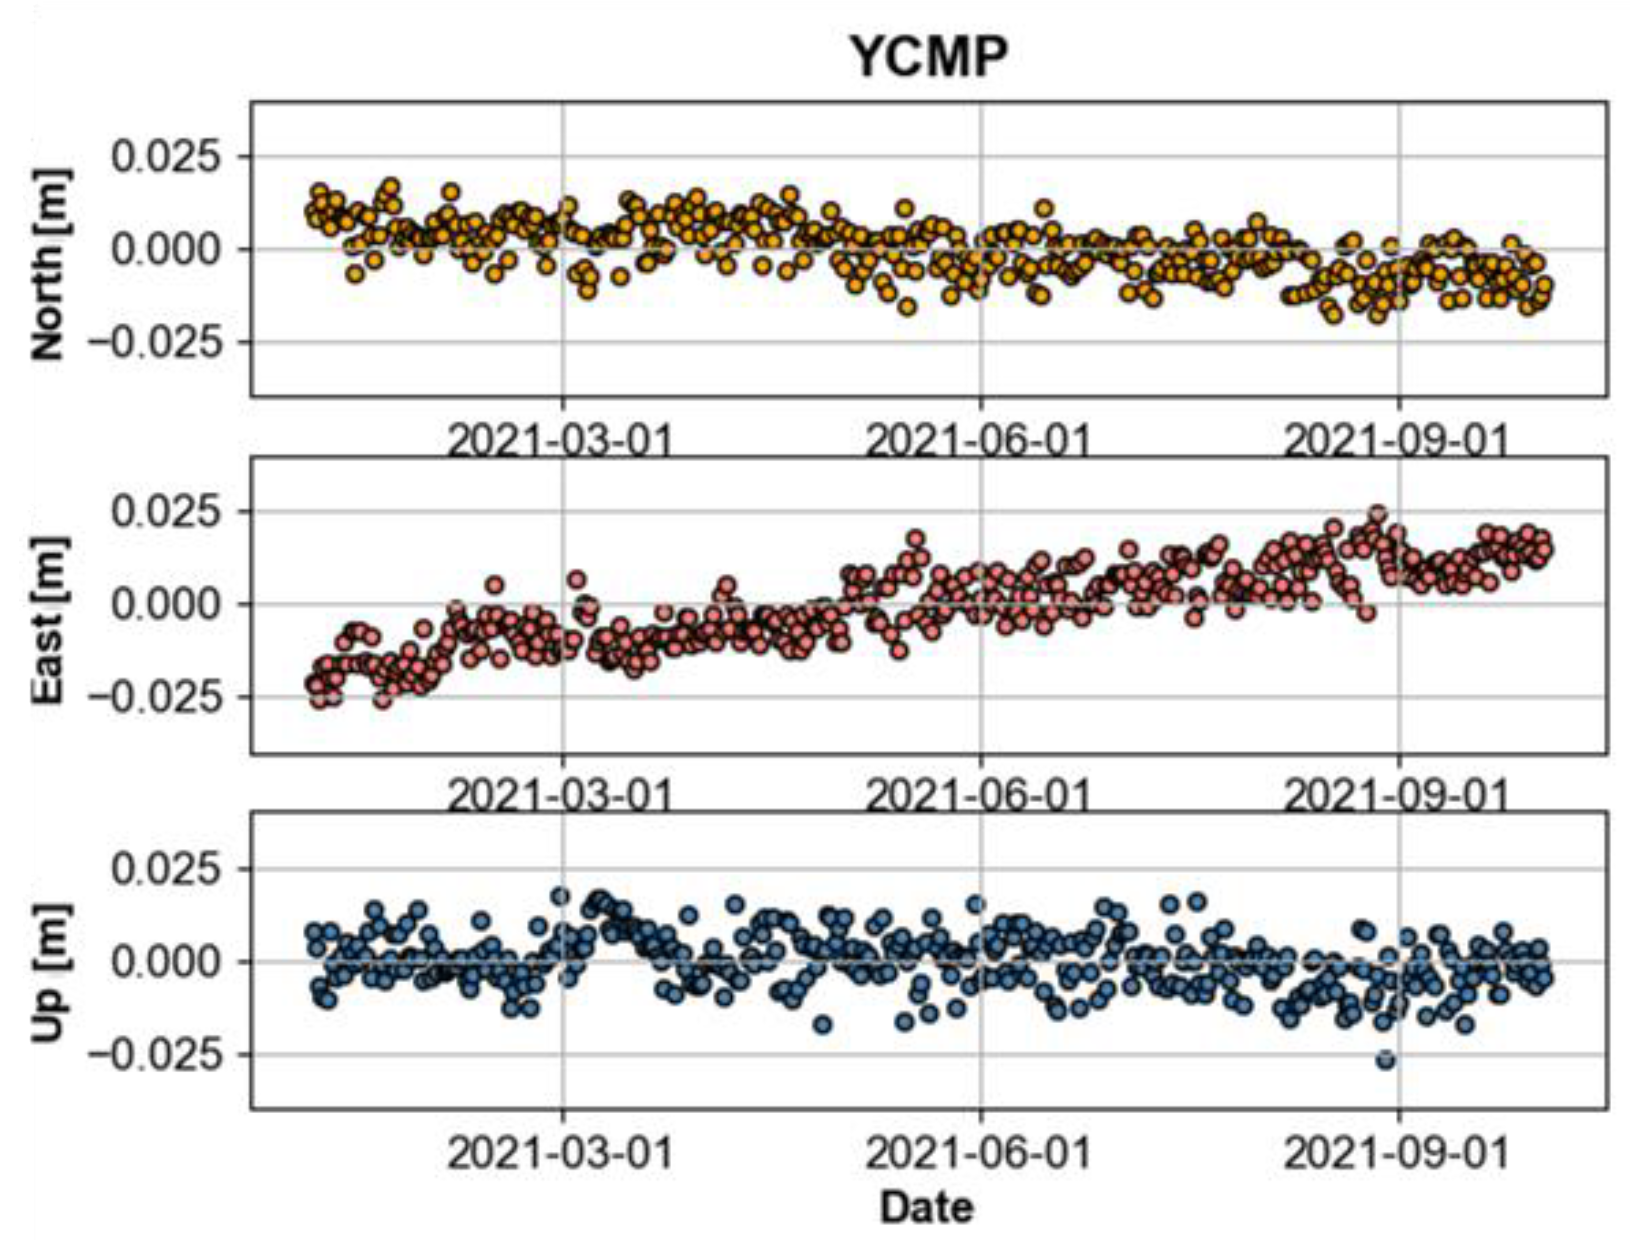
4.1. Time Series
4.1.1. Daily Solution
4.1.2. Yearly Solution
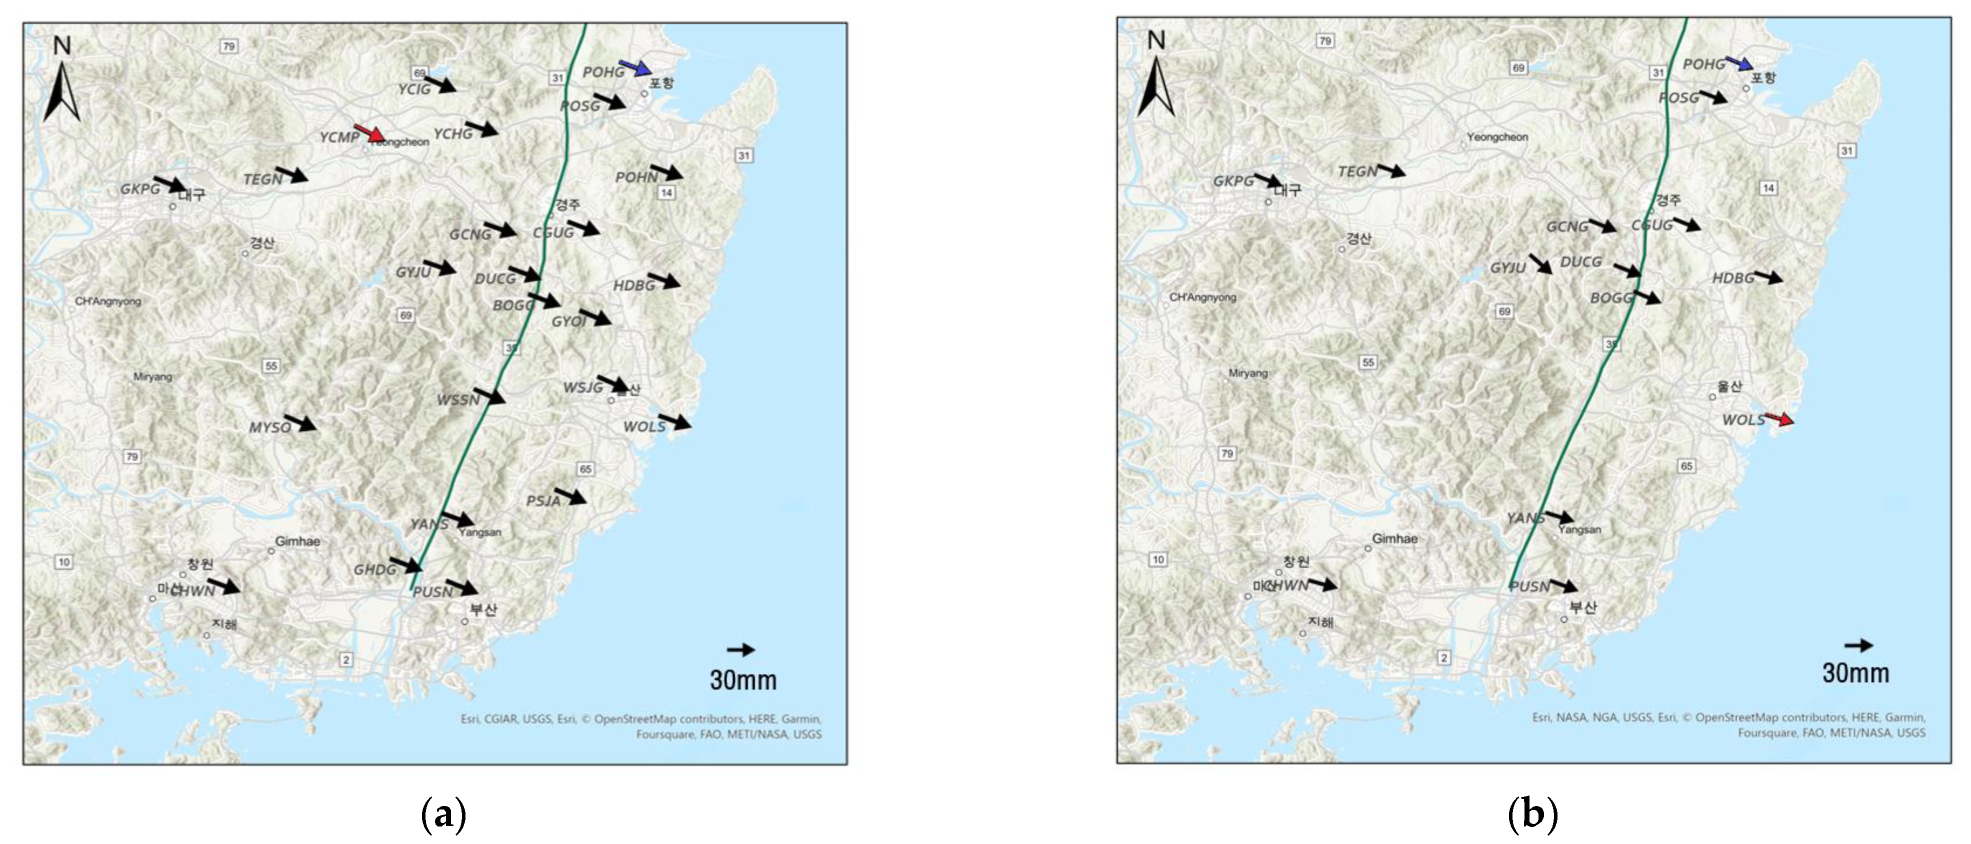
- Absolute Velocity with IGS Constrained
- 2.
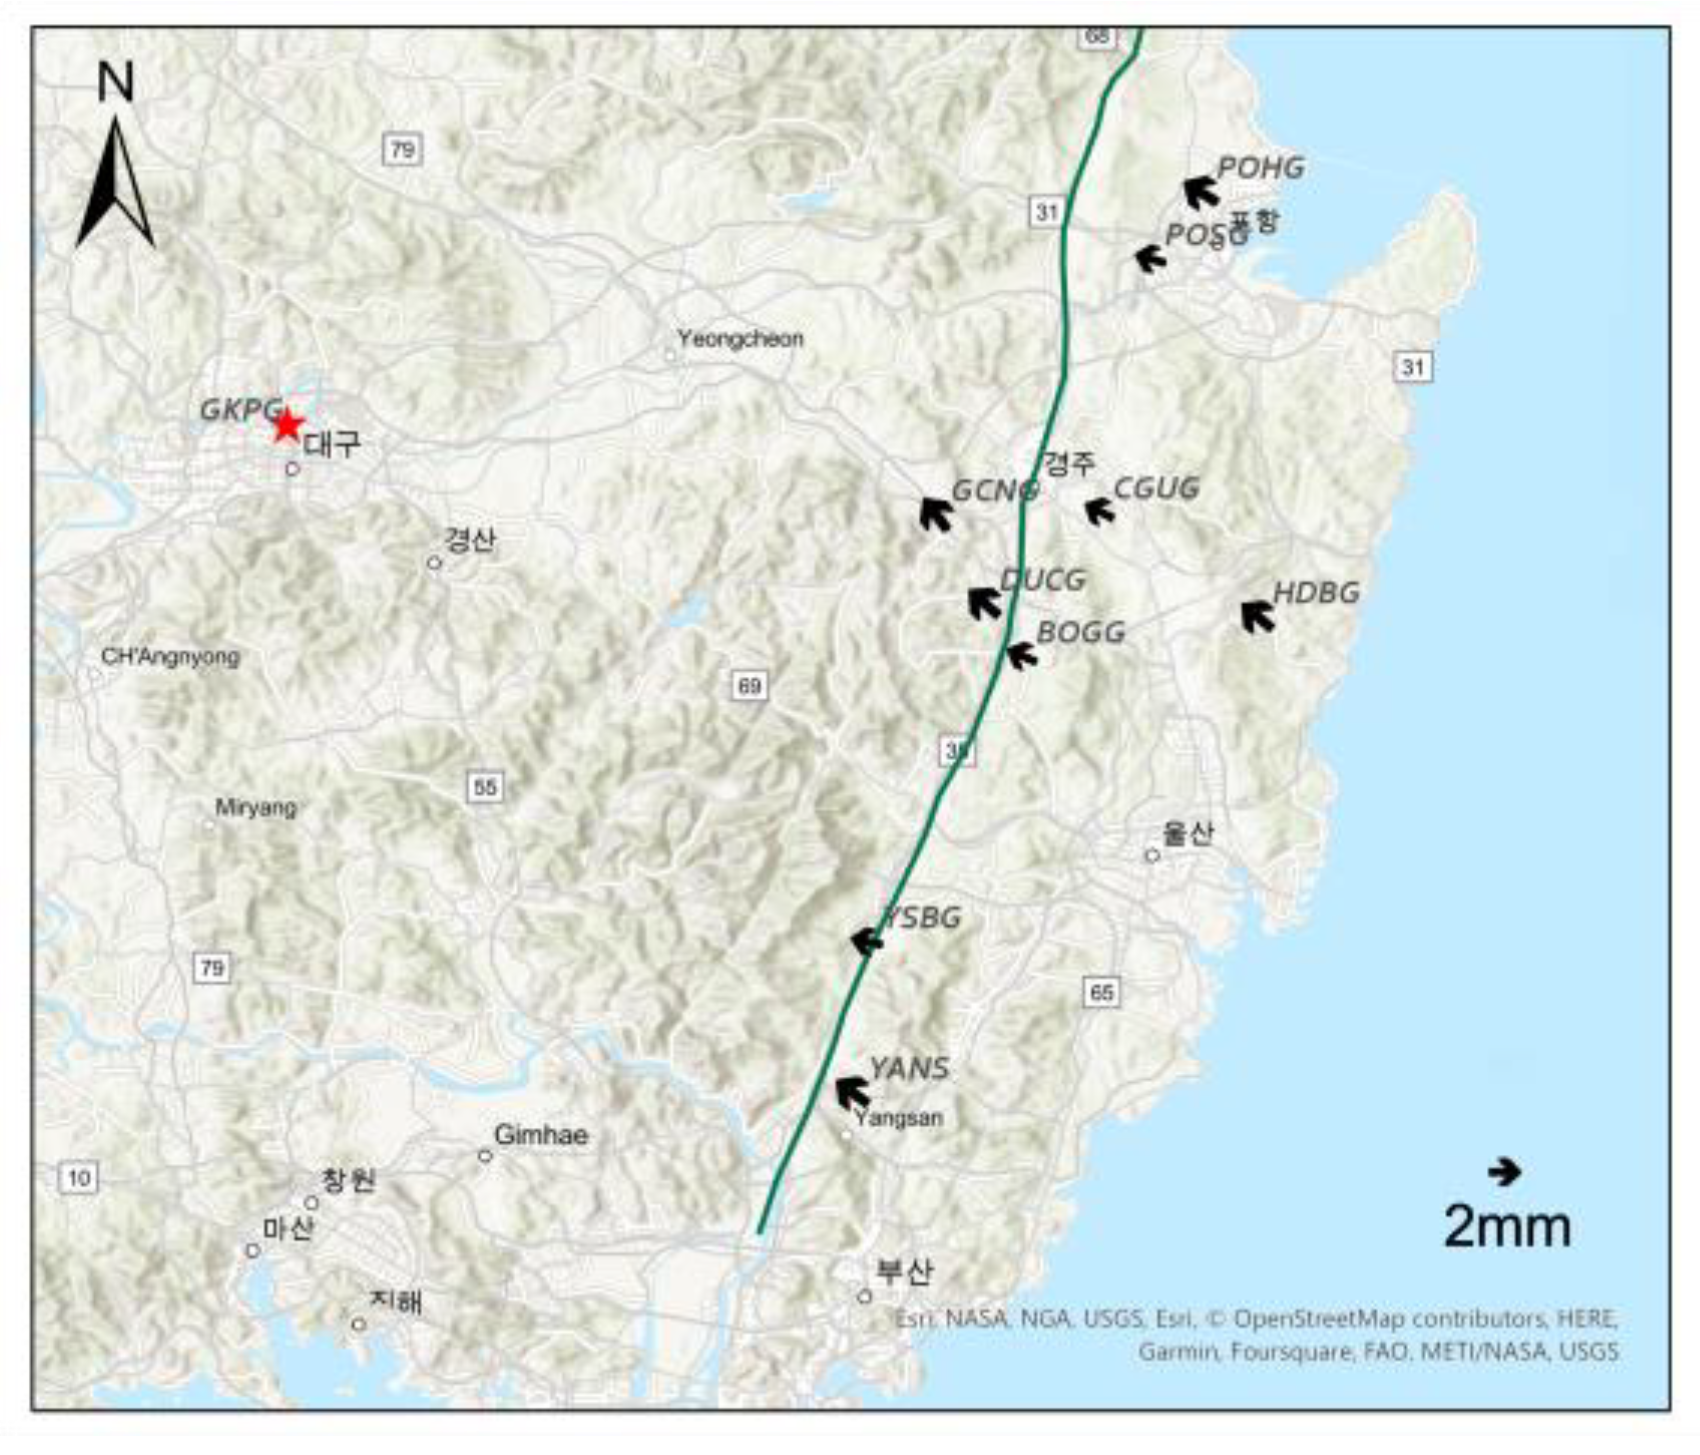
- Relative Velocity with respect to GKPG
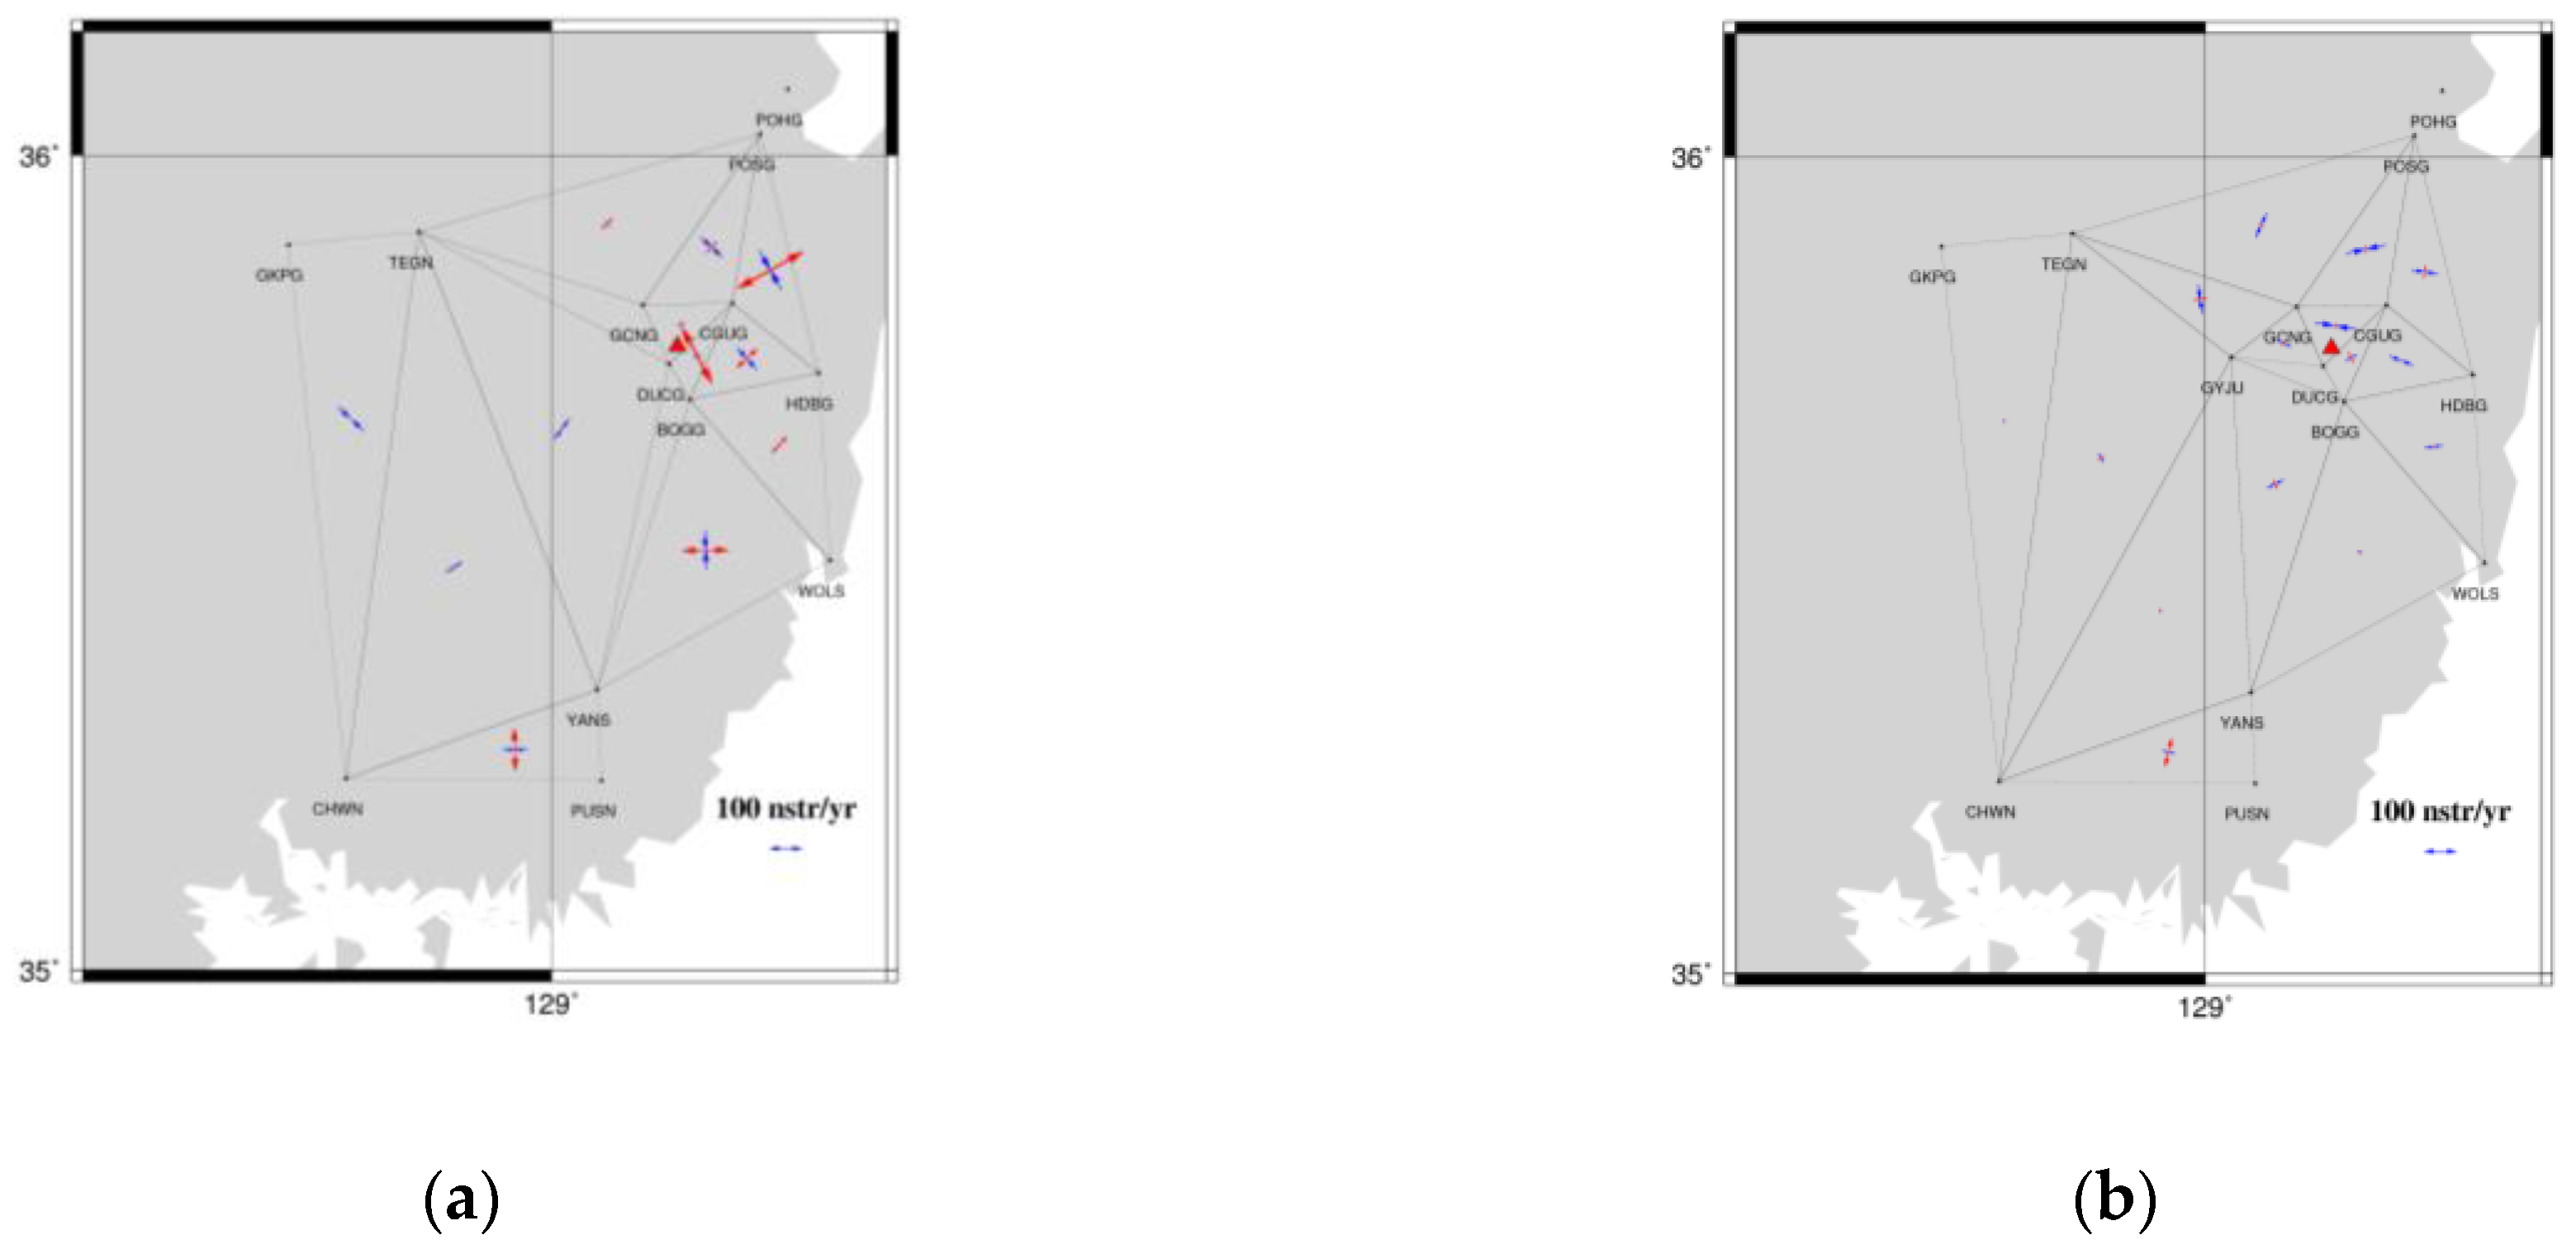
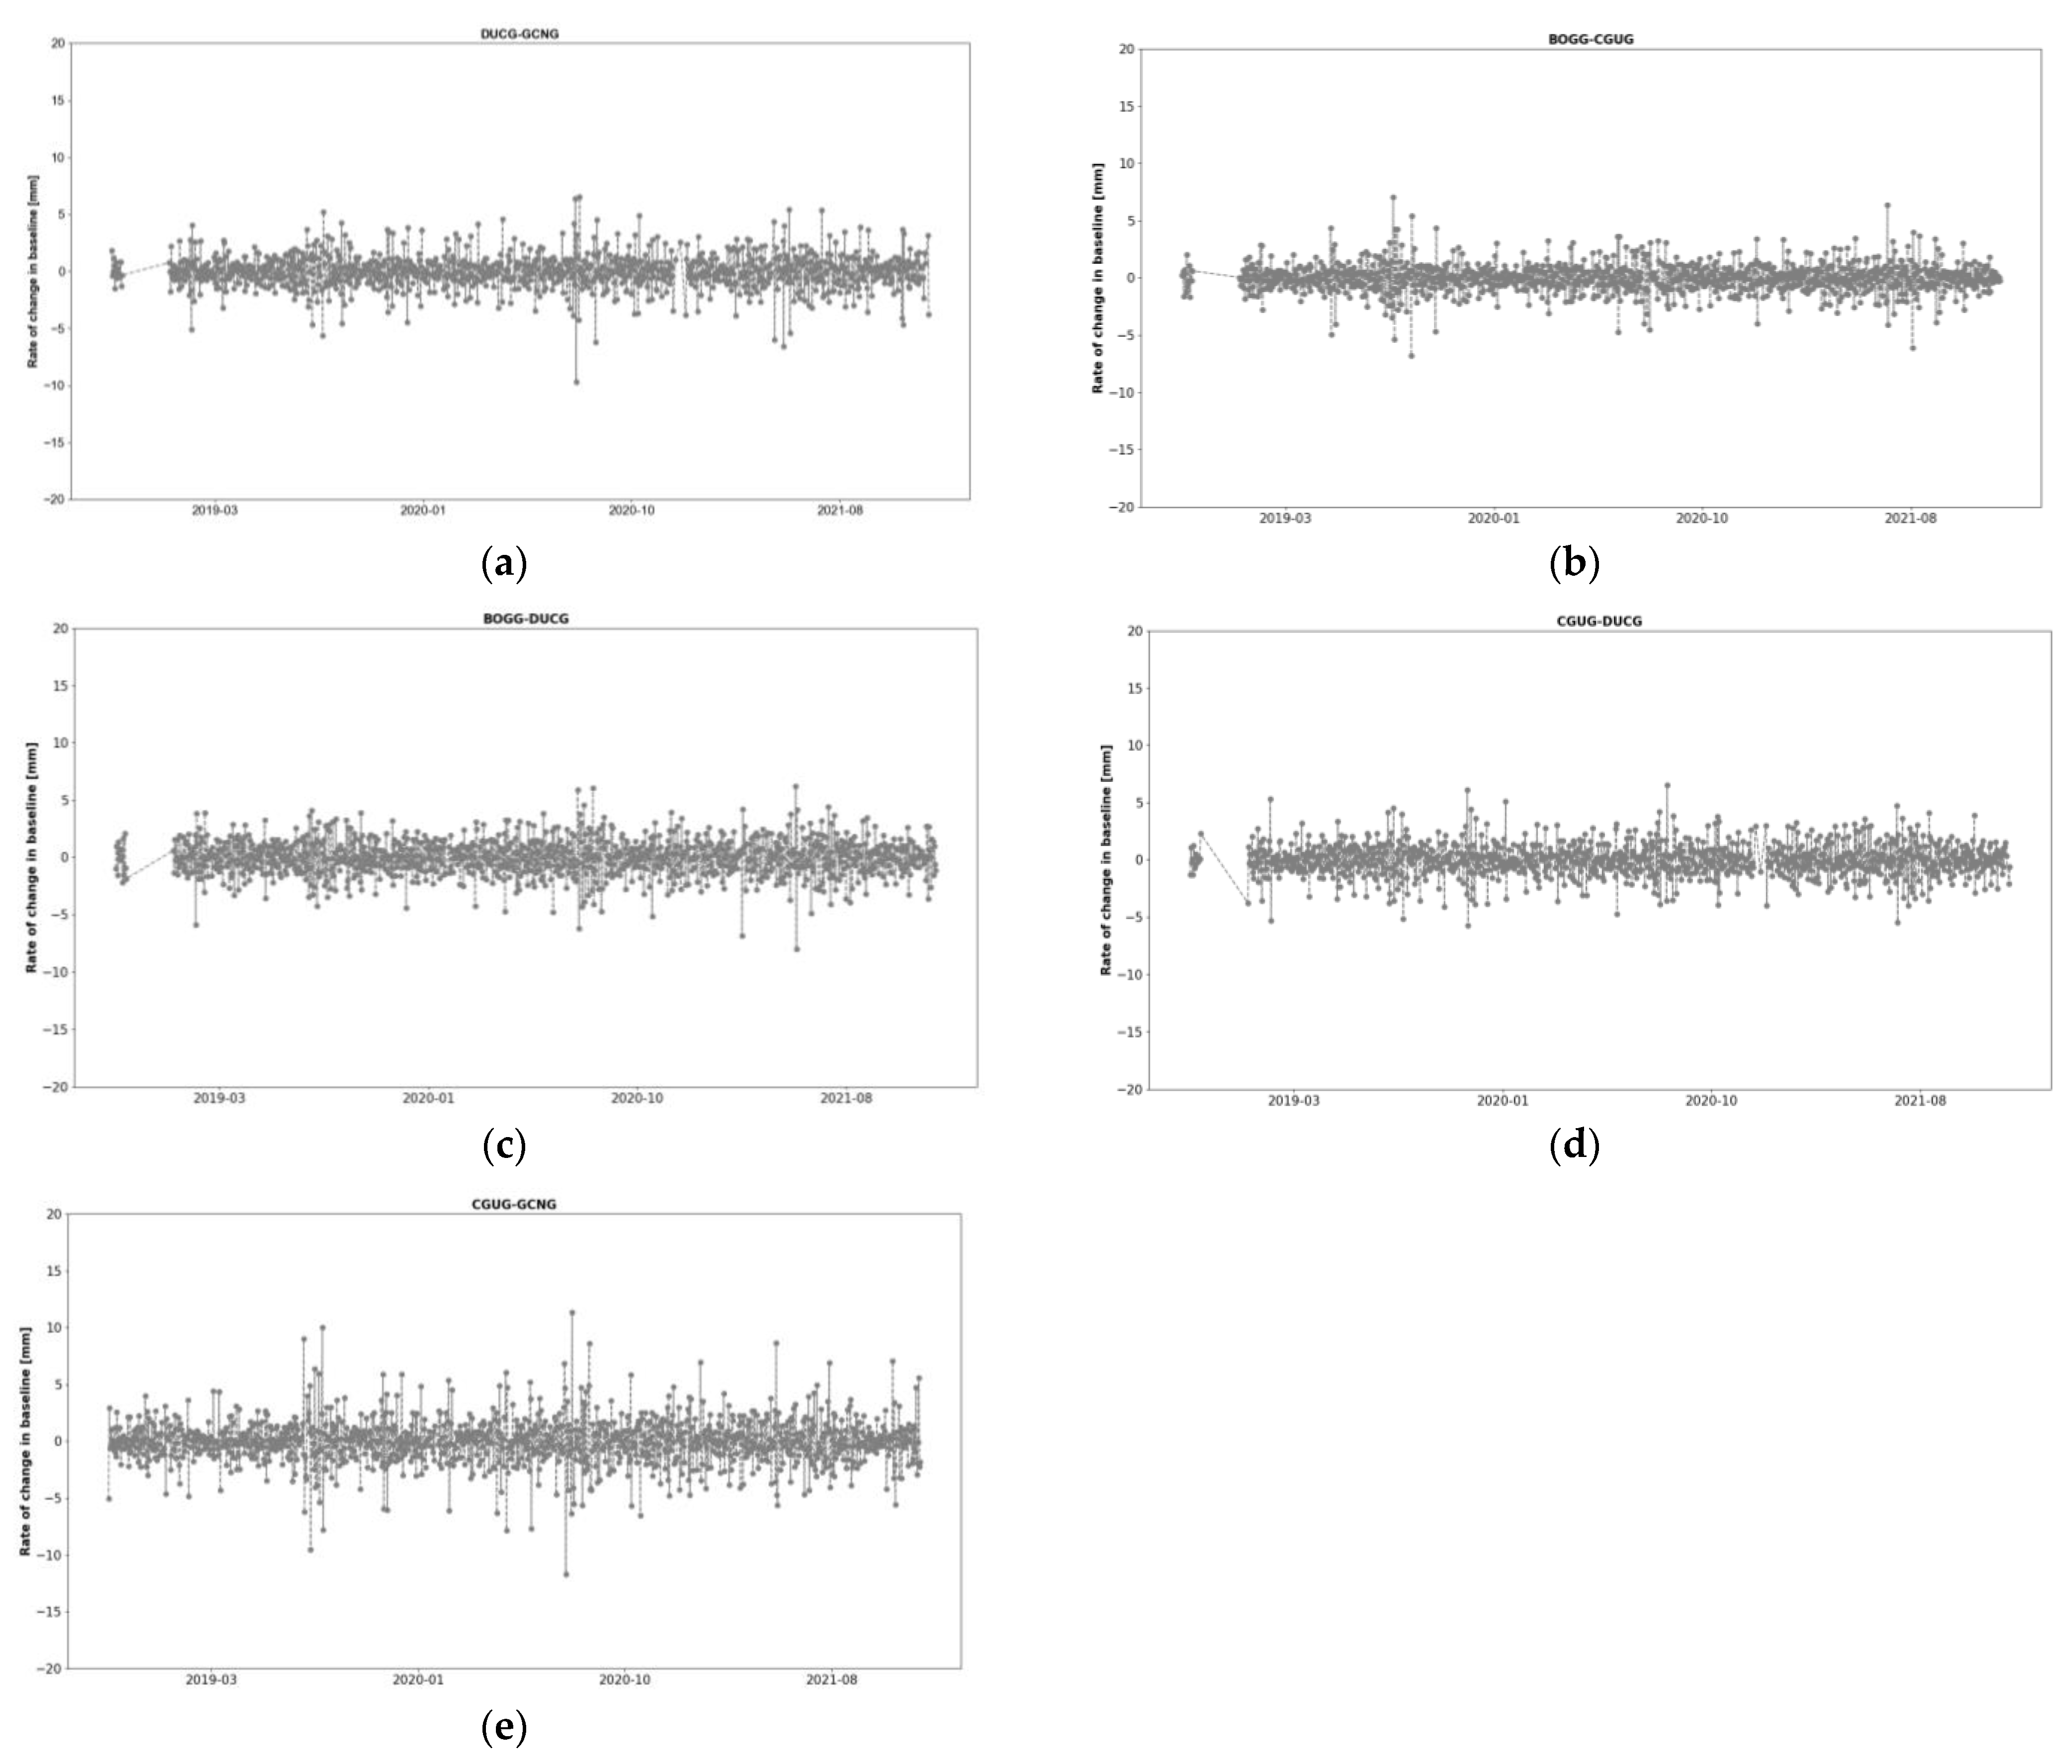
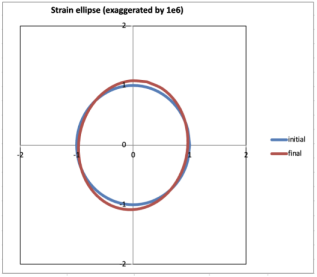
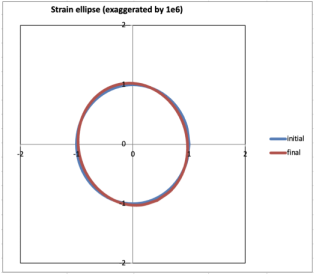
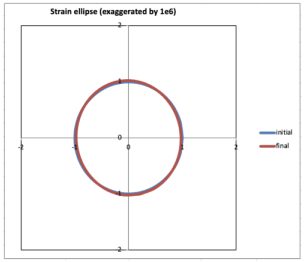
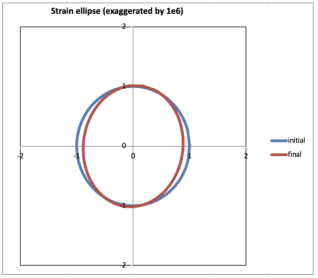
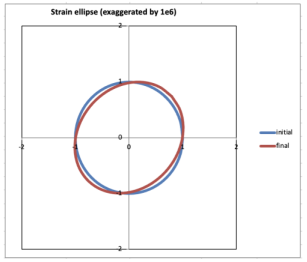
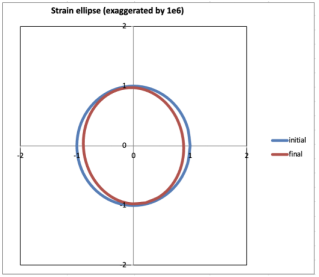
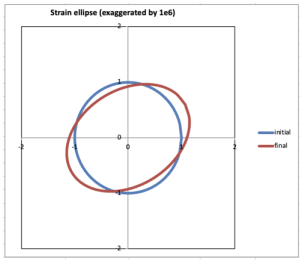
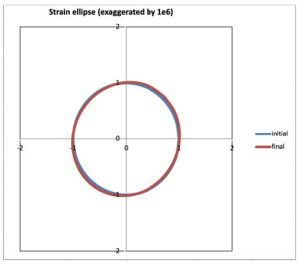
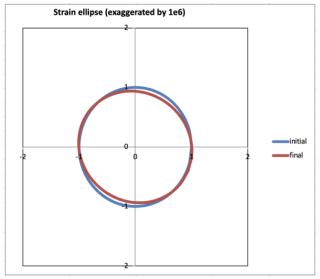
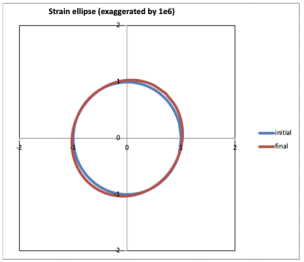
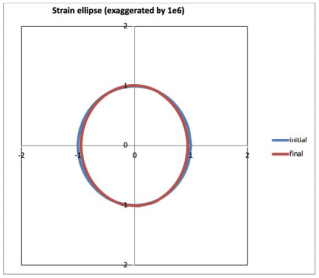
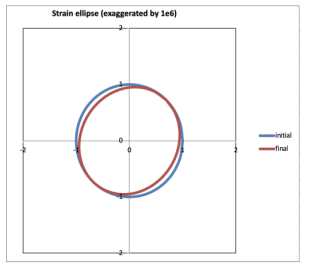
4.1.3. Stress and Strain Analysis
5. Conclusions
- Based on the results of this study, the Yangsan Fault Zone is moving about 30 mm per year to the southeast. This is like the annual movement of the Korean Peninsula. The period was subdivided to see trends the tectonic movement. When divided into two periods, both the magnitude and direction of crustal movement were similar for two sub-periods: between 2018 and 2019, and between 2020 and 2021. The stations on both sides, east and west, divided by the Yangsan Fault Zone, moved with similar scale and direction.
- Internal deformation was monitored to analyze the stability of the fault in more detail. As a result, most of the stations around the study area moved in the northwest direction with respect to GKPG at a very small magnitude, average of about 1.8 mm/year. Considering that all of them are very small and move in the same direction, it is judged that there is no clear distortion of the crust inside the Yangsan Fault. Since the scale is close to the average values of the Korean Peninsula, it is considered stable at the moment. However, the internal distortion is very important to understand the movement of the region, which should be further investigated in near future.
- The stress of the fault was computed through GNSS data. Based on the calculated stress, the scale of the east–west expansion during the period decreased over time. In addition, the stress strain of the area of interest is larger than that of surrounding triangular networks. However, based on the rate of change in the baseline distance, the area that is expected to have crustal deformation appears to be stable at present, which is additional evidence that the study area is in a stable state.
Author Contributions
Funding
Institutional Review Board Statement
Informed Consent Statement
Data Availability Statement
Acknowledgments
Conflicts of Interest
Appendix A
Appendix B
Appendix C
Appendix D
References
- Jun, M.-S.; Jun, J.-S. Focal mechanism in and around the Korean Peninsula. Korea Soc. Earth Explor. Geophys. 2021, 13, 198–202. [Google Scholar]
- Choi, S.-J.; Jeon, J.-S.; Choi, J.-H.; Kim, B.-K.; Ryoo, C.-R.; Hong, D.-G.; Chwah, U. Estimation of possible maximum earthquake magnitudes of Quaternary faults in the southern Korean Peninsula. Quat. Int. 2014, 344, 53–63. [Google Scholar] [CrossRef]
- Lee, J.; Rezaei, S.; Hong, Y.; Choi, J.-H.; Choi, J.-H.; Choi, W.-H.; Rhee, K.-W.; Kim, Y.-S. Quaternary fault analysis through a trench investigation on the northern extension of the Yangsan fault at Dangu-ri, Gyungju-si, Gyeongsanbuk-do. J. Geol. Soc. Korea 2015, 51, 471–485. [Google Scholar] [CrossRef]
- Kim, M.-C.; Jung, S.; Yoon, S.; Jeong, R.-Y.; Song, C.-W.; Son, M. Neotectonic crustal deformation and current stress field in the Korean Peninsula and their tectonic implications: A review. J. Petrol. Soc. Korea 2016, 25, 169–193. [Google Scholar] [CrossRef] [Green Version]
- Jeon, Y.S.; Park, E.H.; Lee, D.K. 9.12 Earthquake Response Report; Korea Meteorological Administration: Seoul, Republic of Korea, 2017; 139p. [Google Scholar]
- Son, M.; Cho, C.-S.; Shin, J.-S.; Rhee, H.-M.; Sheen, D.-H. Spatiotemporal distribution of events during the First Three Months of the 2016 Gyeongju, Korea, Earthquake Sequence. Bull. Seismol. Soc. Am. 2018, 108, 210–217. [Google Scholar] [CrossRef]
- Hollenstein, C.; Müller, M.D.; Geiger, A.; Kahle, H.G. Crustal motion and deformation in Greece from a decade of GPS measurements, 1993–2003. Tectonophysics 2008, 449, 17–40. [Google Scholar] [CrossRef]
- Lazos, I.; Sboras, S.; Chousianitis, K.; Kondopoulou, D.; Pikridas, C.; Bitharis, S.; Pavlides, S. Temporal evolution of crustal rotation in the Aegean region based on primary geodetically-derived results and palaeomagnetism. Acta Geod. Et Geophys. 2022, 57, 317–334. [Google Scholar] [CrossRef]
- Müller, M.D.; Geiger, A.; Kahle, H.G.; Veis, G.; Billiris, H.; Paradissis, D.; Felekis, S. Velocity and deformation fields in the North Aegean domain, Greece, and implications for fault kinematics, derived from GPS data 1993–2009. Tectonophysics 2013, 597, 34–49. [Google Scholar] [CrossRef]
- Nyst, M.; Thatcher, W. New constraints on the active tectonic deformation of the Aegean. J. Geophys. Res. Solid Earth 2004, 109. [Google Scholar] [CrossRef] [Green Version]
- Wilkinson, M.W.; McCaffrey, K.J.; Jones, R.R.; Roberts, G.P.; Holdsworth, R.E.; Gregory, L.C.; Iezzi, F. Near-field fault slip of the 2016 Vettore Mw 6.6 earthquake (Central Italy) measured using low-cost GNSS. Sci. Rep. 2017, 7, 4612. [Google Scholar] [CrossRef] [PubMed]
- Choi, S.-J.; Ghim, Y.-S.; Cheon, Y.; Ko, K. The first discovery of Quaternary fault in the Western part of the South Yangsan fault-Sinwoo site. Econ. Environ. Geol. 2019, 52, 251–258. [Google Scholar]
- Oh, J.-S.; Kim, D.-E. Lineament extraction and its comparison using DEMs based on LiDAR, digital topographic map, and aerial photo in the central segment of Yangsan Fault. J. Korean Geogr. Soc. 2019, 54, 507–525. [Google Scholar]
- Langbein, J.; Bock, Y. High-rate real-time GPS network at Parkfield: Utility for detecting fault slip and seismic displacements. Geophys. Res. Lett. 2014, 31. [Google Scholar] [CrossRef]
- Barrile, V.; Meduri, G.M.; Bilotta, G. Monitoring and GPS controls, over time, of the active fault in Castrovillari. In Proceedings of the 7th International Conference on Environmental and Geological Science and Engineering (Eg’14), Salerno, Italy, 3–5 June 2014; pp. 169–175. [Google Scholar]
- Langbein, J.; Murray, J.R.; Snyder, H.A. Coseismic and initial postseismic deformation from the 2004 Parkfield, California, earthquake, observed by Global Positioning System, electronic distance meter, creepmeters, and borehole strainmeters. Bull. Seismol. Soc. Am. 2006, 96, S304–S320. [Google Scholar] [CrossRef]
- Ozawa, S.; Nishimura, T.; Munekane, H.; Suito, H.; Kobayashi, T.; Tobita, M.; Imakiire, T. Preceding, coseismic, and postseismic slips of the 2011 Tohoku earthquake. J. Geophys. Res. 2012, 117, B7. [Google Scholar]
- Kim, Y.-S.; Jin, K.-M.; Choi, W.-H. Understanding of active faults: A review for recent researches. J. Geol. Soc. Korea 2011, 47, 723–752. [Google Scholar]
- Kim, H.-U.; Hwang, E.-H.; Lee, H.-S.; Lee, D.-K. A study on the analysis of crust deformation on the Korean Peninsula after the Tohoku Earthquake using GNSS observation. J. Korean Soc. Surv. Geod. Photogramm. Cartogr. 2020, 38, 689–696. [Google Scholar]
- Kim, S.-K. Establishing a Dynamic National Geodetic Reference Frame considering Discontinuity of Crustal Movement. Master’s Thesis, Sejong University, Seoul, Republic of Korea, 2013. [Google Scholar]
- Kim, D.-S. Geodetic Studies of Post-Seismic Crustal Deformations Occurring in the Southern Korean Peninsula due to the Tohoku-oki Earthquake. Ph.D. Thesis, Inha University, Incheon, Republic of Korea, 2015. [Google Scholar]


| Station | Receiver | Antenna | Latitude [deg] | Longitude [deg] | Height [m] | Organization |
|---|---|---|---|---|---|---|
| BOGG | SEPT POLARX5 | SEPCHOKE_B3E6 | 35.701 | 129.206 | 117.955 | KIGAM |
| CGUG | SEPT POLARX5 | SEPCHOKE_B3E6 | 35.819 | 129.269 | 191.804 | KIGAM |
| CHWN | TRIMBLE ALLOY | TRM59800.00 | 35.236 | 128.692 | 88.346 | NGII |
| DUCG | SEPT POLARX5 | SEPCHOKE_B3E6 | 35.744 | 129.176 | 101.967 | KIGAM |
| GCNG | SEPT POLARX5 | SEPCHOKE_B3E6 | 35.817 | 129.136 | 107.004 | KIGAM |
| GHDG | Trimble Alloy | TRM59800.00 | 35.270 | 128.985 | 50.0011 | NGII |
| GKPG | SEPT POLARX5 | SEPCHOKE_B3E6 | 35.890 | 128.606 | 110.664 | KIGAM |
| GYJU | TRIMBLE NETR9 | HXCCGX601A | 35.755 | 129.039 | 225.153 | NGII |
| GYOI | Trimble Alloy | TRM59800.00 | 35.673 | 129.288 | 154.311 | NGII |
| HDBG | SEPT POLARX5 | SEPCHOKE_B3E6 | 35.733 | 129.398 | 180.316 | KIGAM |
| MYSO | Trimble Alloy | TRM59800.00 | 35.501 | 128.815 | 62.693 | NGII |
| POHG | SEPT POLARX5 | SEPCHOKE_B3E6 | 36.079 | 129.352 | 76.678 | KIGAM |
| POHN | Trimble NetR9 | HXCCGX601A | 35.910 | 129.402 | 130.743 | NGII |
| POSG | SEPT POLARX5 | SEPCHOKE_B3E6 | 36.025 | 129.311 | 78.974 | KIGAM |
| PSJA | Trimble Alloy | TRM59800.00 | 35.382 | 129.248 | 148.601 | NGII |
| PUSN | TRIMBLE NETR9 | TRM59800.00 | 35.233 | 129.074 | 158.645 | NGII |
| TEGN | TRIMBLE NETR9 | TRM59800.00 | 35.906 | 128.801 | 106.377 | NGII |
| WOLS | TRIMBLE NETR9 | TRM59800.00 | 35.503 | 129.416 | 95.935 | NGII |
| WSJG | Trimble Alloy | TRM59800.00 | 35.565 | 129.317 | 100.631 | NGII |
| WSSN | Trimble Alloy | TRM59800.00 | 35.545 | 129.118 | 131.206 | NGII |
| YANS | SEPT POLARX5 | SEPCHOKE_B3E6 | 35.345 | 129.068 | 233.777 | KIGAM |
| YCHG | Trimble Alloy | TRM59800.00 | 35.980 | 129.106 | 175.149 | NGII |
| YCIG | Trimble Alloy | TRM59800.00 | 36.052 | 129.040 | 200.111 | NGII |
| YCMP | Trimble Alloy | TRM59800.00 | 35.972 | 128.926 | 154.256 | NGII |
| Station | Receiver | Antenna | Latitude [deg] | Longitude [deg] | Height [m] | Organization |
|---|---|---|---|---|---|---|
| AJAC | LEICA GR50 | TRM115000.00 | 41.927 | 8.763 | 99 | IGS |
| BJFS | TRIMBLE NETR9 | TRM59900.00 | 39.609 | 115.892 | 87 | IGS |
| BRST | TRIMBLE ALLOY | TRM57971.00 | 48.380 | −4.497 | 66 | IGS |
| CHAN | ASHTECH UZ-12 | ASH701945C_M | 43.791 | 125.443 | 268 | IGS |
| CHUM | TRIMBLE NETRS | AOAD/M_T | 42.999 | 74.751 | 716 | IGS |
| CRO1 | SEPT POLARX5TR | JAVRINGANT_DM | 17.757 | −64.584 | −31 | IGS |
| DARW | SEPT POLARX5 | JAVRINGANT_DM | −12.844 | 131.133 | 125 | IGS |
| DRAG | JAVAD TRE_3 DELTA | ASH700936D_M | 31.593 | 35.392 | 32 | IGS |
| FALK | SEPT POLARX5 | ASH701945E_M | −51.694 | −57.874 | 51 | IGS |
| FLIN | SEPT POLARX5 | NOV750.R4 | 54.726 | −101.978 | 320 | IGS |
| HERT | LEICA GRX1200GGPRO | LEIAT504GG | 50.867 | 0.334 | 83 | IGS |
| HYDE | LEICA GRX1200GGPRO | LEIAT504GG | 17.417 | 78.551 | 442 | IGS |
| INVK | TRIMBLE NETR9 | ASH701945C_M | 68.306 | −133.527 | 46 | IGS |
| KRGG | TRIMBLE ALLOY | LEIAR25.R4 | −49.352 | 70.256 | 73 | IGS |
| LHAZ | LEICA GR25 | LEIAR25.R4 | 29.657 | 91.104 | 3622 | IGS |
| LROC | LEICA GR25 | ASH701945B_M | 46.159 | −1.219 | 58 | IGS |
| MAS1 | SEPT POLARX5 | LEIAR25.R4 | 27.764 | −15.633 | 197 | IGS |
| MATE | SEPT POLARX5 | TRM59800.00 | 40.649 | 16.704 | 536 | IGS |
| NKLG | Trimble Alloy | TRM59800.00 | 0.354 | 9.672 | 32 | IGS |
| STJO | JAVAD TRE_3N DELTA | AOAD/M_T | 47.595 | −52.678 | 153 | IGS |
| TLSE | TRIMBLE ALLOY | TRM59800.00 | 43.561 | 1.481 | 207 | IGS |
| TOW2 | SEPT POLARX5 | LEIAR25.R3 | −19.269 | 147.056 | 88 | IGS |
| UNBJ | TPS LEGACY | TRM57971.00 | 45.950 | −66.642 | 23 | IGS |
| WES2 | TRIMBLE ALLOY | TWIVC6150 | 42.613 | −71.493 | 85 | IGS |
| ZIMM | TRIMBLE NETR9 | TRM29659.00 | 46.877 | 7.465 | 956 | IGS |
| Reference frame | IGS14 |
| Troposphere model | Dry/Wet GMF |
| Gravity model | EGM2008_SMALL |
| Nutation model | JAU2000R06 |
| Celestial ephemeris | JPL DE405 |
| Cut-off angle | 10° |
| Velocity [mm/year] | Direction/Azimuth [deg] | |
|---|---|---|
| 2018–2019 | 34.9 | 110.35 |
| 2020–2021 | 33.6 | 110.83 |
| num | Period | 17 July 2018–31 December 2019 | 1 January 2020–31 December 2021 | ||||||
|---|---|---|---|---|---|---|---|---|---|
| Triangular Network | (nstr) | (nstr) | (nstr) | (nstr) | (nstr) | (nstr) | (nstr) | ||
| 1 | CHWN-PUSN-YANS | 130.92 | −72.63 | 203.54 | 58.29 | 86.80 | 123.26 | 123.26 | 50.350 |
 |  | ||||||||
| 2 | BOGG-CGUG-DUCG | 192.62 | −25.41 | 218.03 | 167.20 | 39.01 | −36.67 | 75.68 | 2.33 |
 |  | ||||||||
| 3 | CGUG-DUCG-GCNG | 25.09 | −22.78 | 47.87 | 2.30 | 20.49 | −119.71 | 140.20 | −99.22 |
 |  | ||||||||
| 4 | BOGG-CGUG-HDBG | 85.88 | −85.75 | 171.63 | 0.12 | −3.01 | −73.17 | 70.16 | −76.18 |
 |  | ||||||||
| 5 | CGUG-GCNG-POSG | 48.37 | −87.93 | 136.30 | −39.56 | −22.99 | −118.41 | 95.41 | −141.41 |
 |  | ||||||||
| 6 | CGUG-HDBG-POSG | 225.04 | −131.47 | 356.52 | 93.57 | −36.34 | −77.69 | 41.35 | −114.03 |
 |  | ||||||||
| 7 | GCNG-POSG-TEGN | 47.23 | −18.53 | 65.76 | 28.70 | 21.54 | −77.58 | 99.13 | −56.03 |
 |  | ||||||||
| 8 | BOGG-HDBG-WOLS | 67.13 | −9.91 | 77.05 | 57.22 | 11.53 | −52.59 | 64.13 | −41.06 |
 |  | ||||||||
| 9 | BOGG-WOLS-YANS | 139.72 | −114.64 | 254.36 | 25.07 | −10.58 | −13.45 | 2.86 | −24.04 |
 |  | ||||||||
| 10 | CHWN-GKPG-TEGN | 2.77 | −102.73 | 105.50 | −99.96 | 7.49 | −8.92 | 16.41 | −1.430 |
 |  | ||||||||
Disclaimer/Publisher’s Note: The statements, opinions and data contained in all publications are solely those of the individual author(s) and contributor(s) and not of MDPI and/or the editor(s). MDPI and/or the editor(s) disclaim responsibility for any injury to people or property resulting from any ideas, methods, instructions or products referred to in the content. |
© 2023 by the authors. Licensee MDPI, Basel, Switzerland. This article is an open access article distributed under the terms and conditions of the Creative Commons Attribution (CC BY) license (https://creativecommons.org/licenses/by/4.0/).
Share and Cite
Kim, H.-U.; Bae, T.-S. Monitoring of Possible Activities of Yangsan Fault Zone Using GNSS. Appl. Sci. 2023, 13, 1862. https://doi.org/10.3390/app13031862
Kim H-U, Bae T-S. Monitoring of Possible Activities of Yangsan Fault Zone Using GNSS. Applied Sciences. 2023; 13(3):1862. https://doi.org/10.3390/app13031862
Chicago/Turabian StyleKim, Hee-Un, and Tae-Suk Bae. 2023. "Monitoring of Possible Activities of Yangsan Fault Zone Using GNSS" Applied Sciences 13, no. 3: 1862. https://doi.org/10.3390/app13031862