
Tasks Allocation Based on Fuzzy Rules in Fractional Assembly Line with Redundancy

School of Engineering, University of Basilicata, 85100 Potenza, Italy
Appl. Sci. 2023, 13(4), 2141; https://doi.org/10.3390/app13042141
Submission received: 10 January 2023
/
Revised: 2 February 2023
/
Accepted: 6 February 2023
/
Published: 7 February 2023
(This article belongs to the Section Mechanical Engineering)
Abstract
:In recent years, assembly line design methodologies have included the possibility of sharing tasks between stations. These approaches increase the throughput, improving the workload balance among the stations. Sharing operations can support the management of assembly lines with task redundancy. The redundancy of the tasks between two consecutive stations improves the robustness of the assembly line to unforeseen events. A control policy that allocates the shared tasks between two adjacent stations is crucial for the performance of the assembly line. This paper proposes a fuzzy approach to distributing the workload of the shared tasks between two consecutive stations. The fuzzy model allows for the distribution of the workload between the stations in a more gradual way. Simulations were conducted to allow for a performance evaluation with a model proposed in the literature. The results show how the fuzzy model improves all the performance measures evaluated; in particular, when the inter-arrival of the raw items is rather stable. In these conditions, the reduction of the average time and its standard deviation is about 50% to 80%, while the reduction of the work in process is about 60% to 90%. These benefits are obtained with a relevant increase of the variations of the average utilization of the stations.
1. Introduction
Assembly lines are used in the mass production of complex items found in many contexts such as in the automotive sector, the field of consumer electronics, home appliances, etc. The assembly lines consist of stations that perform the tasks needed to obtain the final items. The operations to complete the tasks of the stations can be performed manually, automatically, or through a collaboration between humans and robots (defined as Cobot [1]). The assembly line design defines the assignment of operations to the stations, maximizing workload balancing [2]. Classic design methodologies assign operations exclusively to a single station for maximum productivity. The precedence constraints that characterize the product and the timing of the tasks significantly limit the maximum achievable productivity. In recent years, the increase in productivity has also been pursued with greater automation and the introduction of human–robot collaboration systems [3,4,5]. The increasing automation in production lines leads to high investments, so maximizing productivity is of fundamental importance for the return on investment. Some unforeseen events such as the short failures of the stations [6] reduce the profitability of assembly lines due to the throughput loss with starvation or blocking of the stations. Approaches to improve productivity and mitigate the effects of unexpected events have been proposed in the recent literature. The introduction of additional flexibility in mixed-model lines by identical stations was proposed by Lopes et al. [7,8,9]. This approach leads to layout complications and can increase costs more than a fractional task allocation.
The concept of the fractional assembly line allows sharing of some tasks among the stations to reduce the cycle time with a higher throughput of the line [10]. Following this approach, two stations can share some tasks that represent additional balancing flexibility to reduce the cycle time and increase the throughput. The fractional assembly lines are characterized by some tasks split among stations; therefore, the related processing time is assigned to more stations that collaborate to perform the entire task. Some restrictions are necessary to allow the split of these tasks so that each station pair can only share one task, and each task can only be shared by two adjacent stations. The assembly line problem has to include the percentage of the task assigned to each station with the relative processing time part.
The introduction of buffers with preventive maintenance policies can mitigate the effects of short failures [11,12] increasing the capital costs and dimensions of the assembly lines. The redundancy of the operations in a flow line can reduce the effect of short failures avoiding the increment of capital costs and dimension [13,14]. This approach concerns the possibility to move some operations to downstream stations when a failure occurs. To support this configuration, the stations need the necessary equipment to perform some operations assigned at the upstream stations. The development of digitalization in production systems supports the development of sharing and redundancy approaches. In particular, digital transformation such as “Industry 4.0” enables the connectivity to collect data in real-time [15] which support the rapid reaction to unforeseen events by the reconfigurations of the stations [16,17]. The design models have to be modified to include the fractional assembly lines concept [10] and task redundancies [13,14], and the literature proposed some approaches in recent works. The models proposed in the literature define statically the fraction of the tasks assigned to the stations. Greater benefits could be obtained by using a dynamic allocation policy. The most recent works on this topic do not address the potential improvements derived from the dynamic allocation of fractional tasks.
This research proposed a fuzzy engine to support the dynamic allocation of the operations in fractional assembly lines with redundancy. This control policy supports the improvement of the assembly line’s performance when unforeseen events such as failures or process time fluctuations occur. The proposed model, based on fuzzy logic, allows for obtaining a continuous variation of the allocation percentages. Simulation models are proposed to evaluate the performance of the fuzzy approach compared to models proposed in the literature to highlight the main benefits.
The article is organized as follows: Section 2 presents the relevant literature and the contribution in the field of fraction and redundancy assembly lines. Section 3 describes the production control policies for the dynamic allocation of the fractional and redundancy tasks. The design of the experiments and performance measures evaluated are presented in Section 4, while Section 5 discusses the numerical results with the main findings. Finally, the conclusions and future developments are presented in Section 6.
2. Literature Review
Most of the literature considers the design of assembly lines with the assignment of tasks exclusively to one station. The classical assembly line balancing problem did not concern the possibility of sharing a task among two or more stations. A complete survey on dynamic line balancing was proposed by [18]. They provide an exhaustive classification of the tactical and operational models proposed for the dynamic line balancing problem. As discussed in this work as a future research path, studies of how shared workloads vary and the identity of shareable activities can provide important information. A dynamic line balancing problem can be defined as the assignment of some tasks exclusively to a particular station, while other tasks can be shared between two consecutive stations [19]. The numerical analysis shows how this approach reduces the cycle time of the line, improving productivity. Anuar and Bukchin [20] proposed a model for designing an assembly line with the possibility of sharing some tasks between two consecutive stations. The model identifies which tasks to share, looking for the best compromise between cycle time reduction and costs. After identifying the tasks to be shared, the model determines the workload on the stations. Pasupa and Suzuki [21] studied the sharing of tasks from the point of view of the skills of the operators and how to share the activities between them. The approach proposed focused on the skill of the operators to react to absenteeism, turnover, or the replacement of inexperienced workers. Another recent work that focused on the workers was proposed by Jeong and Jeon [22]. In this case, the help policy of a worker towards the downstream stations is considered. Grzechca and Foulds [23] studied the impact of changing the structure of the tasks of a product by splitting some tasks. The potential improvement depends strongly on the product structure. Lopes et al. [10] proposed mathematical models to design fractional assembly lines with three alternates: one to minimize the cycle time, and two other alternatives to minimize the storage of the buffers. The main findings of this research concern the higher productivity of the fractional assembly lines with higher robustness to the demand uncertainty, but the work in process inclines to increase.
The redundancy of the production lines concerns the possibility of re-allocating an entire operation when the station goes into the failure state to a downstream station. The digital transformation of the production systems enables the development of redundancy policies. Kahan et al. [24] proposed a mixed-integer model to support the redundancy in an automotive body shop when the equipment fails. The simulation results highlight the greater robustness of the line to these failures. Müller et al. [13,14,25] proposed several alternative models to design automatic production lines including the possibility of redundancy. The numerical results show how these approaches lead to a significant increase in productivity under stochastic conditions and failure events. Renna [26] presented four alternatives to design automated flow lines: one to maximize the number of redundancies, one to allocate one redundancy for each operation, and these two models are reformulated considering the optimization of the cycle time. The simulation results show the improvements both for push and pull systems control and the benefits are relevant when the Mean Time To Repair increases. Renna [27] integrated the design of mathematical models and the simulation to introduce redundancy in production lines with shared tasks. The first model minimizes the cycle time, while the second model provides several design alternatives, increasing the number of tasks shared with small increments of the optimized cycle time. Then, the simulations allow for identifying the best solution under particular conditions of failures or processing time variations. The simulations are conducted by introducing allocation policies for the shared tasks between the stations that work in real-time. These policies allocate the shared tasks completely to one or consecutive stations evaluating the level of the buffers.
Table 1 classifies the main characteristics of the literature review considering the following issues: the dynamic assembly line balancing (D-ALB) problem addressed, the cross-trained workers (C-TW), the objective of throughput maximalization (T-max) or cycle time minimization (CT-min), the application of heuristic rules, the possibility to apply work sharing (WS) for the fractional assembly line, the development of linear programming or mixed linear programming (LP), the main focus on the design of the flow line, the introduction of demand uncertain, the introduction of failures (Fail), the introduction of the redundancy of the tasks (red), the dynamic allocation (D-Al) of the percentage of the fractional tasks between two stations, the use of the fuzzy logic, and the introduction of the processing time uncertain (PT-un).
As highlighted in Table 1, the discussion of the works proposed on the fractional and redundancy assembly lines highlights how the model proposed is focused only on the design of the line, while the real-time allocation of the shared tasks is investigated only in one work. Few works studied the integration of the fractional and redundancy tasks together. The research proposed in this paper overcomes two of the principal limits of the literature which are the control of the percentage of the shared tasks between two adjacent stations in real-time (dynamic allocation) considering some states information of the flow line and the integration of the fractional tasks with the redundancy possibility. The model developed is based on a fuzzy inference engine that combines the information of the upstream and downstream buffers of each station to assign the percentage of the shared tasks between two adjacent stations. The focus of the dynamic allocation of the shared tasks is to improve the performance of the flow line under uncertain conditions. The fuzzy logic model developed allows for obtaining the dynamic distribution of the fractional tasks with more gradual changes under dynamic scenarios. Simulation models test the proposed fuzzy policy under different dynamic conditions of failures, processing time variations, and the inter-arrival time of the raw items. Then, the first research question of this paper is the following:
RQ1: Can a fuzzy policy support the dynamic allocation of the shared task in a fractional and redundancy assembly line optimizing the main performance measures?
The studies proposed in the literature do not evaluate the different causes of variations such as the parameters of the failures (mean time between failures and mean time to repair), several standard deviation levels of the processing time fluctuations, and the level of the utilization of the assembly line; then, the second research question is the following:
RQ2: What are the operating conditions of the assembly line in which the dynamic allocation of the shared tasks leads to better results?
3. Production Control
The reference context concerns an assembly line with four stations in which a set of operations T with a given processing time PTi are assigned to the stations. In this research, the focus is the production control of a redundancy fractional assembly line; therefore, the assembly line is designed. The design step of the assembly line assigns the operations to the stations. In the case of the fractional assembly line, some operations are fully assigned to a station, while other operations are shared between stations. The fractional operations are assigned with a defined percentage to the stations following the design model result. Following the main works proposed in the literature, the fractional operations are shared between two adjacent stations. In the redundancy approach, considering that the two adjacent stations can perform the operations shared, it is possible to change the percentage allocated to the two stations to improve the performance when unforeseen events occur. This paper proposes an allocation model to dynamically change the percentage of the fractional operations distributed between the two stations. The allocation models proposed are based on the upstream and downstream buffer levels of the first station of the couple that share some operations (see Figure 1).
When the first workstation of the couple becomes free, a part leaves the upstream buffer and before entering the station, the percentage allocation of the shared operations is decided. The first approach tested proposed in the literature [27] evaluates the downstream buffer level of the first station of the couple. If the buffer level is under a threshold Th1, the shared operations are assigned completely to the second station of the couple. Otherwise, if the buffer level is over a threshold Th2, the shared operations are completely allocated to the first station of the couple. The goal is to maintain a constant flow of parts, but the allocation of the shared operations completely to the first or second station of the couple can lead to higher fluctuations of the workload of the stations.
Fuzzy Approach
The proposed approach considers both the upstream (UP) and downstream (DOWN) buffers for the definition of a decision-making model based on fuzzy logic that can also be extended to other indicators such as station efficiency, reliability, etc. The design model of the flow line determines the percentage of the shared operations to the first and second stations of a couple. The total time shared assigned to the first station is denoted as P%1, while the percentage assigned to the second station is P%2. The goal of the fuzzy model is to dynamically change the allocation of the shared operations with a more continuous variation. Then, the output of the model is a percentage variation x which is used to increase/decrease the allocation of the shared operations from the designed parameters as follows:
The value of x can be positive or negative; the positive value means a shift of the shared operations towards the first station (Equation (1)), while a negative value means a shift of the shared operations towards the second station (Equation (2)).
The fuzzy engine computes the value of x using a set of fuzzy rules that are reported in Table 2.
The fuzzy rules operate with the definition of the fuzzy sets for the buffers and the output value. The fuzzy set used for both upstream and downstream buffer levels is shown in Figure 2.
The fuzzy set for the output value x is shown in the Figure 3.
The composition of fuzzy rules follows the “min” operator considering the minimum value of the antecedent sets for each rule [28]. Following the notation of Figure 2, the consequents of the fuzzy rules yl, ym, and yh are computed as shown in Table 3 according the value of the buffer level “buffer”.
The value of the computed yl, ym, and yh determine the area (weight) of each output fuzzy set (Figure 3). The generic abscissa of each output fuzzy set is computed as follows:
and the related area is computed as follows:
abscissa = a + y*(b − a)
area = (b − absissa)*y*2 + (abscissa − a)*y
The crisp value (x value used in Equations (1) and (2)) is obtained by multiplying the area by each central value of the whole and dividing by the sum of the areas (centroid approach).
4. Simulation Environment
The simulations have been conducted considering three factors: the inter-arrival of the raw items, the failures, and the processing time variability. The inter-arrival studied are three cases: the first case considers the raw items always available to simulate the case with higher throughput; then, the inter-arrival follows an exponential distribution (with two possible values) that have a higher coefficient of variation (CV = 1); finally, the inter-arrival follows a normal distribution with means and 20% of the variation (CV = 0.2). The unforeseen events concern the failures and the variations in processing time. The failures are characterized by a Mean Time To Repair (MTTR fixed to 10) and a Mean Time Between Failures (MTBF) with two cases that lead to 96 % and about 92% of efficiency. The variations in the processing time follow a normal distribution of 20 % and 40 % of the standard deviation of the mean (see Table 4).
The fuzzy sets of the buffer levels (Figure 2) are the following:
- -
- al = −3; bl = 0; cl = 3;
- -
- am = 0; bm = 3; cm = 6;
- -
- ah = 3; bh = 6; ch = 9.
To investigate only the effect of the redundancy models, the simulation models consider a perfectly balanced line. Two different parts of the fractional tasks’ processing time are considered with the same cycle time. Table 5: the first case concerns a two-unit time of fractional processing time, while the second case considers an increment to four-unit time of the fractional processing time.
The models tested are the following: the first benchmark is a model without the possibility of task redundancy, while the second benchmark is a model proposed in the literature [27] that considers the buffer level to decide the allocation of the fractional tasks between two consecutive stations. This model allocates the entire fraction task to the first or second station of the couple. The better values for the buffer thresholds are obtained by simulating several cases to determine the best performance. The proposed fuzzy approach is compared to these two benchmarks to highlight the real added value by a fuzzy method. The simulation models are developed using the software package SIMUL8®. The simulation length is 28,800 min, enough to assure the stability of the simulations. Simulations are conducted following the terminating simulation approach. For each experimental class, a number of replicates were conducted, capably ensuring a confidence interval of 5% and 95% of the confidence level for each performance measure.
The performance measures to evaluate the proposed method are the following:
- -
- The throughput rate of the assembly line as the number of final items completed over the simulation horizon. In this study, this performance does not depend on the cycle time because the design of the flow line is provided.
- -
- The average time in the assembly line of the items: this average time includes the production time in the stations and the time blocked in the queue when the stations are working on other items or are in a failure state. This measure determines the lead time which is a relevant metric to evaluate how quickly the flow line can respond to changing market needs.
- -
- The standard deviation of the average time in the assembly line to evaluate the stability of the average time: this metric evaluates the stability of the average time in the system and, therefore, of the lead time.
- -
- The work in process of the assembly line as the sum of the items in queues: this metric evaluates the costs due to the temporary inventory of the items and space needed for the buffer.
- -
- The average working of the stations which is an index of the energy consumption;
- -
- The coefficient of variation of the working of the stations as the uniform distribution of the work among the stations. The fluctuation of the working among the stations is a relevant metric for the maintenance policies.
5. Numerical Results
The simulation results are compared to the first benchmark which is the model without redundancy. Table 6 reports the legend used for the graphs of the results; the first letter “X” denotes the number of the case study reported in Table 3. The second letter can be “Q” for the benchmark proposed in [27] and “F” for the fuzzy model. The fuzzy models are tested in four cases:
- -
- “a”, it has been considered that only the processing time of the fractional tasks assigned to the upstream station can be allocated to the downstream station (first case Table 4).
- -
- “b”, it has been considered that the total processing time of the fractional tasks of the couple stations can be allocated between the upstream and downstream station (first case Table 4).
- -
- “c”, it has been considered that only the processing time of the fractional tasks assigned to the upstream station can be allocated to the downstream station (second case Table 4).
- -
- “d”, it has been considered that the total processing time of the fractional tasks of the couple stations can be allocated between the upstream and downstream station (second case Table 5).
The following figures report the performance measures studied for each inter-arrival condition for all models to provide a complete overview of the main effects as the percentage difference from the benchmark case. Figure 4 shows the percentage difference of the average time in system measures compared to the benchmark case without redundancy. The model with higher productivity where the raw items are always available highlights how the fuzzy models are always better than the queue models. The improvements are higher from fuzzy a to fuzzy d for all simulations. This means that the increment of the fractional processing time leads to improving this performance. The introduction of the inter-arrival time of the raw items drastically changes this performance. If the inter-arrival time follows an exponential distribution, which is characterized by a relevant variation, the queue models lead to better results. Generally, the improvements are lower than the case with raw items always available. If the inter-arrival time follows a normal distribution with a standard deviation of 10% or 20%, the fuzzy models lead to better results than the queue models. The coefficient of variation of the inter-arrival time has a relevant effect on this performance. The effect of the failures (cases 1 to 10) is well absorbed by the fuzzy models as shown in Figure 5.
Figure 5 shows the standard deviation of the average time in system as the percentage difference compared to the benchmark. The fuzzy models have the same behavior of the average time in system for the case in which the raw items are always available. When the inter-arrival time of the raw items is introduced (both exponential and normal), the queue models reduce the standard deviation of the average time in system. Then, the average time in system and standard deviation of this performance measure have the same behavior studying the different models.
Figure 6 reports the work in process (WIP) of the flow line as the percentage difference compared to the benchmark. The fuzzy models allow a relevant reduction of the work in process to be obtained in the case of maximum productivity. Additionally, for this performance, when the inter-arrival of the raw items follows an exponential distribution, the queue models is the better approach. The normal inter-arrivals show how the fuzzy models are more robust when the condition changes than the queue models.
Figure 7 shows the coefficient of variation of the average working of the stations to evaluate the uniform distribution among the stations. In the case of maximum productivity, the queue models lead to a more uniform working distribution among the stations, but as shown in the previous graphs, the performance of the fuzzy models is always better in this condition. When the inter-arrival time of the raw items follows a distribution, both normal and exponential, the queue models are less robust to the changing of the conditions than the fuzzy models. The fuzzy rules proposed take into account the buffer levels to dynamically change the allocation of the fractional tasks to keep the flow of items through the production line. The simulation tests the fuzzy model compared to the benchmark proposed in the literature considering failures and uncertainty in processing times.
From the analysis of the above figures, the following issues can be drawn:
- -
- The fuzzy models lead to better performance measures studied when the flow line works at higher productivity or the inter-arrival time of the raw items follows a normal distribution. These results highlight how the fuzzy approach works better when the production is more stable.
- -
- The queue models are the best approaches when the inter-arrival items follow an exponential distribution. Then, the queue models can react better to a relevant fluctuation in the inter-arrival time of the raw items.
- -
- Generally, the main improvements are obtained in the case of raw items always being available which leads to higher productivity which is often the case of the flow line applications.
The hypothesis of a balanced flow line designed to evaluate only the effects of the proposed method leads to a throughput rate very similar among the simulation experiments conducted. The differences are about 1%; for this reason the graphs of the throughput are not reported.
6. Conclusions and Future Development Paths
The productivity of the production lines can be improved with the introduction of fractional tasks in the design model, while the redundancy between two consecutive stations can reduce the impact of unforeseen events such as short failures or processing time fluctuations. This research proposes an allocation model based on the fuzzy logic of the fractional tasks considering the redundancy possibility between two consecutive stations. Then, it responds to the first research question asked: “Can a fuzzy policy support the dynamic allocation of the shared task in a fractional and redundancy assembly line optimizing the main performance measures?”
The numerical results of the simulation show how the fuzzy model can improve the performance of the production line with more stability when the conditions of the production lines change. The production lines with redundancy control have a relevant coefficient of variation of the stations’ use; the fuzzy model allows to drastically reduce this variation with more uniform use of the stations.
The second answer to the research question asks: “What are the operating conditions of the assembly line in which the dynamic allocation of the shared tasks leads to better results?”
The main effect on the fuzzy model proposed is the inter-arrival of the raw items in the production line. The fuzzy model works better when the fluctuation of the inter-arrival raw items is lower; the numerical results are better in the cases of raw items always available or following a normal distribution. When the inter-arrival follows an exponential distribution characterized by a high coefficient of variation (CV = 1), the improvements are lower.
Some limitations of the proposed research to investigate in future developments are the following. The costs to support the introduction of redundancy in equipment will be studied to evaluate the costs of the improvements obtained. In the case of assembly lines with operators, the learning and forgetting effects can be investigated.
Funding
This research received no external funding.
Institutional Review Board Statement
Not applicable.
Informed Consent Statement
Not applicable.
Data Availability Statement
Not applicable.
Conflicts of Interest
The author declares no conflict of interest.
References
- Boschetti, G.; Faccio, M.; Milanese, M.; Minto, R. C-ALB (Collaborative Assembly Line Balancing): A new approach in cobot solutions. Int. J. Adv. Manuf. Technol. 2021, 116, 3027–3042. [Google Scholar] [CrossRef]
- Scholl, A. Balancing and Sequencing Assembly Lines, 2nd ed.; Physica: Heidelberg, Germany, 1999. [Google Scholar]
- Graves, S.C.; Redfield, C.H. Equipment selection and task assignment for multiproduct assembly system design. Int. J. Flex. Manuf. Syst. 1988, 1, 31–50. [Google Scholar] [CrossRef]
- Takata, S.; Hirano, T. Human and robot allocation method for hybrid assembly systems. CIRP Ann. 2011, 60, 9–12. [Google Scholar] [CrossRef]
- Bingol, M.C.; Omur, A. Performing predefined tasks using the human–robot interaction on speech recognition for an industrial robot. Eng. Appl. Artif. Intell. 2020, 95, 103903. [Google Scholar] [CrossRef]
- Muller, C. Fault-Tolerant Flow-Line Design, an Example from an Automotive Body Shop. Master’s Thesis, University of Rhode Island, Kingston, RI, USA, 2013. [Google Scholar]
- Lopes, T.C.; Michels, A.S.; Sikora, C.G.S.; Molina, R.G.; Magatão, L. Balancing and cyclically sequencing synchronous, asynchronous, and hybrid unpaced assembly lines. Int. J. Prod. Econ. 2018, 203, 216–224. [Google Scholar] [CrossRef]
- Lopes, T.C.; Michels, A.S.; Sikora, C.G.S.; Molina, R.G.; Magatão, L. Mixed-model assembly line balancing with given buffers and product sequence: Model, formulation comparisons and case study. Ann. Oper. Res. 2020, 286, 475–500. [Google Scholar] [CrossRef]
- Lopes, T.C.; Pastre, G.V.; Michels, A.S.; Magatão, L. Flexible multimanned assembly line balancing problem: Model, heuristic procedure, and lower bounds for line length minimization. Omega 2020, 95, 102063. [Google Scholar] [CrossRef]
- Lopes, T.C.; Brauner, N.; Magatão, L. Assembly line balancing with fractional task allocations. Int. J. Prod. Res. 2022, 60, 1569–1586. [Google Scholar] [CrossRef]
- Nahas, N. Buffer allocation and preventive maintenance optimization in unreliable production lines. J. Intell. Manuf. 2017, 28, 85–93. [Google Scholar] [CrossRef]
- Renna, P. Adaptive policy of buffer allocation and preventive maintenance actions in unreliable production lines. J. Ind. Eng. Int. 2019, 15, 411–421. [Google Scholar] [CrossRef]
- Muller, C.; Weckenborg, C.; Grunewald, M.; Spengler, T.S. Consideration of redundancies in the configuration of automated flow lines. In Logistics Management; Mattfeld, S., Brinkmann, G., Eds.; Springer International Publishing: Cham, Switzerland, 2016. [Google Scholar]
- Müller, C.; Grunewald, M.; Spengler, T.S. Redundant configuration of automated flow lines based on “Industry 4.0”-technologies”. J. Bus. Econ. 2017, 87, 877–898. [Google Scholar] [CrossRef]
- Kamblea, S.S.; Gunasekaran, A.; Ghadge, A.; Raut, R. A performance measurement system for industry 4.0 enabled smart manufacturing system in SMMEs—A review and empirical investigation. Int. J. Prod. Econ. 2020, 229, 107853. [Google Scholar] [CrossRef]
- Cohen, Y.; Faccio, M.; Galizia, F.G.; Mora, C.; Pilati, F. Assembly system configuration through Industry 4.0 principles: The expected change in the actual paradigms. In Proceedings of the 20th IFAC World Congress, Toulouse, France, 9–14 July 2017; pp. 14958–14963. [Google Scholar]
- Argoneto, P.; Bruccoleri, M.; Lo Nigro, G.; Perrone, G.; Noto La Diega, S.; Renna, P.; Sudhoff, W. High level planning of reconfigurable enterprises: A game theoretic approach. CIRP Ann.—Manuf. Technol. 2016, 55, 509–512. [Google Scholar] [CrossRef]
- Schlüter, M.J.; Ostermeie, F.F. Dynamic line balancing in unpaced mixed-model assembly lines: A problem classification. CIRP J. Manuf. Sci. Technol. 2022, 37, 134–142. [Google Scholar] [CrossRef]
- Chen, J.; Askin, R.G. Throughput maximization in serial production lines with worksharing. Int. J. Prod. Econ. 2006, 99, 88–101. [Google Scholar] [CrossRef]
- Anuar, R.; Bukchin, Y. Design and operation of dynamic assembly lines using work-sharing. Int. J. Prod. Res. 2006, 44, 4043–4065. [Google Scholar] [CrossRef]
- Pasupa, T.; Suzuki, S. Impact of work-sharing on the performance of production line with heterogeneous workers. Int. J. Ind. Eng. Manag. 2019, 10, 284–302. [Google Scholar] [CrossRef]
- Jeong, I.-J.; Jeon, S. Balanceability of a work-sharing line using floating workers and its comparison with floating work strategy. Int. J. Prod. Res. 2021, 59, 5903–5912. [Google Scholar] [CrossRef]
- Grzechca, W.; Foulds, L.R. The assembly line balancing problem with task splitting: A case study. IFAC Pap. Line 2015, 48, 2002–2008. [Google Scholar] [CrossRef]
- Kahan, T.; Bukchin, Y.; Menassa, R.; Ben-Gal, I. Back-up strategy for robots’ failures in an automotive assembly system. Int. J. Prod. Econ. 2009, 120, 315–326. [Google Scholar] [CrossRef]
- Muller, C.; Spengler, T.S.; Sodhi, M.S. Robust flowline design for automotive body shops. In Proceedings of the 2014 Industrial and Systems Engineering Research Conference, Montreal, QC, Canada, 31 May–3 June 2014; pp. 3077–3085. [Google Scholar]
- Renna, P. Evaluation of redundant configurations and backup stations to support fault tolerant flow line design. Int. J. Adv. Manuf. Technol. 2019, 101, 825–837. [Google Scholar] [CrossRef]
- Renna, P. Evaluation of redundant configurations in assembly lines with fractional tasks. Prod. Eng. Res. Devel. 2022, 16, 857–867. [Google Scholar] [CrossRef]
- Mamdani, E.H. Application of Fuzzy Logic to Approximate Reasoning Using Linguistic Synthesis. IEEE Trans. Comput. 1977, C-26, 1182–1191. [Google Scholar] [CrossRef]
Figure 1.
Workload allocation.

Figure 2.
Fuzzy sets for the buffers’ level.
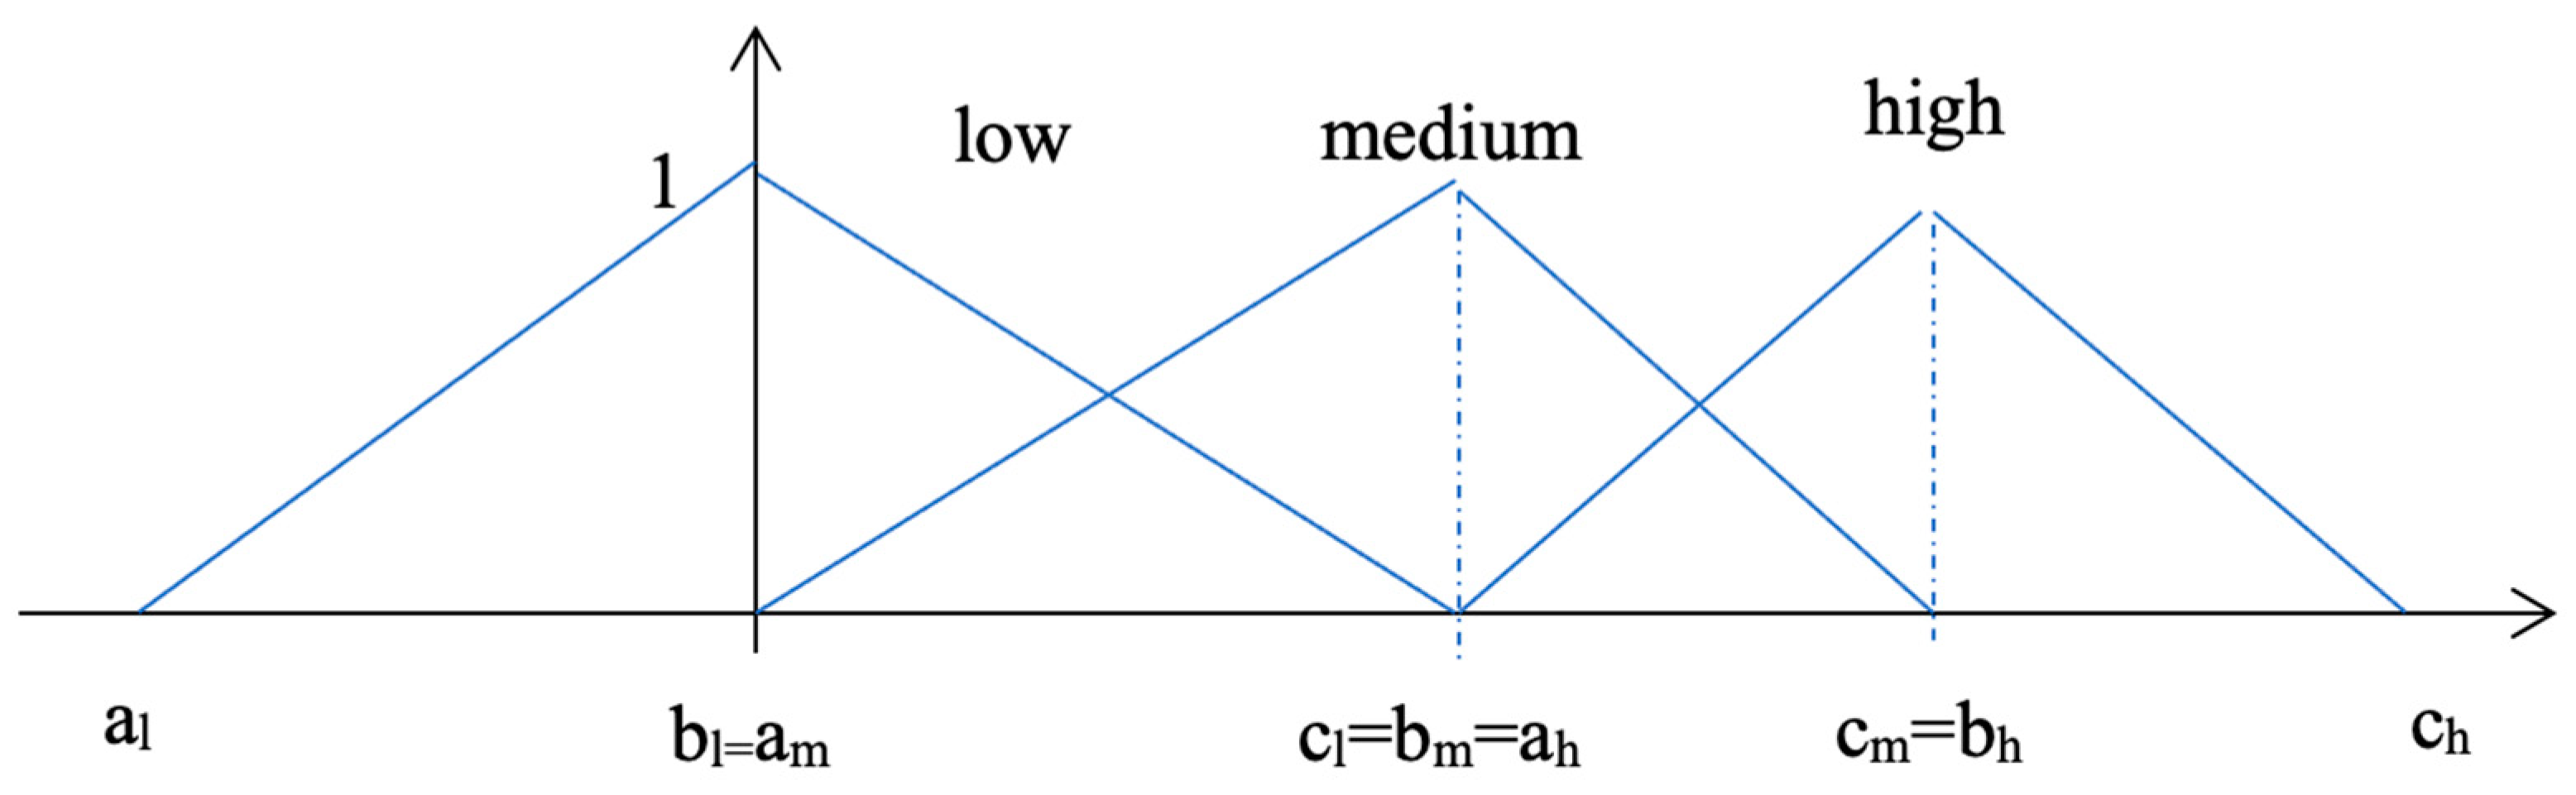
Figure 3.
Fuzzy sets for the output value.

Figure 4.
Average time in system.


Figure 5.
Average time in system—standard deviation.


Figure 6.
Work in process.


Figure 7.
CV average working.


Table 1.
Classification of the literature review.
| Refs. | D-ALB | C-TW | T-Max/CT-Min | Heuristic Rules | WS | LP | Design | Demand Uncertain | Fail | Red | D-Al | Fuzzy | PT-un |
|---|---|---|---|---|---|---|---|---|---|---|---|---|---|
| [19] | X | X | X | X | |||||||||
| [20] | X | X | X | X | X | ||||||||
| [21] | X | X | X | X | |||||||||
| [22] | X | X | X | X | X | ||||||||
| [23] | X | X | X | ||||||||||
| [10] | X | X | X | X | X | X | |||||||
| [24] | X | X | X | X | |||||||||
| [5,13,14] | X | X | X | X | X | ||||||||
| [26] | X | X | X | X | X | ||||||||
| [27] | X | X | X | X | |||||||||
| This paper | X | X | X | X | X | X | X |
Table 2.
Fuzzy rules.
| Rule No. | Buffer UP | Operator | Buffer Down | Output x | Rule |
|---|---|---|---|---|---|
| 1 | Low | And | Low | x is medium | R1 |
| 2 | Low | And | Medium | x is high | R2 |
| 3 | Low | And | High | x is very high | R3 |
| 4 | Medium | And | Low | x is low (negative) | R4 |
| 5 | Medium | And | Medium | x is medium | R5 |
| 6 | Medium | And | High | x is high | R6 |
| 7 | High | And | Low | x is very low (negative) | R7 |
| 8 | High | And | Medium | x is low | R8 |
| 9 | High | And | High | x is medium | R9 |
Table 3.
Output computation.
| Buffer Levels | yl | ym | yh |
|---|---|---|---|
| IF Buffer =0 | 1 | 0 | 0 |
| IF Buffer > 0 and <bm | 1 − (buffer/cl) | Buffer/cl | 0 |
| If Buffer = bm | 0 | 1 | 0 |
| If buffer > bm and ≤bh | 0 | 1 − ((buffer − bm)/(cm − bm)) | (buffer − ah)/(bh − ah) |
| If buffer > bh | 0 | 0 | 1 |
Table 4.
Experimental classes.
| Exp. No. | MTBF | MTTR | Inter-Arrival | Standard Deviation of the Processing Time |
|---|---|---|---|---|
| 1 | 200 | 10 | Always available | 0% |
| 2 | 100 | 10 | Always available | 0% |
| 3 | 200 | 10 | EXPO 13 | 0% |
| 4 | 100 | 10 | EXPO 13 | 0% |
| 5 | 200 | 10 | EXPO 14 | 0% |
| 6 | 100 | 10 | EXPO 14 | 0% |
| 7 | 200 | 10 | NORM (13 10%) | 0% |
| 8 | 100 | 10 | NORM (13 20%) | 0% |
| 9 | 200 | 10 | NORM (14 10%) | 0% |
| 10 | 100 | 10 | NORM (14 20%) | 0% |
| 11 | - | - | Always available | 20% |
| 12 | - | - | EXPO 13 | 20% |
| 13 | - | - | EXPO 14 | 20% |
| 14 | - | - | NORM (13 10%) | 20% |
| 15 | - | - | NORM (14 10%) | 20% |
| 16 | - | - | Always available | 40% |
| 17 | - | - | EXPO 13 | 40% |
| 18 | - | - | EXPO 14 | 40% |
| 19 | - | - | NORM (13 10%) | 40% |
| 20 | - | - | NORM (14 10%) | 40% |
Table 5.
Processing time of the stations.
| Station 1 | Station 2 | Station 3 | Station 4 | |
|---|---|---|---|---|
| First case | ||||
| Processing time assigned only to the station | 10 | 10 | 10 | 10 |
| Fractional processing time | 2 | 2 | 2 | 2 |
| Second case | ||||
| Processing time assigned only to the station | 8 | 8 | 8 | 8 |
| Fractional processing time | 4 | 4 | 4 | 4 |
Table 6.
Legend of the simulation results.
| XQ | XFa | XFb | XFc | XFd |
|---|---|---|---|---|
| Queue | Fuzzy A | Fuzzy B | Fuzzy C | Fuzzy D |
Disclaimer/Publisher’s Note: The statements, opinions and data contained in all publications are solely those of the individual author(s) and contributor(s) and not of MDPI and/or the editor(s). MDPI and/or the editor(s) disclaim responsibility for any injury to people or property resulting from any ideas, methods, instructions or products referred to in the content. |
© 2023 by the author. Licensee MDPI, Basel, Switzerland. This article is an open access article distributed under the terms and conditions of the Creative Commons Attribution (CC BY) license (https://creativecommons.org/licenses/by/4.0/).
Share and Cite
MDPI and ACS Style
Renna, P. Tasks Allocation Based on Fuzzy Rules in Fractional Assembly Line with Redundancy. Appl. Sci. 2023, 13, 2141. https://doi.org/10.3390/app13042141
AMA Style
Renna P. Tasks Allocation Based on Fuzzy Rules in Fractional Assembly Line with Redundancy. Applied Sciences. 2023; 13(4):2141. https://doi.org/10.3390/app13042141
Chicago/Turabian StyleRenna, Paolo. 2023. "Tasks Allocation Based on Fuzzy Rules in Fractional Assembly Line with Redundancy" Applied Sciences 13, no. 4: 2141. https://doi.org/10.3390/app13042141
Note that from the first issue of 2016, this journal uses article numbers instead of page numbers. See further details here.