Featured Application
This study can be used for stability analysis of surrounding rock and optimization of an underground cavern excavation scheme.
Abstract
The surrounding rock stability of an underground cavern group is an important issue in the process of cavern excavation, which has the characteristics of large displacement, discontinuity and uneven deformation, so the calculation and analysis are very complicated. The optimized discontinuous deformation analysis for rock failure method was adopted to analyze the stability of the surrounding rock of a real underground engineering cavern group under different excavation schemes. The cracking process of surrounding rock under different excavation schemes, the depth of crack expansion and the vertical displacement of the arch and bottom floor were obtained, and the following conclusions are drawn: (a) After the completion of the excavation, the stability problems mainly appeared in the surrounding rocks of the arch, left wall, right wall and bottom floor of the main powerhouse, in the surrounding rocks of the arch, left wall and bottom floor of the main transformer chamber and in the surrounding rocks of the arch, right wall and bottom floor of the tailrace surge tank. (b) Fault f2 has an influence on the stability of the surrounding rock of the tailrace surge tank, while fault f1 has no influence on the stability of the cave group. (c) The scheme of simultaneous excavation of three caverns shows the advantages in the crack propagation depth of surrounding rock and vertical displacements of caverns.
1. Introduction
Since the beginning of the 21st century, as the global population has continued to grow, the development and use of underground space has become a research focus; the surrounding rock (SR) stability of underground projects is one of the outstanding engineering geology problems in underground engineering. The stability problem of surrounding rock refers to the phenomenon of excessive deformation or SR failure that hinders production and use or safety, such as side wall extrusion, vault collapse, support fracture, sudden rock burst, SR cracking, floor heave, etc. [1]. From the point of view of rock mechanics, before excavation, the underground cavern is in a certain state of equilibrium and the original equilibrium state is broken by the construction disturbance excavation, making the SR unload and rebound to the direction of the free surface and leading to SR mass stress redistribution within certain limits of the excavation face; thus, the stress state, displacement state, plastic zone distribution state and the support construction loading state of SR during the construction period are decided, which have an impact on the overall SR stability of cavern [2,3,4,5]. The stability of the SR of an underground cavern is related to the depth of the cavern, the magnitude and distribution features of initial in situ stress, the conditions of the joints and faults of SR mass, the scale and size, the arrangement, the scheme and sequence of excavation and support of cavern group engineering and the groundwater [6,7,8,9].
2. Evaluation Methods on Rock Stability
The SR stability of underground caverns is a non-linear mechanical problem characterized by large displacement, discontinuity and non-uniform deformation, so the computational analysis is complex [10,11,12,13]. With the progression in computer technology, the scientific research of rock mechanics has been continuously developed and the theory and technology have been constantly updated. There are many research methods to study the SR stability of underground caverns, and new research methods are also constantly emerging [14,15,16,17]. At present, the international evaluation methods of the SR stability of caverns mainly include two aspects: one is a qualitative analysis method and the other is a quantitative analysis method [6].
2.1. Qualitative Analytical Method
Two kinds of qualitative analysis methods are currently commonly used: one is the SR classification method, and the other is the stereographic projection method [18].
The SR classification method comprehensively considers the engineering geological conditions, rock mass characteristics and dynamic observation data of underground caverns and combines this with engineering experience to make a relatively correct evaluation [19]. At present, the commonly used classification methods of SR include the rock quality designation (RQD) method [20], rock structure rating (RSR) method [21], rock mass rating (RMR) method [22], Q-system (Q) method [23], etc. Guo proposed a full-hole wall optical imaging method of drilling holes, as a quality classification auxiliary method of rock mass, to make the visualization of rock mass classification stronger [24]. Yang put forward that a GIS system is a boundary method of information, graphical and intelligent rock mass quality classification [25].
The stereographic projection method shows the spatial combination relationship of rock mass structural plane or working plane by drawing, so as to determine the spatial geometry, joint or fault orientation and boundary of a rock mass; this method can effectively analyze the stability characteristics of a rock mass.
2.2. Quantitative Analysis Method
2.2.1. Mathematical Method
The mathematical method is a method of abstracting and simplifying complex geological archetypes into simple calculation models and using mathematical tools to work out the problem and calculate the stress distribution of SR. This method is often used to solve circular caverns, and for other cavern shapes, approximate solutions can be obtained by the complex function method. The mathematical method has the characteristics of high precision, fast analysis speed and suitability for regular study, so it is still a basic method for SR stability analysis in engineering practice [15,26,27].
2.2.2. Physical Test Simulation Method
The physical experiment simulation method is based on the principle of similarity and dimensional analysis. It studies the stability and stress distribution of SR by means of a model physical simulation test. The commonly used physical test simulation methods include the model test, centrifugal test and photoelastic method. Li et al. and Jin et al. summarized the influence law of tunnel excavation on the stress field and displacement field of surrounding rock through large-scale geomechanical model experimentation, reproduced the failure process of the surrounding rock and guided the information construction of a tunnel [28,29]. Huang et al. studied the influence of shield tunneling on pipeline deformation under vertical, oblique and parallel conditions based on a shield simulation test and took Hefei Metro Line 3 as an example [30].
2.2.3. Numerical Simulation Analysis Method
Numerical simulation analysis is a method used to obtain the stress distribution and SR stability by abstracting the engineering prototype and using numerical analysis software. Due to the intricacies of engineering rock mass, the accuracy of the mathematical method is not sufficient and the physical test simulation method is expensive and not easy to realize, so the numerical simulation analysis method has become a significant tool to solve the rock and soil problems under complex geological conditions, which has the advantages of a short period, low cost, simplicity, etc. [31]. At present, the numerical simulation analysis method is more widely used than the mathematical method. There are two common methods of numerical simulation analysis. The first one is the continuum mechanics method, which generally assumes that rock mass is an isotropic continuum. This method includes the finite element method, boundary element method, finite difference method, etc. Tian used the finite element software Abaqus to research the variation in soil and support stress in the bifurcation section of the cavern group under different construction sequence conditions and put forward a reasonable construction scheme for the bifurcation section [32]. The finite difference method was used by Zhou et al. to evaluate the excavation scheme and stability of SR of a 3D cross-cavern group of a hydropower station [33]. The second common numerical simulation analysis method is the discontinuous mechanics method, because the rock mass of an underground cavern contains discontinuities such as cracks, joints and faults, which lead to discontinuity and anisotropy of rock mass. The discontinuous mechanics method is closer to practical engineering. Discontinuous mechanics methods include the discrete element method, block element method, discontinuous deformation analysis (DDA) method, displacement discontinuity method [34], etc. Li et al. used the discrete element method to study the excavation influence of an underground cavern group of a high in situ stress hydropower station and found that the maximum displacement of the cavern group caused by excavation unloading mostly concentrated near the spandrel [35].
The theory of discontinuous deformation analysis of a block system was proposed by Dr. Shi Genhua, after the key block theory (KBT) was proposed by Professor Goodman, for rock mass stability analysis to simulate large deformation of a bulk system by taking Professor Goodman’s ideas one step further. Dr. Shi Genhua published a paper on this method in 1984, but its complete expression was given in his doctoral dissertation, which was completed in 1988 [36]. The DDA model is a kind of discontinuous mechanics model, where the deformation between element interfaces can be discontinuous and the shape of elements can be an arbitrary combination of convex, concave or polygon. The contact between elements does not necessarily require contact between corner points, which is significantly different from the finite element method. At the same time, DDA can reflect the features of large deformation and large displacement of the block system, which is similar to the calculation results of discrete elements, but the mechanical principle is completely different. The basic principle of discrete elements is Newton’s second law; compared with this, the DDA method is based on a more rigorous mechanical foundation in dealing with the mechanical behavior of a block system [37,38].
Wu et al. used DDA to research the influence of regional in situ stress levels, anchorage, rock mass structural conditions, and structural plane strength parameters of a cavern on the deformation of the SR of a cavern [39]; Fu et al. used the DDA method to study the step-by-step excavation of an underground cavern group in Dagangshan Power Station, established models of the underground cavern group under different through-joint combinations according to geological exploration data, and analyzed its failure mode and failure mechanism [40]. Ke applied the DDA method and limit equilibrium method to study the stability of a slope and pointed out the superiority of the DDA method [41]. Ning et al. used the DDA method to realize a jointed rock mass blasting simulation under the action of explosive production material and reproduced the process of hole expansion, rock mass destruction, throwing block and blasting pile formation in the rock blasting process [42].
Since some algorithms in DDA could not work out the destruction issue of jointed rock mass with discontinuity, Jiao et al. constructed a method to study the destruction process of jointed rock mass, which is the discontinuous deformation analysis for rock failure (DDARF) method [43,44]. The DDARF method can research the overall process of joint initiation, propagation, connection and rock breakage, which can be used for the calculation and analysis of not only complete rock mass, but also discontinuous rock mass [45].
However, DDARF has a limitation in the process of model building, which is that it can only generate uniform grids, that is, it can either generate all the same fine grids in the whole model, or generate all the same sparse grids in the whole model, which greatly limits the use of DDARF, because considering the simulation accuracy, dense grids should be generated, and if all the grids are generated to be dense grids in the model, the number of grids in the model will be greatly increased, which will not only increase the calculation workload and reduce the calculation efficiency, but also may cause calculation errors and result in calculation failure; this limitation means that DDARF is unsuitable for large-scale geotechnical engineering [46,47]. Further, Ma et al. optimized DDARF. The optimized DDARF can generate heterogeneous grids and generate grids of any size in any area of the model, which could ensure calculation accuracy and improve calculation efficiency at the same time [45].
This paper is based on the optimized DDARF method to simulate the process of excavation of a real underground cavern group project through the stability analysis of SR mass after excavation to determine the optimal excavation plan.
3. Analysis of SR Stability and Excavation Scheme of a Large Underground Cavern Group
3.1. Project Profile
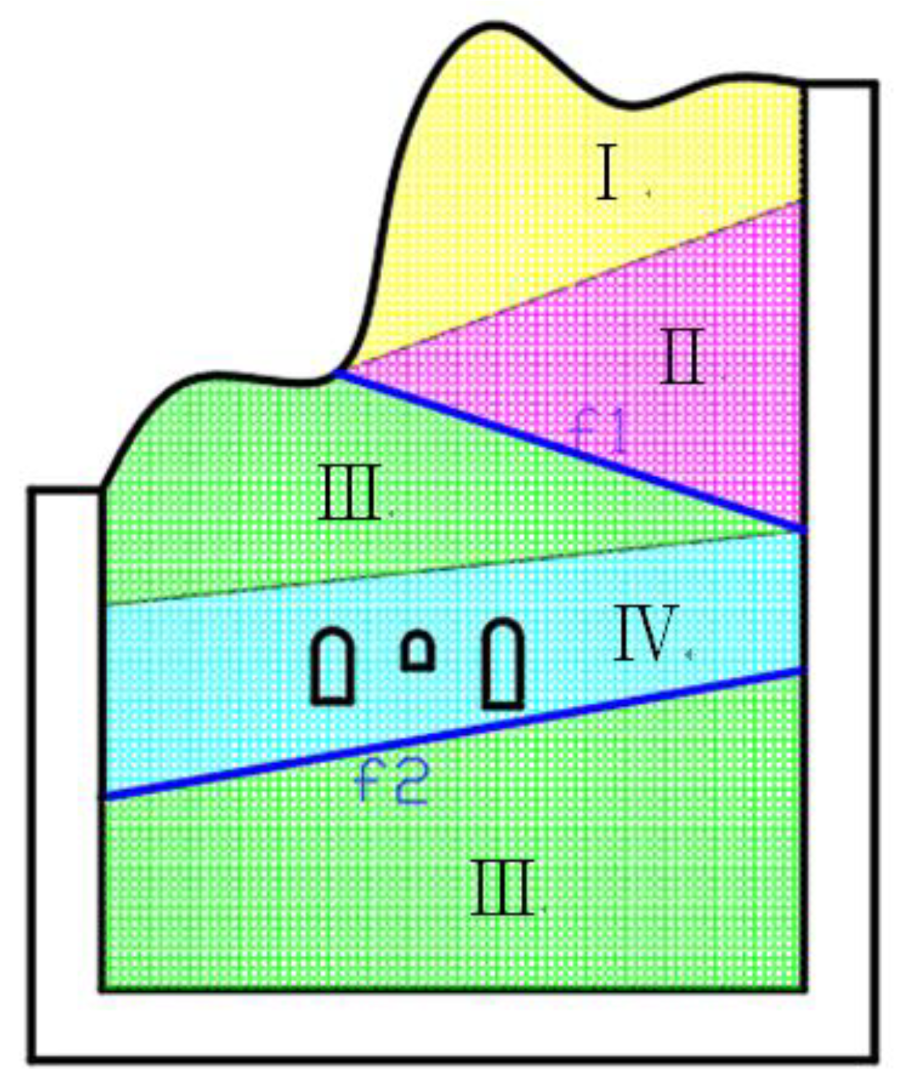
There is a hydropower station with a total installed capacity of 1800MW located in Kangding County, Sichuan Province, China, on the upper reaches of Dadu River. The underground cavern group of the hydropower station is composed of three cavern groups: the main powerhouse cavern (MP cavern), the main transformer chamber cavern (MTC cavern) and the tailrace surge tank cavern (TST cavern). The buried depth of the underground cavern group is about 180–420 m, and the SR mass is mainly composed of Yanshanian porphyritic black cloud K-feldspar granite interspersed with granitic pegmatite dikes less than 1m thick. According to the statistics, pegmatite dike accounts for about 10.67%, the rock mass is fresh, compact and hard, and the rock strata occurrence is N50°–70°E/NW < 32–51°; two faults, f1 and f2, are mainly considered.
The section forms of the three caverns are round arch and straight wall, and the three caverns are arranged in parallel; the model can be simplified to a two-dimensional plane model. The section size of the MP cavern is 25 × 50 m (width × height), the section size of the MTC cavern is 18 × 24 m (width × height), and the section size of the TST cavern is 24 × 60 m (width × height).
3.2. Model Building
The section where unit 3 is located is selected to establish a two-dimensional model for stability analysis. The geometric dimensions of the model are shown in Figure 1.
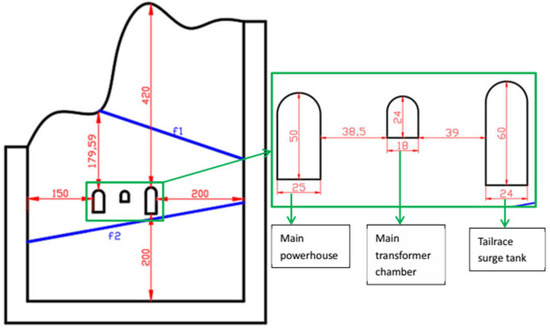
Figure 1.
Geometric dimensions (m) of the model.
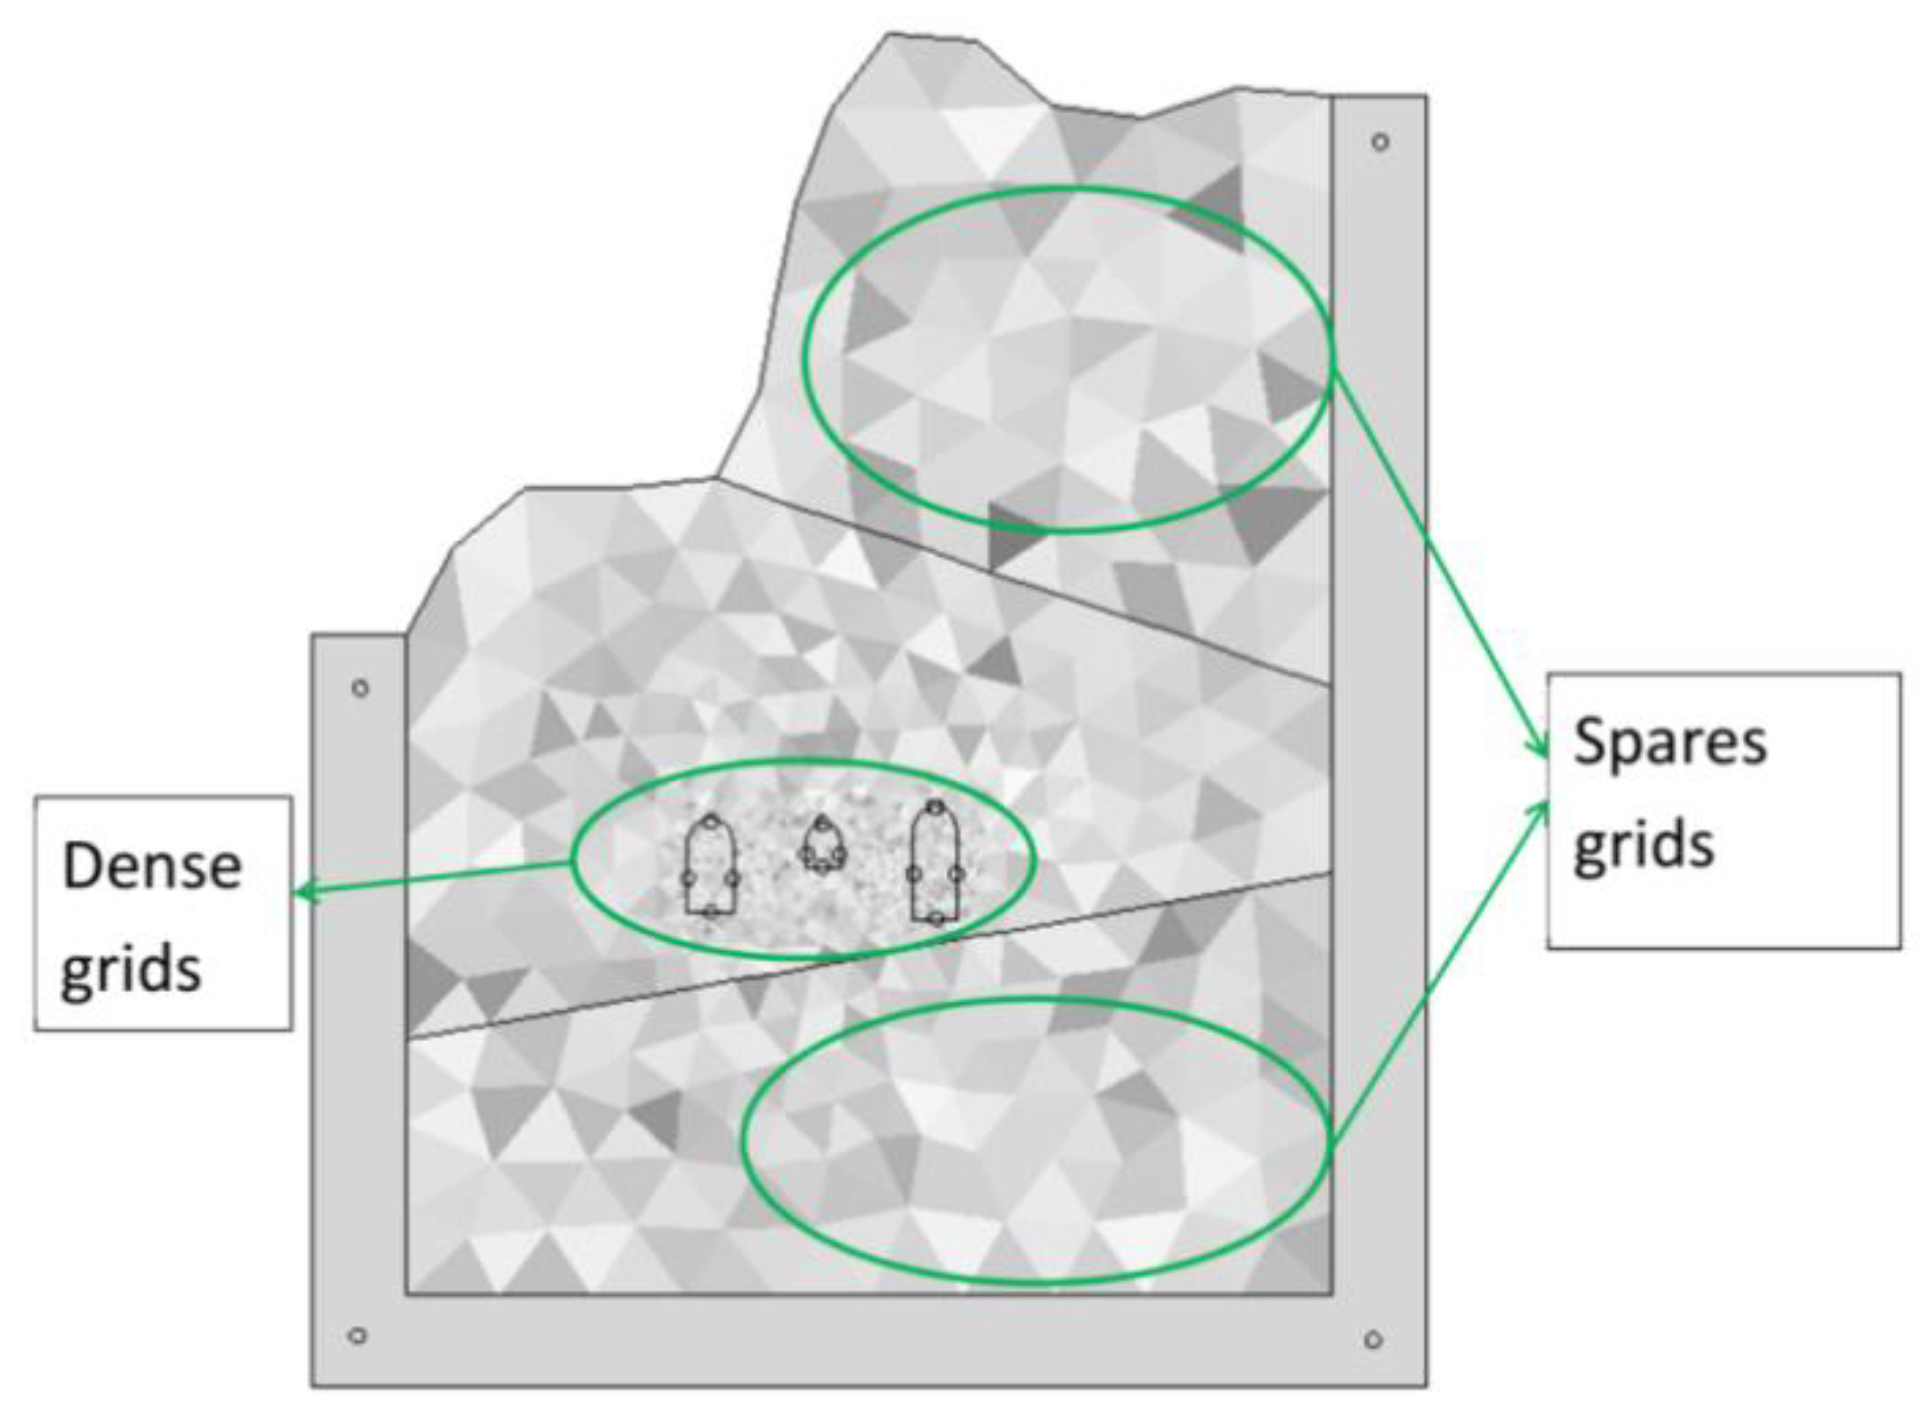
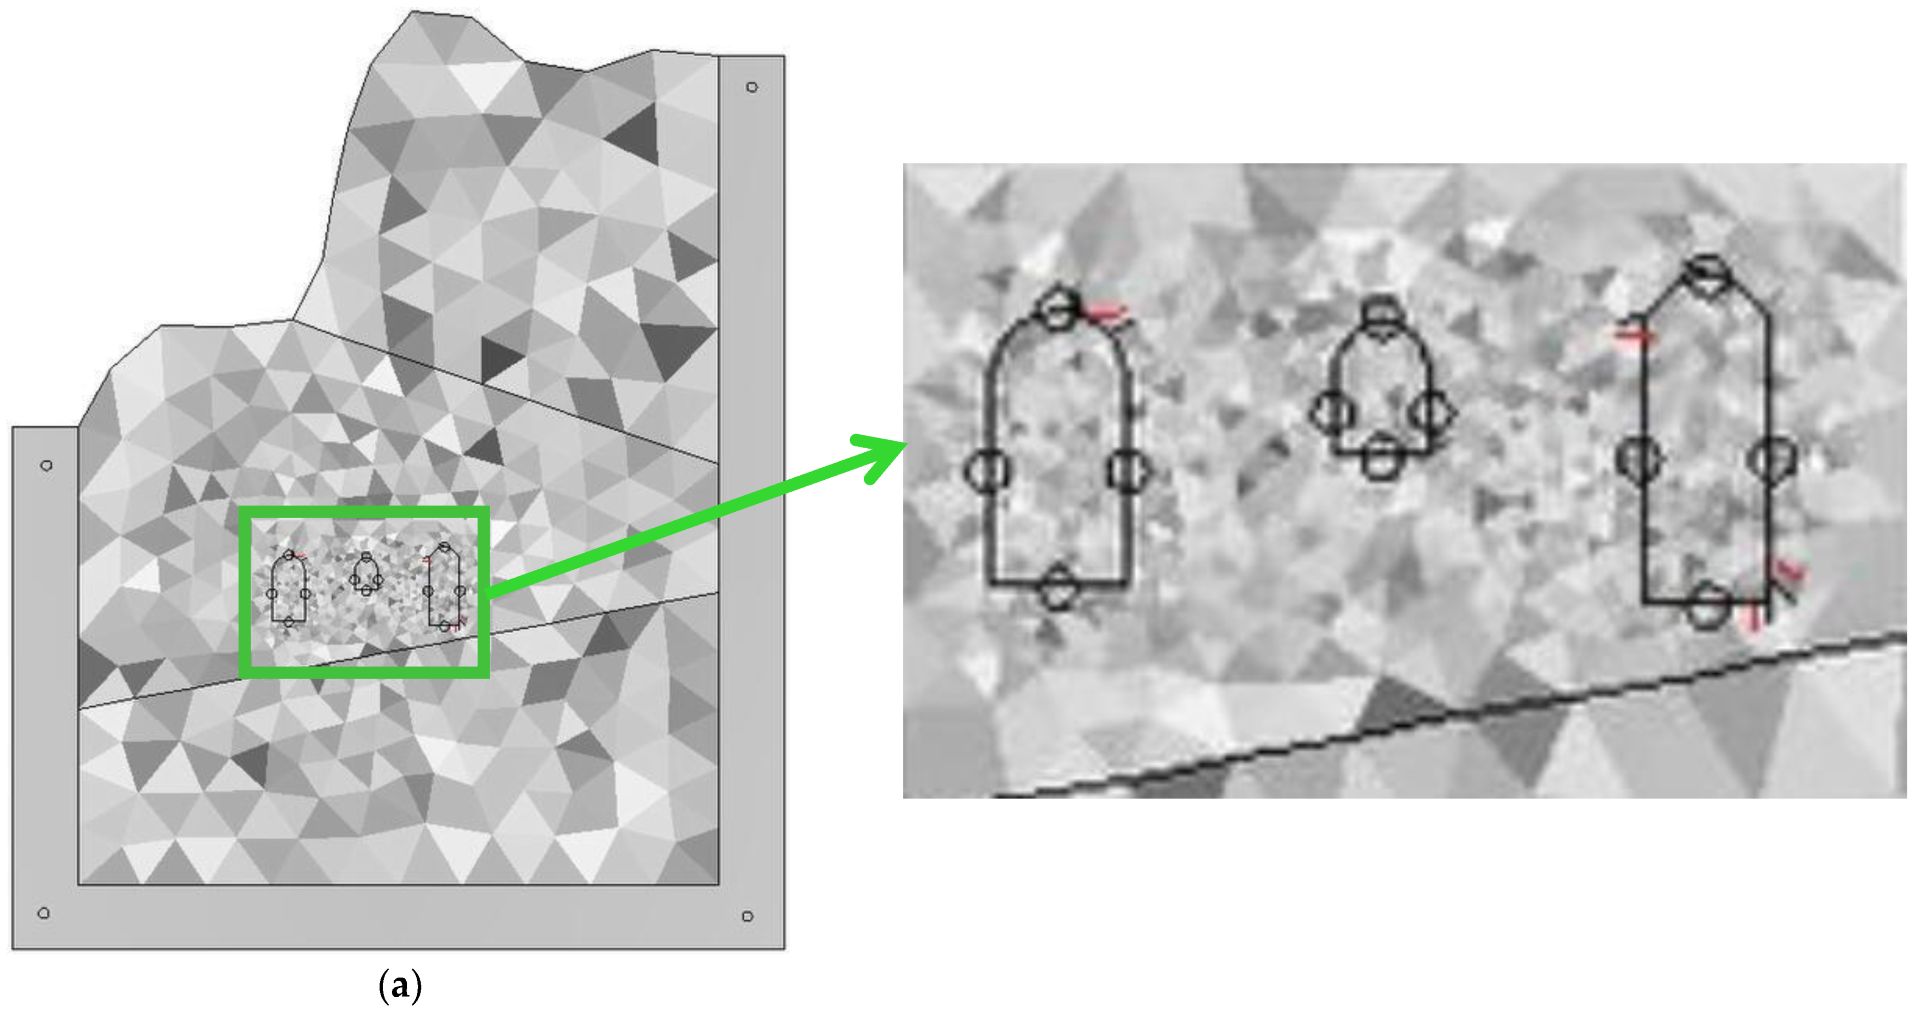
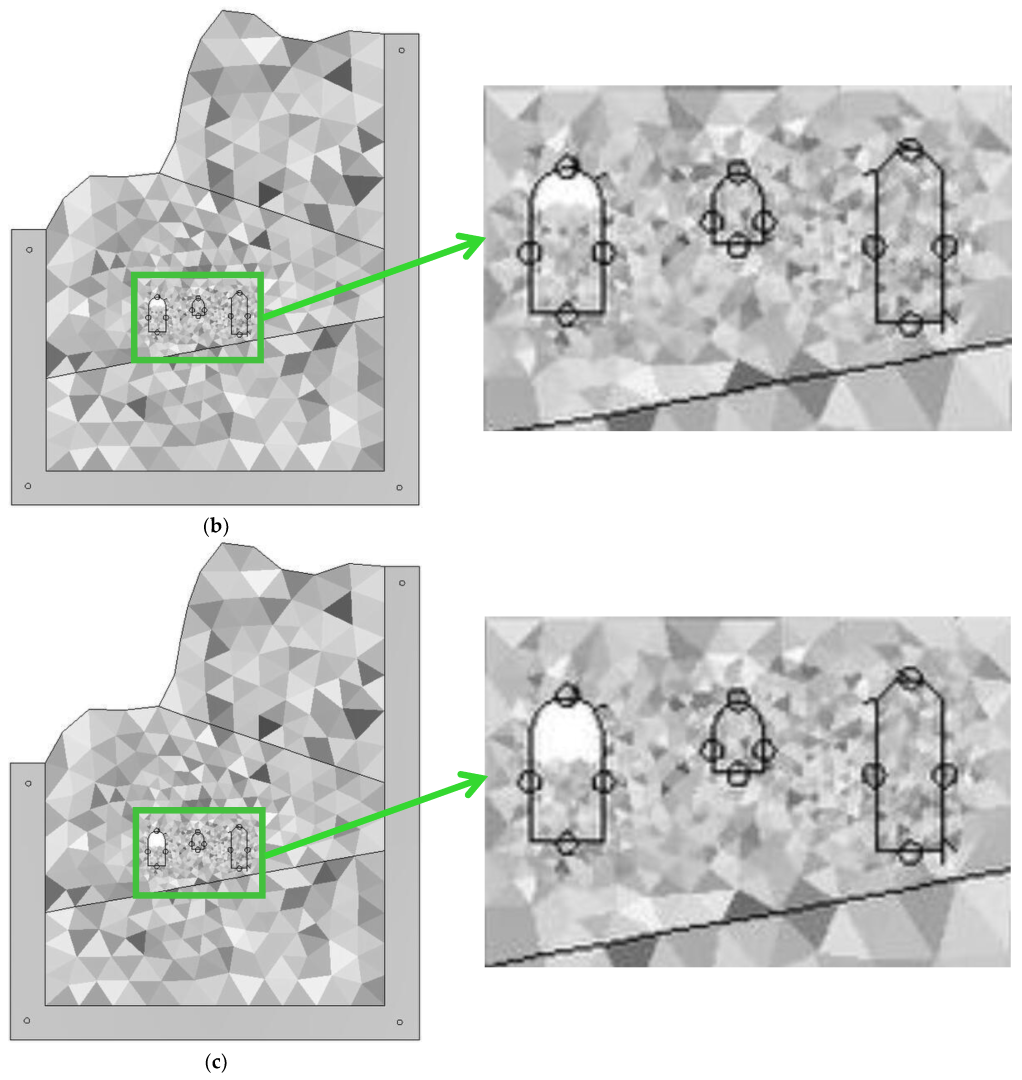
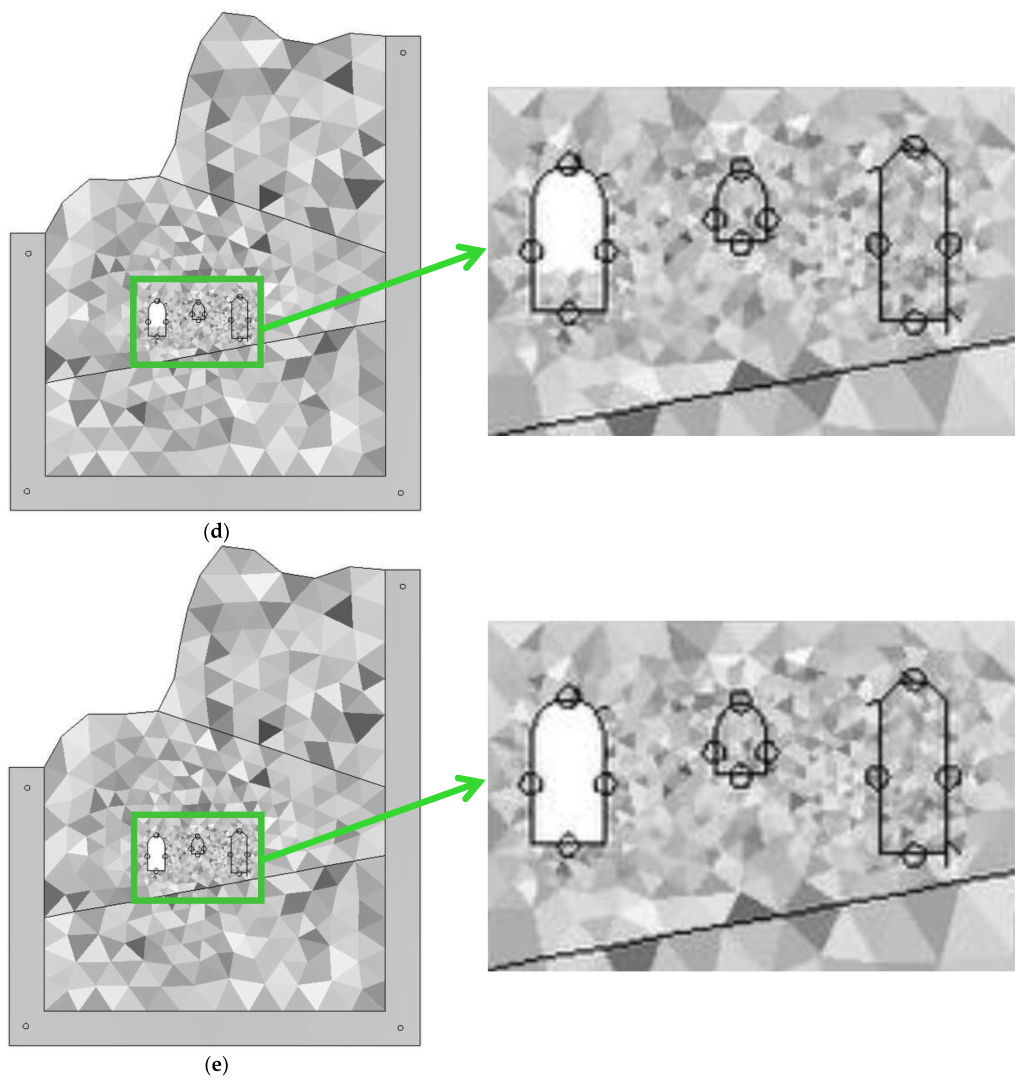
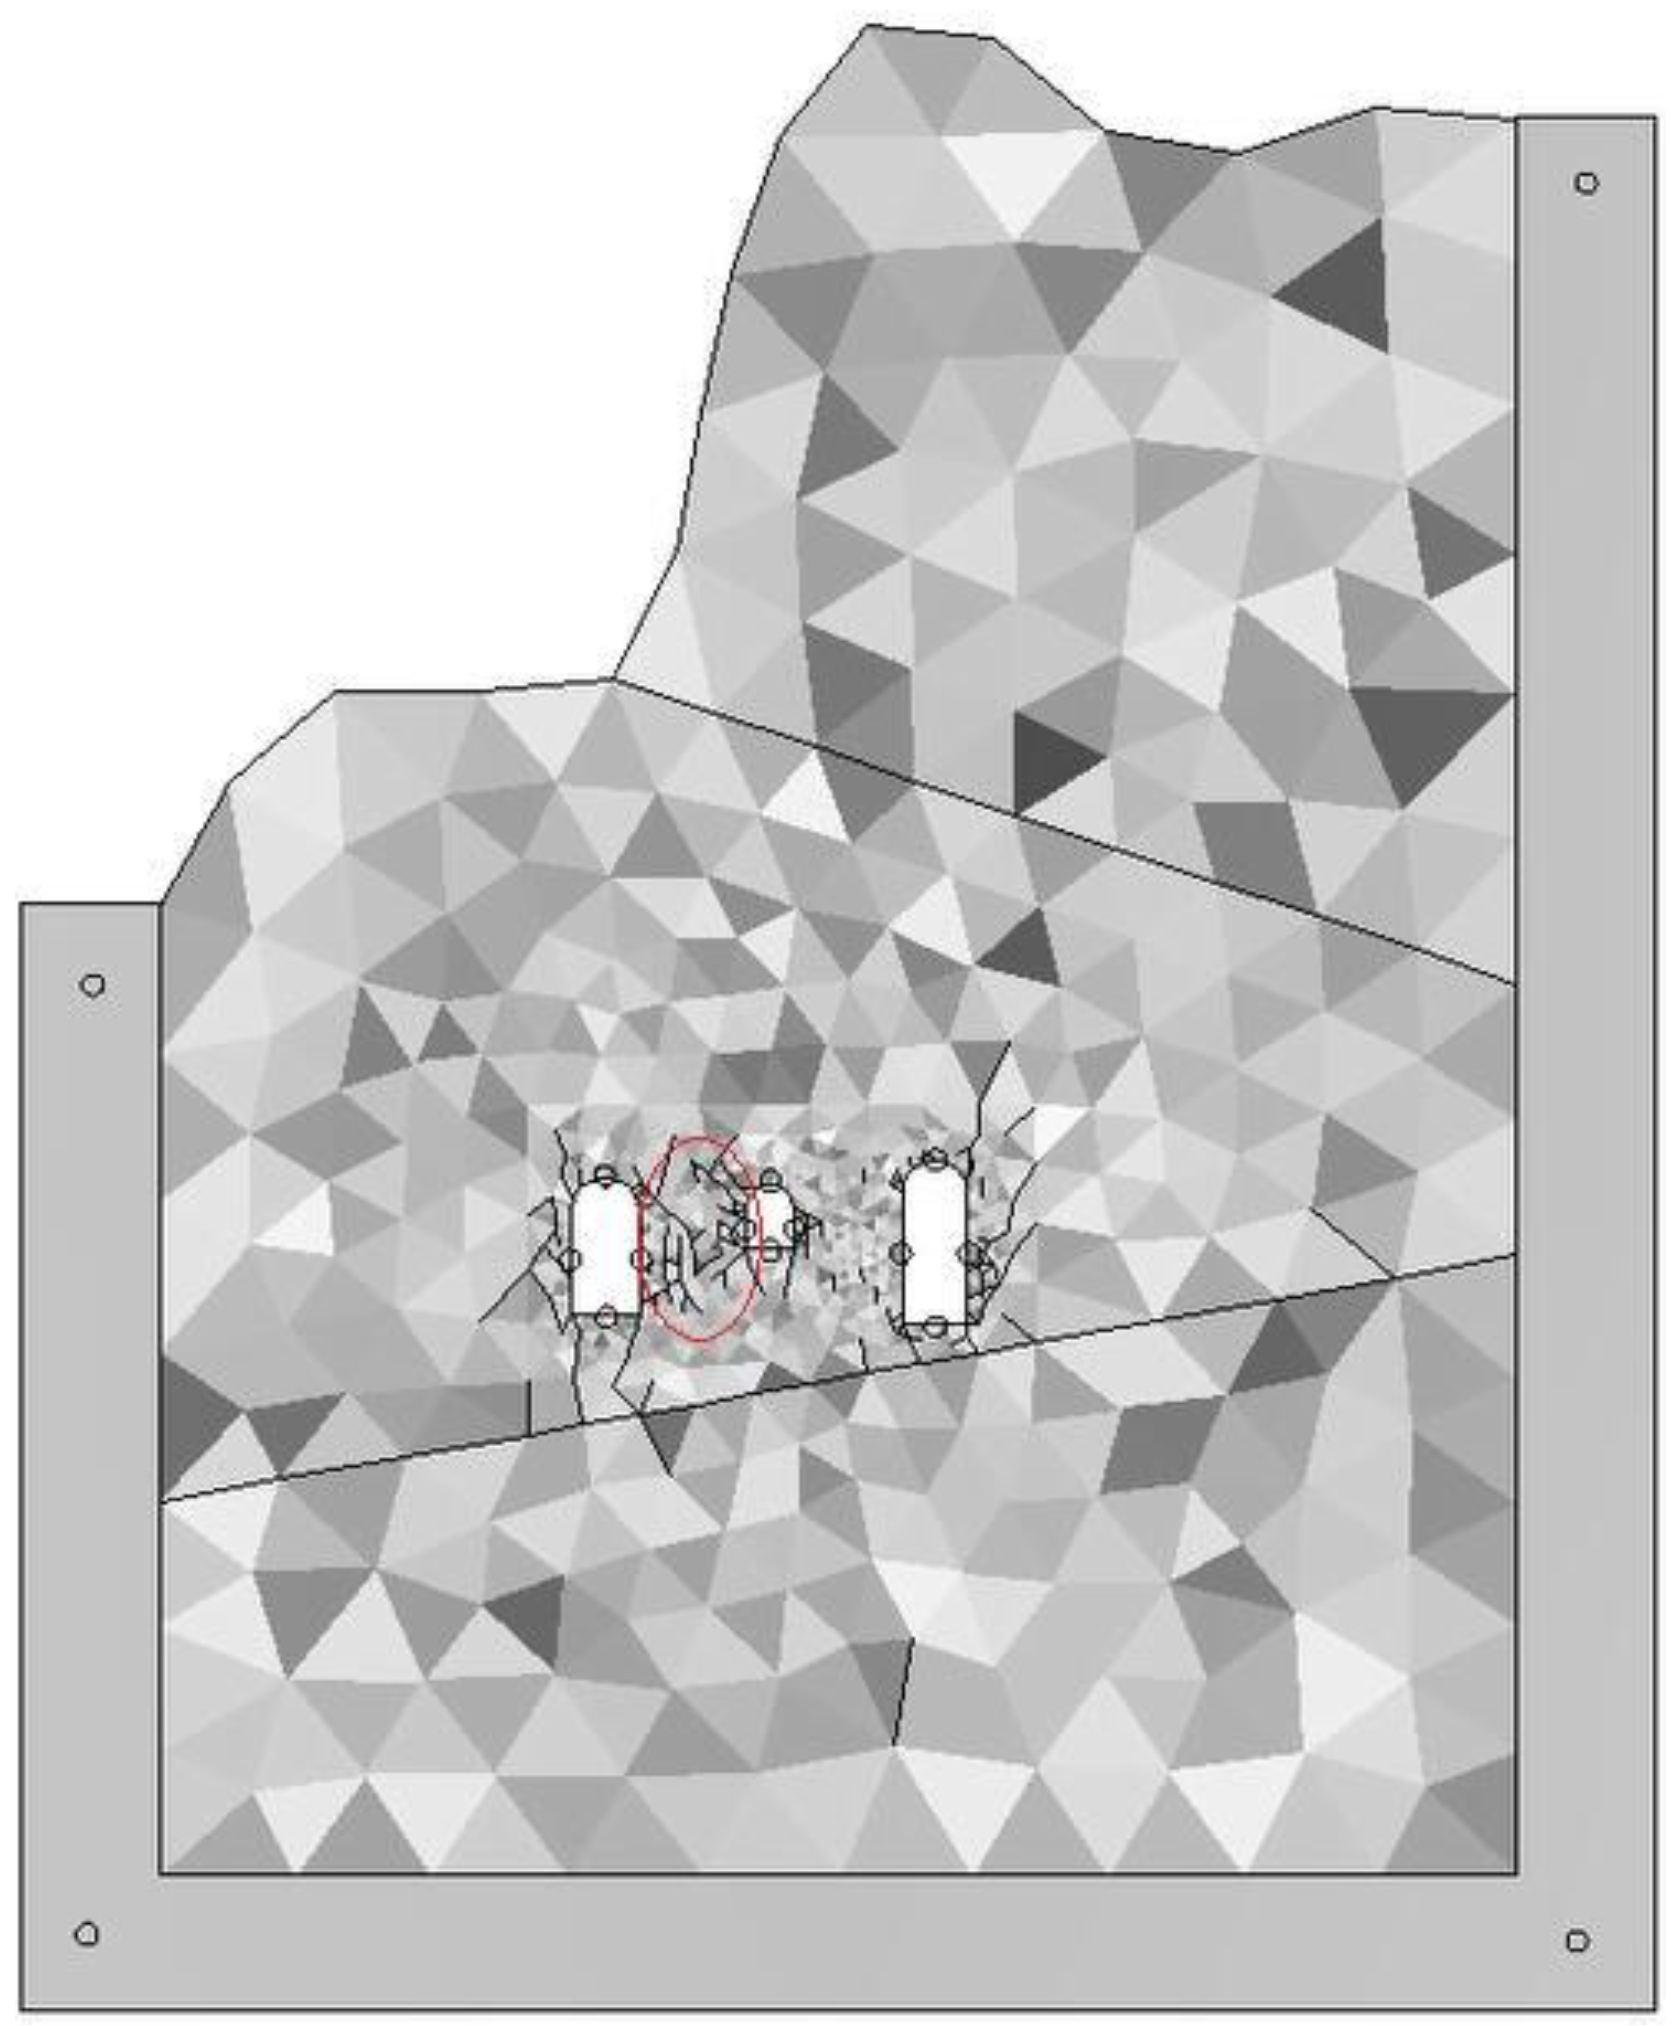
The optimized DDARF program was used to generate a model with a heterogeneous grid, as shown in Figure 2. It can be seen that a relatively dense grid is generated near the caverns to be excavated to ensure the calculation accuracy, and a relatively sparse grid is generated in the peripheral area far from the caverns, which can reduce the calculation load and improve the calculation efficiency. The calculation boundary conditions are: adding a U-shaped steel plate to the bottom and left and right sides of the model; the U-shaped steel plate being fixed with four fixed points for displacement constraints; and the top of the model being the earth’s surface without constraint. The calculation convergence condition is that the displacement generated by one step is less than 0.001 of the displacement generated by the previous step, namely convergence [48]. The discontinuous deformation analysis is calculated in the optimized DDARF program. SR classification of the underground cavern group is shown in Figure 3, and the physical and mechanical parameters of various surrounding rocks during calculation are shown in Table 1.

Figure 2.
Computational model generated in optimized DDARF.

Figure 3.
Classification of SR of underground cavern group.

Table 1.
Physical and mechanical parameters of various surrounding rocks.
3.3. Excavation Scheme
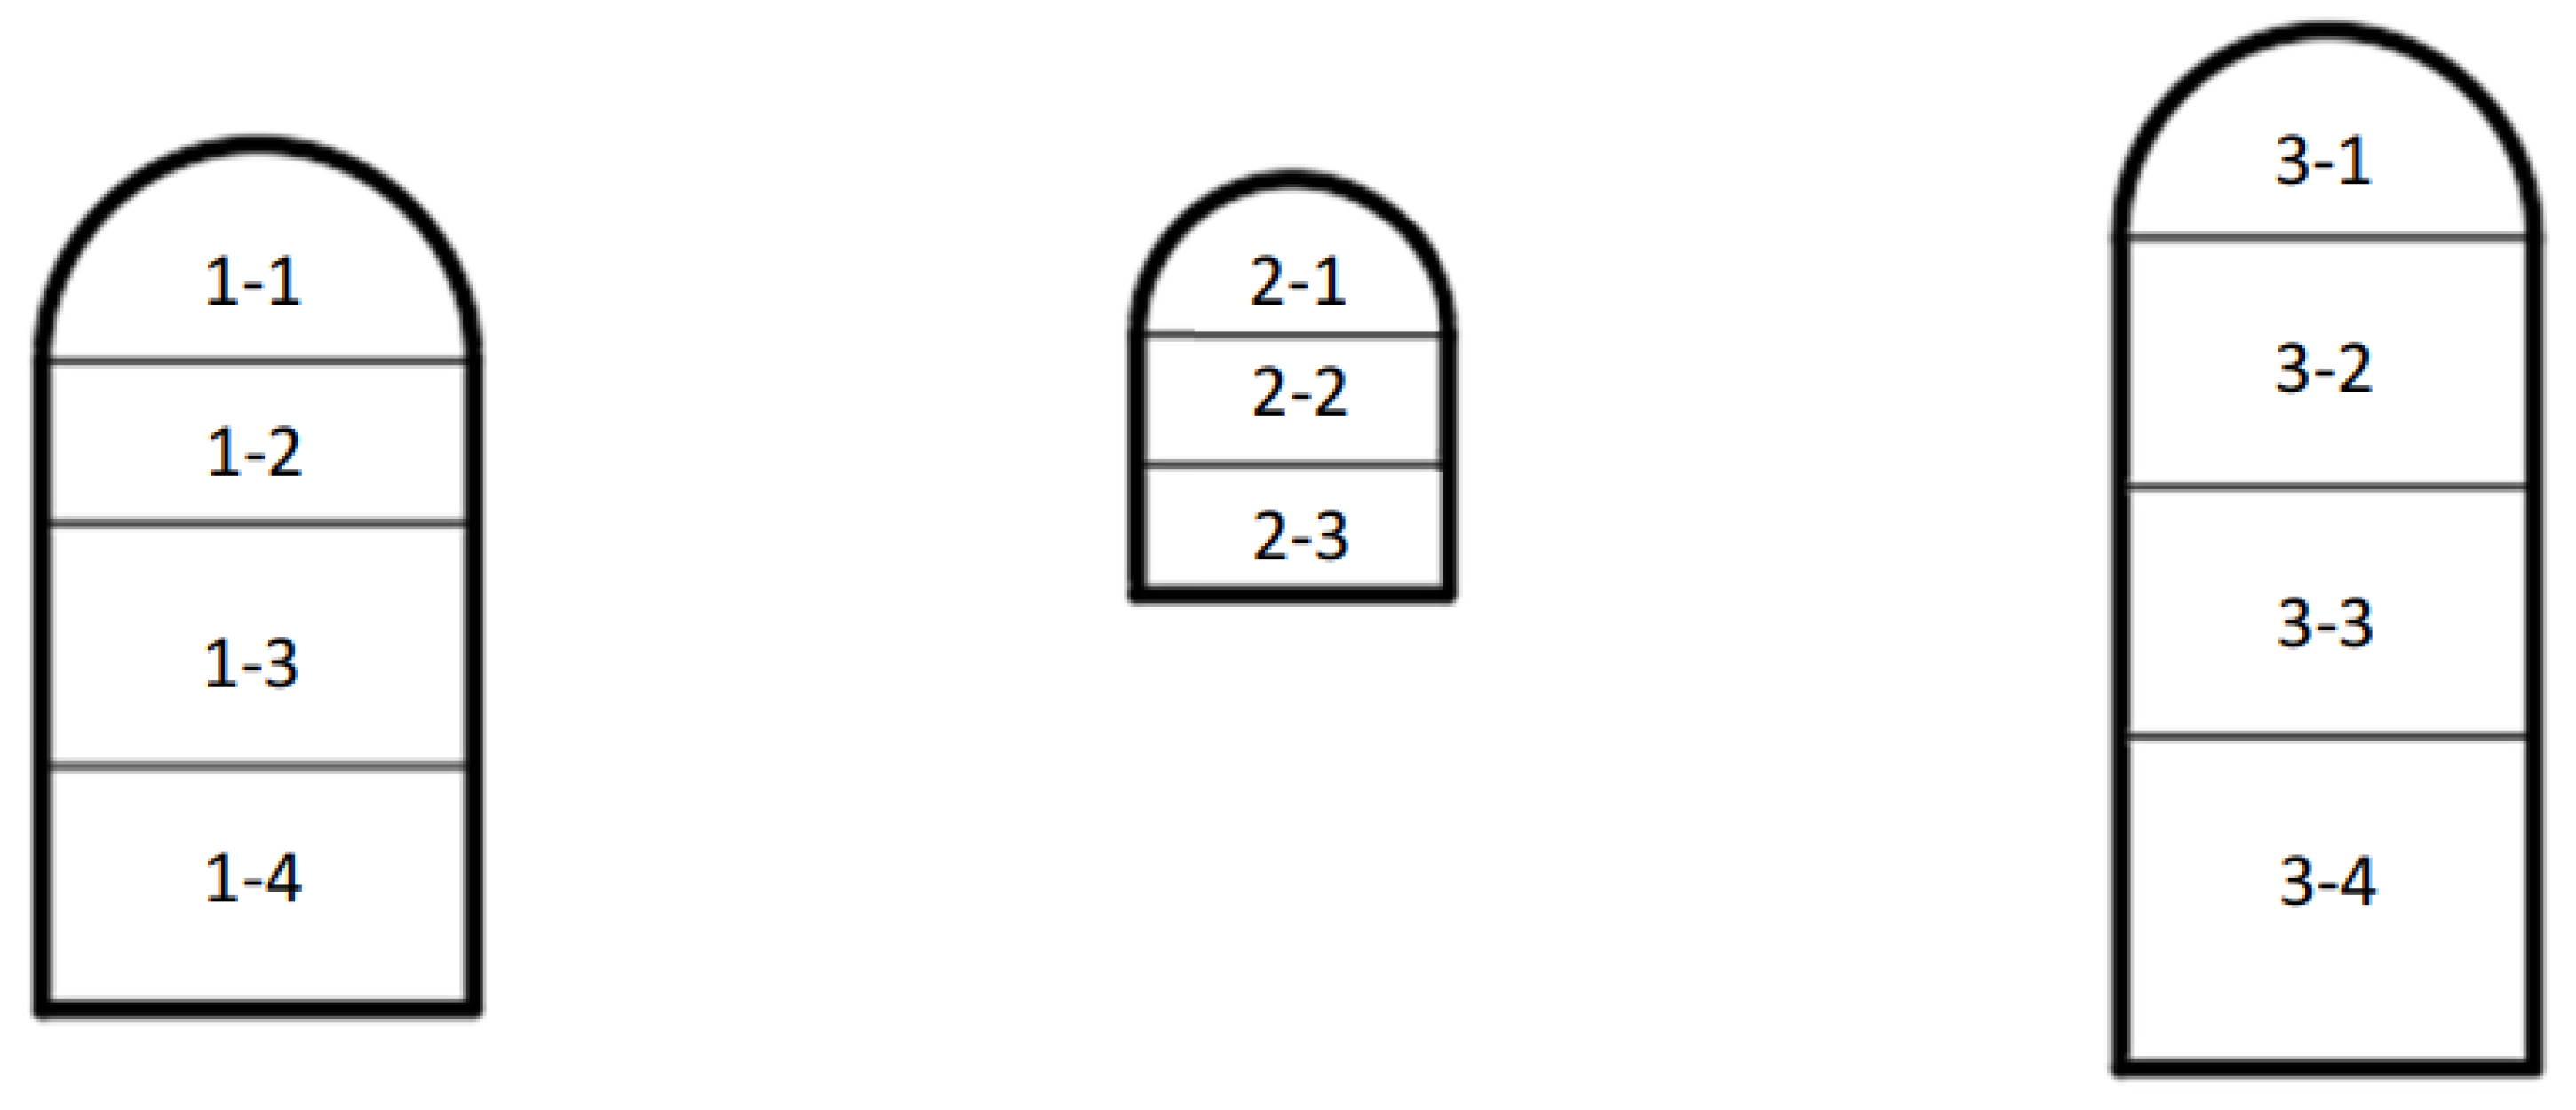
In this project, three excavation schemes are drawn up as shown in Figure 4, and the specific allocation is shown in Table 2. The MP cavern is excavated in four steps and the excavation sequence is 1-1,1-2,1-3,1-4, the MTC cavern is excavated in three steps and the excavation sequence is 2-1,2-2,2-3 and the TST cavern is excavated in four steps and the excavation sequence is 3-1,3-2,3-3,3-4.
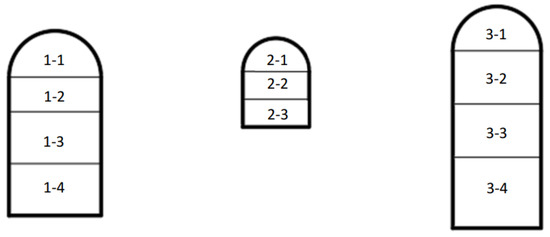
Figure 4.
Excavation sequence of the three caverns.
Table 2.
Excavation schemes.
4. Analysis and Discussion
The optimized DDARF method is used to simulate the excavation process of the cavern group, and the simulation results of three schemes are obtained.
4.1. Analysis of Cavern Group Excavation Scheme
4.1.1. Failure Process Analysis of SR
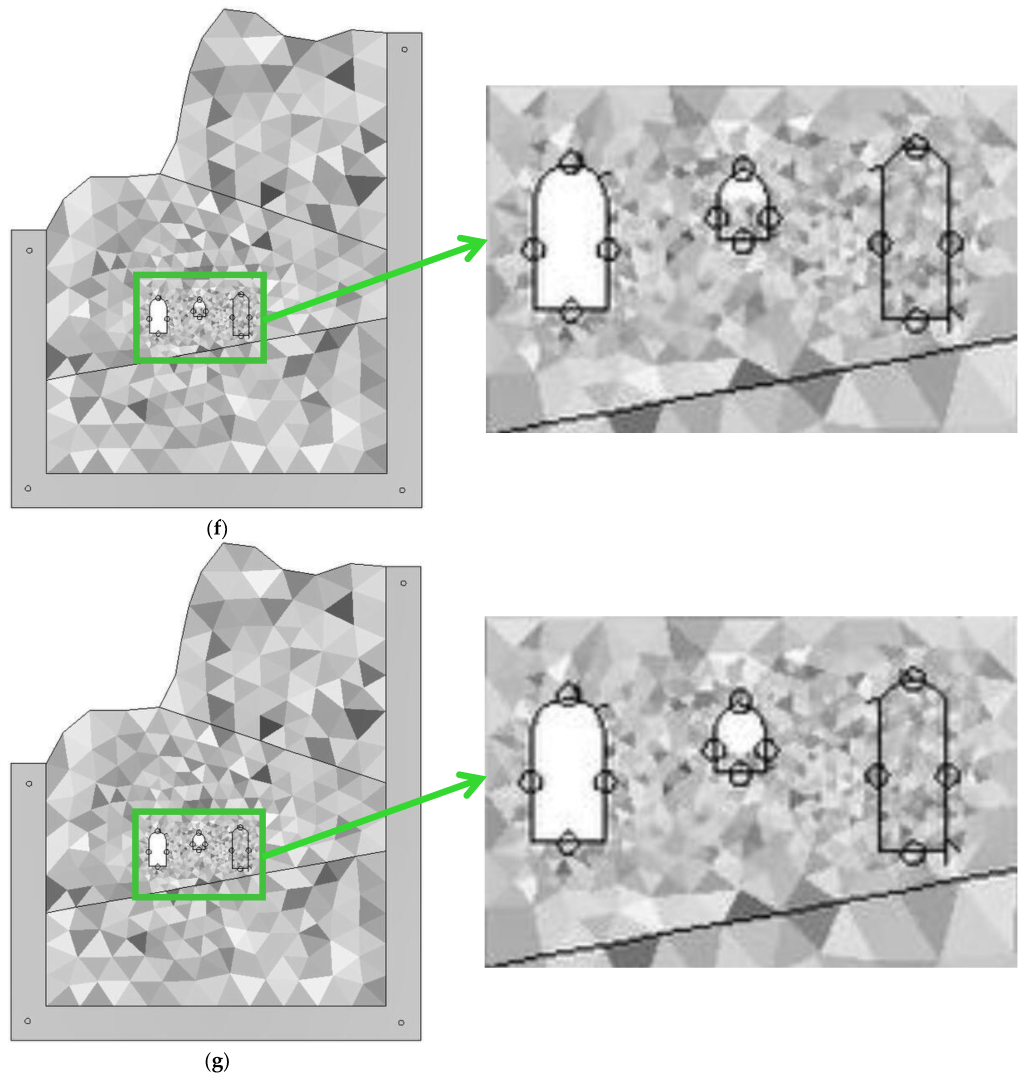
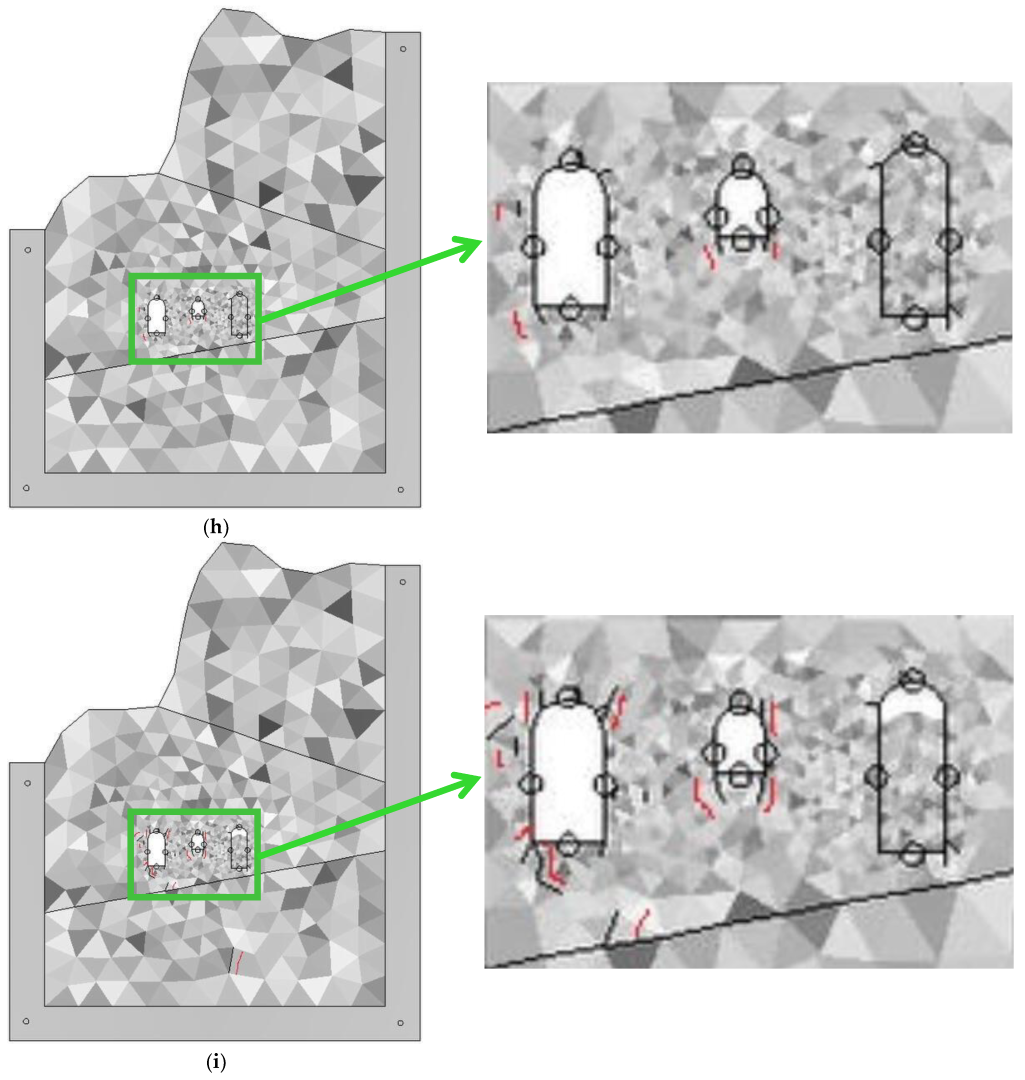
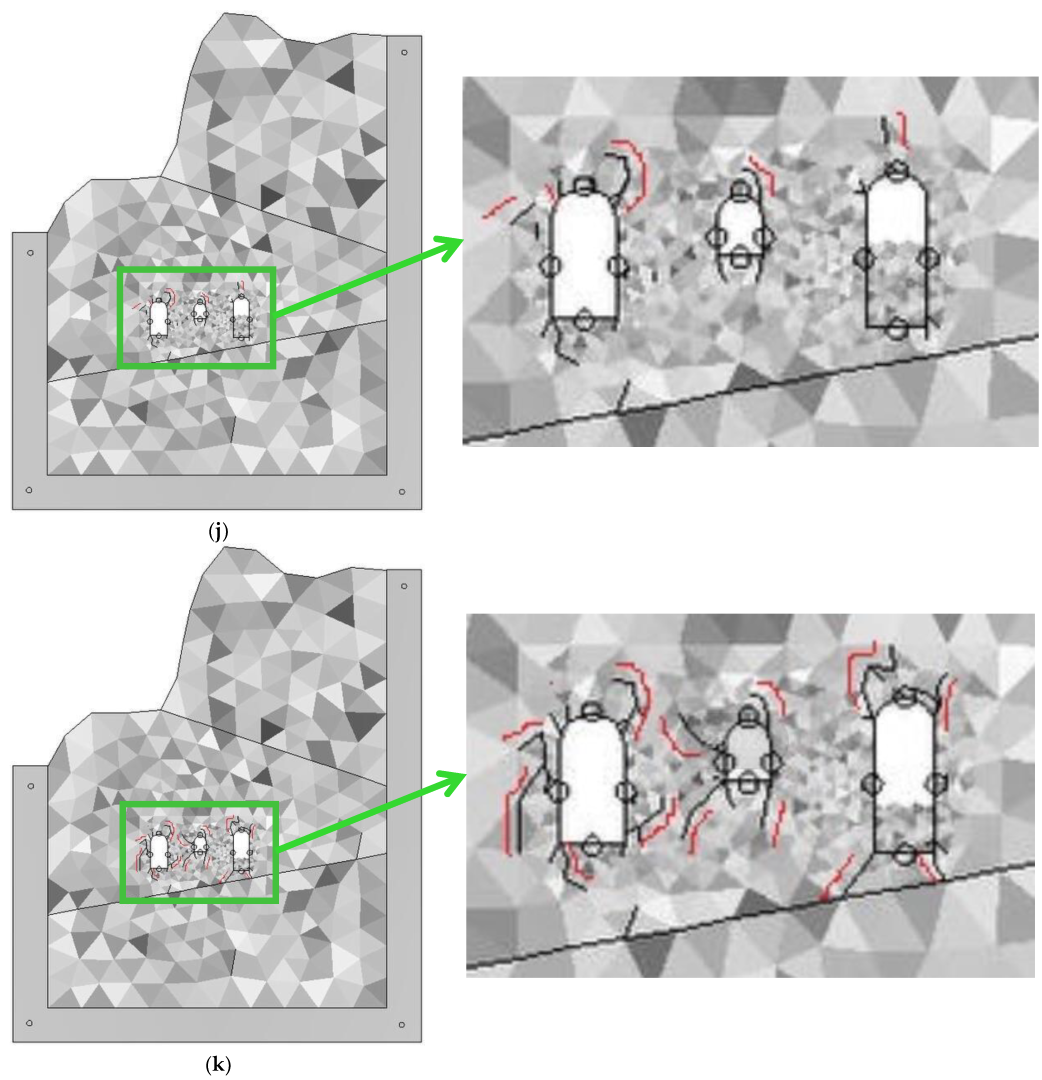
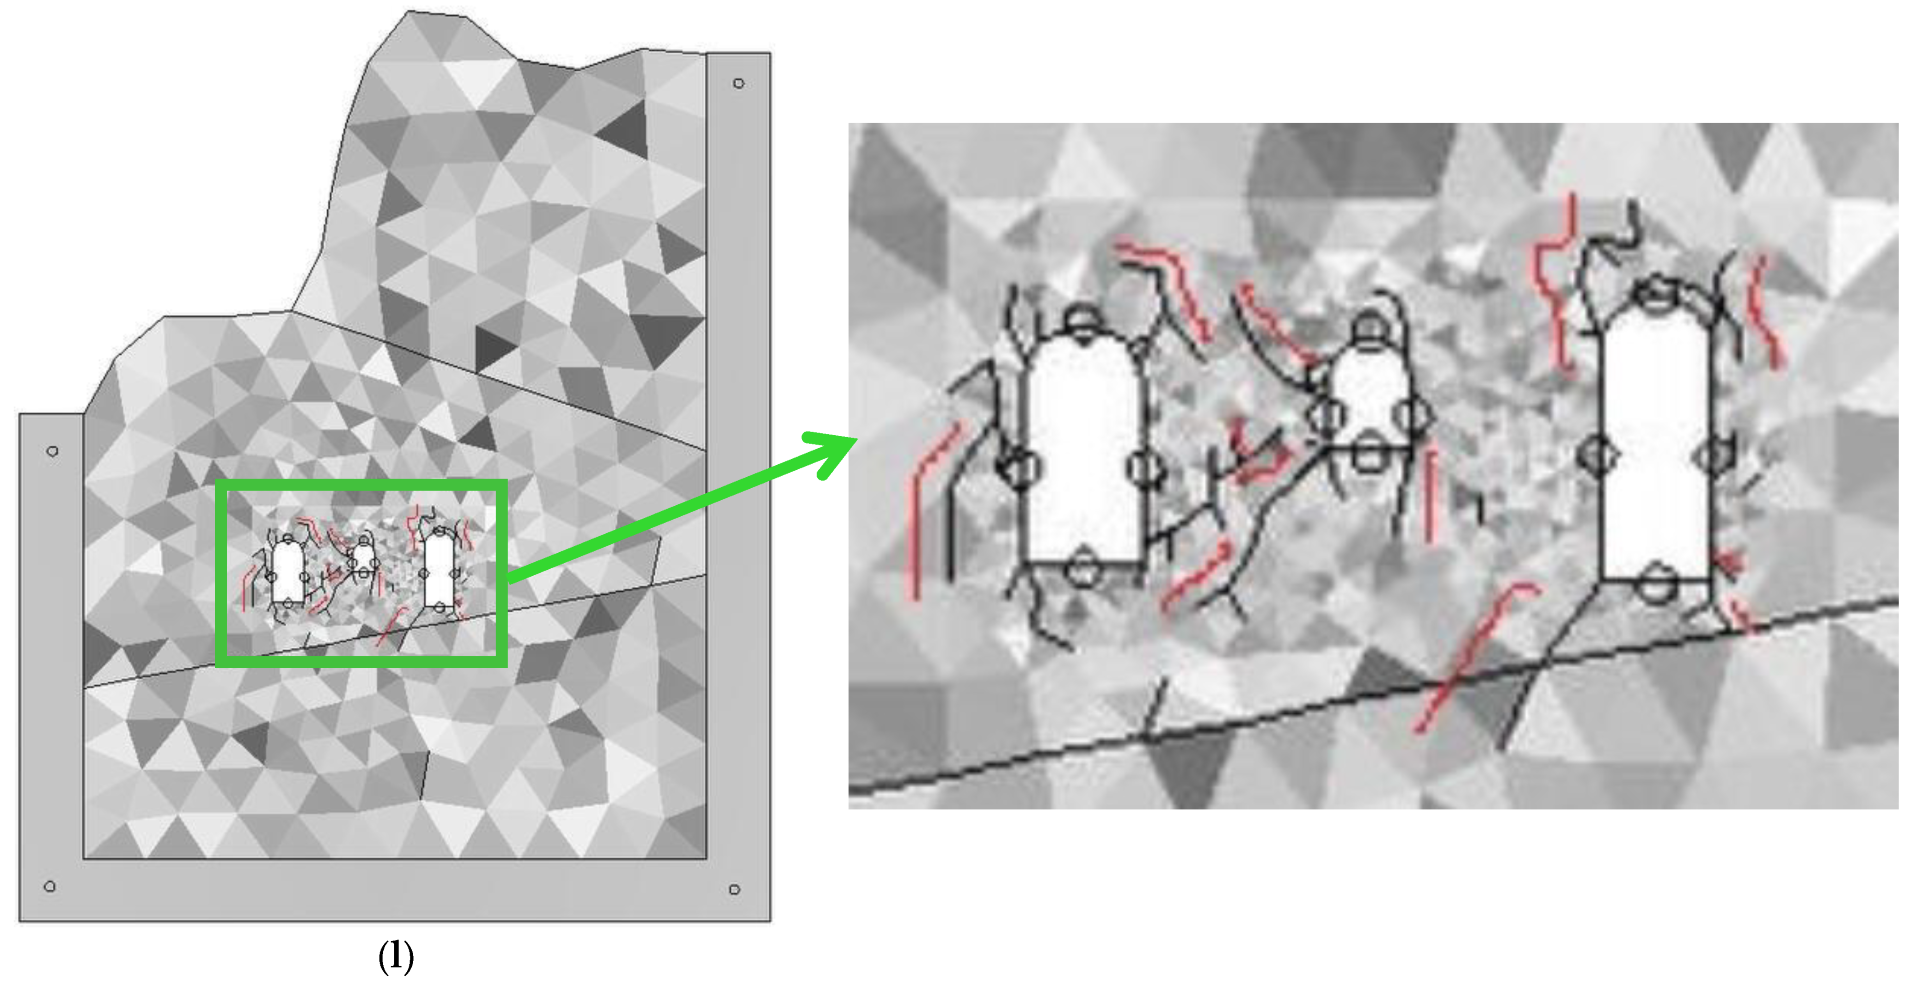
According to the above analysis, the excavation of Scheme 1 was divided into 11 steps in total. After the calculation, the failure process of SR can be obtained as shown in Figure 5a–l.
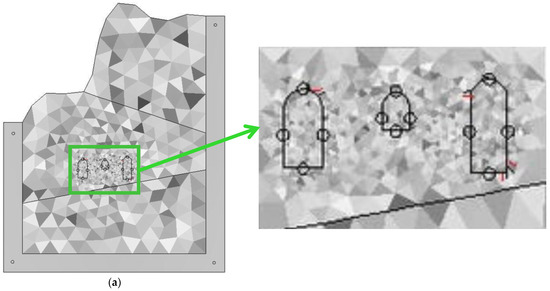
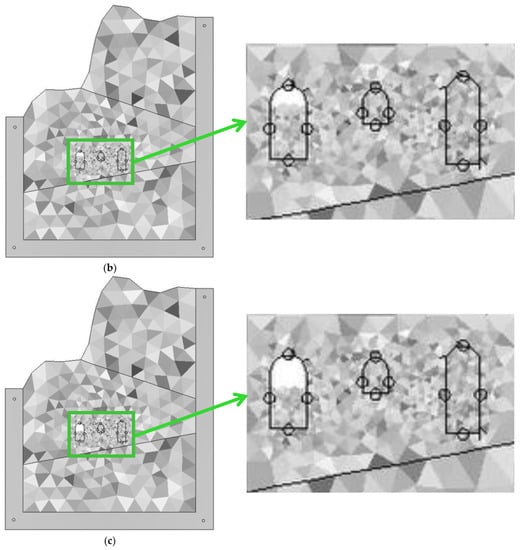


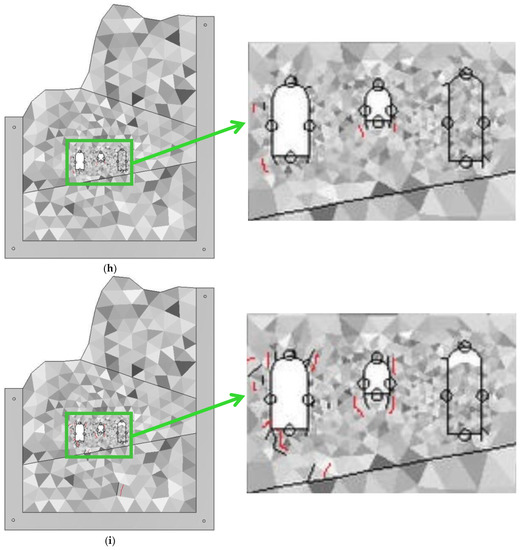
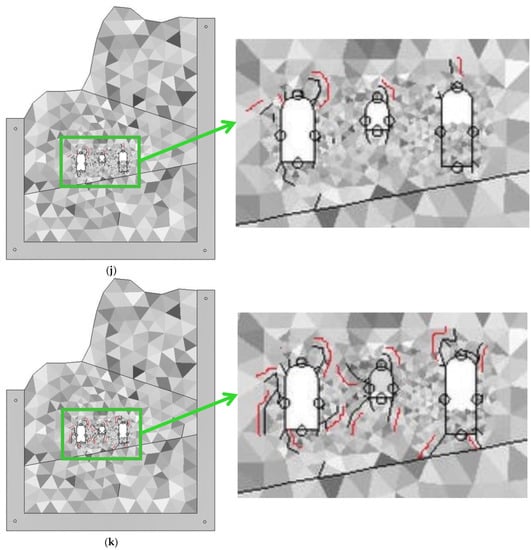

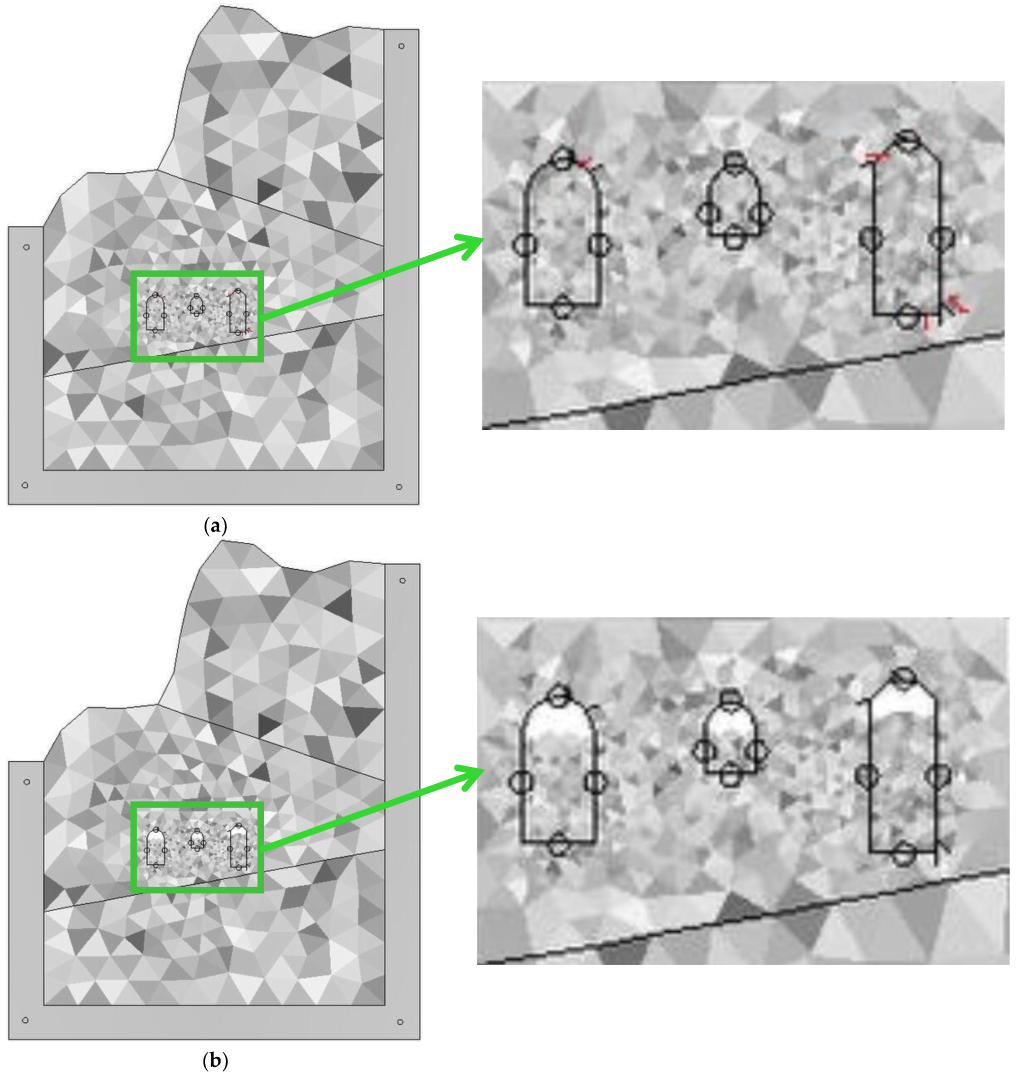
Figure 5.
Failure process of SR of underground cavern group during excavation in Scheme 1: (a) The excavation began; (b) the 1st step of excavation is completed; (c) the 2nd step of excavation is completed; (d) the 3rd step of excavation is completed; (e) the 4th step of excavation is completed; (f) the 5th step of excavation is completed; (g) the 6th step of excavation is completed; (h) the 7th step of excavation is completed; (i) the 8th step of excavation is completed; (j) the 9th step of excavation is completed; (k) the 10th step of excavation is completed; (l) the 11th step of excavation is completed.
From Figure 5, after the excavation began in Scheme 1, small cracks first appeared in the surrounding rocks of the arch at the right side of the MP cavern, in the arch at the left side and in the bottom floor, lower right corner of the TST cavern, as shown in Figure 5a. With the gradual progression of excavation, these cracks did not expand significantly, as shown in Figure 5b–g. After the completion of the seventh step, a small crack appeared in the left SR of the MP cavern, and small cracks appeared in the surrounding rocks of the bottom floor lower left and right corners of the MP cavern. Small cracks appeared in the surrounding rocks of the bottom floor’s lower left and right corners of the MTC cavern, as shown in Figure 5h. After the completion of the eighth step, the cracks around the MP cavern increased, the cracks in the right SR of the arch of the MP cavern expanded, and the cracks in the SR of the bottom floor’s lower left corner of the MP cavern increased and expanded. Cracks appeared in the right SR of the arch of the MTC cavern, cracks expanded in the surrounding rocks of the bottom floor’s lower left and right corners of the MTC cavern, cracks appeared in fault f2, and a crack appeared in the lower rock mass far from the cavern group, as shown in Figure 5i. After the ninth step of excavation was completed, the cracks in the right SR of the arch of the MP cavern continued to expand, and the cracks in the left SR of the MP cavern increased. Cracks spread in the SR of the arch’s right side of the MTC cavern. Cracks appeared above the cavern of the TST cavern, as shown in Figure 5j. After the tenth step of excavation was completed, the cracks in the left surrounding rocks of the MP cavern and MTC cavern increased and expanded rapidly, the cracks in the SR of the arch and bottom floor of the TST cavern expanded significantly and the cracks in the bottom floor were connected with fault f2, as shown in Figure 5k. After the eleventh step of excavation was completed, the cracks in the right side of the SR of the MP cavern expanded and increased, the cracks in the left side of the SR of the MTC cavern expanded, and the cracks in the SR of the bottom floor of the tailrack surge tank passed through fault f2, as shown in Figure 5l.
In Scheme 2, the excavation was divided into four steps in total. After the excavation, the failure process of SR can be obtained, as shown in Figure 6a–e.
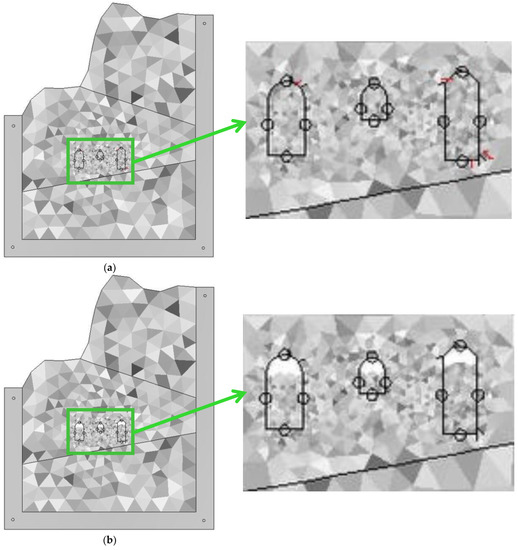
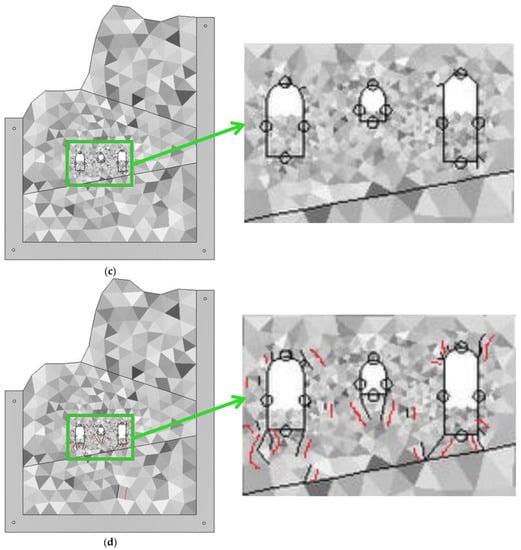
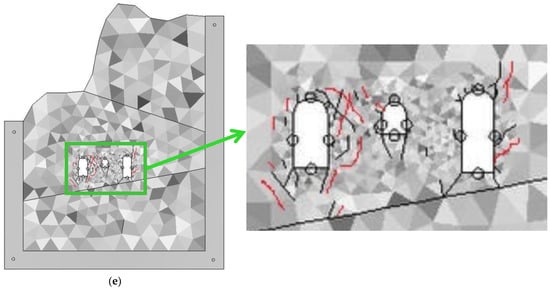
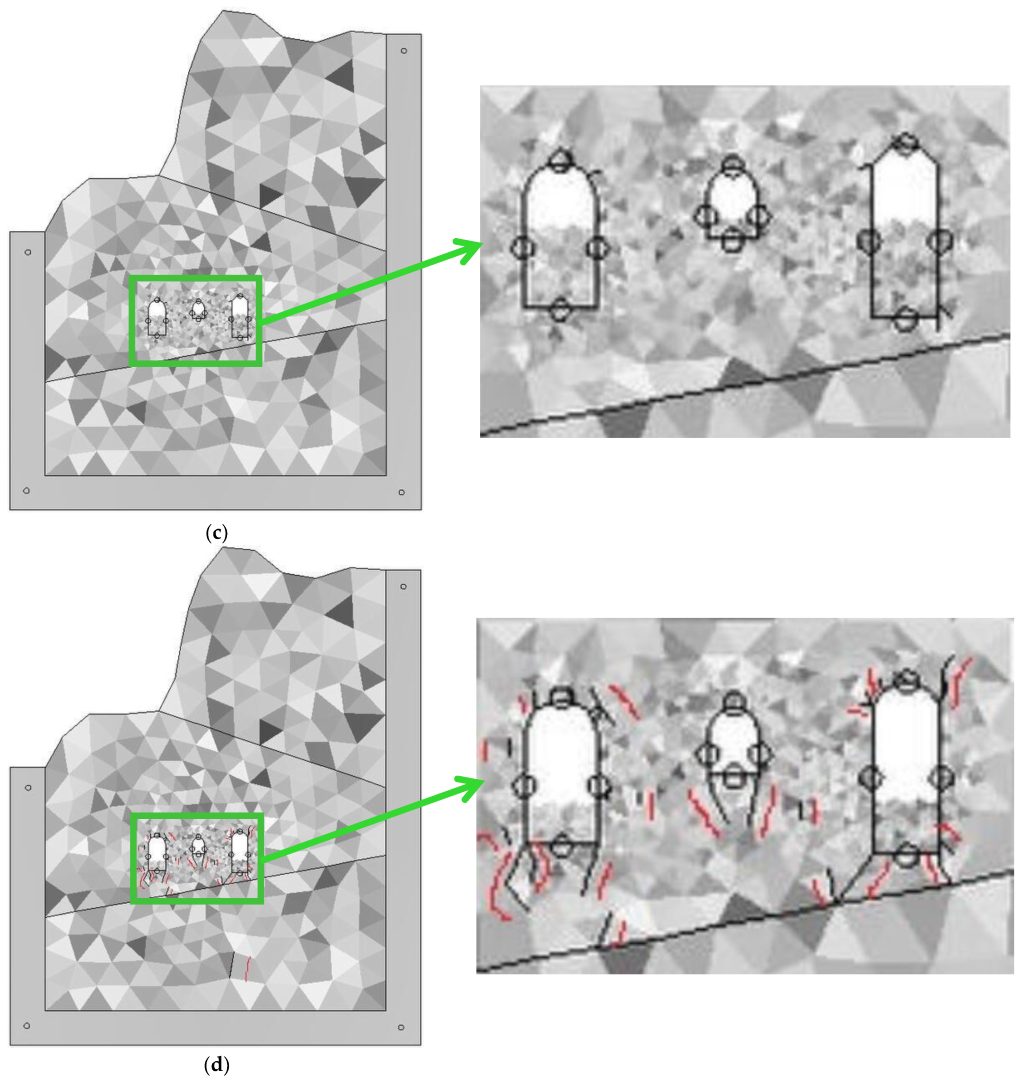
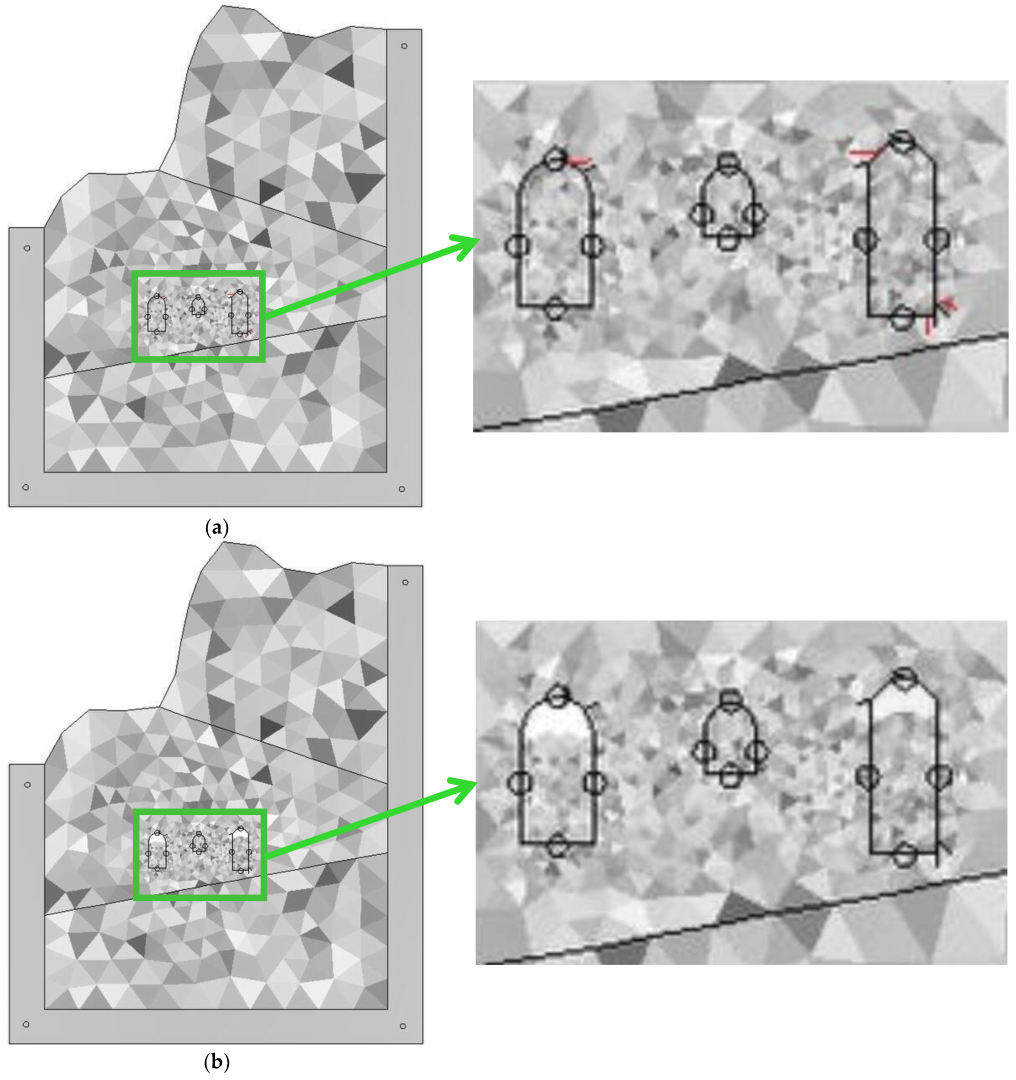
Figure 6.
Failure process of SR of the underground cavern group during excavation in Scheme 2: (a) The excavation began; (b) the 1st step of excavation is completed; (c) the 2nd step of excavation is completed; (d) the 3rd step of excavation is completed; (e) the 4th step of excavation is completed.
From Figure 6, after the excavation began in Scheme 2, small cracks appeared in the surrounding rocks of the arch’s right side of the MP cavern and the arch’s left side and bottom floor’s lower right corner of the TST cavern, as shown in Figure 6a. With the progression in excavation, cracks did not further increase and expand after the end of the second step of excavation, as shown in Figure 6b–c. After the third step of excavation was over, the cracks around the cavern group gradually increased and expanded, long cracks appeared in the surrounding rocks of the three caverns’ bottom floor’s lower left and right corners, and the cracks also increased and expanded in the surrounding rocks of the arches of the MP cavern and the TST cavern. There were several fractures that appeared in fault f2, and one fracture was connected with the fracture in the bottom floor’s lower left corner in the SR of the TST cavern, as shown in Figure 6d. After the fourth step of excavation is over, the cracks in the surrounding rocks of the arch and right side of the MP cavern and the TST cavern further increased and expanded, as shown in Figure 6e.
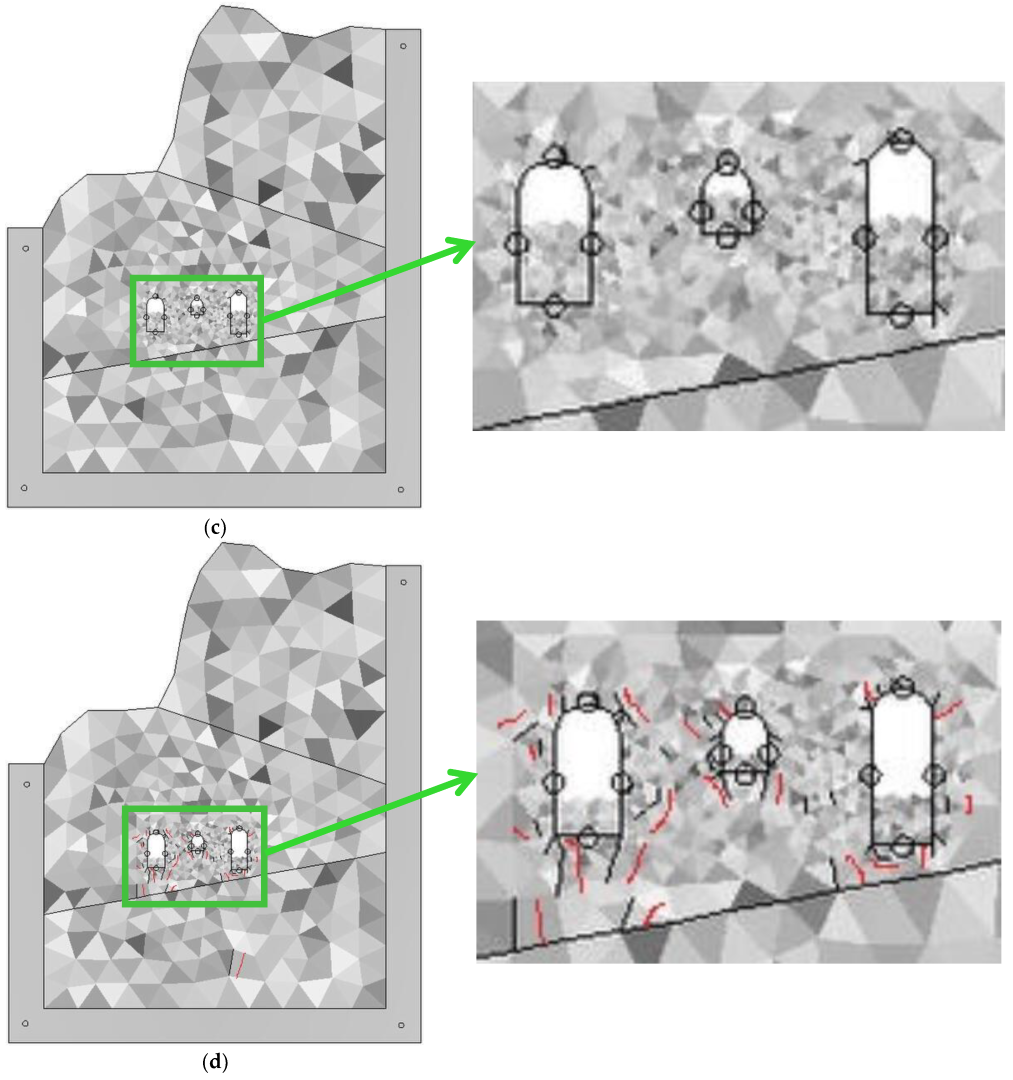
In Scheme 3, the excavation was divided into four steps in total. After the excavation, the failure process of the underground cavern group SR can be obtained as shown in Figure 7a–e.
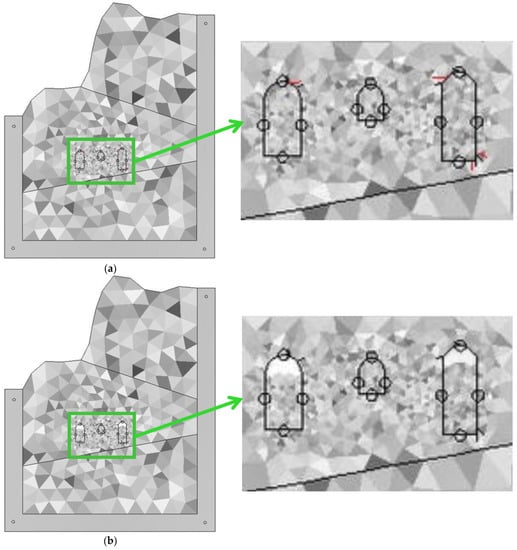
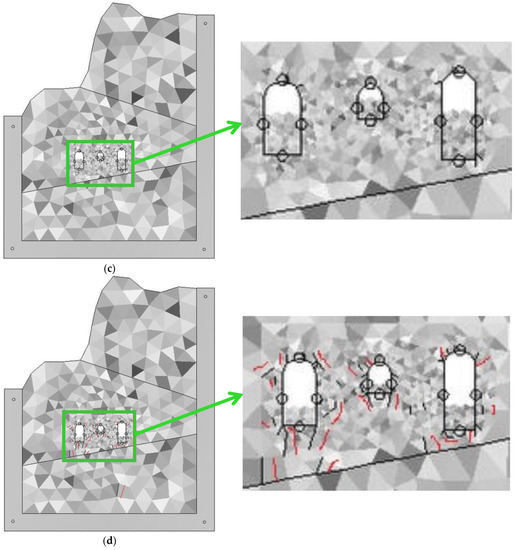
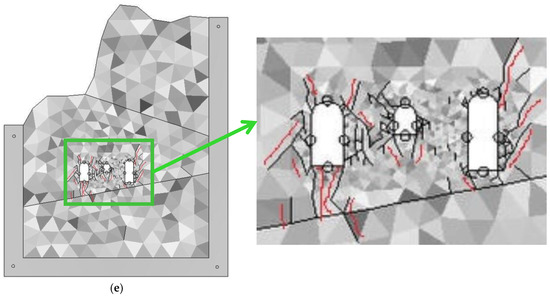
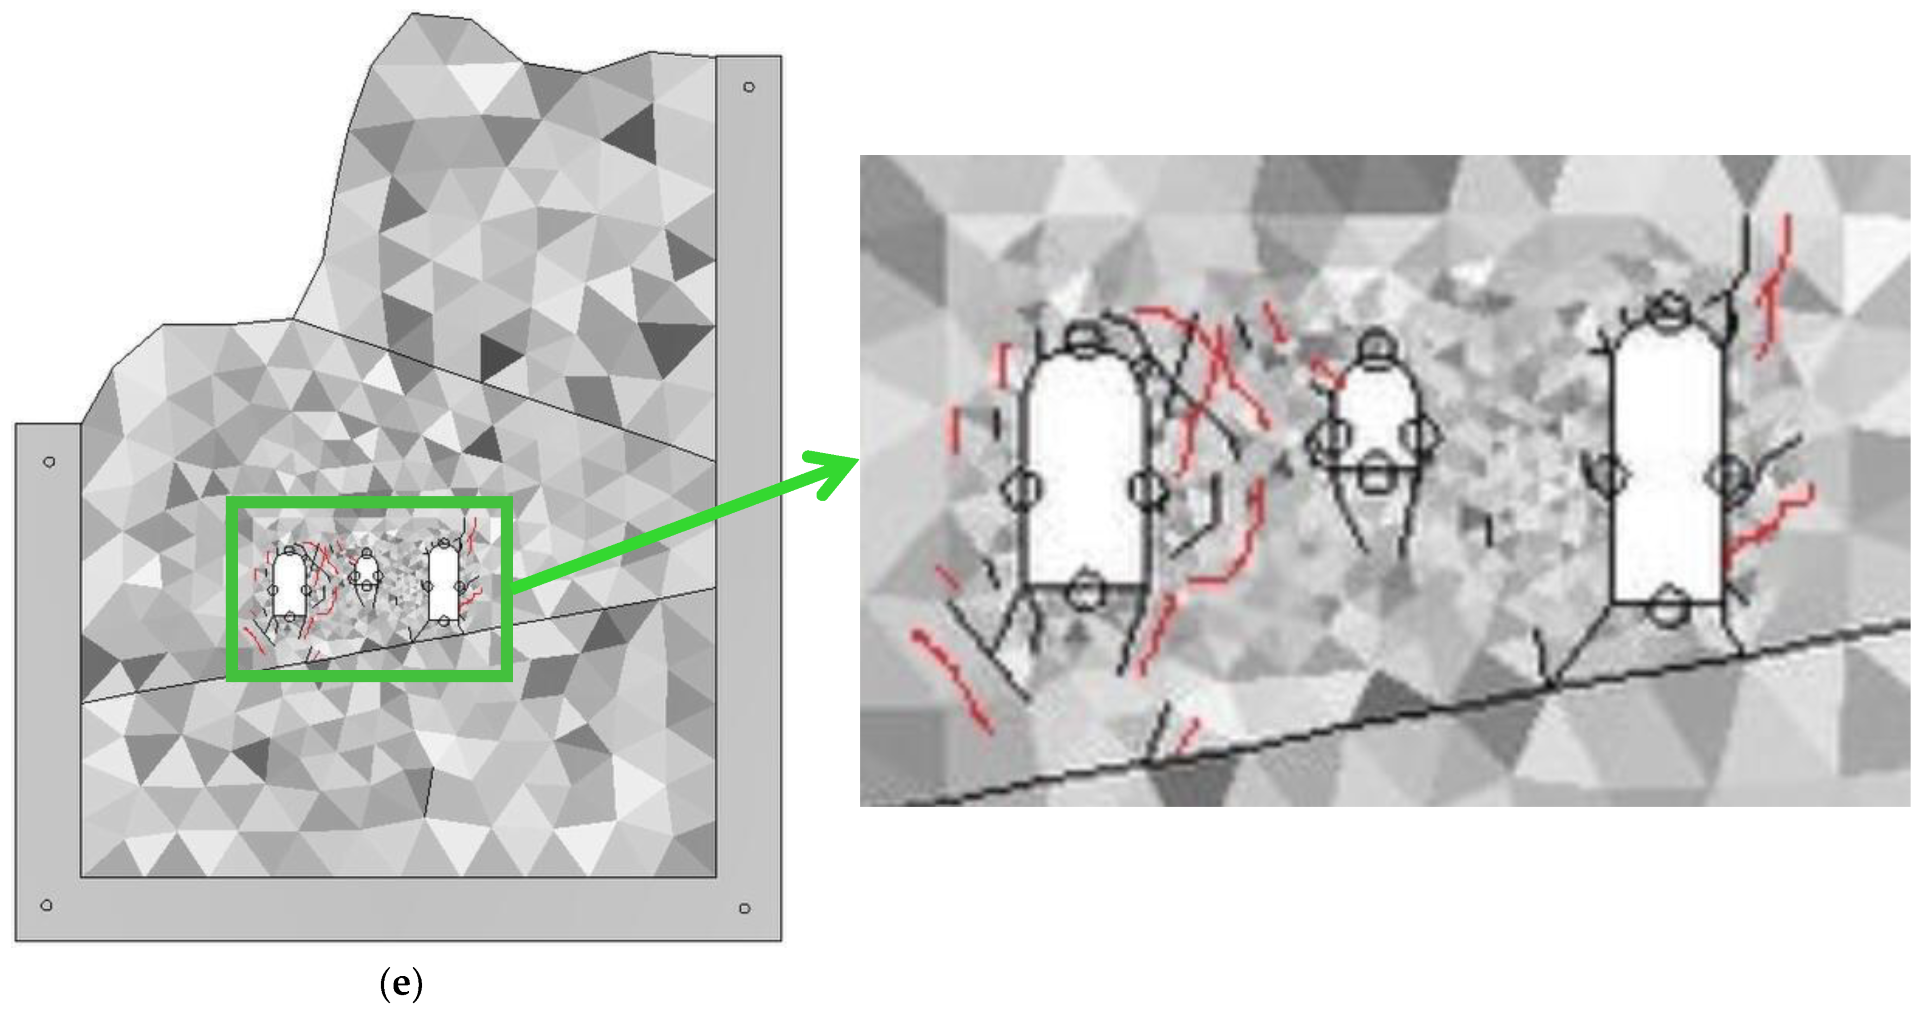
Figure 7.
Failure process of SR of the underground cavern group during excavation in Scheme 3: (a) The excavation began; (b) the 1st step of excavation is completed; (c) the 2nd step of excavation is completed; (d) the 3rd step of excavation is completed; (e) the 4th step of excavation is completed.
From Figure 7, after the excavation of Scheme 3 began, small cracks appeared in the surrounding rocks of the arch’s right side of the MP cavern and the arch’s left side and the bottom floor’s lower right corner of the TST cavern, as shown in Figure 7a. With the progression in excavation, cracks did not further increase and expand after the end of the second step of excavation, as shown in Figure 7b–c. After the third step of excavation was over, the cracks around the cavern group gradually increased and expanded. Long cracks appeared in the surrounding rocks of the bottom floor’s lower left and right corners of the MP cavern and MTC cavern, small cracks appeared in the surrounding rocks of the bottom floor’s lower left and right corners of the TST cavern, and cracks in the arch of the surrounding rocks of the three caverns also increased and expanded, while multiple fissures appeared in fault f2, as shown in Figure 7d. After the fourth step of excavation, the cracks in the surrounding rocks of the three caverns were further increased and expanded. Among them, the cracks in the surrounding rocks of the arch, the left and right walls, and the bottom floor of the MP cavern expanded to be long cracks, the cracks in the right wall SR of the MP cavern extended and connected with the cracks in the left wall SR of the MTC cavern and the cracks in the bottom floor of the MP cavern were connected with the fault f2. The cracks in the surrounding rocks of the arch’s right side and the right wall of the TST cavern extended into long cracks, and the cracks in the bottom floor SR of the tailrack surge tank were connected with fault f2, as shown in Figure 7e.
4.1.2. Crack Propagation Depth Analysis
After the excavations were over, the surrounding rock crack propagation of the cavern group under the three schemes are shown in Figure 5l, Figure 6e and Figure 7e. It can be seen that the surrounding rocks of the cavern group are damaged to different degrees after the completion of the excavation. According to the measurement results, the depth comparison of the rock fracture zone of the cave group in the three schemes is shown in Figure 8, Figure 9, Figure 10 and Figure 11.
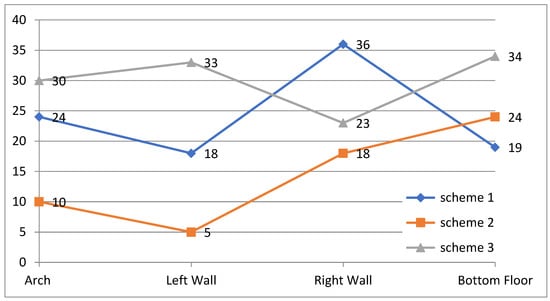
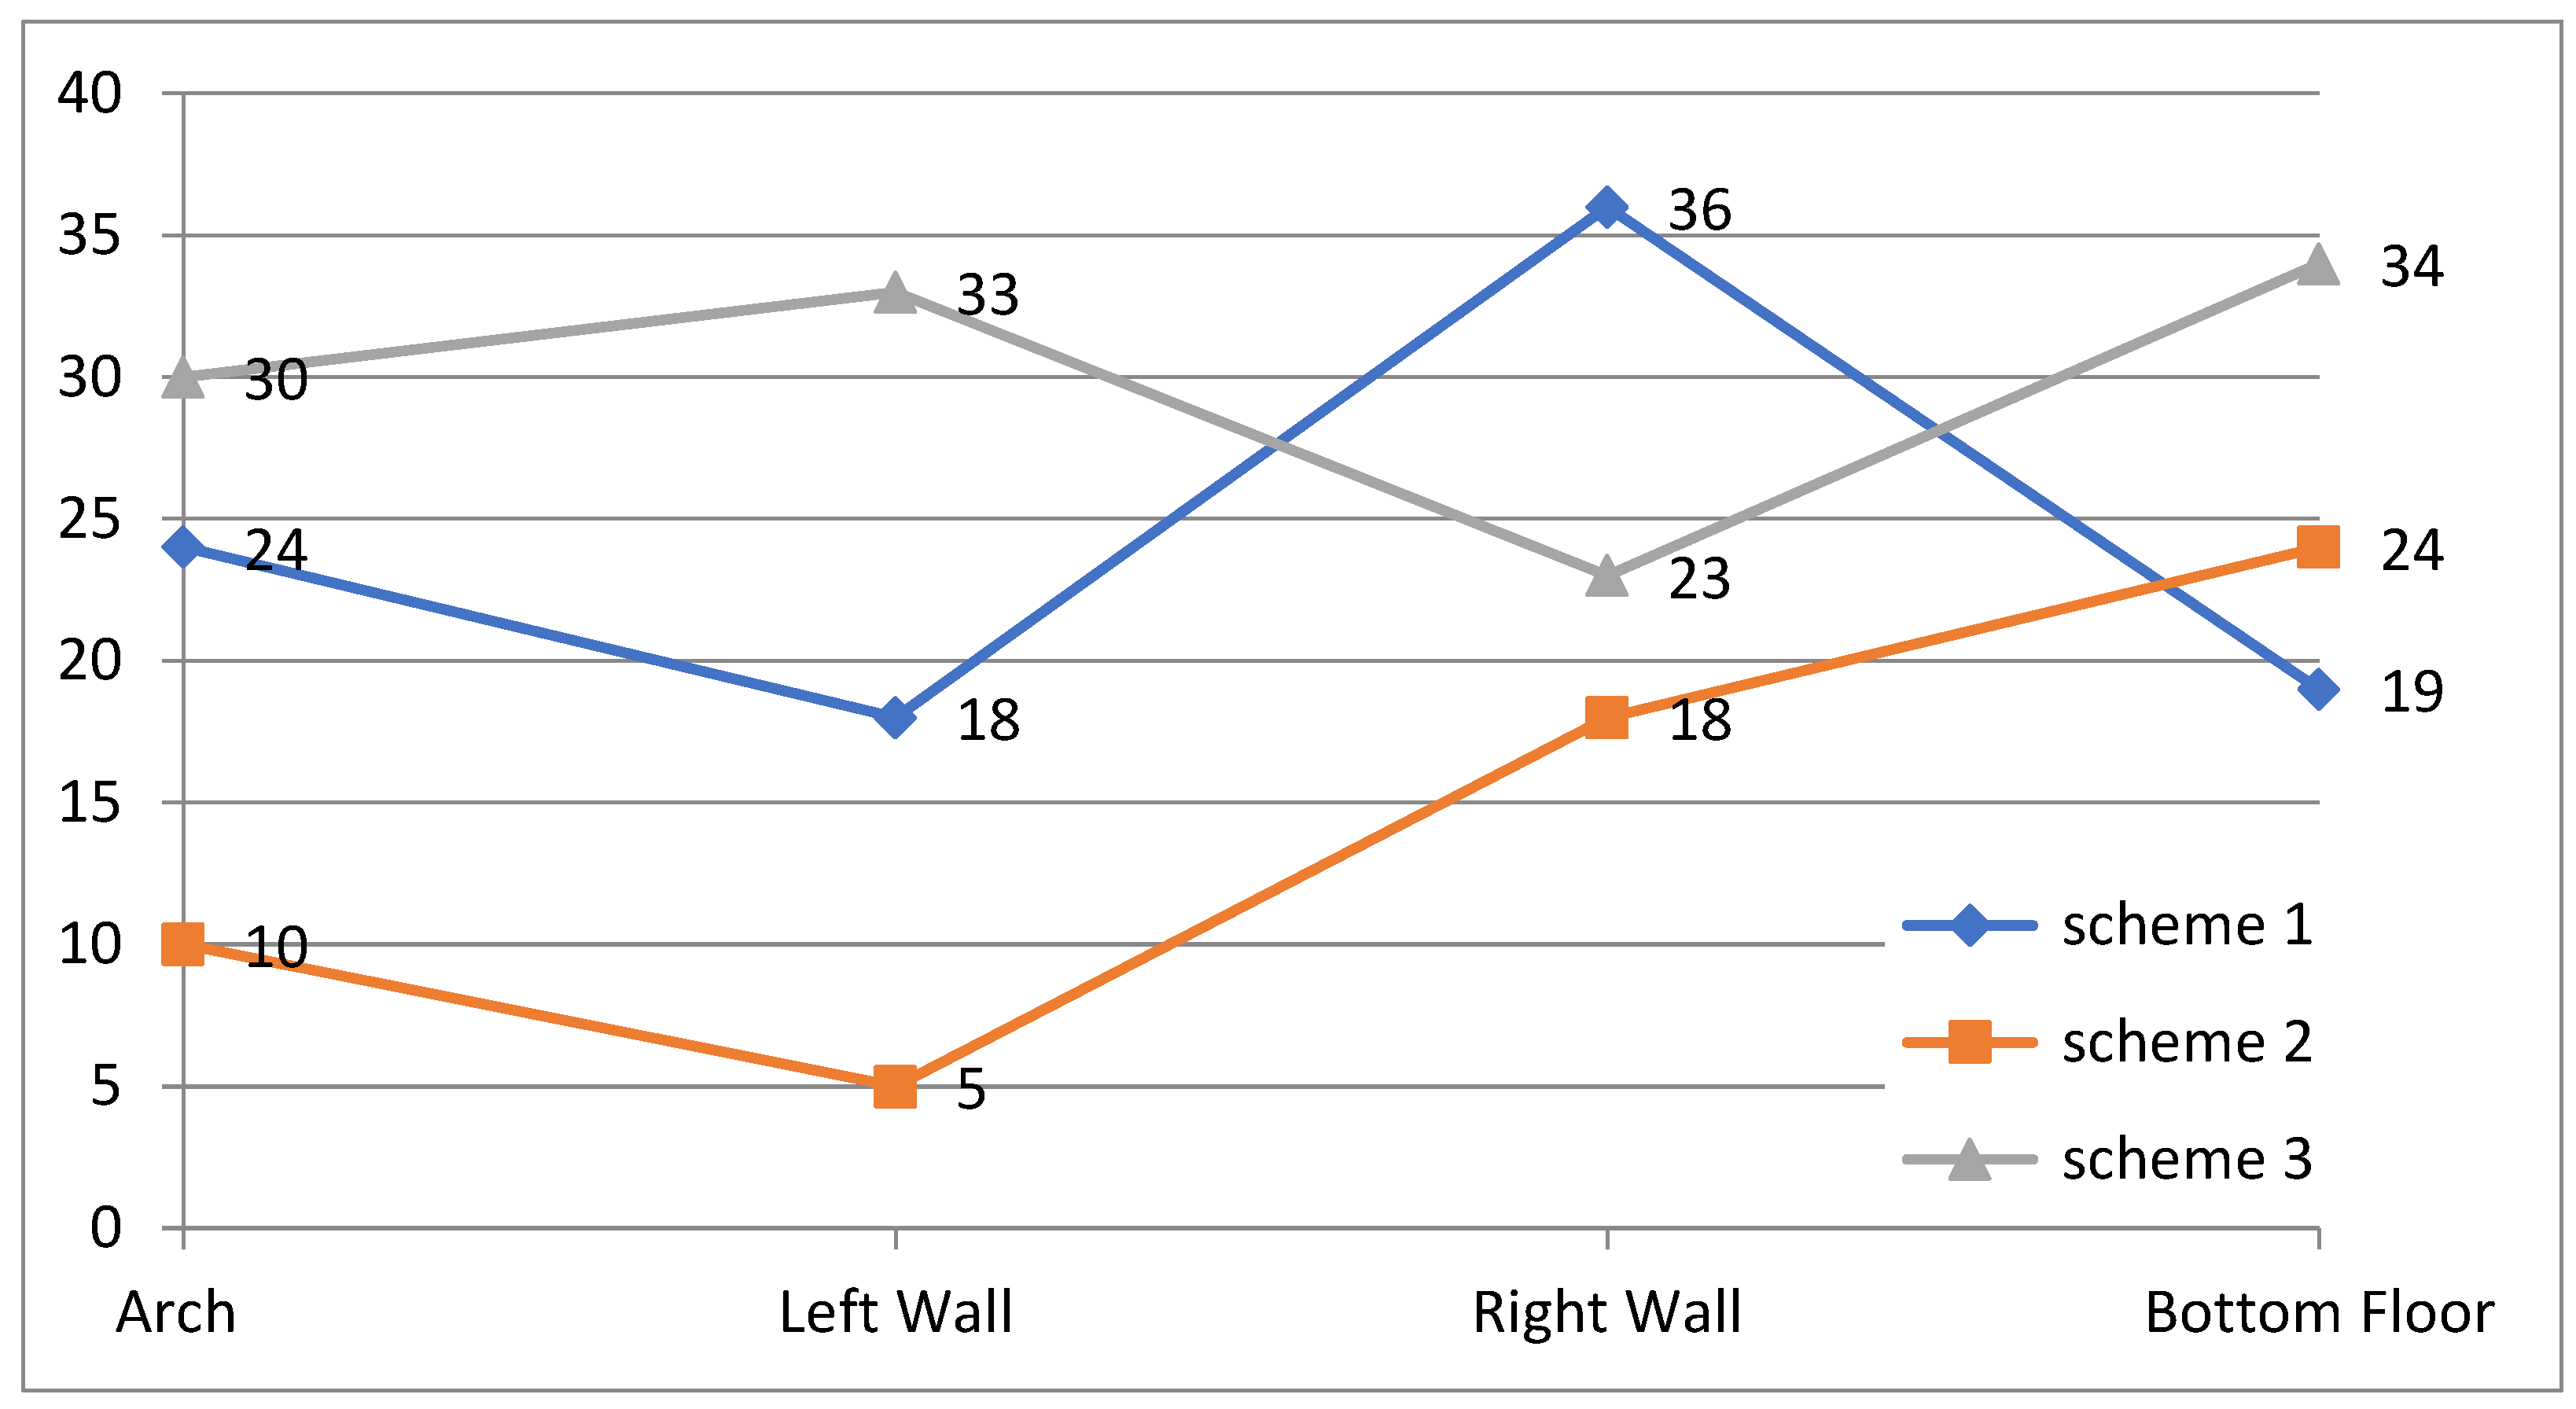
Figure 8.
Crack depth (m) of SR after excavation of main powerhouse.
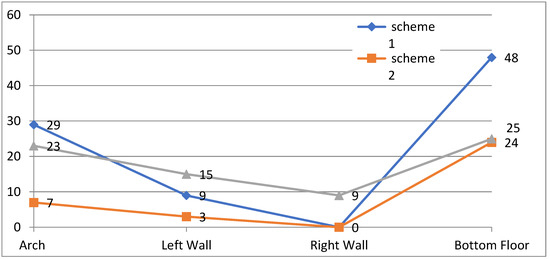
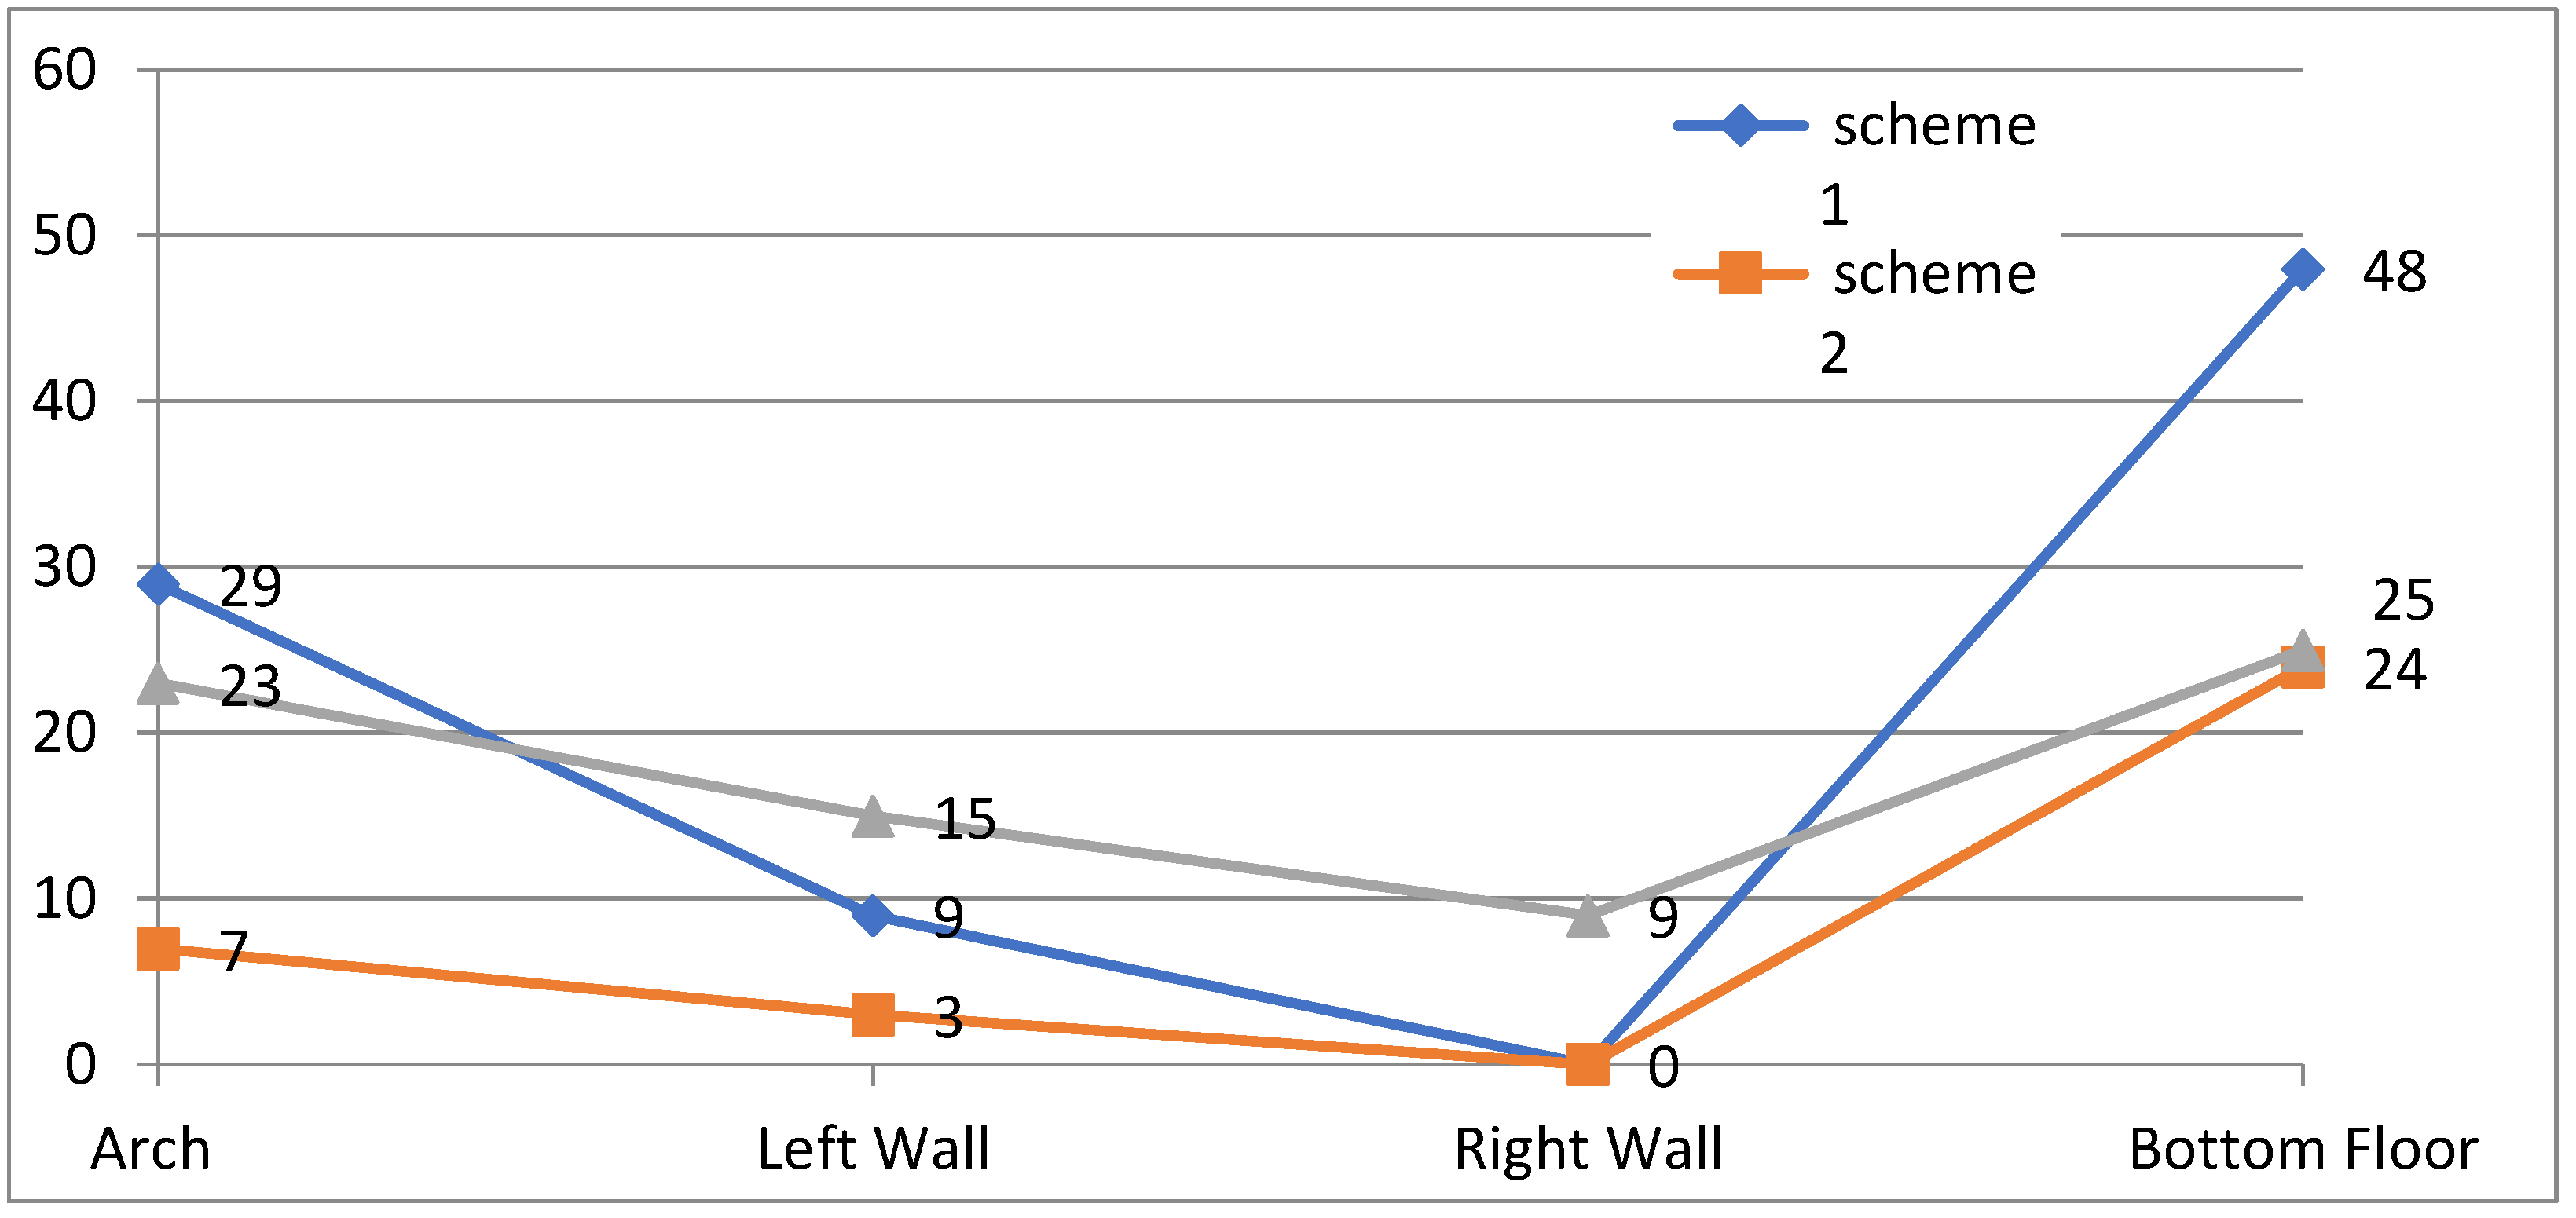
Figure 9.
Crack depth (m) of SR after excavation of main transformer chamber.
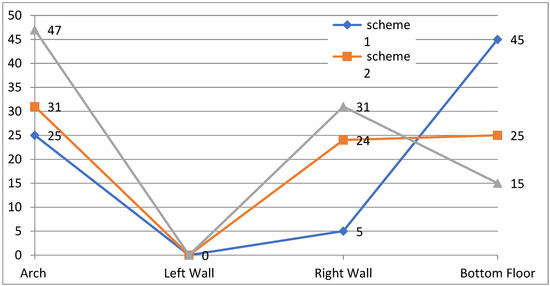
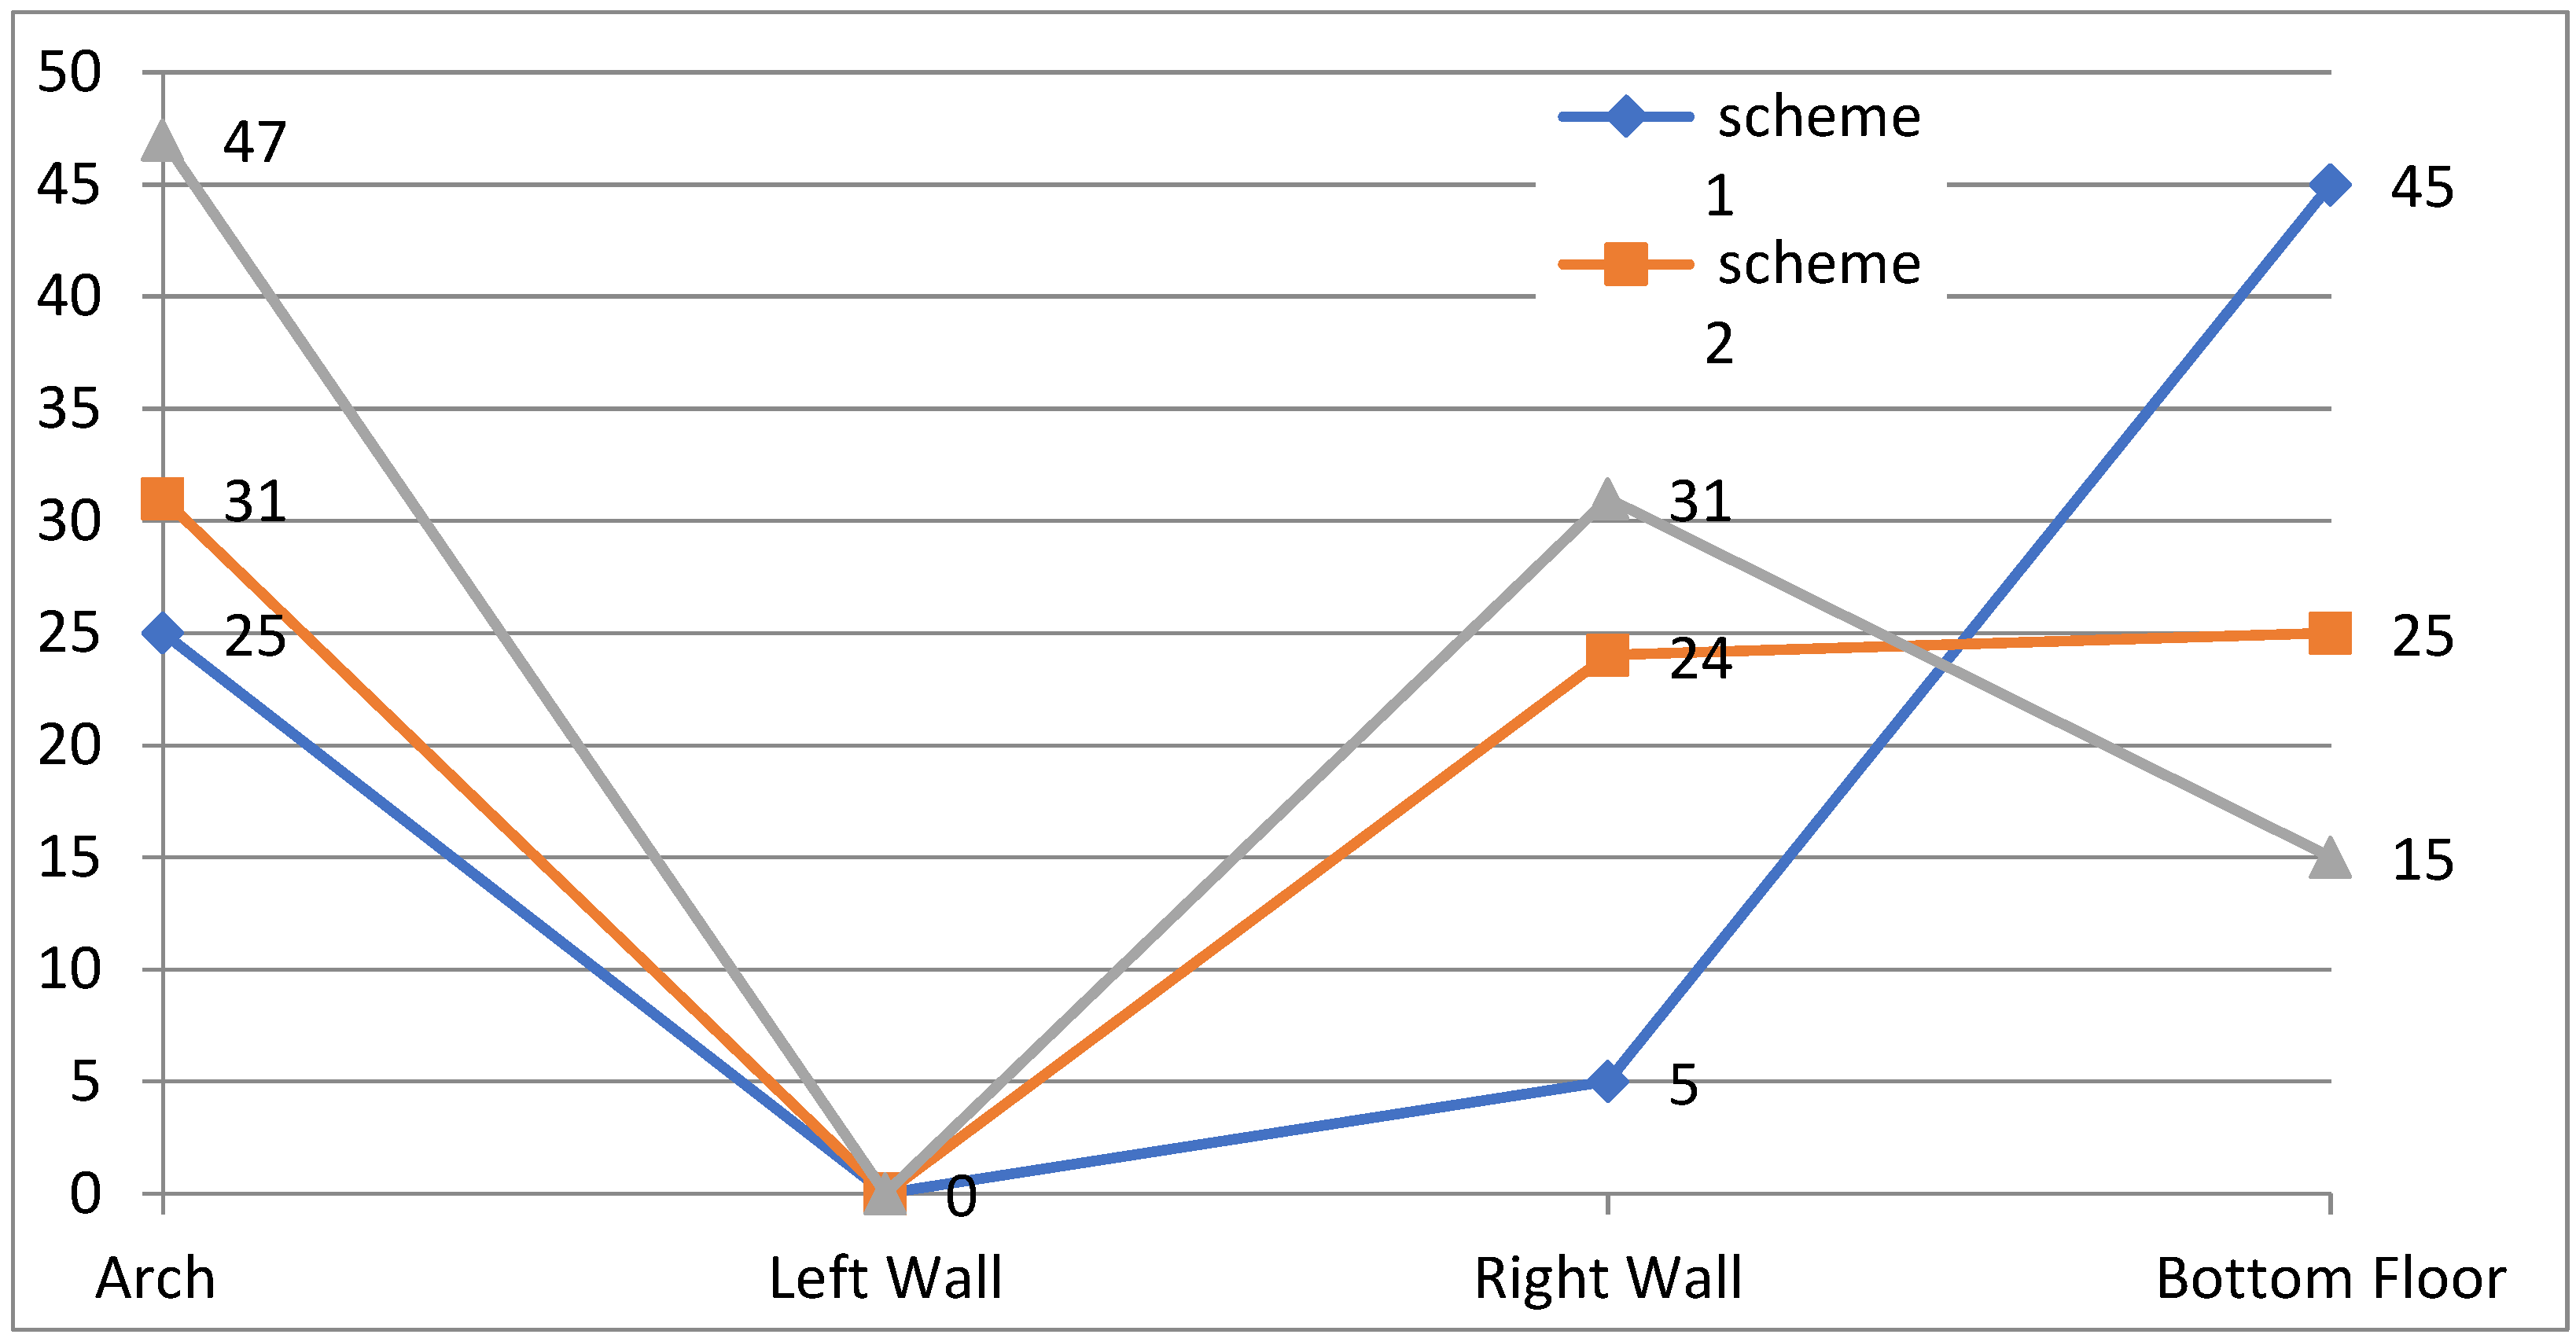
Figure 10.
Crack depth (m) of SR after excavation of tailrace surge tank.

Figure 11.
Broken zone after completion of excavation in Scheme 3.
After the excavation, the following conclusions can be drawn by comparing the failure patterns of the surrounding rocks in Figure 5l, Figure 6e and Figure 7e and the depth of crack propagation in Figure 8, Figure 9, Figure 10 and Figure 11.
- In Scheme 3, there are long cracks in the arch, the left and right side walls and bottom floor of the MP cavern, and the long cracks at the bottom floor are connected with fault f2, as shown in Figure 7e. There are dense cracks in the surrounding rocks between the right wall of the MP cavern and the left wall of the MTC cavern in Scheme 3, forming a broken zone, as shown in Figure 11. Figure 8 shows the crack propagation depth of each part of the MP cavern after excavation in three schemes; as shown in Figure 8, Scheme 3 has the largest crack propagation depth in the arch, left wall and bottom floor, and Scheme 1 has the largest crack propagation depth in the right wall. Scheme 2 has the smallest propagation depth of arch crack, left wall crack and right wall crack, while Scheme 1 has the smallest propagation depth of bottom floor crack. In conclusion, for the MP cavern, Scheme 2 is the optimal scheme.
- The damage degree of surrounding rocks in the MTC cavern of Scheme 1 and Scheme 3 is relatively high. Scheme 1 has the largest crack propagation depth in the MTC cavern, as shown in Figure 5l. In Scheme 3, dense cracks appear on the left wall of the MTC cavern, forming a broken zone, as shown in Figure 11. Figure 9 shows the crack propagation depth of each part after the excavation of the MTC cavern in three schemes. According to the data in Figure 9, it can be seen that Scheme 1 has the largest crack propagation in the arch and bottom floor of the MTC cavern, and Scheme 3 has the largest crack propagation in the left and right side walls. Scheme 2 has the smallest crack propagation depth in the MTC cavern arch, the left wall, the right wall and the bottom floor. In conclusion, for the MTC cavern, Scheme 2 is the optimal scheme.
- Schemed 2 and 3 of the TST cavern of rock damage are mainly concentrated on the right side of the arches, on the right side walls and on the bottom floors; the rock damage on the left side of the walls is not apparent, as shown in Figure 6e and Figure 7e, and the destruction of the TST cavern of Scheme 1 is mainly concentrated in the arch and bottom floor, as shown in Figure 5l. Comparing the crack area, it can be seen that Scheme 2 has the lowest degree of damage. Figure 10 shows the crack propagation depth of each part after the excavation of the TST cavern in three schemes. According to the data in Figure 10, Scheme 3 has the largest crack propagation depth in the arch and the right wall of the TST cavern, and Scheme 1 has the largest crack propagation depth in the bottom floor. The crack propagation depth of the left side wall is 0 in all three schemes. Scheme 1 has the smallest crack propagation depth in the arch, left side wall and right side wall of the TST cavern, while Scheme 3 has the smallest crack propagation depth in the bottom floor. In Scheme 2, although the propagation depth of SR of the arch, left and right side walls and bottom floor of the TST cavern are not the minimum, it does not appear to be the maximum either. In conclusion, for the TST cavern, Scheme 2 is the optimal scheme.
By comparing the arch, left and right side walls and bottom floor crack propagation depth of the MP cavern, MTC cavern and TST cavern in the three schemes, it can be seen that the excavation mode of Scheme 2 is better than that of Scheme 1 and Scheme 3.
4.1.3. Displacement Analysis of SR
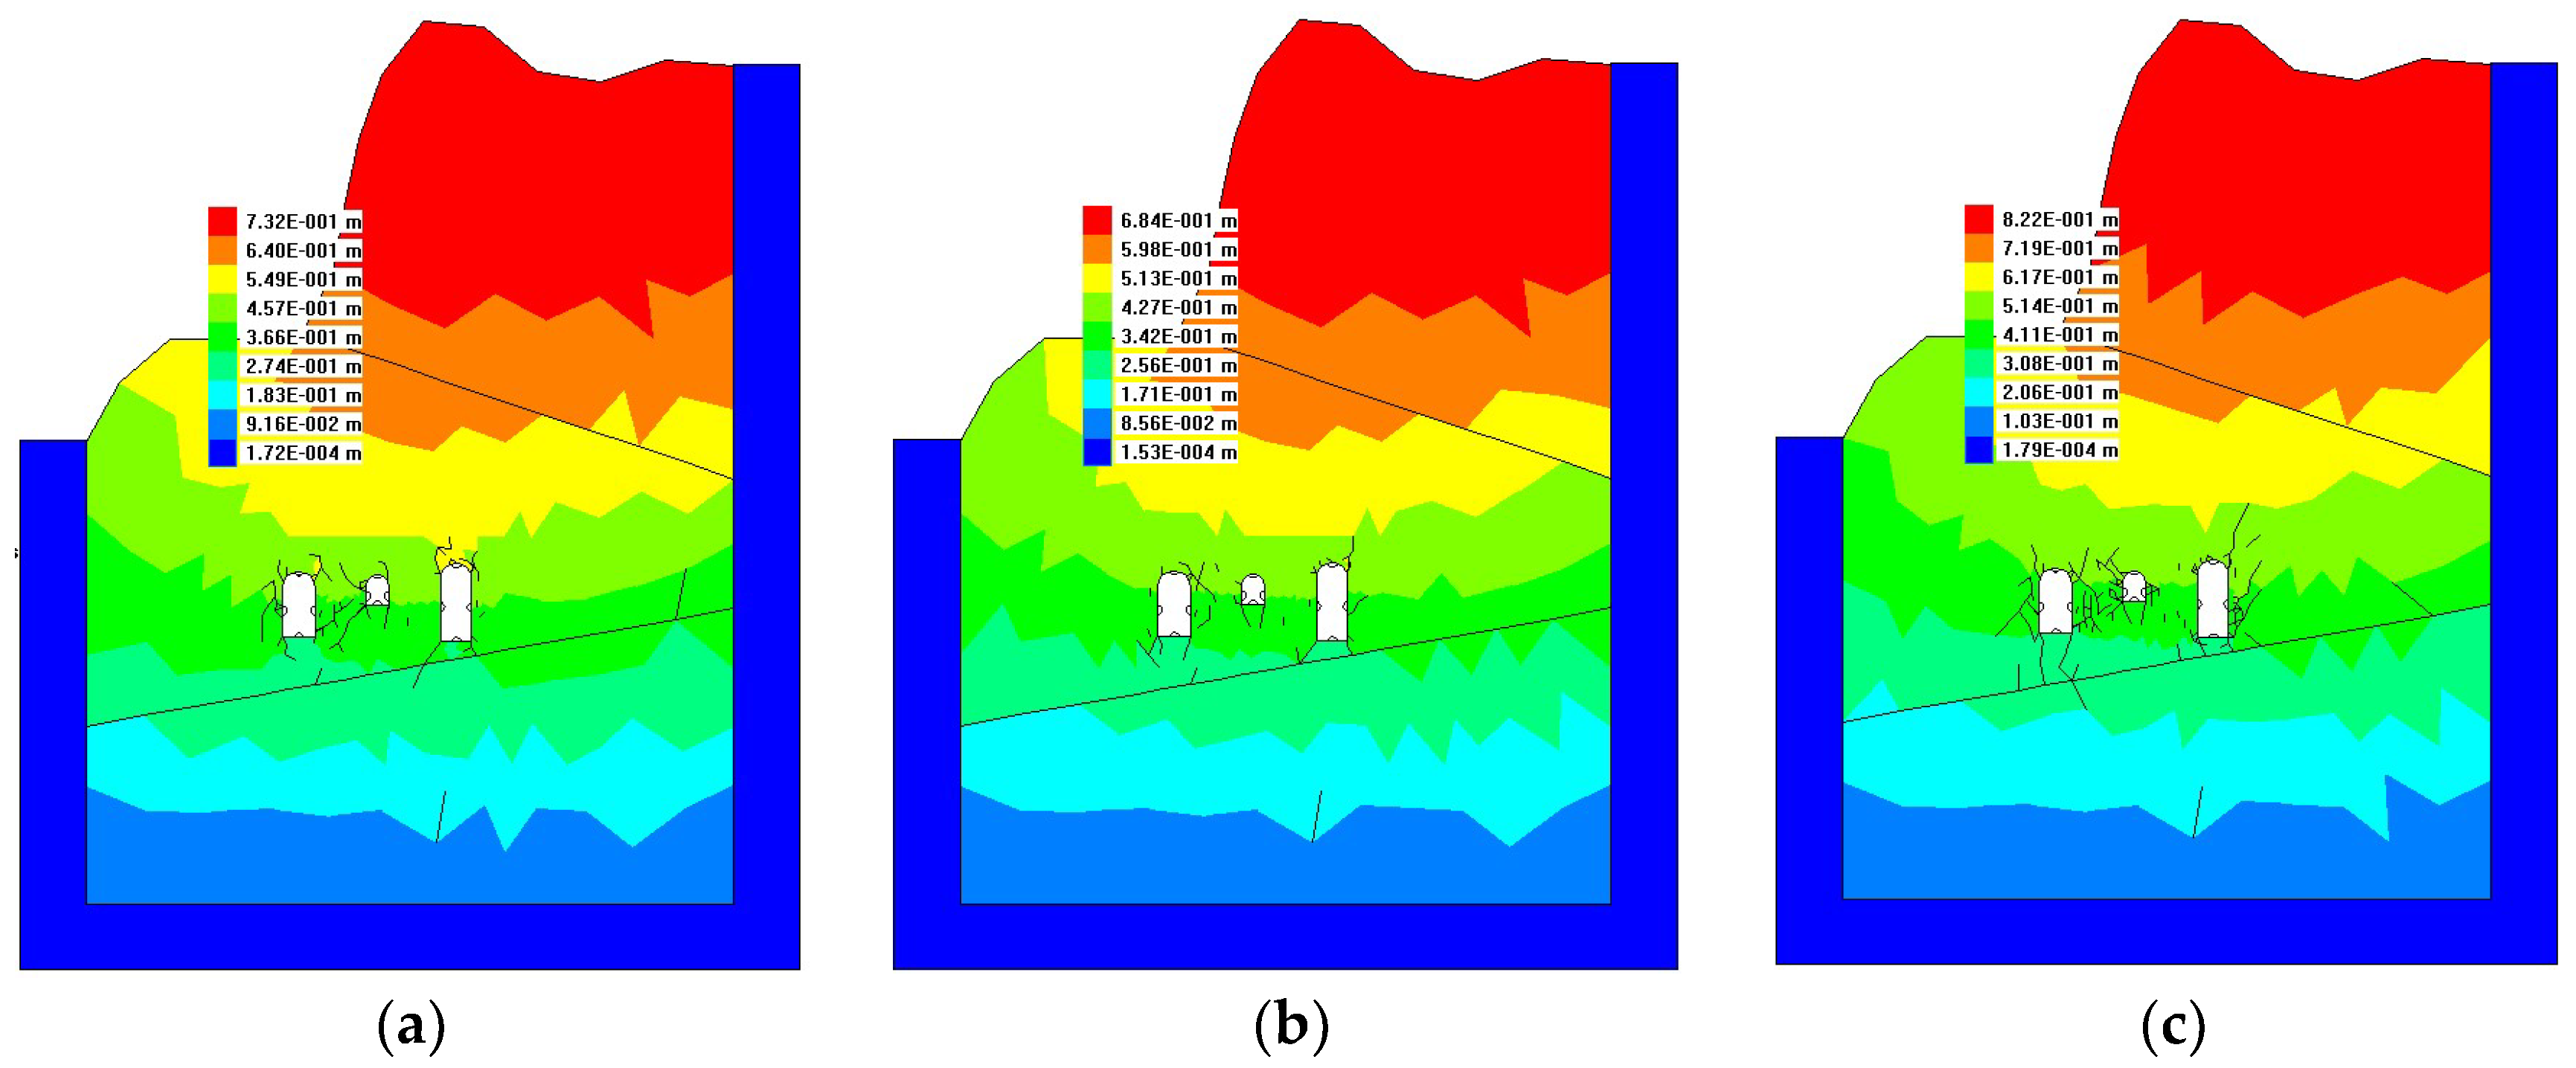
After the cavern group excavation was completed, the optimized DDARF program automatically measured the displacement contours of the SR of the cavern in three schemes, as shown in Figure 12a–c.
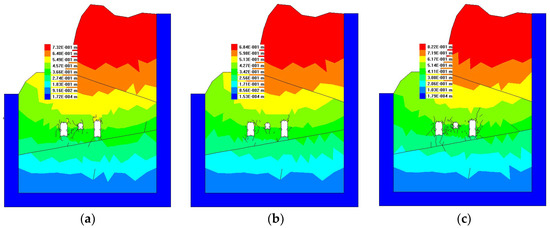
Figure 12.
Displacement contours of three schemes after excavation completion: (a) Scheme 1; (b) Scheme 2; (c) Scheme 3.
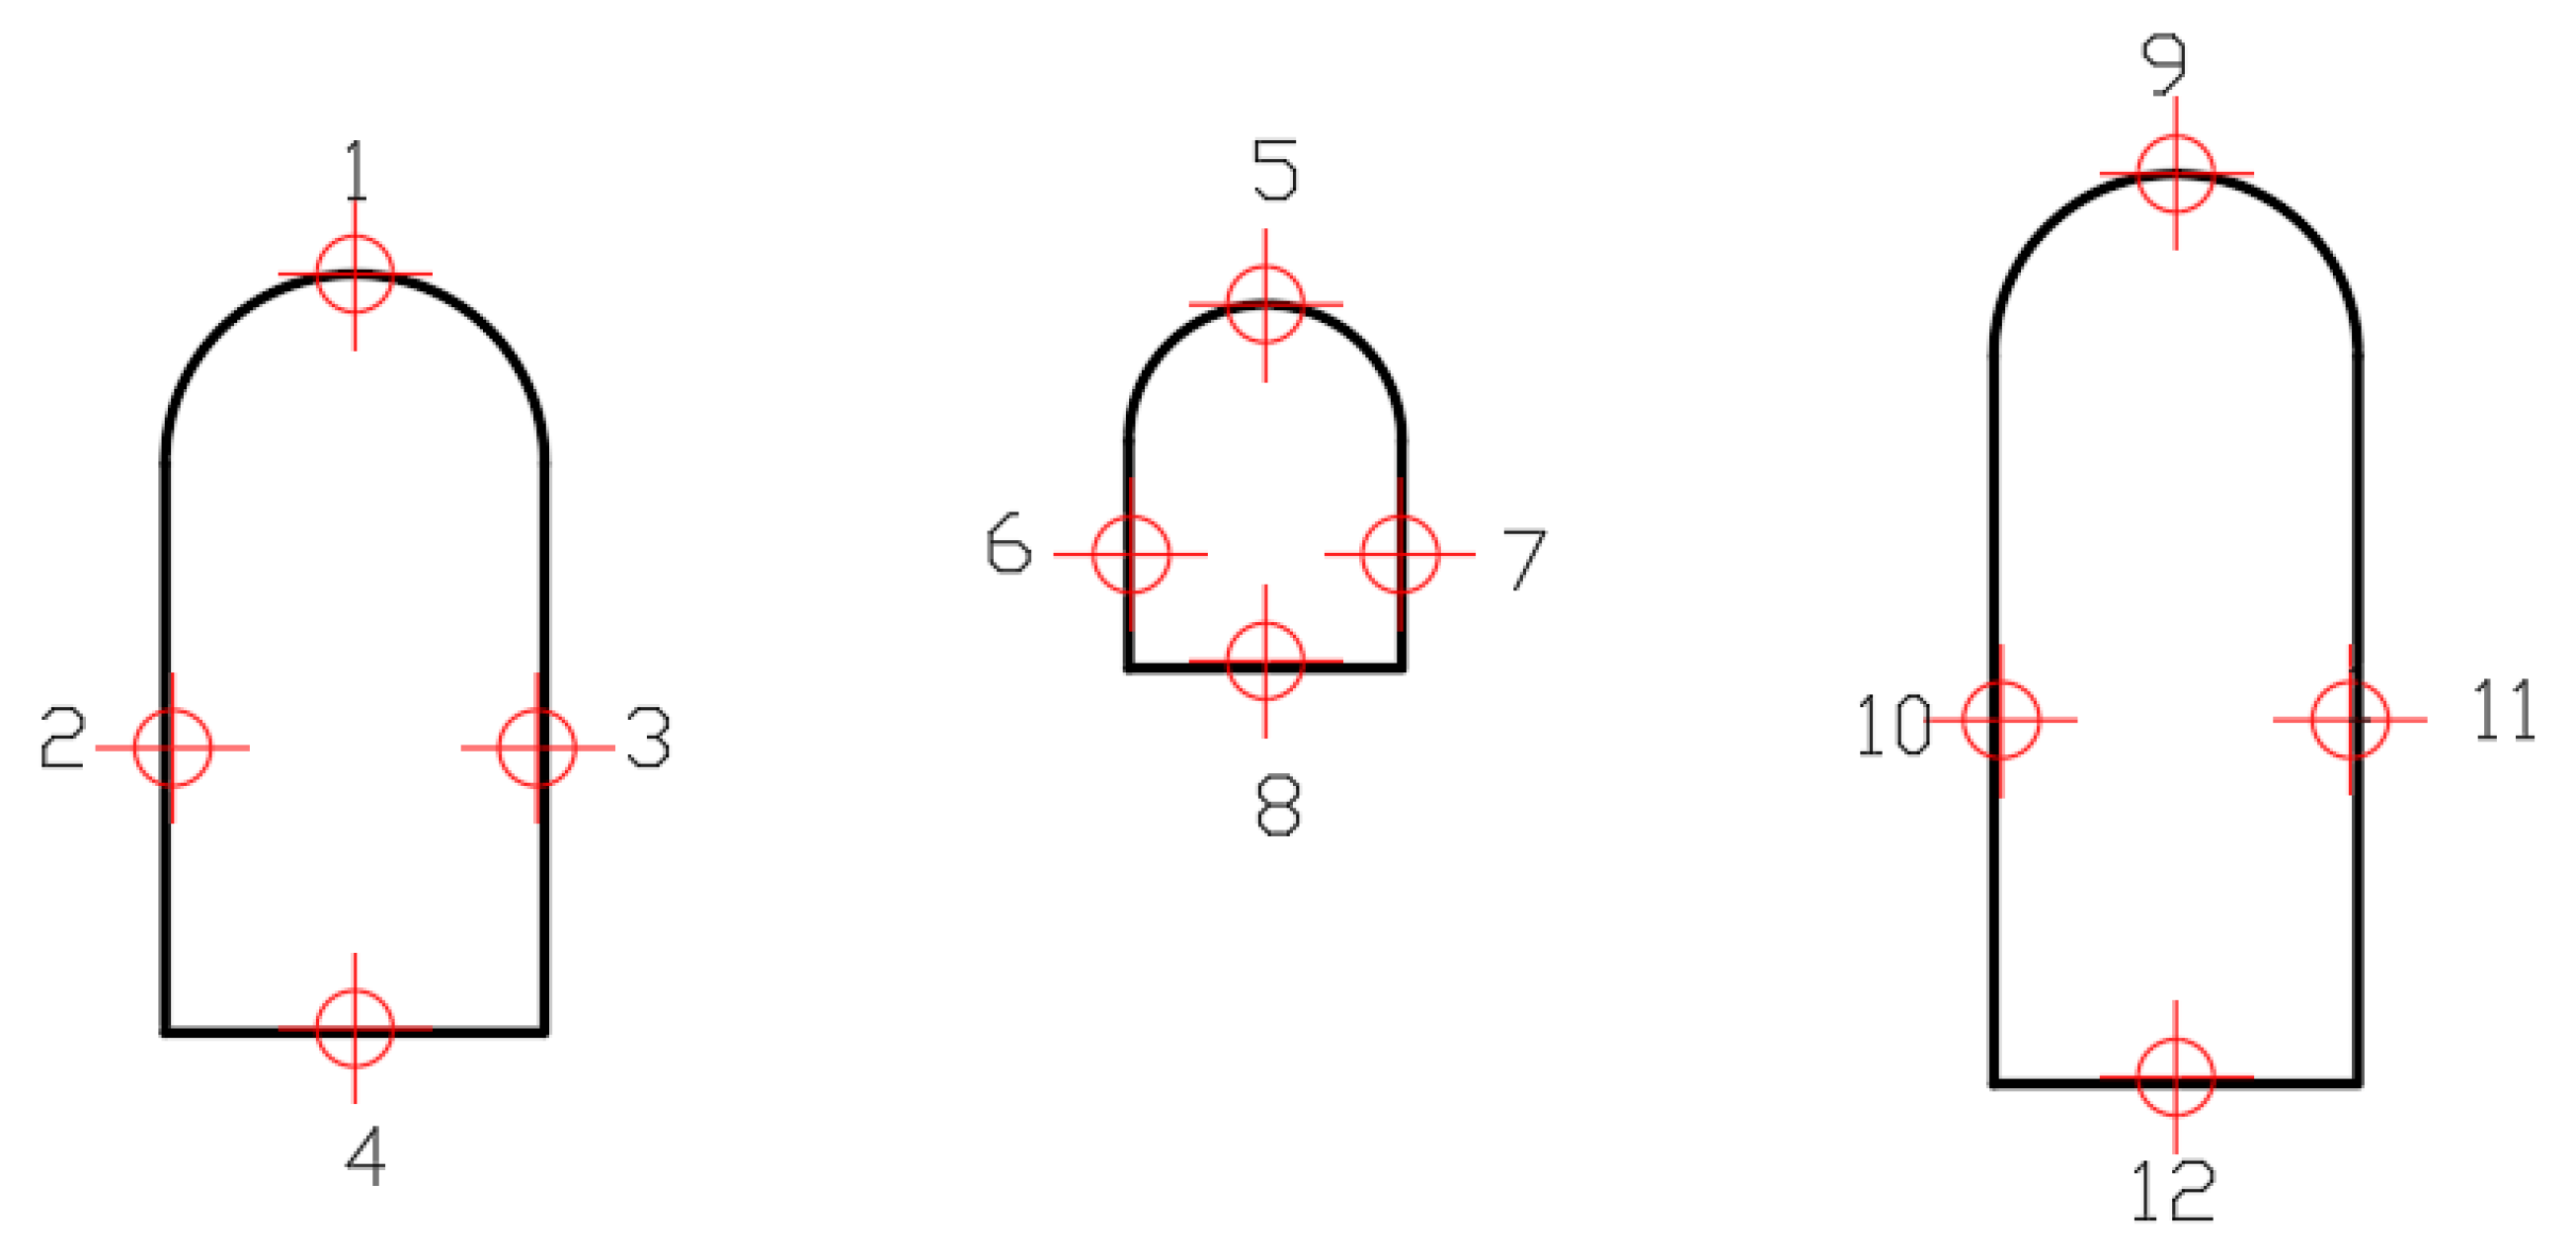
In order to obtain more accurate displacement data, at the arch, the left and right side walls and the bottom floor of each cavern, there are four key points set to measure the change in displacement in the process of excavation. The setting of measuring points is shown in Figure 13.

Figure 13.
Setting of key points of cavern group. (Note: The numbers in the picture represent the key point number).
The displacement of the key points of the three schemes after the completion of the excavation process can be obtained through the data of the measuring points. The specific statistics are shown in Figure 14 and Figure 15.
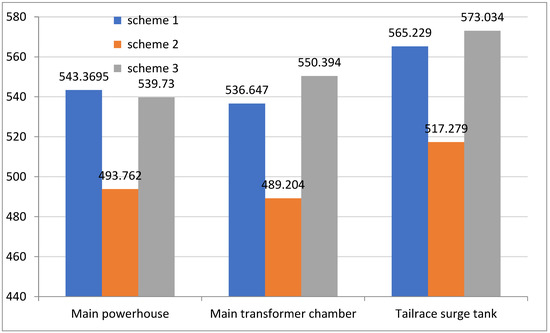
Figure 14.
Vertical displacements (mm) of the arch of cavern group in three schemes after excavation completion.
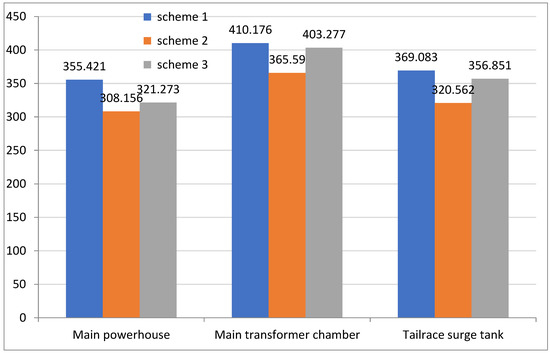
Figure 15.
Vertical displacement of bottom floor of cavern group in three schemes after excavation (mm).
- Among the vertical displacements of the arch, Scheme 2 has the smallest vertical displacement of the MP cavern (493.762 mm), MTC cavern (489.204 mm) and TST cavern (517.279 mm), respectively. It can be concluded that from the vertical displacement of the arch that Scheme 2 is the optimal scheme.
- In the vertical displacement of the bottom floor, Scheme 2 has the smallest vertical displacement of the MP cavern (308.156 mm), MTC cavern (365.59 mm) and TST cavern (320.562 mm), respectively. It can be concluded that from the vertical displacement of the bottom floor that Scheme 2 is the optimal scheme.
The vertical displacements of the arch and bottom floor of the cavern group are the smallest in Scheme 2. Therefore, from the displacement analysis of the SR of the cavern, Scheme 2 is also the optimal scheme.
4.2. Stability Analysis of SR of Cavern Group
According to the failure process, crack propagation depth and key point displacement of SR during cavern excavation under the three schemes, the stability of SR in the cavern can be analyzed as follows:
- From the SR failure process, after the excavation began of the three schemes, small cracks appeared in the surrounding rocks of the arch’s right side of the MP cavern and the arch’s left side and the bottom floor lower right corner of the TST cavern. In the first few steps in the process of excavation, the cracks did not grow and expand until the excavation steps were more than halfway completed (for Scheme 1 at the end of the seventh step of excavation, and for Scheme 2 and Scheme 3 at the end of the third step of excavation) the cracks around the cavern group began to increase and expand. It can be seen that in the early half stage of excavation, the stability of SR mainly focused on the arch SR of the MP cavern and the arch and bottom floor SR of the TST cavern.
- According to the failure process of the SR, in the latter half of the excavation period, the cracks increased rapidly. In this period, the cracks in the surrounding rocks of the three caverns increased and expanded, and after the excavation was completed, cracks appeared in the surrounding rocks of the arch, left wall, right wall and bottom floor of the MP cavern, in the surrounding rocks of the arch, left wall and bottom floor of the MTC cavern, and in the surrounding rocks of the arch, right wall and bottom floor of the TST cavern. According to the depth of the crack propagation, the crack propagation depth of the arch, left wall, right wall and bottom floor of the MP cavern, the arch, left wall and bottom floor of the MTC cavern, and the arch, right wall and bottom floor of the TST cavern are bigger. From the perspective of the displacement of the key points, the displacements of the arches and the bottom floors of the three caverns are relatively obvious. In summary, after the completion of the excavation of the cavern group, the stability problems of the cavern group mainly appeared in the surrounding rocks of the arch, left wall, right wall and bottom floor of the MP cavern, in the surrounding rocks of the arch, left wall and bottom floor of the MTC cavern, and in the surrounding rocks of the arch, right wall and bottom floor of the TST cavern.
- After the completion of the excavation, the cracks in the SR of the bottom floor of the TST cavern expanded and connected with fault f2. Therefore, fault f2 has an influence on the stability of SR of the TST cavern, while fault f1 has no influence on the stability of the cave group.
5. Conclusions
The conclusions can be stated as follows:
- In the early half of the excavation, the stability of SR mainly focused on the arch SR of the MP cavern and the arch and bottom floor SR of the TST cavern. After the excavation of the cavern group was completed, the stability problems of the cavern group mainly appeared in the surrounding rocks of the arch, left wall, right wall and bottom floor of the MP cavern, in the surrounding rocks of the arch, left wall and bottom floor of the MTC cavern, and in the surrounding rocks of the arch, right wall and bottom floor of the TST cavern.
- Fault f2 has an influence on the stability of the SR of the TST cavern, while fault f1 has no influence on the stability of the cave group.
- Through the analysis of the SR failure process, crack propagation depth and displacement of key points, it can be concluded that Scheme 2 is the optimal scheme, indicating that in the three excavation schemes of the cavern group, the scheme of simultaneous excavation of three caverns shows the advantages in the crack propagation depth of SR and vertical displacements of caverns.
Author Contributions
Conceptualization, H.-P.M. and N.N.N.D.; methodology, H.-P.M., N.N.N.D., Z.M.Y. and W.Z.Y.; software, H.-P.M.; validation, N.N.N.D.; formal analysis, H.-P.M., N.N.N.D., Z.M.Y., W.Z.Y. and H.-J.H.; investigation, H.-P.M., N.N.N.D., Z.M.Y. and W.Z.Y.; resources, H.-P.M. and N.N.N.D.; data curation, H.-P.M. and N.N.N.D.; writing—original draft preparation, H.-P.M.; writing—review and editing, N.N.N.D., Z.M.Y., W.Z.Y. and H.-J.H.; visualization, H.-P.M. and N.N.N.D. All authors have read and agreed to the published version of the manuscript.
Funding
This article was supported by the following funds: Study on the occurrence state of Fe and CaSO4 after middle temperature calcination of titanium gypsum [35001648], Open Fund project of State Key Laboratory of Comprehensive Utilization of Vanadium and Titanium Resources, China; Consolidation process and meso-evolution mechanism of tailings Sc_fqwly-2020-y-01 (School Fund) [35300420], Laboratory for Comprehensive Development and Utilization of Industrial Solid Waste Civil Engineering, Education Department of Sichuan Province, China. Failure law and engineering application of jointed rock mass 2020DOCO024 [35200243], Doctoral research start-up fee of Panzhihua University.
Institutional Review Board Statement
Not applicable.
Informed Consent Statement
Not applicable.
Conflicts of Interest
The authors declare no conflict of interest.
References
- Chen, J.T. Evaluation on Surrounding Rock Stability of Emergency Rescue Station Caverns in a Tunnel of Chenglan Railway. Master’s Thesis, Chengdu University of Technology, Chengdu, China, 2018. [Google Scholar]
- Zhu, W.S.; Li, S.C.; Zhang, Y.J. Research on the Application of Rock Fracture Damage Model in the Construction Sequence Optimization of Underground Caverns. In Proceedings of the Fourth Academic Conference of Chinese Society for Rock Mechanics and Engineering, Jinchang, China, 1 May 1996; pp. 474–480. [Google Scholar]
- Yu, X.; Zheng, Y.; Liu, H.; Fang, Z. Stability Analysis of Surrounding Rock in Underground Engineering; China Coal Industry Press: Beijing, China, 1983; pp. 12–25. [Google Scholar]
- Wang, X.P.; Wang, J.B.; Zhang, Q.; Song, Z.P.; Liu, X.R.; Feng, S.J. Long-term Stability Analysis and Evaluation of Salt Cavern Compressed Air Energy Storage Power Plant Under Creep-fatigue Interaction. J. Energy Storage 2022, 55, 105843. [Google Scholar] [CrossRef]
- Yuan, F.; Shi, A.F.; Zhou, J.W.; Hong, W.B.; Wang, M.; Lu, G.D.; Chen, Q.; Li, H.B. Deformation and Failure Analyses of the Surrounding Rock Mass with an Interlayer Shear Zone in the Baihetan Underground Powerhouse. Adv. Civ. Eng. 2021, 2021, 2988998. [Google Scholar] [CrossRef]
- Wu, Z.Z. Stability Analysis of Surrounding Rock During Construction of Underground Water Sealed Oil Storage Cavern. Master’s Thesis, Northeast Petroleum University, Daqing, China, 2020. [Google Scholar]
- Zhang, Y.M.; Zhu, F.G. Rock Block Stability and Support Optimization of Underground Powerhouse. Chin. J. Undergr. Space Eng. 2011, 7, 150–154+167. [Google Scholar]
- Gao, D. Review and Prospect of Geotechnical Engineering; China Communications Press: Beijing, China, 2001; pp. 134–158. [Google Scholar]
- Wang, C.G.; Zhang, Y. Application of FLAC3D in Stability Analysis of Shallow Buried Tunnel. Geotech. Eng. World 2008, 2, 50–51+5. [Google Scholar]
- Tong, W. Study on Working Behavior of Underground Cavern Group in Large-Scale Hydropower Project. Master’s Thesis, Hohai University, Nanjing, China, 2006. [Google Scholar]
- Tan, Y.X. Stability Analysis of Surrounding Rock of Large Underground Cavern Based on ABAQUS. Master’s Thesis, Donghua University of Technology, Nanchang, China, 2016. [Google Scholar]
- Deng, S.J.; Lu, X.M.; Huang, X.Y. A Brief Introduction to the Stability Analysis Method of Surrounding Rock of Underground Cavern. Geol. Explor. 2013, 49, 541–547. [Google Scholar]
- Bandis, S.C.; Vardakis, G.; Barton, N.; Addis, M.A. Instability and Stress Transformations Around Underground Excavations in Highly Stressed Anisotropic Media. In Proceedings of the Isrm International Symposium, Pau, France, 30 August 1989. [Google Scholar]
- Zeng, J.; Sheng, Q.; Tang, J.C. Comparative Analysis of Layout Scheme of Underground Powerhouse Under Complex Geological Structure. J. Undergr. Space Eng. 2007, 1, 105–109+113. [Google Scholar]
- Yang, Q.; Chen, X.; Zhou, W.Y. Elastoplastic Damage Model and Deformation Localization Analysis of Rock and Soil Materials. Chin. J. Rock Mech. Eng. 2004, 21, 3577–3583. [Google Scholar]
- Chen, X.; Yang, Q.; Zhou, W.Y. Plastic Damage Model of rock and soil materials and deformation localization analysis of arch dam. Rock Soil Mech. 2007, 5, 865–870. [Google Scholar]
- Li, J.H.; Yang, J.S. Elastoplastic nonlinear finite element analysis of rock damage. Chin. J. Rock Mech. Eng. 2000, 6, 707–711. [Google Scholar]
- Zhou, S.W.; Gong, J.Y.; Qie, L.P.; Xia, Z.F.; Zhou, H.Y.; Jin, X. Driver Fatigue Tracking and Detection Method Based on OpenMV. Adv. Sci. Technol. Eng. Syst. J. 2021, 6, 296–302. [Google Scholar] [CrossRef]
- Yu, M.H.; Li, J.C. Underground caves, Tunnels and Excavation of Hydraulic Power Station. In Advanced Topics in Science and Technology in China; Springer: Berlin/Heidelberg, Germany, 2012. [Google Scholar] [CrossRef]
- Deere, D.U.; Hendron, A.J.; Patton, F.D.; Cording, E. Design of Surface and Near-Surface Construction in Rock. In Proceedings of the 8th U.S. Symposium on Rock Mechanics (USRMS), Minneapolis, MN, USA, 15 September 1966. ARMA-66-0237. [Google Scholar]
- Lama, R.D.; Vutukuri, V.S. Handbook on Mechanical Properties of Rocks; Publication Trans Tech: Bay Village, Switzerland, 1978. [Google Scholar]
- Bieniawski, Z.T. Engineering Rock Mass Classifications: A Complete Manual for Engineers and Geologists in Mining, Civil and Petroleum Engineering; Wiley: New York, NY, USA, 1989. [Google Scholar]
- Barton, N. Recent Experience with the Q-System of Tunnel Support Design. Proc. Symp. Explor. Eng. Johannesbg. 1978, 1, 107–117. [Google Scholar]
- Guo, L.C. Application of Borehole Wall Optical Imaging in Rock Mass Classification. Shanxi Archit. 2018, 44, 54–56. [Google Scholar]
- Yang, S. Research on Intelligent Perception of Roof Quality of Coal Roadway Heading Face Based on Rock classification System. Ph.D. Thesis, China University of Mining and Technology, Beijing, China, 2019. [Google Scholar]
- Fan, G.B. Analysis of stability for the surrounding rock of underground excavations based on different yield criteria. Chin. J. Undergr. Space Eng. 2008, 4, 635–639. [Google Scholar]
- Li, Z.; Zhang, G.Z.; Chen, E.Y. Analysis of Stress State of Transversely Isotropic Weak Rock Stratum. IOP Conf. Ser. Earth Environ. Sci. 2021, 692, 042116. [Google Scholar]
- Li, L.P.; Li, S.C.; Zhao, Y.; Li, S.C.; Wang, H.P.; Liu, Q.; Zhao, Y.; Yuan, X.S. Experimental study on three-dimensional geomechanical model of progressive failure process of soft broken surrounding rock in super large section tunnel. Chin. J. Rock Mech. Eng. 2012, 31, 550–560. [Google Scholar]
- Jin, W.; Ding, W.Q.; Xu, W.W. Model Test Technology and Application of Extra-large Span Tunnel in Soft Surrounding Rock. Mod. Tunn. Technol. 2014, 51, 99–107. [Google Scholar]
- Huang, X.K.; Lu, K.L.; Zhu, D.Y. Simulation Test Study on the Influence of Shield Construction on Underground Pipeline Deformation at Different Positions. Rock Soil Mech. 2017, 38, 123–130. [Google Scholar]
- Zhang, Y.W.; Chen, L.; Wang, S.; Zhou, J.; Tian, C.S.; Feng, H.X. Research on agile FPGA fault injection system. In Proceedings of the 2021 International Conference on Microelectronics (ICM), New Cairo City, Egypt, 19–22 December 2021; pp. 57–61. [Google Scholar] [CrossRef]
- Tian, R.Z. Mined Construction Technology of Tunnel Group at the Junction of Metro Main line and Connection Line in Karst Stratum. Mod. Tunn. Technol. 2020, 57, 197–203. [Google Scholar]
- Zhou, Y.; Zhang, S.; Pan, B.; Cai, B.; Wu, J. Simulation Analysis of Surrounding Rock Stability of Three-dimensional Cross Underground Cavern Group. People’s Pearl River 2020, 41, 24–29. [Google Scholar]
- Crouch, S. Analysis of Stresses and Displacements around Underground Excavations: An Application of the Displacement Discontinuity Method, 2nd ed.; University of Minnesota Geomechanics Report; University of Minnesota: Twin Cities, MN, USA, 1980. [Google Scholar]
- Li, B.; Ding, Q.F.; Xu, N.W.; Lei, Y.; Xu, Y.; Zhu, Z.; Liu, J. Mechanical Response and Stability Analysis of Rock Mass in High Geostress Underground Powerhouse Caverns Subjected to Excavation. J. Cent. South Univ. 2020, 27, 2971–2984. [Google Scholar] [CrossRef]
- Shi, G.H. Discontinuous Deformation Analysis: A New Numerical Model for the Statics and Dynamics of Block Systems. Ph.D. Thesis, University of California, Berkeley, CA, USA, 1988. [Google Scholar]
- Fan, H.Y.; Li, L.P.; Chen, G.Q.; Liu, H.L.; Ji, X.Y.; Jiang, X.B.; Zhou, S. An Improved 3D DDA Method Considering the Unloading Effect of Tunnel Excavation and Its Application. Comput. Geotech. 2023, 154, 105178. [Google Scholar] [CrossRef]
- Pu, S.; Yu, T.; Ye, L.B.; Liao, H.; Fang, Y.; Yao, Z.G.; Wang, J. Study on Instability Mechanism and Support Scheme of the Tunnel Face in Carbonaceous Phyllite Stratum under High Geo-Stress. Adv. Civ. Eng. 2022, 2022, 3870227. [Google Scholar] [CrossRef]
- Wu, A.Q.; Ding, X.L.; Chen, S.H.; Shi, G.H. Researches on Deformation and Failure Characteristics of an Underground Powerhouse with complicated Geological Conditions by DDA Method. Chin. J. Rock Mech. Eng. 2006, 25, 2–8. [Google Scholar]
- Fu, X.D.; Sheng, Q.; Zhang, Y.H. Stepwise Excavation Process of Underground Caverns of Hydropower Station Using DDA. Rock Soil Mech. 2013, 34, 568–574. [Google Scholar]
- Ke, T.C. Application of DDA to stability analysis of rock masses. In Proceedings of the First International Forum on Discontinuous Deformation Analysis (DDA) and Simulations of discontinuous Media, Berkeley, CA, USA, 12–14 June 1996; TSI Press: Albuquerque, NM, USA, 1996. [Google Scholar]
- Ning, Y.J.; Yang, J.; Chen, P.W. Numerical Simulation of Rock Blasting in Jointed Rock Mass by DDA Method. Rock Soil Mech. 2010, 31, 2259–2263. [Google Scholar]
- Jiao, Y.; Zhang, X.; Li, T. DDARF Method for Simulating the Whole Failure Process of Jointed Rock Mass; Science Press: Beijing, China, 2010; pp. 2–15. [Google Scholar]
- Jiao, Y.Y.; Zhang, X.L.; Zhang, H.Q.; Huang, G.H. A Discontinuous Numerical Model to Simulate Rock Failure Process. Geomech. Geoengin. 2014, 9, 133–141. [Google Scholar] [CrossRef]
- Ma, H.P.; Daud, N.N.N. Jointed Rock Failure Mechanism: A Method of Heterogeneous Grid Generation for DDARF. Appl. Sci. 2022, 12, 6095. [Google Scholar] [CrossRef]
- Wang, Z.S. Study on Mechanism and Discontinuous Deformation Analysis of Hydraulic Fracturing of Rock. Ph.D. Thesis, Shandong University, Jinan, China, 2019. [Google Scholar]
- Wang, L.M. Finite Element Meshing Automation System for Specific Component. Ph.D. Thesis, Shandong University, Jinan, China, 2017. [Google Scholar]
- Wang, W.; Liu, G.W.; Su, Q.; Han, R. Analysis of Excavation Procedure and Stability in Jointed Rock Masses of the Large Underground Caverns. In Application of Intelligent Systems in Multi-Modal Information Analytics; MMIA 2019; Advances in Intelligent Systems and Computing; Sugumaran, V., Xu, Z.P.S., Zhou, H., Eds.; Springer: Cham, Switzerland, 2019; p. 929. [Google Scholar]


Disclaimer/Publisher’s Note: The statements, opinions and data contained in all publications are solely those of the individual author(s) and contributor(s) and not of MDPI and/or the editor(s). MDPI and/or the editor(s) disclaim responsibility for any injury to people or property resulting from any ideas, methods, instructions or products referred to in the content. |
© 2023 by the authors. Licensee MDPI, Basel, Switzerland. This article is an open access article distributed under the terms and conditions of the Creative Commons Attribution (CC BY) license (https://creativecommons.org/licenses/by/4.0/).