Article

Distribution Quality of Agrochemicals for the Revamping of a Sprayer System Based on Lidar Technology and Grapevine Disease Management

Department of Agricultural, Food and Environmental Sciences, Marche Polytechnic University, Via Brecce Bianche 10, 60131 Ancona, Italy
*
Author to whom correspondence should be addressed.
Appl. Sci. 2023, 13(4), 2222; https://doi.org/10.3390/app13042222
Submission received: 26 January 2023 / Revised: 5 February 2023 / Accepted: 6 February 2023 / Published: 9 February 2023

Abstract

:
Grapevines are one of the most intensely treated crops with a high potential risk to health and biodiversity. Thus, the distribution control of agrochemicals is crucial to obtain a high quality and sustainable product for intensive viticulture. Although the search for systems to reduce the waste of chemical products is consistent in some countries, such as Italy, the machinery used are obsolete. The development of an upgrading system for sprayers can be a good compromise to achieve the pollution reduction without requiring huge investments. Field tests were conducted using a LIDAR-based prototype coupled to a commercial sprayer. This study tested the distribution performance using water-sensitive papers and evaluated the infections of grapevine downy and powdery mildews. The results showed a distribution in the vegetation gaps with a higher frequency in the coverage classes >20% in the standard treatment and 10–15% in the LIDAR treatment. Treatments performed with LiDAR reduced the incidence of downy mildew and severity of powdery mildew. The innovative sprayer reduces the distribution of agrochemicals thanks to the on/off control of the nozzles in the voids of vegetation and, meanwhile, controls vineyard fungal disease, so it can be a good way to meet the sustainability and quality of the production.

1. Introduction

Precision agriculture (PA), also called precision farming, is defined as a system that uses GPS technology, including satellites and sensors, and big data management applied to agriculture [1]. The aim of PA is to achieve better efficiency, productivity and sustainability of agri-food chain. One of the most important aims for agriculture is to reduce the distribution of plant protection products (PPPs) both to reduce environmental impact, to improve product quality and for better economic management [2,3,4]. Therefore, precision agriculture plays a crucial role in doing this through sensors, device connection and data elaboration [5]. There are lot of published works focused on environmental sustainability of PA both for reduction of greenhouse gas emissions [6], for example, using LCA analysis [7], and a better quality of water and food [8,9].
Grapevine powdery mildew (GPM) and downy mildew (GDM), caused by Erysiphe necator and Plasmopora viticola, respectively, represent two of the main constraints of European viticulture. Vitis vinifera evolved separately from GPM and GDM causal agents [10,11], resulting in being highly susceptible to these pathogens. Consequently, their management requires many treatments with chemical fungicides throughout the season, especially in organic farming, where the use of curative compounds is not allowed. PA involves all agri-food chain phases, and so, it is important to analyze specifically the distribution control of agrochemicals in vineyards or orchards, which requires several treatments. The European Union has been paying attention to sustainability in agri-food chain. The reduction of PPPs used in agriculture represents one of the pillars of the farm-to-fork strategy, and one of the main goals is “to reduce the overall use and risk of chemical pesticides by 50% and the use of more hazardous pesticides by 50% by 2030” [12]. For these reasons, the distribution of PPPs should be adjusted according to field needs [13,14]. According to Le Cointe et al. [15] and Zanin et al. [16], pesticides distribution could be reduced in three ways: reduced number of treatments, low doses of application and exclusive distribution on targets. In the first case, crop yield can be compromised; in the second case, genetic resistance can be promoted. Instead, the exclusive distribution on targets represents the best strategy on which the site-specific application is based to carry out a precise management of inputs [7].
The distribution control of agrochemicals can be applied in an espalier system, such as in vineyard or orchards managed with similar systems, through automatic section control of the sprayer or smart sprayer assembled with robots. Every smart sprayer needs specific real-time sensors and a control system to detect the tridimensionality of plants and modulate the distribution of agrochemicals; sensors include an infrared sensor system, ultrasonic sensor system, LiDAR sensor system, machine vision system and sensor fusion system [17]. LiDAR, short for Light Detection and Ranging, is a special sensor that uses pulsed light to measure the distance between the source and the object [18,19]; the system produces a large data set, known as point clouds, and consists of millions of points [20]. There are two types of LiDAR systems: ALS, stands for airborne lidar or airborne laser scanning, refers to a laser on board an aircraft (including unmanned aerial vehicles), and ground-based lidar, divided into TLS (terrestrial laser scanning) and MLS (mobile laser scanning) systems [19]. LiDARs can be divided into 1D, 2D and 3D sensor scanning, respectively, one axis, two axes (X, Y) and three axes (X, Y, Z). In particular, 2D LiDAR rotates 180 or 360 degrees to collect the horizontal distance to the targets [18]. Recently, LiDAR technology has become widespread thanks to improvements in range detection performance, accuracy, scanning angle and other features [21]. According to Raj et al. [21], LiDAR sensors stand out for field of view (FOV), angular resolution, response time and number of scan points. For example, the FOV represents the area that can be observed by the scanner and is limited to the horizontal plane for 2D scanners and both horizontal and vertical planes for 3D scanners. LiDAR systems can be classified into four different scanning mechanisms: optomechanical, electromechanical, MEMS and solid-state scanning [21,22]. Optomechanical scanning uses optical components in aiding beam deflection and is similar to MEMS scanning, but the latter is smaller and lighter; electromechanical scanning uses electric motors to obtain 3D scans due to different beam orientations, and solid-state scanning is used to detect objects for navigation purposes. There are different kinds of LiDARs, for example, LS Lidar MS03 [23] is a 3D LiDAR that scans at high speed at a horizontal angle of 120°, an accuracy of ±2 cm and acquisition frequency variable from 75 kHz to 750 kHz, based on a detection range from 2000 m to 200 m. Sick TiM1xx [24] is a 2D LiDAR that scans at a horizontal angle of 200° for indoor use and an acquisition frequency about 14.5 Hz. The first one is much more expensive than the second one, respectively, around EUR 25–30,000 and EUR 900–1000.
The distribution of agrochemicals is deeply linked to spray drift, defined as a part of agrochemicals carried out of the target during the spraying activity [25]. According to the literature, a spray losses range from 1% up to 20–30% [26,27], but in some cases, it can reach 90%, depending on the compounds used [28]. Spray drift affects human health and environment, including water, soil and air. Therefore, it is important to reduce agrochemicals used in agriculture and, at the same time, improve the distribution on the target [29,30]. Thanks to new technologies, it is possible to manage the distribution of agrochemicals and to use the correct amount on the correct target [30] following the principles of precision agriculture. There are two possibilities: variable rate spraying, managing the distribution of agrochemicals according to specific vegetation features, or on/off control, as explained below. The spray cloud can be analyzed by a 3D LiDAR; the data can be used both to modulate the distribution of agrochemicals and develop a simple prediction model [26]. Furthermore, LiDAR gave satisfactory results applied to on/off control based on the presence/absence of vegetation [31]. New technologies demonstrate their positive performance, for example, the reduction of pesticides ranges from 53% [32] up to 70% [33], depending on the type of innovation introduced. The reduction of agrochemicals distributed, combined with better distribution on the target, allows to reduce spray drift phenomena.
Spray drifts can be detected with an artificial target, called water-sensitive papers (WSP), subsequently analyzed with different techniques. There are three cases found about the use of WSP to detect spray distribution [34,35,36]. In particular, the study conducted by Chen et al. [36] represents an important starting point for the work discussed below. They used monofilament nylon screens to mount WSP (26 × 76 mm, by Syngenta Crop Protection AG, Basel, Switzerland) in different target locations inside the orchard; one of the procedures reported for data analysis is based on coverage WSP samples provided by the chemical company (hereafter referred to as the “comparing protocol”). The analysis of water-sensitive papers is primarily direct to observe the coverage area, expressed as a percentage of the covered area; there are different techniques to elaborate WSP: digital post-processing and data extrapolation via software, a smart camera equipped with internal software or portable applications for a smartphone. The former solution is the most hardworking because of the complexity of each step: Zhu et al. [35] developed a portable scanning system connected to a post-processing software; to test the accuracy of the program, they used a reference card containing uniform spots ranging in size produced by Hoechst AG (Frankfurt, Germany). The main problem is that the reference card is not available anymore, and the one used in the study cited has too-low resolution, while the latter solution is interesting because its application is easily downloadable on smartphones and provides the spray coverage estimation of agrochemicals. For example, SnapCard and DropLeaf are two applications described in the literature [37,38] with positive outcomes.
According to Beyaz et al. [39], water-sensitive papers provide relevant advantages if compared to other measurement methods of droplet analysis. For example, digital image processing techniques are easy-to-use, directly usable and low-cost. To evaluate the quality of spraying, WSP can also be used to measure droplet size spectra. More in detail, according to several works available in the existing literature [39,40,41], the most important parameters are: Volume Median Diameter (VMD), Number Median Diameter (NMD), Diameter Surface (ds), range of droplet sizes and more.
The aims of this study are to verify (i) the efficacy evaluation of a 2D LiDAR system with on/off control aimed for the vineyard distribution of agrochemicals and (ii) the relationship between mechanical distribution efficacy and protection of grapevines by GPM and GDM.

2. Materials and Methods

2.1. Experimental Equipment and Devices

The equipment and devices used in the experiment included a traditional sprayer combined with a Landini Rex 100 tractor, LiDAR and other three devices interconnected.
The conventional sprayer is produced by SAE, model Turbmatic Defender MK2 91DP/1500 (Figure 1a). It is composed of a 1500 L polyethylene tank, a fan with a diameter of 910 mm with front air intake and 14 cone nozzles mounted on a rectangular parallelepiped turret. To achieve the aim of the project, the conventional sprayer is equipped with a prototype for data acquisition (Figure 1b) composed of a LiDAR sensor, GPS (Global Positioning System), IMU (Inertial Measurement Unit) and controller. The LiDAR, model RP LiDAR-A3 produced by SLAMTEC, is a low-cost 2D sensor for indoor and outdoor applications and, respectively, 16 kHz and 10 kHz maximum sampling frequency. The GPS receiver, model Ag Leader GPS 1500, is used to geotag the worksite and give the tridimensional data of points cloud extracted from LiDAR. IMU stands for inertial measurement unit, model WIT MPU6505 3-Axis, and is used to improve the accuracy of all data. All the devices are connected via the controller Raspberry PI model B+.
The purpose-driven design of the prototype was to allow the distribution of agrochemicals by following the principles of precision agriculture, even by using obsolete sprayers; the intended application is a vineyard with a high incidence of gaps and presence of different species along the row (especially in organic management) that are typical of a hillside Italian vineyard.

2.2. Experimental Design

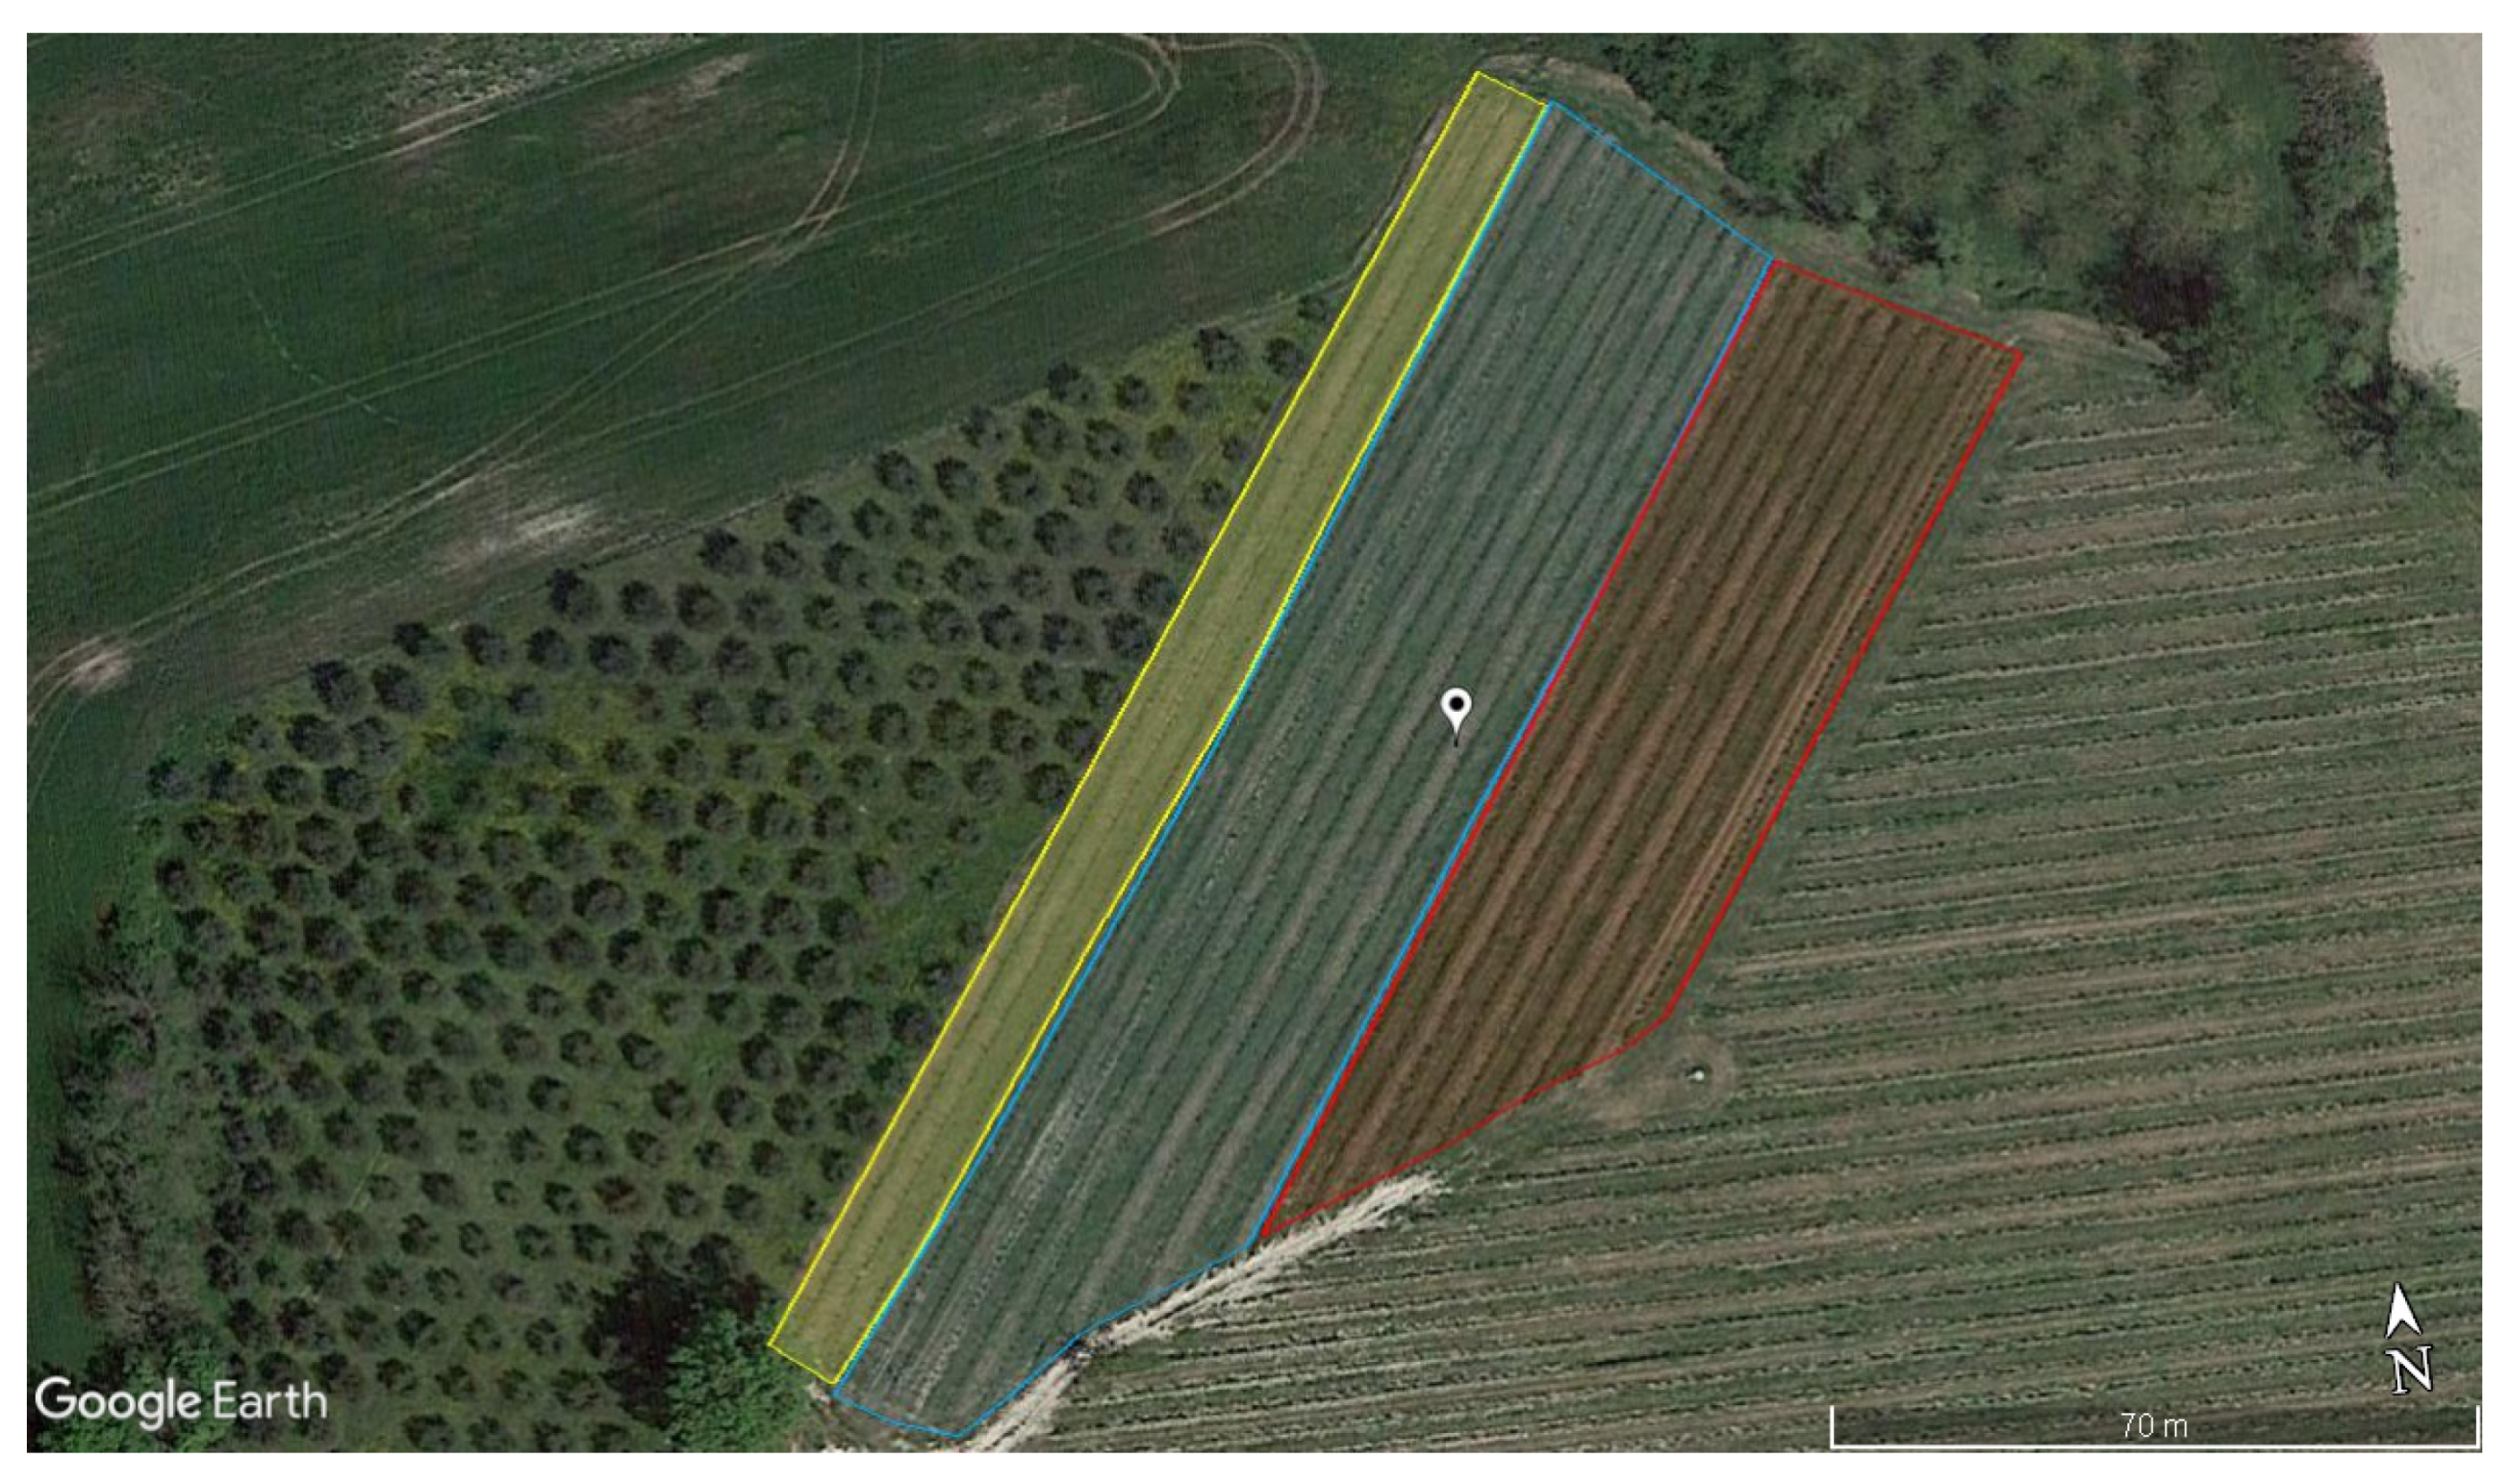
Field tests were conducted from May to October 2021 in Arcevia Municipality, Marche Region, Italy (43°31′2.00″ N 12°58′0.80″ E). The organic vineyard is Guyot-trained and established with cv. Verdicchio around 10–12 years old. The experimental vineyard area is composed of 22 rows, trained on hillside with southwest/northeast exposure. For the experimental design, the vineyard is divided into three plots (Figure 2): 3 rows for control (no treatments performed), 10 rows for LiDAR tests and 9 rows for standard tests.
The first step of the experiment is vineyard mapping; it reports the real situation in a worksheet for each plant or gap along the row. In particular, the worksheet highlights different situations reported in Table 1 and Figure 3.
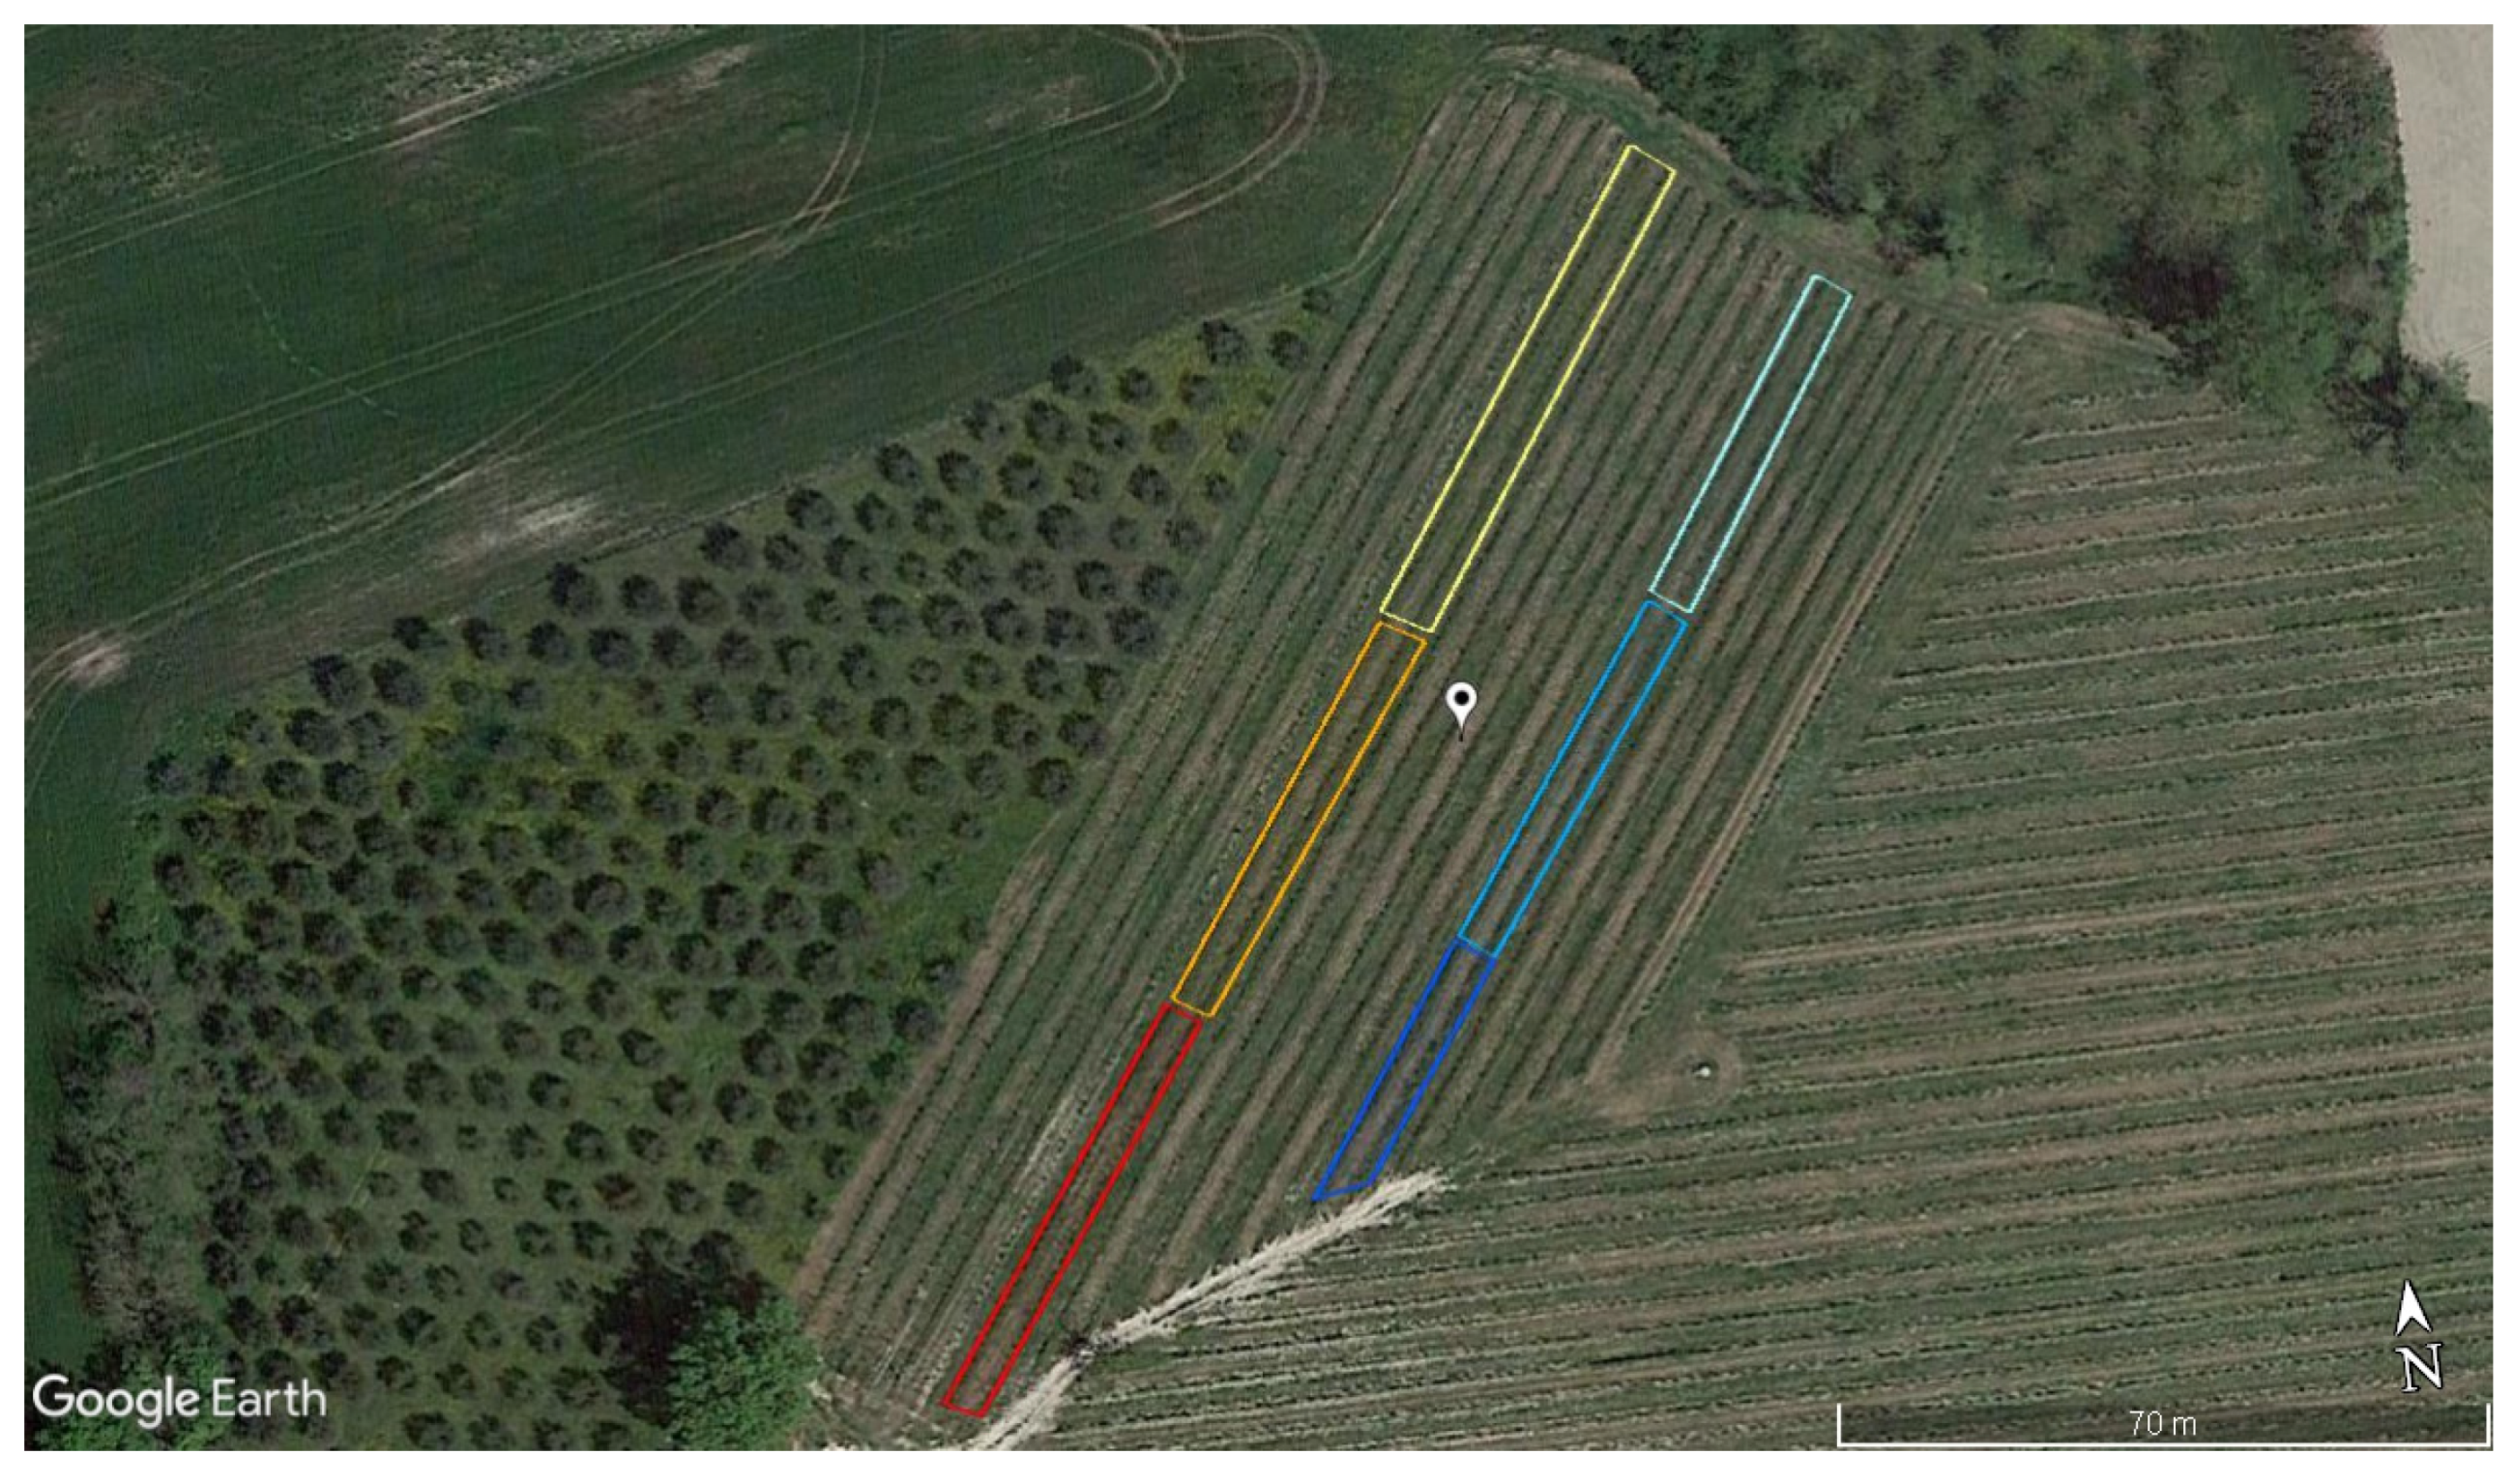
Mapping is crucial to choose two rows for LiDAR tests and two rows for standard tests with special features, such as gap distribution in the row and proper distance to avoid spray drift conditioning. Each couple of rows is divided into three blocks (Figure 4). The map is also used to identify plants and gaps of sample in which water-sensitive papers will be placed. The first guideline was to distinguish vine gaps and vine plants; in the former case, WSP were stapled on monofilament nylon screens; in the latter case, WSP were stapled directly on vine leaves. The second step relates WSP placement in the chosen samples: one paper in the lower position (thread position 1) and one paper in the upper position (thread position 2) with respect to horizontal containment wires in the vineyard. In the end, each WSP is encoded by an alphanumeric sequence previously defined, based on the type of treatment, block position, progressive number inside each block and single paper position on nylon wires.
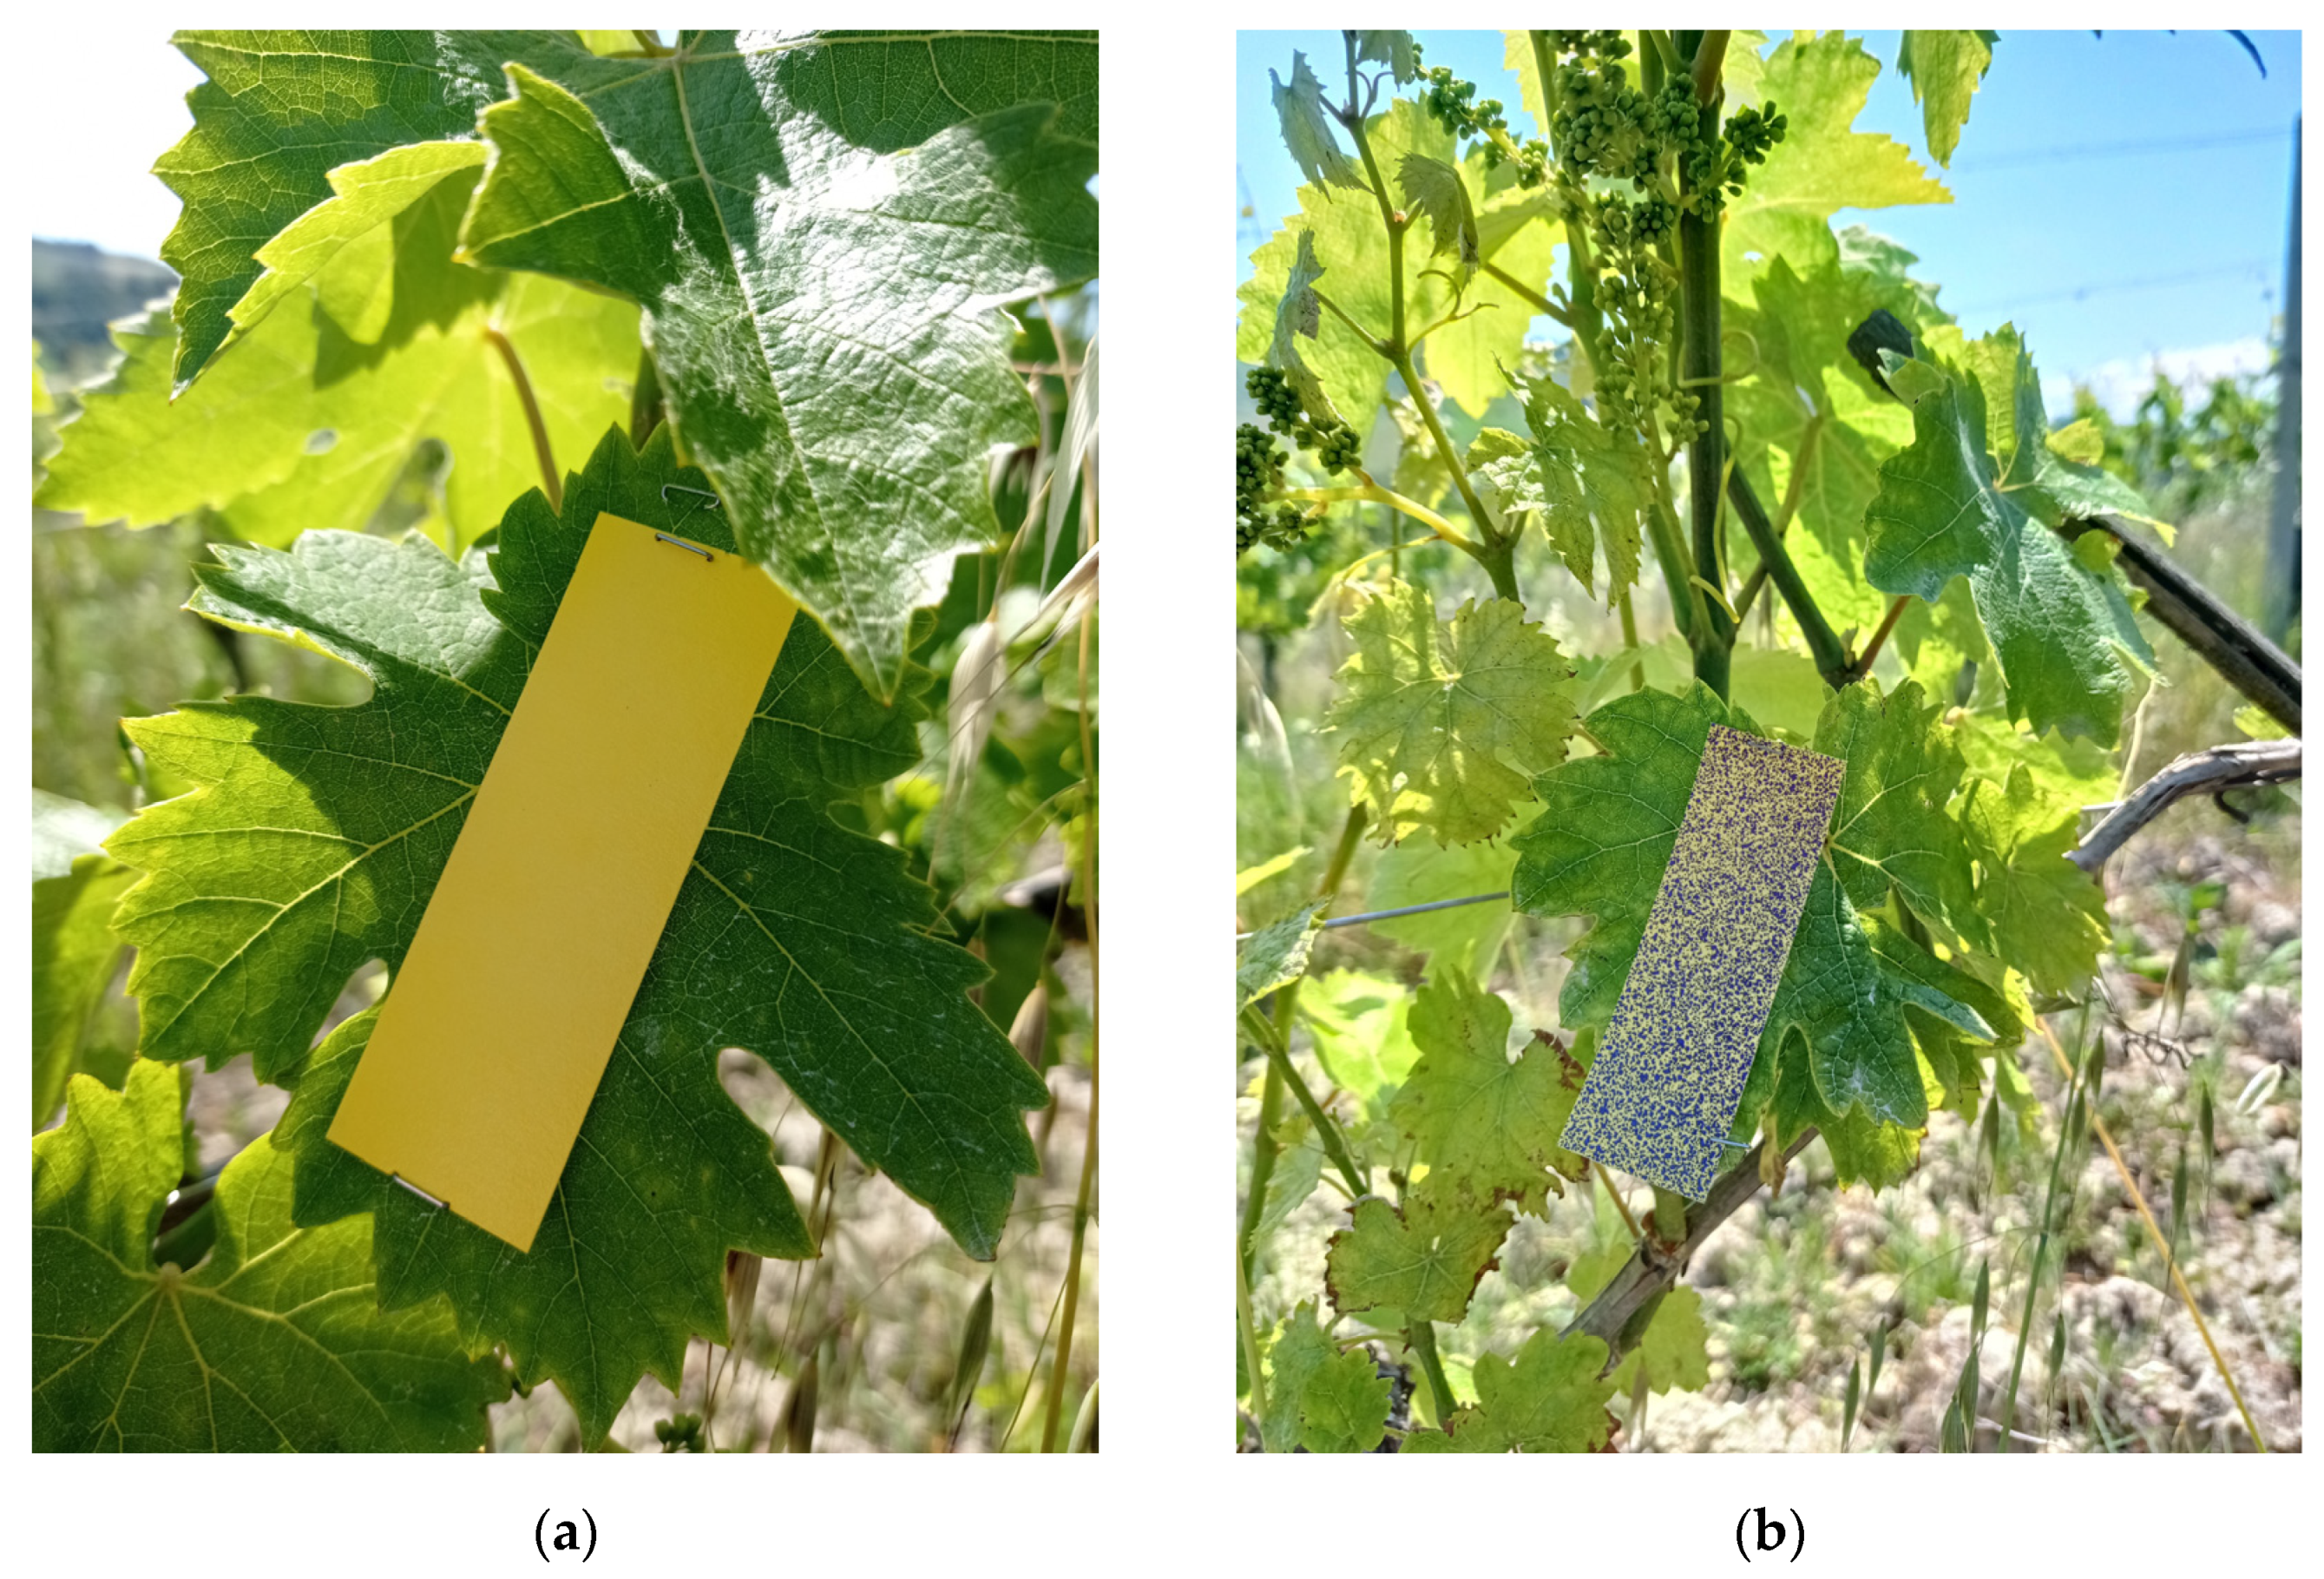
The field trial consists of a simulation of the distribution of agrochemicals and then verifies the quality of distribution through WSP (Figure 5a). These special papers are impressed by the contact with the solution, highlighting blue areas that contrast with the yellow background (Figure 5b).

2.3. Processing of Water-Sensitive Papers

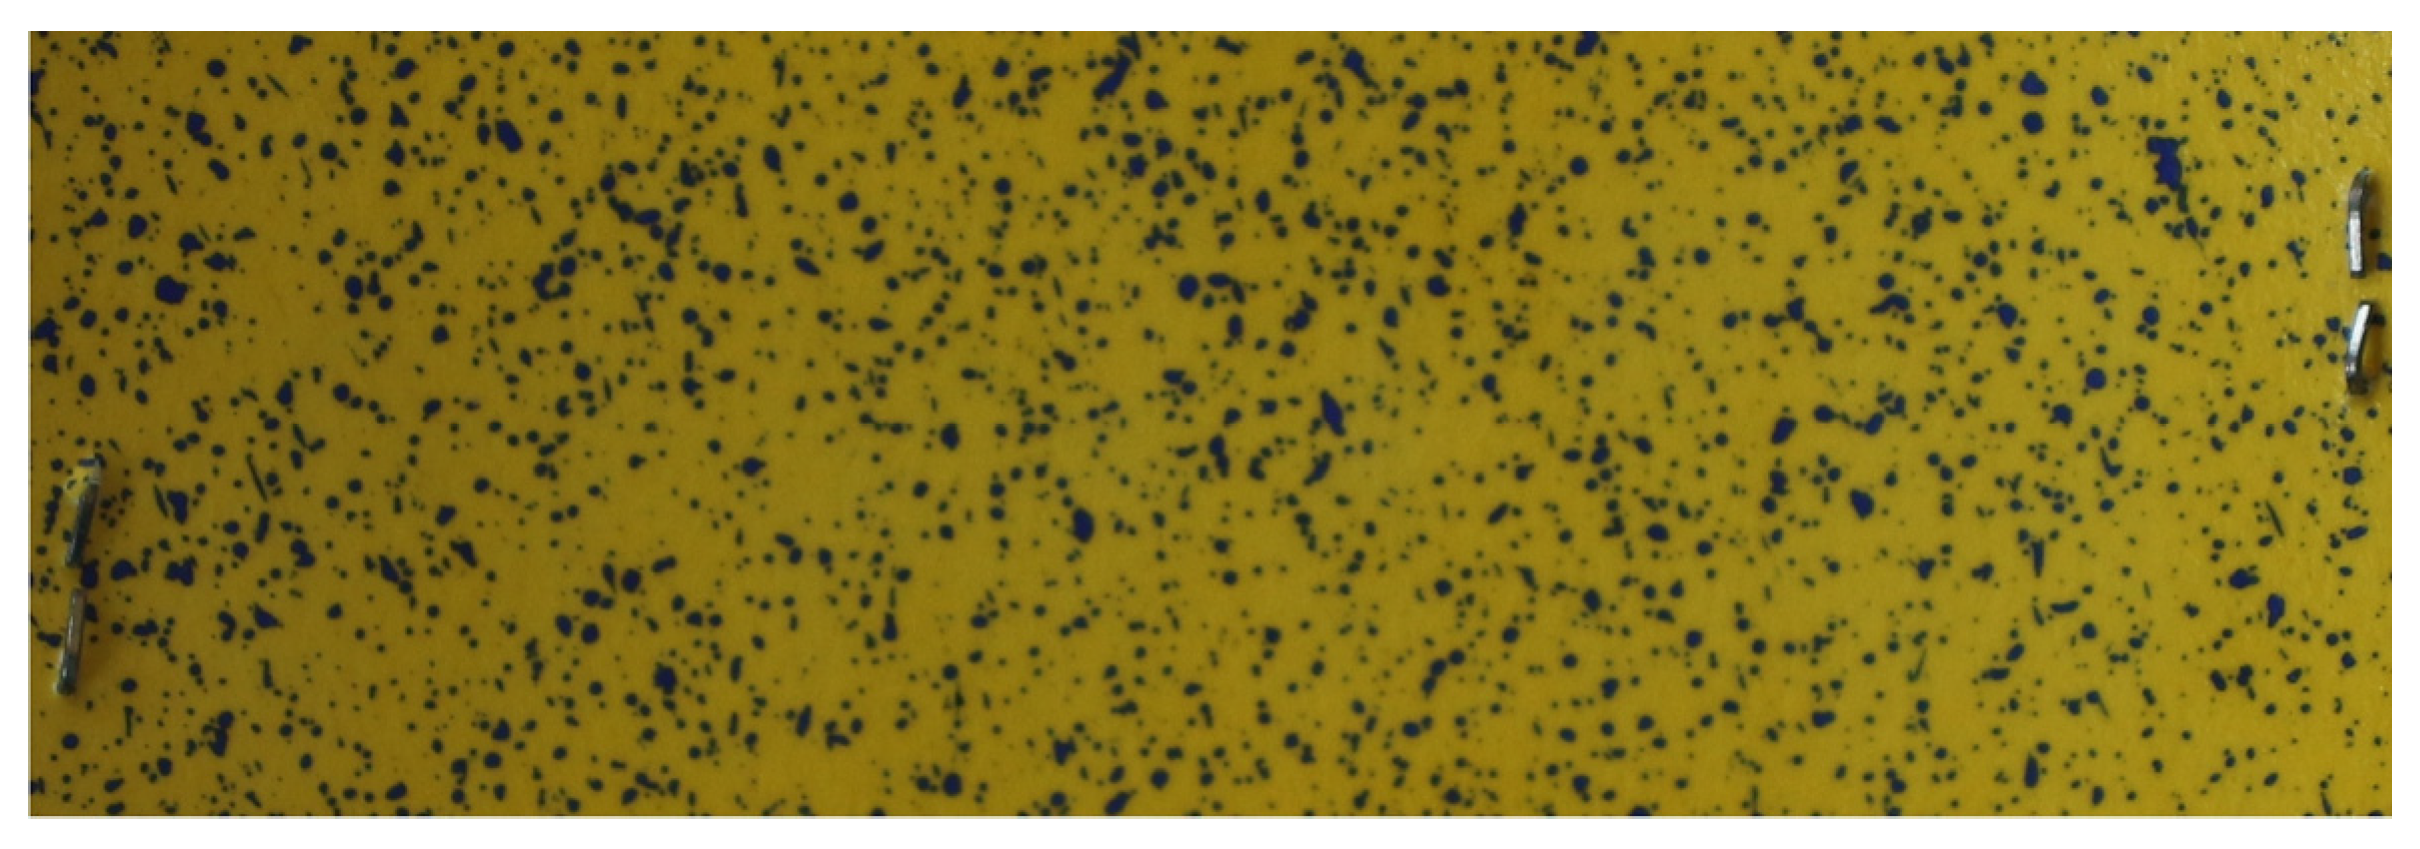
This work focuses on the field experiment of 29 October 2021: water-sensitive papers were placed only on vines gaps of both LiDAR and standard tests. The aim was to verify nozzle closing in the absence of vegetation. After field operation, WSP are post-processed in laboratory by setting a workflow. First of all, digital acquisition of special papers with a Canon EOS 700D camera is accomplished; the camera is located at a fixed workstation, with steady light and the camera lens directed to a neutral background. These features allow to create a standard procedure with minimal interference by external factors. Acquired images are in .jpg format, a raster with limited use, and so that is why they are processed with the software Inkscape to obtain .dxf format (vector image). After Inkscape elaboration, digital WSP are processed with QGis: an open-source software improved by a huge community of developers. Thanks to this software, the .dxf file is turned into a shapefile to translate polyline (linear information) into polygon (closed line); closed lines allow to calculate the number and area of impact. Each file is set to the same reference system, and a features table is exported to an Excel worksheet, proceeding with the statistical analysis. That is the workflow set up in previous work phases by using water-sensitive papers produced by Syngenta, hereafter referred to as the “reference card” (Figure 6); the developed protocol (hereafter referred to as the “digital protocol”) has been verified and validated by previous works [42].
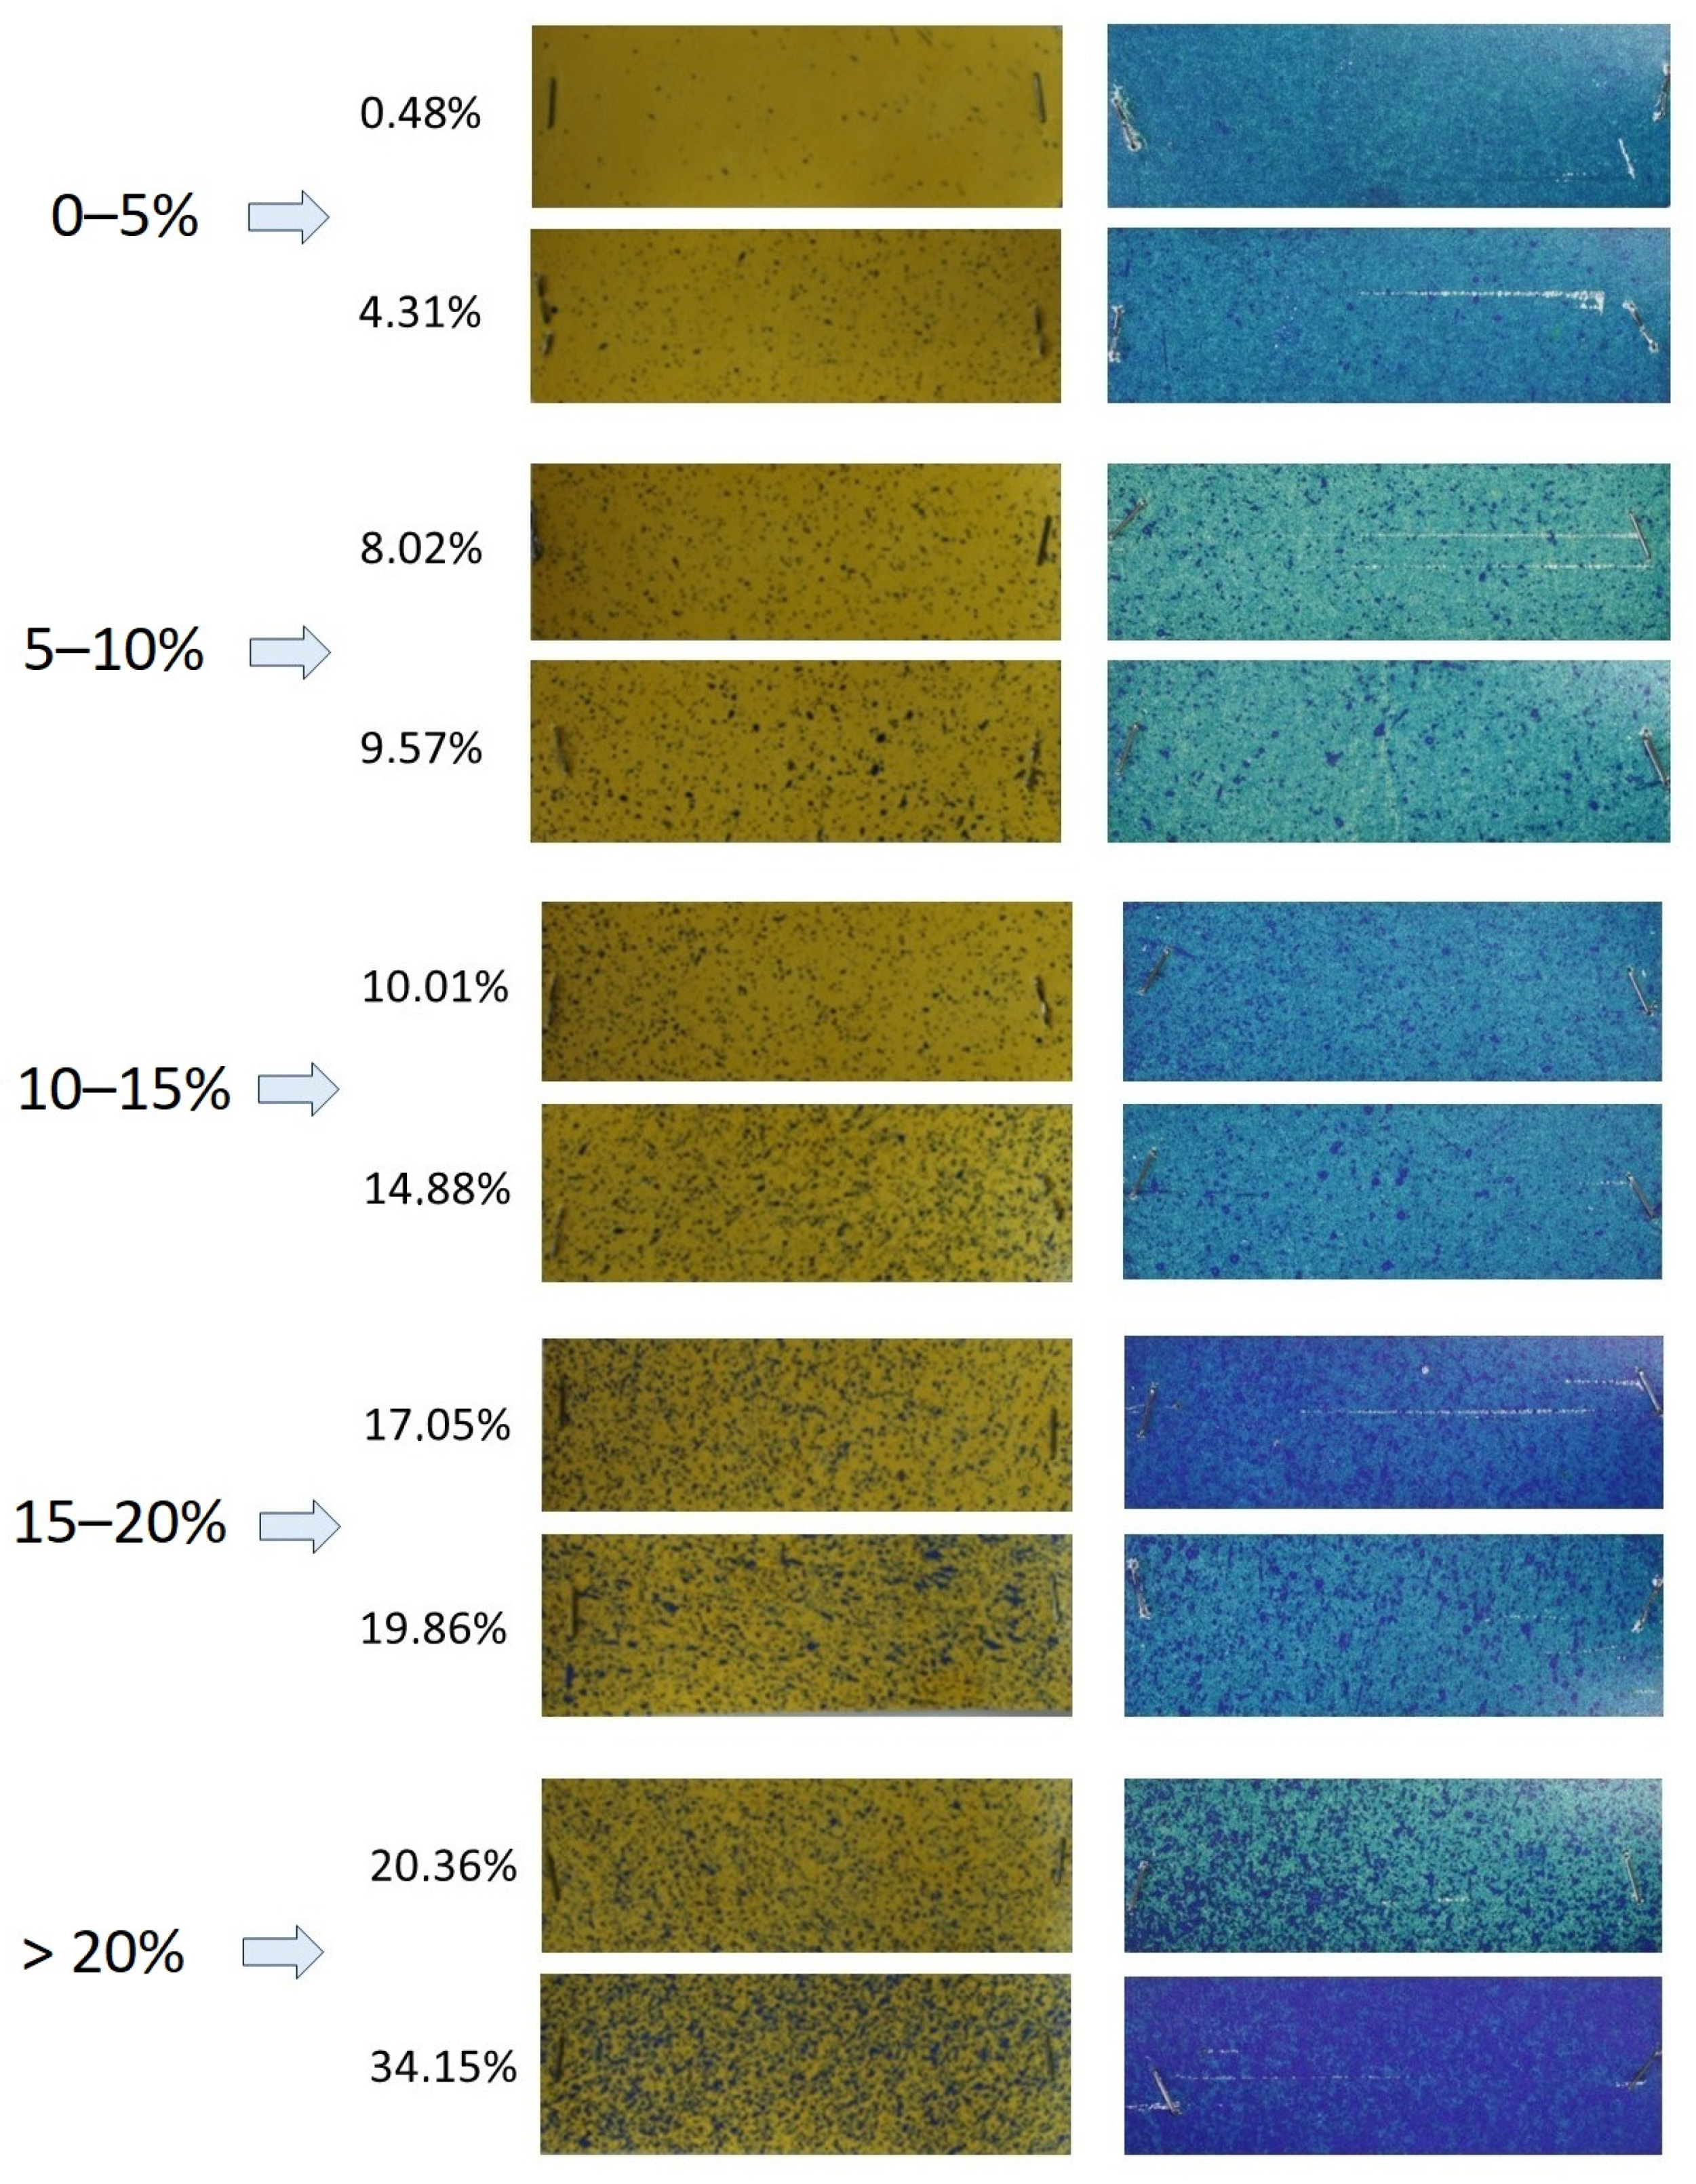
The comparing protocol can be also applied to analyze the WSP. In the study of Chen et al. [36], WSP samples were provided by the chemical company Syngenta, but there is no methodology suggestion on how WSP references are constructed. For these reasons, the comparing protocol has been improved: firstly, 5 coverage classes are identified (Table 2). Then, reference cards for comparison are chosen corresponding to the minimum and maximum values of each range of coverage classes (objectively measured by Tiffi Magi [42]).

2.4. Survey of Grapevine Pathogens

Similar to what was previously highlighted, the three plots (Figure 2) were also used to record fungal infections. In detail, the plots were: (i) untreated area, (ii) area treated using the LiDAR system and; (iii) area treated using a conventional sprayer. Furthermore, the plots were divided in three blocks with homogeneous environmental conditions, such as transverse direction in the rows. Fifteen plants per block were selected to carry out the disease assessments. The plants chosen were located proximally to a vine gap (according to Figure 4) to evaluate the effectiveness of treatments using the LiDAR system. Throughout the period that involved experimental trials, vineyards were constantly monitored to identify the appearance of first symptoms of GPM and GDM and to follow disease developments. Simultaneously, meteorological data provided by ASSAM (Agenzia Servizi Agroalimentare delle Marche) were collected. Once the first symptoms appeared, pathometric assessments were carried out in the field to quantify the presence of symptoms associated with P. viticola and E. necator infections. For the quantification of infections, the following parameters were estimated: disease incidence, severity [43] and weighted medium intensity or McKinney Index [44], which express the percentage of disease compared to the highest possible (all bunches completely infected). Two different empiric scales based on the infected surface were adopted: one for leaves (from class 0: healthy leaves to class 10: 91–100% infected surfaces) and one for bunches (from 0: healthy bunches to 7: infected surfaces > 75%). Overall, two assessments were carried out for GPM and GDM on the following dates: 23 July and 10 September of the 2021 season. Due to the unfavorable meteorological trend registered in Arcevia (AN) during the period considered, no symptoms of disease were observed on the leaves. Therefore, assessments were carried out only on bunches. Statistical analyses were performed using the statistical package software RStudio. One-way analysis of variance (ANOVA) was carried out to determine statistically significant (p ≤ 0.05) differences and averages are separated according to Fisher’s LSD test.

3. Results

3.1. Evaluation of LiDAR System

Specifically for the field experiment discussed in this paper, already from Inkscape processing, it has been clear the poor quality of new water-sensitive papers (supplied by a different producer of the reference card). In the figure below is reported a comparison of water-sensitive papers; the first one is the reference card used for previous works for the field trial of 20 July 2021 (Figure 7a), the second one is a WSP used for the field trial of 29 October 2021 (Figure 7b) and the last one is an example of WSP (similar to the reference card) used for the field trial of 21 October 2022 (Figure 7c) in worse damp conditions than the field test of 29 October 2021.
Water-sensitive papers are classified through visual comparisons with the reference constructed on the basis set out; each paper is assigned to the correct class. An example of classification based on objective comparison is represented in Figure 8, in which the reference cards correspond to the minimum and maximum values of each range.
Data analysis has been developed following two lines of observation: water-sensitive papers located in vines gaps for the LiDAR test (Table 3) and water-sensitive papers located in vine gaps for the standard test (Table 4). Either way, there are three reference blocks, and for each one is a known progressive number (from 1 to 15), support thread position (1 or 2) and coverage classes (from 1 to 5).
Then, the frequency data about coverage classes was extrapolated (Table 5).
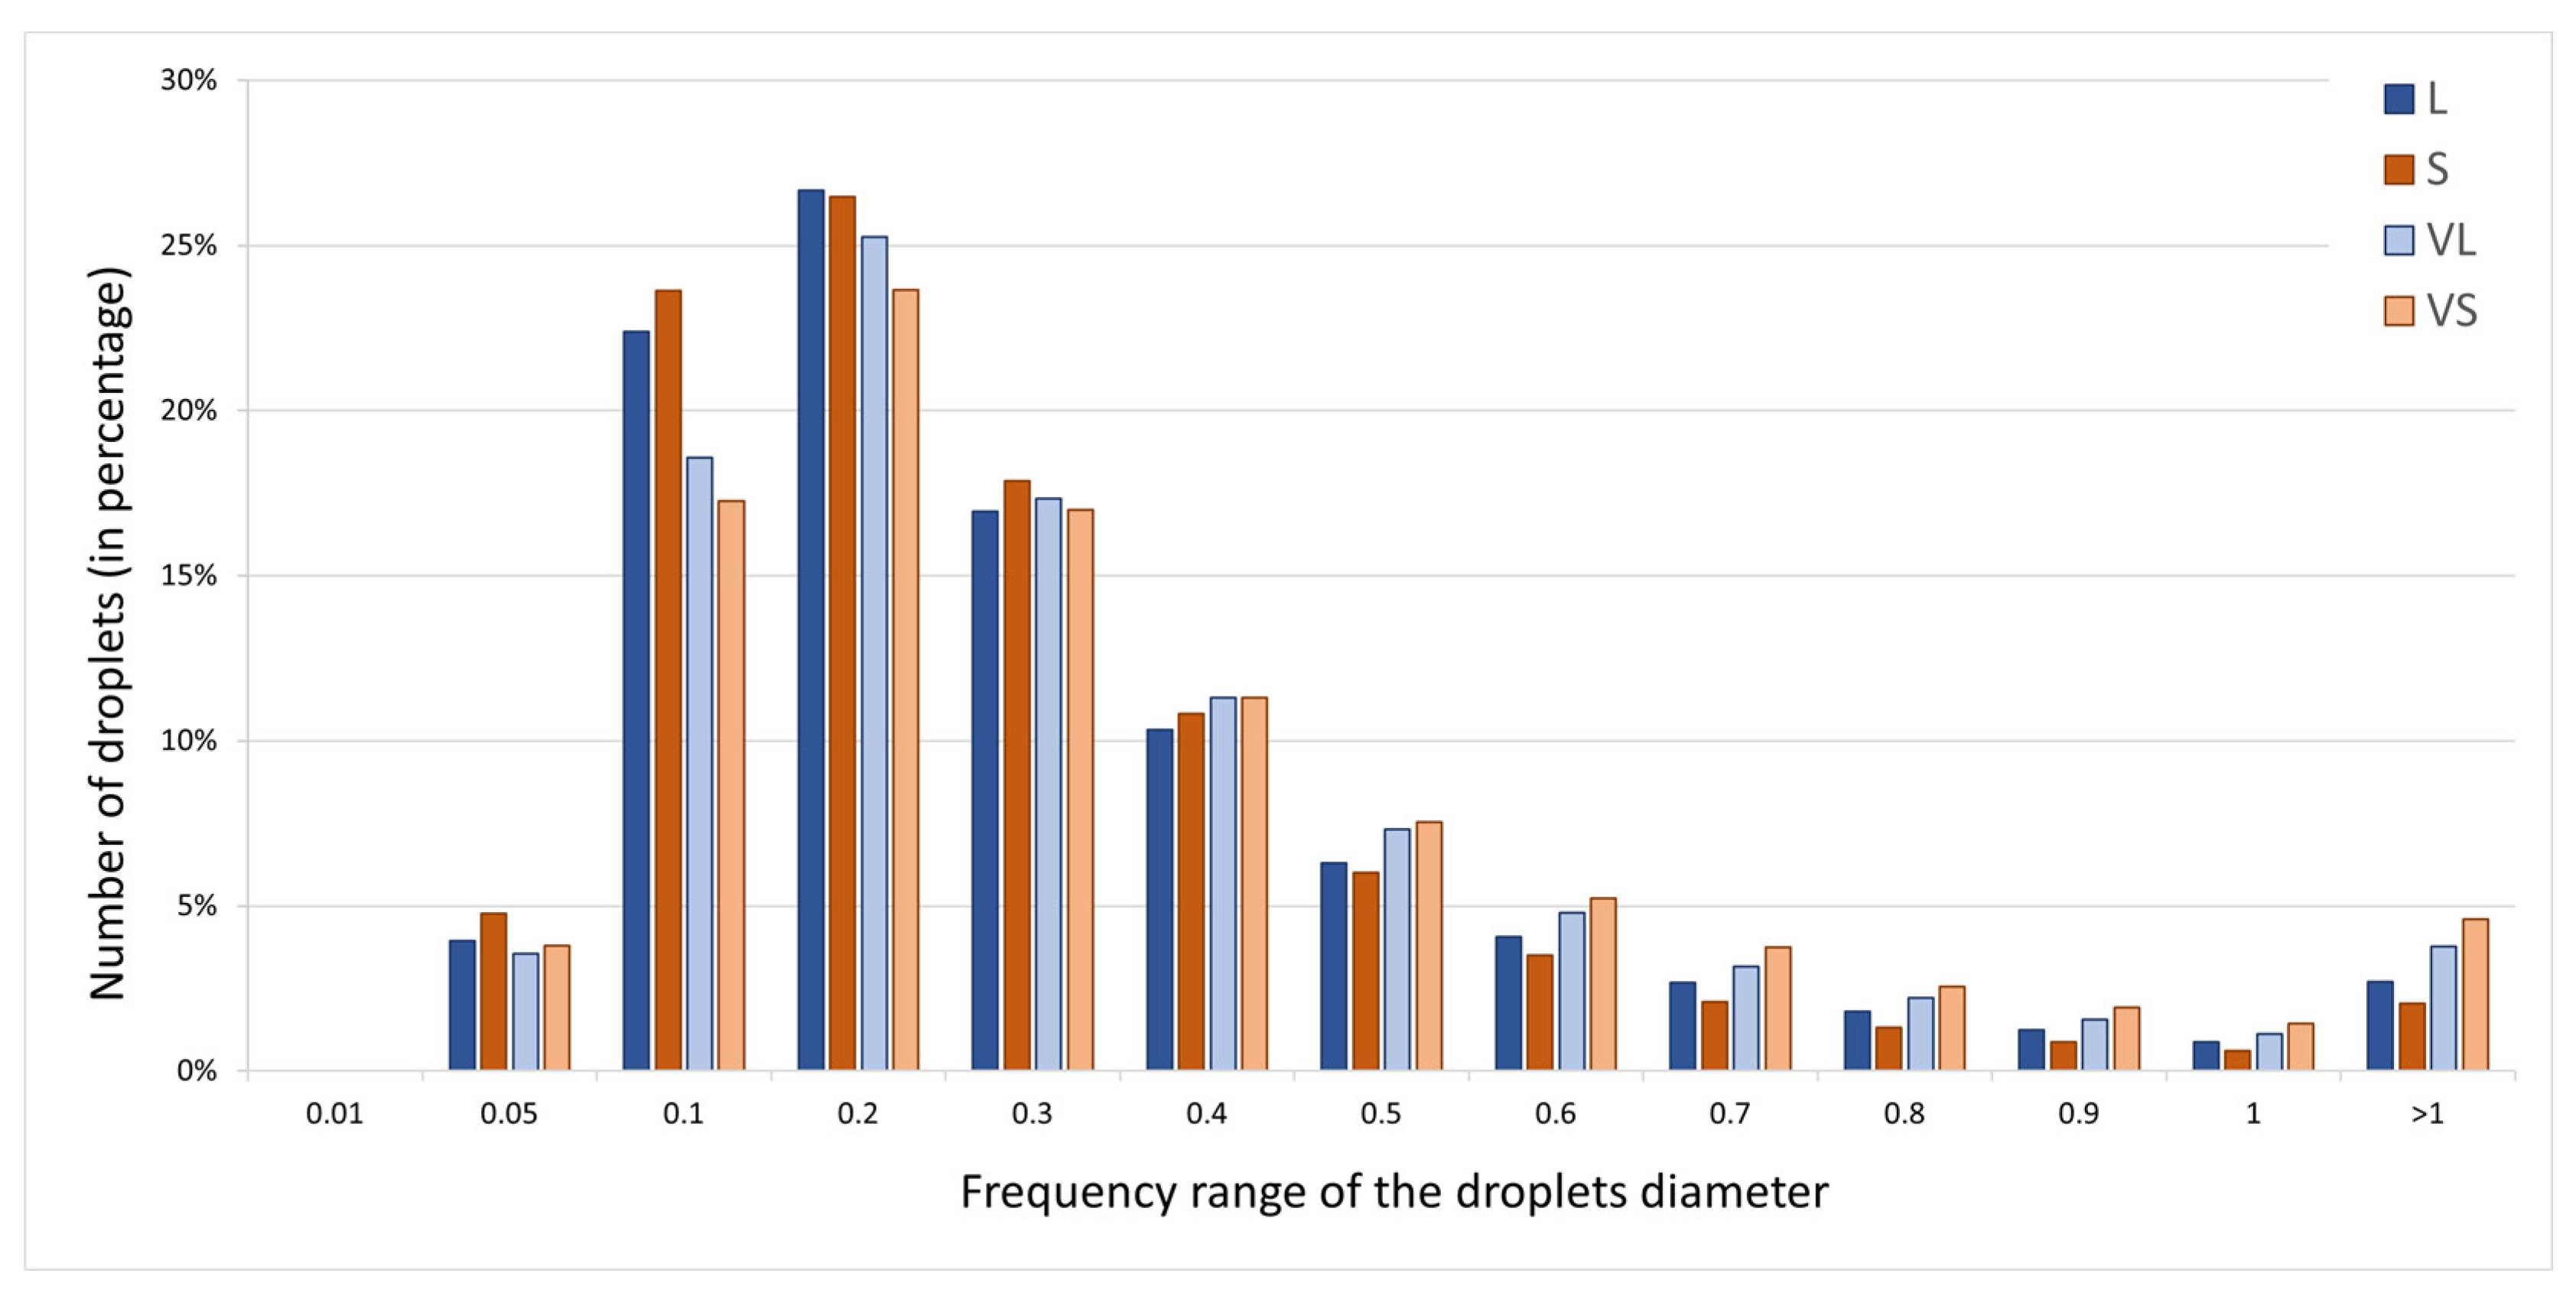
In order to analyze droplet size spectra, the following results have been elaborated from data obtained by Tiffi Magi [42]. First of all, the surface of each impact on WSP was calculated (expressed in mm2) through QGis. Then, the value was converted to cm2 relative to the real mask area. At this point, the impacts are assumed to be circular in order to obtain the diameter value (converted back to mm). Subsequently, the frequency of the number of droplets per diameter range has been calculated with Microsoft Excel function (Table 6).

3.2. Environmental Conditions

In the Marche Region, excluding January, all months from February to July were characterized by lower-than-normal rainfall, causing signs of drought throughout the region. Spring 2021 was the second driest spring for the Marche Region since 1961 (www.assam.marche.it, accessed on 20 January 2023). Consequently, the meteorological conditions were not favorable to the development of fungal diseases, and fewer treatments were carried out compared to previous years. However, symptoms of GPM and GDM appeared on the bunches in mid/late July. On the other hand, around the end of the summer, some significant precipitations favored the development of GDM late infections. Data from the ASSAM weather station of Arcevia (AN) are reported in Figure 9.

3.3. Evaluation of Grapevine Downy and Powdery Mildews

Fungal diseases pressure was very low in this area during 2021 due to the weather conditions. Symptoms of GPM were detected on bunches around the end of July, and the first assessment was conducted on 23 July 2021, while no symptoms were observed on leaves. No significant differences emerged after this assessment among experimental plots, in terms of reducing diseases incidence and the McKinney Index. On the other hand, GPM symptoms severity was significantly reduced compared to the untreated control treated with both innovative (by 27%) and conventional (by 45%) spraying machines.
Before the harvest, on 10 September 2021, another assessment was carried out to estimate late infections of GDM. Only treatments performed with LiDAR were able to limit the incidence of P. viticola infections, reducing this parameter compared to both the untreated and treated controls by 59% and 66%, respectively. Furthermore, LiDAR also reduced with statistical significance the McKinney Index if compared to the standard sprayer, while no significant differences among plots emerged in terms of GDM symptoms severity. The results are summarized in Table 7.

4. Discussion

The poor quality of water-sensitive papers is crucial to discuss post-processing phase. In Figure 7 it is prominent the different legibility of reference cards and different WSP used. The former has a good contrast with the background, and it is possible to determine treatment distribution features through digital protocol; the latter has not enough contrast and it is possible to discriminate impact areas thanks only to human eyes capabilities. This issue affects data analysis because Inkscape was unable to properly generate closed lines or semi-closed lines due to the lack of difference between background and treatment impact. Consequently, QGis was unable to recognize closed lines and translate them into polygons. For these reasons, the comparing protocol has been adopted.
The comparing protocol has been improved starting from Chen et al. protocol, based on provided WSP samples by the chemical company. As has been said above, the cited paper did not provide any methodology on how WSP references were constructed; consequently, the present work has developed an objective and replicable reference method. The updated comparing protocol proved to be positive in use.
The first purpose of the work was to evaluate the effectiveness of laser scanner system from mechanical point of view. Results show increased frequency in 10–15% coverage range for LiDAR tests, coherent with the sensors principles, and increased frequency in over 20% coverage range for standard tests, because the distribution of agrochemicals is steady throughout the row. The conclusion is that smart sprayer is able to distinguish between vines plants and vines gaps along the row.
The frequency distribution of the coverage classes has been analyzed through a plot (Figure 10) and it is clear that there are two different trends:
  • The frequency of LiDAR vines gaps has a bell-shaped distribution, with the maximum frequency around 10–15%, and the variability observed with smart sprayer maybe depends on the variability of gaps size (small gaps are harder to spot than very large gaps, so it means that more agrochemicals is distributed on small gaps).
  • The frequency of Standard vines gaps reflects an exponential trend, considering that the last coverage classes is “over 20%”.
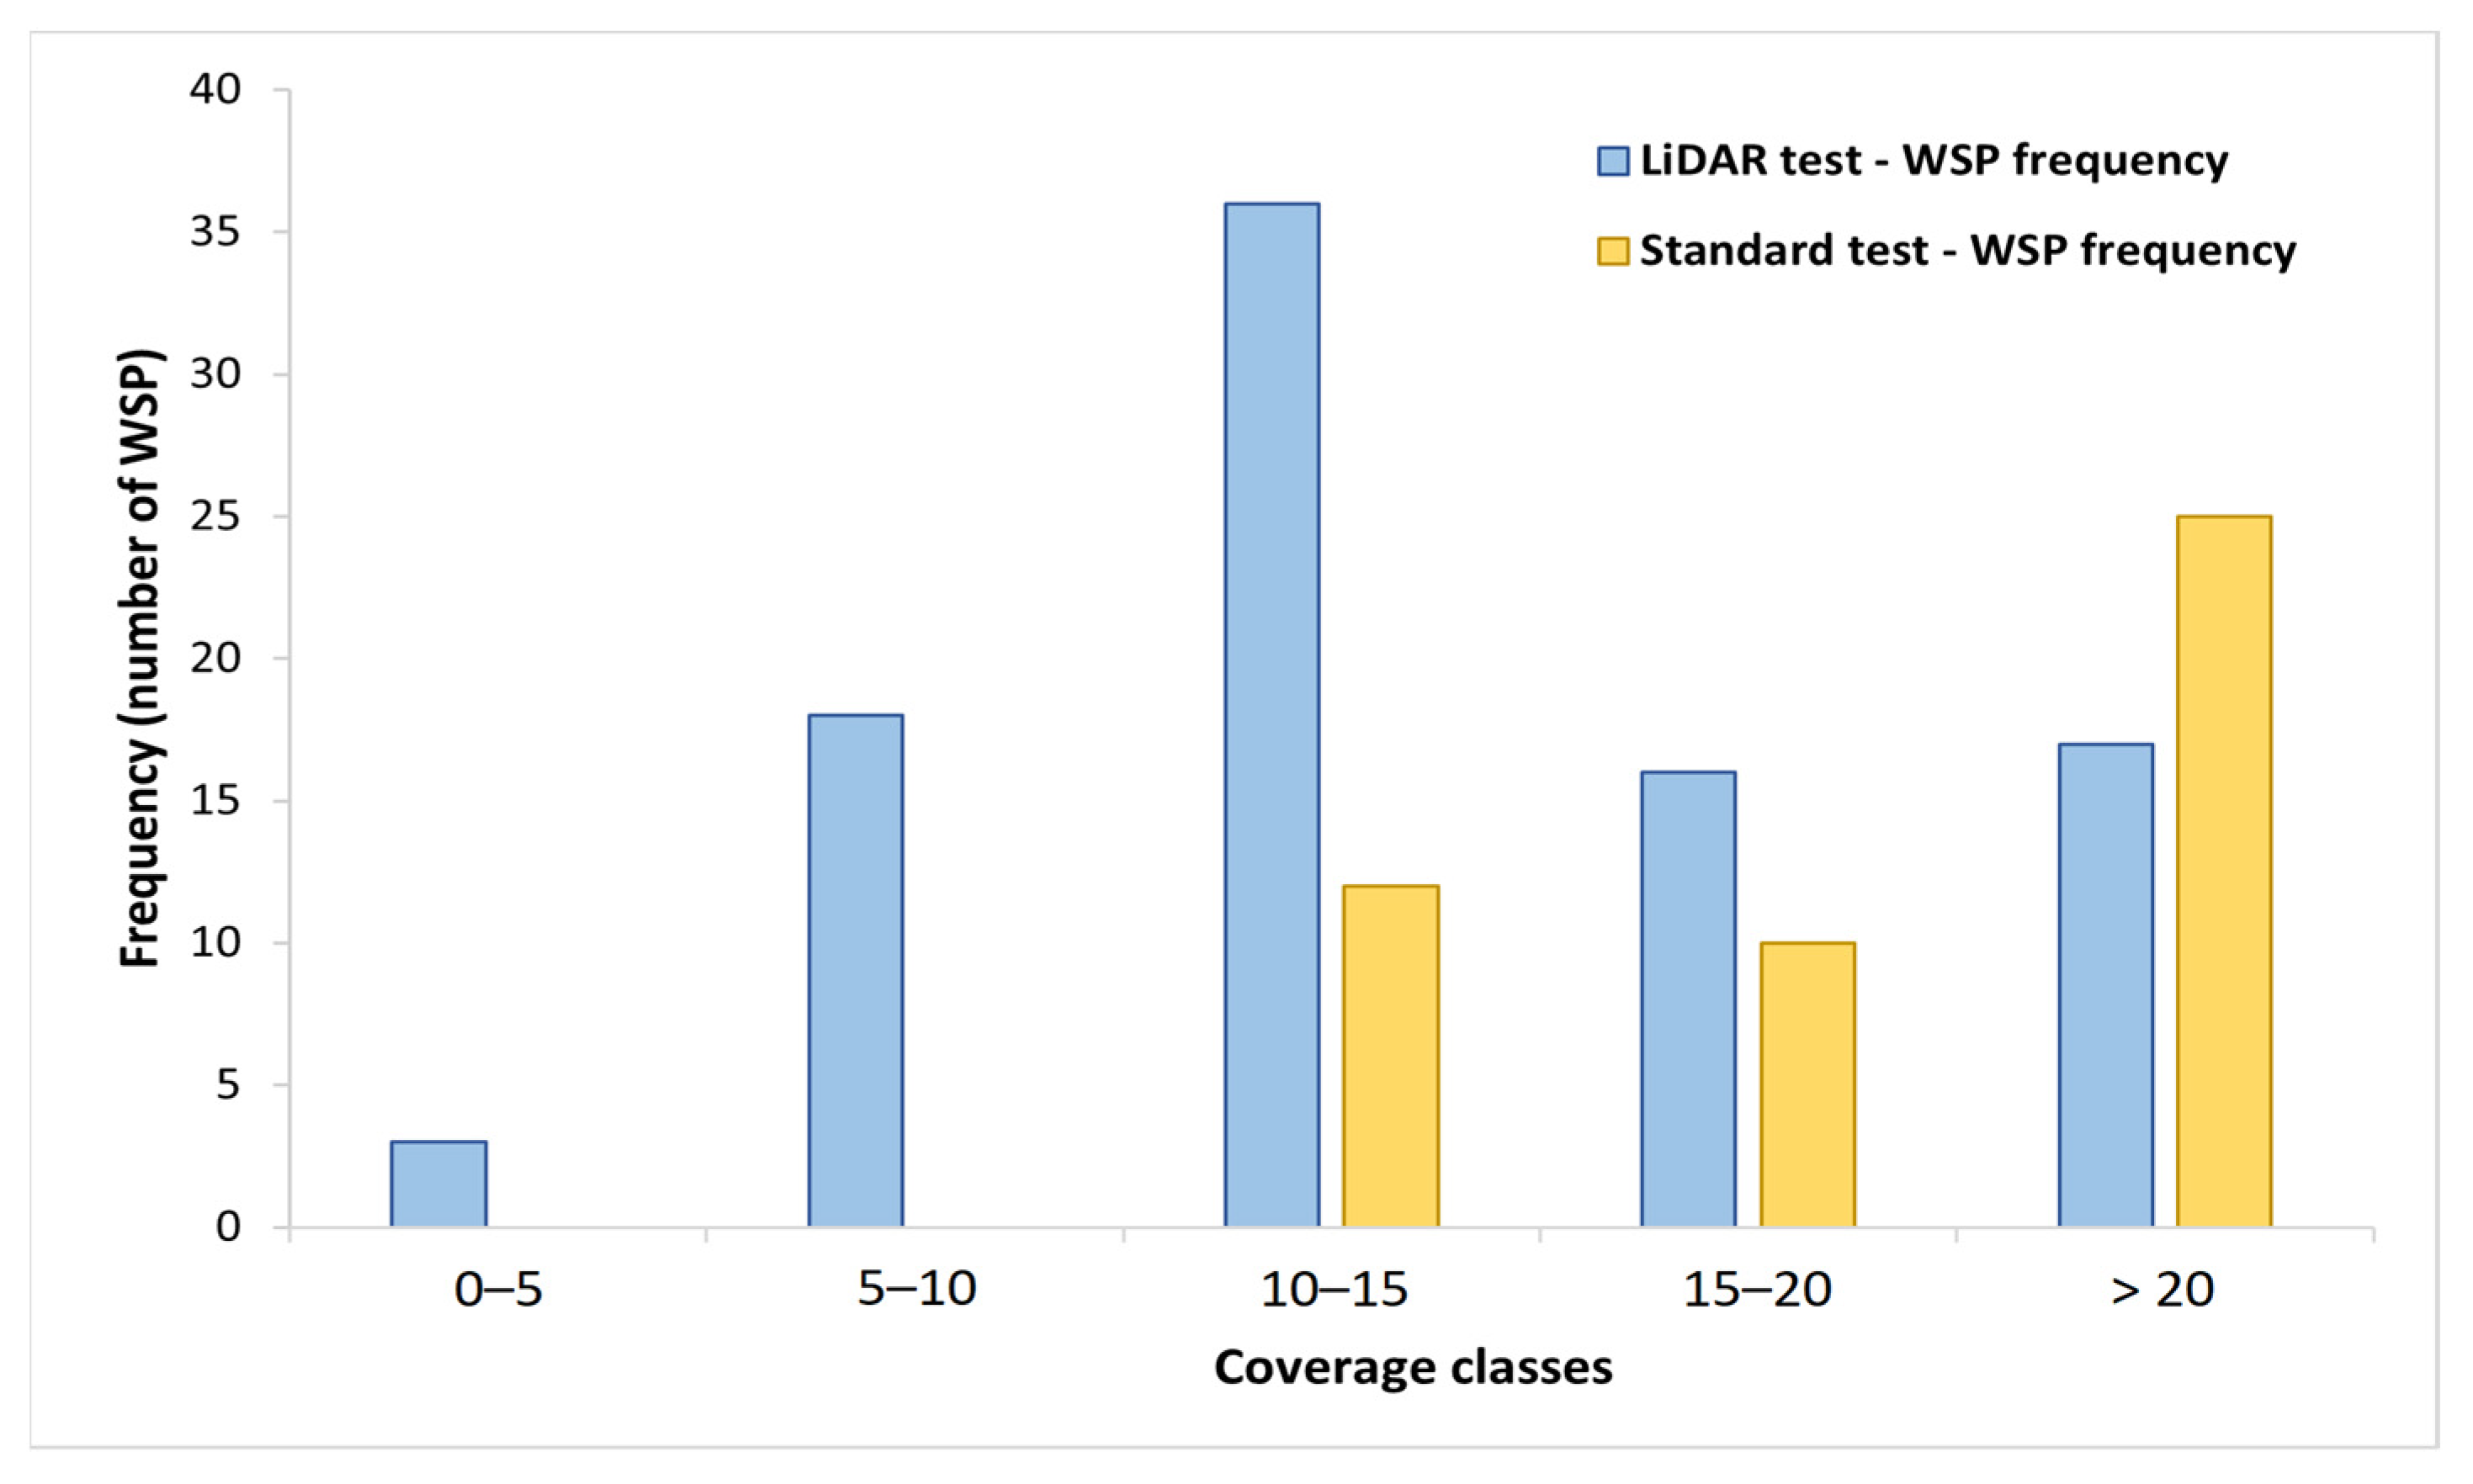
Figure 10. Frequency plot describing WSP frequency both in the LiDAR test (in blue) and standard test (in yellow) for different coverage classes (expressed as percentage range).
Applsci 13 02222 g010
The last point is important to introduce another discussion about the coverage area overlap. The new protocol established 5 coverage classes, but the fifth class does not refer to a specific range, it includes coverage area over 20% and no further classes can be distinguished due to overlap. It means that the coverage area could be higher than 20% in standard conditions.
From the results obtained on the droplet size analysis, the frequency function about the distribution of the diameter range has been analyzed through a plot (Figure 11). The highest concentration of the number of droplets is in the diameter range of 0.1–0.3 mm. In vineyard treatments, the optimal diameter of droplets should be about 100 μm. Therefore, the distribution of the number of droplets in the figure below can be considered representative of an optimal distribution on field conditions.
Nowadays, vines protection from GPM and GDM is still based on massive preventive applications of sulfur and copper but evidence on the dangers of these compounds emerged, making their use no longer in line with the principles of sustainable agriculture. Recently public attention has been focused especially on the risks associated to copper [45], since it is classified as heavy metal and its repeated use results in negative consequences for environment, human health, wine quality and soil fertility [46,47,48,49,50]. For these reasons, European Union inserted copper into the list of active ingredients candidates for substitution and limited the quantity allowed in agriculture up to an average of 4 kg/ha per year [51]. Technologies that lead to exclusive distribution to targets represent one of the strategies to reduce the amount of PPPs sprayed. Treatments performed with LiDAR system showed in some case a reduction of incidence, severity, and McKinney Index of GPM and GDM comparable to those obtained with conventional sprayer, in plants located before or after vine gaps. Results showed that it is possible to reach satisfactory levels of protection by distributing a lower quantity of agrochemicals per unit of surface area. On the other side, doses per hectare below the minimum of label are not allowed and thus legislation need to be adapted to technical innovations. Farm to Fork objectives can only be achieved by integrating all the available tools to reduce the amount of dangerous pesticides, from technologies for the optimization of distribution to the use of alternative compounds with proven efficacy, such as some basic substances [52,53]. This category of compounds is not considered in the Harmonised Risk Indicator 1 [54] calculation.

5. Conclusions

This work has led to meaningful results: the innovative sprayer is able to reduce the distribution of agrochemicals, if compared with conventional sprayer, through the on/off control of nozzles based on presence/absence of vegetation along the row. Field trials in vineyard were successful; moreover, this smart sprayer can be applied in orchards trained with espalier systems thanks to suitable calibration and regulation. LiDAR sensor represents a remarkable opportunity for agriculture because of the balance between costs and effectiveness. The purchase cost is relatively low, and for this reason, this innovation can be introduced in small- and medium-sized enterprises. Additionally, the smart sprayer is perfectly aligned with European Union tasks due to reduction of the distribution of agrochemicals, lower environmental impact, better economic management and rationalization of water resources.
Between the final considerations, one focuses on water-sensitive papers quality. It is important to invest on high quality WSP to ensure data analysis with software; despite this, the new protocol based on comparison provides good results and confirm the effectiveness of smart sprayer. For future research, it is suggested to consider water-sensitive papers as a priority for field tests. Another main point concerns the digital protocol: taking for granted the importance of WSP quality, research should develop batch systems to streamline the post-elaboration and make it more user-friendly. To conclude, the smart sprayer based on LiDAR technology reduce the distribution of agrochemicals in vineyard with great results and ensures a good control of the two major grapevine disease. To support this last statement, further tests can be set to define the volumes of mixture distributed in the field. It can be useful to link the actual mixture savings and coverage percentage. In order to broaden the research, LiDAR system can be adapted to different sprayers to verify its performance in various conditions.

Author Contributions

Conceptualization, E.F.P. and G.R.; methodology, L.C. and A.I.; software, L.C., S.P. and A.I.; validation, L.C., S.P. and A.I.; formal analysis, L.C., S.P. and M.M.; investigation, L.C., S.P., M.M. and A.I.; resources, E.F.P. and G.R.; data curation, L.C., S.P., M.M. and A.I.; writing-original draft preparation, A.I., S.P., M.M. and E.F.P.; writing-review and editing, L.C.; visualization, L.C. and A.I.; supervision, L.C., E.F.P. and G.R.; project administration, E.F.P. and G.R.; funding acquisition, E.F.P. All authors have read and agreed to the published version of the manuscript.

Funding

The activities inside the research were funded by PSR Marche 2014/2020, Misura 16.1—Sostegno per la costituzione e la gestione dei gruppi operativi del PEI in materia di produttività e sostenibilità dell’agricoltura “Fase di gestione del G.O. e realizzazione del Piano di Attività”, grant number 2917 (“SMART SPRAYER” project).

Institutional Review Board Statement

Not applicable.

Informed Consent Statement

Not applicable.

Data Availability Statement

The data presented in this study are available on request from the corresponding author.

Acknowledgments

Thanks are expressed to Fabrizio Favi and Francesco Zingaretti of Iselqui Technology srl for having made available the prototype LiDAR-based. The authors also thanks Alessio Tiffi Magi for the support to the development of the digital protocol.

Conflicts of Interest

The authors declare no conflict of interest. The funders had no role in the design of the study; in the collection, analyses, or interpretation of data; in the writing of the manuscript; or in the decision to publish the results.

References

  1. Roy, R.N.; Food and Agriculture Organization of the United Nations (Eds.) Plant Nutrition for Food Security: A Guide for Integrated Nutrient Management; FAO Fertilizer and Plant Nutrition Bulletin; Food and Agriculture Organization of the United Nations: Rome, Italy, 2006; ISBN 978-92-5-105490-1. [Google Scholar]
  2. Bongiovanni, R.; Lowenberg-Deboer, J. Precision Agriculture and Sustainability. Precis. Agric. 2004, 5, 359–387. [Google Scholar] [CrossRef]
  3. Calvitti, M.; Colonna, N.; Iannetta, M. La relazione cambiamenti climatici e sistema agricolo tra adattamento e mitigazione. Energ. Ambiente e Innov. 2016, 1, 74–81. [Google Scholar] [CrossRef]
  4. Pierce, F.J.; Nowak, P. Aspects of Precision Agriculture. Adv. Agron. 1999, 67, 1–85. [Google Scholar]
  5. Chamara, N.; Islam, M.D.; Bai, G.F.; Shi, Y.; Ge, Y. Ag-IoT for Crop and Environment Monitoring: Past, Present, and Future. Agric. Syst. 2022, 203, 103497. [Google Scholar] [CrossRef]
  6. Kazlauskas, M.; Bručienė, I.; Jasinskas, A.; Šarauskis, E. Comparative Analysis of Energy and GHG Emissions Using Fixed and Variable Fertilization Rates. Agronomy 2021, 11, 138. [Google Scholar] [CrossRef]
  7. Núñez-Cárdenas, P.; Diezma, B.; San Miguel, G.; Valero, C.; Correa, E.C. Environmental LCA of Precision Agriculture for Stone Fruit Production. Agronomy 2022, 12, 1545. [Google Scholar] [CrossRef]
  8. Wang, D.; Prato, T.; Qiu, Z.; Kitchen, N.R.; Sudduth, K.A. Economic and Environmental Evaluation of Variable Rate Nitrogen and Lime Application for Claypan Soil Fields. Precis. Agric. 2003, 4, 35–52. [Google Scholar] [CrossRef]
  9. Balafoutis, A.; Beck, B.; Fountas, S.; Vangeyte, J.; Wal, T.; Soto, I.; Gómez-Barbero, M.; Barnes, A.; Eory, V. Precision Agriculture Technologies Positively Contributing to GHG Emissions Mitigation, Farm Productivity and Economics. Sustainability 2017, 9, 1339. [Google Scholar] [CrossRef]
  10. Gadoury, D.M.; Cadle-Davidson, L.; Wilcox, W.F.; Dry, I.B.; Seem, R.C.; Milgroom, M.G. Grapevine Powdery Mildew (Erysiphe Necator): A Fascinating System for the Study of the Biology, Ecology and Epidemiology of an Obligate Biotroph: Grapevine Powdery Mildew. Mol. Plant Pathol. 2012, 13, 1–16. [Google Scholar] [CrossRef]
  11. Gessler, C.; Pertot, I.; Perazzolli, M. Plasmopara viticola: A Review of Knowledge on Downy Mildew of Grapevine and Effective Disease Management. Phytopathol. Mediterr. 2011, 50, 3–44. [Google Scholar]
  12. European Commission. A Farm to Fork Strategy for a Fair, Healthy and Environmentally-Friendly Food System; European Commission: Brussels, Belgium, 2020. [Google Scholar]
  13. Sharda, A.; Fulton, J.P.; McDonald, T.P.; Brodbeck, C.J. Real-Time Nozzle Flow Uniformity When Using Automatic Section Control on Agricultural Sprayers. Comput. Electron. Agric. 2011, 79, 169–179. [Google Scholar] [CrossRef]
  14. Alam, M.; Alam, M.S.; Roman, M.; Tufail, M.; Khan, M.U.; Khan, M.T. Real-Time Machine-Learning Based Crop/Weed Detection and Classification for Variable-Rate Spraying in Precision Agriculture. In Proceedings of the 2020 7th International Conference on Electrical and Electronics Engineering (ICEEE), Antalya, Turkey, 14–16 April 2020; IEEE: Antalya, Turkey, 2020; pp. 273–280. [Google Scholar]
  15. Le Cointe, R.; Simon, T.E.; Delarue, P.; Hervé, M.; Leclerc, M.; Poggi, S. Reducing the Use of Pesticides with Site-Specific Application: The Chemical Control of Rhizoctonia solani as a Case of Study for the Management of Soil-Borne Diseases. PLoS ONE 2016, 11, e0163221. [Google Scholar] [CrossRef] [PubMed] [Green Version]
  16. Zanin, A.R.A.; Neves, D.C.; Teodoro, L.P.R.; da Silva Júnior, C.A.; da Silva, S.P.; Teodoro, P.E.; Baio, F.H.R. Reduction of Pesticide Application via Real-Time Precision Spraying. Sci. Rep. 2022, 12, 5638. [Google Scholar] [CrossRef]
  17. Abbas, I.; Liu, J.; Faheem, M.; Noor, R.S.; Shaikh, S.A.; Solangi, K.A.; Raza, S.M. Different Sensor Based Intelligent Spraying Systems in Agriculture. Sens. Actuators Phys. 2020, 316, 112265. [Google Scholar] [CrossRef]
  18. Mehendale, N.; Neoge, S. Review on Lidar Technology. SSRN Electron. J. 2020, 9. [Google Scholar] [CrossRef]
  19. Xia, S.; Chen, D.; Wang, R.; Li, J.; Zhang, X. Geometric Primitives in LiDAR Point Clouds: A Review. IEEE J. Sel. Top. Appl. Earth Obs. Remote Sens. 2020, 13, 685–707. [Google Scholar] [CrossRef]
  20. Baek, N.; Shin, W.S.; Kim, K.J. Geometric Primitive Extraction from LiDAR-Scanned Point Clouds. Clust. Comput. 2017, 20, 741–748. [Google Scholar] [CrossRef]
  21. Raj, T.; Hashim, F.H.; Huddin, A.B.; Ibrahim, M.F.; Hussain, A. A Survey on LiDAR Scanning Mechanisms. Electronics 2020, 9, 741. [Google Scholar] [CrossRef]
  22. Royo, S.; Ballesta-Garcia, M. An Overview of Lidar Imaging Systems for Autonomous Vehicles. Appl. Sci. 2019, 9, 4093. [Google Scholar] [CrossRef]
  23. Ls, L. LS Lidar MS03. Available online: https://www.lslidar.com/en/mso/79 (accessed on 17 October 2022).
  24. Sick, S. SICK TiM1xx. Available online: https://www.sick.com/it/it/soluzioni-di-misurazione-e-rilevamento/sensori-2d-lidar/tim/c/g570093 (accessed on 17 October 2022).
  25. Gregorio, E.; Torrent, X.; Planas, S.; Rosell-Polo, J.R. Assessment of Spray Drift Potential Reduction for Hollow-Cone Nozzles: Part 2. LiDAR Technique. Sci. Total Environ. 2019, 687, 967–977. [Google Scholar] [CrossRef]
  26. Liu, B.; Li, L.; Zhang, R.; Tang, Q.; Ding, C.; Xu, G.; Hewitt, A.J.; Chen, L. Analysis of the Spatial and Temporal Distribution of a Spray Cloud Using Commercial LiDAR. Biosyst. Eng. 2022, 223, 78–96. [Google Scholar] [CrossRef]
  27. Ravier, I.; Haouisee, E.; Clément, M.; Seux, R.; Briand, O. Field Experiments for the Evaluation of Pesticide Spray-Drift on Arable Crops. Pest Manag. Sci. 2005, 61, 728–736. [Google Scholar] [CrossRef] [PubMed]
  28. Bedos, C.; Cellier, P.; Calvet, R.; Barriuso, E.; Gabrielle, B. Mass Transfer of Pesticides into the Atmosphere by Volatilization from Soils and Plants: Overview. Agronomie 2002, 22, 21–33. [Google Scholar] [CrossRef]
  29. Hossein, M.; Saeid, M.; Barat, G.; Hassan, M. Agricultural Sustainable Development by Variable-Rate Spraying. Int. J. Agron. Plant Prod. 2013, 4, 3455–3462. [Google Scholar]
  30. Hassen, N.S.; Sidik, N.A.C.; Sheriff, J.M. Advanced Techniques for Reducing Spray Losses in Agrochemical Application System. Life Sci. J. 2014, 11, 56–66. [Google Scholar]
  31. Seol, J.; Kim, J.; Son, H.I. Spray Drift Segmentation for Intelligent Spraying System Using 3D Point Cloud Deep Learning Framework. IEEE Access 2022, 10, 77263–77271. [Google Scholar] [CrossRef]
  32. Gil, E.; Arnó, J.; Llorens, J.; Sanz, R.; Llop, J.; Rosell-Polo, J.; Gallart, M.; Escolà, A. Advanced Technologies for the Improvement of Spray Application Techniques in Spanish Viticulture: An Overview. Sensors 2014, 14, 691–708. [Google Scholar] [CrossRef]
  33. Boatwright, H.; Zhu, H.; Clark, A.; Schnabel, G. Evaluation of the Intelligent Sprayer System in Peach Production. Plant Dis. 2020, 104, 3207–3212. [Google Scholar] [CrossRef]
  34. Salcedo, R.; Zhu, H.; Ozkan, E.; Falchieri, D.; Zhang, Z.; Wei, Z. Reducing Ground and Airborne Drift Losses in Young Apple Orchards with PWM-Controlled Spray Systems. Comput. Electron. Agric. 2021, 189, 106389. [Google Scholar] [CrossRef]
  35. Zhu, H.; Salyani, M.; Fox, R.D. A Portable Scanning System for Evaluation of Spray Deposit Distribution. Comput. Electron. Agric. 2011, 76, 38–43. [Google Scholar] [CrossRef]
  36. Chen, Y.; Ozkan, E.; Zhu, H.; Derksen, R.; Krause, C.R. Spray Deposition inside Tree Canopies from a Newly Developed Variable-Rate Air-Assisted Sprayer. Trans. ASABE 2013, 56, 1263–1272. [Google Scholar] [CrossRef]
  37. Nansen, C.; Ferguson, J.C.; Moore, J.; Groves, L.; Emery, R.; Garel, N.; Hewitt, A. Optimizing Pesticide Spray Coverage Using a Novel Web and Smartphone Tool, SnapCard. Agron. Sustain. Dev. 2015, 35, 1075–1085. [Google Scholar] [CrossRef]
  38. Brandoli, B.; Spadon, G.; Esau, T.; Hennessy, P.; Carvalho, A.C.P.L.; Amer-Yahia, S.; Rodrigues, J.F., Jr. DropLeaf: A Precision Farming Smartphone Tool for Real-Time Quantification of Pesticide Application Coverage. Comput. Electron. Agric. 2021, 180, 105906. [Google Scholar] [CrossRef]
  39. Beyaz, A.; Dagtekin, M.; Cilingir, I.; Gerdan, D. Evaluation of Droplet Size Spectra for Agricultural Pesticide Application Using Water Sensitive Paper and Image Analysis Techniques. Fresenius Environ. Bull. 2017, 26, 102–108. [Google Scholar]
  40. Cerruto, E.; Manetto, G.; Longo, D.; Failla, S.; Papa, R. A Model to Estimate the Spray Deposit by Simulated Water Sensitive Papers. Crop. Prot. 2019, 124, 104861. [Google Scholar] [CrossRef]
  41. Li, X.; Giles, D.K.; Andaloro, J.T.; Long, R.; Lang, E.B.; Watson, L.J.; Qandah, I. Comparison of UAV and fixed-wing Aerial Application for Alfalfa Insect Pest Control: Evaluating Efficacy, Residues, and Spray Quality. Pest Manag. Sci. 2021, 77, 4980–4992. [Google Scholar] [CrossRef]
  42. Tiffi Magi, A. Valutazione Della Funzionalità di Distribuzione di un Atomizzatore Innovativo; Università Politecnica delle Marche: Ancona, Italy, 2021. [Google Scholar]
  43. Romanazzi, G.; Mancini, V.; Feliziani, E.; Servili, A.; Endeshaw, S.; Neri, D. Impact of Alternative Fungicides on Grape Downy Mildew Control and Vine Growth and Development. Plant Dis. 2016, 100, 739–748. [Google Scholar] [CrossRef]
  44. McKinney, H.H. A New System of Grading Plant Diseases. J. Agric. Res. 1923, 26, 195–218. [Google Scholar]
  45. La Torre, A.; Iovino, V.; Caradonia, F. Copper in Plant Protection: Current Situation and Prospects. Phytopathol. Mediterr. 2018, 57, 201–236. [Google Scholar] [CrossRef]
  46. Duca, D.; Toscano, G.; Pizzi, A.; Rossini, G.; Fabrizi, S.; Lucesoli, G.; Servili, A.; Mancini, V.; Romanazzi, G.; Mengarelli, C. Evaluation of the Characteristics of Vineyard Pruning Residues for Energy Applications: Effect of Different Copper-Based Treatments. J. Agric. Eng. 2016, 47, 22. [Google Scholar] [CrossRef]
  47. Hobbelen, P.H.F.; Koolhaas, J.E.; van Gestel, C.A.M. Bioaccumulation of Heavy Metals in the Earthworms Lumbricus rubellus and Aporrectodea caliginosa in Relation to Total and Available Metal Concentrations in Field Soils. Environ. Pollut. 2006, 144, 639–646. [Google Scholar] [CrossRef] [PubMed]
  48. Rusjan, D.; Strlič, M.; Pucko, D.; Korošec-Koruza, Z. Copper Accumulation Regarding the Soil Characteristics in Sub-Mediterranean Vineyards of Slovenia. Geoderma 2007, 141, 111–118. [Google Scholar] [CrossRef]
  49. Komárek, M.; Čadková, E.; Chrastný, V.; Bordas, F.; Bollinger, J.-C. Contamination of Vineyard Soils with Fungicides: A Review of Environmental and Toxicological Aspects. Environ. Int. 2010, 36, 138–151. [Google Scholar] [CrossRef] [PubMed]
  50. Garde-Cerdán, T.; Mancini, V.; Carrasco-Quiroz, M.; Servili, A.; Gutiérrez-Gamboa, G.; Foglia, R.; Pérez-Álvarez, E.P.; Romanazzi, G. Chitosan and Laminarin as Alternatives to Copper for Plasmopara Viticola Control: Effect on Grape Amino Acid. J. Agric. Food Chem. 2017, 65, 7379–7386. [Google Scholar] [CrossRef] [PubMed]
  51. European Commission. Commission Implementing Regulation (EU) 2018/1981 of 13 December 2018—Renewing the Approval of the Active Substances Copper Compounds, as Candidates for Substitution, in Accordance with Regulation (EC) No 1107/2009 of the European Parliament and of the Council Concerning the Placing of Plant Protection Products on the Market and Amending the Annex to Commission Implementing Regulation (EU) No 540/2011. Off. J. Eur. Union 2018, 317, 16–20. [Google Scholar]
  52. Romanazzi, G.; Orçonneau, Y.; Moumni, M.; Davillerd, Y.; Marchand, P.A. Basic Substances, a Sustainable Tool to Complement and Eventually Replace Synthetic Pesticides in the Management of Pre and Postharvest Diseases: Reviewed Instructions for Users. Molecules 2022, 27, 3484. [Google Scholar] [CrossRef]
  53. Romanazzi, G.; Mancini, V.; Foglia, R.; Marcolini, D.; Kavari, M.; Piancatelli, S. Use of Chitosan and Other Natural Compounds Alone or in Different Strategies with Copper Hydroxide for Control of Grapevine Downy Mildew. Plant Dis. 2021, 105, 3261–3268. [Google Scholar] [CrossRef]
  54. European Commission. Commission Directive (EU) 2019/782 of 15 May 2019—Amending Directive 2009/128/EC of the European Parliament and of the Council as Regards the Establishment of Harmonised Risk Indicators. Off. J. Eur. Union 2019, 127, 7. [Google Scholar]
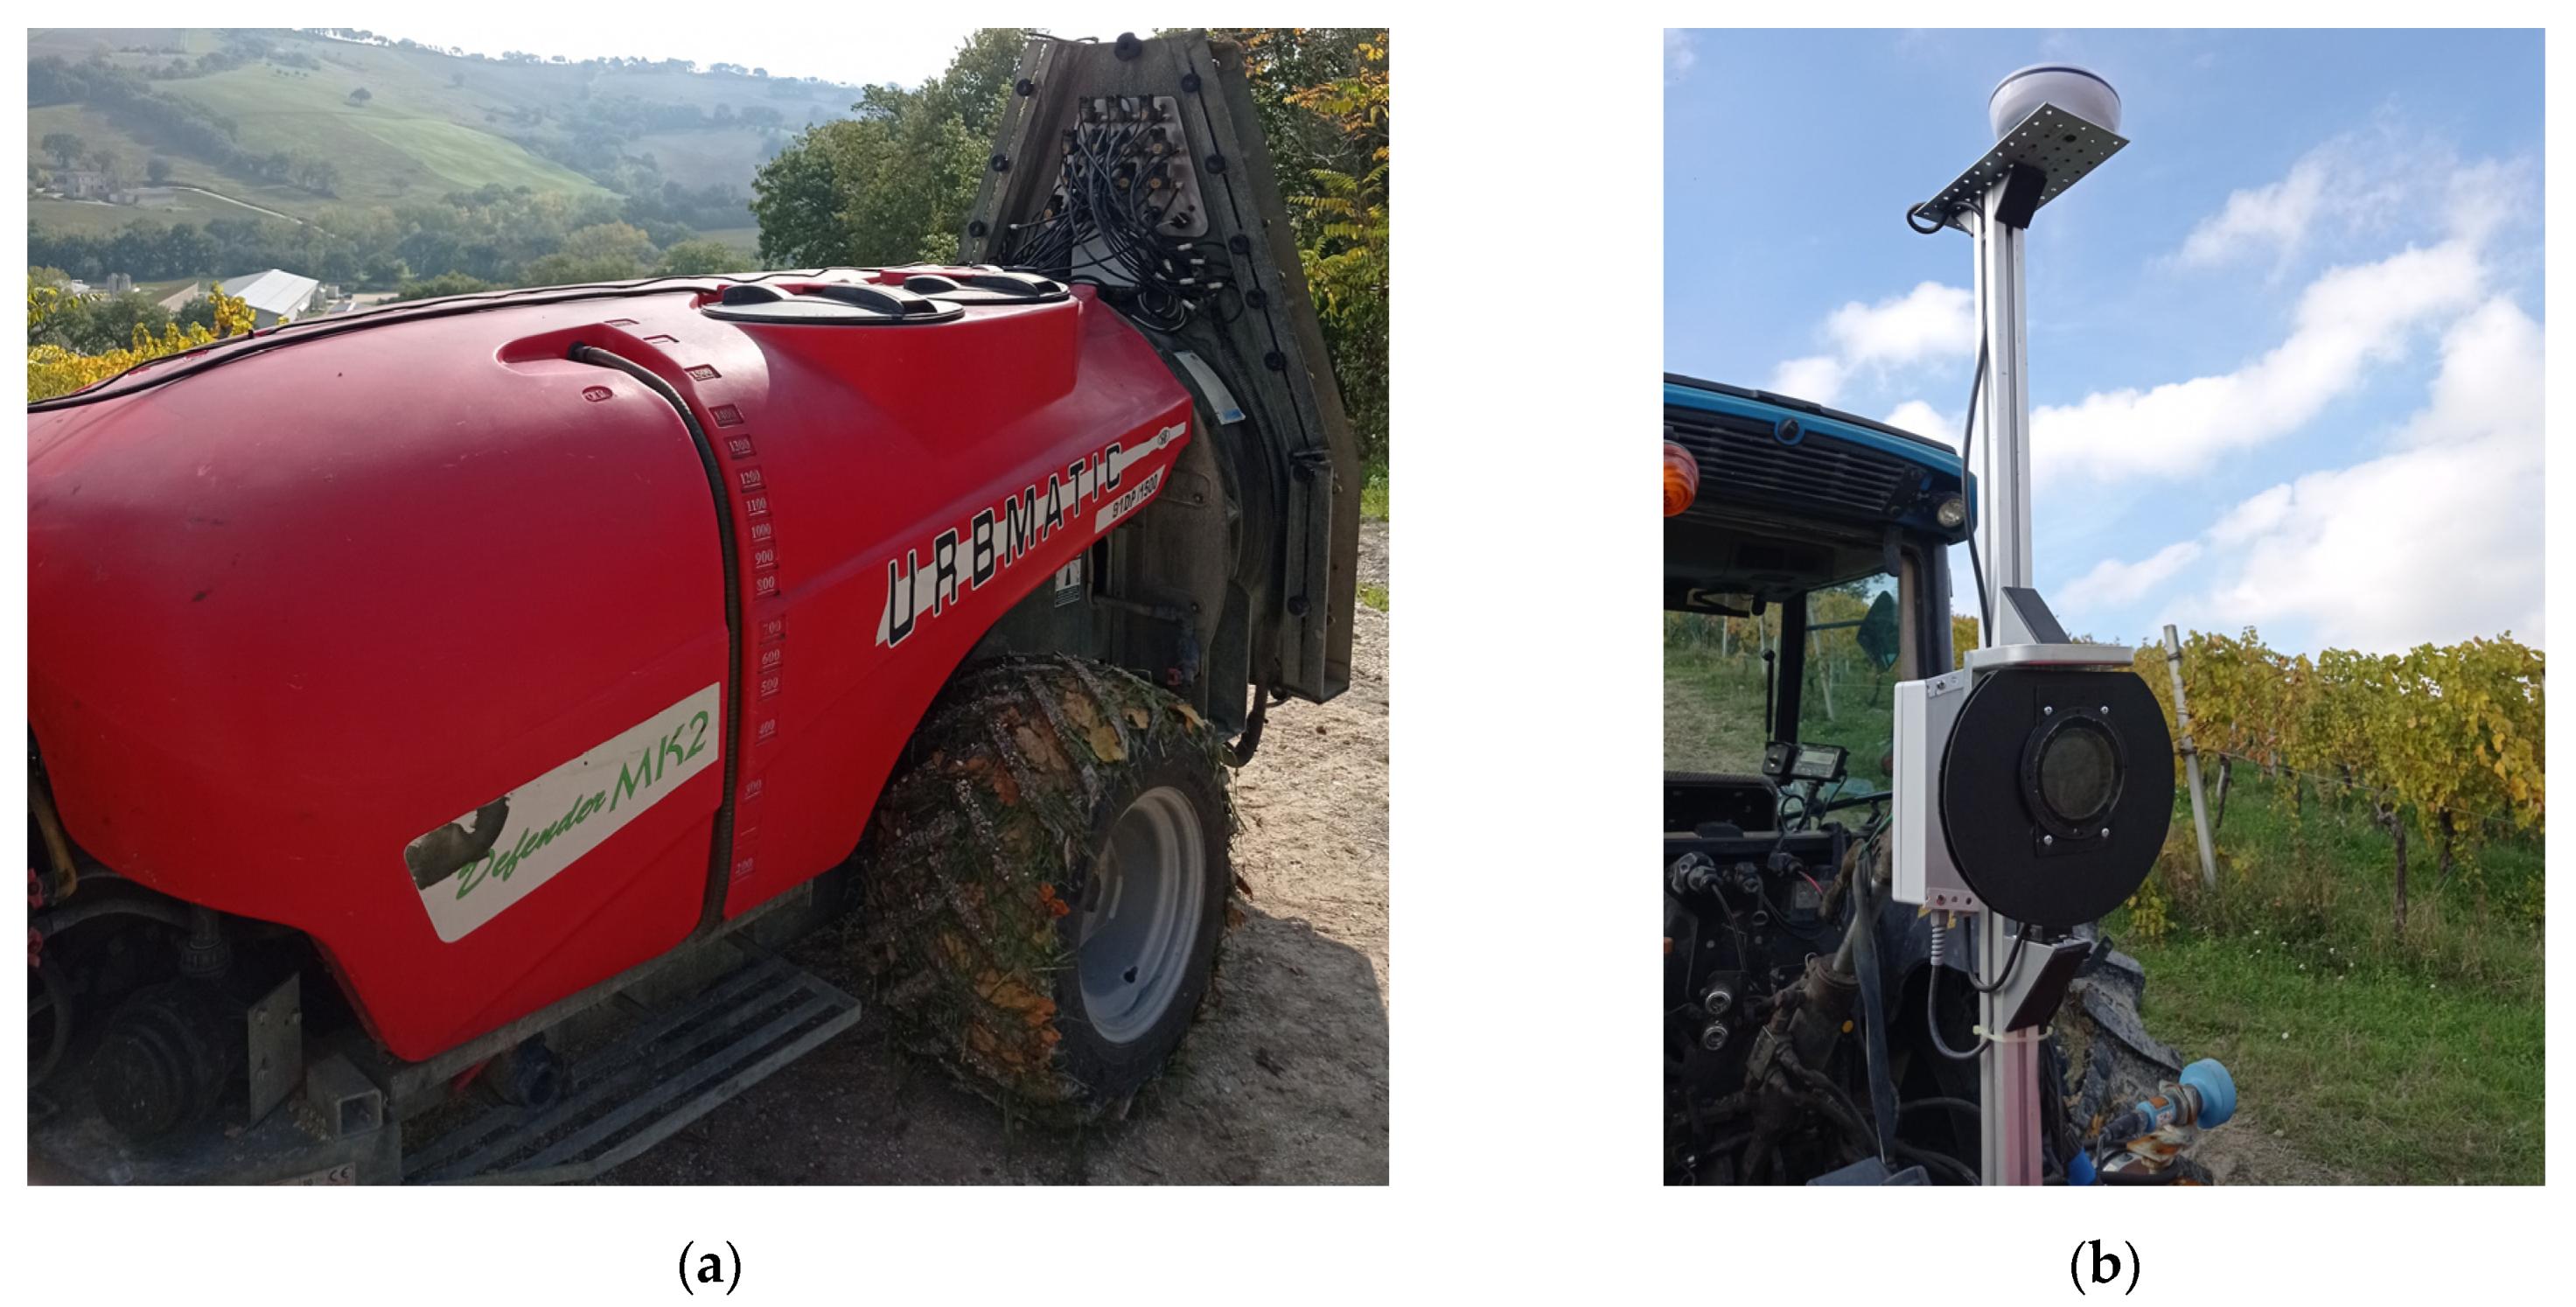
Figure 1. Workstation for experimental operation composed of: (a) a conventional sprayer. (b) Complex system for data acquisition composed of LiDAR sensor, GPS, IMU and controller.
Applsci 13 02222 g001
Figure 2. Experimental design of the vineyard: control in yellow, LiDAR test in blue and standard test in red.
Applsci 13 02222 g002
Figure 3. Vineyard mapping: each box responds to the ideal position of a grapevine, with different situations reported in Table 1.
Applsci 13 02222 g003
Figure 4. Vineyard rows divided into three blocks for the LiDAR and standard tests: yellow to red blocks are respectively LiDAR blocks from 1 to 3, while light blue to dark blue blocks are respectively Standard blocks from 1 to 3.
Applsci 13 02222 g004
Figure 5. Details of water-sensitive papers: (a) Before the distribution of agrochemicals. (b) After distribution with blue areas that represent the impact area.
Applsci 13 02222 g005
Figure 6. Reference card.
Applsci 13 02222 g006
Figure 7. Difference about water-sensitive paper after using: (a) Reference card used for previous works. (b) WSP used for the field trial of 29 October 2021. (c) Example of WSP (similar to the reference card) used for the field trial of 21 October 2022 in worse condition.
Applsci 13 02222 g007
Figure 8. Example of comparisons between reference cards used in previous works (on the left) and water-sensitive papers used for the field trial on 29 October 2021 (on the right).
Applsci 13 02222 g008
Figure 9. Meteorological trend during 2021 in Arcevia. Data were obtained from the weather station of Arcevia (AN), 295 m above sea level and recorded from April to September. All the data were provided by the Notiziario Agrometeorologico, published by Agrometeo ASSAM, Marche Region, Italy.
Applsci 13 02222 g009
Figure 11. Frequency plot describing the number of droplets (in percentage) for each diameter range.
Applsci 13 02222 g011
Table 1. Experimental vineyard mapping.
CaptionLegend
vines gapsF (red)
vines end post/
vines support post|
vines close to desiccation1
vines gaps on end post or support postF/—F|
vines close to desiccation on end post or support post1/1|
Table 2. Coverage classes and coverage range.
Coverage ClassesCoverage Range (%)
10–5
25–10
310–15
415–20
5>20 *
* No further coverage classes can be distinguished due to overlap.
Table 3. Results of LiDAR tests on vine gaps: linkage of WSP coverage classes to each thread position.
Thesis: LiDAR Gaps
Block 1Block 2Block 3
NumberThread
Position
Coverage
Classes
NumberThread
Position
Coverage
Classes
NumberThread
Position
Coverage
Classes
115112115
252223
213213212
232322
315314314
232523
411415413
222422
513512512
212422
614614615
232423
713712715
232324
813813812
232222
912913913
232324
101310151015
232424
111311131115
252324
121412131213
242522
131313131315
232325
141114151413
232225
151215131514
222423
Table 4. Results of the standard test on vine gaps: linkage of WSP coverage classes to each thread position.
Thesis: STANDARD Gaps
Block 1Block 2Block 3
NumberThread
Position
Coverage
Classes
NumberThread
Position
Coverage
Classes
NumberThread
Position
Coverage
Classes
11511511n/a
2n/a242n/a
21521521n/a
25232n/a
31n/a31531n/a
2n/a252n/a
41n/a41541n/a
2n/a252n/a
51551551n/a
25252n/a
61561461n/a
24232n/a
71n/a71371n/a
2n/a232n/a
81n/a81381n/a
23232n/a
91n/a91491n/a
25242n/a
101n/a1013101n/a
2n/a232n/a
11151114111n/a
25252n/a
12151214121n/a
24232n/a
131n/a1313131n/a
2n/a232n/a
14151415141n/a
24252n/a
15151515151n/a
25242n/a
Some coverage classes in block 1 are indicated with n/a (not available), because WSP have been altered due to the fan of the sprayer that peels off WSP from the nylon screen, and so have been excluded. Coverage classes in block 3 are not available because spray drift affect the impression of WSP and so they have been excluded from the analysis.
Table 5. Summary table of the LiDAR and standard WSP samples placed in vine gaps.
Coverage ClassesCoverage Range (%)Lidar Vines Gaps
Frequency
Standard Vines Gaps
Frequency
10–530
25–10180
310–153612
415–201610
5>201725
Table 6. Summary table about the number of droplets per diameter range, expressed in percentages.
Number of Droplets (in Percentage)
Diameter
Classes (mm)
L *S *VL *VS *
0.010000
0.053.9%4.8%3.6%3.8%
0.122.4%23.6%18.6%17.3%
0.226.7%26.5%25.2%23.7%
0.316.9%17.9%17.3%17.0%
0.410.3%10.8%11.3%11.3%
0.56.3%6.0%7.3%7.5%
0.64.1%3.5%4.8%5.2%
0.72.7%2.1%3.2%3.8%
0.81.8%1.3%2.2%2.6%
0.91.3%0.9%1.5%1.9%
10.9%0.6%1.1%1.4%
>12.7%2.0%3.8%4.6%
* L stands for LiDAR; S stands for Standard; VL stands for LiDAR gaps; VS stands for Standard gaps.
Table 7. Details of grapevine powdery mildew (GPM) and grapevine downy mildew (GDM) infections recorded on grapevine bunches in Arcevia vineyard, respectively, on 23 July 2021 and 10 September 2021.
TreatmentsGPM
23 July 2021
GDM
10 September 2021
Incidence
(%)
Severity
(1–7)
McKinney Index
(%)
Incidence
(%)
Severity
(1–7)
McKinney Index
(%)
Untreated control1.72 ± 4.40 a1.83 ± 1.33 a0.47 ± 1.51 a9.34 ± 13.13 a1.80 ± 1.01 a2.58 ± 3.91 ab
LiDAR2.11 ± 4.56 a1.33 ± 0.71 b0.40 ± 0.95 a3.81 ± 7.26 b2.12 ± 1.42 a0.98 ± 1.76 b
Conventional sprayer1.36 ± 7.70 a1.00 ± 0.00 c0.19 ± 1.10 a11.21 ± 15.31 a2.00 ± 1.19 a3.21 ± 4.92 a
Data are reported with means ± standard deviation. Data followed by different letters in the same column and on the same date of assessment are significantly different according to Fisher’s LSD test (with p ≤ 0.05).
Disclaimer/Publisher’s Note: The statements, opinions and data contained in all publications are solely those of the individual author(s) and contributor(s) and not of MDPI and/or the editor(s). MDPI and/or the editor(s) disclaim responsibility for any injury to people or property resulting from any ideas, methods, instructions or products referred to in the content.