Article

Research on Interdependence between Specific Rock Cutting Energy and Specific Drilling Energy

1
Croatian Hydrocarbon Agency, Miramarska 24, 10000 Zagreb, Croatia
2
Faculty of Mining, Geology and Petroleum Engineering, University of Zagreb, Pierottijeva 6, 10000 Zagreb, Croatia
*
Author to whom correspondence should be addressed.
Appl. Sci. 2023, 13(4), 2280; https://doi.org/10.3390/app13042280
Submission received: 19 January 2023 / Revised: 8 February 2023 / Accepted: 8 February 2023 / Published: 10 February 2023

Abstract

:

Featured Application

The presented method can be used to estimate the energy consumption of hydraulic drills and chain saw machines in the extraction of natural stone.

Abstract

A method based on extensive laboratory and field measurements was developed to determine the dependence of specific rock cutting energy (SEc) on specific drilling energy (SEd) for machines with different operating and design characteristics and similar breaking mechanics. Laboratory measurements were performed on a linear rock cutting device and a laboratory drill, using a measurement system to measure electrical power and cutting forces using force/torque transducers. Field power consumption measurements were performed on a chainsaw cutting machine and a hydraulic rotary drill under real working conditions in the dimension stone quarries. The analysis of the measured results confirmed the strong dependence of the specific rock cutting energy on the specific drilling energy and confirmed that laboratory devices can be used to simulate actual rock cutting and drilling process. In addition, the results are applicable in the dimension stone exploration and exploitation phase in order to assess and reduce energy consumption by optimizing the operating parameters of the chain cutter and/or the hydraulic rotary drill.

1. Introduction

Rock cutting and drilling are common technological procedures of mechanical rock fragmentation during mining operations, using machines of different operational and constructional characteristics. The efficiency of mechanical rock fragmentation can be optimized by monitoring specific energy. Specific energy is the energy required to mechanically breakage a unit volume of rock [1]. Although the specific energy can vary significantly, it is a useful basis for comparison when other cutting parameters are constant [2]. Furthermore, the specific energy is one of the key quantities for evaluating the operational and constructional parameters of the machines.
Machines for cutting and drilling rock have different operating and design characteristics, but breaking mechanics are similar. The specific cutting and specific drilling energy depends on similar parameters, such as rock mass parameters, machine efficiency and operational parameters, bit geometry, and wear. Therefore, it is logical to assume that there is a significant dependence between the specific cutting and the specific drilling energy.
Rowsell [3] used specific drilling energy, in combination with other drill operational parameters, to determine the type of rock through which it is drilled. Ersoy [4] used specific drilling energy to optimize drill operating parameters and determine the relationship between specific drilling energy and bit conditions, i.e., certain rock properties. During extensive research work, Akün and Karpuz [5] observed an exponential decrease in drilling speed in the case of an increase in specific drilling energy. The interdependence of specific drilling energy and uniaxial compressive strength, abrasiveness and rock brittleness were determined. Balci et al. [6] used specific cutting energy to determine the characteristics and efficiency of a roadheader. In addition, they found a strong relationship between optimal specific energy and uniaxial compressive and tensile strength of rocks. LaBelle [7] states in her doctoral dissertation that specific drilling energy can be used in combination with other drilling operational parameters for machine learning of classifier to determine the type of rock through which drilling is performed. Exadaktylos et al. found a good correlation between SE of a tunnel boring machine TBM and the rock mass rating RMR and the tunnelling quality index Q. This study presents a new spatial estimation model for continuous rock mass characterization based on the specific energy of a TBM [8]. Lakshminarayana et al. found a strong linear relationship between specific drilling energy and uniaxial compressive strength of rock UCS with a coefficient of determination of 92.1% [9]. All the above studies show that rock properties have a significant influence, with uniaxial compressive strength having the greatest influence on specific cutting and drilling energy.
The geometry of cutting and drilling tools, such as cutting tool angle (rake angle, clearance angle, side angle), tool spacing, tool shape, and depth of cut, can have significant effects on the specific energy [10,11,12,13]. Atici and Ersoy [14] concluded that the specific cutting energy can be used to determine the degree of wear of the diamond circular saw cutting elements. In addition, they noticed that the cutting speed is higher when the specific energy is lower and that increasing the depth of cut reduces the specific energy up to the limit cut depth, and further increasing the depth of cut slightly decreases or even increases the specific energy.
Rate of penetration ROP and advance rate AR can be used to quantify the efficiency of a machine. It is suitable for estimating the mechanical parameters of the rock, while torque and rotation speed are not reliable for this estimation [15]. Arbabsiar et al. [16] developed a model for predicting the advance rate of a tunnel boring machine in hard rock conditions. Finfinger et al. [17] observed during the study that the number of revolutions of the drill bit and the vertical drilling speed had an increased influence on the change of the specific drilling energy. Mikaeil et al. [18] analysed the influence of operating parameters on the chain-saw machines production rate. Balci et al. [19] conducted a study of the cuttability and drillability of rocks for seabed excavation at great depths and increased pressure. The results of the study proved to be very promising for further analysis and the ultimate goal of developing a reliable model for estimating in situ the specific energy of rock cutting at high pressure from drilling data.
Measurement While Drilling (MWD) is state-of the-art technology for estimating rock mass properties [20,21]. Bout et al. found a strong correlation between the specific energy obtained by MWD and UCS, which is one of the most important parameters for rock mechanic characterization [20]. Previous studies have shown that specific drilling energy SEd can be estimated by measuring the electrical power of the drilling motor or calculated based on drilling variables and their physical units. In addition, a strong correlation between electrical and mechanical SEd has been found [22].
Despite numerous studies and various applications of the specific energy of rock cutting and drilling, there is still a need for detailed research into the interdependence of these two energies. Accordingly, the topic of this paper is the presentation of the method and the obtained results, based on which was the confirmed hypothesis of the existence of a significant linear dependence of specific rock cutting energy on specific drilling energy for machines or devices having the same or similar rock destruction mechanics and different working and construction parameters. In order to confirm the hypothesis, extensive laboratory and field measurements of the specific energy of rock cutting and drilling were performed.

2. Mechanics of Rock Cutting and Boring

In quarrying dimension stone, a combination of a chain saw and a diamond wire saw is often used. In order to place the diamond wire in the cut, it is necessary to drill vertical and/or horizontal boreholes using a hydraulic rotary drill. In addition, a hydraulic rotary drill is used to drill cores when exploring dimension stone deposits. Chain saw machine (Figure 1a) and hydraulic rotary drill (Figure 1b) are machines that have different operational and constructional characteristics but have similar rock destruction mechanics. The chain saw cutting tool and natural diamond core bit are shown in Figure 1c and Figure 1d, respectively.
Mellor [23,24,25,26,27] analysed in detail the kinematics and dynamics of the cutting elements, i.e., the working element of the chain saw and the hydraulic rotary drill. In order to determine rock cutting and boring mechanics of the aforementioned machines, the most important kinematic and dynamic quantities were analysed. The results of the analysis, shown in Table 1, indicate the similarity of the selected physical quantities, so it can be concluded that the mechanics of rock cutting and boring are similar.
For easier comparison with the kinematic values of the chain saw, in Table 1 the vertical drilling speed vd is denoted by the symbol for the cart speed rate of the chain saw U, while the peripheral speed vtan is denoted by the symbol for the chain saw cutting chain speed vt. In addition, it is assumed that the angle between the arm of chain saw and the cutting direction φ is 90° and belt speed of chain saw is equal to chain saw cutting chain speed.

3. Materials and Methods

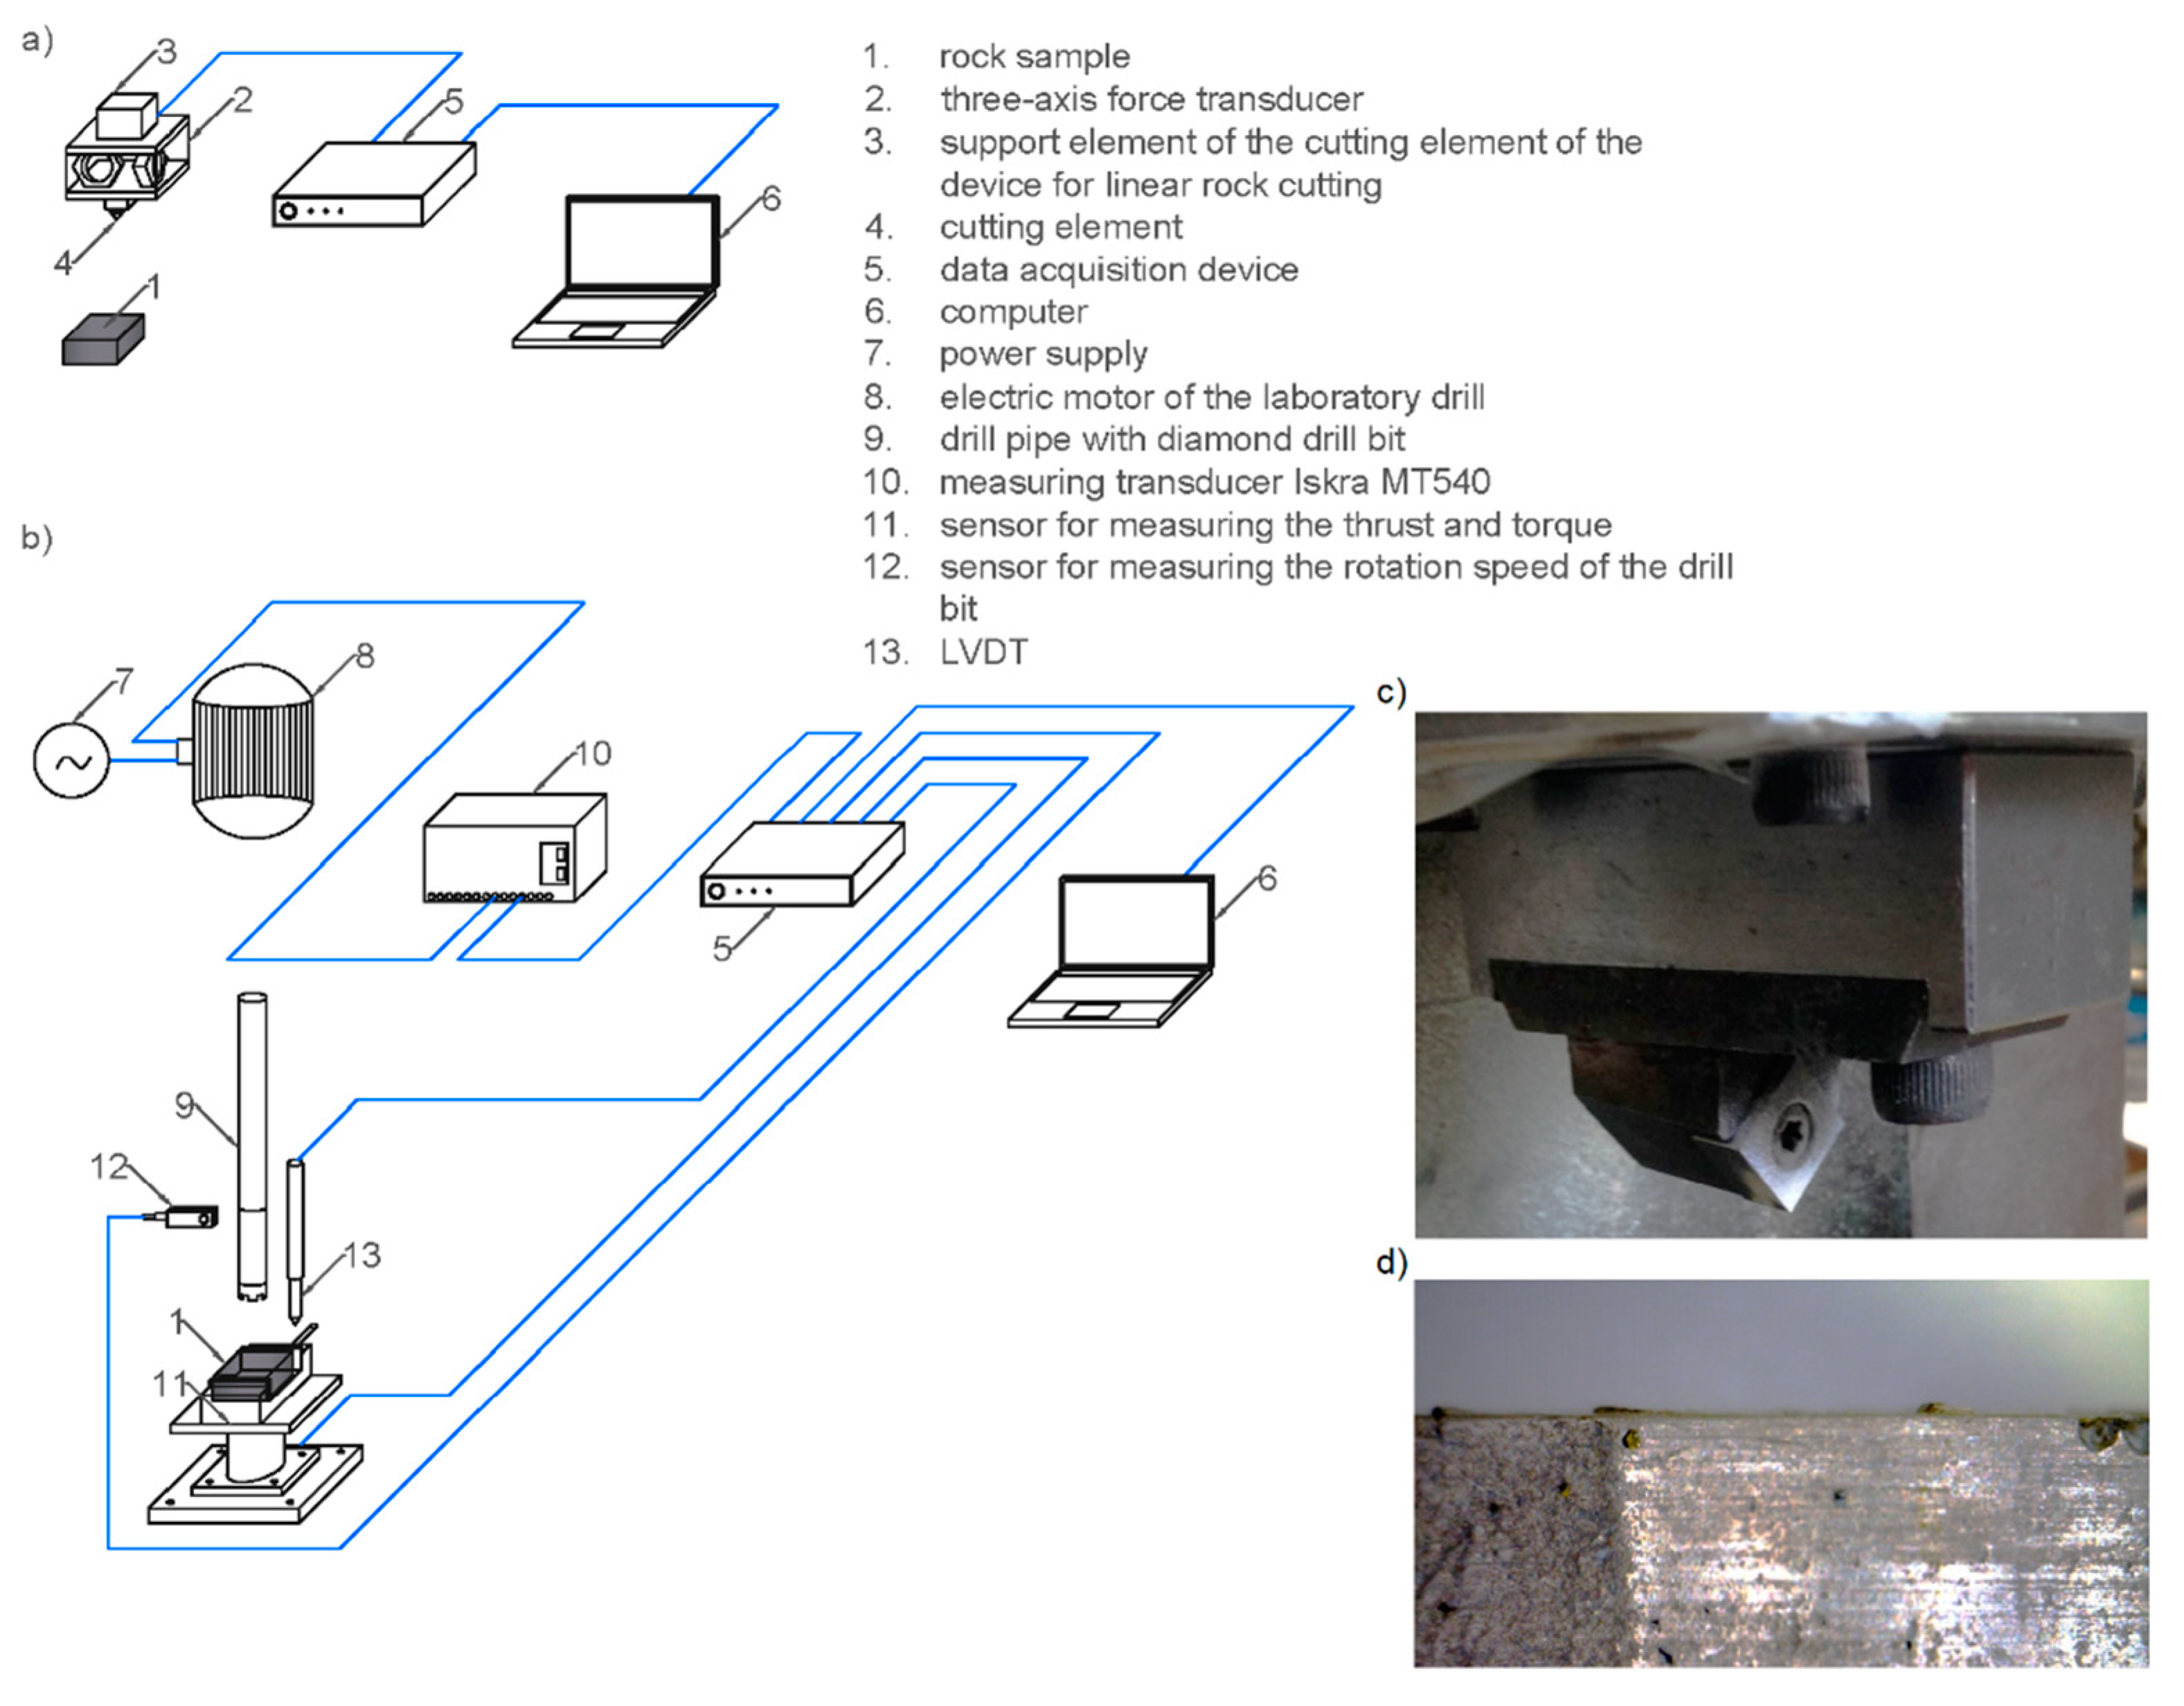
3.1. Laboratory Measurements

Laboratory measurements were performed on a linear rock cutting device (Figure 2a) and a laboratory drill with a diamond drill bit (Figure 2b). A detailed description of the laboratory cutting rig can be found in previous works [11,28]. The laboratory drill is equipped with a diamond drill bit, used in dimension stone exploration and core drilling. The cutting depth of a diamond grain (cutting element) depends on its exposure in relation to the metal matrix, whereby it is not possible to adjust the cutting depth. Chiaia et al. [29] found that its value is approx. 100 μm. In order to determine the average depth of cut and the number of diamond grains in contact with the rock sample being tested, measurements were made on the drill bit using a digital microscope. The average exposure height of diamond grains was measured at 75.5 μm. A drill bit with an external diameter of 50 mm and an inner diameter of 38 mm was used.
Rock samples were limestones collected from three different dimension stone quarries (Table 2). Prior to the start of the test, the bulk density of each sample was determined. During the measurement, two different measuring systems were used, depending on the applicability of the sensor:
  • a measuring system for measuring electrical power used up by cutting or drilling applied in laboratory and field tests (Figure 2a);
  • a measuring system with a force transducer was used on the device for linear rock cutting, and a measuring system with a force and torque transducer was used on the laboratory drill (Figure 2b).
The sensor part of the measuring system for measuring power is the measuring transducer Iskra MT540, which is connected between the power supply and the electric motor of the device in order to measure the electric active power consumed by the electric motor of the device in time (Figure 2b). The transducer converts the power into an output voltage proportional to the power. Using the proportionality constant of the measuring transducer, the electrical voltage is converted into electrical power. The transducer is connected via a data acquisition device to a computer on which the measured data are stored. During laboratory measurements, a virtual instrument was used, that is, an instrument that realizes part of its functionality through software [30]. On the front panel of the virtual instrument, it was possible to monitor the change in electrical voltage, current, power and energy in real time [31].
To calculate the cutting energy, a linear rock cutting device equipped with three component force transducer was used (Figure 2a). A three-axis force transducer using octagonal rings was used, on which strain gauges were mounted in such a way as to form three Wheatstone bridges. The sensor is attached to the support element of the cutting element of the device for linear rock cutting. Powering Wheatstone bridges and transferring and storing measured data to a computer is enabled using a data acquisition device [28].
Measuring system with force and torque transducer consists of sensors for measuring the vertical component of drilling force (thrust) and torque (torsion) of a rotary drill, LVDT for measuring the vertical displacement of the drill bit, sensors for measuring the rotation speed of the drill bit, device for data acquisition and computer (Figure 2b). The elastic sensor element for measuring thrust and torsion is a steel tube on which strain gauges are mounted and electrically connected in such a way as to form two Wheatstone bridges [32]. The elastic element is fastened between two metal plates. In addition to the aforementioned parts, the sensor also consists of a base plate which is used to fix the sensor to the base, a mechanism for fixing the rock sample and a protective case of the elastic element. The drill bit rotation speed sensor is a miniature polarized retro-reflecting laser sensor. All the senses are powered by a data acquisition device which transmits data to a computer.
The three-axial force transducer and thrust and torsion sensor are calibrated before measurement. Based on the data obtained by calibration, and in order to reduce the adverse effect of transverse sensitivity on the measured data, compensation matrices for the three-axis force transducer and the thrust and torsion sensor were calculated. Compensation matrices can reduce the transverse sensitivity below 0.5% of the full measuring range of the sensor [33].
The rock sample was placed and fixed on the vice of the linear rock cutting device, and the cutting depth of the cutting element was set to 100 μm. Using a measuring system with a force transducer, the cutting force components were measured at ten cuts placed at a sufficient distance from each other for the cutting to take place in unrelieved conditions. A total of 40 cuts were made in unrelieved conditions, so that the mass of rock fragments created by cutting was as large as possible, and thus a more reliable weighing result. It is worth pointing out that in the initial phase of the laboratory measurement, a power measurement system connected to the electric motor of the linear cutting device was used. However, the obtained results are practically useless because it is very difficult to distinguish the idle energy from cutting energy. A possible reason for this could be the increase in energy when cutting at small depths (100 μm) is negligible in relation to the idle energy, and the measuring power system is insensitive to small changes in energy. Furthermore, the flywheel (mass of the rocker mechanism) of the device for linear rock cutting ensures equal energy consumption from the electrical network.
After cutting and weighing, the same rock sample was placed on the thrust and torsion measuring sensor. Prior to putting the laboratory drill into operation, a constant water flow to the drill bit was enabled. This was followed by measuring the idle power, which lasted for approx. 50 s, followed by drilling the sample to a depth of approx. 50 mm. When the target depth was reached, the remaining rock fragments were removed from the rock sample with a jet of water. The sample was then dried, and after drying to constant weight, the sample was weighed.

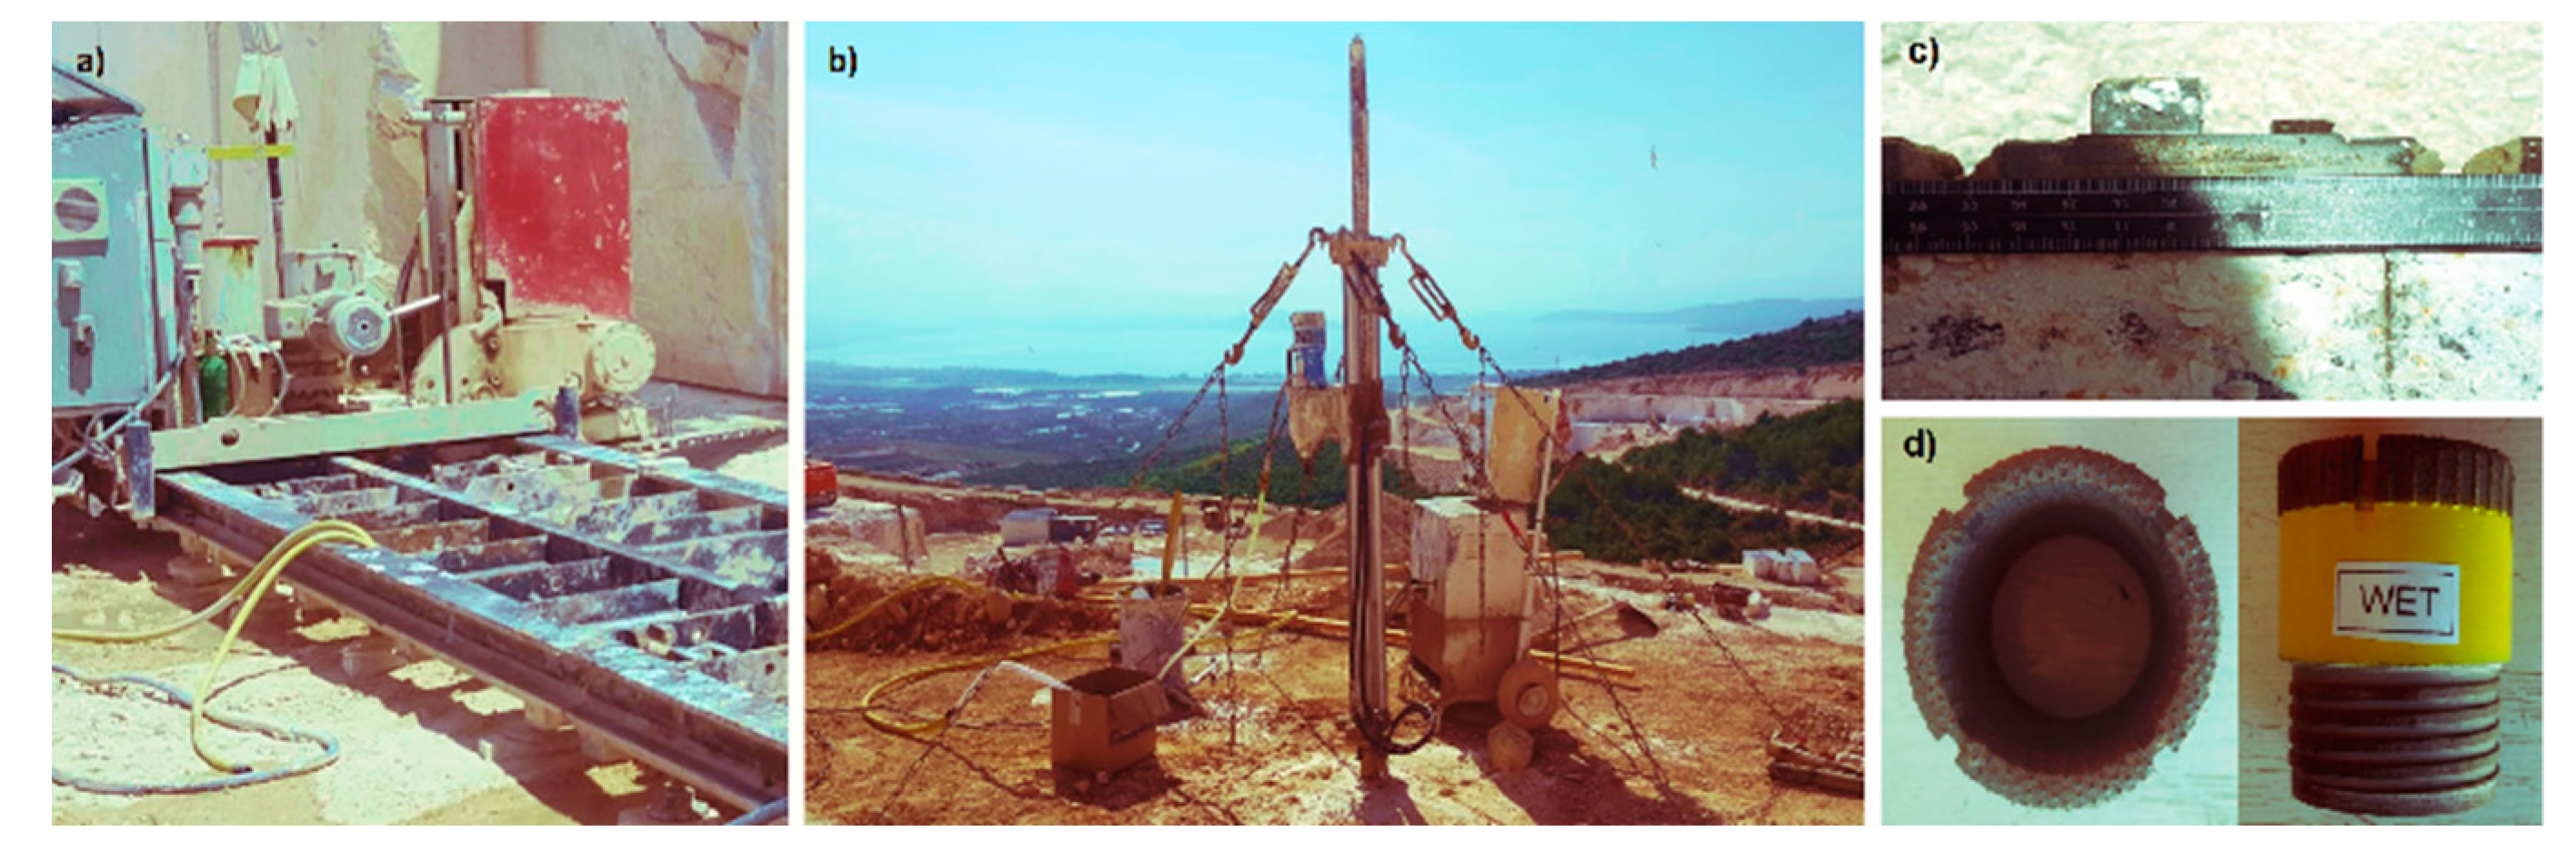
3.2. Field Measurements

Field measurements were performed on the dimension stone quarry “Redi” in Croatia. Using a system for measuring the cutting and drilling power, the measurement was performed on a chain saw (Figure 1a) and a hydraulic rotary drill (Figure 1b) in real operating conditions. The characteristics of a chain saw and a hydraulic rotary drill are shown in Table 3 [32].
During drilling, a sensor was added to measure the pressure of the hydraulic oil because the thrust of the drilling equipment is achieved hydraulically. The measurement on the chain saw began with the start-up of the electric drive motor and the adjustment of the cutting chain and cart speed. After the electric motor reached a steady state, the idling power was measured for 50 s. The measurement was continued during cutting for about 250 s, and the measured data were stored on a computer. The test procedure was repeated at different cutting chain speeds and cart speed rates.
Before the start of the measurement on the drill, the water supply to the drill bit was enabled and the electric motor for rotation, i.e., the hydraulic unit of the drill, was put into operation. After connecting the power measuring transducer to the rotation drive and the pressure measuring sensor to the drill hydraulic supply line, the idling power measurement was started. The measurement was continued when drilling a borehole with a depth of about 50 cm. For the purposes of calculating the thrust force, the diameter of the piston of the hydraulic cylinder was measured.

4. Results

The specific cutting energy can be expressed by Equation (1), and the specific drilling energy by Equation (2):
S E C =   E Cav V C  
S E D =   E Dav V D
where SEC is the specific cutting energy (J/m3); SED is the specific drilling energy (J/m3); ECav is the average energy expended on rock cutting (J); EDav is the average energy expended on rock drilling (J); VC is the volume of rock fragments formed by cutting (m3); and VD is the volume of rock fragments formed by drilling (m3).

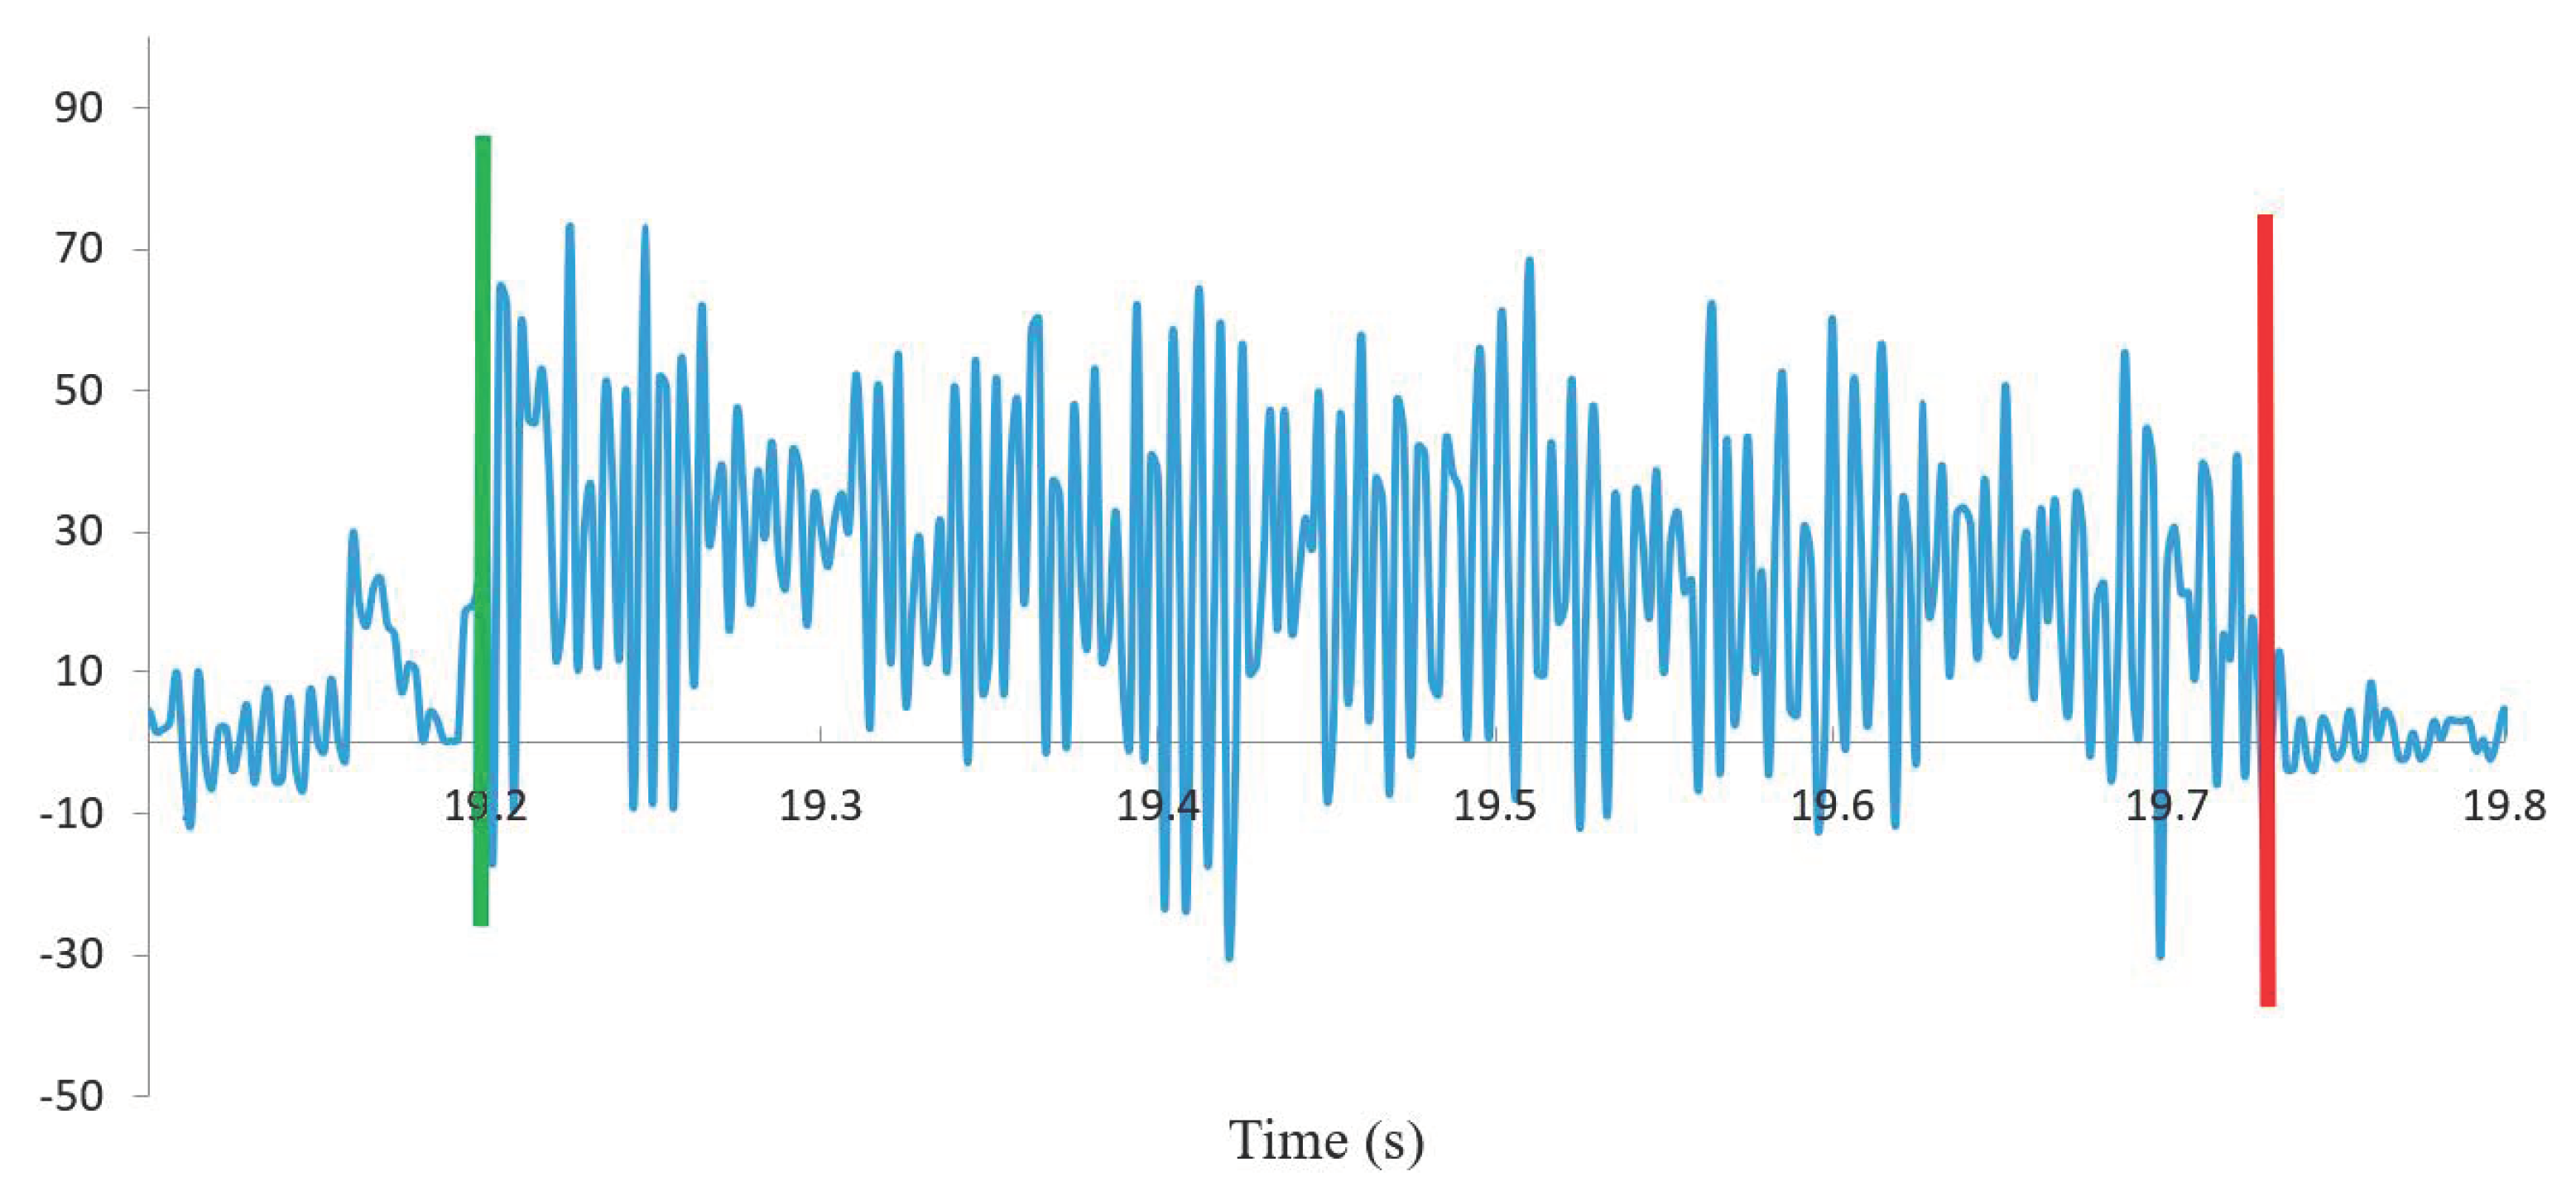
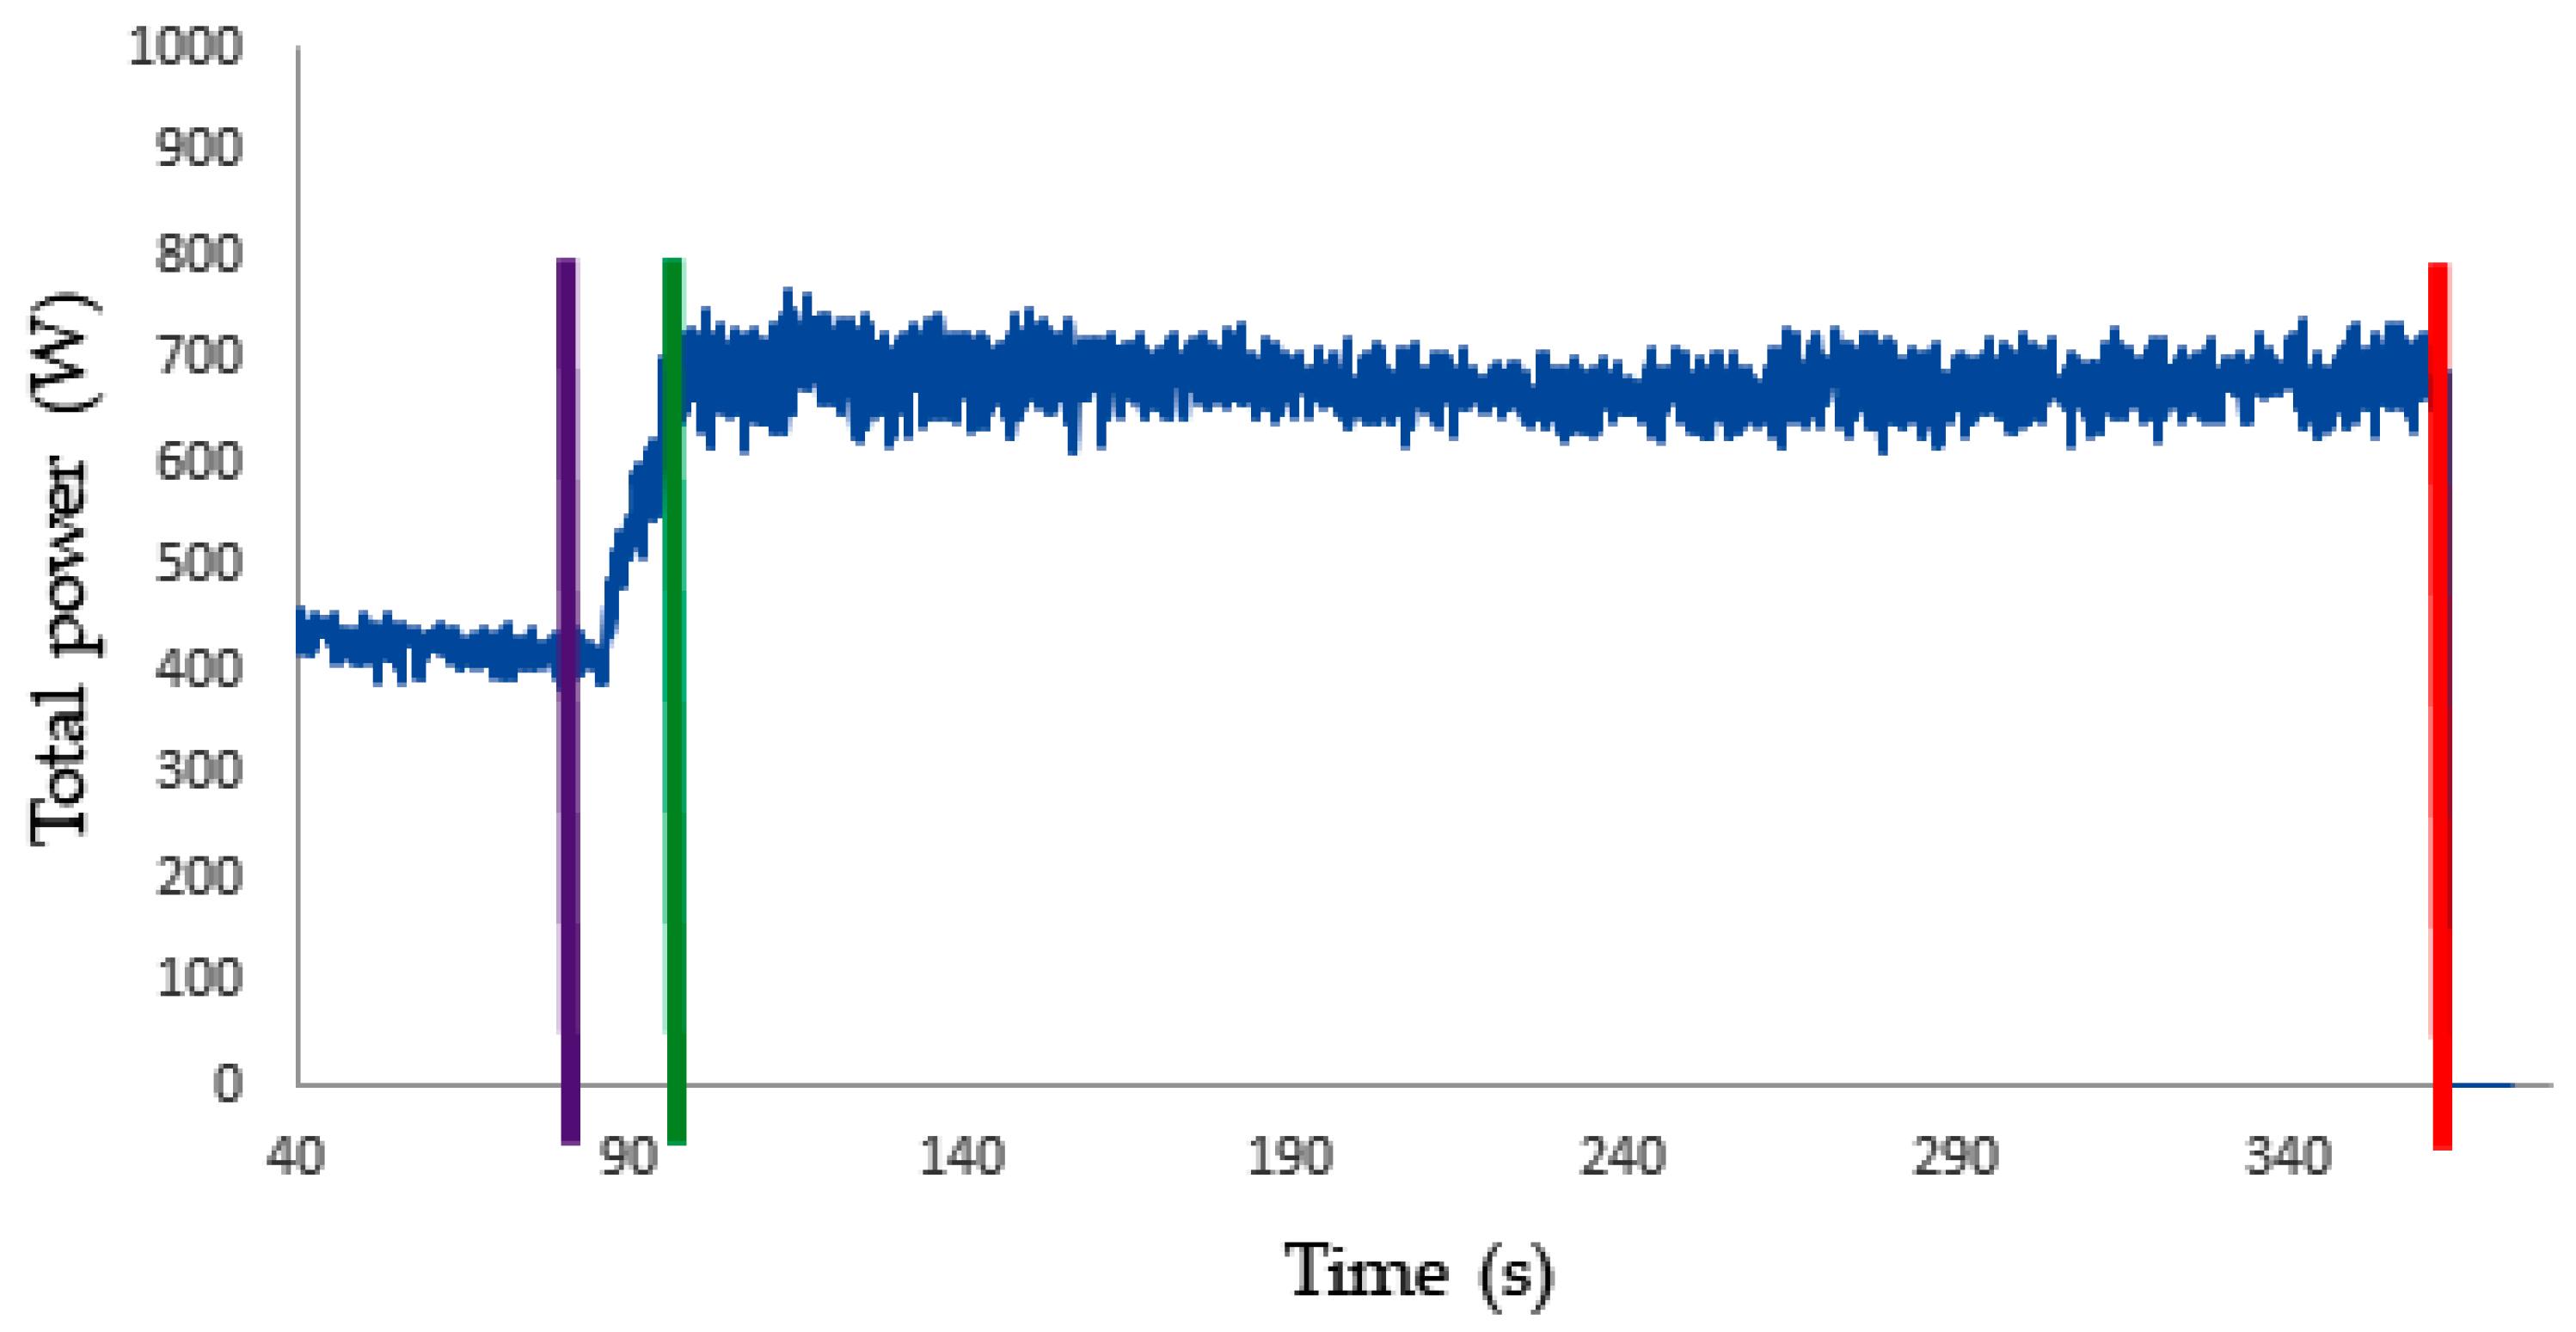
4.1. Calculation of Specific Cutting Energy and Specific Drilling Energy from Results of Laboratory Measurements

The cutting element of the device for linear rock cutting moves horizontally in relation to the surface of the rock sample. Therefore, the horizontal component of the cutting force performs mechanical work along the distance made, which is equal to the average length of the sample.
The formation of rock fragments is of a discontinuous nature [34], which can be seen in the variation of the horizontal cutting force in time (Figure 3). In the figure, the green line represents the beginning of cutting, and the red line represents the end of cutting.
The average horizontal component of the cutting force of one cutting element is calculated according to the equation:
F cav = i = 1 N F c i N  
where Fcav is the average horizontal component of the cutting force of one cutting element (N); Fci is the horizontal component of the cutting force of one cutting element and N number of samples.
Since one cutting element was used to cut the rock samples in the laboratory tests, the average energy used on rock cutting is equal to the average energy used on cutting the rock of one cutting element. The expression for calculating the average energy used on cutting rocks of one cutting element is:
E Cav = E cav = F cav · L cav
where Ecav is the average energy used on rock cutting of one cutting element (J); Lcav is the average cut length (m).
The volume of rock fragments formed by cutting one cut is calculated using the equation:
V C = m c ρ = m c 1 m c 2 n c m dr V rs = V r s · m c 1 m c 2 m dr · n c
where mc is the mass of rock fragments of one cut (kg); ρ is the bulk density (kg/m3); mc1 is the sample mass before cutting (kg); mc2 is the sample mass after cutting (kg); nc is the number of cuts; mdr is the dry mass of the sample (kg); and Vrs is the volume of the rock sample (m3).
The movement of the cutting element of the drill bit, i.e., the diamond grain is a complex movement consisting of vertical movement and rotation around the vertical axis, so the total mechanical work is equal to the sum of mechanical works created by the vertical component of drilling force upon vertical movement of the drilling bit and the horizontal component of drilling force by a circular arc (Equation (6)). The diamond grain rotates at some distance from the axis of rotation and forms the arm of the force to the horizontal component of the drilling force, whereby a torque (torsion) is created:
E Dav = E DNav + E DRav
where EDNav is the average energy used on rock drilling generated by the action of the vertical component of the drilling force (J); EDRav is the average energy used on rock drilling generated by the action of torque (J).
Due to the oscillation of the vertical component of the drilling force, the mean value was calculated using the equation:
F Nav = i = 1 N F Ni N
where FNav is the average vertical component of the drilling force (N); FNi is the vertical component of the drilling force at the i-th moment (N) and N number of samples.
The end time (red line), i.e., the beginning of drilling (green line) is determined using the diagram of the dependence of the total power of the electric motor of the drill on time (Figure 4), and their difference is the drilling time.
Drilling depth is the difference between the vertical position of the drill bit measured at the end, i.e., the beginning of drilling:
H = H 2 H 1
where H is the drilling depth (m); H1 is the vertical position of the drill bit measured at the beginning of drilling (m); H2 is the vertical position of the drill bit measured at the end of drilling (m).
The result of the above stated facts is the equation for calculating the average energy spent on drilling rocks caused by the action of the vertical component of the drilling force:
E DNav = F Nav · H
As in the case of the vertical component of the drilling force, the torque value also oscillates during drilling, so it was necessary to calculate the average torque using the equation:
M av = i = 1 N M i N
where Mav is the average torque (Nm); Mi is the torque in the i-th moment (Nm) and N number of samples.
The average number of rotations of the drilling bit was calculated by the following equation:
N av = i = 1 N N i N
where Nav is the average number of rotations of the drilling bit (s−1); Ni is the number of rotations of the drilling bit in the i-th moment (s−1) and N number of samples.
The average energy used on rock drilling caused by torque can be calculated using the expression:
E DRav = 2 π · N a v · M a v · t d
As in the case of cutting, from the ratio of the mass of rock fragments formed by drilling and the bulk density, it is possible to calculate the volume of rock fragments formed by drilling:
V D = m d ρ = m d 1 m d 2 ρ
where md is the mass of rock fragments formed by drilling (kg); md1 is the mass of the sample in the dry state before drilling (kg); md2 is the mass of the sample in the dry state after drilling (kg).
The specific drilling energy of one cutting element is the ratio of the specific drilling energy and the total number of exposed diamond grains:
S E D =   S E D N d
where SED is the specific drilling energy of one cutting element (J/m3); Nd is the total number of exposed diamond grains.
The energy used by the electric motor is represented by the area under the curve shown on Figure 4. The purple line represents start time, while the green line represents end of idling and start of drilling, and the red line represents end of drilling. The oscillation of the force during drilling is related to the nature of the formation of rock fragments, the basic feature of which is discontinuity [34].
The idle energy of the drill is calculated using Equation (15), provided that the idle time of the drill is equal to the drilling time:
E DIav = P Iav · t Id = P Iav · t d 2 t d 1
where EDIav is the average energy of the idle time of the drill (J); PIav is the average power of the idle time of the drill (W); tId is the idle time of the drill (s).
It is assumed that the average power, that is, the average idle energy of the drill remains constant during drilling. The total drilling energy was calculated by numerical integration with a trapezoidal rule, and the difference between it and the average idle energy of the drill is the average energy used on drilling:
E Dav = E Dt E DIav
where EDt is the total drilling energy (J).
The volume of rock fragments was calculated using Equation (13), while the specific drilling energy was calculated on the computer using Equations (2) and (14) when it referred to the specific drilling energy of one cutting element.

4.2. Calculation of Specific Cutting Energy and Specific Drilling Energy from the Results of Field Measurements

The total cutting energy of the chain saw was calculated by numerical integration of the total power over time. According to Equations (15) and (16), the average idle energy of the chain saw, and the average energy used on cutting were calculated. Equation (17) was used to calculate the geometric volume of the chain saw cut:
V C = S c · W = d · L c · W
Where Sc is the cut surface (m2); W is the cut width (m); d is the cut depth (m); Lc is the cut length (m).
The specific cutting energy of the chain saw was calculated according to Equation (1). The effective depth of the cut of cutting elements mostly depends on the speed of the cutting chain and the cart speed rate of the chain saw and the length of the cutting segment and the angle between the arm and the cutting direction (Figure 5) [24], and is calculated using the equation:
h w = U v t · S · sin φ
where hw is the effective cutting depth, (m), vt is the chain saw cutting chain speed (m/s); U is the cart speed rate of the chain saw (m/s); S length of cutting segment (m); φ bar angle or cutting angle (°).
The cutting chain speed and the cart speed rate of the saw could not be adjusted so that the cutting depth of the cutting element was 100 μm, which means that a cutting depth corresponding to laboratory measurements could not be achieved. Therefore, a regression analysis of the specific cutting energy depending on the effective depth of cut (Figure 6) was performed, where the equation was obtained:
S E C = 59.63 ·   ln h w 338.35
Using Equation (19), the specific cutting energy of the chain saw was calculated at a cutting depth of the cut segment of 100 μm.
The same case as in Equations (15) and (16), the average energy used on rock drilling generated by the action of torque was calculated, while the average energy used on rock drilling generated by the action of the vertical component was calculated by Equation (9). To calculate the drill thrust, the equation was used:
F N = p h · S h = p h · r h 2 · π
where FN is the vertical component of the drilling force or thrust (N); ph is hydraulic oil pressure (Pa); Sh is the surface area of the hydraulic piston in the thrust cylinder (m2); rh is the radius of the cross section of the hydraulic piston (m).
Due to the oscillation of the vertical component of the drilling force, the mean value was calculated using Equation (7). Equation (6) was used to calculate the average energy used for drilling, and Equation (2) was used to calculate the specific drilling energy. The geometric volume of the borehole was calculated according to the equation for calculating the volume of the hollow roller:
V D = r o 2 r i 2 · π · H
where ro is the outer radius of the drill bit (m); ri is the inner radius of the drill bit (m).

5. Analysis of Calculation Results and Discussion

In order to reduce the influence of rock heterogeneity on the analysis of specific energies, eight groups were formed according to the type of rock material from which samples for laboratory testing were excluded. For each group, a statistical test (Dixon test) was performed on the values of specific cutting and drilling energies to determine the outliers [35]. This was followed by basic statistical data processing to determine the arithmetic mean values of specific energies of individual groups, after which linear regression models of the dependence of specific cutting energy on specific drilling energy were calculated using the least squares method and the orthogonal distance regression method. The latter method involves the error of both variables [36], which refers to the cases described in this paper because both the abscissa and the ordinate contain the data obtained by measurements. Using both methods, the equations of the line of the dependence of the specific energy of rock cutting on the specific drilling energy were calculated, and the deviations in the coefficients of slope of the line and sections on the ordinate, i.e., in the coefficients of determination are minimal. For simplicity of calculation, explicit equations of lines obtained by the least squares method were chosen, so Equation (22) shows the linear dependence of specific rock cutting energy on specific drilling energy obtained using a measuring system for measuring electrical power, and Equation (23) shows linear dependence of specific rock cutting energy on specific drilling energies obtained by means of a measuring system with a measuring transducer of force and torque.
S E C = 0.27 ·   S E D 78.71             R 2 = 0.71
S E C = 0.35 ·   S E D 203.06         R 2 = 0.56
Determination coefficients indicate a strong and moderate correlation.
The calculation of the measurement uncertainty was performed on the basis of data from the calibrations and specifications of the manufacturers of measuring instruments and equipment. In addition, it was assumed that the input quantities, on the basis of which the standard measurement uncertainty of the input quantities estimate is calculated, are independent. The overall representation of the calculated specific energies with the corresponding measurement uncertainties is visible in Table 4, while the graphical representations are visible in Figure 7 and Figure 8.
From Table 4, but also in Figure 7 and Figure 8, it can be seen that the measurement uncertainty associated with the results of measuring the specific drilling energy obtained using the power measuring system is significantly less than the measurement uncertainties associated with the results of measuring specific cutting or drilling energy obtained with the measuring system with force transducer or measuring system with force and torque measuring transducer. This indicates the quality of the measuring system. The increase in the measurement uncertainty associated with the measurement results of the specific cutting energy is also influenced by the small mass of rock fragments formed by cutting.
A very good correlation between the field measurement of specific energies and the laboratory one can be seen in Figure 9.
The used measuring systems have advantages and disadvantages. Their comparison is based on the specific indicators presented in the Table 5.
Comparing the indicators from the Table 5, it was concluded that the system for measuring power has several advantages over the measuring system with a measuring force transducer. i.e., a measuring system with a force and torque transducer. Namely, the measuring system for measuring power is applicable in the laboratory and in the field and is much easier to apply. i.e., it is less complex (smaller number of components in the system which reduces installation and de-installation time) compared to other measuring systems. The measurement uncertainty associated with the measured data obtained by the measuring system for measuring power is significantly lower compared to the measuring system with the force transducer. In other words. a power measurement system provides more reliable measurement quantities. The disadvantages of the power measuring system are the low sensitivity at small cutting depths and the need to convert electricity into mechanical energy using the mechanical efficiency of the electric motor η. In addition, when measuring the power of the electric drive motor, losses (e.g., motion transmission losses) are measured which are difficult to determine and consequently correct the measurement result.

6. Conclusions

After extensive laboratory and field measurements and the analysis of the measured data the following was concluded:
  • There is a strong and moderate linear dependence of specific rock cutting energy on specific drilling energy, depending on whether a power measurement system or a force and torque transducer measurement system was used to measure drilling energy. This confirms the hypothesis about the existence of a significant linear dependence of specific rock cutting energy on specific drilling energy for machines or devices with the same or similar rock breakage mechanics and different operating and design characteristics.
  • Cutting and drilling SE are linearly related since both depend on similar parameters, with the main parameter affecting both energies being rock strength. The difference between the two energies results from the geometrical parameters of the cutting and drilling tools and the efficiency of the different machines.
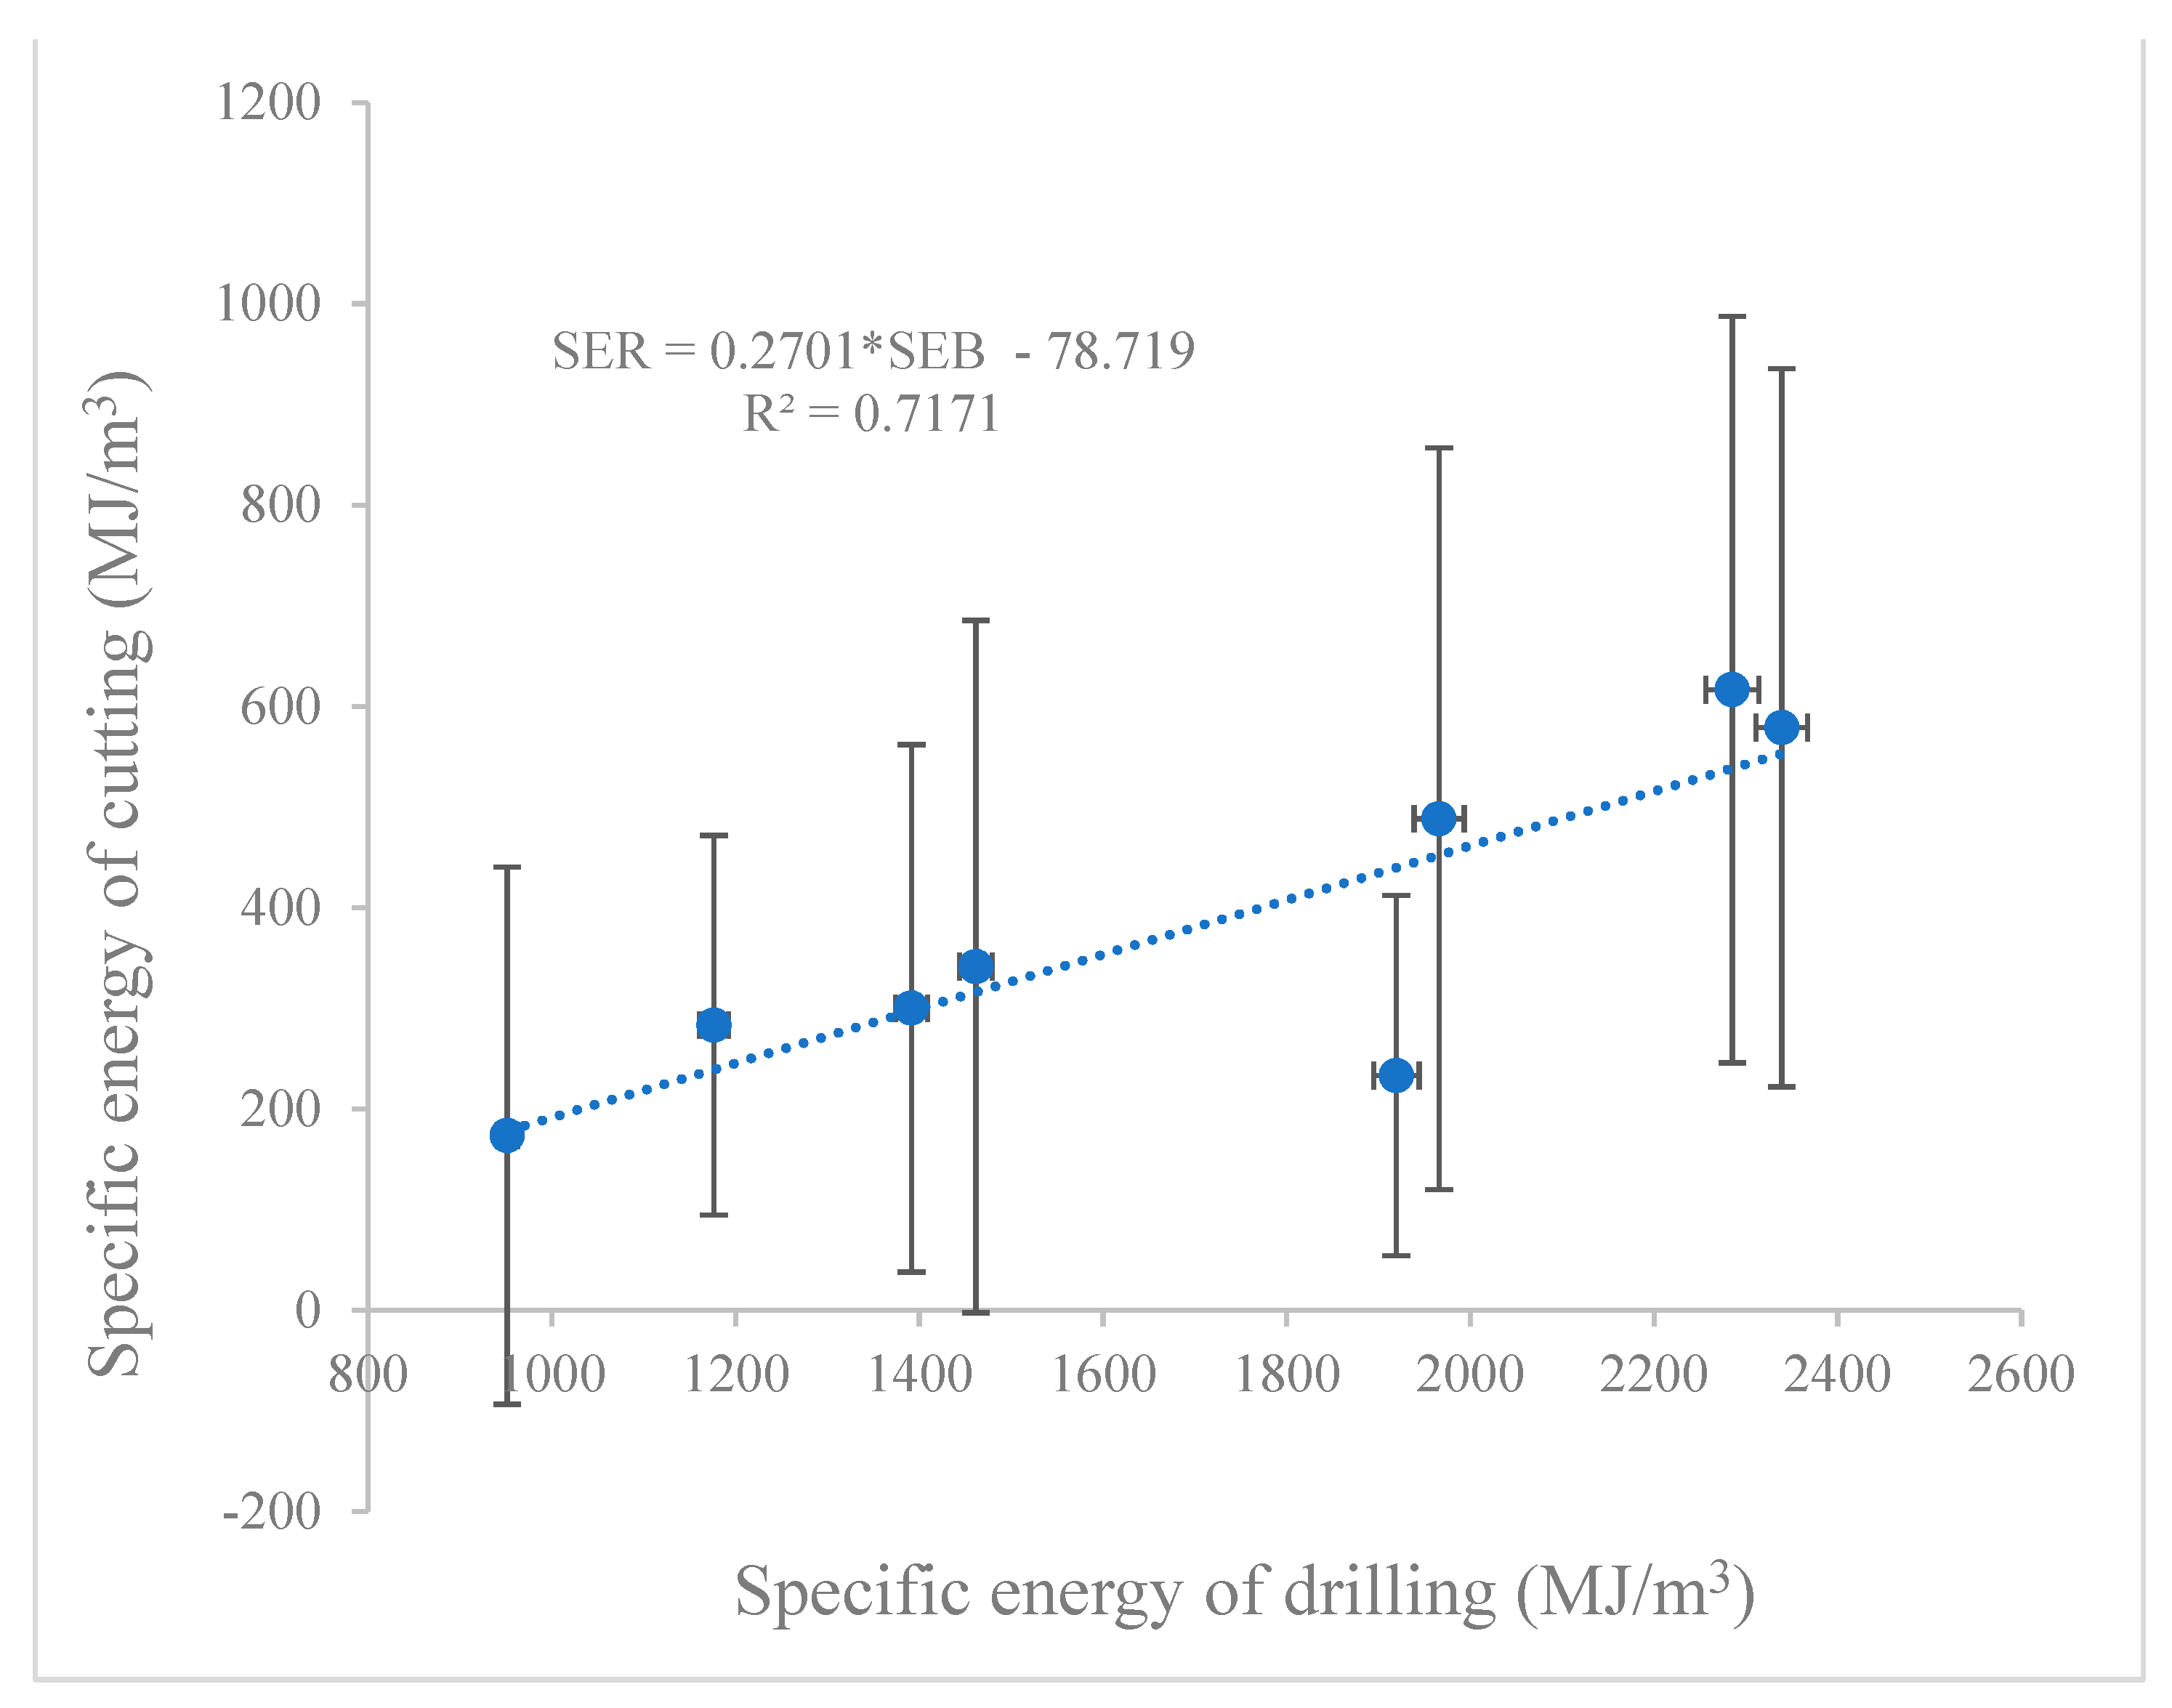
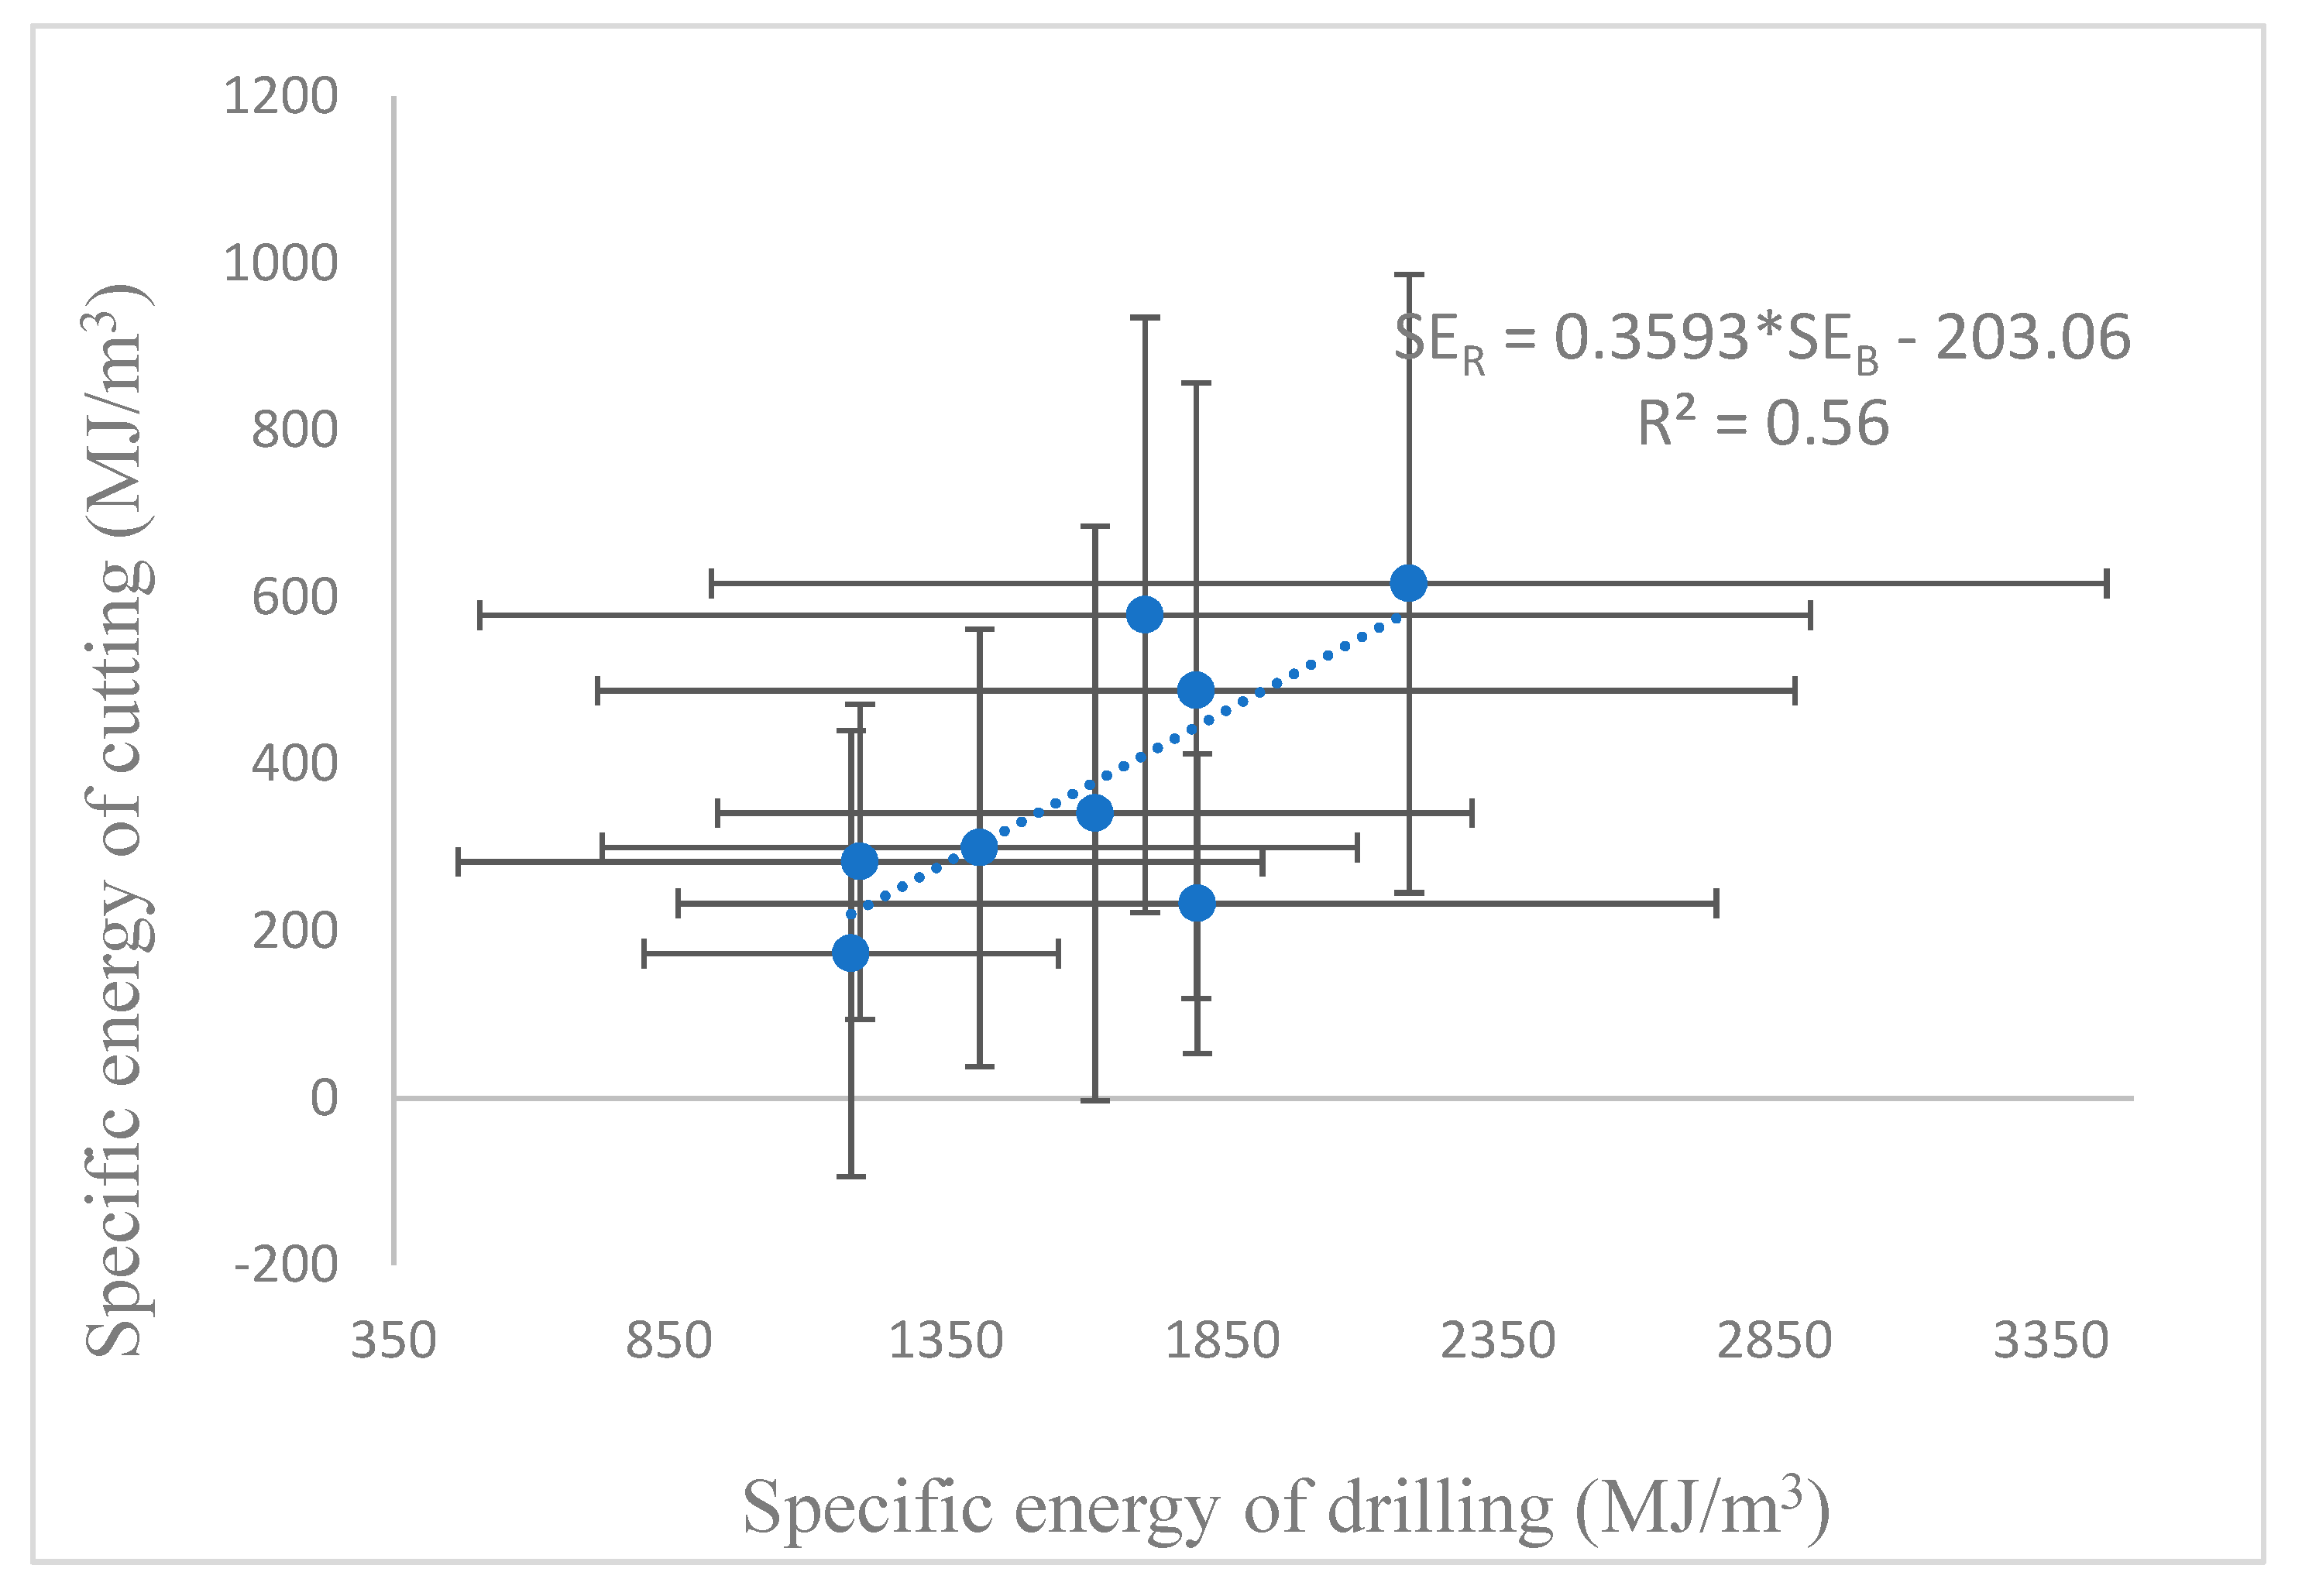
  • The analysis of the measurement uncertainty of the laboratory test results has shown that the power measurement system provides more reliable values compared to the data obtained with the force or torque transducer measurement system. This is evident from Figure 7 and Figure 8, which show the expanded combined standard uncertainty for each type of measurement (in the x and y axes). Both figures show a certain correlation of the measured quantities. In Figure 7, the coefficient of determination is higher than in Figure 8, which is attributed to the smaller experimental error in the electrical power measuring system setup. Future work should focus on reducing the uncertainty components of the measurement setup.
  • The results of laboratory tests and field measurements of specific energies performed on the same group of rocks (Redi) correlate very well, confirming the possibility of using the method for determining specific energy in cutting and drilling rocks in the laboratory and in the field. This indicates that a linear rock cutter and a laboratory drill can be used to simulate the operation of a chain saw and a hydraulic rotary drill. In addition, all measured values of specific cutting and drilling energy can be easily converted from MJ to kwh, allowing easy estimation of energy costs.

Author Contributions

Conceptualization, T.K. (Tomislav Korman) and T.K. (Trpimir Kujundžić); methodology, T.K. (Trpimir Kujundžić) and D.K.; software, D.A., D.K., and T.K. (Tomislav Korman); validation, D.K. and T.K. (Trpimir Kujundžić); formal analysis, D.A. and T.K. (Tomislav Korman); investigation, D.A., D.K., and T.K. (Tomislav Korman); resources, D.K. and T.K. (Trpimir Kujundžić); data curation, D.K.; writing—original draft preparation, D.A. and T.K. (Tomislav Korman); writing—review and editing, D.A., D.K., T.K. (Tomislav Korman), and T.K. (Trpimir Kujundžić); visualization., T.K. (Tomislav Korman); supervision, D.K., T.K. (Trpimir Kujundžić), and T.K. (Tomislav Korman); funding acquisition, T.K. (Trpimir Kujundžić) and D.K. All authors have read and agreed to the published version of the manuscript.

Funding

This research was funded by the Development Fund of the Faculty of Mining Geology, and Petroleum Engineering, University of Zagreb. This work has been supported by the Virtulab project (KK.01.1.1.02.0022), co-funded by the European Regional Development Fund.

Institutional Review Board Statement

Not applicable.

Informed Consent Statement

Not applicable.

Data Availability Statement

Not applicable.

Acknowledgments

The authors would like to thank Mate Babić and other employees of Adriakamen d.o.o. without which it would not be possible to realize the field measurement. We also thank to Ivica Golik from P.S.G. on the fabrication of sensor components for measuring the vertical component of drilling force and torque.

Conflicts of Interest

The authors declare no conflict of interest.

References

  1. Teale, R. The Concept of Specific Energy in Rock Drilling. Int. J. Rock Mech. Min. Sci. Geomech. Abstr. 1965, 2, 57–73. [Google Scholar] [CrossRef]
  2. Inyang, H.I. Developments in Drag Bit Cutting of Rocks for Energy Infrastructure. Int. J. Min. Reclam. Environ. 2002, 16, 248–260. [Google Scholar] [CrossRef]
  3. Rowsell, P.J. Automatic Optimization of Rotary Drilling Parameters. Ph.D. Thesis, Department of Mining Engineering at University of Nottingham, Nottingham, England, UK, 1991. [Google Scholar]
  4. Ersoy, A. Automatic drilling control based on minimum drilling specific energy using PDC and WC bits. Min. Technol. 2003, 112, 86–96. [Google Scholar] [CrossRef]
  5. Akün, M.E.; Karpuz, C. Drillability studies of surface-set diamond drilling in Zonguldak region sandstones from Turkey. Int. J. Rock Mech. Min. Sci. 2005, 42, 473–479. [Google Scholar] [CrossRef]
  6. Balci, C.; Demircin, M.A.; Copur, H.; Tuncdemir, H. Estimation of optimum specific energy based on rock properties for assessment of roadheader performance. J. S. Afr. Inst. Min. Metall. 2004, 104, 633–642. [Google Scholar]
  7. LaBelle, D. Lithological Classification by Drilling. Thesis Proposal, Carnegie Mellon University, Pittsburgh, PA, USA, 2001. [Google Scholar]
  8. Exadaktylos, G.; Stavropoulou, M.; Xiroudakis, G.; de Broissia, M.; Schwarz, H. A Spatial Estimation Model for Continuous Rock Mass Characterization from the Specific Energy of a TBM. Rock Mech. Rock Eng. 2008, 41, 797–834. [Google Scholar] [CrossRef]
  9. Lakshminarayana, C.R.; Tripathi, A.K.; Pal, S.K. Experimental Investigation on Potential Use of Drilling Parameters to Quantify Rock Strength. Int. J. Geo-Eng. 2021, 12, 23. [Google Scholar] [CrossRef]
  10. Copur, H. Linear Stone Cutting Tests with Chisel Tools for Identification of Cutting Principles and Predicting Performance of Chain Saw Machines. Int. J. Rock Mech. Min. Sci. 2010, 47, 104–120. [Google Scholar] [CrossRef]
  11. Korman, T.; Kujundžić, T.; Kuhinek, D. Simulation of Chain Saw Cutting Process with Linear Cutting Machine. Int. J. Rock Mech. Min. Sci. 2015, 78, 283–289. [Google Scholar] [CrossRef]
  12. Korman, T.; Kujundžić, T.; Lukačić, H.; Martinić, M. The Impact of Area and Shape of Tool Cut on Chain Saw Performance. Rud.-Geol.-Naft. Zb. 2016, 31, 1–12. [Google Scholar] [CrossRef]
  13. Romoli, L. Cutting Force Monitoring of Chain Saw Machines at the Variation of the Rake Angle. Int. Int. J. Rock Mech. Min. Sci. 2018, 101, 33–40. [Google Scholar] [CrossRef]
  14. Ersoy, A.; Atici, U. Performance characteristics of circular diamond saws in cutting different types of rocks. Diamond Relat. Mater. 2004, 13, 22–37. [Google Scholar] [CrossRef]
  15. Liu, C.; Zheng, X.; Shahani, N.M.; Li, P.; Wang, C.; Guo, X. An Experimental Investigation into the Borehole Drilling and Strata Characteristics. PLoS ONE 2021, 16, e0253663. [Google Scholar] [CrossRef] [PubMed]
  16. Arbabsiar, M.H.; Farsangi, M.A.E.; Mansouri, H. A new model for predicting the advance rate of a Tunnel Boring Machine (TBM) in hard rock conditions. Rud.-Geol.-Naft. Zb. 2020, 35, 57–74. [Google Scholar] [CrossRef]
  17. Finfinger, G.L.; Peng, S.S.; Gu, Q.; Wilson, G.; Thomas, B. An approach to identifying geological properties from roof bolter drilling parameters. In Proceedings of the 19th International Conference on Ground Control in Mining, West Virginia University, Morgantown, WV, USA, 8–10 August 2000. [Google Scholar]
  18. Mikaeil, R.; Esmailzadeh, A.; Aghaei, S.; Haghshenas, S.S.; Jafarpour, A.; Mohammadi, J.; Ataei, M. Evaluating the sawability of rocks by chain-saw machines using the promethee technique. Rud.-Geol.-Naft. Zb. 2021, 36, 25–36. [Google Scholar] [CrossRef]
  19. Balci, C.; Copur, H.; Bilgin, N.; Ozdemir, L.; Jones, G.R. Cuttability and drillability studies towards predicting performance of mechanical miners excavating in hyperbaric conditions of deep seafloor mining. Int. J. Rock Mech. Min. Sci. 2020, 130, 104338. [Google Scholar] [CrossRef]
  20. Bout, G.; Brito, D.; Gómez, R.; Carvajal, G.; Ramírez, G. Physics-Based Observers for Measurement-While-Drilling System in down-the-Hole Drills. Mathematics 2022, 10, 4814. [Google Scholar] [CrossRef]
  21. Isheyskiy, V.; Sanchidrián, J.A. Prospects of Applying MWD Technology for Quality Management of Drilling and Blasting Operations at Mining Enterprises. Minerals 2020, 10, 925. [Google Scholar] [CrossRef]
  22. Babaei Khorzoughi, M.; Hall, R. Processing of Measurement While Drilling Data for Rock Mass Characterization. Int. J. Min. Sci. Technol. 2016, 26, 989–994. [Google Scholar] [CrossRef]
  23. Mellor, M. Mechanics of Cutting and Boring—Part 2: Kinematic of Axial Rotation Machines; Spec. Rep. 76-16; US Army Cold Regions Research and Engineering Laboratory: Hanover, NH, USA, 1976. [Google Scholar]
  24. Mellor, M. Mechanics of Cutting and Boring—Part 3: Kinematics of Continuous Belt Machines; Spec. Rep. 76-17; US Army Cold Regions Research and Engineering Laboratory: Hanover, NH, USA, 1976. [Google Scholar]
  25. Mellor, M. Mechanics of Cutting and Boring—Part 4: Dynamics and Energetics of Parallel Motion Tools; Spec. Rep. 77-7; US Army Cold Regions Research and Engineering Laboratory: Hanover, NH, USA, 1977. [Google Scholar]
  26. Mellor, M. Mechanics of Cutting and Boring—Part 8: Dynamics and Energetics of Continuous Belt Machines; Spec. Rep. 78-11; US Army Cold Regions Research and Engineering Laboratory: Hanover, NH, USA, 1978. [Google Scholar]
  27. Mellor, M. Mechanics of Cutting and Boring—Part 7: Dynamics and Energetics of Axial Rotation Machines; Spec. Rep. 81-26; US Army Cold Regions Research and Engineering Laboratory: Hanover, NH, USA, 1981. [Google Scholar]
  28. Korman, T. Influence of Constructional and Operational Parameters on Chain Saw Performance. Ph.D. Thesis, Faculty of Mining. Geology and Petroleum Engineering at University of Zagreb, Zagreb, Croatia, 2014. [In Croatian with English Abstract]. [Google Scholar]
  29. Chiaia, B.; Borri-Brunetto, M.; Carpinteri, A. Mathematical modelling of the mechanics of core drilling in geomaterials. Mach. Sci. Technol. 2013, 17, 1–25. [Google Scholar] [CrossRef]
  30. Kuhinek, D.; Zorić, I.; Hrženjak, P. Development of Virtual Instrument for Uniaxial Compression Testing of Rock Samples. Meas. Sci. Rev. 2011, 11, 99–103. [Google Scholar] [CrossRef] [Green Version]
  31. Antoljak, D.; Kuhinek, D.; Korman, T.; Kujundžić, T. Dependency of specific energy of rock cutting on specific drilling energy. Rud.-Geol.-Naft. Zb. 2018, 33, 23–32. [Google Scholar] [CrossRef]
  32. Antoljak, D. Dependence of Rock Cutting Specific Energy on the Specific Energy of Drilling. Ph.D. Thesis, Faculty of Mining. Geology and Petroleum Engineering at University of Zagreb, Zagreb, Croatia, 2020. [In Croatian with English Abstract]. [Google Scholar]
  33. Schrand, D. Cross-Talk Compensation Using Matrix Methods. Sens. Transducers. 2007, 79, 1157–1163. [Google Scholar]
  34. Maurer, W.C. The state of rock mechanics knowledge in drilling. In Proceedings of the 8th U.S. Symposium on Rock Mechanics (USRMS), Minneapolis, MN, USA, 15–17 September 1966. [Google Scholar]
  35. Gertsbakh, I. Measurement Theory for Engineers, 1st ed.; Springer: Berlin/Heidelberg, Germany, 2003. [Google Scholar] [CrossRef]
  36. Cruz de Oliveira, E.; Fernandes de Aguiar, P. Least squares regression with errors in both variables: Case studies. Quim Nova. 2013, 36, 885–889. [Google Scholar] [CrossRef] [Green Version]
Figure 1. (a) Chain saw; (b) Hydraulic rotary drill; (c) Cutting tool; (d) Natural diamond core bit.
Applsci 13 02280 g001
Figure 2. (a) Electrical power measuring system; (b) Measuring system with a force transducer and a measuring system with a force and torque transducer; (c) Chainsaw tool holder and cutting tool; (d) Synthetic diamonds in drilling bit segment.
Applsci 13 02280 g002
Figure 3. Diagram of the dependence of the horizontal component of the cutting force of one cutting element on time.
Applsci 13 02280 g003
Figure 4. Diagram of the dependence of the total power of the electric motor on time.
Applsci 13 02280 g004
Figure 5. Kinematic parameters of a chain saw [24].
Applsci 13 02280 g005
Figure 6. Diagram of the dependence of the specific cutting energy on the effective depth of cut.
Applsci 13 02280 g006
Figure 7. Diagram of the dependence of the specific rock cutting energy on the specific drilling energy (electrical power measuring system) by groups.
Applsci 13 02280 g007
Figure 8. Diagram of the dependence of the specific rock cutting energy on the specific drilling energy (measuring system with force and torque transducer) by groups.
Applsci 13 02280 g008
Figure 9. Presentation of the field measurement of specific energies with laboratory measurements by groups.
Applsci 13 02280 g009
Table 1. The most important kinematic and dynamic quantities of chain saw and rotary drill.
Kinematic QuantitiesUnitChain SawRotary Drill
The path resultant of the cutting element sM v t · t · 1 + U v t 2 r · Θ · 1 + U v t 2
The speed resultant of the cutting element vm/s v t · 1 + U v t 2 ω · r · 1 + U v t 2
Dynamic Quantities Chain SawRotary Drill
Horizontal component of the cutting or drilling force of one cutting element FcN k c · h w r w a k c · h w r w a
Vertical component of the cutting or drilling force of one cutting element FnN k n · h w r w b k n · h w r w b
The cutting or drilling force resultant of one cutting element R’N F c 2 + F n 2 F c 2 + F n 2
Torque of one cutting element MNmnot applicable F c · r
Horizontal component of cutting or drilling force FCN F c F c
Vertical component of the cutting or drilling force FNN F n F n
Resultant of total cutting or drilling force RN F C 2 + F N 2 F C 2 + F N 2
Torque MNmnot applicable F c · r
vt = chain saw cutting chain speed (m/s), U = cart speed rate (m/s), t = time (s), r = radius or distance of the exposed diamond grain from the axis of rotation (m), Θ = angle of rotation of the diamond grain in the xy plane (°), ω = angular velocity (s−1), hw = effective cutting depth (m), rw = radius of curvature of the tip of the cutting element (m), kc, kn, a’, b’ = experimental constants.
Table 2. Characteristics of rock samples.
Sampling Location (Exploitation Field)KanfanarRediŽaganj Dolac
Rock Type/the Name of the Rock SampleOncolytic LimestoneRecrystallized Organic LimestoneRudist Limestone
Roof Layer ARoof Layer BRoof Layer E/FRoof Layer GRoof Layer HRoof Layer IRediRasotica
Rock sample designation21, 22, 2324, 25, 2604, 05, 0906, 07, 1003, 08, 11, 13, 14, 1501, 02, 1200, 19, 2016, 17, 18
Bulk density (kg/m3)26832688250523082507262625512655
Table 3. The characteristics of a chain saw and a hydraulic rotary drill.
Chain Saw
TypePellegrini Ch-60
Voltage380(V)
Frequency50(Hz)
Total power37(kW)
Dimensions (Length × Width × Height)1.8 × 2.0 × 1.4(m)
Blade length4.25(m)
Weight (without rails)6500(kg)
Speed of cutting chain0–1.4(m/s)
Length of cutting segments1.028(m)
Width of cutting segments0.4(m)
Cutting tool materialTungsten carbide
Tool dimensions (Length × Width × Height)12.7 × 12.7 × 6.5(mm)
Hydraulic Rotary Drill
TypeLochtmans LGR FAST65
Power of rotation3420(W)
Hydraulic power1500(W)
Maximum current9.5(A)
Voltage230(V)
Frequency50(Hz)
Number of rotations—idle (load)1st gear350 (230)(min−1)
2nd gear800 (520)(min−1)
3rd gear1475 (965)(min−1)
Average rate of penetration0.50(m/min)
Working pressure of hydraulic aggregate110/120(bar)
Volume of hydraulic oil tank20(L)
Drilling rig height1000(mm)
Weight210(kg)
Dimensions (Length × Width × Height)700 × 550 × 2000(mm)
Type of drilling bitNatural diamond core bit
Outer (inner) diameter of drilling bit50 (44)(mm)
Table 4. Presentation of measurement results of specific cutting and drilling energies (both measuring systems) with corresponding measurement uncertainties.
Group No.GroupSpecific
Cutting
Energy
Expanded Measurement UncertaintySpecific Drilling
Energy
Expanded
Measurement
Uncertainty
Specific Drilling
Energy
Expanded Measurement Uncertainty
Electrical Power Measuring
System
Measuring System with Force and Torque Transducer
(MJ/m3)(MJ/m3)(%)(MJ/m3)(MJ/m3)(%)(MJ/m3)(MJ/m3)(%)
1Redi. Trogir233.04±179.0578.581919.37±24.871.321805.12±939.5153.96
2Rasotica. Brač283.15±188.4864.591176.59±15.461.311194.67±728.2061.03
3Roof layer A. Kanfanar616.52±370.7659.122285.05±28.781.262188.48±1263.2157.7
4Roof layer B. Kanfanar578.73±356.7661.642339.06±28.121.21710.3±1204.6171.01
5Roof layer E/F. Kanfanar299.9±262.0892.561391.6±17.421.31411.14±683.9248.94
6Roof layer G. Kanfanar173.39±267.01164.43951.53±11.021.161178.39±374.5132.53
7Roof layer H. Kanfanar341.34±344.05102.061461.67±17.601.21619.83±682.8246.84
8Roof layer I. Kanfanar488.26±368.6174.711965.91±27.291.391803.06±1083.5762.84
Average value376.79±292.1087.211686.35±21.321.271613.87±870.0454.36
Minimum value173.39179.0559.12951.5311.021.161178.39374.5132.53
Maximum value616.52370.76164.432339.0628.781.392188.481263.2171.01
Standard deviation164.1679.2634.64514.666.760.08341.92305.2611.76
Note: In all the calculation cases of the expanded measuring uncertainty k = 2. p = 95%; where: k = coverage factor; p = level of confidence.
Table 5. Comparison of measuring systems.
IndicatorElectrical Power Measuring SystemMeasuring System with Force Transducer/Measuring System with Force and Torque Transducer
Sensitivity at shallow cutting depthslowhigh
Applicabilitylaboratory/field 1laboratory
Complexitylowhigh
Reliabilityhighlow
Measuring uncertaintylowhigh
Note: 1 including a possible combination of current or voltage transformers and pressure sensors.
Disclaimer/Publisher’s Note: The statements, opinions and data contained in all publications are solely those of the individual author(s) and contributor(s) and not of MDPI and/or the editor(s). MDPI and/or the editor(s) disclaim responsibility for any injury to people or property resulting from any ideas, methods, instructions or products referred to in the content.

