Article

Experimental Investigation of High-Viscosity Conductive Pastes and the Optimization of 3D Printing Parameters

School of Mechanical Engineering, Guangxi University, Nanning 530004, China
*
Author to whom correspondence should be addressed.
Appl. Sci. 2023, 13(4), 2389; https://doi.org/10.3390/app13042389
Submission received: 12 January 2023 / Revised: 9 February 2023 / Accepted: 9 February 2023 / Published: 13 February 2023
(This article belongs to the Section Applied Industrial Technologies)

Abstract

:
Traditional contact printing technology is primarily controlled by the shape of the mask to form the size, while for the more popular non-contact printing technologies, in recent years, adjusting the print parameters has become a direct way to control the result of the printing. High-viscosity conductive pastes are generally processed by screen printing, but this method has limited accuracy and wastes material. Direct-write printing is a more material-efficient method, but the printing of high-viscosity pastes has extrusion difficulties, which affects the printed line width. In this paper, we addressed these problems by studying the method of printing high-viscosity conductive paste with a self-made glass nozzle. Then, by parameter optimization, we achieved the minimum line width printing. The results showed that the substrate moving speed, the print height, and the feed pressure were the key factors affecting the line width and stability. The combination of the printing parameters of 0.6 MPa feed pressure, 200 mm/s substrate moving speed, and 150 μm print height can achieve a line width of approximately 30 μm. In addition, a mathematical model of the line width and parameters was established, and the prediction accuracy was within 5%. The results and the prediction model of the parameters provide an important reference for the printing of high-viscosity pastes, which have immense potential applications in electronics manufacturing and bioprinting.

1. Introduction

Conductive pastes are widely used in general electronic components, including the front electrodes of photovoltaic modules [1], the circuits of flexible electrodes [2], transparent electrodes [3], printed circuit boards (PCBs) [4], multilayer chip ceramic capacitors [5], the inorganic non-metallic substrates of new energy storage devices [6], etc. Traditional forming methods for conductive paste with a high viscosity are mainly screen-printing-based contact forming; this method has high requirement on the flatness of the substrate and wastes a lot of conductive paste [7,8,9,10,11]. Non-contact forming methods can effectively avoid these problems [12].
Non-contact forming methods include Electrohydrodynamic Jet Printing (E-Jet Printing) [13], Light-Induced Plating [14], Ink-Jet Printing [15], and Buried Contact Solar Cells (BCSC) [16]. Different processing methods are suitable for different materials. E-Jet Printing and Ink-Jet Printing can print structures on the micron or even nanometer scale, but they are only suitable for specific fluids. Light-Induced Plating and BCSC are highly accurate, but the processing steps are complicated and inefficient.
Different from general non-Newtonian fluids that do not contain solid particles, conductive paste has the characteristics of high viscosity, a high solid content, and poor fluidity [17], and so it is difficult for it to be extruded from a small nozzle. To solve this problem, Mette [18] used a metal aerosol jet printing method to deposit metal aerosol onto the substrate by using the gas flow focusing principle, avoiding contact between the aerosol and the nozzle tip. Mette used an approximately 200 μm nozzle outlet to obtain the first layer of 50–140 μm, and then used Light-Induced Silver Plating to obtain the second layer. The width of the contact fingers increased by approximately 20–30 μm. However, the contact between the first and second layers was sometimes not strong enough to meet the requirements, and the processing steps were tedious, resulting in low efficiency and difficulty with commercializing. Direct-ink writing (DIW) is an extrusion 3D printing technology that has the advantages of simple installation, convenient operation, and a wide selection of printing materials [19]. DIW technology can achieve relatively smooth extrusion for conductive pastes. Gerdes et al. [20] created a StarJet for solar cell metallization processes, and their print head was used to eject jets of molten metal with diameters as small as 50 µm to print fingers of a 70 µm minimal width, but this method is not yet as fine as screen printing. M Beutel et al. [21,22] designed a printing nozzle that co-extruded metal paste between two layers of sacrificial layer materials, and the sacrificial layer could be completely removed in subsequent processing. The size of the nozzle was approximately 220 μm and the line width was approximately 50 μm. However, the design of the nozzle was too complex and the flow balance between the metal paste in the middle and the sacrificial layer on both sides was difficult to control, which may have been the reason why this method was not widely adopted. Recently, M. Pospischil [23,24,25] designed and processed a print head with 50 integrated ceramic nozzles to achieve the fast and efficient printing of conductive pastes, and this print head is currently at the world-leading level. They used a group-dispenser with D = 20 μm sized nozzle openings, with corresponding finger widths of 17 μm. However, the influence of printing parameters on the quality of paste formation and the prediction of printing results requires more study.
Generally, conductive paste has a high viscosity and a high internal solid particle content. It often faces the problem of clogging during the printing process, and so the related experiments have higher requirements than usual for the nozzle. The glass nozzle used in this paper can effectively solve this problem, and it enables the efficient and fast forming of fine lines using conductive pastes. The extrusion model of the printing process was established, and the direct connection between each parameter and the line width was quantitatively studied by mechanical analysis. The process of thin paste-pulling between the tip and the substrate due to the speed difference was also studied, and the exit flow rate was calculated by an equation. Finally, the correspondence between the forming line width and each printing parameter, without pulling off the paste, was derived to control the line width by changing the parameters and providing a technical reference for the future high-precision printing of higher-viscosity and high-solid-content fluids (e.g., the direct printing of human bones, etc.).

2. Materials and Methods

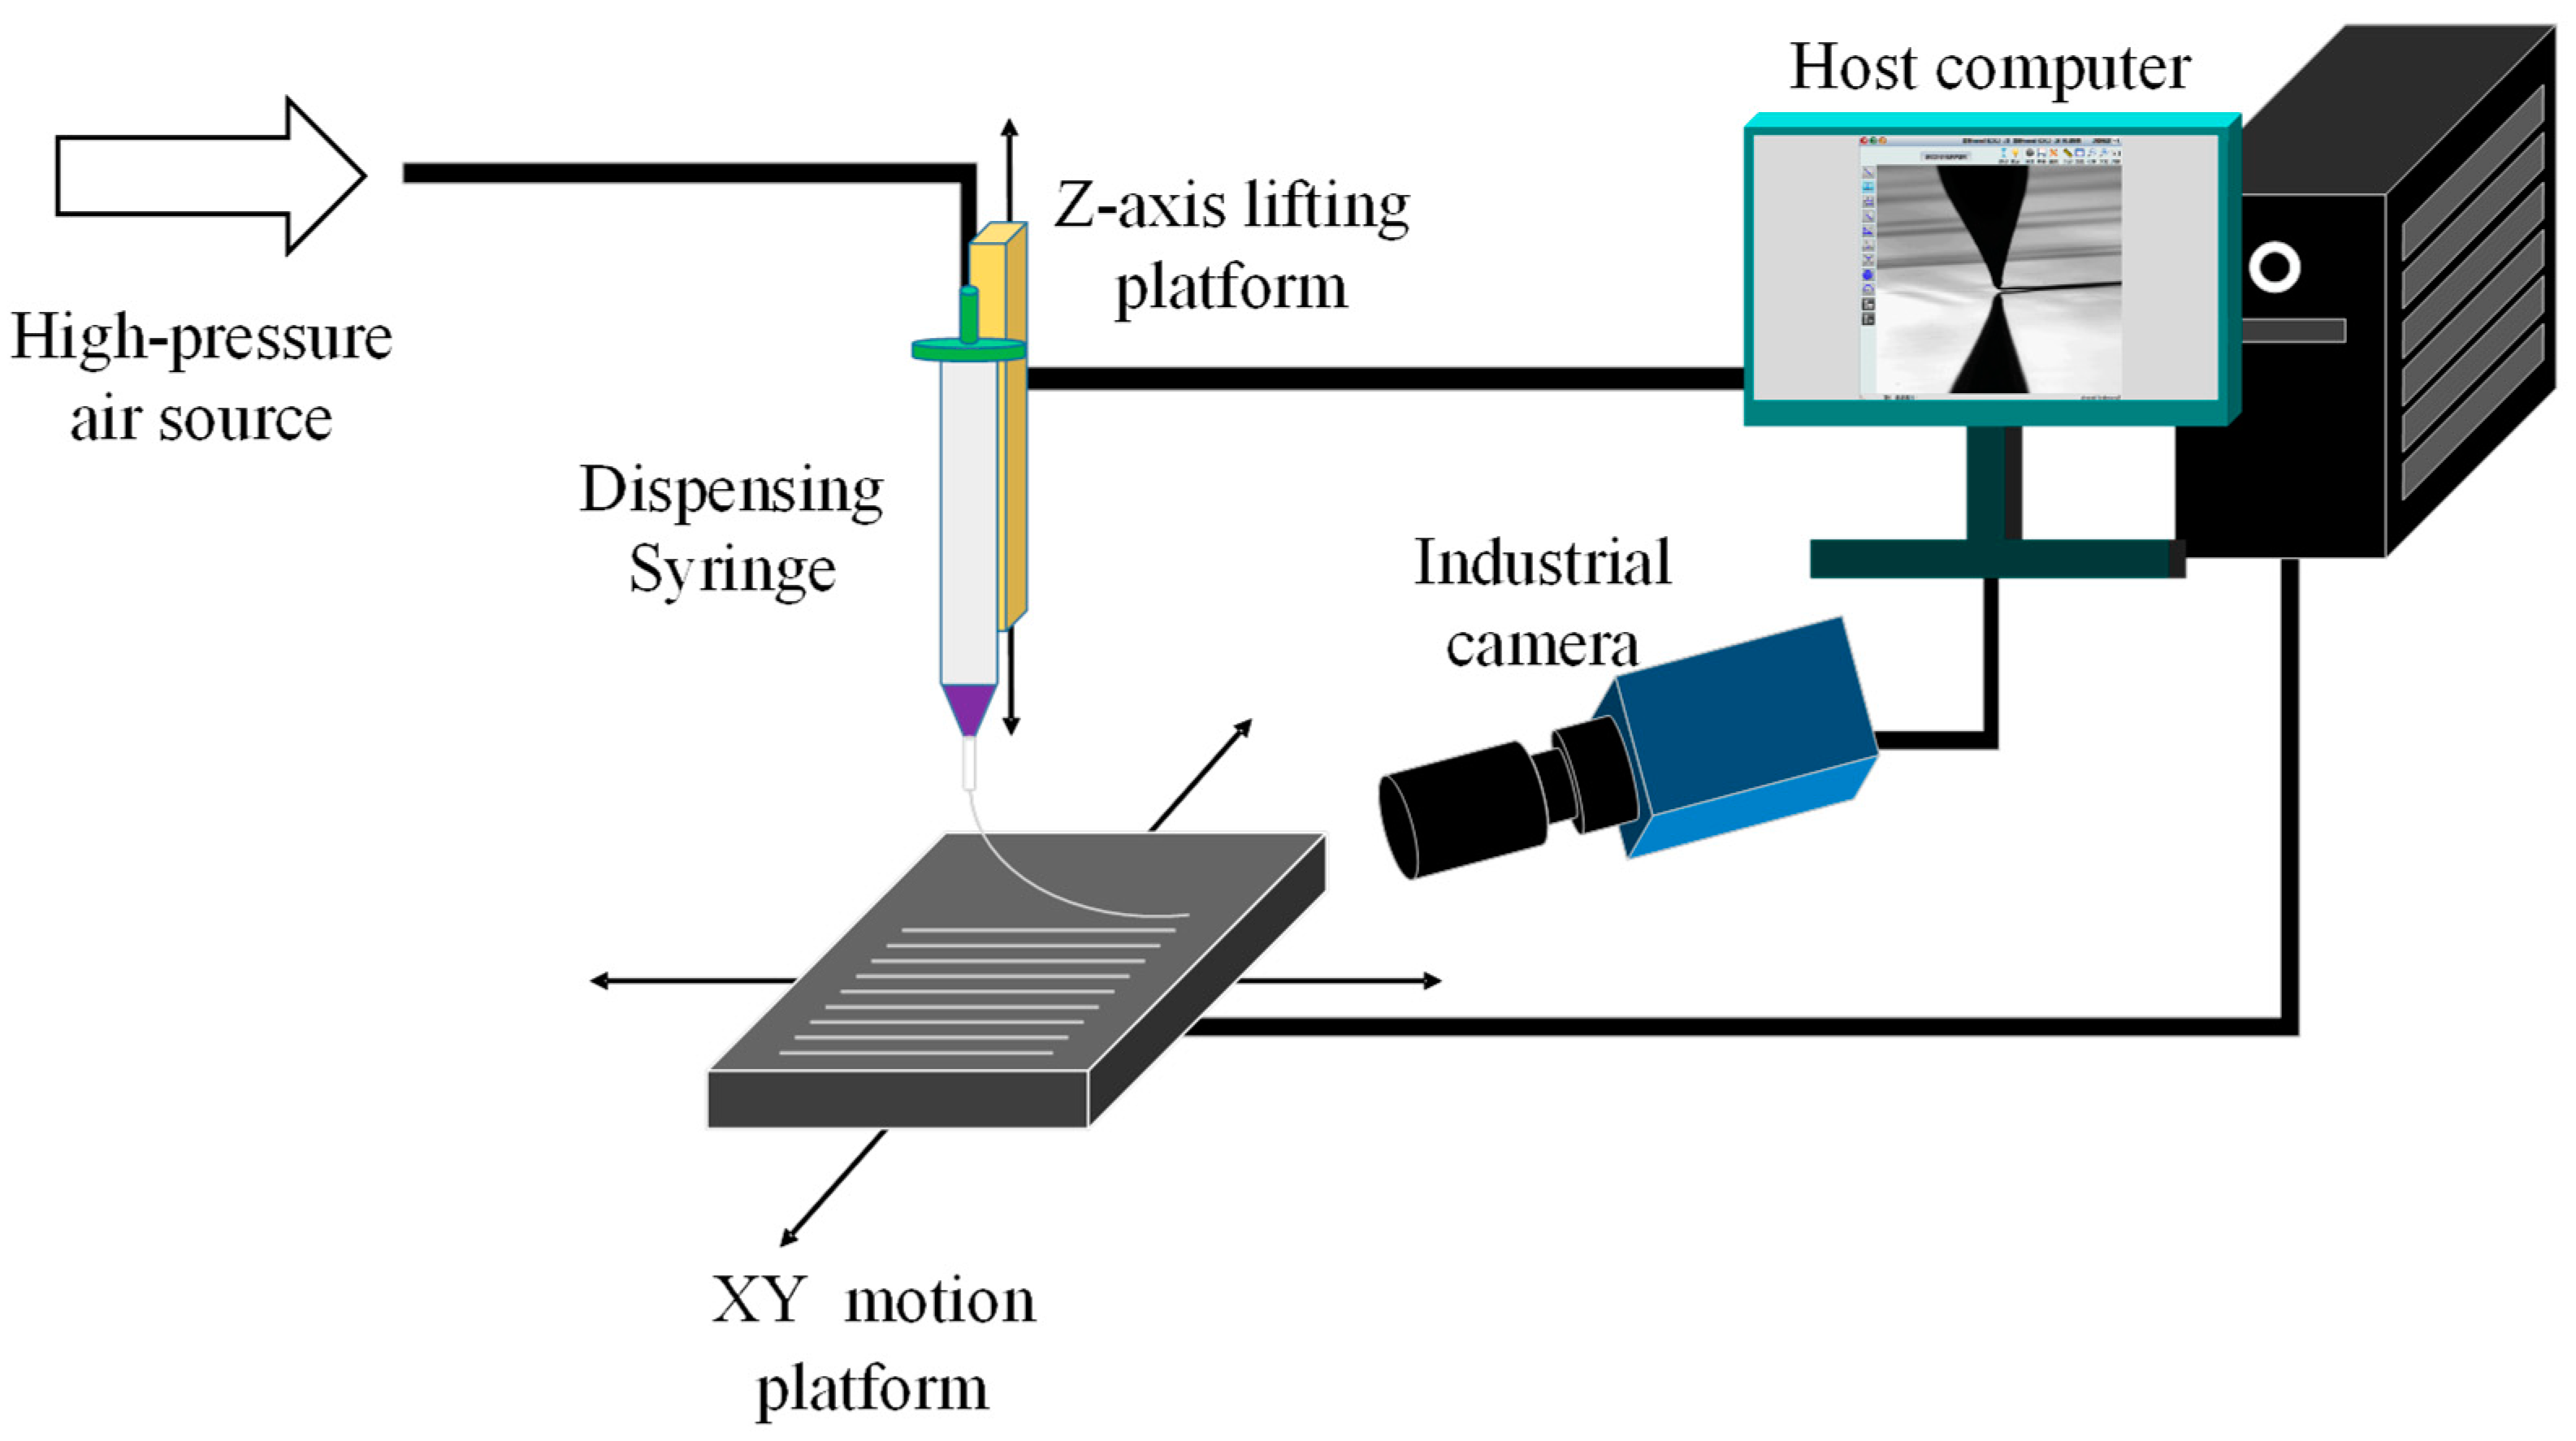
2.1. Device Platform Introduction

The high-viscosity conductive paste direct-write printing experimental platform used in this paper is based on the YiJie printing device (EHDJet-H, SYGOLE, Guangdong, China). The entire experimental printing platform is shown in Figure 1. The experimental platform consists of a camera observation system, a motion control system, a paste extrusion system, and other components. The motion control is realized by the XY motion platform, the Z-axis lifting platform, and the supporting host computer. The speed range of the XY motion platform is 0~200 mm/s, the minimum movement accuracy in the XY direction is 0.05 mm, and the minimum movement accuracy in the Z direction is 0.01 mm. The paste extrusion system uses a pressurized dispensing syringe with a printing nozzle fixed on the Z-axis platform. It is supplied with a high-pressure air source with a maximum of 0.8 MPa, and it is equipped with a pressure regulating valve, which can achieve precise and stable control of the output feed pressure. An industrial camera built into the system accurately measures the actual height of the nozzle tip to the substrate, and it monitors the extrusion status of the paste at the nozzle outlet, as well as the stretching process of printing onto the substrate in real time.

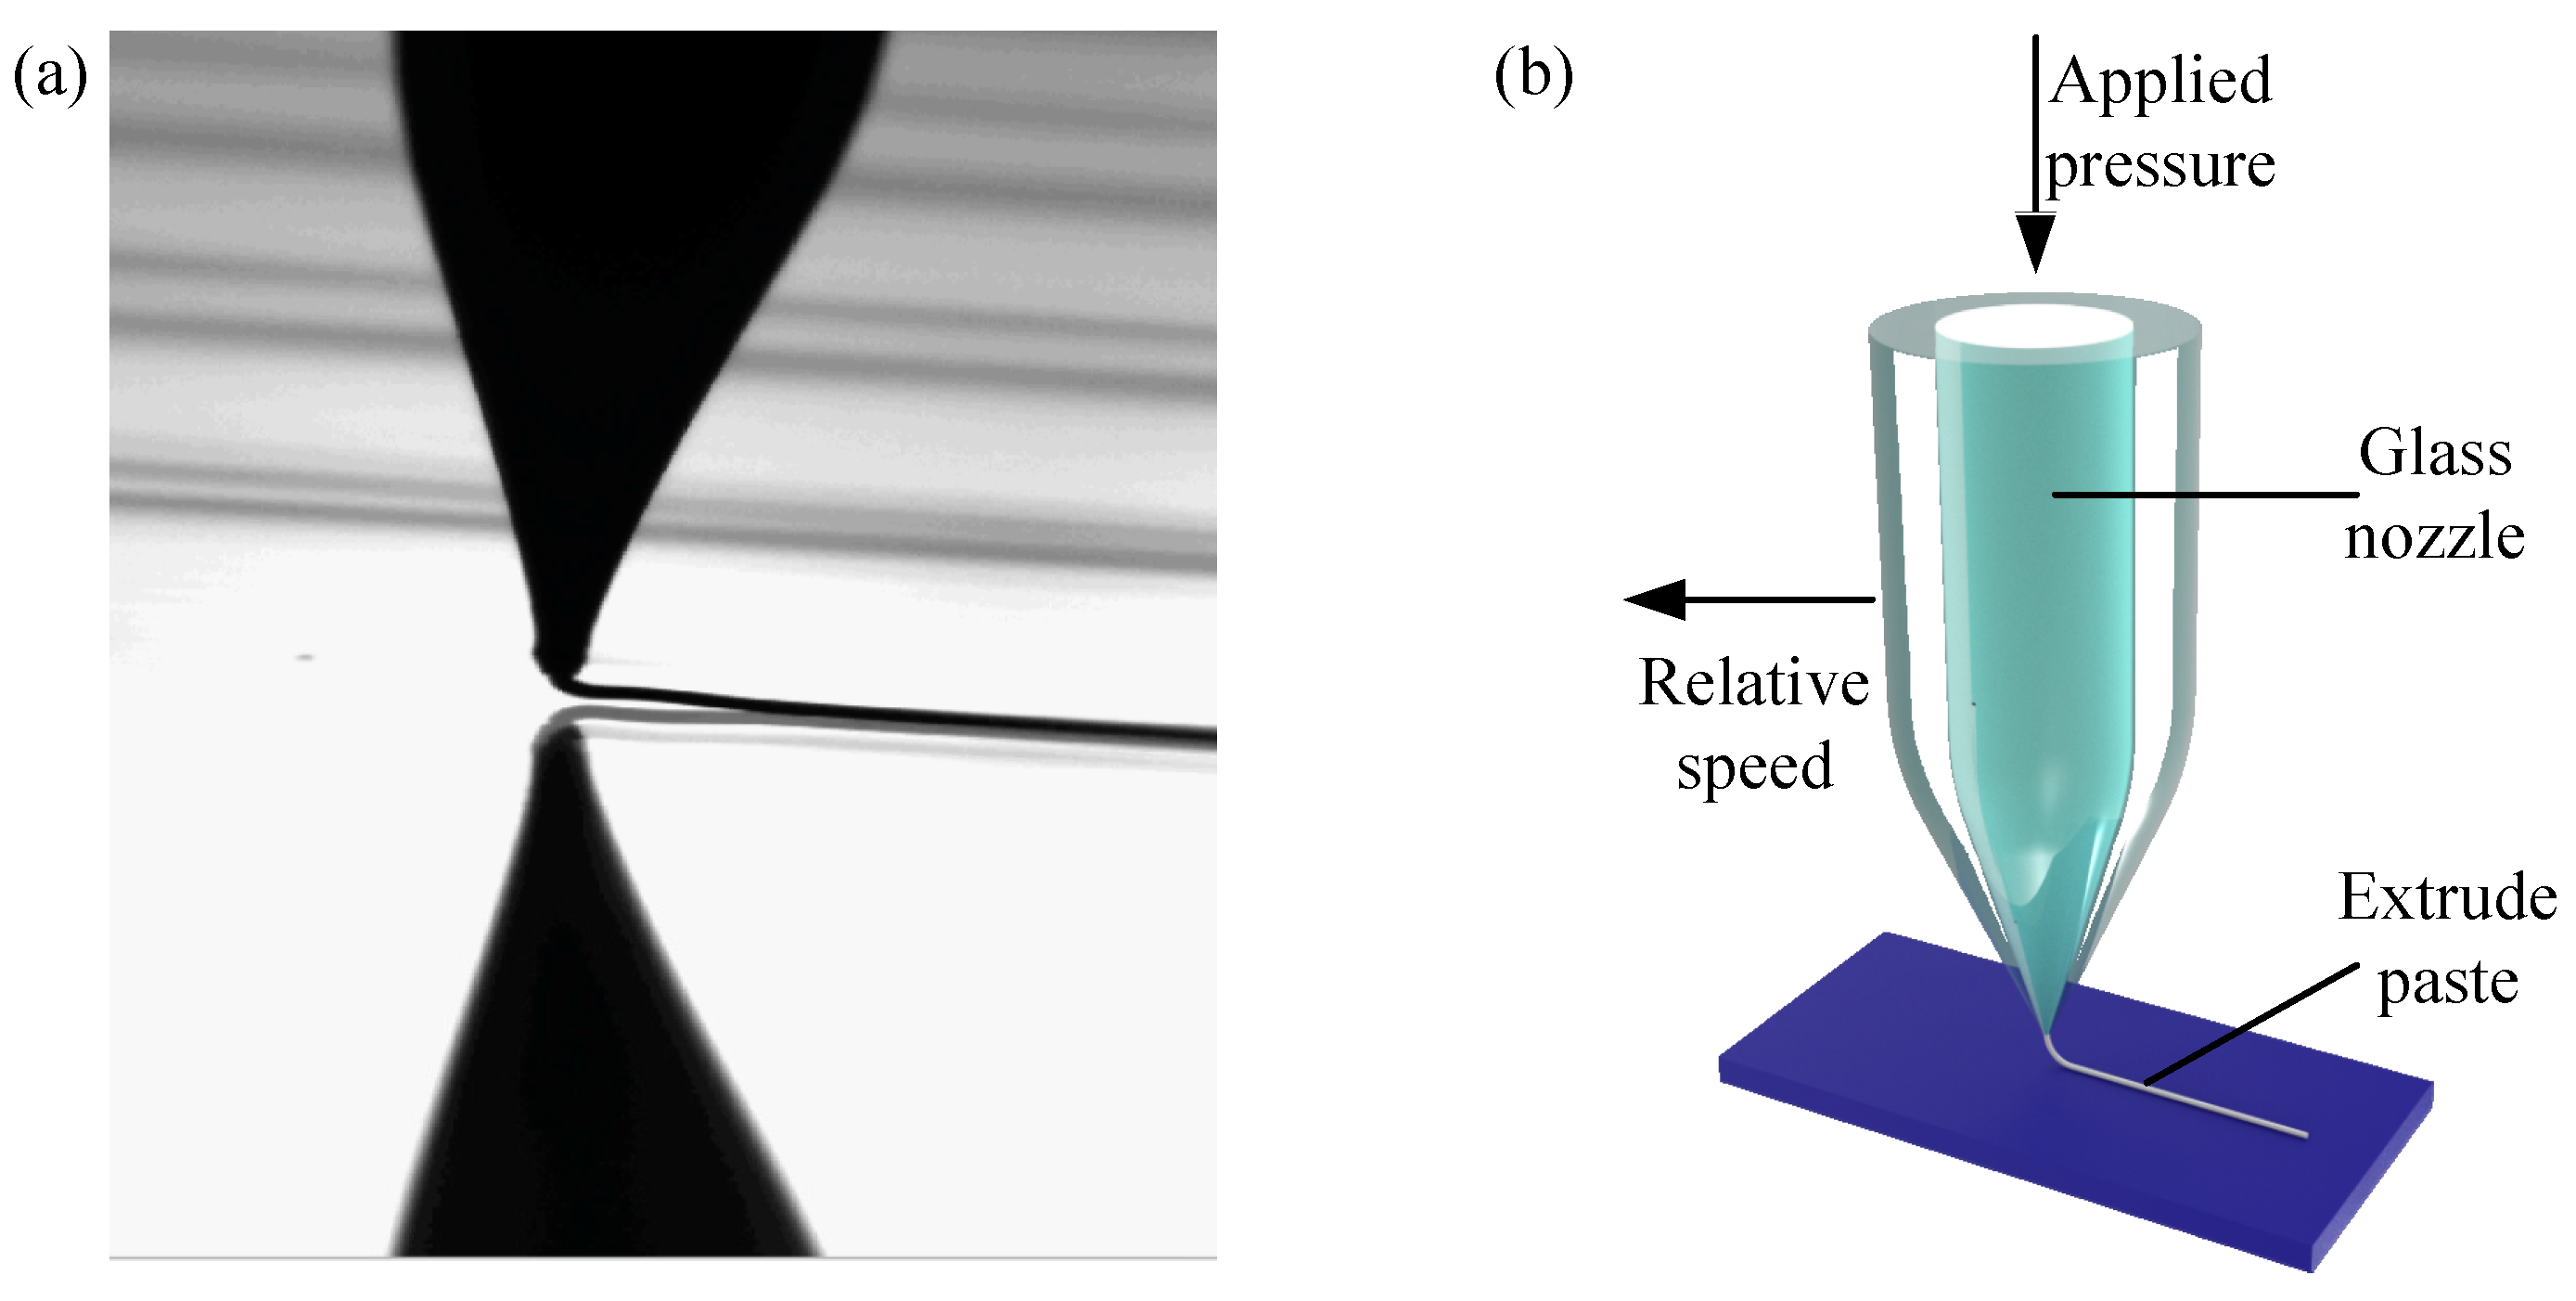
2.2. Printing Glass Nozzle Preparation

The raw material of the nozzle used in this paper is a glass capillary with an outer diameter of 1 mm and an inner diameter of 600 μm. As shown in Figure 2, the glass nozzle was fabricated by pulling the glass capillary using a micropipette puller (P1000; Sutter Instrument, Novato, CA, USA). The micropipette puller can control the shape and diameter of the glass nozzle through pulling parameters that include heat, pull, velocity, delay, and pressure. Table 1 shows the required parameters for fabricating the glass nozzle with a 56 ± 5 μm tip inner diameter. The glass nozzle was connected to a 24 G dispensing steel needle with an outer diameter of 540 μm and an inner diameter of 320 μm.

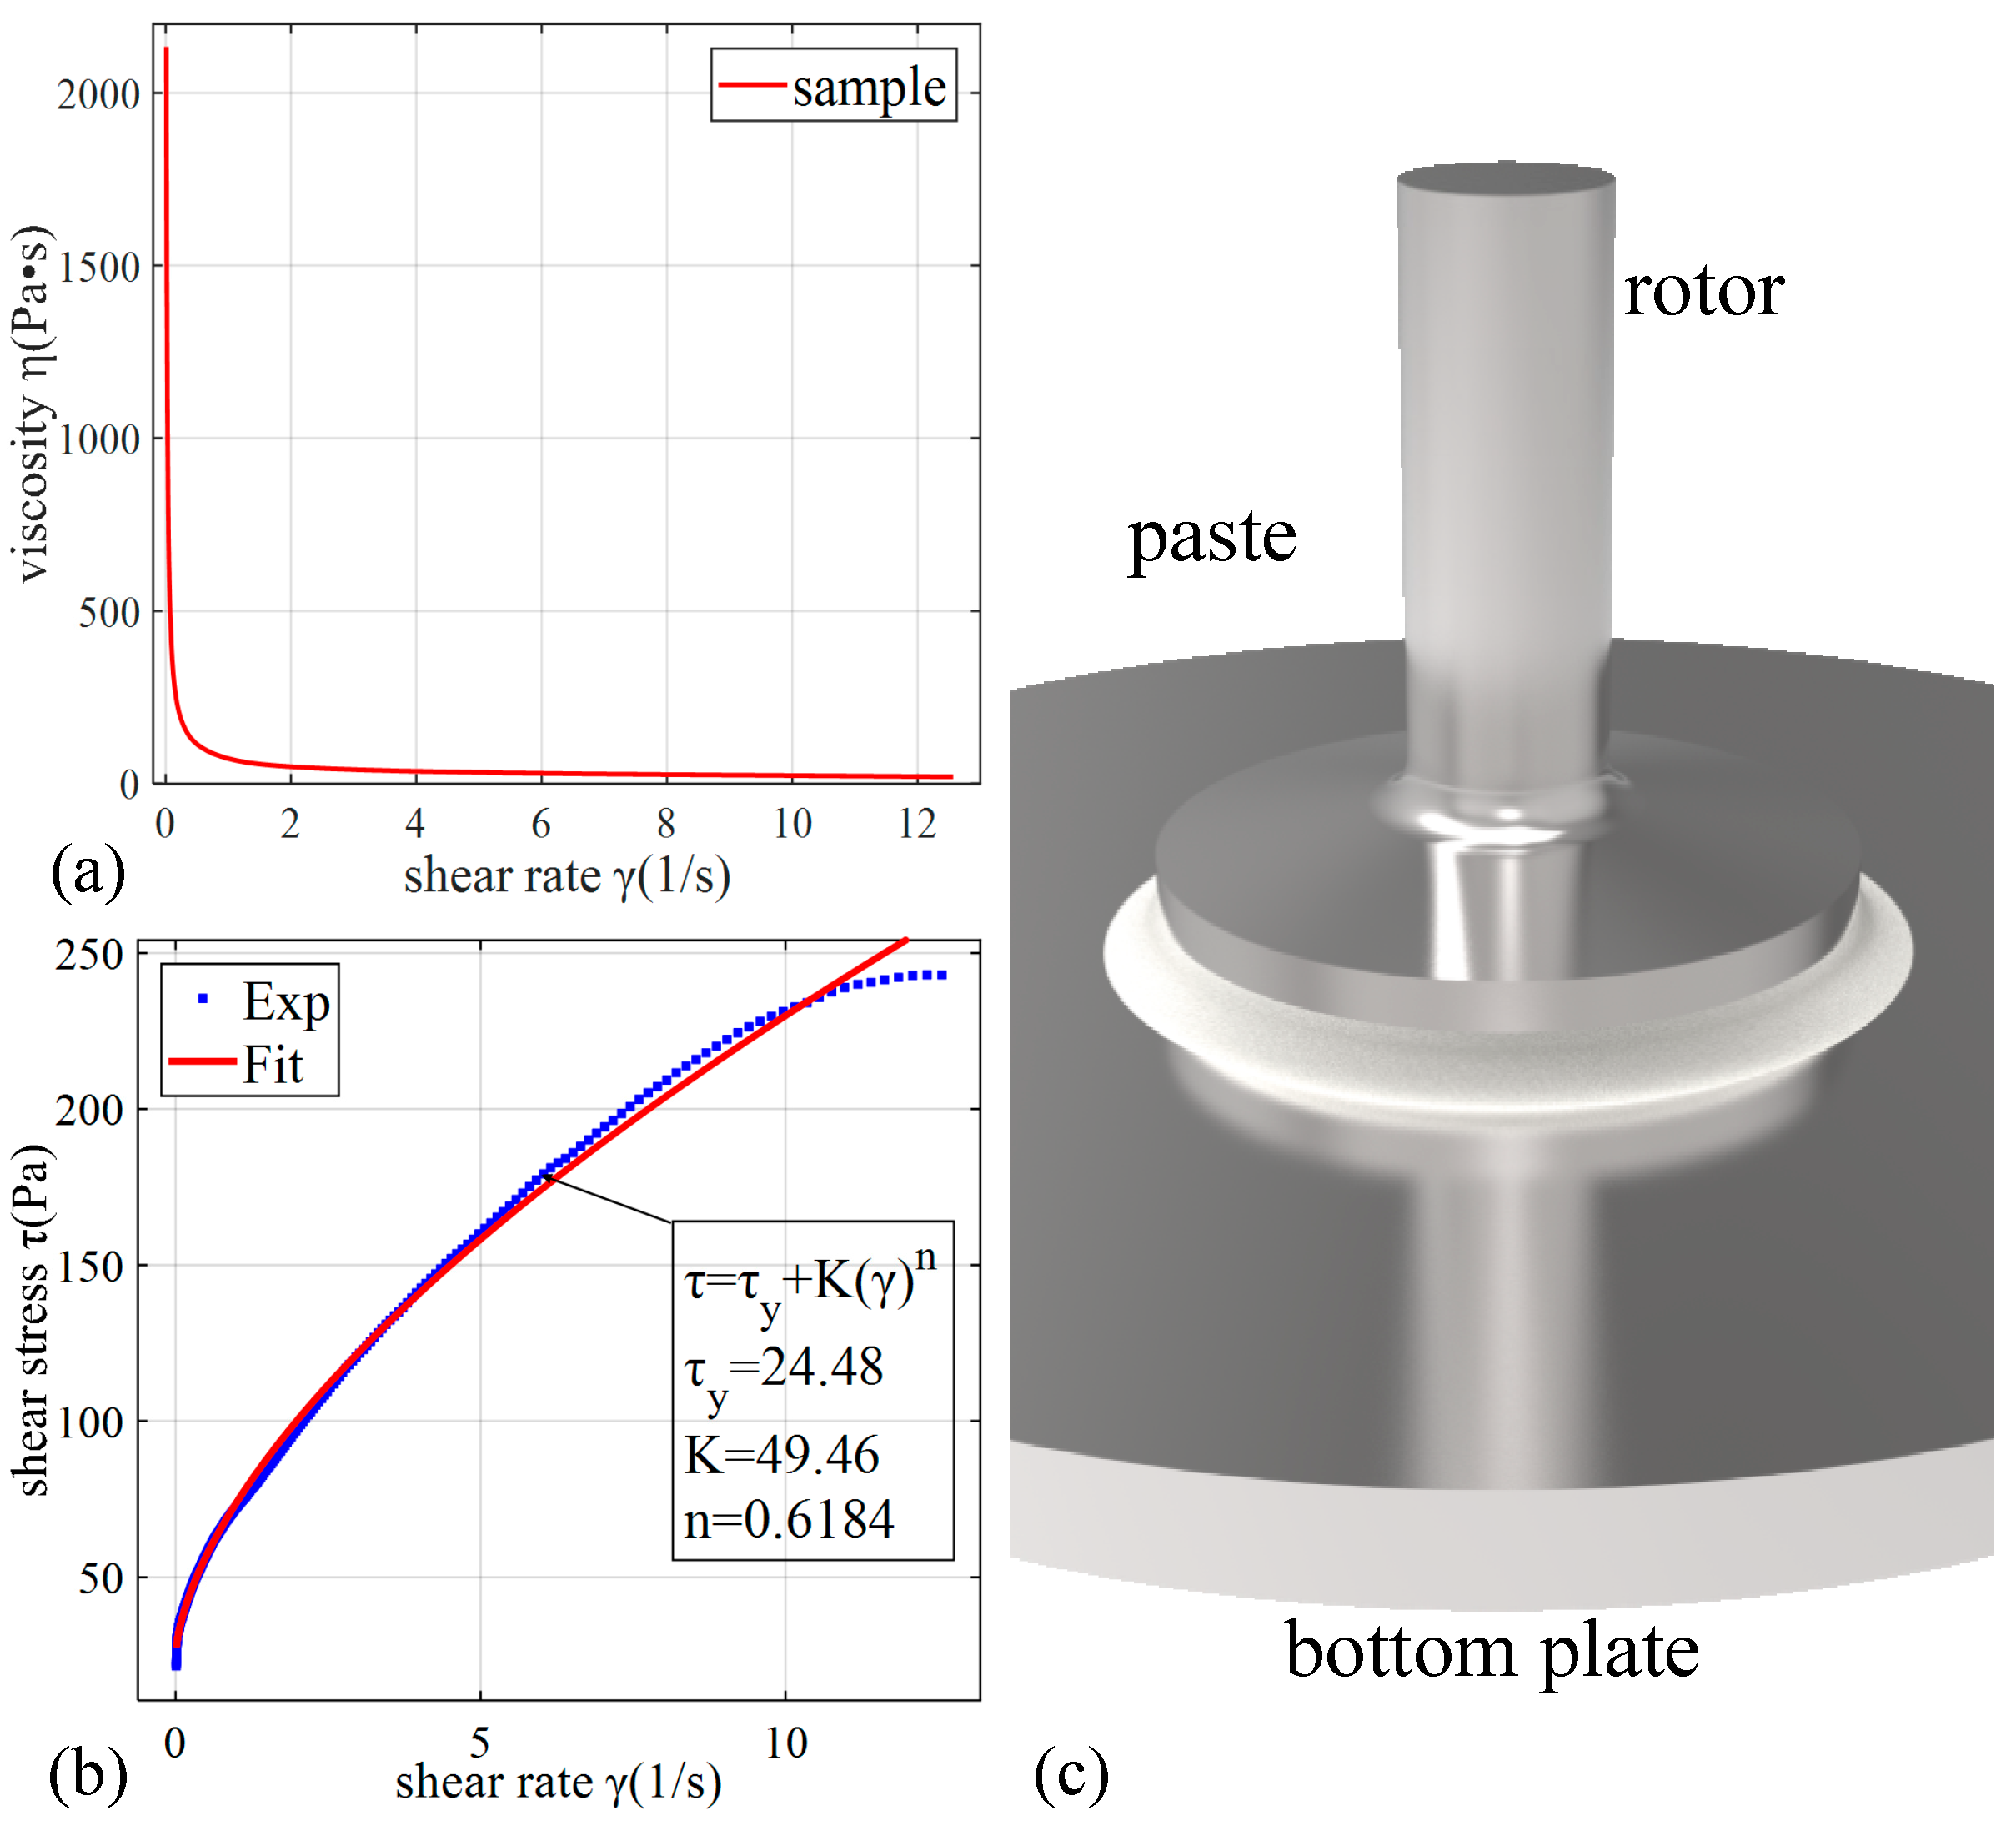
2.3. Rheological Properties of the Conductive Paste

The conductive paste used in this study is commercial Ag paste used for screen printing. It is a non-Newtonian fluid with a shear thinning property. According to Mueller’s research [26], the dynamic properties of this fluid can be characterized using the Herschel–Bulkley (H-B) model, whose constitutive equation is shown in Equation (1) below:
τ = τ y + K ( γ ˙ ) n
where τ is the shear stress, τ y   is the yield shear stress, K is the consistency coefficient, γ ˙ is the shear strain rate, and n is the rheological index.
The fitting curves were collated to obtain the approximate values of the yield shear stress τ y , the rheological index   n , and the consistency coefficient K for the experimentally used conductive pastes, as displayed in Table 2. The specific fitting process is shown in Appendix A, Figure A1.

3. Results and Discussion

The research steps in this paper are mainly in the flow chart shown in Figure 3:

3.1. Printing Orthogonal Experimental Designs

In the paste printing experiment, the print line width was adjusted by changing three parameters: substrate moving speed, print height, and feed pressure. The three parameters could take effect separately and influence each other. The feed pressure directly determined the flow rate of the nozzle outlet, the substrate moving speed primarily affected the degree of stretching of the paste, and the print height was closely related to the stability of the printing process. Figure 4 schematically illustrates the photo and schematic diagram of the printing process.
The orthogonal test method was used to carry out the paste printing experiment. The above-mentioned feed pressure P, print height H, and substrate moving speed v, which had a great influence on the line width, were selected as the influencing factors of the experiment. Each factor had three levels, and the specific values of the levels of each experimental influencing factor are shown in Table 3.
In the orthogonal test, the average line width of the paste printed on the substrate was taken as the investigation index. According to the specific requirements of the experiment, the L 9 ( 3 4 ) orthogonal table was used for the test. The final designed orthogonal test scheme and the nine groups of printing experimental results carried out according to this scheme were recorded, and they are listed in Table 4. Except for the three parameters, the rest of the experimental parameters used the default values.
In order to determine the degree of influence of the influencing factors on the investigation index, the corresponding range analysis was carried out for the experimental results in Table 4, and the range analysis results of each parameter on the printing line width are summarized in Table 5, where K i represents the sum of the corresponding index values at the ith level of this column of factors, k i represents the average value of the index results corresponding to the ith level of this column of factors, and R represents the range value corresponding to each column of factors.
The size of the range R determined the primary and secondary influence of each factor on the experimental index. The larger the value, the greater the influence of the factor on the index. According to the data analysis in Table 5, the range R values corresponding to the feed pressure, print height, and substrate moving speed were 19.20 μm, 8.58 μm, and 25.02 μm, respectively. Therefore, it could be intuitively concluded that in this experiment, the three factors’ influences on the line width, from high to low, were v > P > H, where v and P are the primary factors and H is the secondary factor. The optimal combination of parameters was P1H3v3, i.e., 0.6 MPa feed pressure, 200 μm print height, and 150 mm/s substrate moving speed.

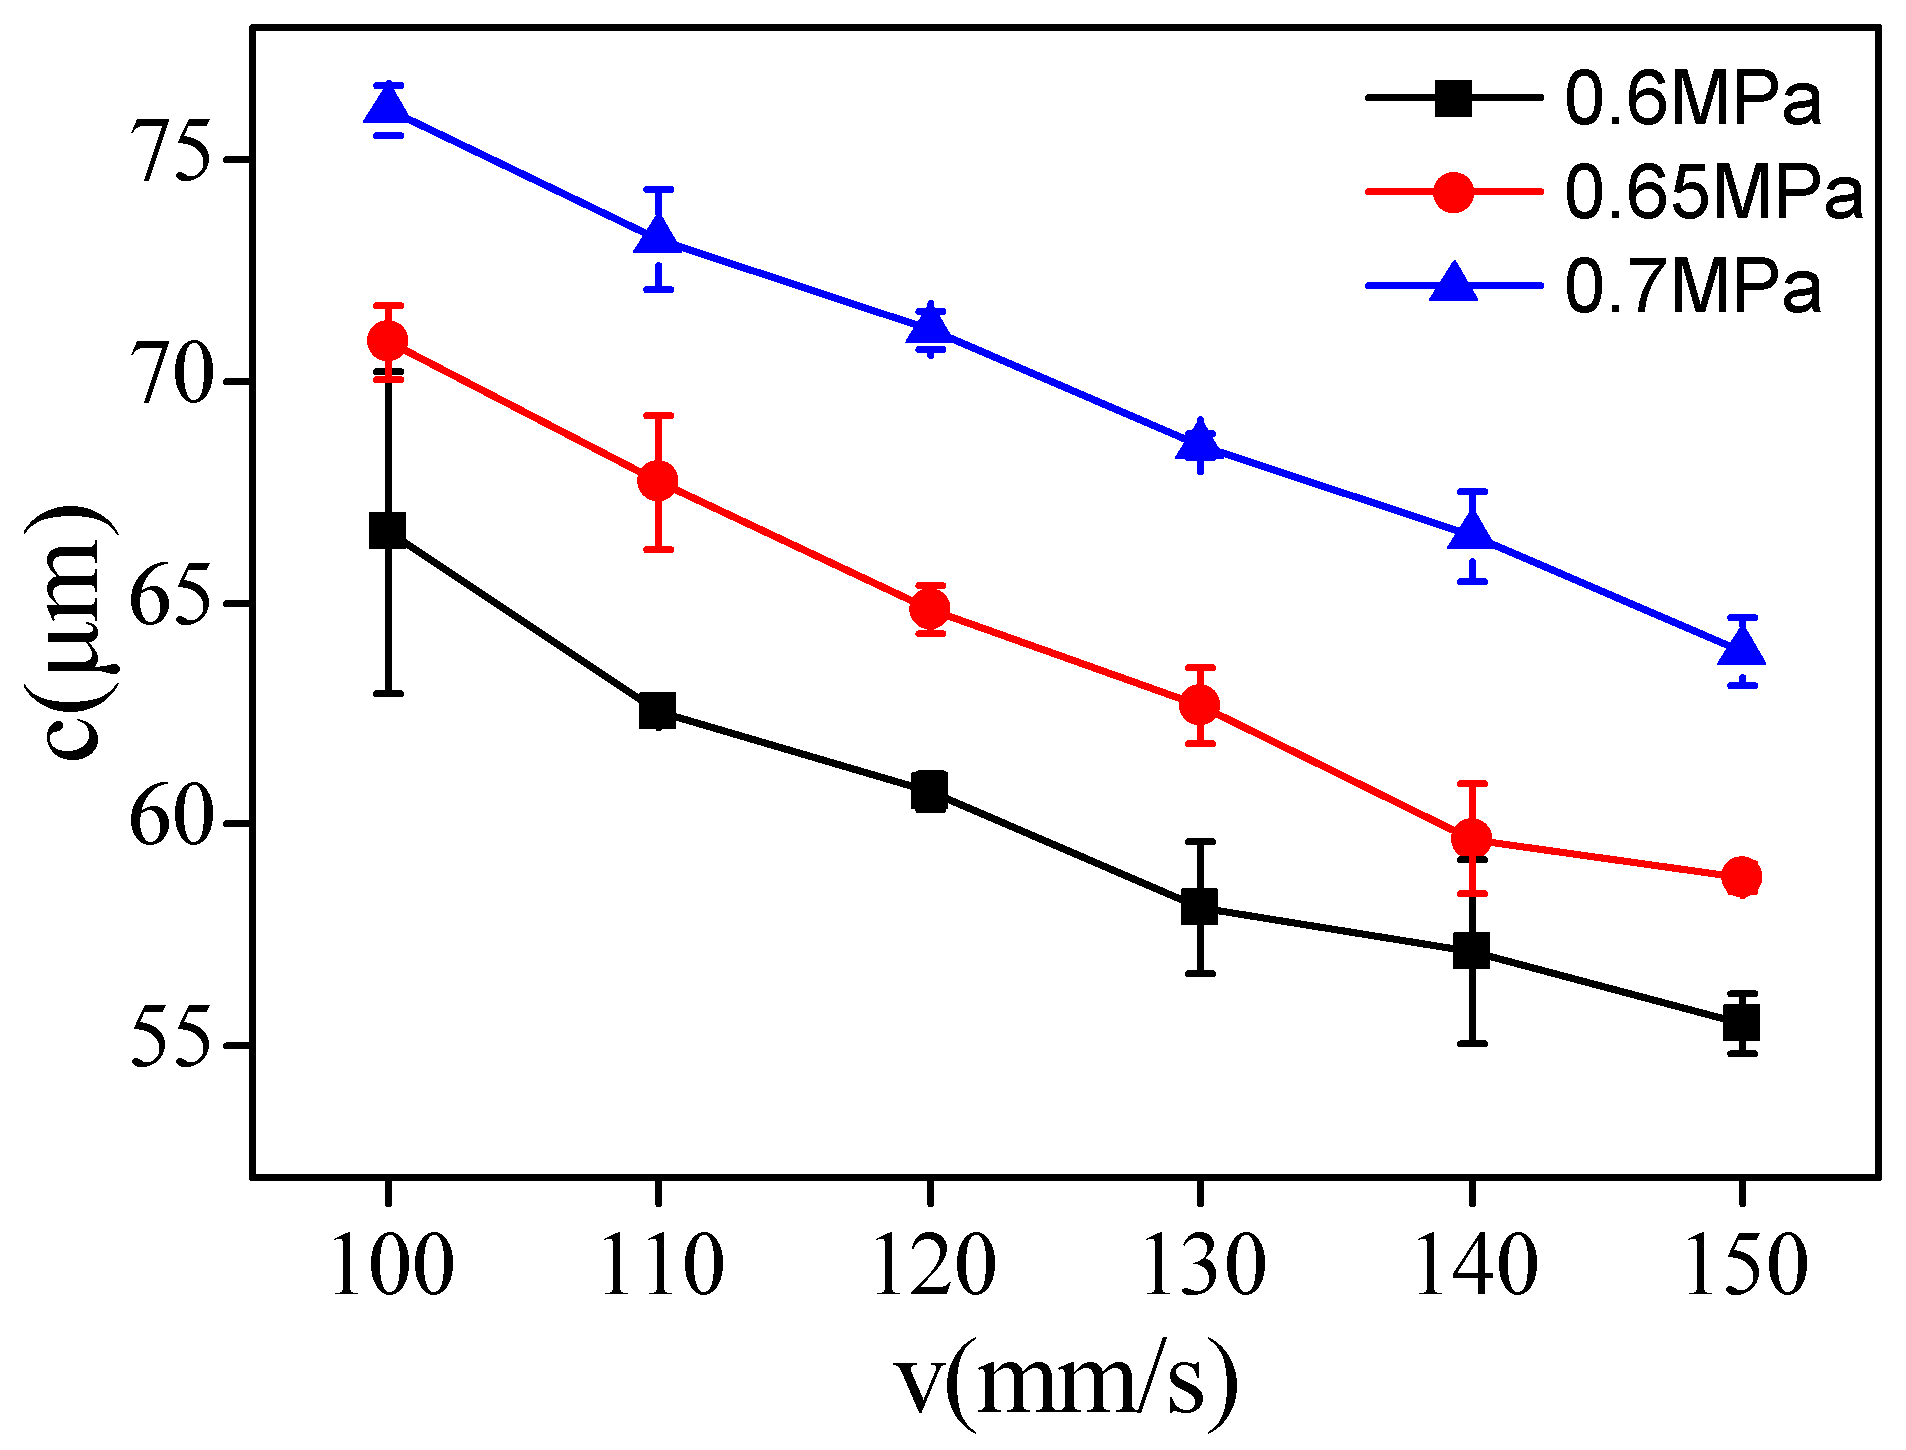
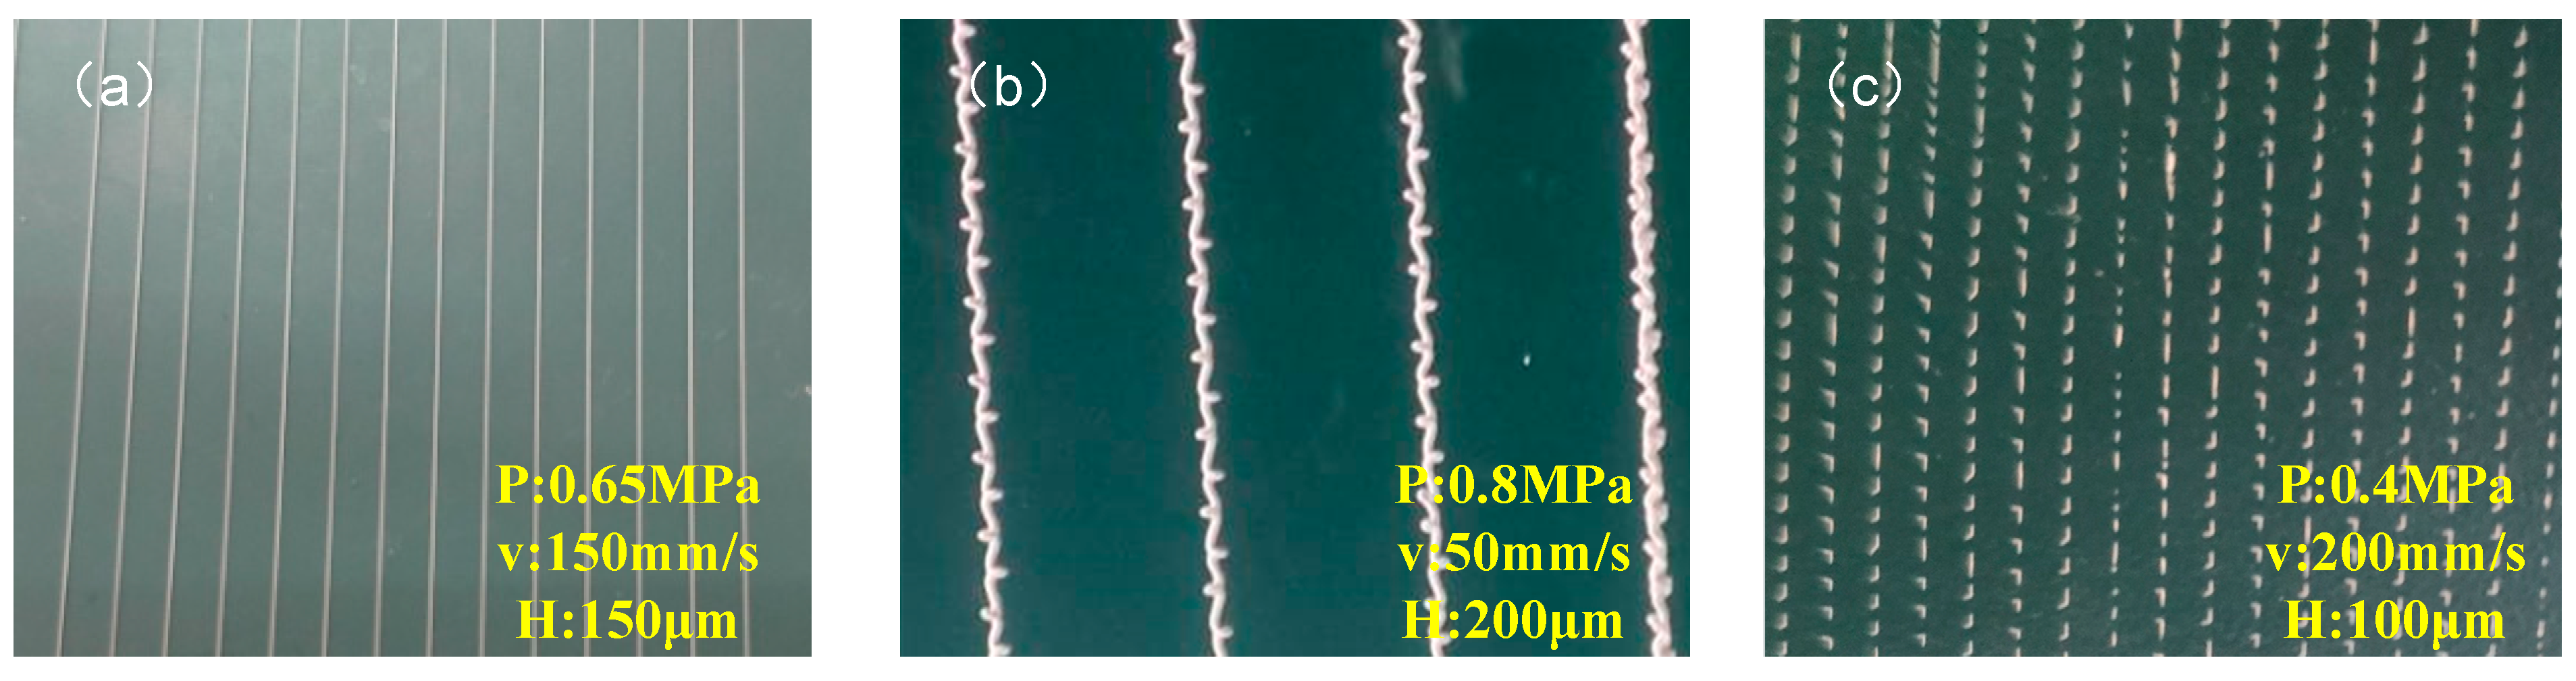
3.2. Single-Factor Experiments

From the results of the orthogonal experiments, it could be seen that the feed pressure and substrate moving speed had greater degrees of influence on the line width. When the print height was below 100 μm, it was easy to hit the fragile glass nozzle, and when the print height was greater than 600 μm, the line of conductive paste jumped seriously and had difficulty in attaching to the substrate. On the other hand, there were variations in line width values within approximately 10 μm in the height range of 100–600 μm. Therefore, we considered fixing the secondary factor (print height), that is, the subsequent print height H, at 150 μm while reducing the value of the span between the main factors, and we took three feed pressure gradients and six substrate moving speed gradients to continue the experiment to further explore the impacts of speed and pressure changes on line width. We took four lines in the printing result of each parameter combination, and we took three uniform places on each line to calculate the means and standard deviations of the line widths. The measured line width results are shown in Figure 5.
As can be seen in Figure 5, the substrate moving speed and the change in the value of the feed pressure had an intuitive effect on the change in line width, and as v increased, the line width decreased, and when P decreased, the line width decreased. It is worth noting that after repeated printing experiments, the results showed that there were critical values for the parameters, and once a parameter was higher or lower than a certain value, it would cause discontinuity and the line width could not be measured. For example, when the feed pressure was less than 0.3 MPa, the pressure was completely unable to push the paste flow in the syringe, and when the print height was greater than 700 μm, the paste printing became extremely unstable and could not even be completely formed on the substrate. At the same time, the mismatch between the parameters, such as too much feed pressure and less speed or too little feed pressure and too fast, could lead to similar printing failures, as shown in Figure 6 below.

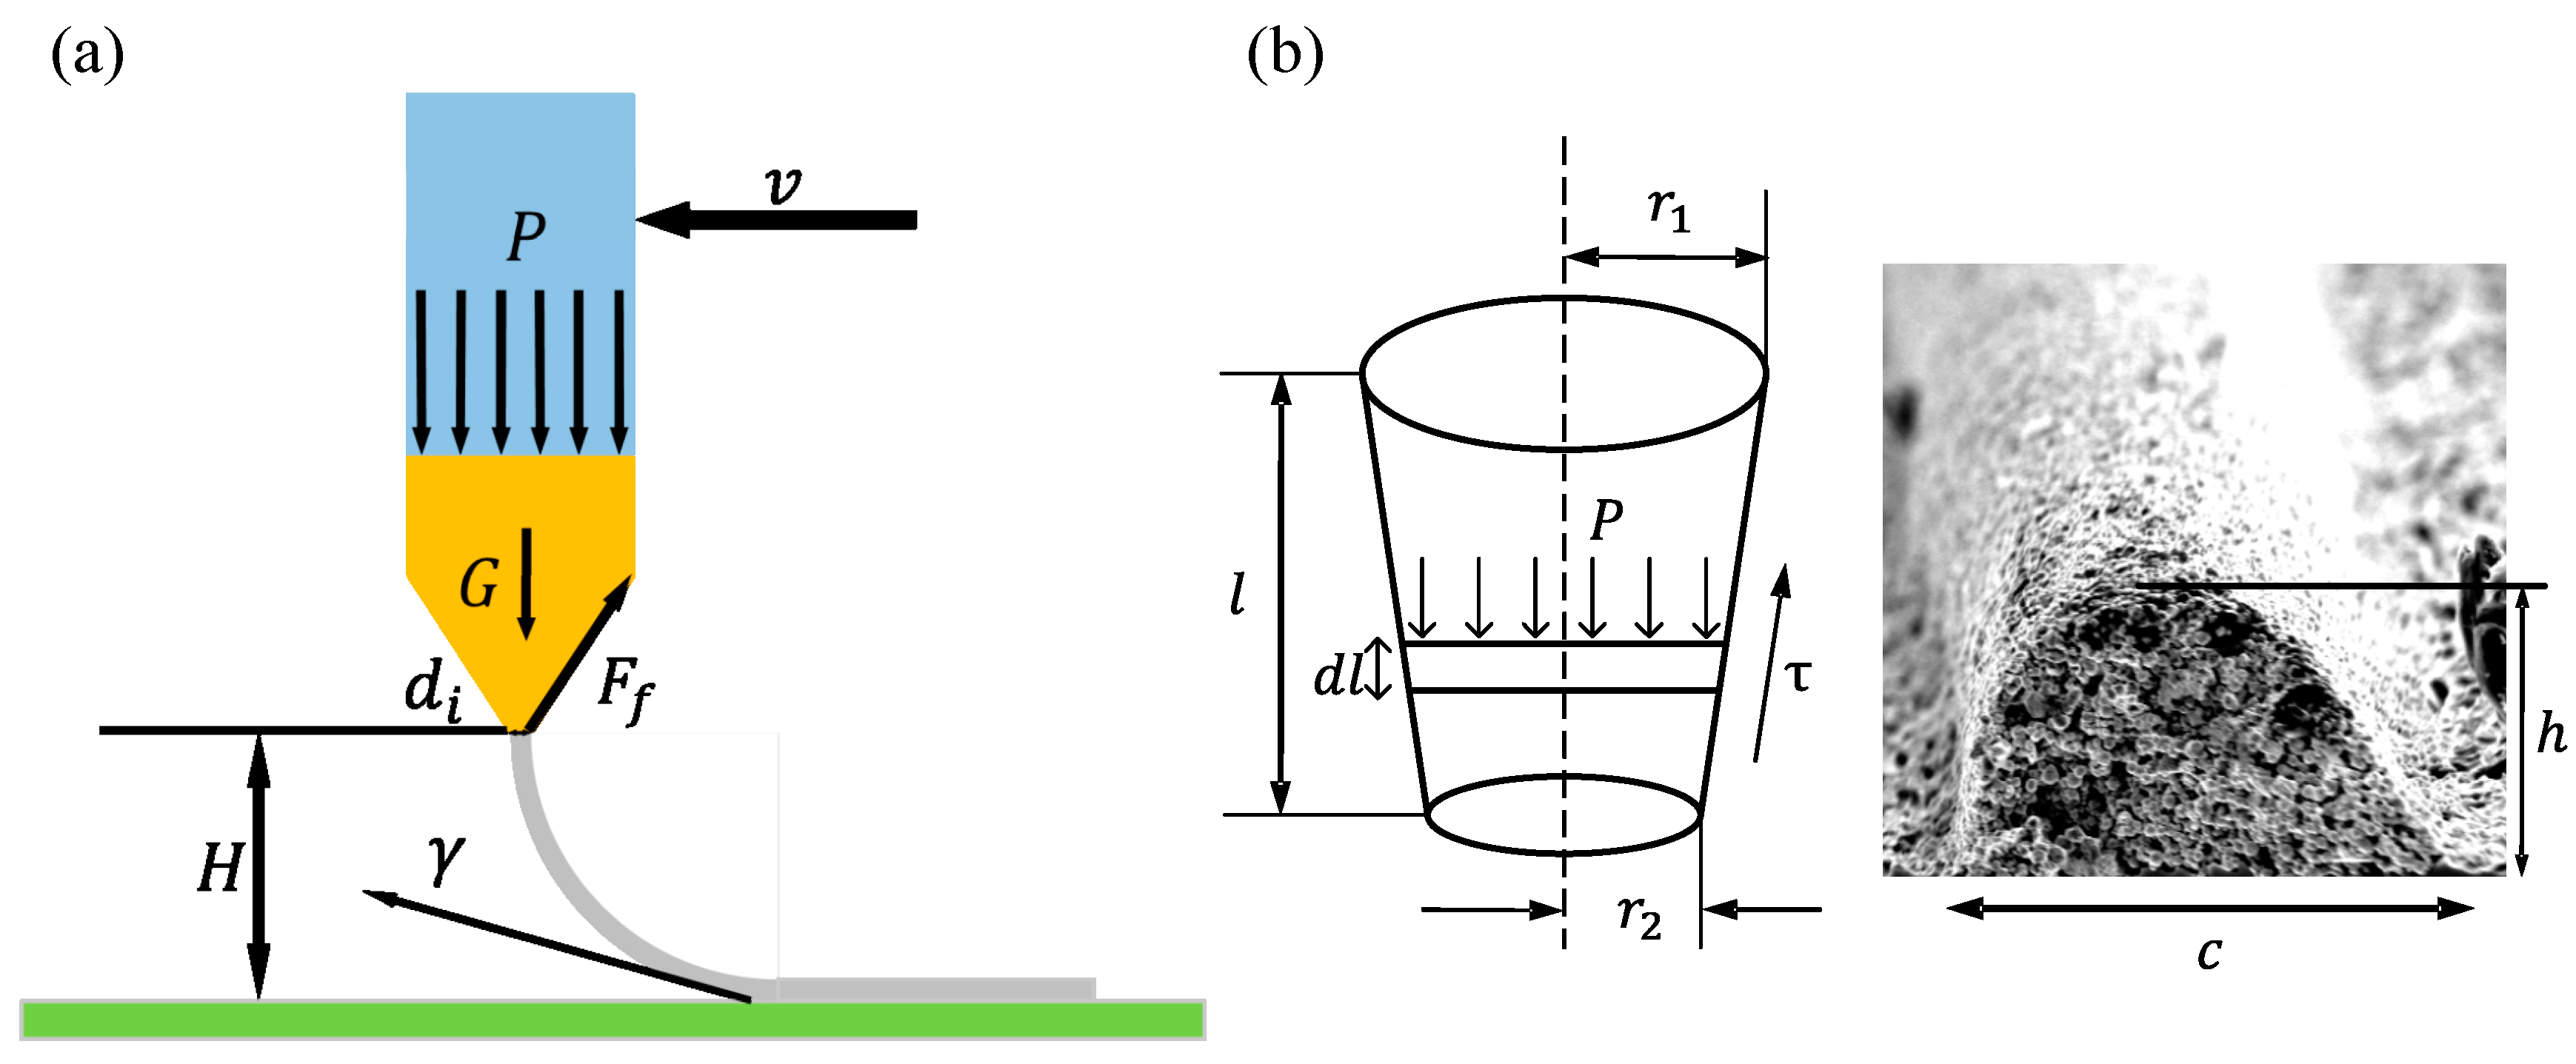
3.3. Extrusion Prediction Formula

As shown in Figure 7a below, the paste was primarily affected by the feed pressure P (provided by the high-pressure air source for the entire extrusion process), the friction F f between the paste inside the nozzle and the nozzle wall, the surface tension of the paste ( γ ) in the internal pressure of the nozzle, and the effect of the paste self-weight (G). When dealing with dense materials, such as conductive pastes, the gravity number, G p , in pipe flow is often used to relate the effect of gravity to the shear yield stress, τ y [27,28], as shown in Equation (2) below:
G p = ρ g d i 4 τ y
where ρ is the density of the paste, d i is the inner diameter of the glass nozzle, and τ y is the yield stress of the paste.
After completing the calculation, we established that G p = 0.04 1 for all the paste studied in this paper, and so the influence of gravity on the nozzle flow could be ignored. In the actual printing process, the feed pressure is used as the main driving force, which is much larger than other forces such as the material’s own weight. Therefore, in order to simplify the model, these less influential forces can be ignored. The flow rate of the paste extruded through the nozzle can be expressed as
q v = d V d t
where V is the volume of the extruded paste and t is the duration.
According to the measurements of the scanning electron microscope (SEM), shown in Figure 7b, the shape of the extruded paste could be approximately regarded as being half oval, and then the flow rate in the Equation (3) could be approximately expressed as
q v = π c h 4 d L d t = π c h v 4 = π v c 2 k c h 4
where c is the line width, h is the vertical distance from the highest point to the substrate after the paste is fixed, L is the total length of the paste deposited on the substrate over duration t, v is the substrate moving speed of the platform that holds the substrate on the system, and k c h is the aspect ratio, k c h = h / c .
We assumed that the paste extrusion was a continuous viscous non-Newtonian fluid, and the conductive paste was incompressible. The inlet effect and the slight loss caused by the attachment could be ignored. As shown in Figure 7b, the force analysis of the micro-element of the conductive paste at the nozzle, the shear force acting on the paste at the wall, and the pressure drop in this section were in the mechanical equilibrium required to obtain Equation (6). Equation (6) was simplified and combined with the H-B fluid expression to obtain the nozzle outlet flow in Equation (7) [29]. The simplification from Equation (7) to Equation (8) is presented in Appendix C.
tan θ = r 1 r 2 l
π r 2 Δ P = 2 π r τ d l sec θ cos θ
τ = Δ P R 2 L = τ y + K γ ˙ n = τ y + K ( 3 n + 1 4 n 4 Q π R 3 ) n
where τ y is the yield stress of the conductive paste, K is the consistency coefficient, and d l = d r tan θ . Then,
q v = π n 3 n + 1 ( 3 n ( r 1 - r 2 ) 2 K l ( r 2 - 3 n - r 1 - 3 n ) ( Δ P - 2 τ y l r 1 - r 2 ln ( r 1 r 2 ) ) ) 1 n
where l is the total length of the conical part where the front end of the glass nozzle is deformed and Δ P / l is the pressure gradient applied by the compressed air.
According to the flow conservation in Equations (4) and (8), the expression of the line width c of the printing paste can be obtained as
c = 4 n ( 3 n + 1 ) v k c h ( 3 n ( r 1 r 2 ) 2 K l ( r 2 3 n r 1 3 n ) ( Δ P 2 τ y l r 1 r 2 ln ( r 1 r 2 ) ) ) 1 n

3.4. Error Analysis of the Predicted Line Width and the Experimental Results

Based on the rheological properties of the paste measured in Section 2.3, the values of the parameters in Equation (9) in Section 3.3 could be determined, and the flow coefficient of the conductive paste n was set to 0.6184 and the consistency coefficient K was set to 49.46. In this paper, the nozzle was chosen to be r 2 = 28 μm and r 1 = 300 μm, and the length l was taken as the vertical distance of 3.55 mm at the front end of the glass nozzle with the largest pressure gradient change in the tapered part, which was measured by the step meter. The height to width ratio was measured to be approximately 0.4868, while the feed pressure gradient and speed gradient were set to the same as those of the single-factor experiment. The actual feed pressure calculation value is shown in Appendix B, Figure A2. By introducing these parameters, the theoretical values of the mathematical model of the line width of the extrusion process could be obtained, and the calculated results were compared with the experimental results, as shown in Figure 8.
The proportion of error in the experimental data was calculated by the following formula:
p = T i M i M i
where Mi is the measured value at the substrate moving speed v i , Ti is the theoretical value at the same speed, and p represents the total proportion of error between Mi and Ti relative to the measured value.
It could be calculated from Equation (9) that under the condition of feed pressure, the theoretical line width change value decreased with the increase in substrate moving speed. The line width difference decreased at 0.6 MPa from 3.18 μm between 100 mm/s and 110 mm/s to 1.95 μm between 140 mm/s and 150 mm/s. Although there were some fluctuations in the experimental data changes due to the experimental conditions and other factors, the overall trend was also in line with the maximum drop from 4.07 μm to 1.62 μm. It was speculated that the reason for the decrease in the line width change value at high speed was the complexity of the paste, and so the outlet flow rate of the paste could be regarded as basically unchanged when the feed pressure was constant, and as the substrate moved faster, the speed difference between the two gradually increased. The closer it came to its tensile limit, the more the stretch ability was reduced. The variation range of the line width in the actual experiment was larger than the theoretical value. It was speculated that when the feed pressure increased, the flow rate per unit time at the outlet also increased accordingly, and more paste would be forced to extrude, with the resulting pressure loss being more obvious than the pressure loss when the pressure was low. The result was that the theoretical value of the line width under high pressure was larger than the measured value. When the feed pressure increased to 0.65 MPa and 0.7 MPa, the theoretical difference in the line width under the same speed difference changed from 3.43 μm to 2.12 μm and from 3.69 μm to 2.28 μm, respectively, and the experimental difference changed from 3.16 μm to 0.87 μm and from 2.93 μm to 2.61 μm, respectively. The theoretical value showed a slight upward trend with the increase in feed pressure, while the experimental value decreased slightly. The shear stress of the paste at the outlet from the moving direction of the substrate increased, which reduced the viscosity of the paste. The result was that the line width under actual measurement was slightly larger than the theoretical value, and this was more obvious at faster speeds.
It can be seen in Figure 8b that the overall error range between the measured value and the theoretically calculated value was within 5%. When the feed pressure was 0.65 MPa, the theoretical value coincided with the actual value best and the error was the smallest. In addition to the changes in the moving speed of the substrate and the feed pressure mentioned in the previous section, the reasons for the error may have been that the viscosity of the paste may have deviated from the preset value during the experiment because the paste was squeezed at the nozzle of the glass nozzle. In addition to shear deformation, there was also tensile deformation, and the overall viscosity of the paste fluctuated under the combined action of the two. In addition, due to the functional limitations of the needle-pulling instrument, when the machine set exactly the same needle-pulling parameters, the inner diameter of the actually drawn glass nozzle and the length of the tapered portion had a slight influence that could not be ignored. This was reflected in the results by large deviations between some of the data. If it was to be applied to actual mass production in the future, a method similar to that for processing glass nozzles in a unified mold to reduce the individual differences between the forming line widths should be used.

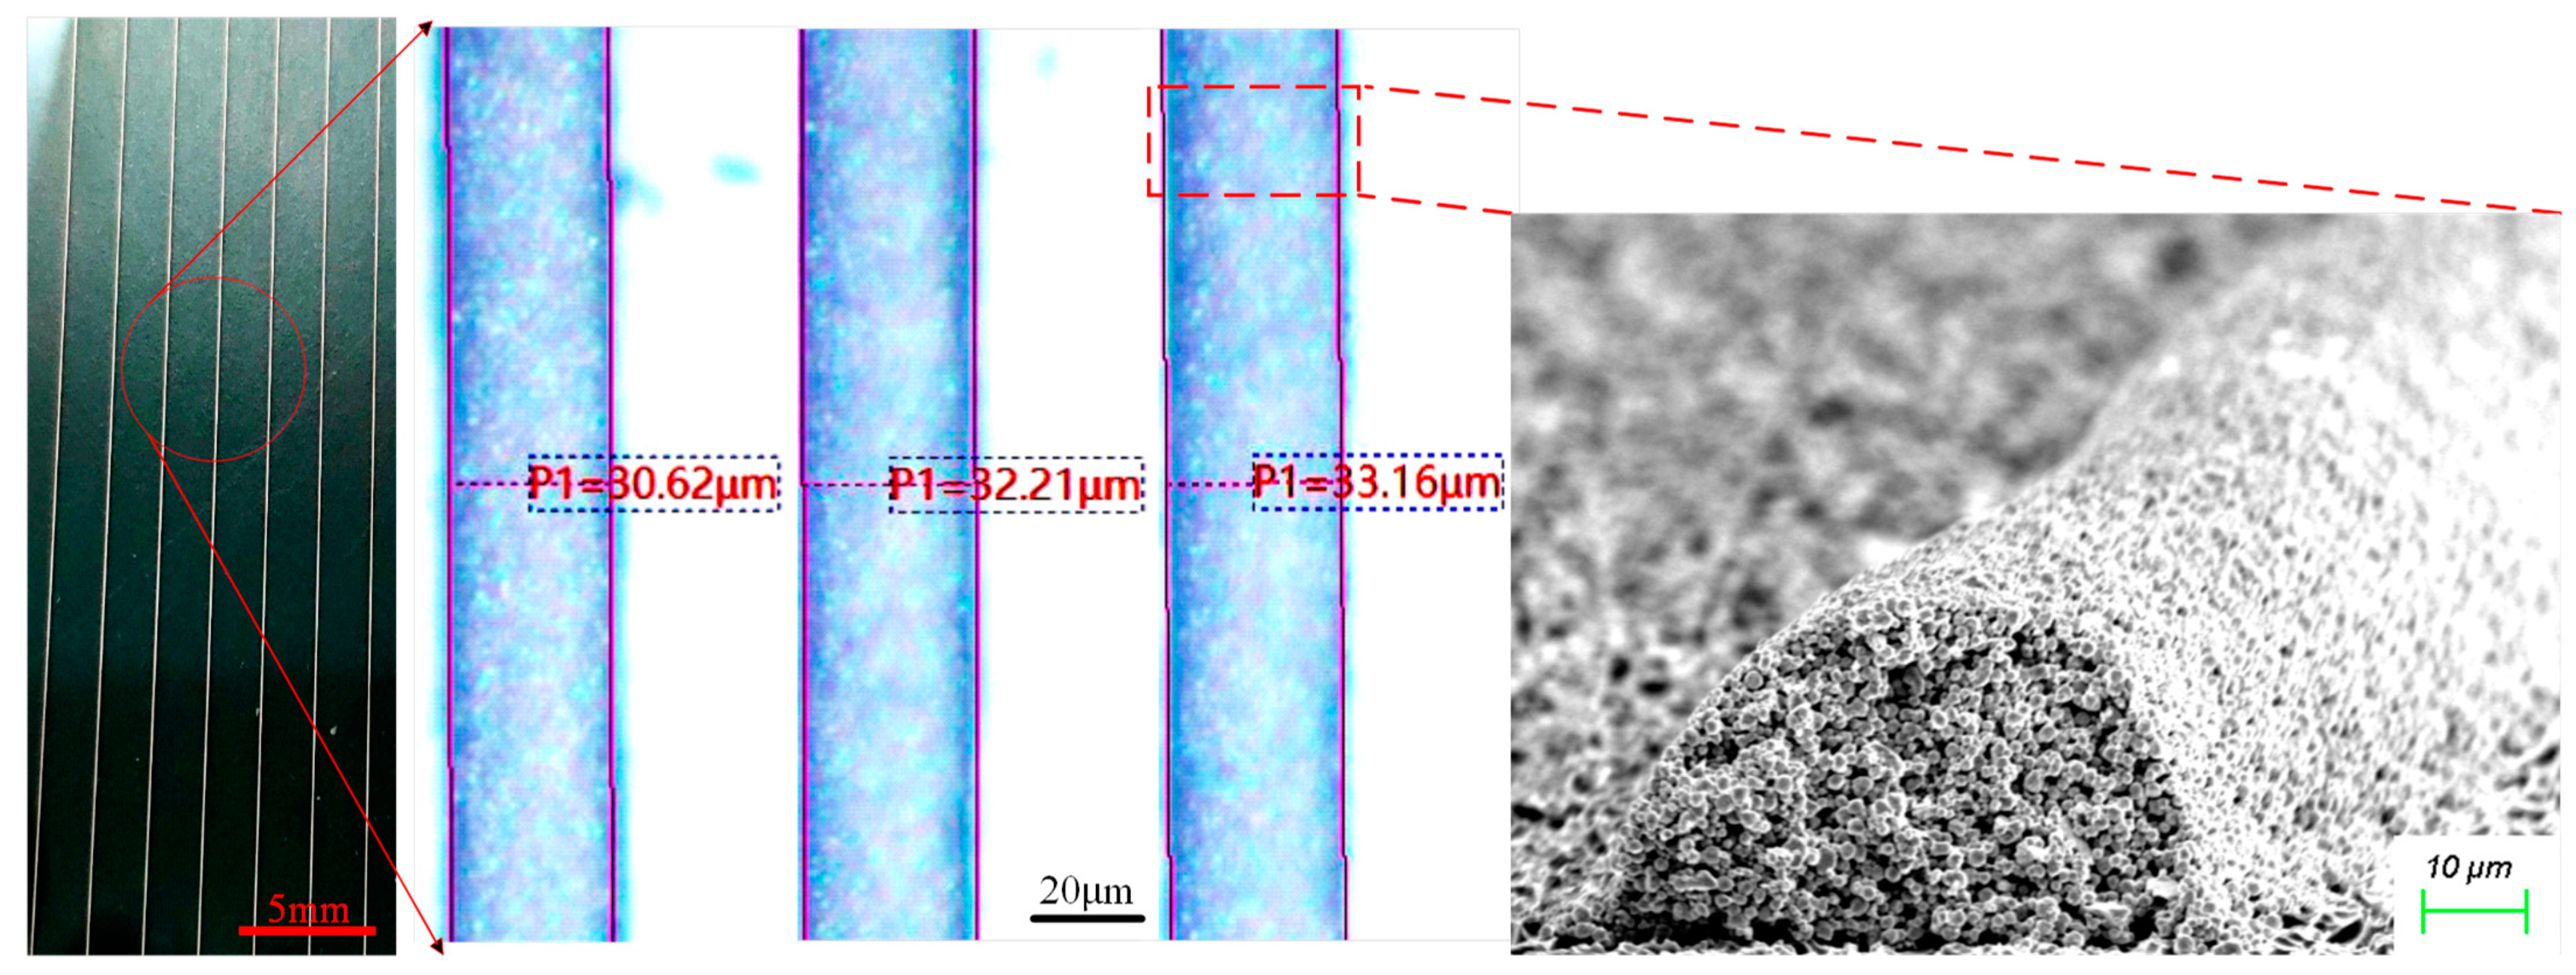
3.5. Printing Optimal Parameter Results

According to the conclusions in the previous two subsections, and from Equation (9), the most important factors affecting the line width (c) are the inner radius of the glass nozzle outlet ( r 2 ), the feed pressure of the material supply (P), and substrate moving speed (v). The minimum line width can be consistently and accurately obtained under the current experimental conditions while printing faster and more efficiently. Finally, a uniform and neat line shape with a line width of approximately 32 μm was successfully printed using a 43 μm inner diameter glass nozzle, a substrate moving speed of 200 mm/s, a feed pressure of 0.6 MPa, and a print height of 150 μm, as shown in Figure 9. From the results of Equation (9), the predicted line width was 33.1 μm and the error range was within 5%. The error was larger because other errors, such as measurement errors at low scales, were perhaps more likely to arise, and the overall predicted results were within acceptable limits. Meanwhile, the geometry of the paste formation could be clearly observed under SEM, and the overall structure was compact and free of obvious defects.

4. Conclusions

In this paper, an orthogonal experimental design method was used to optimize the relevant parameters affecting print quality, and the effects of print height, feed pressure, and substrate shift speed on print line width were studied. In the given parameter range, the greatest influence on the line width was due to the substrate moving speed, followed by the feed pressure, and the print height had the least effect. Further single-factor experiments were conducted to identify the specific trends in feed pressure and substrate moving speed on print line width and to analyze the primary reasons for these variations due to the joint effects of the parameters on line width. The rheological properties of the conductive paste used in the experiment were measured with a rotational rheometer, the parameter values of the line width expression were clarified, the calculated value of the expression was compared with the experimental value, and the resulting error was within 5%. The primary reasons for the error were the pressure loss during extrusion, the change in viscosity, and the inconsistency of the nozzle shape. Further improvements can be made in these aspects in future experiments. The actual line width was measured to be approximately 32 μm while using the theoretical value of 33.1 μm for each parameter of the line width prediction type for the printing experiments. The feasibility of the line width prediction formula was verified, and it had a guiding meaning for the direct writing of the H-B fluids similar to conductive pastes into shape. The prediction model for high-viscosity conductive paste introduced in this paper can provide a reference for direct writing printing for the same types of high-viscosity, high-solid-content, non-Newtonian fluids, which have great potential for processing electrodes in the field of electronics and biological 3D printing. As we all know, the efficiency of a single nozzle is usually low compared with screen printing for industrial commercial use, after referring to Kamino’s research [30]. At present we only investigate the effect of the parameters through single-nozzle experiments. In the future, we will compare the efficiency of multi-nozzle experiments with commercial methods.

Author Contributions

Writing—original draft preparation, J.Z.; planning and performing the experiments, J.Z. and S.W.; investigation, Z.W.; theory consultation and formal analysis, J.Z.; writing—review and editing, Y.C.; supervision, Y.C.; project administration, H.Y.; funding acquisition, H.Y. All authors have read and agreed to the published version of the manuscript.

Funding

This research was funded by the Guangxi Bagui Scholars Project (No. 2019A02).

Institutional Review Board Statement

Not applicable.

Informed Consent Statement

Not applicable.

Data Availability Statement

Not applicable.

Acknowledgments

Thanks are given to the teachers from the School of Mechanical Engineering of Guangxi University for their support in this research, as well as their opinions and suggestions on the writing.

Conflicts of Interest

The authors declare no conflict of interest.

Appendix A

The apparent viscosity versus the shear rate of the conductive paste used in the experiments was determined using a Haake Mars Ⅲ rotational rheometer (summarized in Figure A1a), and it can well demonstrate the shear thinning nature of the viscosity of the conductive paste. The experimentally measured shear stress and shear rate data of the conductive paste were fitted with the second power law formula in Matlab software. In the specified range of shear rate (fitting results are presented in Figure A1b), the resulting fit function curve and the original data points basically match, and it can be seen that the two fit better.
Figure A1. (a) Relationship between the apparent viscosity of the conductive paste and the shear rate. (b) Shear stress and shear rate fitting results. (c) Sketch of the rheometer measurement process.
Applsci 13 02389 g0a1

Appendix B

Since the printing device was made by attaching the glass nozzle to the dispensing nozzle and syringe, there was a certain degree of loss in the feed pressure provided by the high-pressure air source, and the actual pressure acting inside the glass nozzle was simulated and analyzed using COMSOL Multiphysics software for the print nozzle structure. A part of the simulation results is shown in Figure A2. The pressure measurements at the inlet of the glass nozzle cone obtained by the pressure probe were 0.38 MPa at a 0.7 MPa feed pressure, 0.35 MPa at a 0.65 MPa feed pressure, and 0.33 MPa at a 0.6 MPa feed pressure. These values were used in the calculations of the predicted values.
Figure A2. Simulation result graph of the feeding pressure (0.7 MPa).
Applsci 13 02389 g0a2

Appendix C

The detailed simplification process from Equations (6)–(8) is as follows:
Δ P = 2 τ y l R + 2 K l R 3 n + 1 ( Q ( 3 n + 1 ) π π n ) n
For
d p = 2 τ y d l r + 2 K d l r 3 n + 1 ( Q ( 3 n + 1 ) π π n ) n d l = d r cot θ
Then,
Δ P = 2 τ y cot θ r 1 r 2 1 r d r 2 K cot θ ( Q ( 3 n + 1 ) π n ) n r 1 r 2 1 r 3 n + 1 d r Δ P = 2 τ y l r 1 r 2 ln ( r 1 r 2 ) + 2 K l ( r 2 3 n r 1 3 n ) 3 n ( r 1 r 2 ) ( Q ( 3 n + 1 ) π n ) n Q = π n 3 n + 1 ( 3 n ( r 1 - r 2 ) 2 K l ( r 2 - 3 n - r 1 - 3 n ) ( Δ P - 2 τ y l r 1 - r 2 ln ( r 1 r 2 ) ) ) 1 n
Within the same duration t, q v = Q .

References

  1. Çiftpınar, H.E.; Stodolny, M.K.; Wu, Y.; Janssen, G.J.M.; Löffler, J.; Schmitz, J.; Lenes, M.; Luchies, J.; Geerligs, L.J. Study of screen printed metallization for polysilicon based passivating contacts. Energy Procedia 2017, 124, 851–861. [Google Scholar] [CrossRef]
  2. Tomotoshi, D.; Kawasaki, H. Surface and Interface Designs in Copper-Based Conductive Inks for Printed/Flexible Electronics. Nanomaterials 2020, 10, 1689. [Google Scholar] [CrossRef] [PubMed]
  3. Wang, Z.; Zhang, G.; Huang, H.; Qian, L.; Liu, X.; Lan, H. The self-induced electric-field-driven jet printing for fabricating ultrafine silver grid transparent electrode. Virtual Phys. Prototyp. 2021, 16, 113–123. [Google Scholar] [CrossRef]
  4. Benedek, C.; Krammer, O.; Janoczki, M.; Jakab, L. Solder Paste Scooping Detection by Multilevel Visual Inspection of Printed Circuit Boards. IEEE Trans. Ind. Electron. 2013, 60, 2318–2331. [Google Scholar] [CrossRef]
  5. Jung, K.; Min, K.D.; Lee, C.; Park, B.; Jeong, H.; Koo, J.; Lee, B.; Jung, S. Effect of epoxy content in Ag nanoparticle paste on the bonding strength of MLCC packages. Appl. Surf. Sci. 2019, 495, 143487. [Google Scholar] [CrossRef]
  6. Xie, X.; Guo, R.; Yang, B.; Li, H.; Yang, F.; Shen, B. Stencil-printed electrodes without current collectors and inactive additives on textiles for in-plane microsupercapacitors. J. Mater. Chem. A 2021, 9, 25042–25050. [Google Scholar] [CrossRef]
  7. Zhou, C.; Qi, Y.; Zhang, S.; Niu, W.; Tang, B. Rapid fabrication of vivid noniridescent structural colors on fabrics with robust structural stability by screen printing. Dye. Pigment. 2020, 176, 108226. [Google Scholar] [CrossRef]
  8. Ju, M.; Mallem, K.; Dutta, S.; Balaji, N.; Oh, D.; Cho, E.C.; Cho, Y.H.; Kim, Y.; Yi, J. Influence of small size pyramid texturing on contact shading loss and performance analysis of ag-screen printed mono crystalline silicon solar cells. Mater. Ence Semicond. Process. 2018, 85, 68–75. [Google Scholar] [CrossRef]
  9. Tepner, S.; Wengenmeyr, N.; Ney, L.; Linse, M.; Clement, F. Improving wall slip behavior of silver pastes on screen emulsions for fine line screen printing. Sol. Energy Mater. Sol. Cells 2019, 200, 109969. [Google Scholar] [CrossRef]
  10. Tepner, S.; Ney, L.; Linse, M.; Lorenz, A.; Pospischil, M.; Masuri, K.; Clement, F. Screen pattern simulation for an improved front-side Ag-electrode metallization of Si-solar cells. Prog. Photovolt. Res. Appl. 2020, 28, 1054–1062. [Google Scholar] [CrossRef]
  11. Tepner, S.; Wengenmeyr, N.; Linse, M.; Lorenz, A.; Pospischil, M.; Clement, F. The Link between Ag-Paste Rheology and Screen-Printed Solar Cell Metallization. Adv. Mater. Technol. 2020, 5, 2000654. [Google Scholar] [CrossRef]
  12. Sridhar, R.; Lakshminarayanan, R.; Madhaiyan, K.; Barathi, V.A.; Lim, K.H.C.; Ramakrishna, S. Electrosprayed nanoparticles and electrospun nanofibers based on natural materials: Applications in tissue regeneration, drug delivery and pharmaceuticals. Chem. Soc. Rev. 2015, 46, 790–814. [Google Scholar] [CrossRef]
  13. Wang, S.; Mei, X.; Cao, J.; Sun, D.; Wang, S. The preparation of graphene/polyethylene oxide/sodium dodecyl sulfate composite humidity sensor via electrohydrodynamic direct-writing. J. Phys. D Appl. Phys. 2019, 52, 175307. [Google Scholar] [CrossRef]
  14. Laucher, C.; Hamon, G.; Turala, A.; Volatier, M.; Darnon, M.; Aimez, V.; Jaouad, A. Self-powered light-induced plating for III-V/Ge triple-junction solar cell metallization. Energy Sci. Eng. 2020, 8, 3672–3681. [Google Scholar] [CrossRef]
  15. Gengenbach, U.; Ungerer, M.; Koker, L.; Reichert, K.; Stiller, P.; Huang, C.; Hagenmeyer, V. Automated fabrication of multi-layer printed electronic circuits using a novel vector ink-jet printing process control and surface mounting of discrete components. Ifac-Pap. 2019, 52, 609–614. [Google Scholar] [CrossRef]
  16. Xia, Z.; Gao, P.; Sun, T.; Wu, H.; Tan, Y. Buried MoO x/Ag Electrode Enables High-Efficiency Organic/Silicon Heterojunction Solar Cells with a High Fill Factor. Acs. Appl. Mater. Inter. 2018, 10, 13767–13773. [Google Scholar] [CrossRef]
  17. Cano-Raya, C.; Denchev, Z.Z.; Cruz, S.F.; Viana, J.C. Chemistry of solid metal-based inks and pastes for printed electronics—A review. Appl. Mater. Today 2019, 15, 416–430. [Google Scholar] [CrossRef]
  18. Mette, A.; Richter, P.L.; Hörteis, M.; Glunz, S.W. Metal aerosol jet printing for solar cell metallization. Prog. Photovolt: Res. Appl. 2007, 15, 621–627. [Google Scholar] [CrossRef]
  19. Rau, D.A.; Forgiarini, M.; Williams, C.B. Hybridizing Direct Ink Write and mask-projection Vat Photopolymerization to enable additive manufacturing of high viscosity photopolymer resins. Addit. Manuf. 2021, 42, 101996. [Google Scholar] [CrossRef]
  20. Gerdes, B.; Jehle, M.; Lass, N.; Riegger, L.; Spribille, A.; Linse, M.; Clement, F.; Zengerle, R.; Koltay, P. Front side metallization of silicon solar cells by direct printing of molten metal. Sol. Energy Mater. Sol. Cells 2018, 180, 83–90. [Google Scholar] [CrossRef]
  21. Beutel, M.; Lewis, A.; Prondzinski, M.; Selbmann, F.; Richter, P.; Bamberg, F.; Raschtschepkin, P.; Krause, A.; Koch, C.; Hentsche, M.; et al. Fine line metallization by coextrusion technology for next generation solar cells. Sol. Energ. Mat. Sol. C 2014, 131, 64–71. [Google Scholar] [CrossRef]
  22. Richter, L.P.; Fischer, G.; Sylla, L.; Hentsche, M.; Steckemetz, S.; Müller, M.; Cobb, C.L.; Solberg, S.E.; Rao, R.; Elrod, S.; et al. Progress in fine-line metallization by co-extrusion printing on cast monosilicon PERC solar cells. Sol. Energ. Mat. Sol. C 2015, 142, 18–23. [Google Scholar] [CrossRef]
  23. Pospischil, M.; Klawitter, M.; Kuchler, M.; Jahn, M.; Efinger, R.; Schwarz, R.; Wende, L.; König, M.; Clement, F.; Biro, D. High Speed Dispensing with Novel 6” Print Head. Energy Procedia 2016, 98, 61–65. [Google Scholar] [CrossRef]
  24. Erath, D.; Pospischil, M.; Keding, R.; Jahn, M.; Clement, F. Comparison of innovative metallization approaches for silicon heterojunction solar cells. Energy Procedia 2017, 124, 869–874. [Google Scholar] [CrossRef]
  25. Pospischil, M.; Riebe, T.; Jimenez, A.; Kuchler, M.; Tepner, S.; Geipel, T.; Ourinson, D.; Fellmeth, T.; Breitenbücher, M.; Buck, T.; et al. Applications of parallel dispensing in PV metallization. AIP Conf. Proc. 2019, 2156, 020005. [Google Scholar] [CrossRef]
  26. Mueller, S.; Llewellin, E.W.; Mader, H.M. The rheology of suspensions of solid particles. Proc. Royal Soc. A Math. Phys. Eng. Sci. 2010, 466, 1201–1228. [Google Scholar] [CrossRef]
  27. Derby, B. Inkjet printing of functional and structural materials: Fluid property requirements, feature stability, and resolution. Annu. Rev. Mater. Res. 2010, 40, 395–414. [Google Scholar] [CrossRef]
  28. Jang, D.; Kim, D.; Moon, J. Influence of Fluid Physical Properties on Ink-Jet Printability. Langmuir 2009, 25, 2629–2635. [Google Scholar] [CrossRef]
  29. Lenk, R.S. Polymer Rheology; 1978. [Google Scholar] [CrossRef]
  30. Kamino, B.A.; Paviet-Salomon, B.; Moon, S.; Badel, N.; Levrat, J.; Christmann, G.; Walter, A.; Faes, A.; Ding, L.; Diaz Leon, J.J.; et al. Low-Temperature Screen-Printed Metallization for the Scale-Up of Two-Terminal Perovskite–Silicon Tandems. ACS Appl. Energy Mater. 2019, 2, 3815–3821. [Google Scholar] [CrossRef] [Green Version]
Figure 1. Conductive paste 3D printing experimental platform.
Applsci 13 02389 g001
Figure 2. The production process of the glass nozzle with the micropipette puller.
Applsci 13 02389 g002
Figure 3. Flow chart of research steps.
Applsci 13 02389 g003
Figure 4. (a) Industrial camera real image of the printing process. (b) Schematic diagram of the paste printing model.
Applsci 13 02389 g004
Figure 5. Experimental measurement data for the single-factor analysis.
Applsci 13 02389 g005
Figure 6. (a) Normal situation and actual print failure conditions of (b) stacking and (c) broken lines.
Applsci 13 02389 g006
Figure 7. (a) The print force analysis diagram of the model. (b) A simplified model of the print head and the morphology change of the conductive paste.
Applsci 13 02389 g007
Figure 8. (a) Comparison of the experimental and theoretical results. (b) Error variation between the theoretical and experimental values.
Applsci 13 02389 g008
Figure 9. Macro picture and microscopic magnification of the results of the optimal printing parameters.
Applsci 13 02389 g009
Table 1. Micropipette puller setup parameters.
HeatPullVelocityDelayPressureDiameter
531 °C100510025056 ± 5 μm
Table 2. Rheological parameters of the conductive paste.
Shear Rate K n τ y (Pa)
15   s 1 49.460.618424.48
Table 3. Factor level table.
LevelFactor
Feed Pressure P/MPaPrint Height H/μmSubstrate Moving Speed v/(mm/s)
10.610050
20.7150100
30.8200150
Table 4. Three-factor and three-level orthogonal experimental design and experimental results.
Test NumberPHvBlank ColumnLine Width c/μm
1111180.82
2122253.93
3133348.59
4212370.30
5223159.83
6231267.24
7313265.33
83213100.74
9332174.87
Table 5. Range analysis results.
Line Width C
PHv
K 1 183.34216.45248.80
K 2 197.37214.50199.11
K 3 240.93190.70173.75
k 1 61.1172.1582.93
k 2 65.7971.5066.37
k 3 80.3163.5757.92
R 19.208.5825.02
Disclaimer/Publisher’s Note: The statements, opinions and data contained in all publications are solely those of the individual author(s) and contributor(s) and not of MDPI and/or the editor(s). MDPI and/or the editor(s) disclaim responsibility for any injury to people or property resulting from any ideas, methods, instructions or products referred to in the content.

